
Uncovering Distribution Patterns of High Performance Taxis from Big Trace Data


1
State Key Laboratory of Information Engineering in Surveying, Mapping and Remote Sensing, Wuhan University, Wuhan 430079, China
2
School of Geosciences and Info-physics, Central South University, Changsha 410083, China
*
Author to whom correspondence should be addressed.
ISPRS Int. J. Geo-Inf. 2017, 6(5), 134; https://0-doi-org.brum.beds.ac.uk/10.3390/ijgi6050134
Submission received: 15 January 2017
/
Revised: 19 April 2017
/
Accepted: 25 April 2017
/
Published: 28 April 2017
Abstract
:The unbalanced distribution of taxi passengers in space and time affects taxi driver performance. Existing research has studied taxi driver performance by analyzing taxi driver strategies when the taxi is occupied. However, searching for passengers when vacant is costly for drivers, and it limits operational efficiency and income. Few researchers have taken the costs during vacant status into consideration when evaluating taxi driver performance. In this paper, we quantify taxi driver performance using the taxi’s average efficiency. We propose the concept of a high-efficiency single taxi trip and then develop a quantification and evaluation model for taxi driver performance based on single trip efficiency. In a case study, we first divide taxi drivers into top drivers and ordinary drivers, according to their performance as calculated from their GPS traces over a week, and analyze the space-time distribution and operating patterns of the top drivers. Then, we compare the space-time distribution of top drivers to ordinary drivers. The results show that top drivers usually operate far away from downtown areas, and the distribution of top driver operations is highly correlated with traffic conditions. We compare the proposed performance-based method with three other approaches to taxi operation evaluation. The results demonstrate the accuracy and feasibility of the proposed method in evaluating taxi driver performance and ranking taxi drivers. This paper could provide empirical insights for improving taxi driver performance.
1. Introduction
Rapidly growing trajectory data contains enormous records of human spatial paths that can permit researchers to study social problems in detail [1,2,3]. As an important supplement to urban public transit, taxis equipped with GPS devices operate on every segment and corner of the urban road network in Wuhan, China. The GPS trace data they collect is widely used in many studies due to its broad coverage, good continuity, and low collection cost [4], providing a basis for understanding driving behaviors and social activities [5,6,7,8].
There are many studies focusing on the mobility intelligence and behavior patterns of taxi drivers [9,10,11,12,13,14,15,16,17,18]. Space-time analysis methods are introduced to solve taxi problems and improve taxi operation efficiency. In these studies, taxi drivers are usually divided into ordinary drivers and top drivers. The patterns of driving behavior for top drivers can provide valuable information about customer-finding strategies, and this data can also reveal insights into patterns of human activity.
In order to extract useful information about top drivers, the taxi drivers’ performances must first be evaluated and ranked. However, current approaches to evaluating taxi driver performance do not take into consideration the cost incurred when searching for customers while vacant. Current taxi ranking approaches merely consider the transfer process in terms of an occupied or vacant status [1,11,19]. This article aims to fill this gap by developing an approach to evaluating taxi driver performance comprehensively, and accurately rank taxi drivers by performance. Starting from previous studies [20,21,22], we take a step further to evaluate taxi driver performance by measuring taxi operation efficiency, which considers both the income generated by taxis in an occupied status and the cost when vacant.
In this paper, we investigate the factors contributing to single trip taxi efficiency and study how these factors can help improve taxi driver performance. To this end, we first propose the concept of single trip efficiency, taking the cost of vacant taxi status into consideration to optimize the evaluation model for single trip efficiency. We consider the effects of all the trips in a day and formalize taxi daily average efficiency, which is our criterion for taxi driver performance. In a case study, we collect the GPS data from 2000 taxis in Wuhan from 4 August to 10 August 2013. We use average taxi efficiency to distinguish top and ordinary drivers using taxi GPS traces. By analyzing the space-time distribution of the trajectories of top drivers and comparing the space-time distribution between top and ordinary drivers, we gained valuable insights into top drivers’ operation patterns, and at the same time studied urban dynamics. The main contributions of this paper are twofold: a new way to analyze the behavior patterns of taxi drivers using space-time analysis methods, and a new optimized performance evaluation approach. The conclusions provide empirical evidence for improving the operational performance of taxi drivers.
This paper is structured as follows. A review of existing studies on taxi mobility intelligence and performance is introduced in Section 2. Section 3 proposes the concept of single trip efficiency and presents an approach for quantifying average taxi efficiency. In Section 4, we illustrate how to rank taxi drivers by average taxi efficiency and study the spatial-temporal distribution patterns of top and ordinary drivers. In Section 5, we compare the proposed method with other taxi ranking approaches. In Section 6, we conclude our work and discuss possible directions for future studies.
2. Related Work
In taxi mobility intelligence studies, researchers often split taxi drivers into two groups, top and ordinary drivers, to understand driving behaviors. For example, Li et al. [9] identified passenger-finding strategies with the taxi GPS data of ordinary taxi drivers, but not top drivers. Liu et al. [10,11] compared operation behaviors between top drivers and ordinary drivers, to better understand high-level human behavior and mobility intelligence. Some research has focused on taxi driving strategies in order to study driving behaviors. Yuan et al. [12] proposed a method to detect parking locations by analyzing taxi engine status (on/off) and parking events from GPS data, and found out the most likely parking locations of taxis. Moreira-Matias [13] presented an online recommendation model to help the driver change their strategy and minimize waiting time, using time series forecasting techniques. Qian [14] proposed a sharing considered route assignment mechanism (SCRAM) for fair taxi route recommendations to optimize the passenger-finding system. Li [15] explored a prediction approach to help taxi drivers find their next passenger by discovering patterns of passenger pick-ups quantity (PUQ) from urban hotspots. The aforementioned studies provide useful information for taxi drivers by analyzing driving strategies. Recently, Li and Lv [16,17,18] proposed a Virtual Reality GIS based traffic analysis and visualization system and studied city dynamics and transportation using WebVRGIS, for forecasting the flow of coach passengers. Little research however, has studied taxi driver performance in terms of taxi efficiency.
There are many studies focusing on taxi efficiency and service. Gan et al. [20] proposed a new taxi pricing scheme, which provides taxi drivers with extra incentives during peak hours and reflects the congestion costs in taxi fare structure. The proposed scheme reduces the magnitude of the pricing problem while satisfying the constraints to filter out infeasible pure strategies, and simulation results prove the effectiveness of the pricing scheme in improving efficiency of the taxi system. Song et al. [21] analyzed the operation characteristics and patterns of taxi drivers under traffic control during the Beijing Olympic Games. By comparing the operation pattern of the Olympic period and pre-Olympic period, the authors showed the efficiency improvement in taxi operation during the Olympic period. Wong et al. [22] developed a mathematical model based on the absorbing Markov chain approach to describe taxi movement, and they provided a novel and potentially useful measure of the urban taxi operation efficiency in a network. Recently, taxi service demand is analyzed by data mining and machine learning approaches. Moreira-Matias et al. [23] introduced a generic and simple framework to empower the resistance of most induction learning algorithms and solve transportation problems. Khiari et al. [24] proposed an unsupervised learning framework to determine the best schedule coverage to be assigned to a given PT network, and improve schedule reliability on a large scale.
For ranking taxis and evaluating taxi driver performance, various indices are proposed, such as daily income [11], occupied distance [9], proportion of occupied time [19], and average passenger-finding time [1]. These studies introduced different approaches to measuring taxi driver performance and ranking taxi drivers, but they only consider the occupied or vacant statuses of taxis. Indices based on the whole process of transfer are lacking. In this paper we address these issues and fill a gap in the research concerning taxi driver mobility patterns.
3. Taxi Performance Evaluation
3.1. Data Preprocessing
In this paper, a large-scale real-world taxi GPS dataset for the week from 4 to 10 August 2013 in Wuhan city was provided by 2000 GPS equipped taxis. The GPS locations of the taxis were sampled at a fixed time interval of 40 s, at a positional accuracy of approximately 15 m. We matched each raw GPS record to a road segment. Each record contains the following information:
- ROADID: unique ID for the matched road segment of the GPS trace point
- CARID: unique ID for the taxi
- LONGITUDE: the longitude of the sampled GPS point
- LATITUDE: the latitude of the sampled GPS point
- TIME: the timestamp in the format of seconds
- ISCARRY: the current status of the taxi, 0 for vacant and 1 for occupied.
We used both occupied and vacant GPS traces to study taxi efficiency. The pick-up and drop-off events of each taxi’s trajectory were extracted first. The data preprocessing steps were executed as follows:
Step 1. Extract event points and taxi trajectories from GPS records.
A file of raw GPS records was divided into different files by CARID, with each file containing the data of one taxi. The records in each file are sorted by TIME. A change of value in ISCARRY means an event. A value changing from 0 to 1 represents a pick-up event, and the value changing from 1 to 0 represents a drop-off event. Therefore, an occupied trajectory consists of a collection of GPS points between a pick-up event and a following drop-off event, and a vacant trajectory comprises the collection of GPS points between a drop-off event to the succeeding pick-up event.
Step 2. Calculate the time interval and network distance of each trajectory.
The time interval of each occupied and vacant trajectory was calculated by subtracting the TIME of two neighboring event points. To calculate the accurate distance in the road network, first the GPS points were matched to the nearest road network. Then, we used the Dijkstra algorithm [25] to calculate the shortest path between two neighboring points for path reduction. We added up the lengths of all paths to get the total distance of the trajectory of one taxi.
After data preprocessing, the distance and time interval of every occupied and vacant trajectory, as well as the timestamp and location of each event point, are available. These parameters were used to further evaluate taxi efficiency and performance.
3.2. Taxi Single Trip Efficiency
This article evaluates taxi driver performance by calculating their efficiencies, determined by the efficiency of all single trips. A high-efficiency single trip is part of a trajectory between a pick-up event and the succeeding pick-up event with a long driving distance, high driving speed and short transfer interval [26]. For taxi drivers, long driving distance means high income for one trip, and high speed means more profit for the same amount of time. Additionally, the cost of waiting for the next passenger should be as low as possible. So, it is important to shorten the passenger-finding time. As a result, a high-efficiency single trip is a trip that brings taxi drivers high income, high service efficiency, and short passenger-finding times after each drop-off.
To study taxi single trip efficiency, we quantify trip efficiency. Based on the definition of a high-efficiency single trip, the factors considered are income, service efficiency and passenger-finding time. Income is associated with driving distance and taxi fare policy. Service efficiency is associated with the fare and time. Passenger-finding time is associated with a vacant status. Previously, most researchers merely studied the occupied status of taxis. However, taxis in a vacant condition have no income, and the cost increases with time and car loss. As a result, we combine occupied trips (1) and empty trips (0) together, and regard them as a whole basic unit (as shown in Figure 1) to study taxi efficiency.
In this paper, vacant taxi status is incorporated when evaluating single taxi trip efficiency. An important driving factor of single trip efficiency is the total profit (I), as derived from the income of occupied status excluding the total cost during occupied status and vacant status, as Equation (1) shows.
where is the driving distance of occupied status, and is the driving distance of the subsequent vacant status. () is the taxi charging standard function at a certain period. is the taxi cost coefficient including fuel consumption and vehicle loss. We define single taxi trip efficiency () by the profit of a single taxi trip and time, that is, taxi profit per minute. The formula for single taxi trip efficiency (E) is described as:
where I denotes the profit of the trip. is the total operating time (minutes) of a single trip. T1 is the time of the occupied status. T2 is the time of the subsequent vacant status (minutes).
3.3. Taxi Performance Evaluation
We evaluate taxi performance by average taxi efficiency, as derived from the efficiency of all single trips in a day. We use weighting to model the importance of each single trip to the overall efficiency. The weight of each single trip is the ratio of the single trip time to the total daily operating time of the taxi. We summed up all the weighted single trip efficiencies to get taxi performance, as Equation (3) shows.
where P is the taxi performance and n is the number of taxi single trip in a day. is the occupied driving distance of ith single trip, and is the next empty driving distance of the ith single trip. is the time of the ith occupied state, is the time of the ith vacant state (h). The validation analysis of this approach to average taxi efficiency is introduced in Section 5.
4. Space-Time Distribution of Top and Ordinary Drivers
4.1. Ranking Taxi Drivers
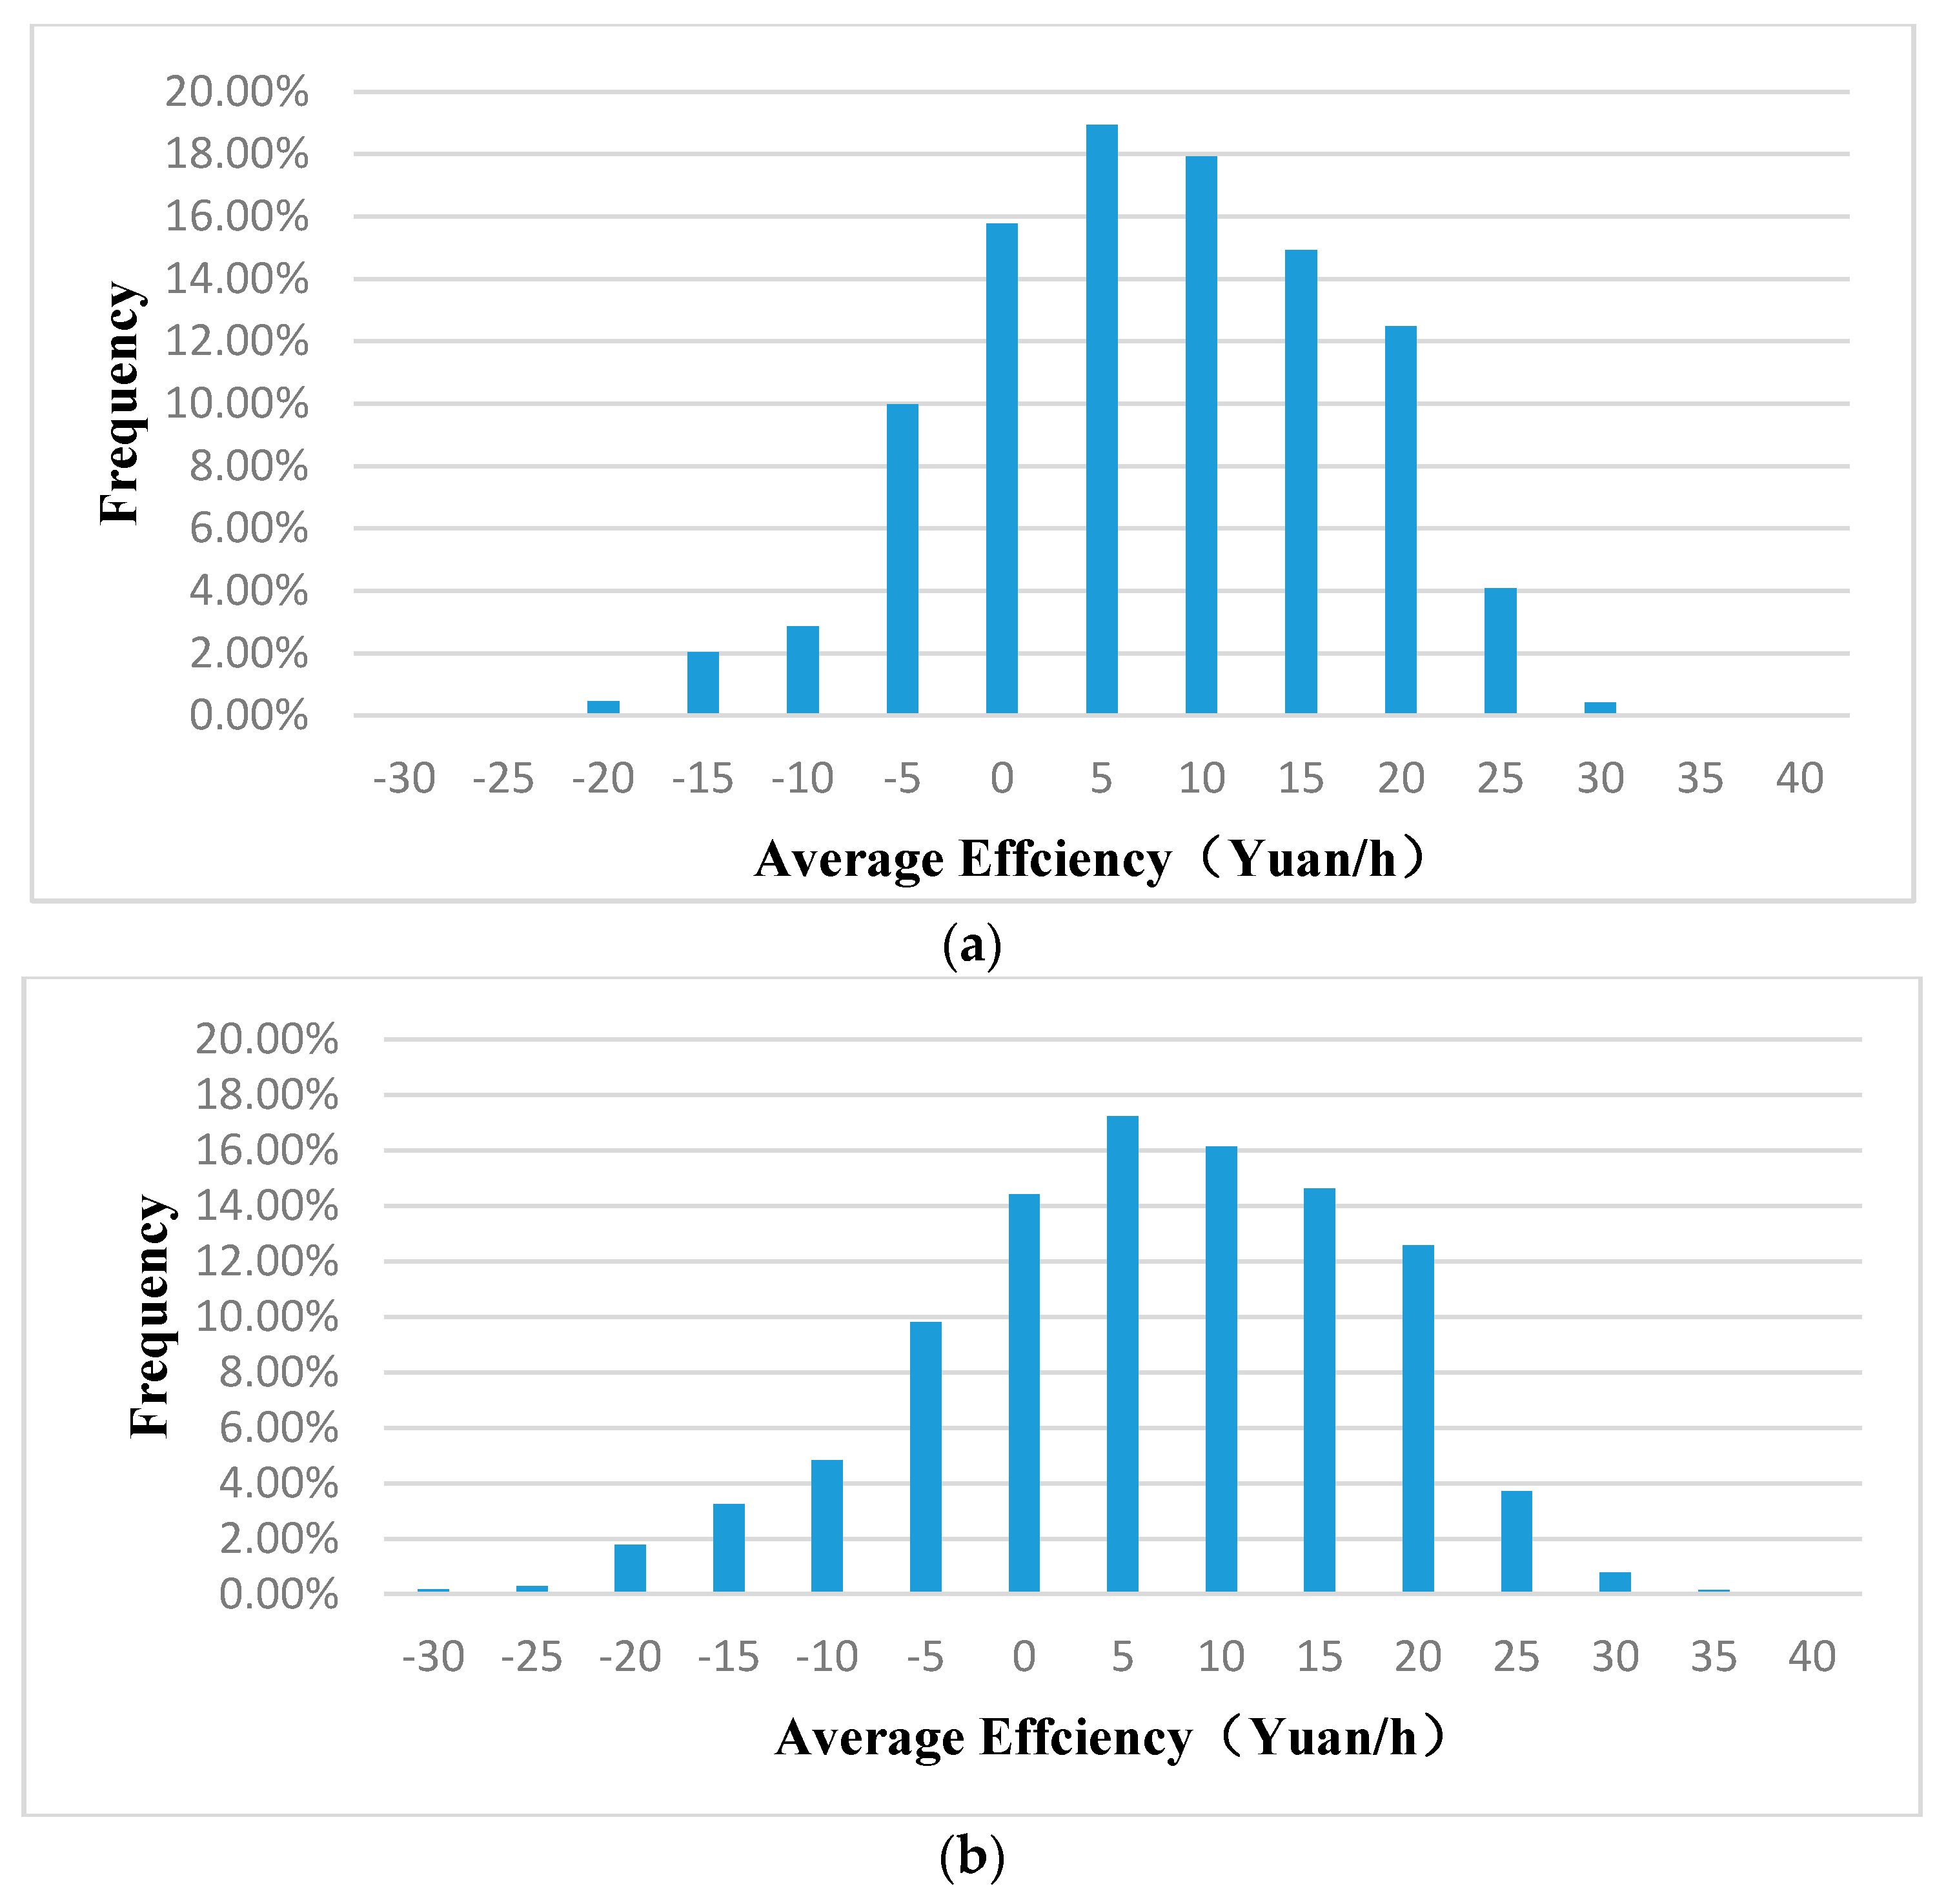
In this paper, we use taxi average efficiency as a taxi performance measure to classify taxi drivers into top drivers and ordinary drivers. To this end, first we use the distance data as discussed in Section 2 to calculate single trip efficiency with Equations (1) and (2). We calculate taxi performance with Equation (3). This paper uses the taxi fare standards of Wuhan in 2013, in which the fare is 7.5 Yuan within 2 km, 8 Yuan from 2 km to 3 km, with additional 1.4 Yuan charged per kilometer from 3 km to 7 km, and another 50% in unit price for trips above 7 km as re-positioning surcharge. For the cost coefficient K1, the taxi gas consumption is 0.5–0.7 Yuan per kilometer in 2013. Adding the spending on vehicle maintenance, this paper takes 0.9 Yuan for K1. We first divide GPS data of one week into two groups, weekdays and weekends. Then, we can calculate the taxi daily average efficiency and rank 2000 taxi drivers. The distribution of average efficiency of all taxis is as shown in Figure 2.
From Figure 2a,b we can see that taxi average efficiencies follow a Gaussian distribution. Most of the efficiency was near the mean value (0–5 Yuan/h), although some values are very high (over 20 Yuan/h). There are about 20% taxis with negative efficiencies (below 0 Yuan/h), which means the cost of their passenger-finding process is beyond the income of operation process. We regard taxis with 0–5 Yuan/h as ordinary drivers. Drivers with efficiencies above 20 Yuan/h are regarded as top drivers, who account for 5% of all these 2000 drivers.
4.2. Space-Time Distribution of Top Drivers
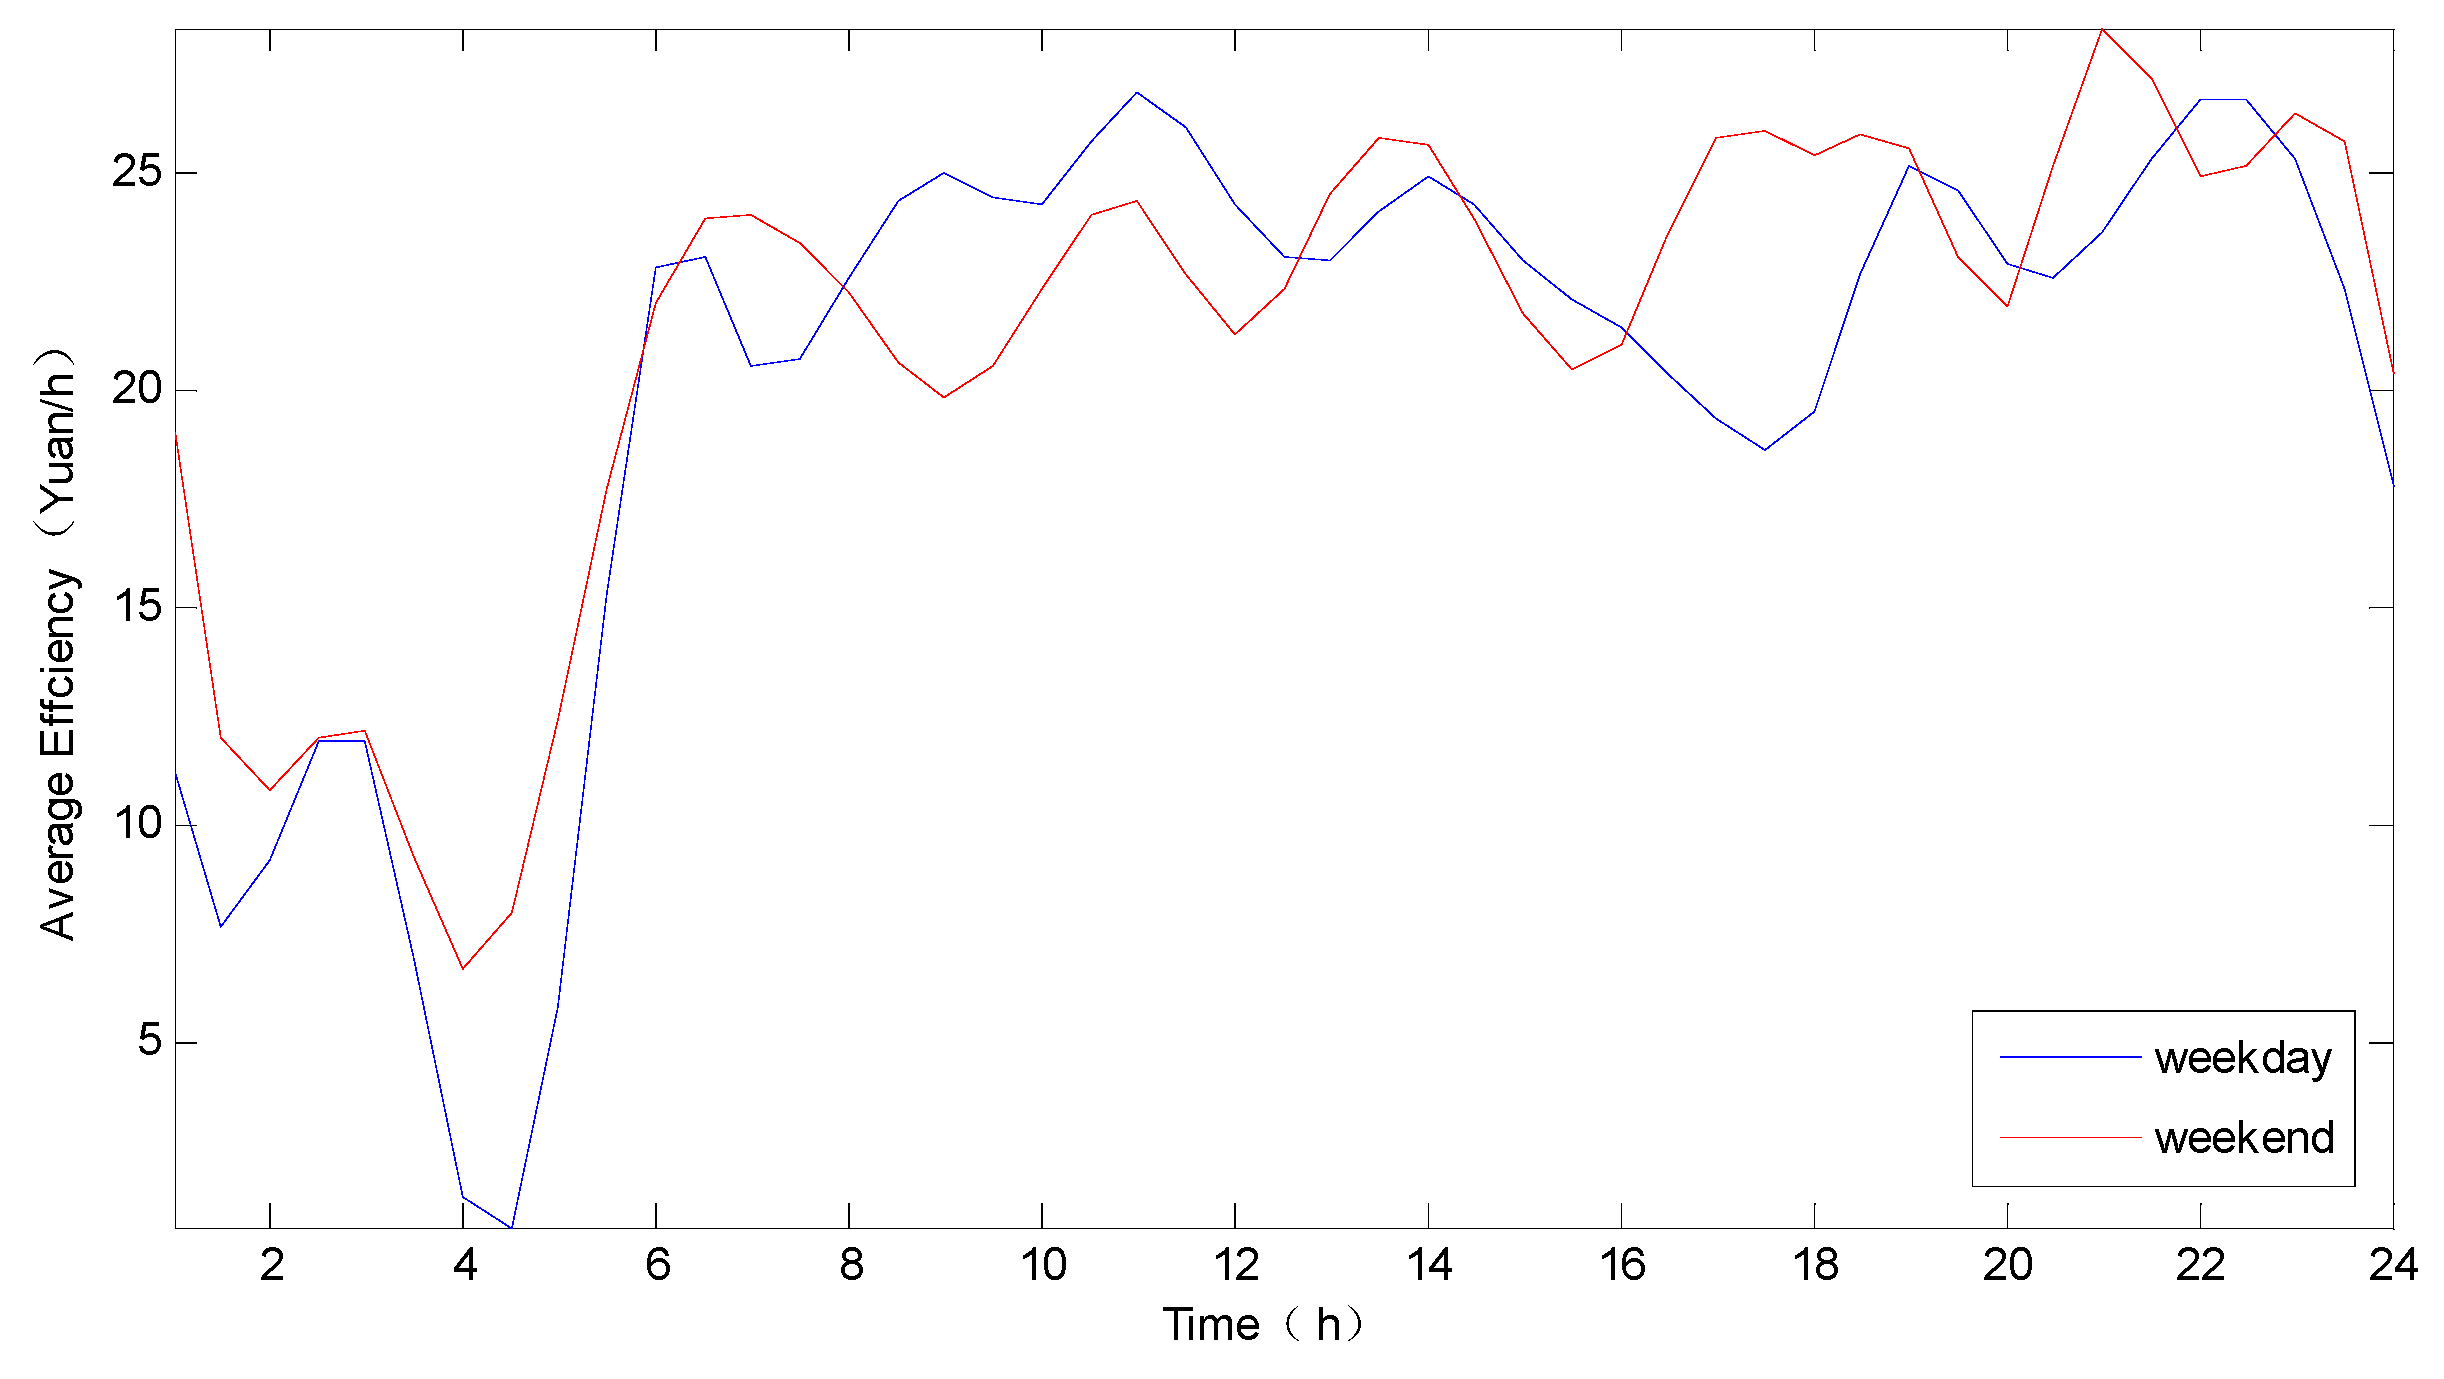
To study top drivers' operation patterns, we selected the top 5% of drivers (above 20 Yuan/h) from 2000 taxis over weekdays and weekends, and analyzed the space-time distribution of their traces in space and time. First, we separated their time distribution of average efficiency into weekdays and weekend, as in Figure 3.
The comparison result shows that top drivers keep similar daily changing tendencies on weekends and weekdays, although there are some difference between them. In weekdays mornings (6:00~8:00), taxi average efficiency of top drivers keeps increasing because people start going to work. There is high demand for taxis at that time, and top taxi driver operational choices are numerous. On weekend mornings, commuting activities slow, accounting for a decrease in the taxi average efficiency of top drivers. On weekdays, top driver efficiency is influenced by poor traffic conditions in rush hour (17:00~19:00). After 19:00 on weekends, social activities increase, so taxi efficiency of top drivers is higher than on weekdays.
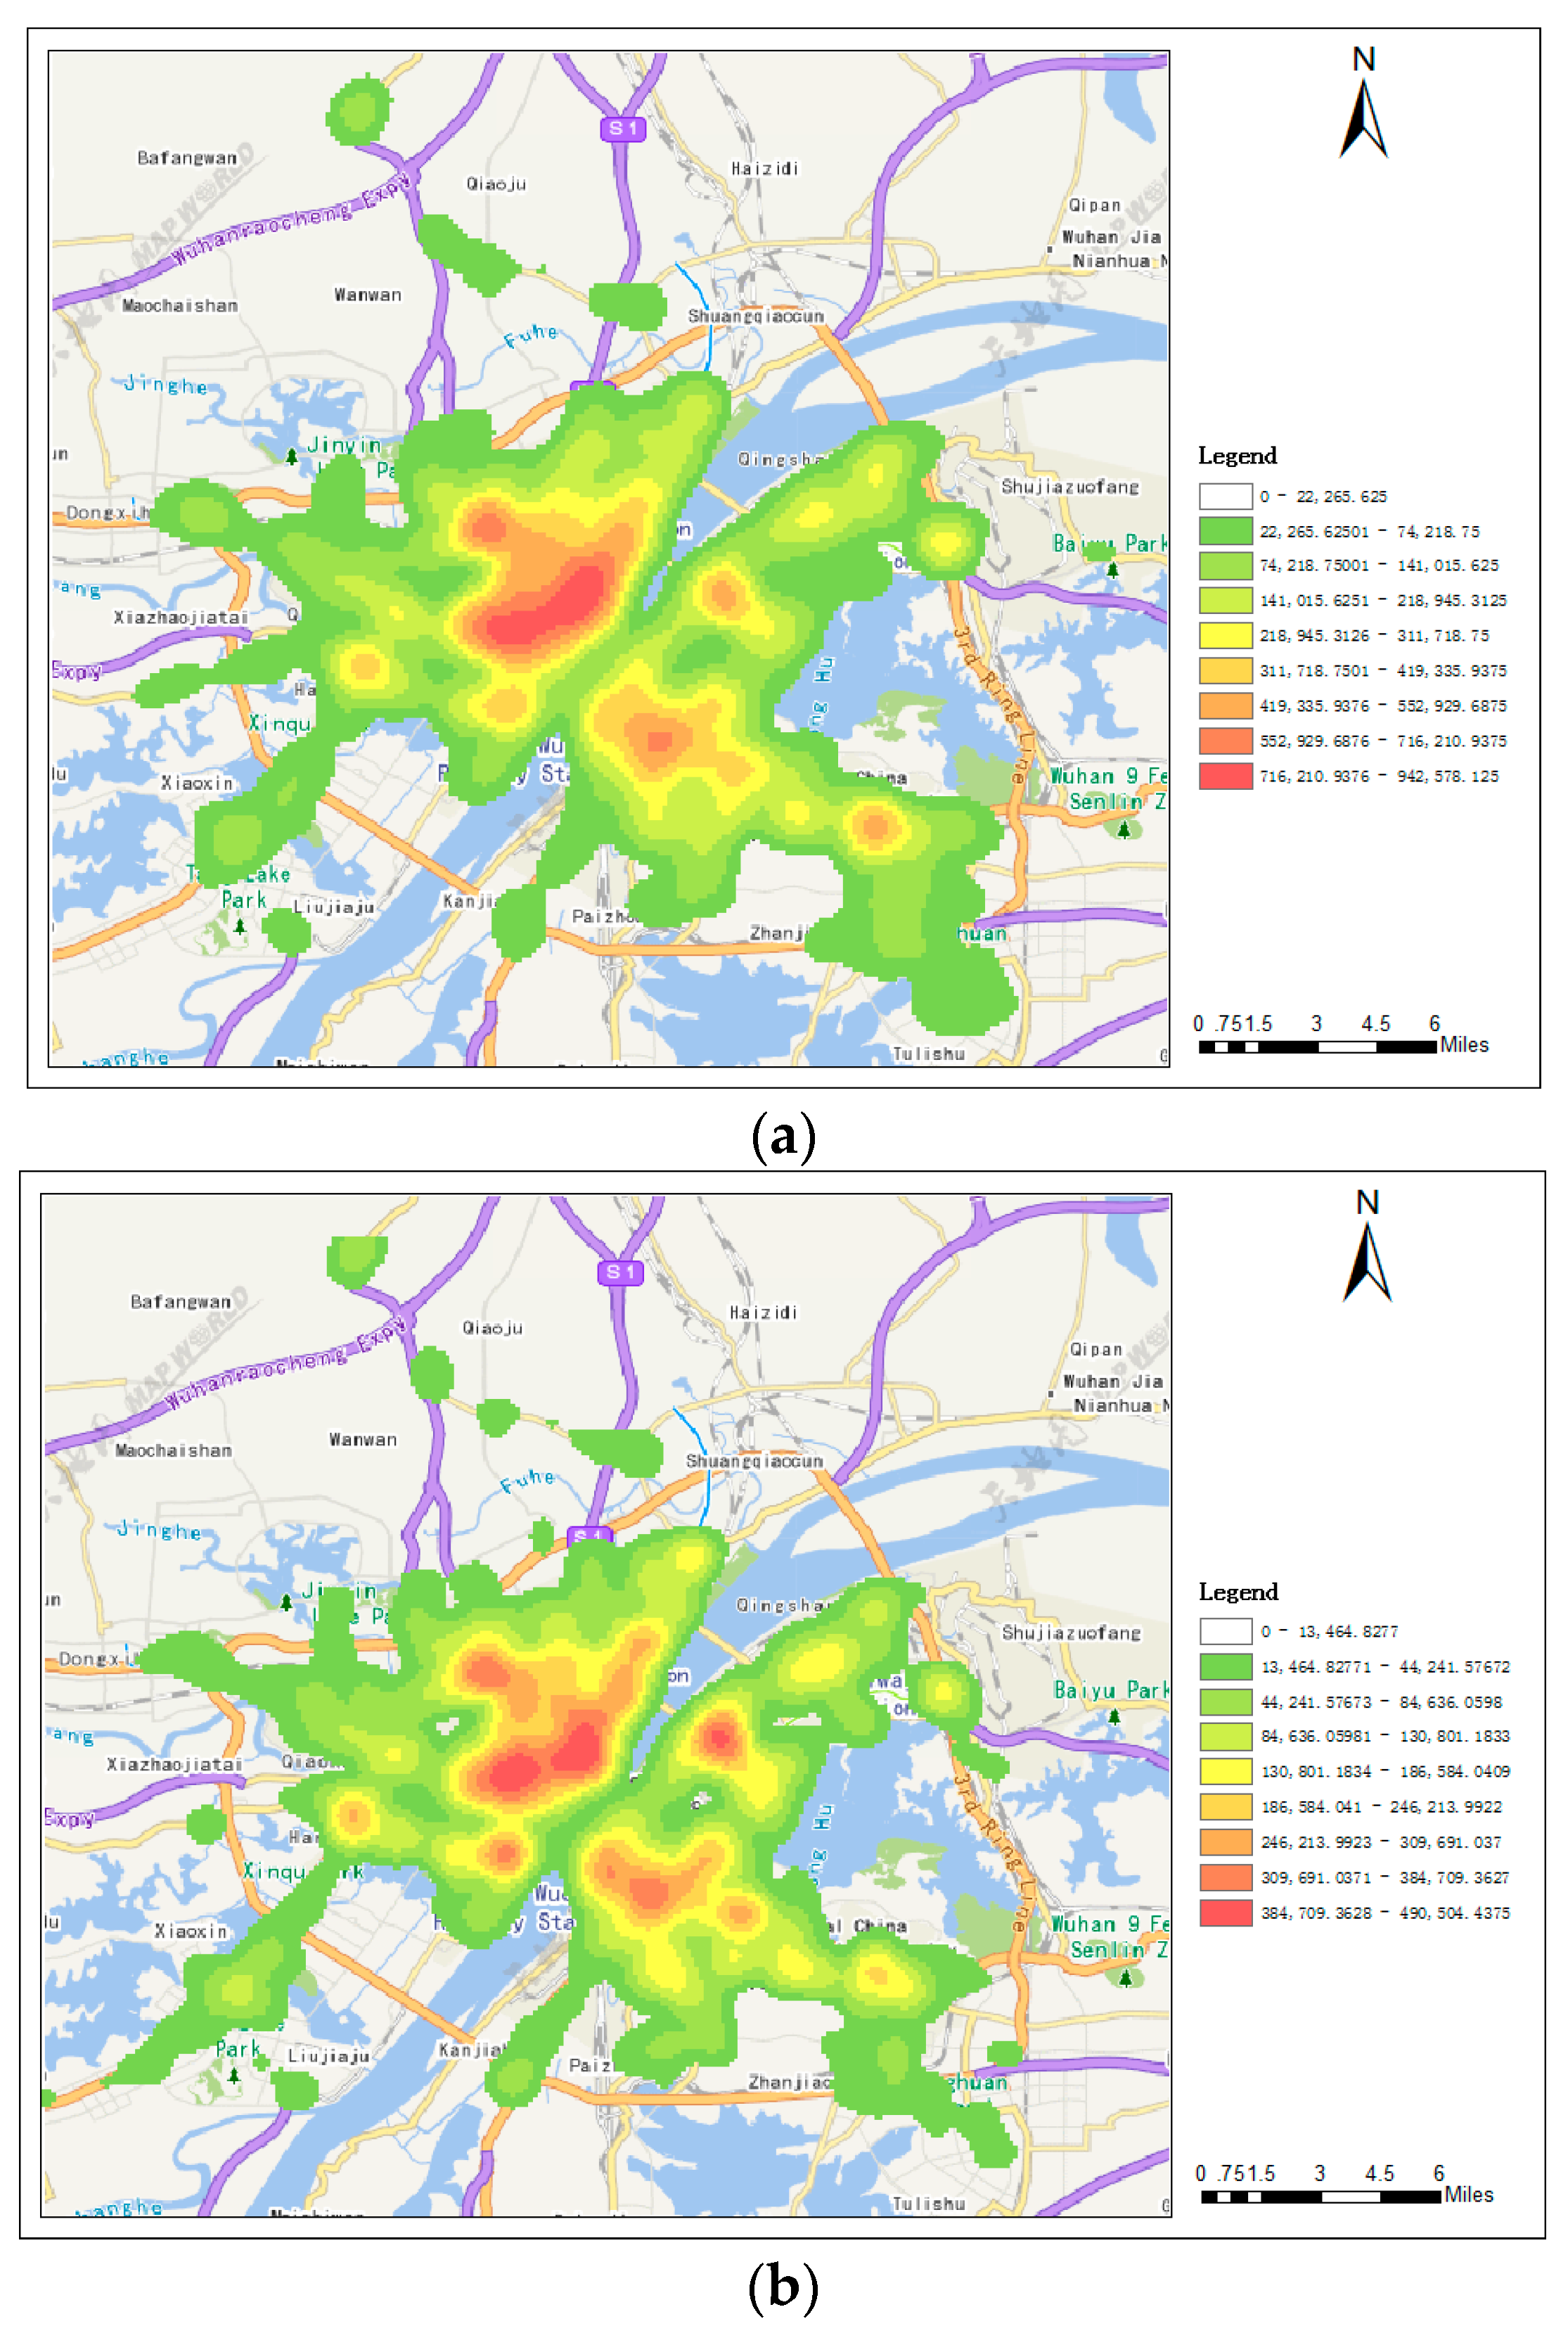
We extracted the pick-up points of the top 5% of drivers and overlayed their distribution on a map of Wuhan city, and displayed the spatial distribution of pick-up points with Kernel Density Estimation (KDE) [27]. In the standard planar KDE method, the estimator is as in Equation (4).
where (s) is the density at location s, r is the search radius (bandwidth) of the KDE (only points within r are used to estimate density), and k is the weight of a point i at distance dis to location s, which is usually modeled as a kernel function of the ratio between dis and r. The spatial distributions of top drivers on weekdays and weekends are shown in Figure 4 with a searching radius of 1.5 km. The values of density represent the weight of points within the searching area determined by searching radius [28].
Figure 4 shows that top driver pick-up events show a similar distribution on weekdays and weekends. The hot pick-up spots for top drivers are Jiefang Avenue in Hankou district, Hanyang Avenue in Hanyang district and Xudong Avenue in Wuchang district. These places are commercial areas and urban transportation hubs. Otherwise, Wuchang Railway Station, Wuhan Railway Station, Hankou Railway Station and Tianhe airport gather lots of pick-up points. Compared with distribution on weekdays, distribution of pick-up events on weekends is more dispersed, indicating that top drivers have a more diverse choice of operating area on weekends.
4.3. Spatial Clustering of Operational Points
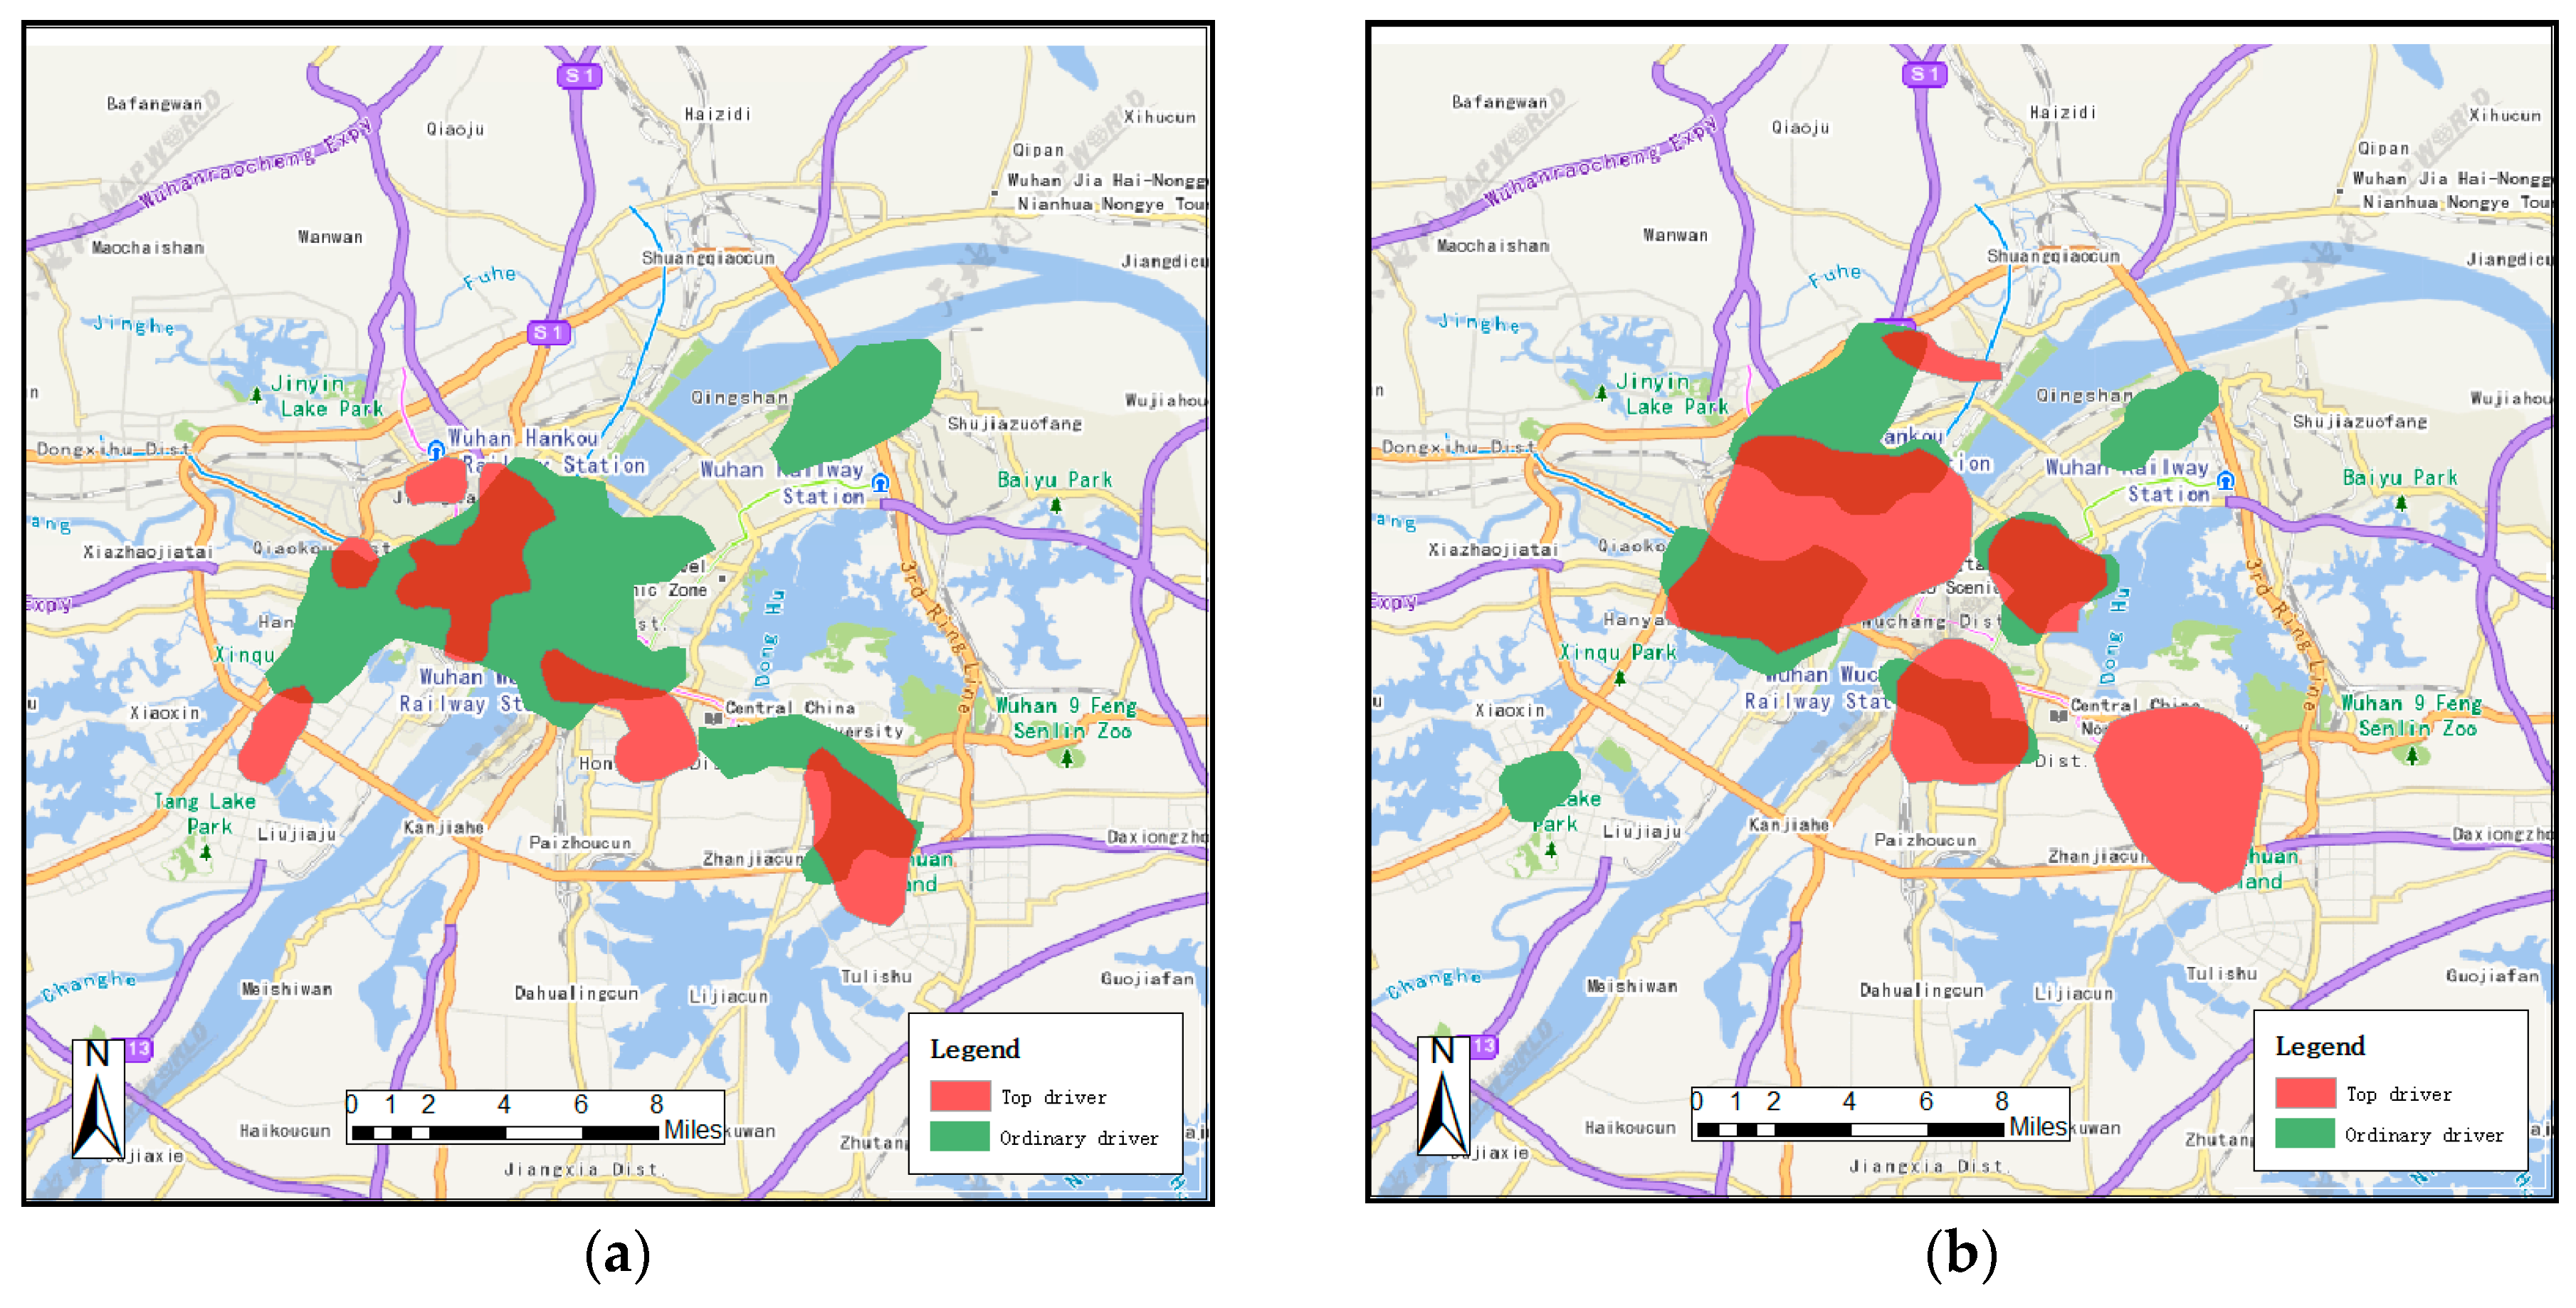
The efficiencies between top and ordinary drivers are significantly different, prompting the question as to why. First, we selected the No. 1 driver on weekdays (taxi ID is 15995), and an ordinary driver selected at random (taxi ID is 12476). In order to find the spatial operation characteristics of top and ordinary drivers, we used the DBSCAN clustering algorithm [29] to calculate the cluster center of operation points. We extracted the operational points of top and ordinary drivers, and set the appropriate scan radius and the minimum number of points required to form a dense region, and obtained the operation centroids for the top driver and ordinary driver on weekdays, as Figure 5a,b show.
The No. 1 top driver has eight operation clusters dispersed across the city. Each cluster concentrates in a small area. The ordinary driver has only two clusters, which were very close to each other. The operation centers of the top driver distributed in both central and peripheral areas of the city, which means that the operation behaviors of the top driver are heterogeneous. However, the operational points of ordinary drivers are limited to the center of the city, which means their driving behaviors are more homogeneous.
4.4. Comparison of Space-Time Distribution between Top Drivers and Ordinary Drivers
We first selected the top 5% of the 2000 taxi drivers and calculated the average efficiency for different periods of the day, and compared the result with 100 ordinary drivers. From Figure 6, we know top drivers and ordinary drivers have similar trends in efficiency during weekdays. Top drivers show higher efficiency than ordinary drivers at almost all times of day due to their mobility intelligence. During 8:00~11:00, the ordinary drivers’ efficiency decreases, but efficiency of top drivers continues to go up. From 16:00~19:00, the efficiency of top drivers decreases then increases, but the efficiency of ordinary drivers shows no obvious fluctuations.
To study why their performances show such differences, we extracted several periods and analyzed spatial distribution of efficiency for top drivers and ordinary drivers at these times. We analyzed the distribution of top driver and ordinary driver traces during four time periods of 7:00~9:00, 9:00~11:00, 17:00~19:00 and 19:00~21:00, as Figure 7 shows.
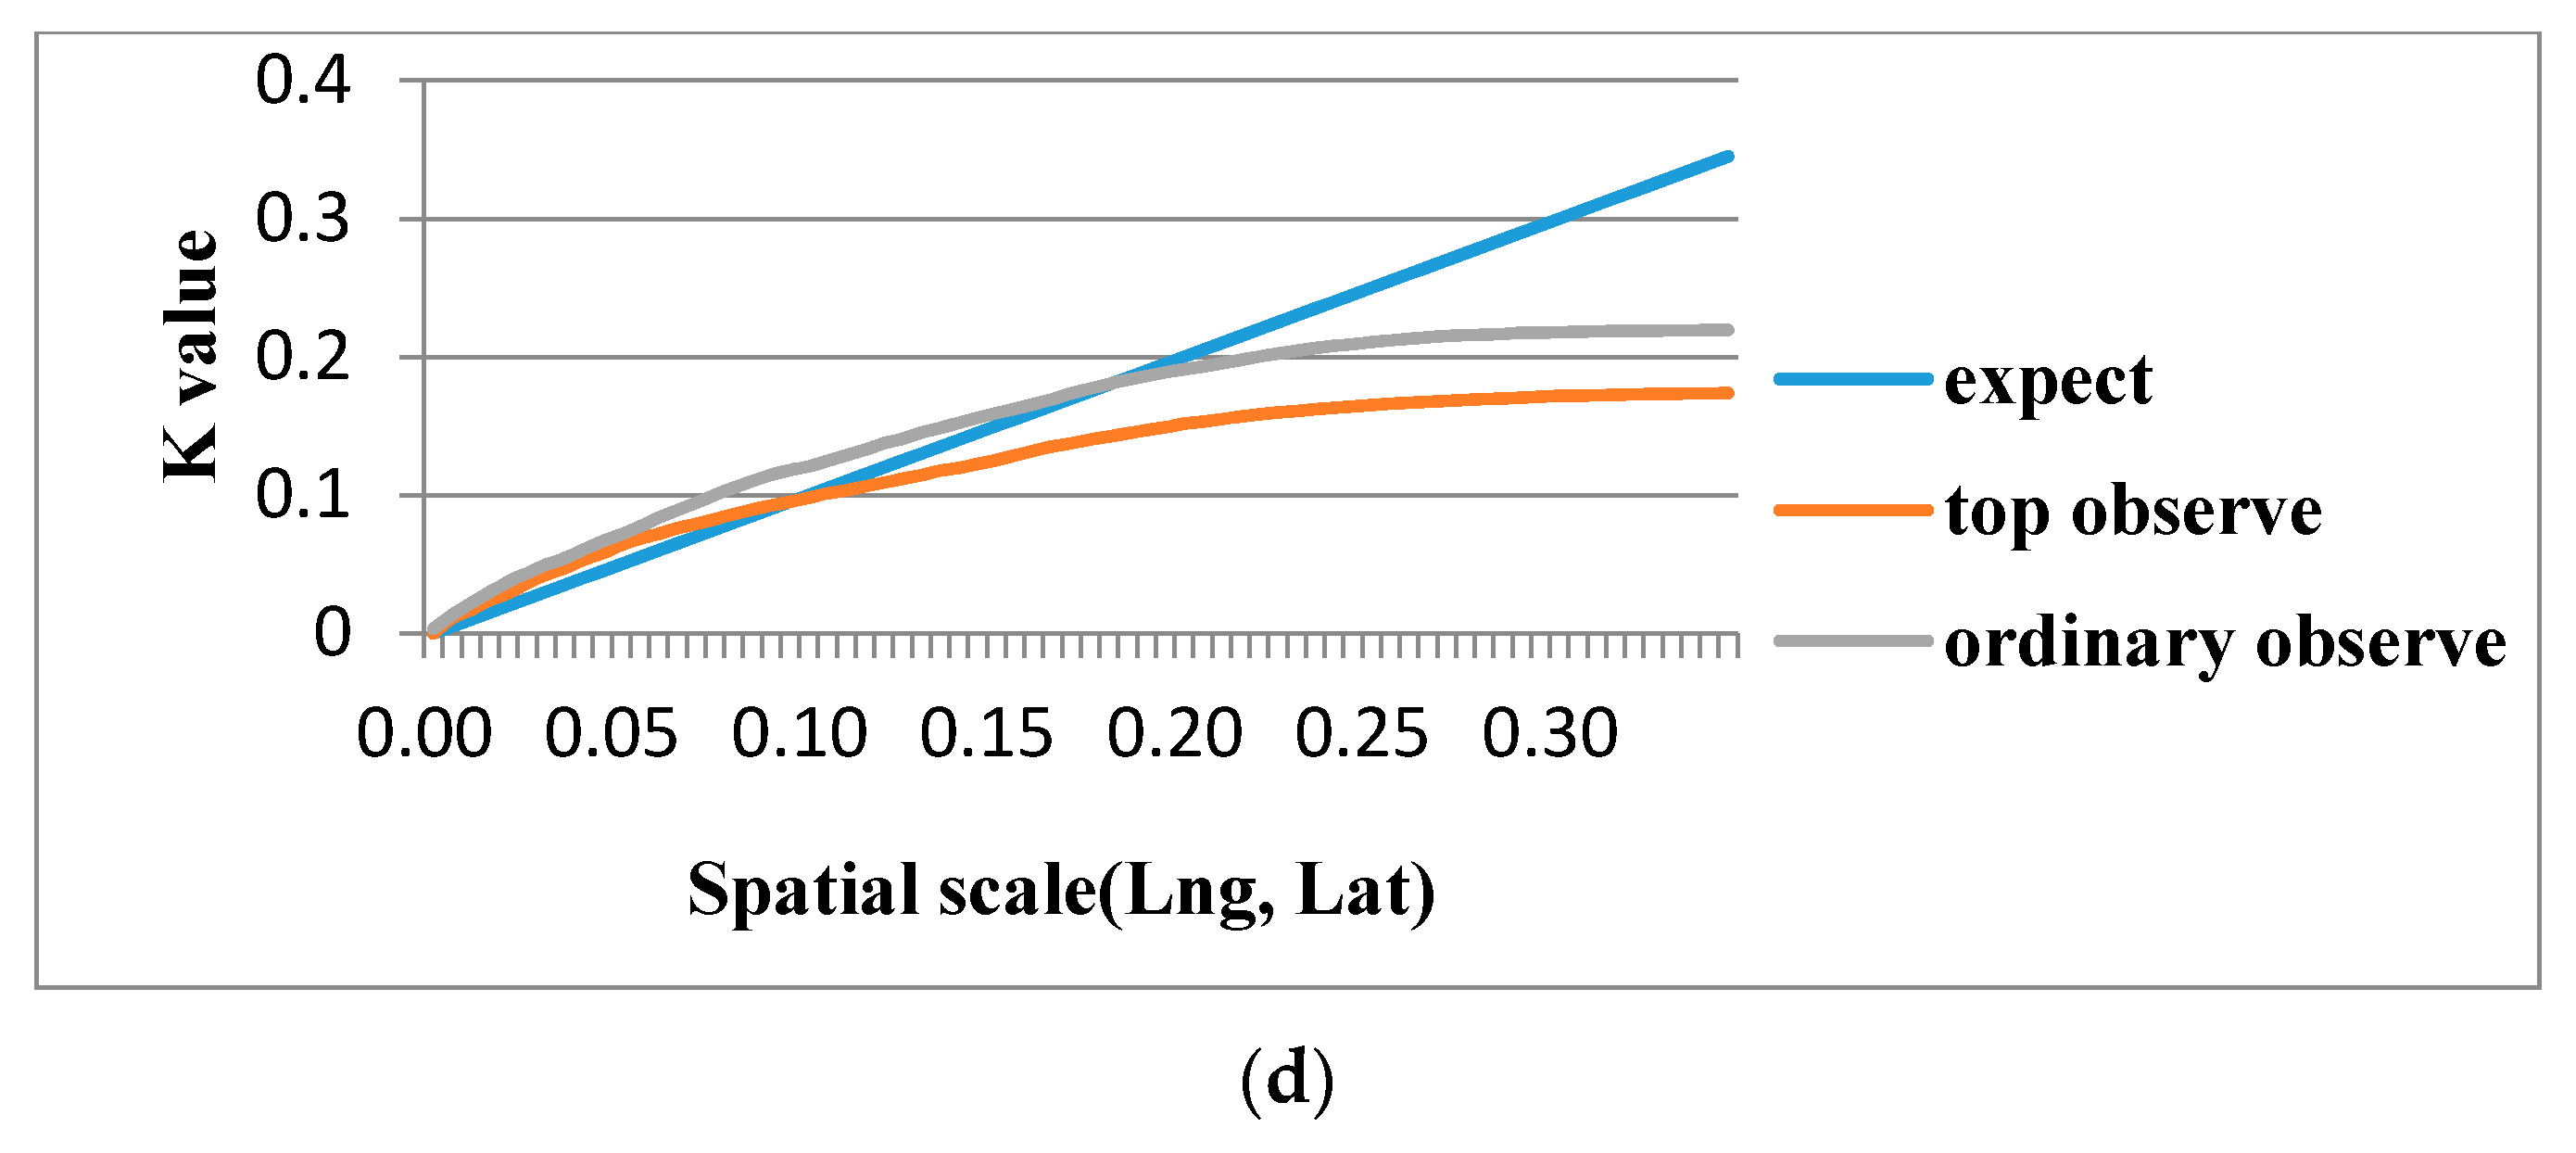
Then, we studied the spatial clustering patterns for the traces of top drivers and ordinary drivers with Ripley’s K function. Ripley’s K-function is a tool to analyze completely mapped spatial point process data. It reveals point patterns, tests hypotheses about the patterns, and estimates parameter fitted models [30]. Ripley’s K-function is one of the most effective and comprehensive methods to deal with the intensity of clustering, as it tests point patterns at various spatial scales, handles all event–event distances and does not aggregate points into areas [31]. In this section, we use Ripley’s K-function to measure the degree of spatial aggregation for the taxi pick-up points of top and ordinary drivers. The result is shown in Figure 8, where the expected K and observed K describe the distribution pattern. If the observed K value is higher than the expected K value at a certain spatial scale, the distribution is more aggregated than a random distribution. Otherwise, the distribution is more discrete than a random distribution. To compare different taxi drivers’ spatial aggregation, we calculated the expected K and observed K for the pick-up points of top and ordinary drivers during four time periods, as Figure 8 shows.
Operational differences between top drivers and ordinary drivers are reflected in Figure 7 and Figure 8.
Figure 7a shows that in the period 7:00~9:00, ordinary drivers picked up passengers in the center of the city, and most of their passengers were located inside the 2nd ring road. Top drivers picked up passengers in many different places. Most of the top drivers operated on the 3rd ring road in Hanyang district, the Zongguan Bus Station in Hankou district, Jianshe Avenue and Jiefang Avenue, Hankou Railway Station in the Hankou district, Wuchang Railway Station and Jiedaokou, and Guanshan Avenue in Wuchang district. Top drivers are good at finding operation zones in good traffic conditions and high passenger demand in rush hours. For example, the Zongguan Bus Station has a big demand for taxis, and is in a good traffic conditions on the 2nd ring road. As a result, taxis operating in this zone find it easier to find passengers, generating higher income. These drivers realize high performance. From Figure 8a, we see the top driver pick-up points aggregate at a smaller spatial scale, suggesting that top drivers are expert in finding passengers in certain zones. They know the most likely locations to find passengers and have a strong desire to find passengers.
Figure 7b shows that during 9:00~11:00, most of the ordinary drivers and top drivers operate inside the 2nd ring road, despite the fact that some ordinary drivers operate on the outskirts of Wuhan city. During this time period, traffic conditions have recovered after rush hours. Drivers operating in the center of the city at this time are more likely to find a passenger and achieve higher efficiency. In Figure 8b, due to decreasing demand, top and ordinary drivers have to expand the spatial scale of their operations to find passengers, so the spatial scales of aggregation for the top and ordinary drivers resemble each other. Comparing to Figure 7a and Figure 8a, we discovered that top drivers change their operational area and scale during different periods of a day.
In Figure 7c, we can discover that the distributions of top and ordinary drivers display differences during 17:00~19:00. Ordinary drivers operate inside the 2nd ring road, with pick-up points aggregated in the commercial areas of the Hankou district, and Xudong Avenue, Wuluo Road and Optics Valley Square in the Wuchang district. However, most of the top drivers operate out of the 2nd ring road, and scattered across many other places, such as Duoluokou Market, Zhuankou Street and Optics Valley Software Park near the 3rd ring road, Erqi Road, Moshui Lake and the Wuchang Railway Station along the 2nd ring road. These results show that top drivers prefer working on the outskirts of the city to avoid traffic jams in rush hour, and often pick-up passengers at transportation hubs. In Figure 8c, the spatial scale of pick-up aggregation is almost the same for top and ordinary drivers, indicating that picking up passengers on the outskirts of the city is as easy as picking up passengers at center of the city during the 17:00~19:00 period.
Figure 7d shows that during 19:00~21:00, ordinary drivers make more diverse choices of operational area than the top drivers do. Most of these places are commercial districts with leisure and recreational facilities. Top drivers operate in the similar way but they target fewer pick-up spots, such as Wangjiawan in Hanyang district and Jiefang Avenue in Hankou district, and Optics Valley Square and Minzu Avenue in the Wuchang district. In Figure 8d, as compared to ordinary drivers, top driver pick-up points aggregate at a smaller spatial scale. These comparisons demonstrate that passenger demands decrease after rush hour and are distributed in recreational areas. In this case, top drivers operate in a smaller spatial scale at certain places so that they can easily find passengers and improve their performance.
5. Comparison of Different Taxi Ranking Approaches
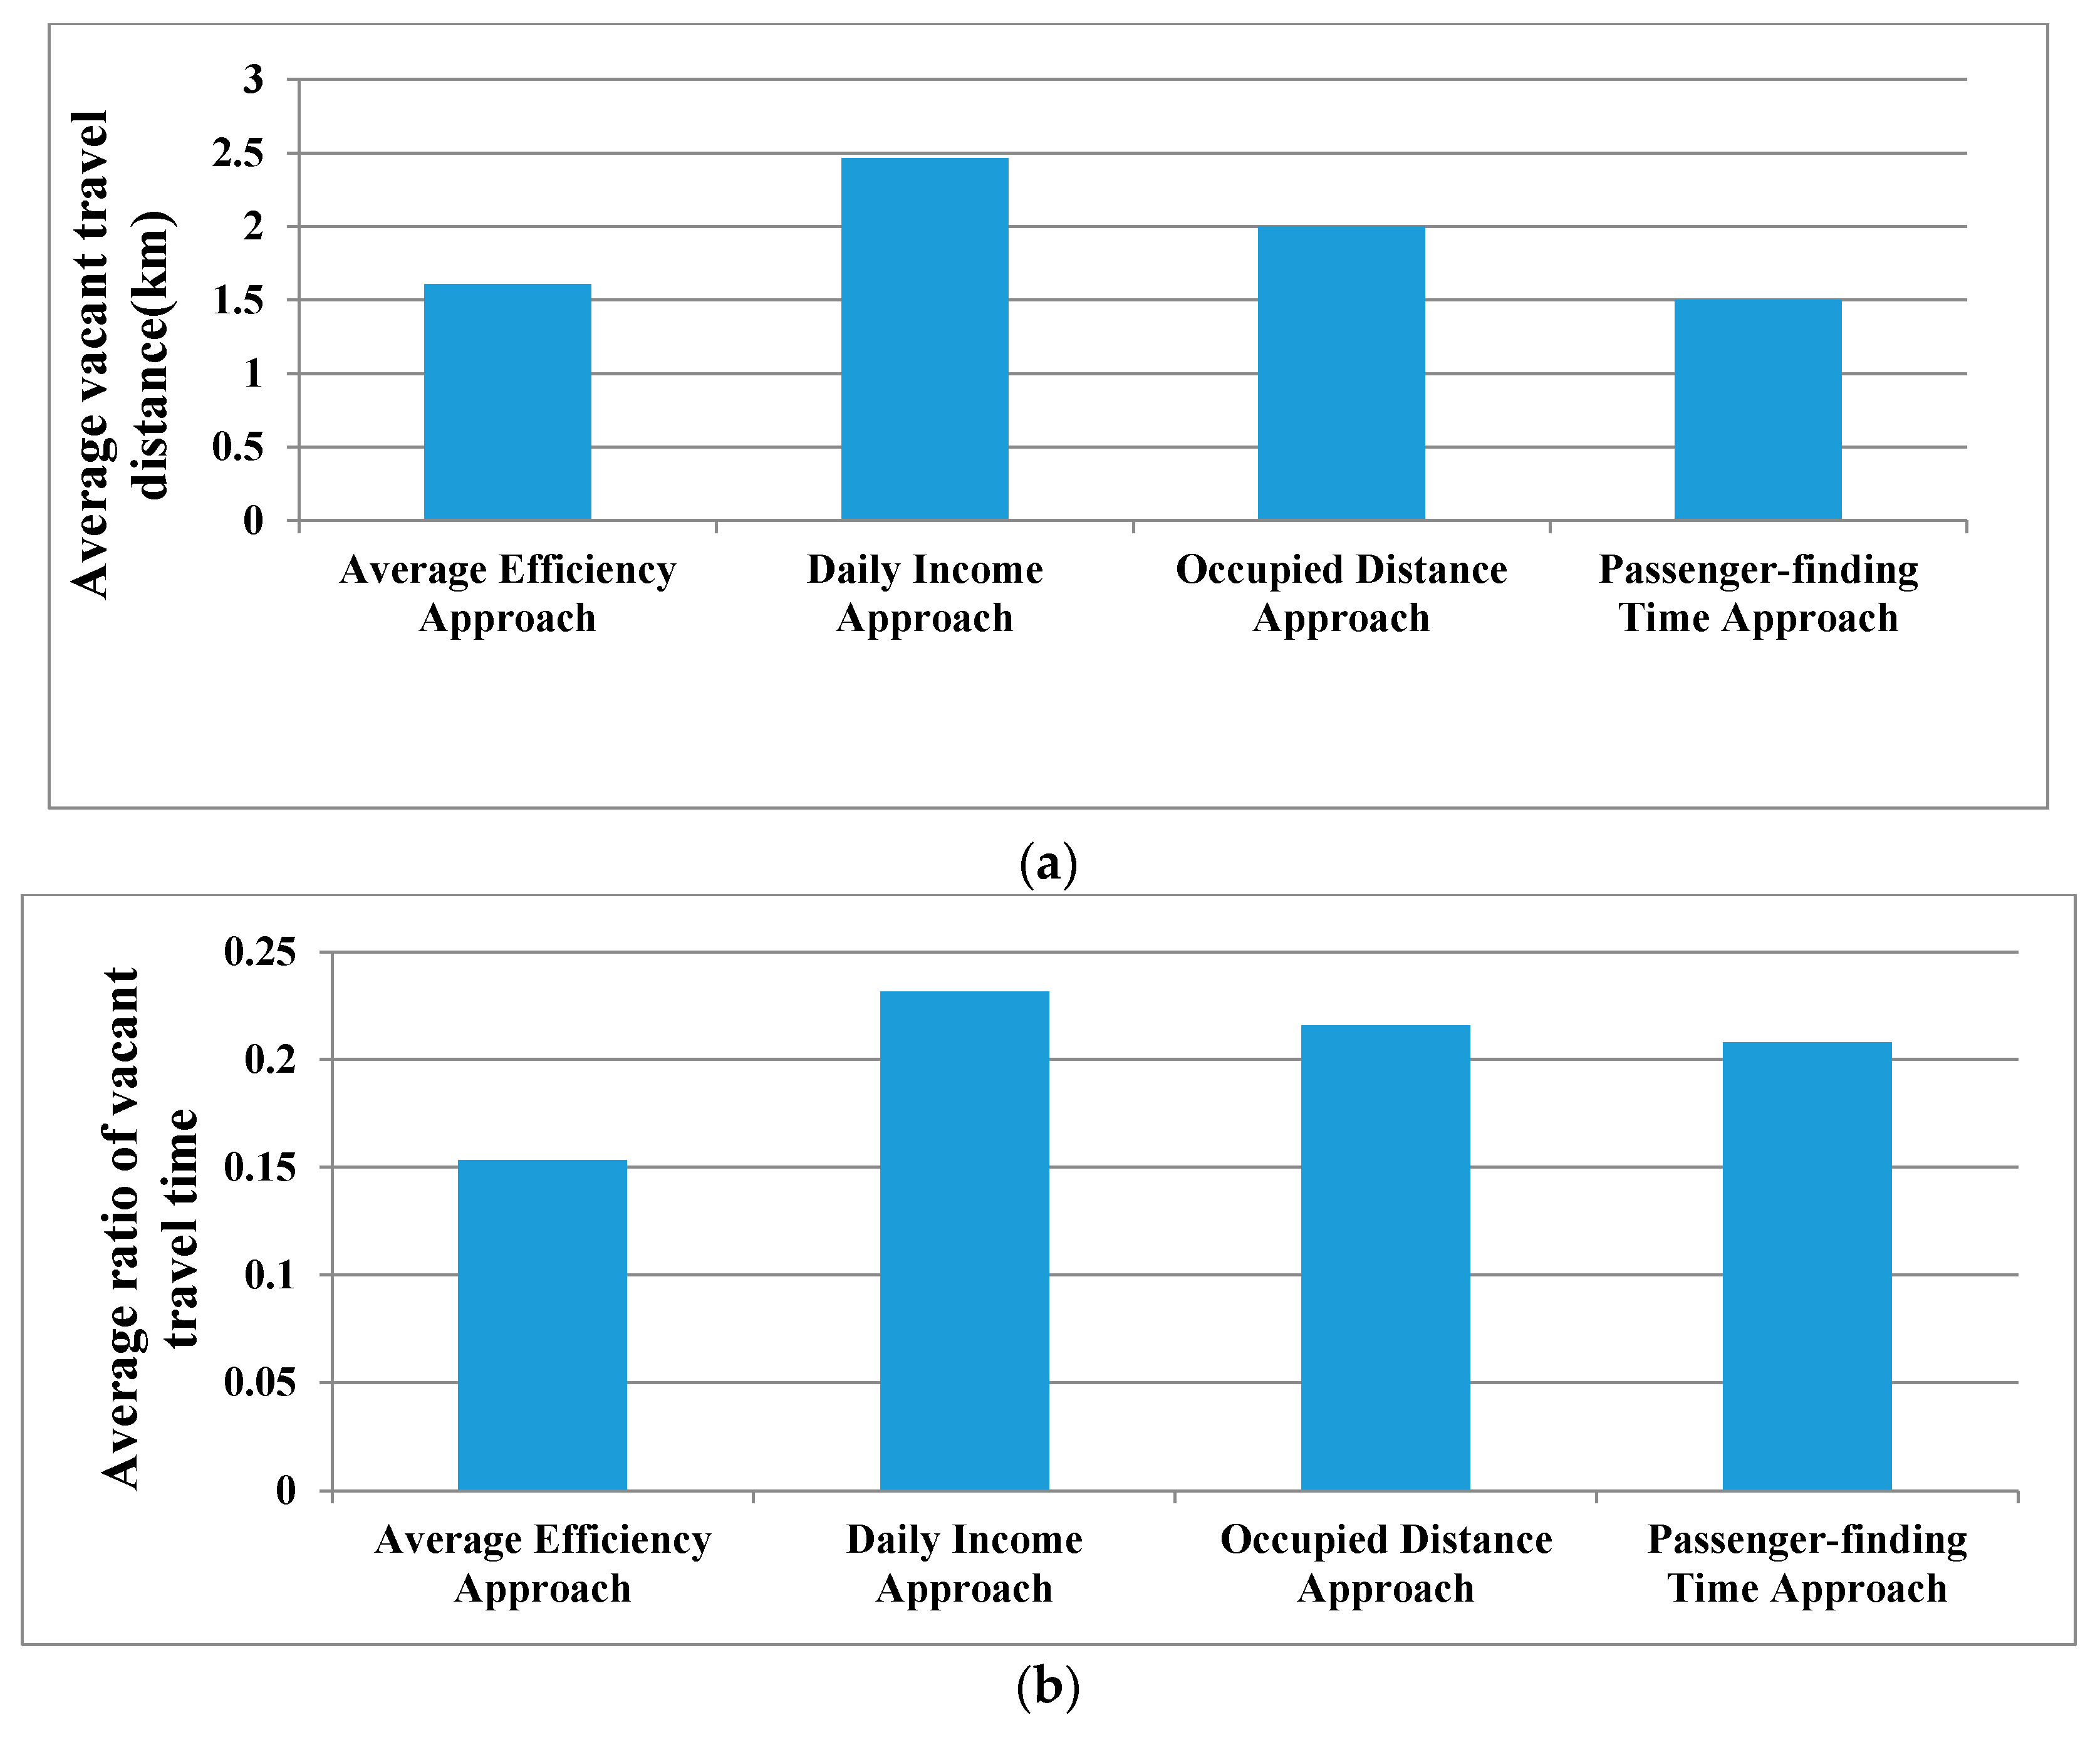
We evaluated taxi performance by average taxi efficiency and ranked taxi drivers by performance. There are many ranking methods for classifying taxi drivers and evaluating taxi performance. Liu et al. [19] ranked taxis according to daily income to analyze and compare top and ordinary drivers. Li et al. [9] ranked drivers based on the occupied distance covered by each taxi, an indicator of driver knowledge about where to pick-up ‘good’ passengers making longer trips. Ge et al. [20] ranked taxi drivers based on the proportion of time the taxi was occupied. If the occupied time represents a big proportion of the total operating time, then this taxi driver is expert in finding passengers. Castro et al. [1] regarded average passenger-finding time as a ranking criterion, which is a direct indication of passenger-finding efficiency. To test the validation of the average efficiency approach in ranking taxi drivers, we compared our proposed approach with three other taxi ranking approaches, daily income [11], occupied distance [20], and average passenger-finding time [1]. We used two evaluation indices for taxi performance, taxi average vacant travel distance and average ratio of vacant travel time, to evaluate ranking results. Lower values for the two indices means higher performance of the taxi driver. Taxi vacant average travel distance considers the driving routes and distance, while taxi average ratio of vacant travel time focuses on the costs incurred during the passenger-finding process. We first extracted the top 1% of 2000 taxi drivers using different taxi ranking approaches, then, we calculated the average vacant travel distance and the average ratio of vacant travel time for every extracted driver. We consider the mean value of indices of the top 1% drivers to be the performance of the taxi ranking approaches. The results are shown in Figure 9.
Figure 9a shows that the average vacant travel distance of the top drivers extracted by the average efficiency approach (1.6 km) is almost as low as for the average passenger-finding time approach (1.5 km). However, the average ratio of vacant travel time of top drivers extracted by the average efficiency approach (0.15) is clearly lower than that of average passenger-finding time approach (0.21) as seen in Figure 9b, reflecting that our proposed average efficiency approach is more accurate than other methods in extracting high performance taxis and ranking taxi drivers. The daily income approach shows the highest values for both average vacant travel distance and average ratio of vacant travel time, indicating a deficiency when handling cases where many taxis in Wuhan operate only during certain periods of the day. The difference in taxi operation time has an effect on their daily income. These comparative results validate our average efficiency approach for the measurement of driver performance and for ranking taxi drivers. Thus, average taxi efficiency is a metric suitable for evaluating taxi driver performance.
6. Conclusions
In order to improve taxi performance, we studied taxi mobility intelligence using large-scale taxi GPS trajectories. The concept of high-efficiency single trip is introduced to measure the profitability and efficiency of a taxi single trip. Furthermore, taxi driver performance is evaluated based on daily average taxi efficiency. The main contributions of this paper are the analysis of taxi behavior patterns using spatio-temporal methods and a new optimized performance evaluation approach.
In the case study, we use taxi average efficiency to first classify taxi drivers into top and ordinary drivers. Then, we analyze the space-time distribution of top and ordinary drivers to reveal the operational patterns for weekdays and weekends. In subsequent experiments, we compare the No. 1 driver with an ordinary driver, finding that the top driver selected more diverse locations of operation than the ordinary taxi driver. Compared to ordinary drivers, the top 5% taxi drivers perform much more efficiently. Our comparative results show that top drivers more actively seek passengers to make more money. We also compared the spatial distributions of top drivers and ordinary drivers during different time periods on weekdays, and analyzed the spatial scale of aggregated pick-up events using Ripley’s K-function. The results show that top drivers always search for passengers purposefully, and they know how to find places with good traffic conditions and passenger demand during different time periods. Instead of hunting for passengers in the downtown area with the most consumption demand, top drivers usually navigate through the whole city, changing operational locations consistently to regions with good traffic conditions. These results not only reveal the unique passenger-finding intelligence of top drivers, but also provide empirical insights for promoting better taxi performance.
In Section 5, we compared our taxi ranking approach to others using two taxi performance evaluation indices, the taxi average vacant travel distance and taxi average ratio of vacant travel time. Lower values for the two indices translate into higher taxi driver performance. These results show that our taxi average efficiency approach can identify high performance taxi drivers and rank taxis more accurately than other approaches.
In future research, we will extract driving strategies from the high performance drivers’ distribution patterns to help taxi drivers find high-efficiency passengers at different times in different areas. Taxi driver operating time can be saved and income might rise, if taxi performance can be improved.
Acknowledgments
This work was supported by the National Natural Science Foundation of China (No. 41671442, 41571430, 41271442).
Author Contributions
Luliang Tang and Fei Sun proposed and designed the evaluation model. Fei Sun performed the experiments and wrote the paper. Zihan Kan, Chang Ren and Luling Cheng analyzed the result.
Conflicts of Interest
The founding sponsors had no role in the design of the study; in the collection, analyses, or interpretation of data; in the writing of the manuscript, and in the decision to publish the results.
References
- Castro, P.S.; Zhang, D.; Chen, C.; Li, S.; Pan, G. From taxi GPS traces to social and community dynamics: A survey. ACM Comput. Surv. 2014, 46, 1167–1182. [Google Scholar] [CrossRef]
- Moreira-Matias, L.; Mendes-Moreira, J.; de Sousa, J.F.; Gama, J. Improving mass transit operations by using AVL-based systems: A survey. IEEE Trans. Intell. Transp. Syst. 2015, 16, 1636–1653. [Google Scholar] [CrossRef]
- Tang, L.; Kan, Z.; Zhang, X.; Sun, F.; Yang, X.; Li, Q. A network kernel density estimation for linear features in space–time analysis of big trace data. Int. J. Geogr. Inf. Sci. 2016, 30, 1–21. [Google Scholar] [CrossRef]
- Tang, L.; Kan, Z.; Zhang, X.; Yang, X.; Huang, F.; Li, Q. Travel time estimation at intersections based on low-frequency spatial-temporal GPS trajectory big data. Cartogr. Geogr. Inf. Sci. 2016, 43, 417–426. [Google Scholar] [CrossRef]
- Zhang, D.; Guo, B.; Yu, Z. The emergence of social and community intelligence. Computer 2011, 44, 21–28. [Google Scholar] [CrossRef]
- Ratti, C.; Frenchman, D.; Pulselli, R.M.; Williams, S. Mobile landscapes: Using location data from cell phones for urban analysis. Environ. Plan. B Plan. Des. 2006, 33, 727–748. [Google Scholar] [CrossRef]
- Zhu, H.; Zhu, Y.; Li, M.; Ni, L.M. SEER: Metropolitan-Scale traffic perception based on lossy sensory data. In Proceedings of the IEEE International Conference on Computer Communications, Joint Conference of the IEEE Computer and Communications Societies, Rio de Janeiro, Brazil, 19–25 April 2009. [Google Scholar]
- Girardin, F.; Calabrese, F.; Fiore, F.D.; Ratti, C.; Blat, J. Digital footprinting: Uncovering tourists with user-generated content. IEEE Pervasive Comput. 2008, 7, 36–43. [Google Scholar] [CrossRef]
- Li, B.; Zhang, D.; Sun, L.; Chen, C.; Li, S.; Qi, G. Hunting or waiting? Discovering passenger-finding strategies from a large-scale real-world taxi dataset. In Proceedings of the IEEE International Conference on Pervasive Computing and Communications Workshops (PERCOM Workshops), Seattle, WA, USA, 21–25 March 2011; pp. 63–68. [Google Scholar]
- Liu, L.; Andris, C.; Ratti, C. Uncovering cabdrivers’ behavior patterns from their digital traces. Comput. Environ. Urban Syst. 2010, 34, 541–548. [Google Scholar] [CrossRef]
- Liu, L.; Andris, C.; Biderman, A.; Ratti, C. Revealing taxi driver’s mobility intelligence through his trace. IEEE Pervasive Comput. 2009, 160, 1–17. [Google Scholar]
- Yuan, J.; Zheng, Y.; Xie, X.; Sun, G. Driving with knowledge from the physical world. In Proceedings of the 17th ACM SIGKDD International Conference on Knowledge Discovery and Data Mining, San Diego, CA, USA, 21–24 August 2011. [Google Scholar]
- Moreira-Matias, L.; Fernandes, R.; Gama, J.; Ferreira, M.; Mendes-Moreira, J.; Damas, L. An online recommendation 450 system for the taxi stand choice problem (poster). In Proceedings of the IEEE Vehicular Networking Conference (VNC), Seoul, Korea, 14–16 November 2012; pp. 173–180. [Google Scholar]
- Qian, S.; Cao, J.; Fr, L.; Le, R.; Sahel, I.; Li, M. SCRAM: A sharing considered route assignment mechanism for fair taxi route recommendations. In Proceedings of the 21th ACM SIGKDD Conference on Knowledge Discovery and Data Mining, Sydney, NSW, Australia, 10–13 August 2015. [Google Scholar]
- Li, X.; Pan, G.; Wu, Z.; Qi, G.; Li, S.; Zhang, D.; Zhang, W.; Wang, Z. Prediction of urban human mobility using large-scale taxi traces and its applications. Front. Comput. Sci. 2012, 6, 111–121. [Google Scholar]
- Li, X.; Lv, Z.; Wang, W.; Zhang, B.; Hu, J.; Yin, L.; Feng, S. WebVRGIS based traffic analysis and visualization system. Adv. Eng. Softw. 2016, 93, 1–8. [Google Scholar] [CrossRef]
- Lv, Z.; Li, X.; Zhang, B.; Wang, W.; Zhu, Y.; Hu, J.; Feng, S. Managing big city information based on WebVRGIS. IEEE Access 2016, 4, 407–415. [Google Scholar] [CrossRef]
- Lv, Z.; Li, X.; Hu, J.; Yin, L.; Zhang, B.; Feng, S. Virtual geographic environment based coach passenger flow forecasting. In Proceedings of the 2015 IEEE International Conference on Computational Intelligence and Virtual Environments for Measurement Systems and Applications (CIVEMSA), Shenzhen, China, 12–14 June 2015. [Google Scholar]
- Ge, Y.; Xiong, H.; Tuzhilin, A.; Xiao, K.; Gruteser, M.; Pazzani, M. An energy-efficient mobile recommender system. In Proceedings of the 16th ACM SIGKDD International Conference on Knowledge Discovery and Data Mining, Washington, DC, USA, 25–28 July 2010. [Google Scholar]
- Gan, J.; An, B.; Wang, H.; Sun, X.; Shi, Z. Optimal pricing for improving efficiency of taxi systems. In Proceedings of the 23th International Joint Conference on Artificial Intelligence, Beijing, China, 3–9 August 2013. [Google Scholar]
- Song, L.J.; Zhang, D.X.; Chen, J.C.; Ju, A.N.; Yin, S.U. Analysis of taxi operation characteristics with traffic control. J. Transp. Syst. Eng. Inf. Technol. 2008, 8, 127–131. [Google Scholar] [CrossRef]
- Wong, K.I.; Wong, S.C.; Bell, M.G.H.; Yang, H. Modeling the bilateral micro-searching behavior for urban taxi services using the absorbing markov chain approach. J. Adv. Transp. 2005, 39, 81–104. [Google Scholar] [CrossRef]
- Moreira-Matias, L.; Gama, J.; Mendes-Moreira, J. Concept neurons–handling drift issues for real-time industrial data mining. In Proceedings of the Joint European Conference on Machine Learning and Knowledge Discovery in Databases, Riva del Garda, Italy, 19–23 September 2016; pp. 96–111. [Google Scholar]
- Khiari, J.; Moreira-Matias, L.; Cerqueira, V.; Cats, O. Automated setting of Bus schedule coverage using unsupervised machine learning. In Pacific-Asia Conference on Knowledge Discovery and Data Mining; Bailey, J., Ed.; Springer: New York, NY, USA, 2016; pp. 552–564. [Google Scholar]
- Dijkstra, E.W. A note on two problems in connexion with graphs. Numer. Math. 1959, 1, 269–271. [Google Scholar] [CrossRef]
- Santani, D.; Balan, R.K.; Woodard, C.J. Spatio-temporal efficiency in a taxi dispatch system. In Research Collection School of Information Systems; Singapore Management University: Singapore, 2008; p. 9. [Google Scholar]
- Xie, Z.; Yan, J. Kernel density estimation of traffic accidents in a network space. Comput. Environ. Urban Syst. 2008, 32, 396–406. [Google Scholar] [CrossRef]
- Rodgers, A.R.; Kie, J.G.; Wright, D.; Beyer, H.L.; Carr, A.P. HRT: Home Range Tools for ArcGIS. Version 2.0; Ontario Ministry of Natural Resources and Forestry, Centre for Northern Forest Ecosystem Research: Thunder Bay, ON, Canada, 2015.
- Ester, M.; Kriegel, H.P.; Sander, J.; Xu, X. A Density-Based Algorithm for Discovering Clusters in Large Spatial Databases with Noise. In Proceedings of the Second International Conference Knowledge Discovery and Data Mining (KDD’96), Portland, OR, USA, 2–4 August 1996; pp. 226–231. [Google Scholar]
- Dixon, P.M. Ripley’s K Function. In Encyclopedia of Environmetrics; El-Shaarawi, A.H., Piegorsch, W.W., Eds.; John Wiley & Sons, Ltd.: New York, NY, USA, 2002; pp. 1796–1803. [Google Scholar]
- Yamada, I.; Thill, J.C. Comparison of planar and network k-functions in traffic accident analysis. J. Transp. Geogr. 2004, 12, 149–158. [Google Scholar] [CrossRef]
Figure 1.
Selection of the research object.
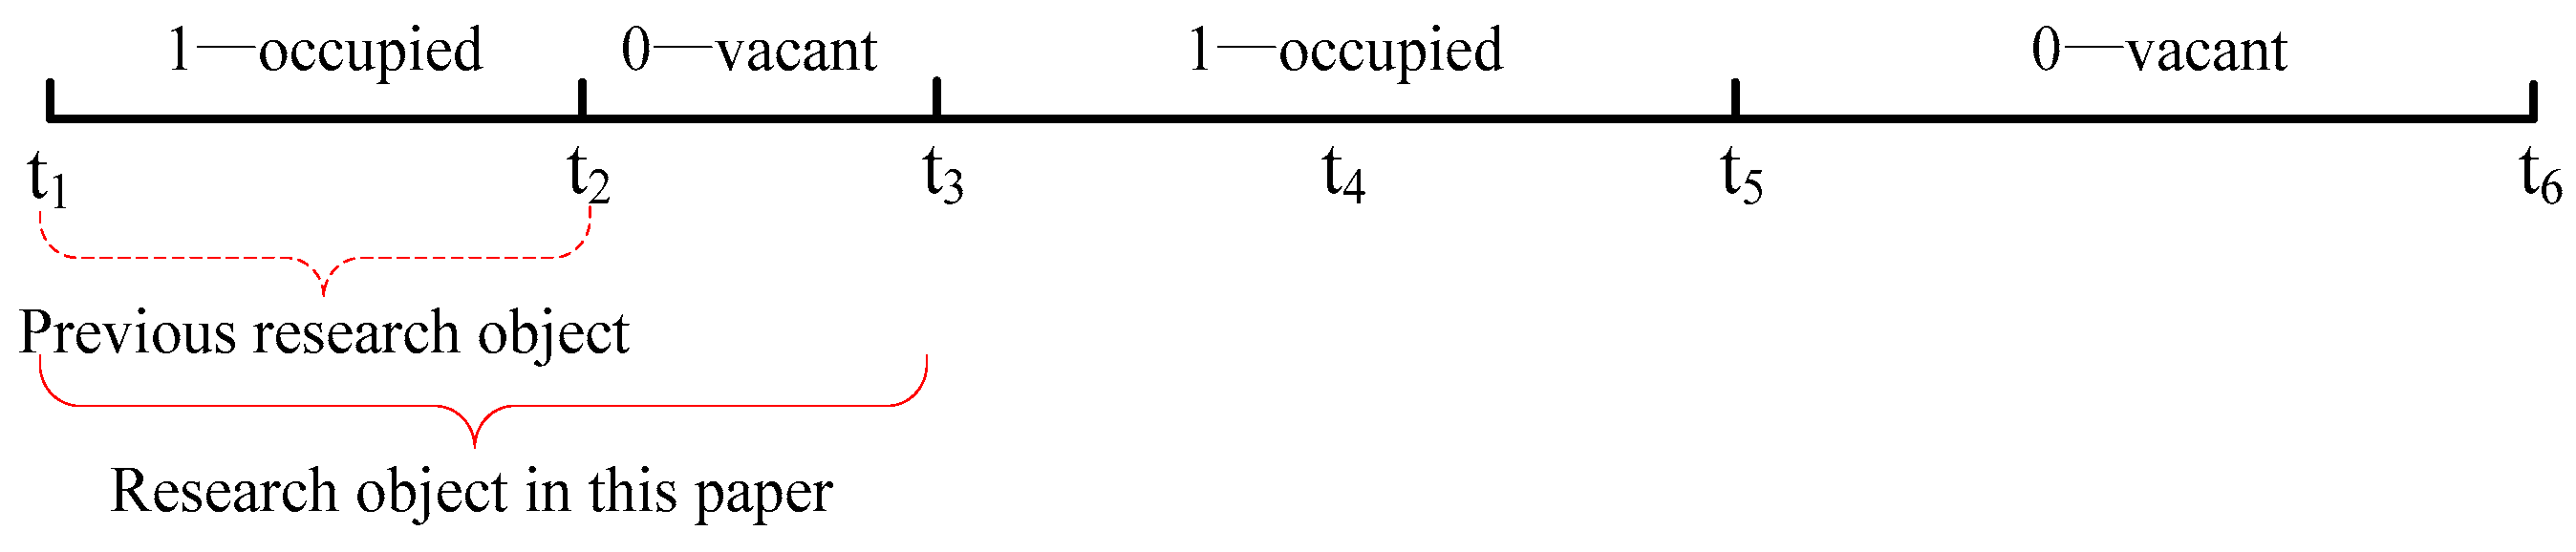
Figure 2.
Average efficiency of taxi drivers (a) on weekdays (5–9 August 2013) and (b) on weekends (4–10 August 2013).
Figure 2.
Average efficiency of taxi drivers (a) on weekdays (5–9 August 2013) and (b) on weekends (4–10 August 2013).

Figure 3.
Time distribution of taxi average efficiency of top drivers.

Figure 4.
The spatial distribution of top driver pick-up points on (a) weekdays and on (b) weekends.
Figure 4.
The spatial distribution of top driver pick-up points on (a) weekdays and on (b) weekends.

Figure 5.
Weekdays operation center distribution. (a) is the spatial distribution of the top eight driver clusters; (b) is the spatial distribution of ordinary driver’s clusters.
Figure 5.
Weekdays operation center distribution. (a) is the spatial distribution of the top eight driver clusters; (b) is the spatial distribution of ordinary driver’s clusters.
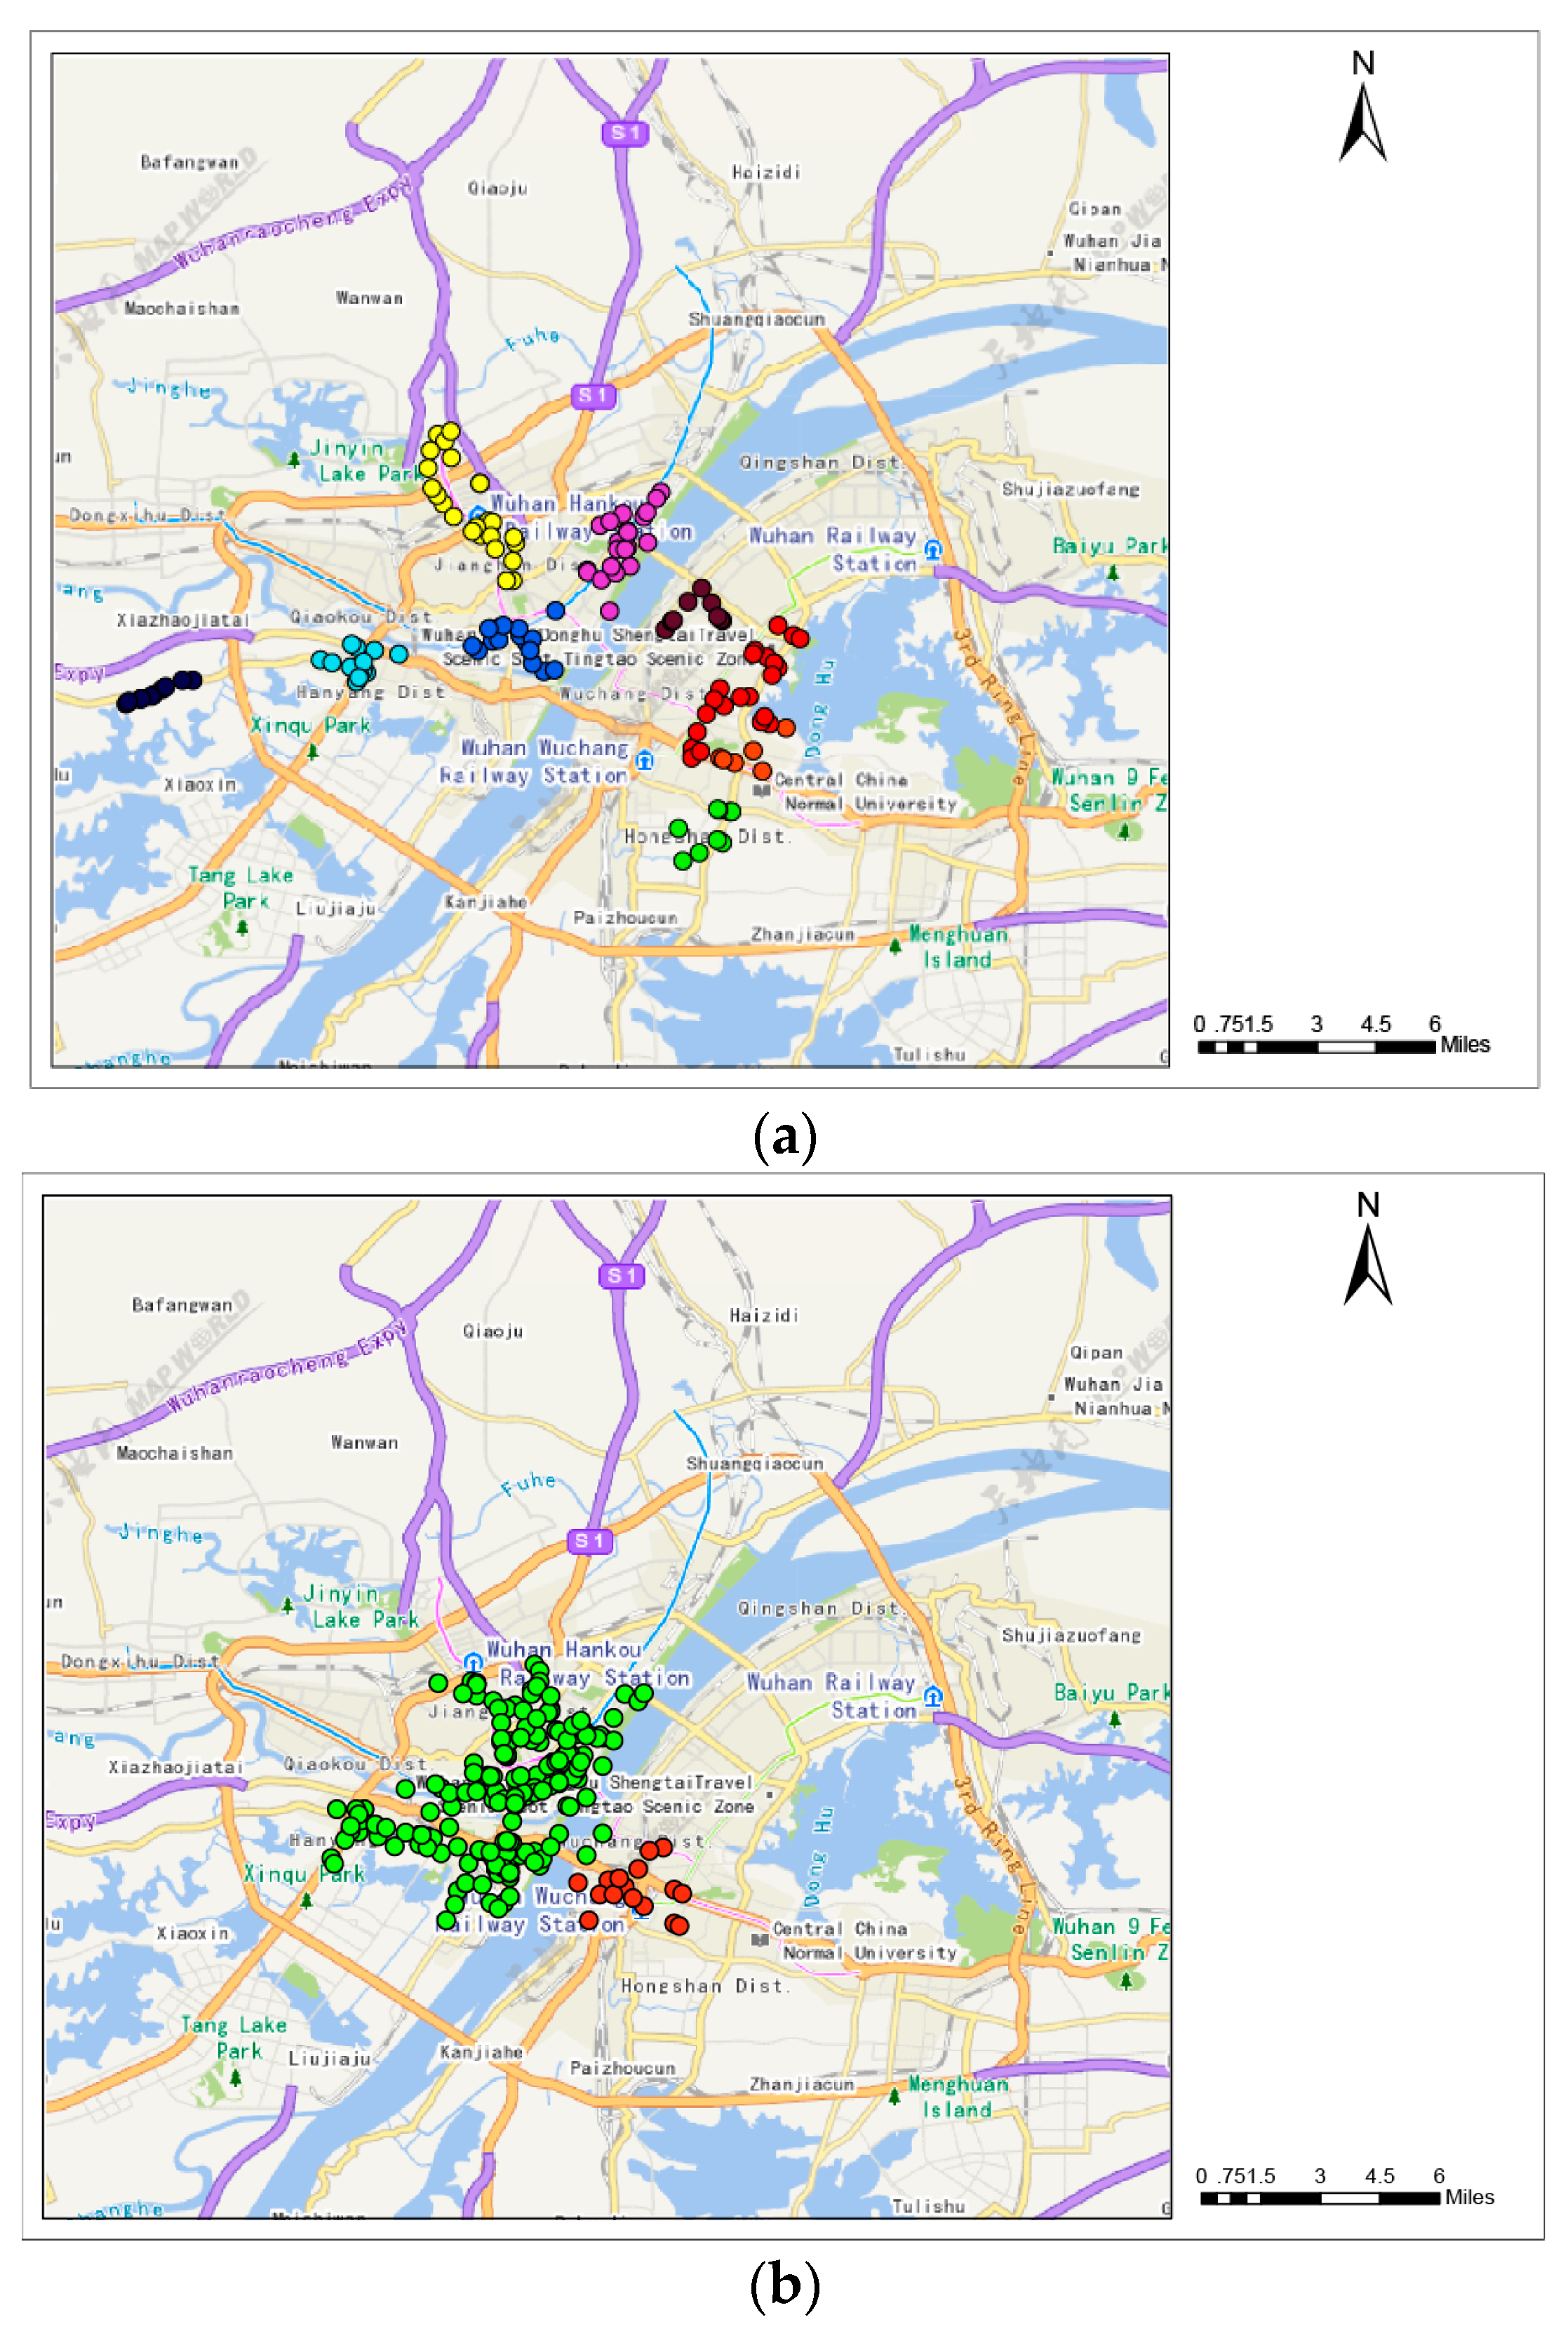
Figure 6.
Average efficiency of top and ordinary drivers in weekdays.
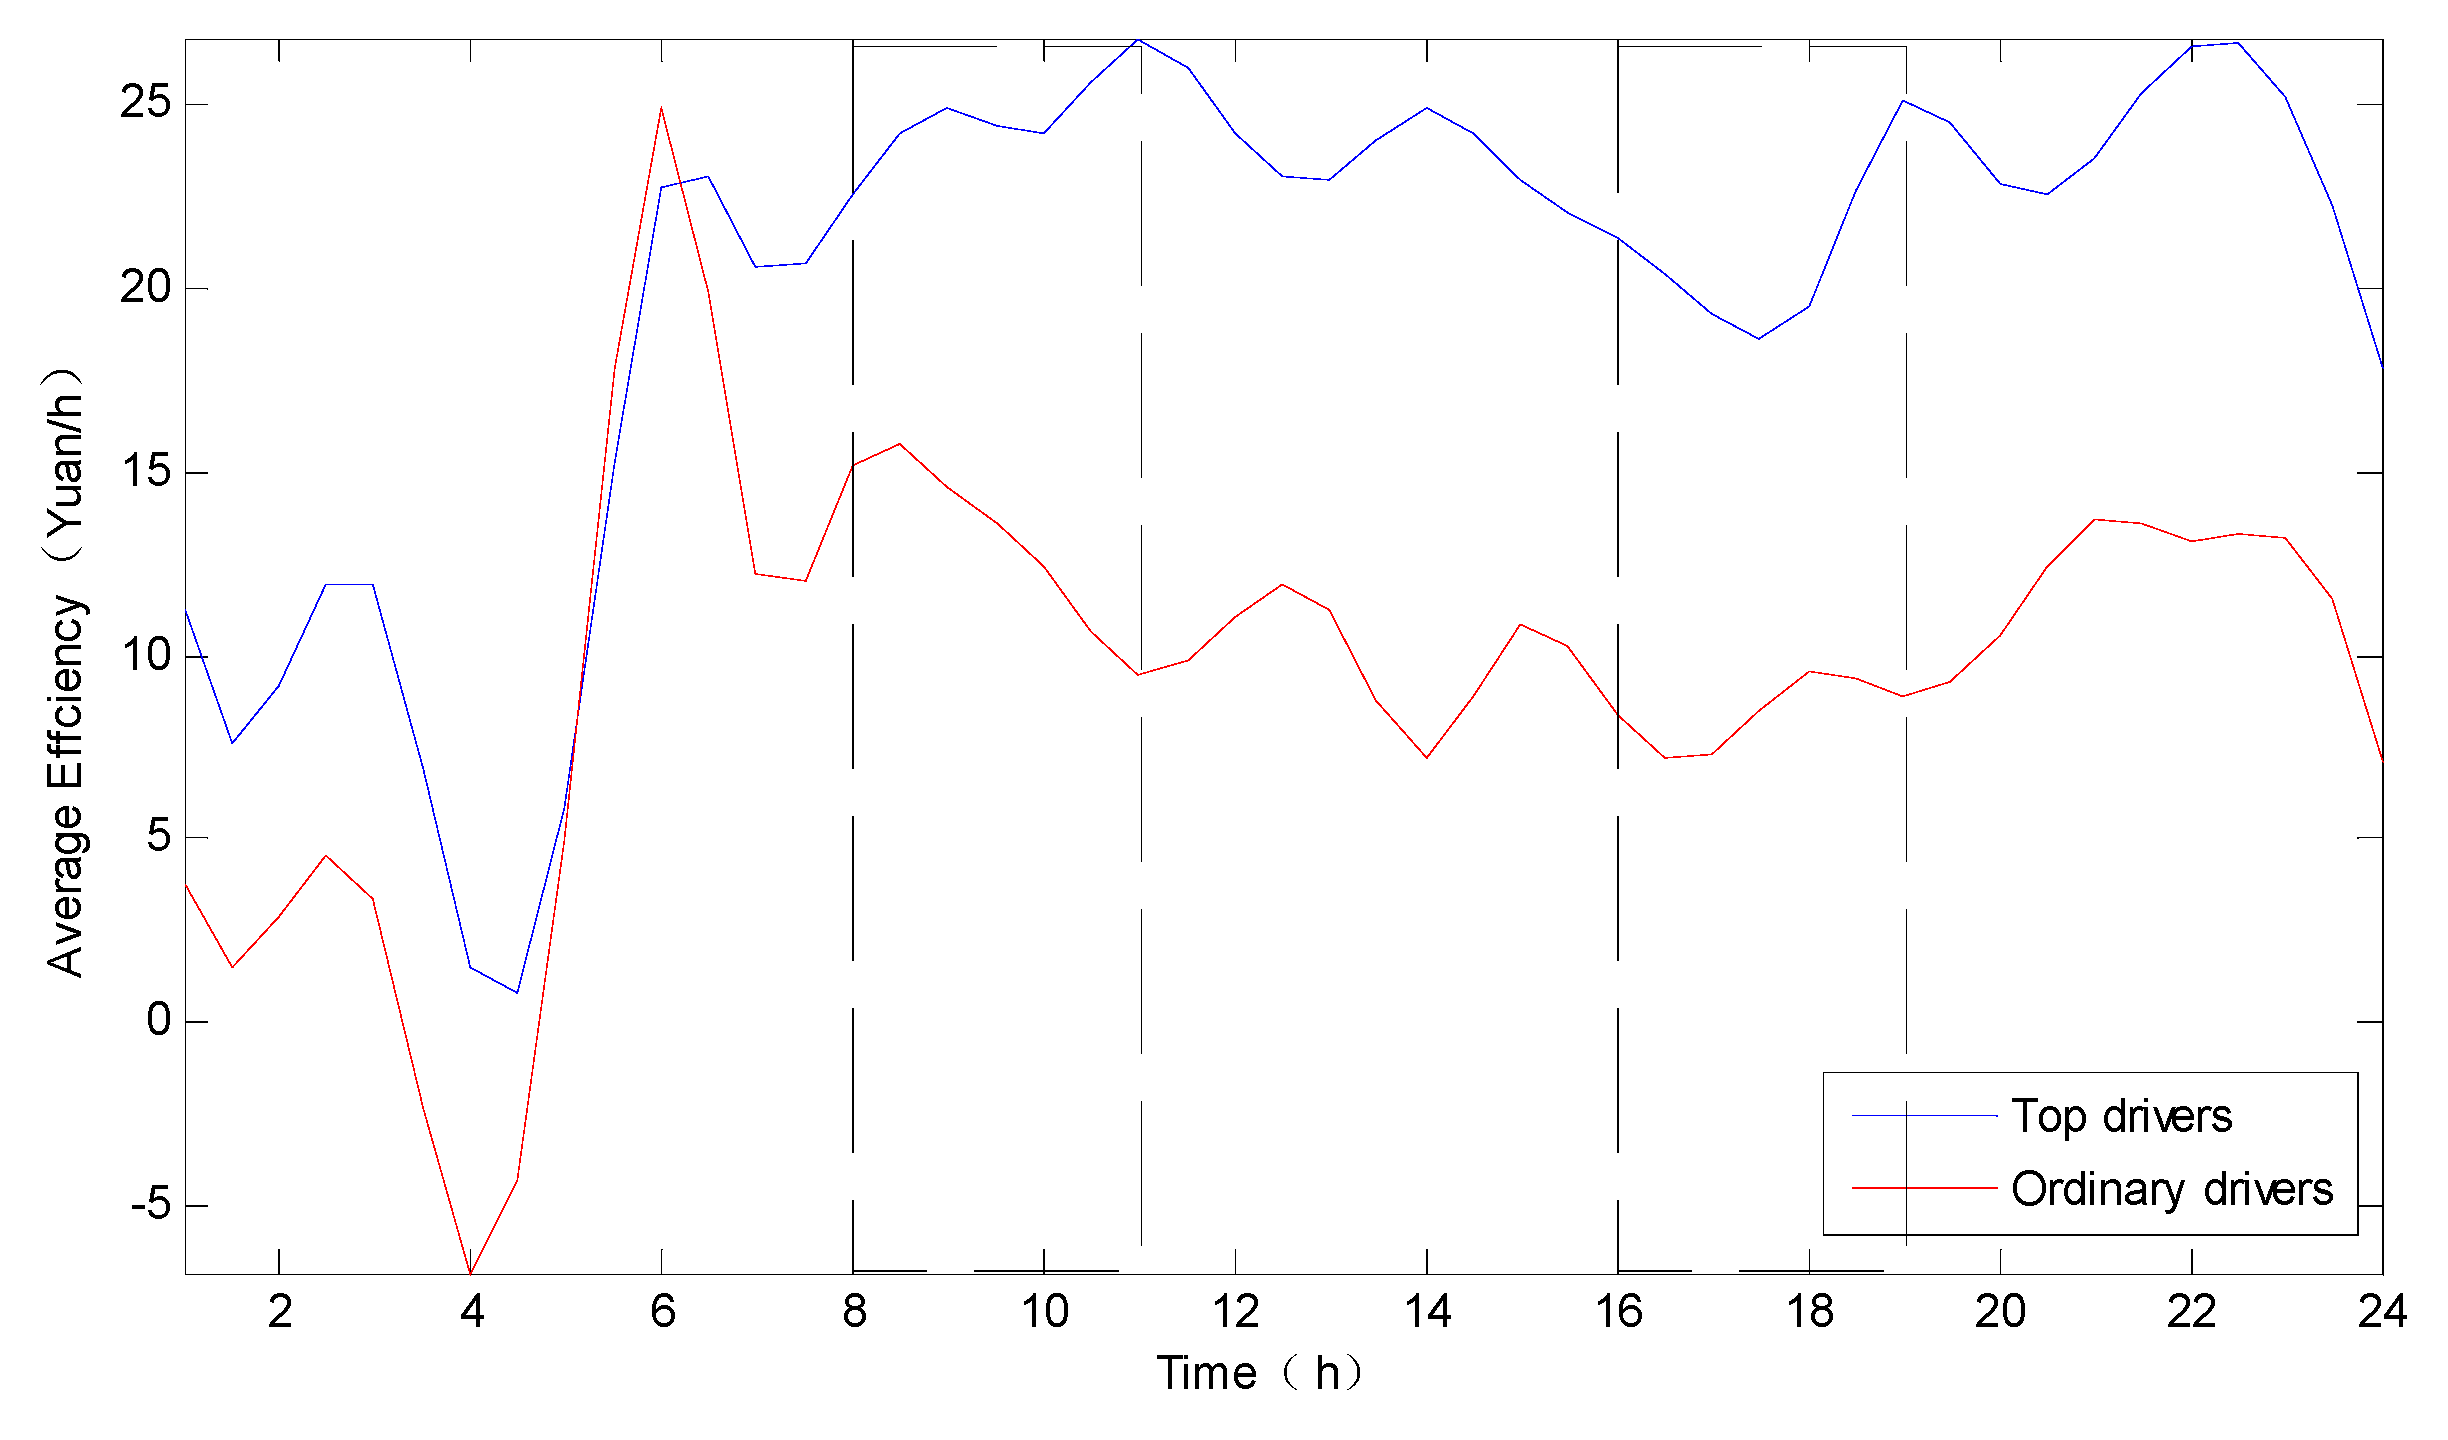
Figure 7.
Spatial distribution of pick-up points of top and ordinary drivers for (a) 7:00~9:00; (b) 9:00~11:00; (c) 17:00~19:00; (d) 19:00~21:00.
Figure 7.
Spatial distribution of pick-up points of top and ordinary drivers for (a) 7:00~9:00; (b) 9:00~11:00; (c) 17:00~19:00; (d) 19:00~21:00.

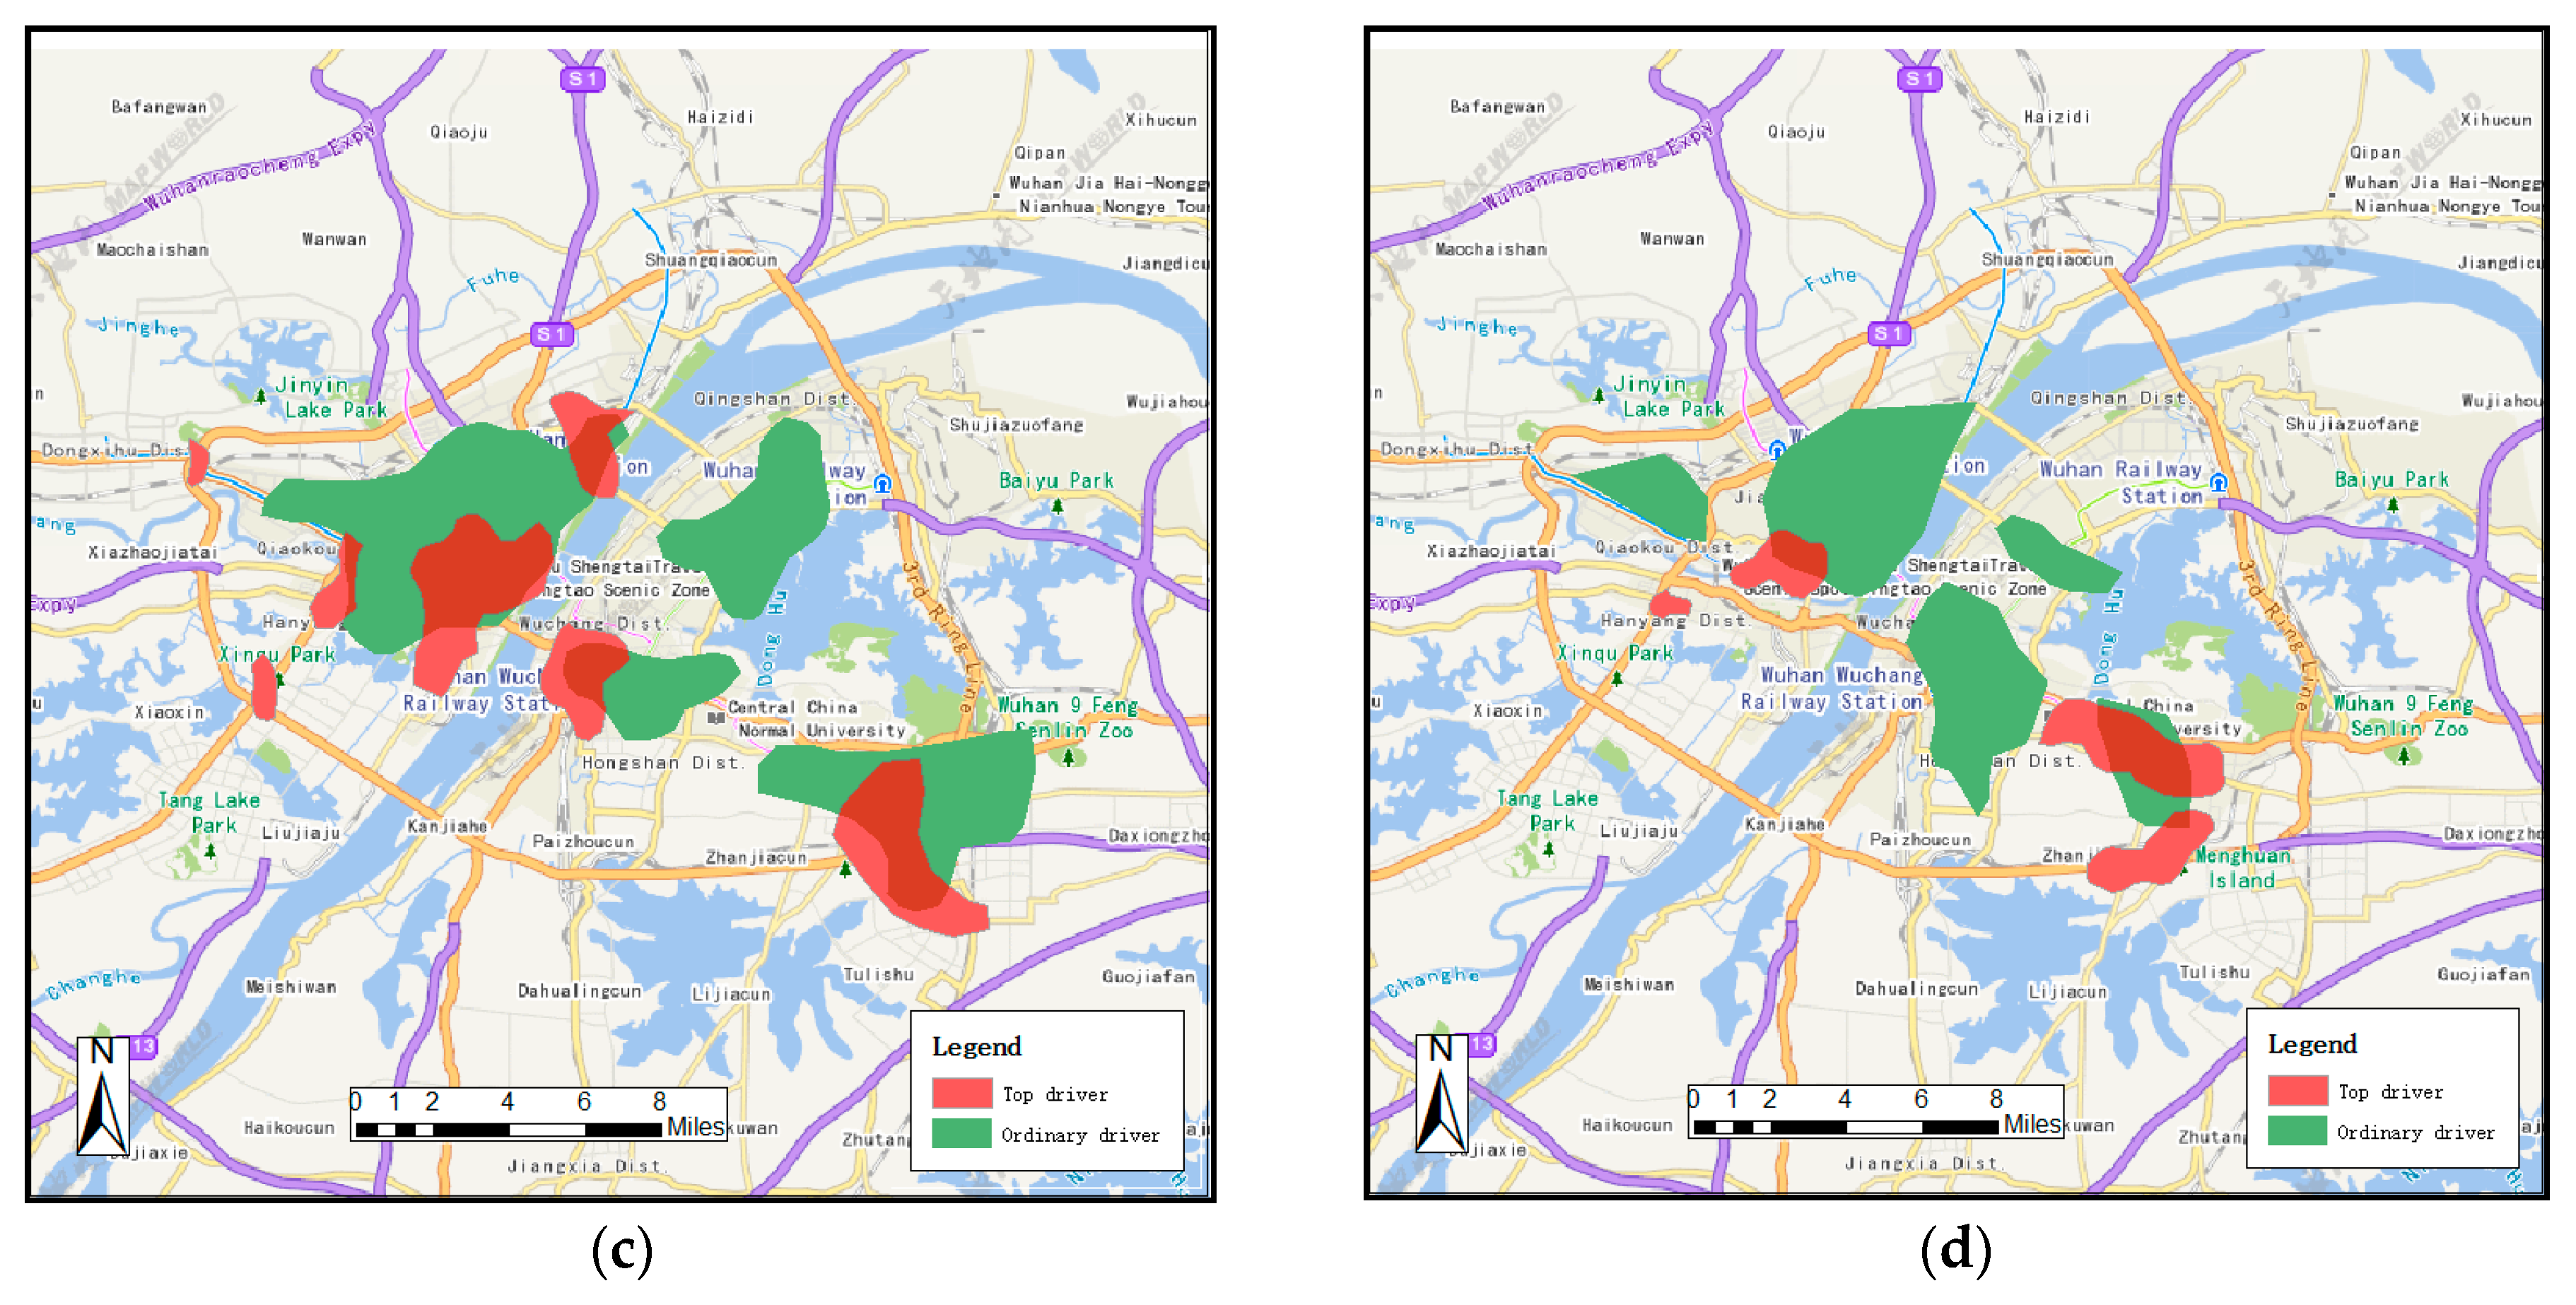
Figure 8.
Ripley’s K(t) of pick-up points of top and ordinary drivers for (a) 7:00~9:00; (b) 9:00~11:00; (c) 17:00~19:00; (d) 19:00~21:00.
Figure 8.
Ripley’s K(t) of pick-up points of top and ordinary drivers for (a) 7:00~9:00; (b) 9:00~11:00; (c) 17:00~19:00; (d) 19:00~21:00.
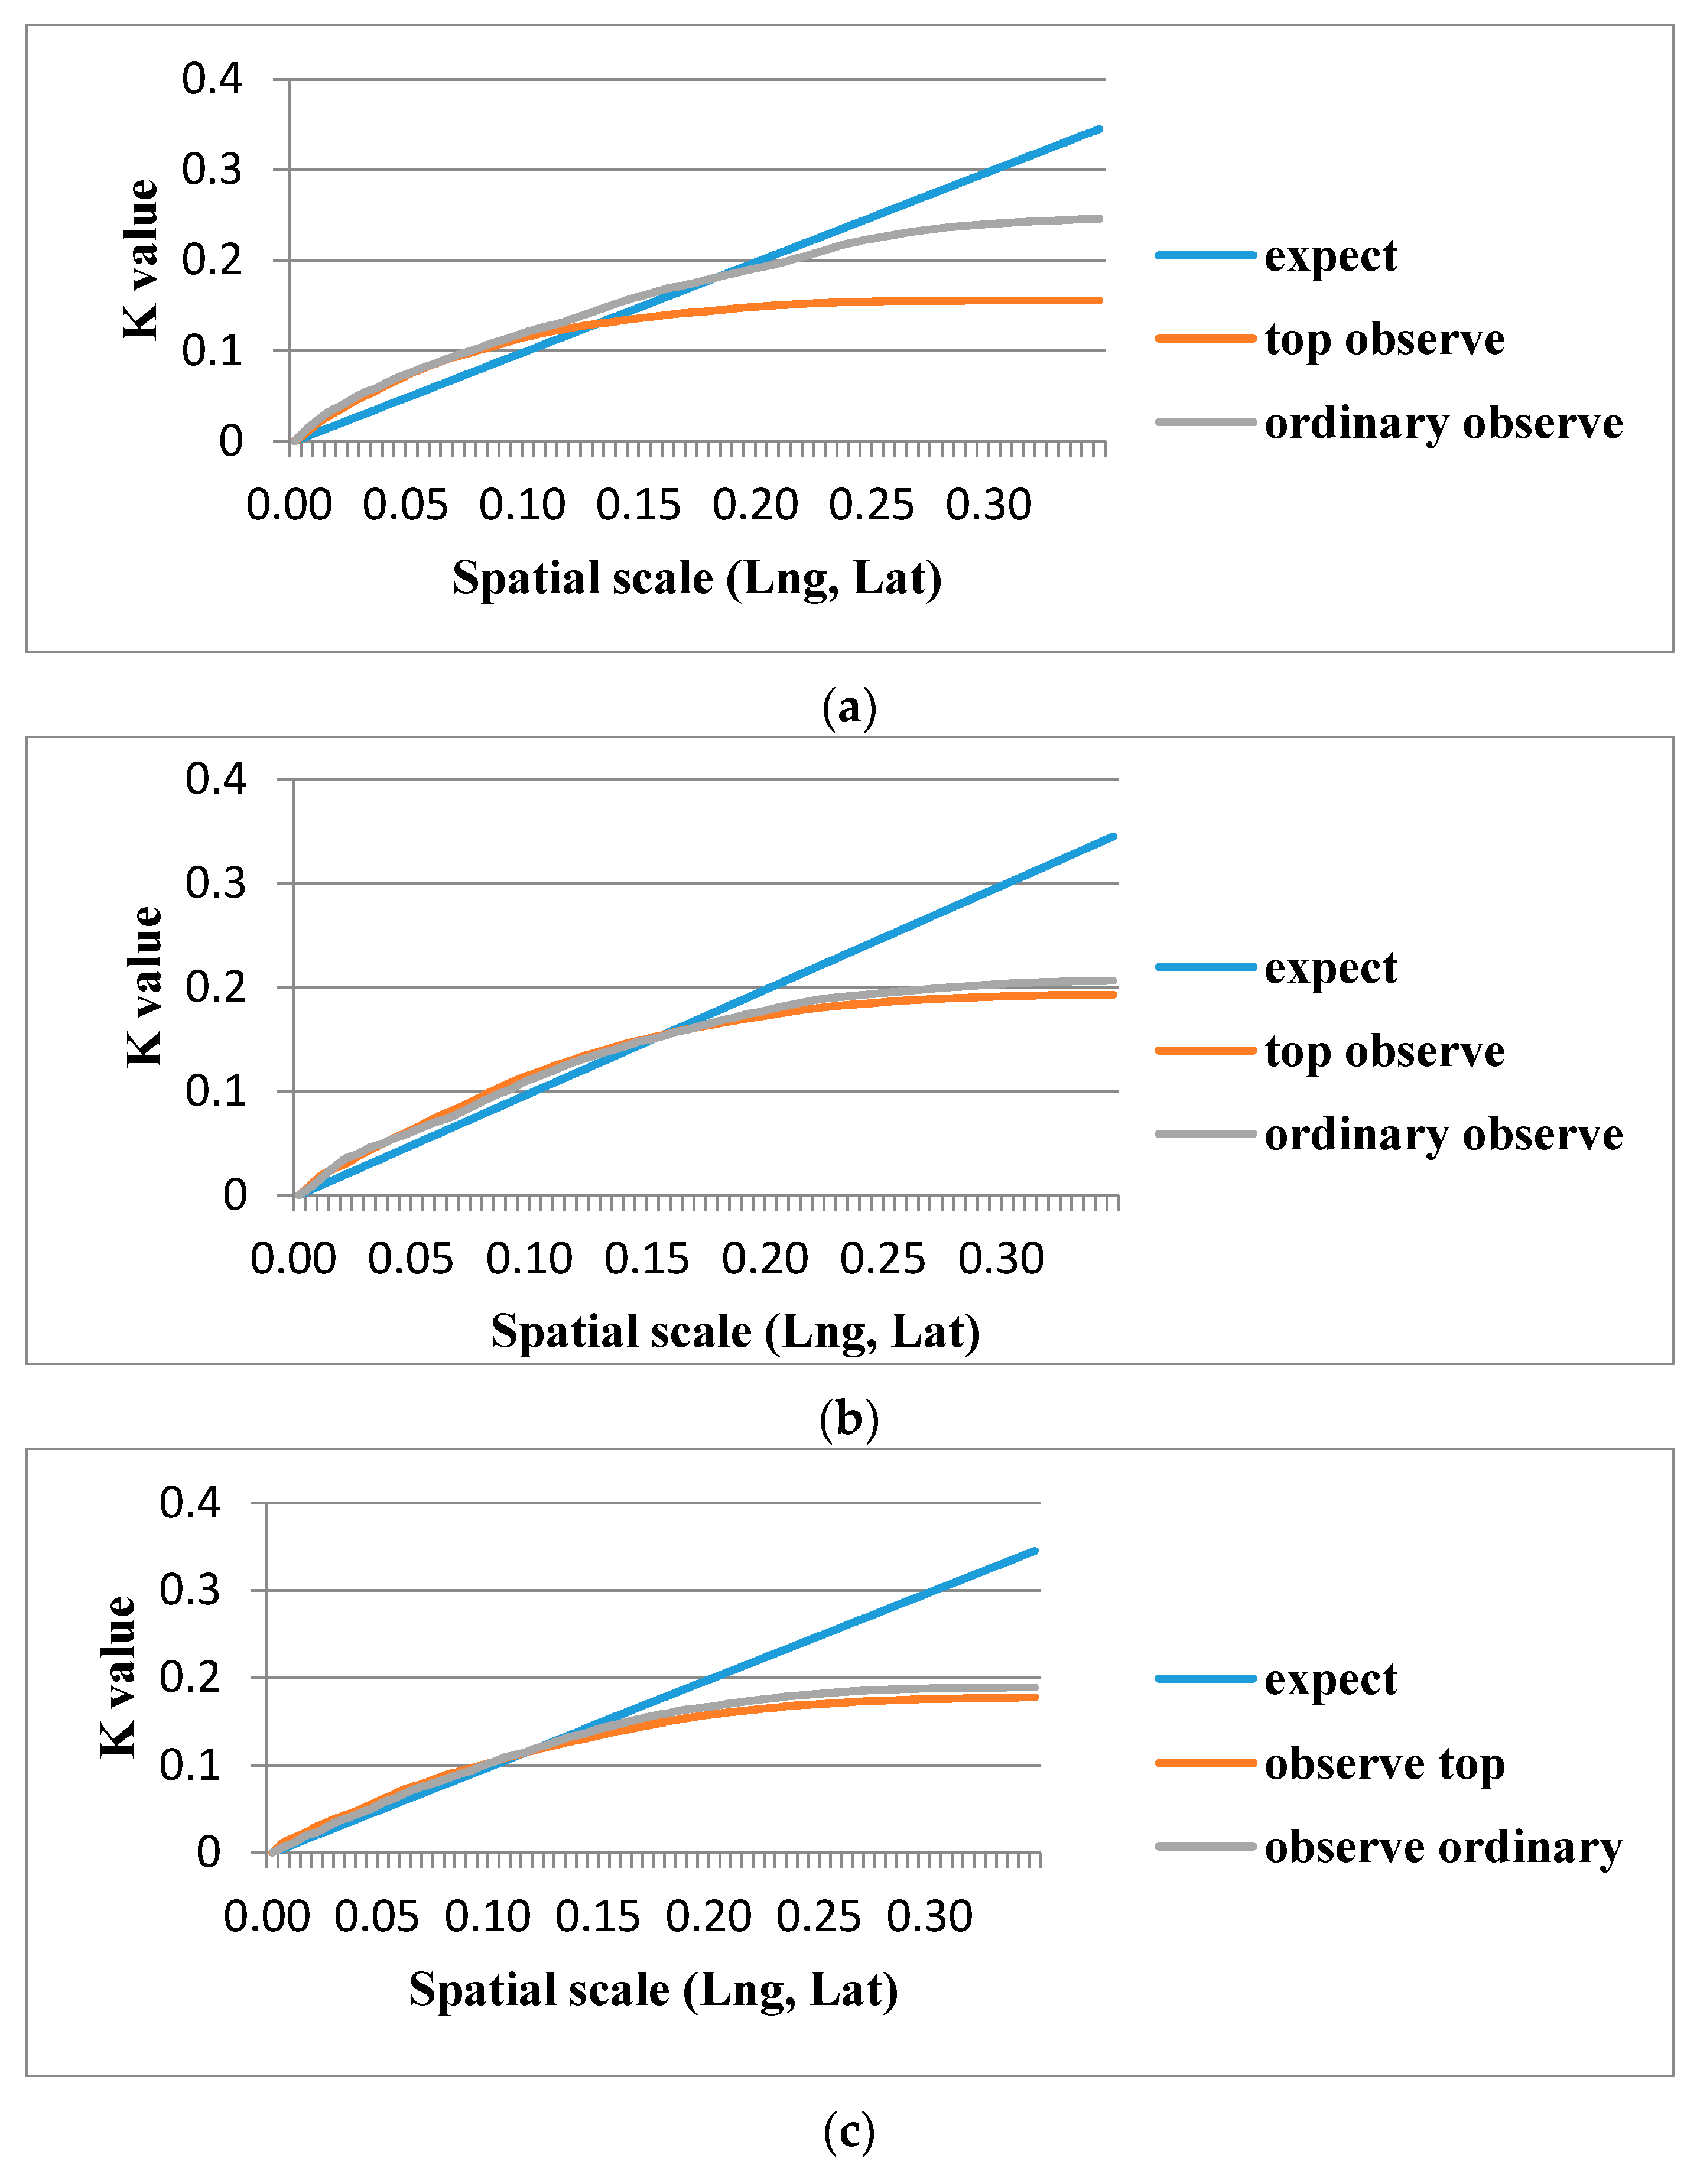

Figure 9.
Comparison of different taxi ranking approaches. (a) is average vacant travel distance of different approaches; (b) is average ratio of vacant travel time of different approaches.
Figure 9.
Comparison of different taxi ranking approaches. (a) is average vacant travel distance of different approaches; (b) is average ratio of vacant travel time of different approaches.
© 2017 by the authors. Licensee MDPI, Basel, Switzerland. This article is an open access article distributed under the terms and conditions of the Creative Commons Attribution (CC BY) license (http://creativecommons.org/licenses/by/4.0/).
Share and Cite
MDPI and ACS Style
Tang, L.; Sun, F.; Kan, Z.; Ren, C.; Cheng, L. Uncovering Distribution Patterns of High Performance Taxis from Big Trace Data. ISPRS Int. J. Geo-Inf. 2017, 6, 134. https://0-doi-org.brum.beds.ac.uk/10.3390/ijgi6050134
AMA Style
Tang L, Sun F, Kan Z, Ren C, Cheng L. Uncovering Distribution Patterns of High Performance Taxis from Big Trace Data. ISPRS International Journal of Geo-Information. 2017; 6(5):134. https://0-doi-org.brum.beds.ac.uk/10.3390/ijgi6050134
Chicago/Turabian StyleTang, Luliang, Fei Sun, Zihan Kan, Chang Ren, and Luling Cheng. 2017. "Uncovering Distribution Patterns of High Performance Taxis from Big Trace Data" ISPRS International Journal of Geo-Information 6, no. 5: 134. https://0-doi-org.brum.beds.ac.uk/10.3390/ijgi6050134
Note that from the first issue of 2016, this journal uses article numbers instead of page numbers. See further details here.