Article

Exploring the Relationship between the Arid Valley Boundary’s Displacement and Climate Change during 1999–2013 in the Upper Reaches of the Min River, China

School of Environment and Resource, Southwest University of Science and Technology, Mianyang 621010, Sichuan, China
*
Author to whom correspondence should be addressed.
ISPRS Int. J. Geo-Inf. 2017, 6(5), 146; https://0-doi-org.brum.beds.ac.uk/10.3390/ijgi6050146
Submission received: 2 March 2017 / Revised: 17 April 2017 / Accepted: 24 April 2017 / Published: 6 May 2017
(This article belongs to the Special Issue Earth/Community Observations for Climate Change Research)

Abstract

:
The arid valley is a unique type of ecological fragile landscape in the Hengduan Mountain Area, China. The boundary of the arid valley is one of the response indicators to mountainous climate change. Based on the meteorological data from 1999 to 2013 and the SPOT remote sensing images in 1999 and 2013 this study explored the response characteristics of the arid valley boundary to regional climate change in the upper reaches of the Min River in the Hengduan Mountains. The results are as follows: (1) During 1999–2013, the temperature, precipitation, and evaporation increased, and the sunshine duration and relative humidity showed decreasing trends at the rates of 0.008 °C/a, 2.25 mm/a, 5.51 mm/a, −8.72 h/a, and −0.19%/a, respectively. Meanwhile, the climate showed the warm-dry tendency in the southern region and the warm-humid tendency in the central and northern areas. (2) On the whole, the arid valley boundary mainly distributed between 1601–3200 m and moved downward to 2428 m at the speed of −0.76 ± 0.26 m/a along with global warming. The descent speeds in different regions showed the same decreasing order as the regional distributions of precipitation and sunshine duration. (3) The arid valley boundary’s displacement in the whole basin had significant negative correlations with current climate change (p < 0.05), as well as with variations of moisture factors. Additionally, with the enhancements of the drought degree and humidity tendency, the variations of temperature, evaporation, and relative humidity, respectively, became the main factors that had significant correlations with the arid valley boundary’s displacement. Therefore, climate change during 1999–2013 shows beneficial effects on the improvement of the arid valley habitat in the upper reaches of the Min River. The study provides a new method and gives basic data for research on climate change.

1. Introduction

The arid valley is a special geographical and ecological phenomenon in the humid and sub-humid region of China, located at the Hengduan Mountain Area from the Tibetan Plateau to the Sichuan Basin. From the perspective of natural geography, the arid valley is the lower part of the valley, where xerophyte grows and humid vegetation surrounds, associated with certain climate conditions. From the standpoint of socio-economic analysis, the arid valley contains areas with water shortages on farming and conditions having an insufficiency of irrigation. Hence, the arid valley covers three aspects of climate, vegetation, and socio-economy [1,2]. At present, there are no common standards for the accurate definition of the arid valley. In earlier studies, the annual dryness between 1.50 and 3.99 were used, defined as the ratio of annual evaporation power and annual precipitation [
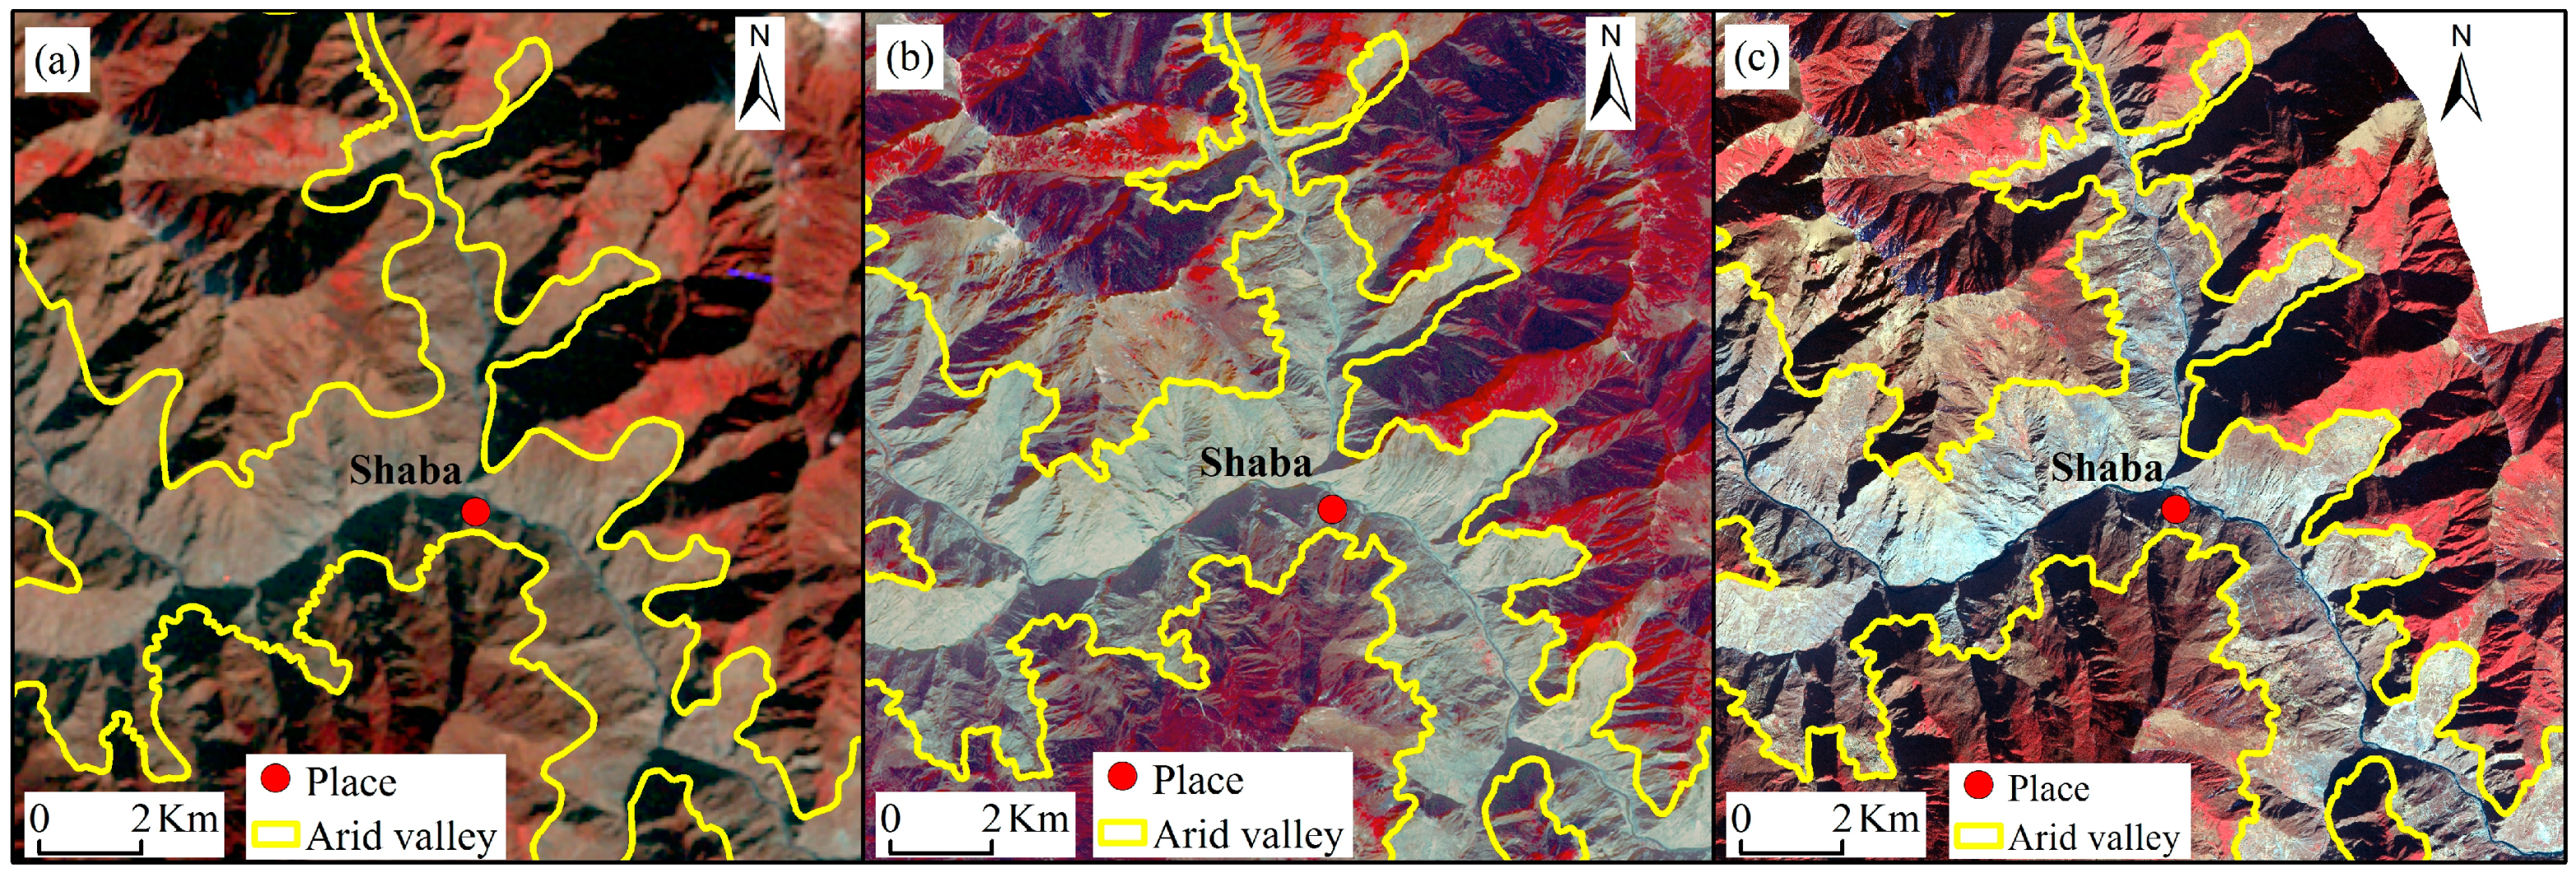
2]. With the development of remote sensing and geographic information technology, the arid valley was defined based on the grey white colour shown in TM (Thematic Mapper) images in standard false colour [3], combined with the classification of vegetation and bare land, the slopes above 25 degrees [4], annual rainfall of less than 400 mm, and an evaporation coefficient above 2 [5]. The boundary of the arid valley is located at the ecotone between local drought-tolerant vegetation and mixed evergreen and deciduous, coniferous, and broad leaved mixed forests. As a unique natural geographical line in this particular ecosystem, the arid valley boundary’s structure is characterized with high heterogeneity and strong variability, and the responses of the arid valley boundary to changes in environmental conditions are more sensitive than the adjacent ecosystems [6]. The fluctuation of the arid valley boundary has to do with the specific performance of the mountain vegetation system to regional environmental changes. Related research can provide a new method for the exploration of regional climate and environment change. Under the background of global warming, the regional response of the mountainous environment to climate change has become one of the hottest scientific issues in current academic research [6,7,8]. It mainly relates to timberline [9,10,11,12] and snowline [13,14,15], etc., but lacks dynamic analysis on the boundary of the arid valley.
The natural factors and human factors have jointly promoted the formation and development of the arid valley. The former plays a controlling role and human disturbance is only reflected at the superimposed effect in local areas [16,17,18,19,20]. First, the alternative arrangement of the deep valley and the high mountain has formed the region’s landscape pattern due to the strong down-cutting of rivers. The atmospheric circulation, foehn effect, and mountain-valley breeze are three important natural drives in the formation of the arid valley. Owing to these influences, the climate in the arid valley is dry and hot in the lower part, and moist and cool in the upper. The regional differentiations of the arid valley and the differences of its drought degree and heat conditions are mainly controlled by the topographical contour, altitude, and relative height. Second, with sufficient heat and light resources, the arid valley has become the core area of regional social and economic activities. Anthropogenic disturbances, such as urban development, village expansion, slope cultivation, cattle grazing, and deforestation, have intensified the expansion of the arid valley, while ecological construction, like the Natural Forest Protection Project and the Green for Grain Project, have promoted the improvement of the local drought landscape. Therefore, climate change and human activities are the main reasons for dynamic changes and regional differentiations at the arid valley boundary.
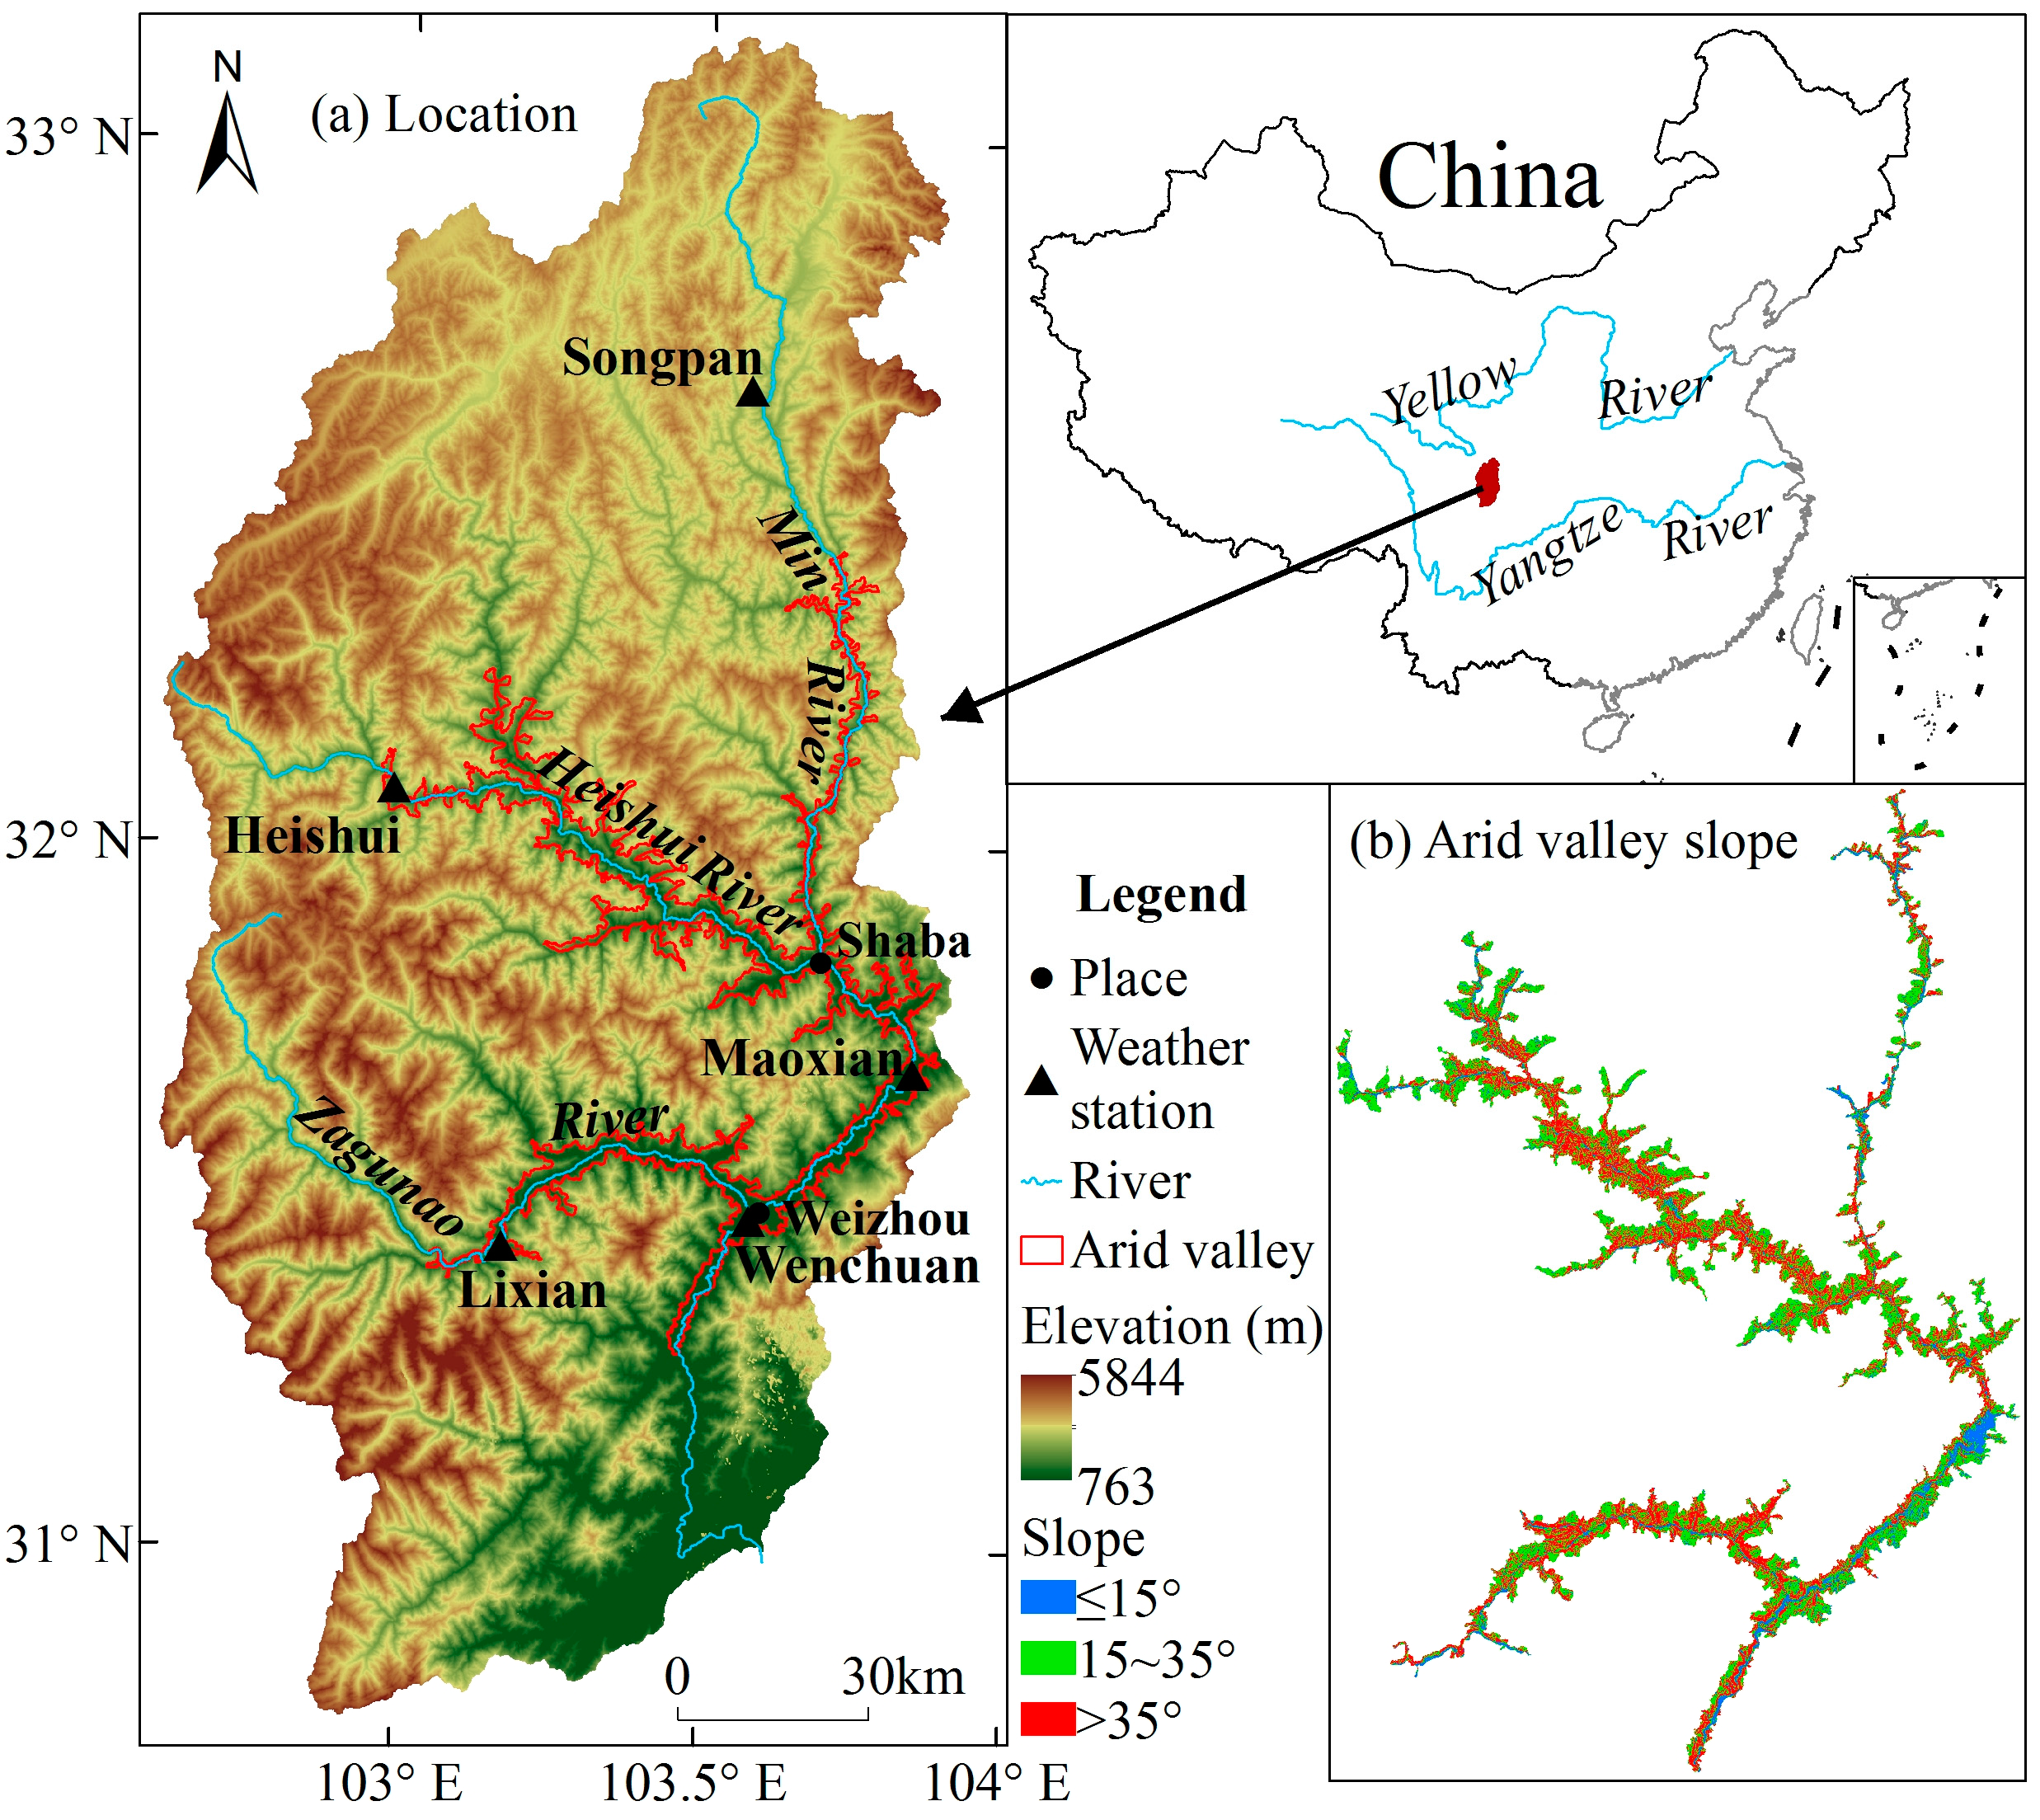
The arid valley in the upper reaches of the Min River is a typical V-shaped dry-temperate valley in the Hengduan Mountains. The upland-valley is the main landform type in this region. And the relative height of the ridge and valley is between 1500–3000 m (Figure 1a). In the valley bottom, although the flat land has the disadvantages of small area, scattered distribution, and thin soil layer, the settlements have been concentrated by the rich heat and convenient irrigation. Between the valley bottom and the valley shoulder, the slope is steep (above 35 degrees) because of the strong cutting of the rivers (Figure 1b). Due to the gentle terrain and the relative balance between water and heat, the arid valley shoulder near the arid valley boundary has become another ideal location for mountain settlements [2,21]. The foehn effect in the arid valley of the upper reaches of the Min River is significant and the climate has large fluctuations in the wet and dry seasons. Owing to uneven rainfall and strong evaporation, the droughts of climate and soil are serious and the limiting effect of precipitation is very obvious [16]. Adapting to the drought environment, the arid shrub that is distributed at 1300–2200 m is the main vegetation type and has the appearances of the xeromorphic community, such as small leaf, hairy, spiny, succulent leaves and deep roots [22,23,24,25]. Due to the simple and weak stability of the vegetation community structure, the regional ecological environment is highly vulnerable and the arid valley boundary is very unstable [26,27]. During 1974–2000, the highest altitude of the arid valley boundary in the upper reaches of the Min River ascended 53 m at the speed of 2 m/a [3]. Meanwhile, some of the desert species, such as Convolvulus tragalanthoides and Nitraria tangutorum, have expanded and become the local dominant species in some areas, indicating an increase in the regional drought degree and the degradation of the ecological environment [28]. On one hand, due to an increasing population, these changes are closely related to growing deforestation and slope cultivation; and on the other hand, climate warming also has a certain impact [16,29,30,31,32]. However, less data is presented to support these conclusions, and the quantitative study on the displacement process of the arid valley boundary under climate change is rarely involved, especially in regard to the analysis in the recent period.
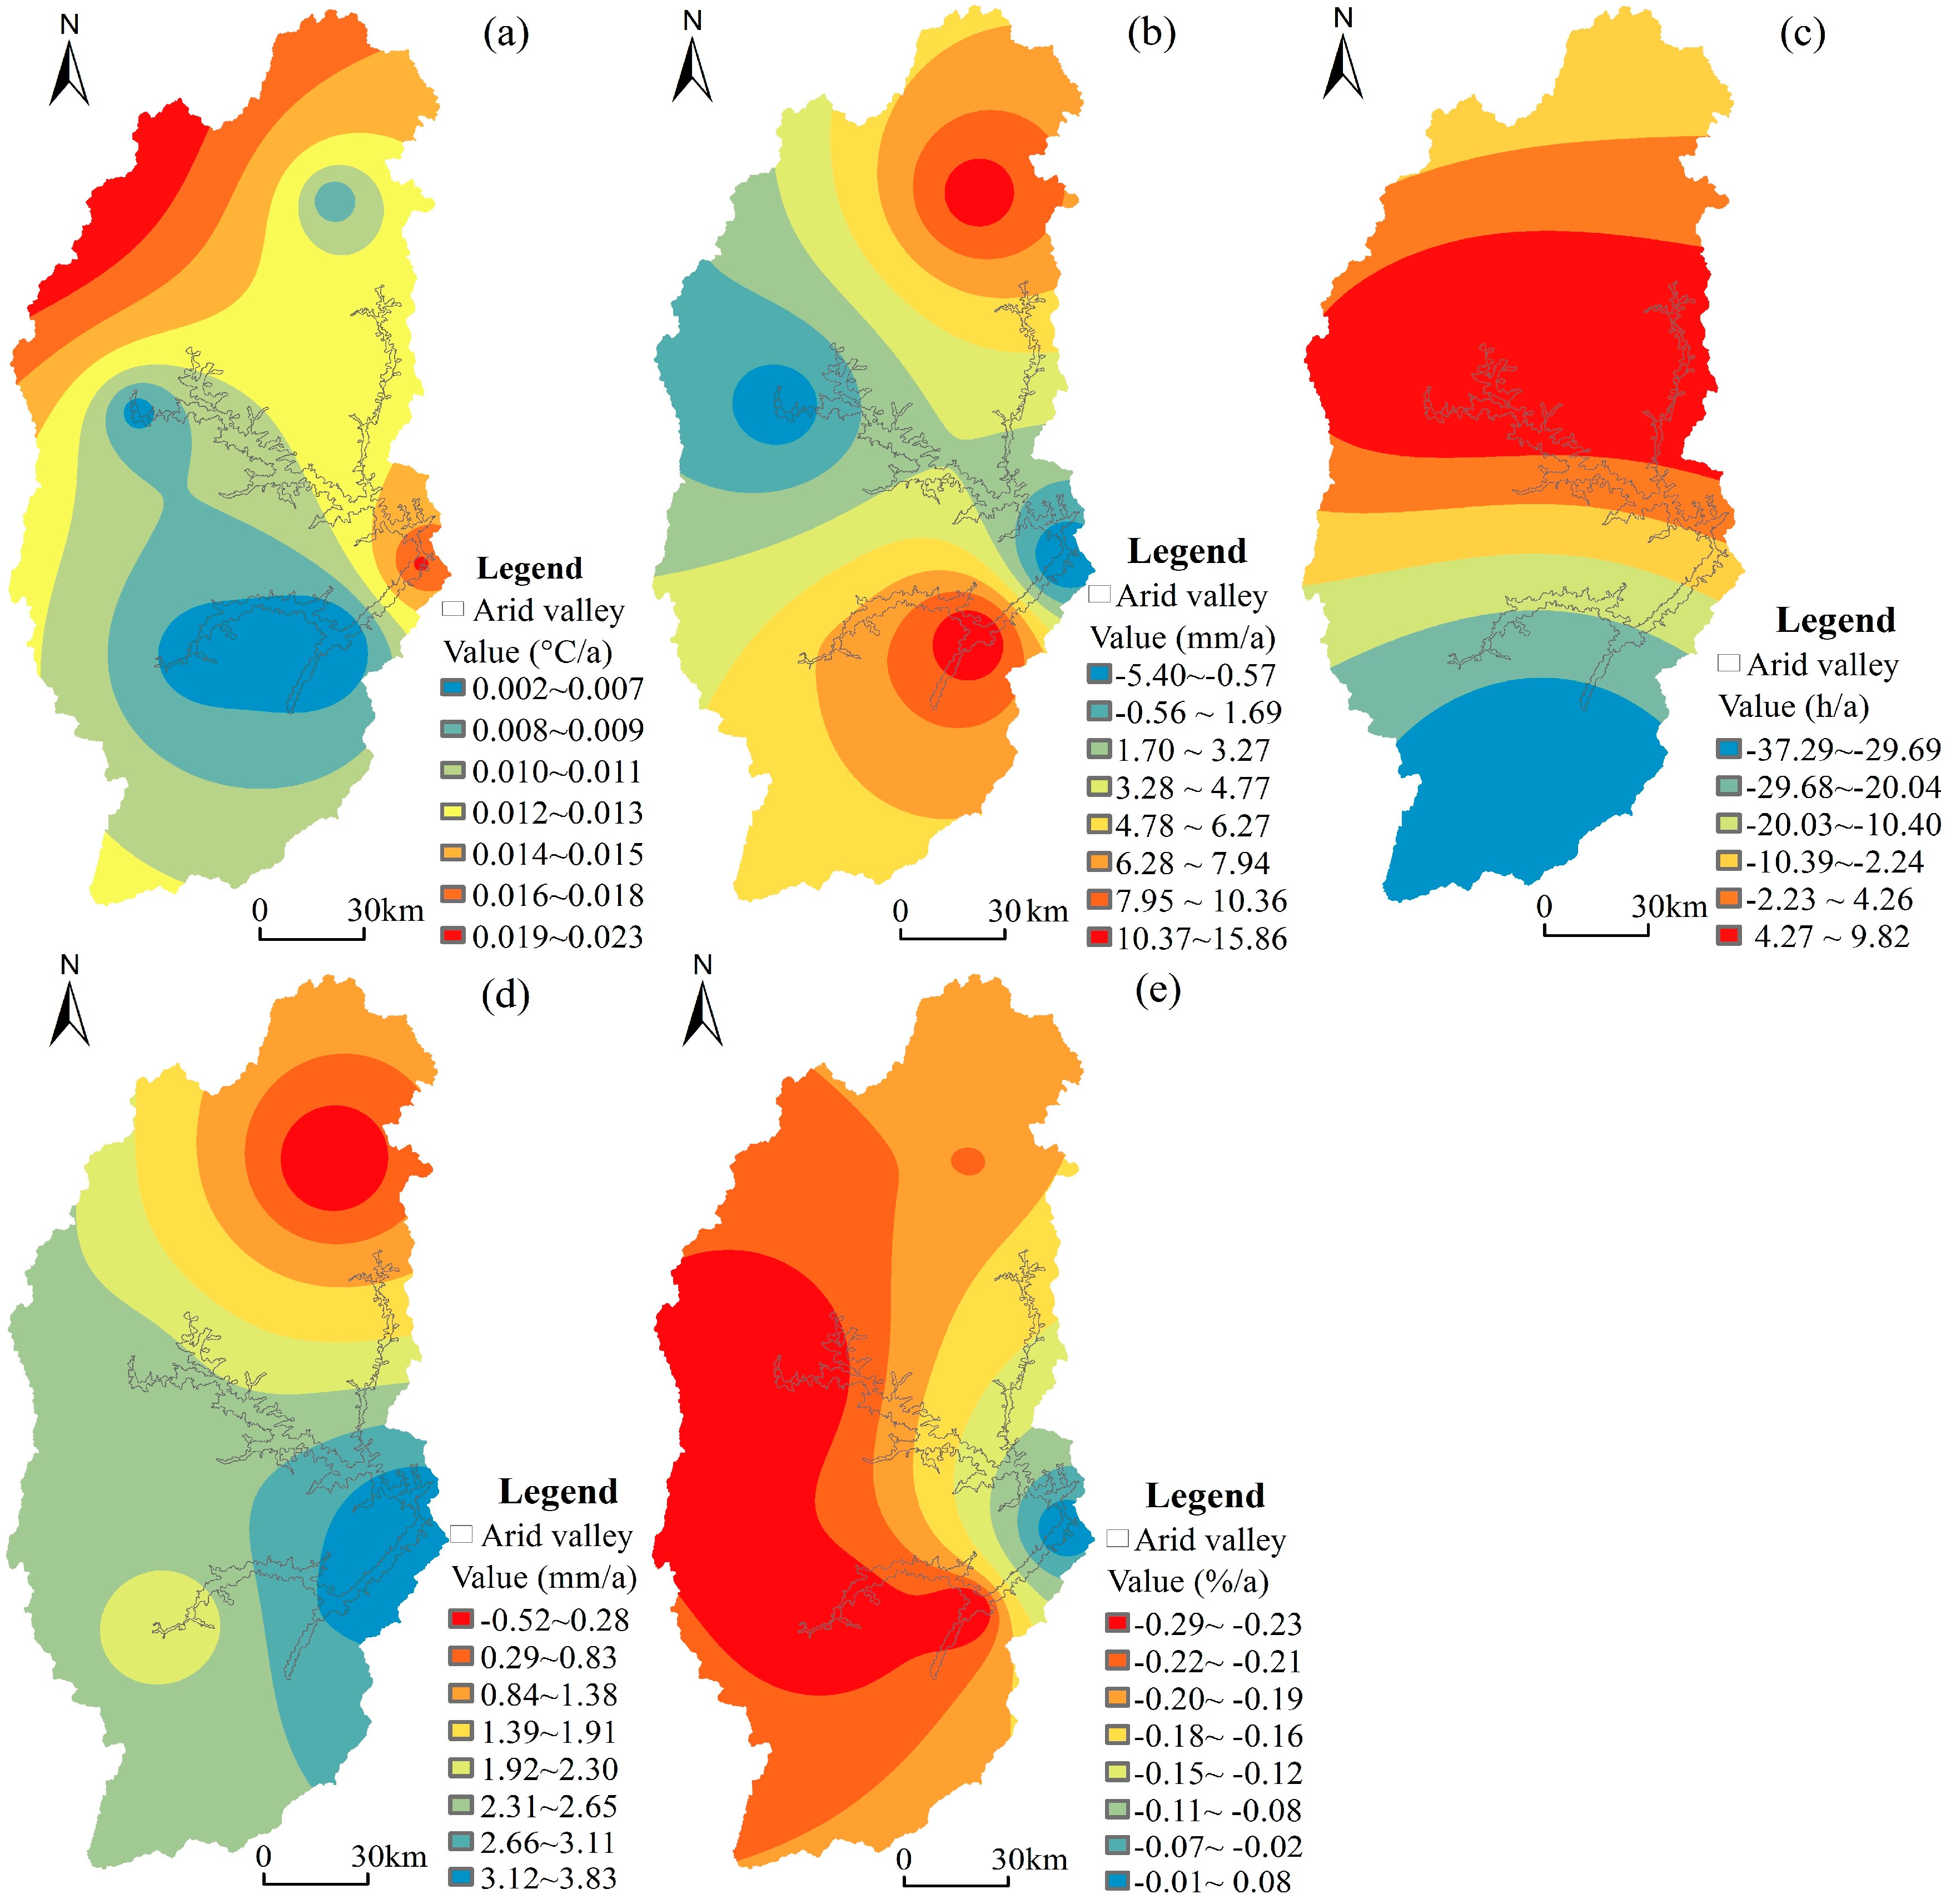
Therefore, this paper revealed the relationship between the arid valley boundary’s displacement and regional climate change during 1999–2013 in the upper reaches of the Min River, seeking a new approach to explore the responding characteristics of the mountain environment to climate change at the watershed scale. Meanwhile, the study can provide important practical value to guide ecological construction and protection in the upper reaches of the Min River.

2. Study Area

The arid valley in the upper reaches of the Min River is located at 31.27° N–32.43° N, 102.94° E–103.90° E, the transition zone from the Tibetan Plateau to the Sichuan Basin, and includes the drought areas of Wenchuan County, Li County, Mao County, Heishui County, and Songpan County in Sichuan Province, China (Figure 1a). In this region, the ranges of annual average temperature, precipitation, and evaporation are 6.7–14.6 °C, 454–798 mm, and 1300–1450 mm, respectively. Adapting to the vertical climate belt, the mountain vegetation vertical belt shows: small-leafed shrubs in the arid valley (1300–2200 m); deciduous broad-leaved and mixed coniferous broad-leaved forests (2000–2800 m); spruce and fir forests (2800–3600 m); alpine brushes and meadows (>3600 m); and the snow belt (>3900 m) [20]. The dominant shrub species in the arid valley belong to the temperate genera. They include the Convolvulus tragacanthoides, Ajania achilleoides, Aster smithianus, Artemisia gmelinii, etc. [25], and the main soil types developing under the shrubs are the yellow cinnamon soil and cinnamon soil. As the typical fragile ecological-environment zone in the upper reaches of the Yangtze River, the arid valley is characterized by a low threshold on ecological security, but is high risk in ecological degradation, with poor habitat suitability, frequent geological disasters (earthquake, landslide, debris flow, etc.), and strong human activities [26,33]. Ecological restoration and reconstruction in the arid valley has become an important aspect of current academic research and government work [17,34].

3. Methods

3.1. Data Sources

Meteorological Data: The datasets were obtained from the National Meteorological Information Centre of the China Meteorological Administration. They include the annual average temperature, annual precipitation, annual sunshine duration, annual average relative humidity, and annual evaporation of the five weather stations in the upper reaches of the Min River from 1999 to 2013 (Figure 1a, Table 1).
Remote Sensing Data: Due to the short time scale of the study, the arid valley boundary’s movement may be small and the high-resolution images were selected as the basic data. They include SPOT-2 and SPOT-4 image data in 1999, SPOT-6 image data in 2013, and Landsat MSS image data in 1974. Details of the remote sensing images are shown in Table 2.

3.2. Methods

3.2.1. Analysis on the Trend of Climate Change

The linear tendency estimation method [35] is used to analyze the inter-annual variation trend of each meteorological element. The equation is:
Y = a + b × t
where Y is the value of meteorological element, t is time, a is the regression constant, and b is the rate of linear tendency that represents the inter-annual variation rate of the meteorological element. The meteorological element shows an increasing trend when b > 0 or a decreasing tendency when b < 0. The variation rate of each meteorological element of the whole basin is represented by the average value of the meteorological element of the five weather stations in the basin.
Then the Mann-Kendall method (M-K test) [36,37,38] is used to test the significance of the variation trend. In the test, under the given significance level α (α = 0.10 in this study), the time series data has a significant increase (z > 0) or a decreasing (z < 0) trend, if |z|≥|z(1 – α/2)|, where z is the test statistic of the M-K test and z(1 – α/2) is the statistic under the given significance level of the M-K test.
Meanwhile, the radial basis function method [31], integrated into ArcGIS software, is used to carry out the spatial interpolation of the linear tendency rates (i.e., the inter-annual variation rates) and map the spatial distribution of meteorological elements’ variation in the upper reaches of the Min River.

3.2.2. Interpretation of the Arid Valley Boundary and Calculation of its Displacement

The Preprocessing of the Remote Sensing Image: Due to the unclear definition of the arid valley boundary, the arid valley in 1974 was interpreted for comparing with existing research [3] on the displacement rate. Using ERDAS IMAGINE software, the remote sensing images were preprocessed, such as the geometric correction, orthogonal correction, image fusion, image mosaic, and image cutting, in the WGS_1984_UTM_Zone_48N coordinate system (central meridian at 105° E).
Interpretation of the Arid Valley Boundary: First, the field investigation was conducted using a handheld GIS (Geographic Information System) data collector in typical regions of the arid valley in the upper reaches of the Min River. The surrounding information of sample sites were recorded [39]. Second, due to the existence of shadow areas in the SPOT image data, the Landsat images over the same period that were downloaded from the United States Geological Survey were referenced. Third, combined with the field investigation and the unsupervised classification of remote sensing images, the interpretation signatures of the arid valley boundary were established, which were mainly based on vegetation types, image color, and texture features. Finally, the arid valley boundaries in 1974, 1999, and 2013 were, respectively, interpreted by two persons simultaneously. The consistency of interpretation results were checked by using the maximum likelihood method: when the consistent rate was more than 90%, the inconsistent part was modified through consultation; when the consistent rate was less than 90%, the re-interpretation was conducted. The partial results are shown in Figure 2.
Calculation of the Displacement of the Arid Valley Boundary: Based on the Digital Elevation Model (DEM) (30 m), the elevation of the arid valley boundary was extracted and the linear data of the arid valley boundary was converted to point data. In order to conduct regularity research intuitively, segmenting the point data by altitude with an interval of 100 m was carried out in this study. The vertical displacement of the arid valley boundary was calculated by the average elevation difference on the same elevation segment in different periods.

4. Results and Discussion

4.1. Characteristics of Climate Change

During 1999–2013, temperature, evaporation, and precipitation increased, and sunshine duration and relative humidity showed decreasing tendencies in the upper reaches of the Min River (Table 3). Due to the differences in climate background and regional geographical characteristics, the climate change in the upper reaches of the Min River showed significant regional features and spatial pattern characteristics under the influences of global climate change (Figure 3).
The increase of drought factors (i.e., temperature, evaporation and sunshine duration) can make the regional climate more arid. The average increased rate of annual average temperature in the upper reaches of the Min River was 0.008 °C/a, which is lower than that in the Hengduan Mountains (0.015 °C/a during 1960–2008) [31]. The warming rate fluctuated between 0.002–0.023 °C/a with the increase in altitude, and the special geographical background made the center of the arid valley (Maoxian Station) become the high-value zone of regional warming with a rate of 0.018 °C/a (Figure 3a). Meanwhile, annual evaporation in the whole basin increased at an average rate of 5.51 mm/a, and the variation trends showed a “tow points and one belt” regional differentiation (Figure 3b). Wenchuan and Songpan are the two high-value centers of the evaporation increase, with increased rates of 15.86 mm/a and 14.34 mm/a, respectively. In the Maoxian-Heishui areas, the annual evaporation increased slowly or decreased slightly and the range of the change rate was −5.40–4.20 mm/a. However, the annual sunshine duration in the whole basin decreased at an average rate of −8.72 h/a. From Lixian to Heishui, the variation range of annual sunshine duration gradually slowed down and showed a horizontal zonal distribution (Figure 3c). The annual sunshine duration decreased with the fastest speed (−25.67 h/a) in the southern Zagunao River Basin, while showing a slower increased trend at the rate of 8.17 h/a in the northern Heishui River Basin.
The increase of moist factors (i.e., precipitation and relative humidity) represents the mitigation of climate drought. In the recent 15 years, the annual precipitation in the upper reaches of the Min River increased with the average rate of 2.25 mm/a (Figure 3d), slower than the increase of evaporation. While the annual average relative humidity in the whole basin decreased at the rate of −0.189%/a (Figure 3e). Furthermore, the variation rate of annual precipitation showed a significant negative linear correlation with altitude (r = −0.925, p = 0.024 < 0.05), and a significant quadratic positive correlation between the variation rates of relative humidity and temperature (r = 0.959, p = 0.0099 < 0.01). Hence, for the regional differentiation, the annual variations of moist factors in the upper reaches of the Min River are obviously related to the variation of annual average temperature.
The regional differentiation characteristics of drought factors and moisture factors reflect the influences of terrain conditions on climate change in the longitudinal range-gorge region [31]. Based on the differences of regional climate background, the arid valley in the upper reaches of the Min River can be divided into three types: the arid valley of the Shaba-Weizhou mainstream of the Min River, the semi-arid valley of the Heishui River Basin and the semi-arid and humid valley of the Zagunao River Basin. According to the analysis of regional differences in climate change: (1) in the central Shaba-Weizhou mainstream of the Min River, temperature and precipitation increased fastest, sunshine duration and evaporation both slightly reduced, and relative humidity slightly increased, causing the regional climate to become warm and humid. (2) In the northern Heishui River Basin, the trend of warmth and humidity in the climate was less obvious due to the increase in sunshine duration and the decrease in relative humidity. (3) In the southern Zagunao River Basin, the annual evaporation showed an increased trend and the annual average relative humidity decreased faster than that in the Heishui River Basin, causing the climate to become warm and dry in the past 15 years.

4.2. Vertical Displacement of the Arid Valley Boundary

The displacement of the arid valley boundary is a comprehensive reflection of climate change and human activities. During 1974–2013, the arid valley boundary in the upper reaches of the Min River was mainly distributed between 1601–3200 m and showed a rising trend at the speed of 0.83 ± 0.21 m/a, together with differences in different periods and regions (Table 4, Figure 4).
During 1974–1999, the average elevation of the arid valley boundary had risen from 2371 m to 2414 m at the speed of 1.72 ± 0.32 m/a (Table 4), which is similar to the result (2 m/a) obtained from the highest elevation of arid valley boundary [3]. In different regions, the ascending speed had a decreasing order, such as: the Shaba-Weizhou mainstream of the Min River (3.77 m/a) > the Heishui River Basin (1.88 m/a) > the Zagunao River Basin (1.00 m/a) (Table 4), in accord with the descending order of the regional drought degree. Compared with 1974, the proportion of the arid valley boundary on each elevation section decreased at lower elevations and increased at higher altitudes in 1999, taking the altitude of 2400 m as the dividing line (Figure 4a). Meanwhile, the dividing altitudes of the variations in distribution proportion in regions by descending order were 2600 m in the Heishui River Basin (Figure 4c), 2400 m in the Zagunao River Basin (Figure 4d) and 2000 m in the Shaba-Weizhou mainstream of the Min River (Figure 4b), having the same order as the regional average elevations.
From 1999 to 2013, the average elevation of the arid valley boundary in the upper reaches of the Min River moved downward to 2404 m at the speed of −0.76 ± 0.26 m/a. The downward speeds of the arid valley boundaries in different regions had a decreasing order, such as: the Heishui River Basin (−0.68 m/a) > the Zagunao River Basin (−0.06 m/a) > the Shaba-Weizhou mainstream of the Min River (0.02 m/a) (Table 4). This is the same with the distributions of precipitation and sunshine duration in the three regions (Figure 5). Meanwhile, the dividing altitude of the distribution proportion variation, on the whole, was 2600 m and it raised 200 m from that during 1974–1999. In different regions, the distribution proportions increased at 1801–2400 m in the Shaba-Weizhou mainstream of the Min River, at 2101–3100 m in the Heishui River Basin, and below 2400 m in the Zagunao River Basin (Figure 4b–d). Therefore, comparing the displacement characteristics of the arid valley boundary in 1974–1999 and 1999–2013, the rise of the arid valley boundary mainly occurred in the low elevation areas and the downward movement of the arid valley boundary basically appeared in the high elevation areas. More importantly, in the Heishui River Basin, significant positive correlations were found between the arid valley boundary’s displacement and the regional meteorological factors. They were the exact opposite of those in the upper reaches of the Min River (Table 5). Therefore, based on the above analysis, the difference in the regional climate background is one of the key factors affecting the characteristics of spatial differentiation of displacement at the arid valley boundary.

4.3. Relationship between the Arid Valley Boundary’s Displacement and Climate Change

4.3.1. Analysis of the Upper Reaches of the Min River

Climate change is one of the driving factors for the displacement of the arid valley boundary. During 1999–2013, with the increases on temperature, precipitation, and evaporation and the decrease of relative humidity in the upper reaches of the Min River, the arid valley boundary moved to a lower altitude, on the whole, and there were significant correlations between the arid valley boundary’s displacement and the inter-annual variations of meteorological elements (Figure 6, Table 6).
Between 1101–1600 m (Figure 6), the arid valley boundary’s displacement and meteorological elements’ variation rates showed a large fluctuation. At 1201–1400 m, the temperature increased the slowest, the increase in evaporation and the decrease in relative humidity were faster, and the arid valley boundary’s displacement was also larger. From 3001–3600 m, the speed of downward movement of the arid valley boundary fluctuated between −0.08 and −0.32 m/a, and the lowest appeared at 3401–3500 m, with a higher speed in the increase of evaporation and a lowest rate in the increase of precipitation.
Between 1601 and 3000 m, the average displacement of the arid valley boundary was −0.02 ± 0.04 m/a, and the correlations between the meteorological elements’ variation rates and the displacement were significant (Table 6). First, in regard to moisture factors, the increased rate of annual precipitation around the arid valley boundary was 2.23–3.26 mm/a, and the relative humidity showed a decreasing trend with the rate of −0.14 to −0.20%/a. The correlations between the variations of the two moisture factors and the displacement were both significantly negative (p < 0.05), meaning the habitat conditions around the arid valley boundary could be obviously improved along with the acceleration of precipitation increase and the slowdown of humidity reduction. Second, the displacement of the arid valley boundary had positive relations with variations in temperature and sunshine duration, and it had a negative correlation with the evaporation’s change. Based on the principal component analysis (PCA), one component was extracted from the three drought factors. Meanwhile, a significant positive correlation (p = 0.016 < 0.05) was found between the displacement and the drought component. Thus, when the drought condition increased quickly, leading to the intensification of habitat drought, the arid valley boundary would move to a higher altitude. Finally, we extracted one component to reflect the changing trends of the five meteorological elements through the PCA method. A significant negative linear correlation was shown between the arid valley boundary’s displacement and the climate change (p = 0.010 < 0.05) (Table 6). Therefore, under the current climate change trends in the upper reaches of the Min River, the upward displacement of the arid valley boundary reduced and the downward displacement increased.
Based on the above analysis, the movement characteristics of the arid valley boundary were influenced by the tendency and the speed in the variation of habitat drought status, and mainly by the changes in the moisture factors. The downward movement of the arid valley boundary, on the whole, reflected that the climate change during 1999–2013 showed beneficial effects on the improvement of the arid valley habitat in the upper reaches of the Min River.

4.3.2. Analysis on the Three Regions

Climate changes in different regions of the upper reaches of the Min River have certain differences, and the differences are also important factors leading to the spatial differentiation of the arid valley boundary’s displacement.
As shown in Figure 6, the altitude ranges, where the fluctuations of the arid valley boundary’s displacement and variation rates of meteorological elements were relatively stable, were 1501–2600 m in the Shaba-Weizhou mainstream of the Min River, 1801–2800 m in the Zagunao River Basin, and 1701–3100 m in the Heishui River Basin, respectively. Except for sunshine duration, the variations in trends of the other four meteorological elements were similar in those regions. They had increased tendencies in temperature, evaporation, and precipitation and a decreased tendency in relative humidity.
In the Shaba-Weizhou mainstream of the Min River, the increased rate of annual precipitation was the largest while the warming rate was also the highest (Figure 6). Thus, the slight upward movement of arid valley boundary revealed that the extent of the current increase in precipitation was not enough to improve habitat conditions on the whole. Based on a correlation analysis (Table 6), the displacement of the arid valley boundary in this region had relatively close relation with the variations of moisture factors (i.e., relative humidity and precipitation), although the correlations did not reach significant levels.
In the Zagunao River Basin, the temperature increased slowly and the sunshine duration decreased rapidly. The increased rate of precipitation was the lowest and the reduction of relative humidity and growth of evaporation were the largest (Figure 6). Considering the slower speed of downward movement in the arid valley boundary, it could be concluded that the positive effect of precipitation increase on the habitat was more obvious than the negative influence of drought aggravation. This means that the current climate change had a slight beneficial effect on regional habitat improvement. Meanwhile, the fluctuation of the arid valley boundary in the Zagunao River Basin was sensitive to the speeds of warming and drying in regional climate, as the variations in temperature and evaporation had relatively high correlations with the displacement of the arid valley boundary (Table 6), even though the rate of the temperature increase was the least in the three regions.
In the Heishui River Basin, despite the increased trend of annual sunshine duration, the variation rates of other factors were at a medium level among the three regions (Figure 6). The climate in this region is more humid than that of the Shaba-Weizhou mainstream of the Min River, and it is much dryer than that of the Zagunao River Basin. The arid valley boundary in the Heishui River Basin showed a faster downward speed, because of the improvement of the water-heat balance caused by the mutual influences of variations of meteorological elements. Through the correlation analysis (Table 6), the arid valley boundary’s displacement in the region had significant correlations with the variation rates of meteorological elements, especially in regards to the evaporation. Furthermore, one component was extracted by the PCA method to represent the changes of the five meteorological elements, and it had a relatively good positive linear correlation with the displacement of the arid valley boundary. This is different from that of the upper reaches of the Min River (Table 6). This opposite correlation characteristic may have a certain relation with the opposite variation trends of evaporation and sunshine duration in different regional scales (Table 3).
Therefore, the movement of the arid valley boundary is the reflection and result of changes in warm and humid degrees of the regional climate. In the arid valley center where the climate became warm and humid, the movement of the arid valley boundary had a higher degree of correlation with the moisture factor. The farther away from the drought center, the weaker the trend of warmth and humidity on climate change, and the relationship between the arid valley boundary’s displacement and the variations of drought factors (especially the evaporation) gradually became close. When the regional climate is relatively humid and had a warm and dry tendency, the temperature increase became the factor that had the highest correlation with the displacement of the arid valley boundary.
Since 1999, the Green for Grain Project has been in full operation, entering the consolidating period from 2009 on. This ecological project has been mainly carried out near, or below, the arid valley boundary with a greater than 25 degree slope. Forest land restoration is the key focus. The arid valley boundary that near the mountainous settlement’s upper limit and the forest accounts for about 13%. Considering the influences of the regional climate background and climate change on vegetation restoration, the study based on the whole arid valley boundary could effectively reflect the relationship of the arid valley boundary’s displacement with climate change. Meanwhile, although the results of the arid valley boundary’s displacement during 1974–1999 were close to existing research, there were interpretation errors due to the lack of specific definition and automatic extraction technology on the arid valley boundary. This study can provide basic data support and favorable references for the automatic extraction of the arid valley boundary based on high resolution remote sensing images in the future. In addition, the arid valley in the upper reaches of the Min River is a vital minority corridor for Tibetan, Qiang, and Hui nationalities in Southwest China, and the livelihood strategies of different types of mountain settlements have different influences on the natural environment [21,40]. As the relationship between the arid valley displacement and climate change in 15 years has been studied, further research on a long time scale needs to be carried out. The consideration of influences from human activities under different livelihoods is also another direction for future research.

5. Conclusions

The displacement of the arid valley boundary is one of the response indicators to climate change in the natural mountainous ecosystem. The habitat conditions and climatic change characteristics in the region have significant influences on the arid valley boundary’s variation in the upper reaches of the Min River. This study provides new research on mountainous environmental change. It can also give guidance for regional ecological construction and eco-environment assessments in accordance with regional differences on the water-heat balance. Based on the results, in the Shaba-Weizhou mainstream of the Min River, the current climate change has been advantageous for the improvement of regional moisture conditions. However, it is not enough to improve the habitat environment, showed as a slight upward movement of the arid valley boundary. Thus, water conservancy construction should become the main task. As for the Heishui River Basin, ecological construction should focus on water conservation due to the significant correlation between evaporation increase and the arid valley boundary’s displacement. Additionally, the warm and humid trend on climate change has been shown in the Shaba-Weizhou mainstream of the Min River and the Heishui River Basin. It is certainly beneficial to local ecological restoration and the development of regional eco-environment quality. For the Zagunao River Basin, the climate is relatively humid, but has a warm and dry tendency, and water conservation must also be strengthened. Due to the arduousness and long-term task of ecological construction in the arid valley of the upper reaches of the Min River, only with scientific cognition of regional environmental characteristics and reasonable artificial regulation can it be effectively carried out.

Acknowledgments

This research was supported by the National Science and Technology Support Program of China (Grant No. 2015BAC05B05-01); and the National Natural Science Foundation of China (NSFC) (Grant No. 41601088, Grant No. 41071115).

Author Contributions

Yalin Guo conceived and designed the research method; Yalin Guo and Min Fan analyzed the data; and Yalin Guo and Qing Wang wrote the paper. All authors read and approved the final manuscript.

Conflicts of Interest

The authors declare no conflict of interest.

References

  1. Yang, Q.Y.; Zhen, D.; Liu, Y.H. Physical–geographical feature and economic development of the dry valleys in the Hengduan Mountains, southwest China. J. Arid L. Resour. Environ. 1988, 2, 17–24. [Google Scholar]
  2. Zhang, R.Z. The Dry Valleys of the Hengduan Mountains Region; Science Press: Beijing, China, 1992. [Google Scholar]
  3. Yang, Z.P.; Chang, Y.; Bu, R.C.; Liu, M.; Zhang, W.G. Long–term dynamics of dry valleys in the upper reaches of Mingjiang River, China. Acta Ecol. Sin. 2007, 27, 3250–3256. [Google Scholar]
  4. Gao, Y.Y.; Liu, Q.; Wang, H.R.; Xu, X.Y.; Shi, Q.Y. Definition dry valleys scope by RS and GIS. J. Beijing Norm. Univ. 2012, 48, 92–96. [Google Scholar]
  5. Yuan, H.; Li, X.W.; Lin, Y. Arid river valley division research in Sichuan Province based on remote sensing. J. Sichuan Agric. Univ. 2013, 31, 182–187. [Google Scholar]
  6. Zhong, X.H. Progress tendency and forward domains of mountain environment studies. J. Mt. Sci. 2006, 24, 525–530. [Google Scholar]
  7. Fang, Y.P.; Qin, D.H.; Ding, Y.J. A review about the research on adaptability in climate change-Present situation and tendency. Arid. Zone Res. 2009, 26, 299–305. [Google Scholar] [CrossRef]
  8. Ming, Q.Z.; Shi, Z.T.; Deng, Y.J.; Dong, M. High gradient effects of mountain regions-Taking the effects of nature human landscape in the Hengduan Mountains for example. J. Glaciol. Geocryol. 2006, 28, 925–930. [Google Scholar]
  9. Kelly, A.E.; Goulden, M.L. Rapid shifts in plant distribution with recent climate change. Proc. Natl. Acad. Sci. USA 2008, 105, 11823–11826. [Google Scholar] [CrossRef] [PubMed]
  10. Kullman, L. Pine (Pinus sylvestris L.) tree–limit surveillance during recent decades, Central Sweden. Arctic Alp. Res. 1993, 25, 24–31. [Google Scholar] [CrossRef]
  11. Malanson, G.P. Complex responses to global change at alpine treeline. Phys. Geogr. 2001, 22, 333–342. [Google Scholar]
  12. Zhai, Z.; Wang, Q. The geography distribution pattern and spatial move of the lower timberline in the upper reaches of Minjiang River. Geogr. Res. 2015, 34, 2105–2112. [Google Scholar]
  13. Hantel, M.; Maurer, C.; Mayer, D. The snowline climate of the Alps 1961–2010. Theor. Appl. Climatol. 2012, 110, 517–537. [Google Scholar] [CrossRef]
  14. Mark, B.G.; Harrison, S.P.; Spessa, A.; New, M.; Evans, D.J.A.; Helmens, K.F. Tropical snowline changes at the last glacial maximum, A global assessment. Quat. Int. 2005, 138–139, 168–201. [Google Scholar] [CrossRef]
  15. Zhao, J.; Huang, Y.S.; Shi, Y.F.; Li, L. Relationship between snow line change and climate change in the middle of Qilian Mountains during 2000–2012. Mt. Res. 2015, 33, 683–689. [Google Scholar]
  16. Bao, W.K.; Wang, C.M. Degradation mechanism of mountain ecosystem at the dry valley in the upper reaches of the Minjiang River. J. Mt. Sci. 2000, 18, 57–62. [Google Scholar]
  17. Chen, G.J.; Tu, J.J.; Fan, H.; Ye, Y.Q.; Chen, Y. The Theory and Practice of Ecological Construction in the Upper Reaches of Minjiang River; Southwest China Normal University Press: Chongqing, China, 2006. [Google Scholar]
  18. Dong, Y.F.; Xiong, D.H.; Su, Z.A.; Li, J.J.; Yang, D.; Shi, L.T.; Liu, G.C. The distribution of and factors influencing the vegetation in a gully in the Dry-hot Valley of southwest China. Catena 2014, 116, 60–67. [Google Scholar] [CrossRef]
  19. Pang, X.Y.; Bao, W.K.; Wu, N. Reasons of dry valley climate characteristic and its formation reason in upstream of Minjiang River. Resour. Environ. Yangtze Basin 2008, 17, 46–53. [Google Scholar]
  20. Zheng, D.; Yang, Q.Y. Some problems on the altitudinal belts in Southeastern Qinghai–Xizang (Tibetan) Plateau. Acta Geogr. Sin. 1985, 40, 60–69. [Google Scholar]
  21. Wang, Q.; Shi, M.Q.; Guo, Y.L.; Zhang, Y. The vertical differentiation of the mountain settlement niche in the upper reaches of Minjiang River. Acta Geogr. Sin. 2013, 68, 1559–1567. [Google Scholar]
  22. Guan, W.B.; Ye, M.S.; Ma, K.M.; Liu, G.H.; Wang, X.L. Vegetation classification and the main types of vegetation of the Dry Valley of Minjiang River. J. Mt. Sci. 2004, 22, 679–686. [Google Scholar]
  23. Liu, L.H. Vegetation types of the arid valleys in the Hengduan Mountainous region. Mt. Res. 1989, 7, 175–182. [Google Scholar]
  24. Liu, W.B. Main types of the semi–arid valley scrubs in the upper reaches of the Minjiang River. Mt. Res. 1994, 12, 27–31. [Google Scholar]
  25. Yang, Q.Z. Study on the arid valley scrubs in the upper reaches of Minjiang River. J. Mt. Sci. 2007, 25, 1–32. [Google Scholar]
  26. Guo, Y.L.; Wang, Q.; Yan, W.P.; Zhou, Q.; Shi, M.Q. Assessment of habitat suitability in the Upper Reaches of the Min River in China. J. Mt. Sci. 2015, 12, 737–746. [Google Scholar] [CrossRef]
  27. Yao, J.; Ding, J.; Ai, N.S. Assessment of ecological vulnerability in upper reaches of Mingjiang River. Resour. Environ. Yangtze Basin 2004, 13, 380–383. [Google Scholar]
  28. Liu, W.B. Flora of semi–arid valley shrubs at the upper reaches of Minjiang River. Mt. Res. 1992, 10, 83–88. [Google Scholar]
  29. Fan, H.; Zhang, J.P. Study on land use/cover in arid valley of upper Minjiang watershed. J. Desert Res. 2002, 22, 273–278. [Google Scholar]
  30. Fan, M.; Li, F.C.; Guo, Y.L.; Wang, Q. Effects of Grain for Green Project on changes in ecosystems service values of alpine settlement area in the upper reaches of the Minjiang River. Mt. Res. 2016, 34, 356–365. [Google Scholar]
  31. Li, Z.X.; He, Y.Q.; Xin, H.J.; Wang, C.F.; Jia, W.X.; Zhang, W.; Liu, Q. Spatio–temporal variations of temperature and precipitation in Mts. Hengduan Region during 1960–2008. Acta Geogr. Sin. 2010, 65, 563–579. [Google Scholar]
  32. Moseley, R.K.; Tang, Y. Vegetation dynamics in the dry valleys of Yunnan, China, during the last 150 years: Implications for ecological restoration. Acta Phytoecol. Sin. 2006, 30, 713–722. [Google Scholar]
  33. Nan, X.; Yan, D.; Li, A.N.; Lei, G.B.; Cao, X.M. Mountain hazards risk zoning in the upper reaches of Minjiang River. J. Catastr. 2015, 30, 113–120. [Google Scholar]
  34. Ye, Y.Q.; Chen, G.J.; Fan, H. Impact of the “Grain for Green” project on rural community in the Upper Min River Basin, Sichuan, China. Mt. Res. Dev. 2003, 23, 35–41. [Google Scholar]
  35. Wei, F.Y. Modern Climatic Statistical Diagnosis and Prediction Technology; Meteorological Press: Beijing, China, 2007. [Google Scholar]
  36. Jiang, W.P.; Yuan, L.H.; Wang, W.J.; Cao, R.; Zhang, Y.F.; Shen, W.M. Spatio–temporal analysis of vegetation variation in the Yellow River Basin. Ecol. Indic. 2015, 51, 117–126. [Google Scholar] [CrossRef]
  37. Wu, S.H.; Yin, Y.H.; Zheng, D.; Yang, Q.Y. Climate changes in the Tibetan Plateau during the last three decades. Acta Geogr. Sin. 2005, 60, 3–11. [Google Scholar]
  38. Xu, Z.X.; Zhang, L.; Huang, J.X.; Gong, T.L. Long–term trend of temperature, precipitation and relative humidity in the Tibetan Region. Meteorol. Mon. 2007, 33, 82–88. [Google Scholar]
  39. Wang, Q.; Zhai, Z. The lower timberline dataset in the upper reaches of Minjiang River, China (1999–2009) (LowerTimberlineMinjiang_1999–2009). Glob. Chang. Res. Data Publ. Repos. 2016, 3. [Google Scholar] [CrossRef]
  40. Fang, Y.P.; Fan, J.; Shen, M.Y.; Song, M.Q. Sensitivity of livelihood strategy to livelihood capital in mountain areas: Empirical analysis based on different settlements in the upper reaches of the Minjiang River, China. Ecol. Indic. 2014, 38, 225–235. [Google Scholar] [CrossRef]
Figure 1. Geographical location of the arid valley in the upper reaches of the Min River: (a) location of the arid valley; and (b) arid valley slope.
Ijgi 06 00146 g001
Figure 2. The arid valley boundaries in different periods near Shaba: (a) the arid valley in 1974 that was interpreted from Landsat MSS images; (b) the arid valley in 1999 that was interpreted from SPOT-2 and SPOT-4 images; and (c) the arid valley in 2013 that was interpreted from SPOT-6 images.
Ijgi 06 00146 g002
Figure 3. Spatial distributions of inter-annual variations of meteorological elements during 1999–2013 in the upper reaches of the Min River: (a) annual average temperature variation; (b) annual evaporation variation; (c) annual sunshine duration variation; (d) annual precipitation variation; and (e) annual average relative humidity variation.
Ijgi 06 00146 g003
Figure 4. Vertical distribution of the arid valley boundary during 1974–2013: (a) MA: the upper reaches of the Min River; (b) SWA: the Shaba-Weizhou mainstream of the Min River; (c) HA: the Heishui River Basin; and (d) ZA: the Zagunao River Basin.
Ijgi 06 00146 g004
Figure 5. Climate characteristics of the arid valley boundaries in different altitudes in regions: (a) vertical distribution of precipitation; and (b) vertical distribution of sunshine duration.
Ijgi 06 00146 g005
Figure 6. Vertical distributions of the arid valley boundaries’ displacements and meteorological elements’ variation rates in the upper reaches of the Min River during 1999–2013: (a) RA: variation rate of average altitude of the arid valley boundary; (b) RT: variation rate of annual average temperature; (c) RS: variation rate of annual sunshine duration; (d) RE: variation rate of annual evaporation; (e) RP: variation rate of annual precipitation; and (f) RH: variation rate of annual average relative humidity.
Ijgi 06 00146 g006
Table 1. Information on weather stations in the upper reaches of the Min River.
Weather StationNorth Latitude (°)East Longitude (°)Elevation (m)AT (°C)AP (mm)AS (h)AH (%)AE (mm)
Wenchuan103.5831.47145314.63467.201457.6565.731401.99
Lixian103.1731.43213911.70591.871667.7967.271448.86
Maoxian103.8531.68158811.54453.941558.9174.131415.41
Heishui102.9832.0823979.39797.571891.7364.401405.83
Songpan103.5732.6531906.67705.911747.4362.201304.24
Notes: AT, AP, AS, AH, and AE represent the average values of the annual average temperature, annual precipitation, annual sunshine duration, annual average relative humidity, and annual evaporation during 1999–2013, respectively.
Table 2. Information on remote sensing data.
ImageAcquisition TimeResolution (m)
Panchromatic BandMulti-Spectral Band
Landsat MSS *January, 1974/30
SPOT-2/SPOT-4December, 1999; January, 20001020
SPOT-6January, 2014; February, 20141.56
* Note: The Landsat MSS image data were downloaded freely from http://glovis.usgs.gov/.
Table 3. Climate change in the upper reaches of the Min River during 1999–2013
Weather StationRT (°C/a)RS (h/a)RE (mm/a)RP (mm/a)RH (%/a)
Wenchuan0.002−22.3415.863.17−0.26 *
Lixian0.005−25.67 *6.922.12−0.26 *
Maoxian0.018−5.24−5.403.840.08
Heishui0.0068.17−4.182.63−0.29 *
Songpan0.0071.5014.34−0.52−0.21 *
Whole Basin0.008−8.725.512.25−0.19 *
Notes: RT, RS, RE, RP, and RH represent the inter-annual variation rates of annual average temperature, annual sunshine duration, annual evaporation, annual precipitation, and annual average relative humidity, respectively. RT, RS, RE, RP, and RH were calculated by the linear tendency estimation method. * Based on the M-K Test, the variation trend was significant at the significant level (α = 0.10).
Table 4. Variation characteristics of the arid valley boundary during 1974–2013.
Regions 1974a–1999a1999a–2013a
MAAverage Elevation/m2402 ± 4092401 ± 414
Variation Rate/m/a1.72 ± 0.32−0.76 ± 0.26
SWAAverage Elevation/m2068 ± 2872101 ± 280
Variation Rate/m/a3.77 ± 0.280.02 ± 0.30
HAAverage Elevation/m2622 ± 3252636 ± 327
Variation Rate/m/a1.88 ± 0.19−0.68 ± 0.18
ZAAverage Elevation/m2274 ± 2772270 ± 294
Variation Rate/m/a1.00 ± 0.24−0.06 ± 0.35
Notes: MA = The upper reaches of the Min River; SWA = The Shaba-Weizhou mainstream of the Min River; HA = The Heishui River Basin; ZA = The Zagunao River Basin. All of the values were equivalent to their means with positive and negative standard deviations.
Table 5. Correlations between the displacement and the meteorological elements during 1999–2013.
RA in RegionAltitude Range (m)TemperatureSunshine DurationEvaporationPrecipitationRelative HumidityRegression Analysis
RA_MA1601‒3000−0.663 *0.658 *−0.662*0.659 *−0.654 *RA= −0.013 × Y − 0.020, p = 0.010 < 0.05
RA_HA1701‒31000.549 *−0.567*0.536*−0.583 *0.561 *RA = 0.022 × Y + 0.003, p = 0.037 < 0.05
Notes: RA_MA: variation rate of average altitude of the arid valley boundary in the upper reaches of the Min River. RA_HA: variation rate of average altitude of the arid valley boundary in the Heishui River Basin. * p < 0.05. In regression analysis, one component (Y) was extracted through the principal component analysis (PCA) and N = 14.
Table 6. Correlations between the displacement of the arid valley boundary and the variations of meteorological elements during 1999–2013.
RA in RegionAltitude Range (m)RTRSRERPRHRegression Analysis
RA_MA1601‒30000.461 0.664 *−0.607 *−0.657 *−0.612 *RA= −0.014 × Y − 0.020, p = 0.010 < 0.05
RA_SWA1601‒2600−0.083 0.101 0.074 −0.176 −0.219 /
RA_HA1701‒31000.554 *−0.605 *0.632 *0.552 *0.612 *RA = 0.025 × Y + 0.003, p = 0.020 < 0.05
RA_ZA1801‒28000.339 0.064 −0.239 0.019 0.108 /
Notes: RA_MA: variation rate of average altitude of the arid valley boundary in the upper reaches of the Min River. RA_SWA: variation rate of average altitude of the arid valley boundary in the Shaba-Weizhou mainstream of the Min River. RA_HA: variation rate of average altitude of the arid valley boundary in the Heishui River Basin. RA_ZA: variation rate of average altitude of the arid valley boundary in the Zagunao River Basin. * p < 0.05. In regression analysis, one component (Y) was extracted through the PCA method and N = 14.

