Change of Land Use/Cover in Tianjin City Based on the Markov and Cellular Automata Models


Faculty of Life and Environmental Science, University of Tsukuba, 1-1-1 Tennodai, Tsukuba City, Ibaraki 305-8572, Japan
*
Author to whom correspondence should be addressed.
ISPRS Int. J. Geo-Inf. 2017, 6(5), 150; https://0-doi-org.brum.beds.ac.uk/10.3390/ijgi6050150
Submission received: 6 March 2017
/
Revised: 26 April 2017
/
Accepted: 3 May 2017
/
Published: 11 May 2017
Abstract
:In recent years, urban areas have been expanding rapidly in the world, especially in developing countries. With this rapid urban growth, several environmental and social problems have appeared. Better understanding of land use and land cover (LULC) change will facilitate urban planning and constrain these potential problems. As one of the four municipalities in China, Tianjin has experienced rapid urbanization and such trend is expected to continue. Relying on remote sensing (RS) and geographical information system (GIS) tools, this study investigates LULC change in Tianjin city. First, we used RS to generate classification maps for 1995, 2005, and 2015. Then, simulation models were applied to evaluate the LULC changes. Analysis of the 1995, 2005, and 2015 LULC maps shows that more than 10% of the cropland areas were transformed into built-up areas. Finally, by employing the Markov model and cellular automata (CA) model, the LULC in 2025 and 2035 were simulated and forecasted. Our analysis contributes to the understanding of the development process in the Tianjin area, which will facilitate future planning, as well as constraining the potential negative consequences brought by future LULC changes.
1. Introduction
Urban areas around the world are currently expanding at an astonishing rate. An increase of 58,000 km2 for urban land areas has been observed from 1970 to 2000 [1]. Rapid economic development and population growth are the main driving forces of urbanization. In the past few decades, the world has achieved steady economic growth, which is around 3% annually. Currently, the world population continues to grow though more slowly than in the recent past. Up to 2017, the world population has reached 7.5 billion. The world has been powerfully shaped by the interplay of economic development, population growth, and urbanization. It has been estimated that global urban land cover will have a likely increase of 1,527,000 km2 by 2030 [1].
Urbanization is especially pronounced in developing countries, due to rapid economic development and population growth [1]. As one of the main developing countries, China has experienced the highest rates of urban land expansion. It is recorded that annual rates of urban land expansion in China vary from 13.3% for coastal areas to 3.9% for the western regions [2].
The implication of urbanization is profound. It contributes to the improvement of people’s live standards, efficient resource utilization, and mitigation of climate change. For example, with high residential density, energy consumption and vehicle miles traveled could be reduced, thus offsetting greenhouse gas emissions. At the same time, negative impacts brought by urbanization should not be neglected. Air pollution, traffic congestion, food shortages, forest decreasing and species extinction have occurred under rapid developments.
Urbanization causes a dramatic change to the urban land use system [3]. For example, Beijing, the capital of China, is quite different now compared to 50 years ago, when subways, highways, and factories rarely operated [4]. Because of human activity, a lot of cropping land has been changed into built-up area, and the scale of the city has expanded. This process brings about benefits as well as problems.
Urbanization is one of the most complex processes that involve landscape changes. The modeling variables and mechanism of LULC are spatiotemporally changing. Under these circumstances, relevant issues need to be discussed and investigated in depth [5]. Analysis of LULC changes is regarded to be a useful approach to capture the urban trend and to forecast its features. In the modern era, it is essential and necessary to have a comprehensive simulation for urban development [6]. RS and GIS are essential tools in capturing the spatial characteristics of LULC changes in a practicable way [7]. Relying on these spatial data, urban models are usually employed in considering the pattern of urbanization [8]. With the aid of urban growth models, researchers are able to calculate the structure and behavior of the urban system and simulate future conditions [9].
RS data has been used as a source of information on urban growth and urban morphology, as remote sensing can provide spatiotemporal data on urbanization processes, while census data is limited [10]. Specifically, RS data and its techniques are increasingly used in research aimed at operational monitoring on urbanization [11]. For developing countries, remote sensing data are particularly useful due to the cost and time associated with the method. Several studies have demonstrated the applicability of RS for depicting LULC change in some cities [12].
Urban models attempt to describe the urban system using mathematical equations [13]. They can be used to make a representation of the urban system and deal with the interaction of LULC activity in different areas. The reasons, processes, and result of LULC modification are determined by the interaction of many factors and policies. Under these circumstances, urban models have become a significant step for predicting LULC changes. Relying on currently available data or conditions, combined with factors (such as population, economic and politics) and modeling variables (such as distance to built-up, distance to the central business district (CBD), distance to road, etc.), urban models could potentially be used to model LULC and forecast future development condition in the same area. As it is extremely helpful for decision-making and policy formulation, a considerable amount of research has been conducted on LULC. However, the adoption of Markov and Cellular Automata is rarely seen.
As one of the four municipalities, Tianjin, a harbor city in northern China, has experienced lasting urbanization and industrialization, which brings about LULC change. After few decades of development, urban areas have expanded significantly. Given its important position in north China, there is still great potential for population growth and economic development. Considering the trend of urbanization, industrialization, and the ongoing LULC change in Tianjin, modeling LULC change and foresting its tendency are great need for urban planners.
Therefore, the primary objective of this study was to investigate the LULC changes in Tianjin city. Moreover, we aimed to simulate future LULC development to support urban planning initiatives. This study focused on the period from 1995 to 2015, during which the urbanization process is remarkable. To do so, we firstly produced LULC maps with five classifications at three time points (1995, 2005, and 2015). By comparing LULC at these time points, it was found that a large number of croplands had been converted into built-up areas. Then, variables for the CA model were constructed. To project the LULC in 2025 and 2035, a suitable set of transition rules was established to identify neighborhood interactions. Based on Markov and CA models, supplemented with dynamic variables, LULC in 2025 and 2035 were projected. Simulation result showed that built-up area will continue expanding in the central and southeast harbor areas, mainly from cropland. This paper ends with a discussion on the trend of LULC in Tianjin and the potential implications of these, which should be particularly known and addressed during city planning.
GIS, the Markov model, and CA model were employed as the main methods of analysis. It contributes to the understanding of LULC change in Tianjin area, which facilitates future planning. Our application also demonstrates the potential of remote sensing techniques in modeling LULC, and providing information for city planners.
2. Materials and Methods
2.1. Study Area
The study area, Tianjin, is the largest city in the northern coast of China (Figure 1). Tianjin covers an area of about 11, 860 km2 with geographic coordinates ranging from 38°34’ N to 40°15’ N and 116°43’ E to 118°04’ E. Tianjin is ranked as the fifth largest city in China, following Beijing, Shanghai, Guangzhou and Shenzhen. Tianjin is one of the fastest growing megacities in the world, with a population of about 15 million. According to the National Bureau of Statistics (NBS) of China (2015), the population of Tianjin grew from approximately 10.1 million to 15.5 million between 2002 and 2015, representing a 53.6 percent (%) increase at an annual growth rate of 4.1%.
Tianjin is the second largest economy in northern China after Beijing with a GDP of approximately 240 billion dollars [14]. Being an international port city and one of the most important economic and industrial centers of China, Tianjin has experienced rapid urbanization over the past few decades. The rapid urbanization has resulted in rapid LULC changes, mainly dominated by the conversion of huge portions of the land such as cropland, grasslands and forests, into built-up areas.
2.2. Data Sources
In this study, Landsat data were obtained from the US Geological Survey website [15], for LULC mapping and detecting the spatiotemporal LULC changes in Tianjin city. The Landsat data included Thematic Mapper (TM)/Operational Land Imager (OLI) images obtained at three time points (1995, 2005 and 2015), as shown in Table 1. Four cloud free (<10%) images were downloaded for each time point to cover the study area. The spatial resolution of all the images was 30 m, projected to WGS 1984_UTM_Zone 50N.
Other ancillary data was also obtained for modeling and/or use as reference data during accuracy assessment. This included vector data of the Central Business District (CBD), city boundary, roads networks, major markets, and capital bus stations of Tianjin city. High-resolution Google EarthTM images were also used as reference data.
2.3. LULC Classification
Landsat images were used to map the LULC of the Tianjin city for three time points (1995, 2005 and 2015). All the images were processed with a spatial resolution of 30 m. In the ArcGIS 10.2 software, the pixel-based supervised classification technique employing the maximum likelihood classification algorithm was used to perform classifications [16]. In order to analyze the characteristics of urbanization in Tianjin city at the series of time from 1995 to 2015, the study area was aggregated into five types of LULC: Built-up, Cropland, Grass, Forest, and Water. Built-up areas included human-constructed structures such as buildings, roads, and other impervious surfaces. Water included paddy field, reservoirs, and rivers.
2.4. Description of Markov Model in LULC
A Markov model has been used to simulate changes in LULC at a variety of spatial scales [17]. In LULC analysis, a stationary state in a Markov model means that the factors that influence changes in LULC from one time period to another time period remain in the same transition probability matrix [18]. The Markov model assumes that LULC changes are regarded as stochastic processes. A characteristic of the Markov process is that its application in the study of LULC change is appropriate, because LULC change also possesses the properties of the Markov process under the limit of certain conditions [19]. Transition probabilities have been used extensively for analysis and modeling of LULC changes [20]. The original transition probability matrices of LULC changes in one-time period need to be defined prior to applying the Markov process.
The transition matrix is a key for simulating LULC changes in the near future; despite the fact that it has no spatial significance, it is capable of simulating future changes based on the current condition [21]. The application of the Markov model to simulate LULC changes in the near future is very useful for urbanization studies [22].
2.5. Description of Cellular Automata Model
Cellular automata was first devised by John Von Neumann and Stanislaw Ulam as a framework for investigating the logical underpinnings of life [23]. The CA model has become adjustable, and is effective at simulating spatial patterns of LULC changes. The CA model provides an effective and interesting method for production for urban systems [24]. Although transition probabilities may be accurate for a particular class using the Markov model, there is no spatial element to this modeling process. The CA model has a spatial dimension for LULC changes [25]. One of the characteristics of CA is the ability to investigate model dynamics under different model parameters which provide different movement regimes [26]. Using the CA model and GIS analysis, LULC changes can be used to simulate landscapes in the future based on independent spatial variables [27]. Although the CA model has many advantages, it suffers from difficulties such as determining parameter values [28]. The process of CA model can be realized by IDRISI Selva 17.0.0.0 software.
2.6. Model Implementation Variables
In order to analyze the spatial distribution in the near future, modeling variables need to be prepared. Multi-temporal Landsat images of 1995, 2005, and 2015 were used in classification analysis, together with GIS to map LULC changes. Distances to roads, distances to subways, distances to bus stations, distances to CBDs, distances to markets, slope and DEM data served as the modeling variables in this study. Figure 2 presents the modeling variables in the study area. Location of main roads, subways (on the ground), capital bus stations, CBDs and markets are shown in detail in the map. The distance to road, distance to subway, and distance to bus station were shown in Figure 2a–c, respectively. In Figure 2d it was clear that there were two CBD clusters in the study area, one in the old city district, and other one in the new area of Binhai. Figure 2e shows the distance to the markets in Tianjin city. The markets are distributed mainly over the five old districts; only one market is located in the mountains region.
2.7. Model Validation
In order to ensure that the Markov model and CA model were valid for simulation, Cohen’s kappa coefficient was calculated [29]. Cohen’s kappa measures the agreement between two raters. This approach is useful for identifying the degree that the cells are identical in two maps [30]. K is measured as follows:
where:
- The relative observed agreement among layers
- The hypothetical probability of chance agreement
Nowadays, the kappa result is not very well recognized [31]. In this study, in order to evaluate the simulation result in 2015 whether it is correct or not, we also used the figure of merit (FoM) [32]. We compared the three maps (2005 and 2015 maps as reference maps and the simulation map in 2015) for model validation [33] and calculated the hits (H), observed change correctly predicted as change, misses (M), observed change incorrectly predicted as persistence, false alarms (F), and observed persistence incorrectly predicted as change.
In order to check the quantification of map similarities and dissimilarities, the Map Comparison Kit (MCK) was used in this study [29]. The MCK is software used for map comparison. The K-histogram is defined as the expected agreement given distribution of class size. The K-location is defined as the maximum agreement given the distribution of class sizes. The K-simulation is defined as the size of class transitions.
2.8. Annual Urban Growth Rate
In order to directly reflect the change speed of LULC, the annual urban growth rate was employed [34]. In this analysis, the value of the urban growth rate () means the condition stability in this land use type.
2.9. Simulation of LULC in 2025 and 2035
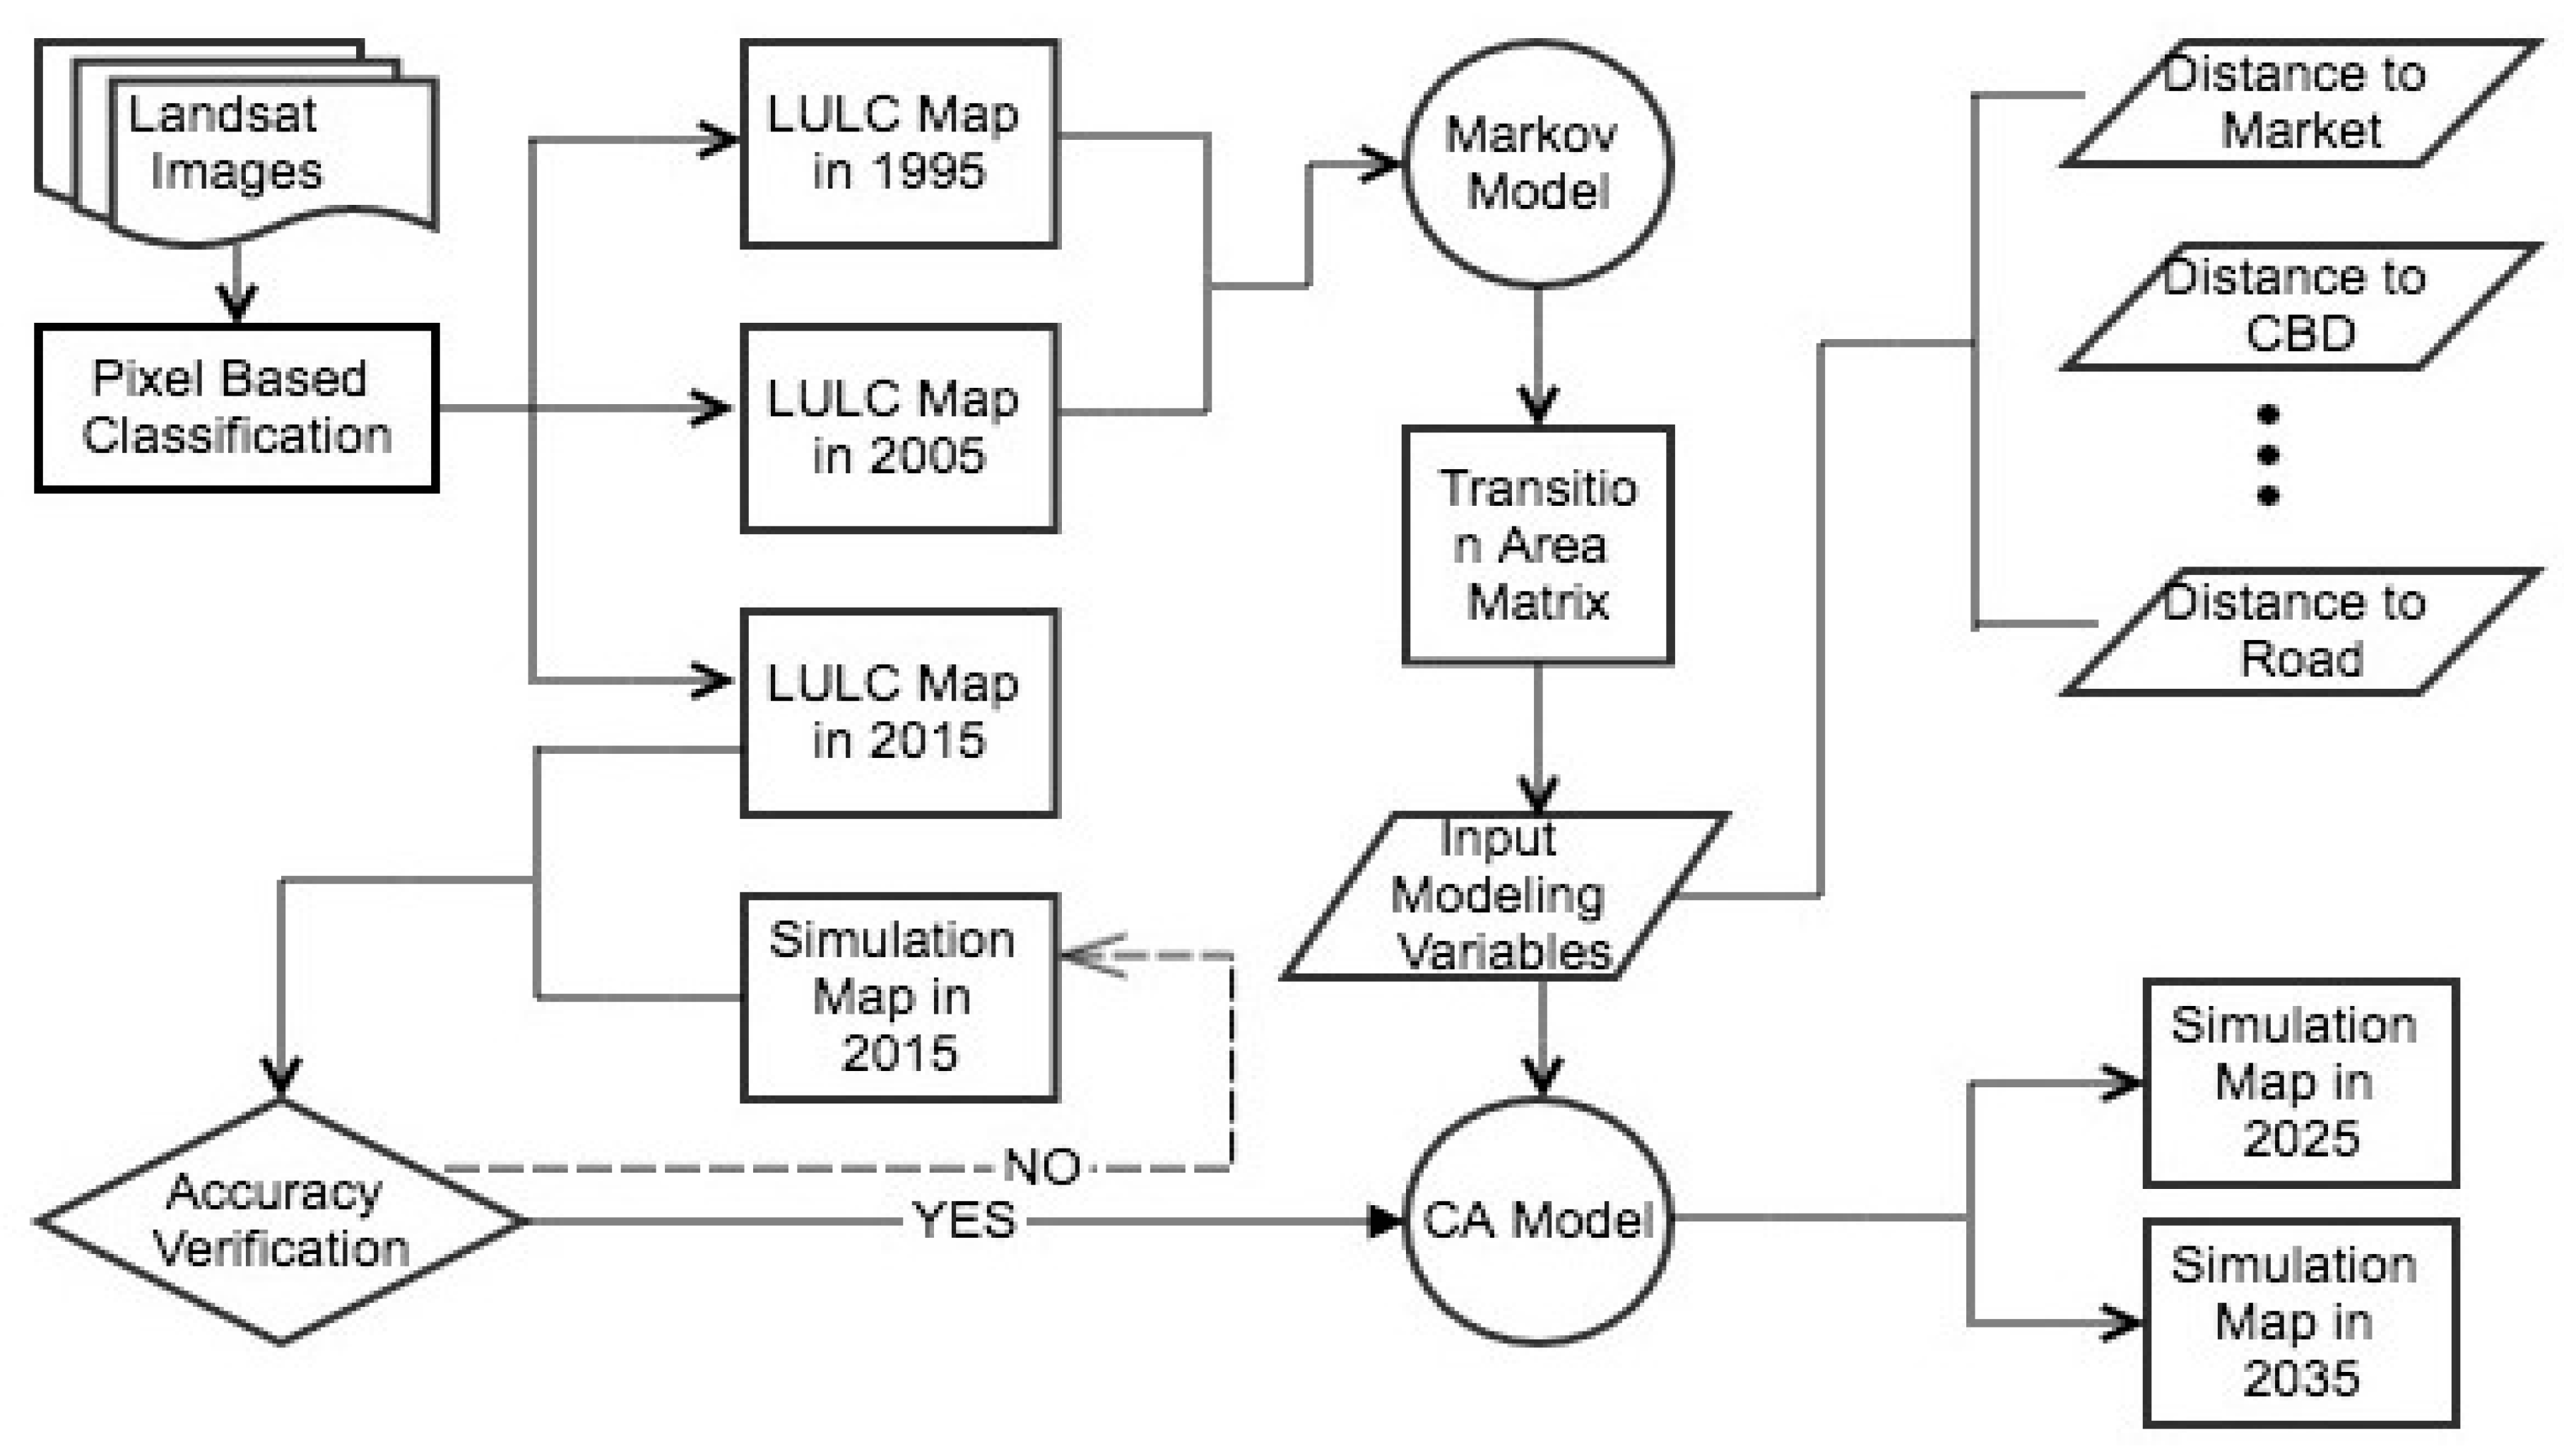
This section presents the modeling process of future LULC with the interactions of modeling variables. The process of simulation that was followed in urbanization modeling is shown in Figure 3. First, we used Landsat images to perform pixel-based classification in ArcGIS software; this was compared with the Google images to make sure that accuracy was acceptable. After that, we input the LULC maps in 1995 and 2005 into the Markov model, and calculated the transition area matrix from 1995 to 2015. Then, we input the modeling variables, such as distance to roads and distance to CBDs. Afterwards, we used the CA model to simulate the LULC map in 2015, and compared it with the real LULC map of the same year. If the result was within the tolerance, we used the CA model to generate the simulation maps of 2025 and 2035.
3. Results
3.1. LULC Mapping
Figure 4 shows the LULC maps for Tianjin city (1995, 2005 and 2015) and the detected LULC change maps from 1995 to 2005 and 2005 to 2015. Table 2 presents the statistics results in LULC classification. During 1995 to 2015 (Figure 4a–c), the built-up areas in the valley had a noticeable increase and spread to the hub area. However, the cropland areas decreased. A vast amount of cropland had been changed into built-up areas. Figure 4d shows the comparison map between 1995 and 2005; the brown areas illustrate other LULC categories changed into built-up areas. In 1995, the built-up category in Tianjin city had an area of 1537.92 km2; after ten years there were 2329.44 km2 in Tianjin city. The cropland area was decreased by 624.85 km2 from 1995 to 2005. However, even though this kind of land use decreased from 1995 to 2015, cropland areas still cover half of the Tianjin city. In the Figure 4e, the built-up area was extended around the city center from 2005 to 2015, and increased with an annual rate at 2.64%. Because paddy fields are considered as a part of water land use, the total area of water decreased. Furthermore, a small change was observed in the forest areas located mainly in the north of the study area.
3.2. Assessing the Accuracy of LULC Maps
To access the reliability of the resulting LULC maps, an accuracy assessment was performed [35,36]. The accuracy of the land-use classification was checked with 500 random sample points for Built-up, Cropland, Grass, Forest and Water [37]. Google images were used (December 1995, December 2005, and December 2015). The overall accuracy was calculated separately for each time point (1995, 2005 and 2015) [38]. The result accuracies of the accuracy assessment of the LULC classification were 77.4%, 79.6% and 76.8% for 1995, 2005, and 2015, respectively [39]. (See Appendix A for more details).
3.3. Land Use Type Transition Matrix
Statistics and the transition matrix are important components of information used to analyze the temporal and spatial dimensions of LULC changes. Table B1 and Table B2 show the transition probability matrix in LULC from 1995 to 2005 and 2005 to 2015, respectively (See Appendix B for more details). The transition probability matrix records the probability at which each LULC category will change to every other category over the specified number of time-periods. According to the statistics obtained, as a percentage of the total landscape, from 1995 to 2005, 83.22% of the built-up areas remained stable, and 12.98% of cropland changed into built-up areas. An interesting point is that 14.55% of built-up areas changed into cropland. The reason behind this is that in China, per capita cultivated land areas are less than 40% of the world average. While cropland areas have been declining because of urbanization, rapid population growth and per capita food consumption has increased. Moreover, with income increase, the food consumption structure of Chinese people is involved as well. Meat and dairy products constitute a larger proportion of people’s diet than ever before. Based on the experience from western countries and other high-income Asian countries, this trend will not be altered in the near future. As a result, more agricultural products are in demand. Although the output of agricultural products, especially crops, has grown continuously over the past decades, the Chinese agriculture sector faces potential risks that may undermine the productivity of land, such as soil degradation and pollution. In order to keep food security at the national level, the Chinese government has enforced cropland area maintenance through a balance strategy to maintain the overall cropland at or above a threshold of 120 million hectares [2]. In suburban and rural areas, reconstruction programs have been established in recent years. With more scientific-based and land-saving designs, certain previously built-up land has been reclaimed into cropland. The water area has decreased by 23.02%, and water area has also been changed into cropland.
Similarly, the transition probability matrix output from 2005 to 2015 is given in Table B2. It was found that 81.44% of the built-up area remained with no change during this time-period. Also, 14.72% of cropland changed into built-up areas in light of urbanization and industrialization. The phenomena of water to cropland transformation and vice versa also occurred during the 2005 to 2015 period, also because the classification of water included paddy fields. Table 3 shows the rate of changes for LULC over two time periods. Great changes took place in grassed areas, the annual LULC rate of change between 1995 and 2005 was 2.91%; from 2005 to 2015 grassed areas decreased at an annual rate of 3.23%. Built-up areas increased at an annual rate of 3% from 1995 to 2015. The rate of change for this category is faster than all other LULC classes. In the same period, the cropland category decreased at an annual rate of 1%, due to urban development.
3.4. Model Validation
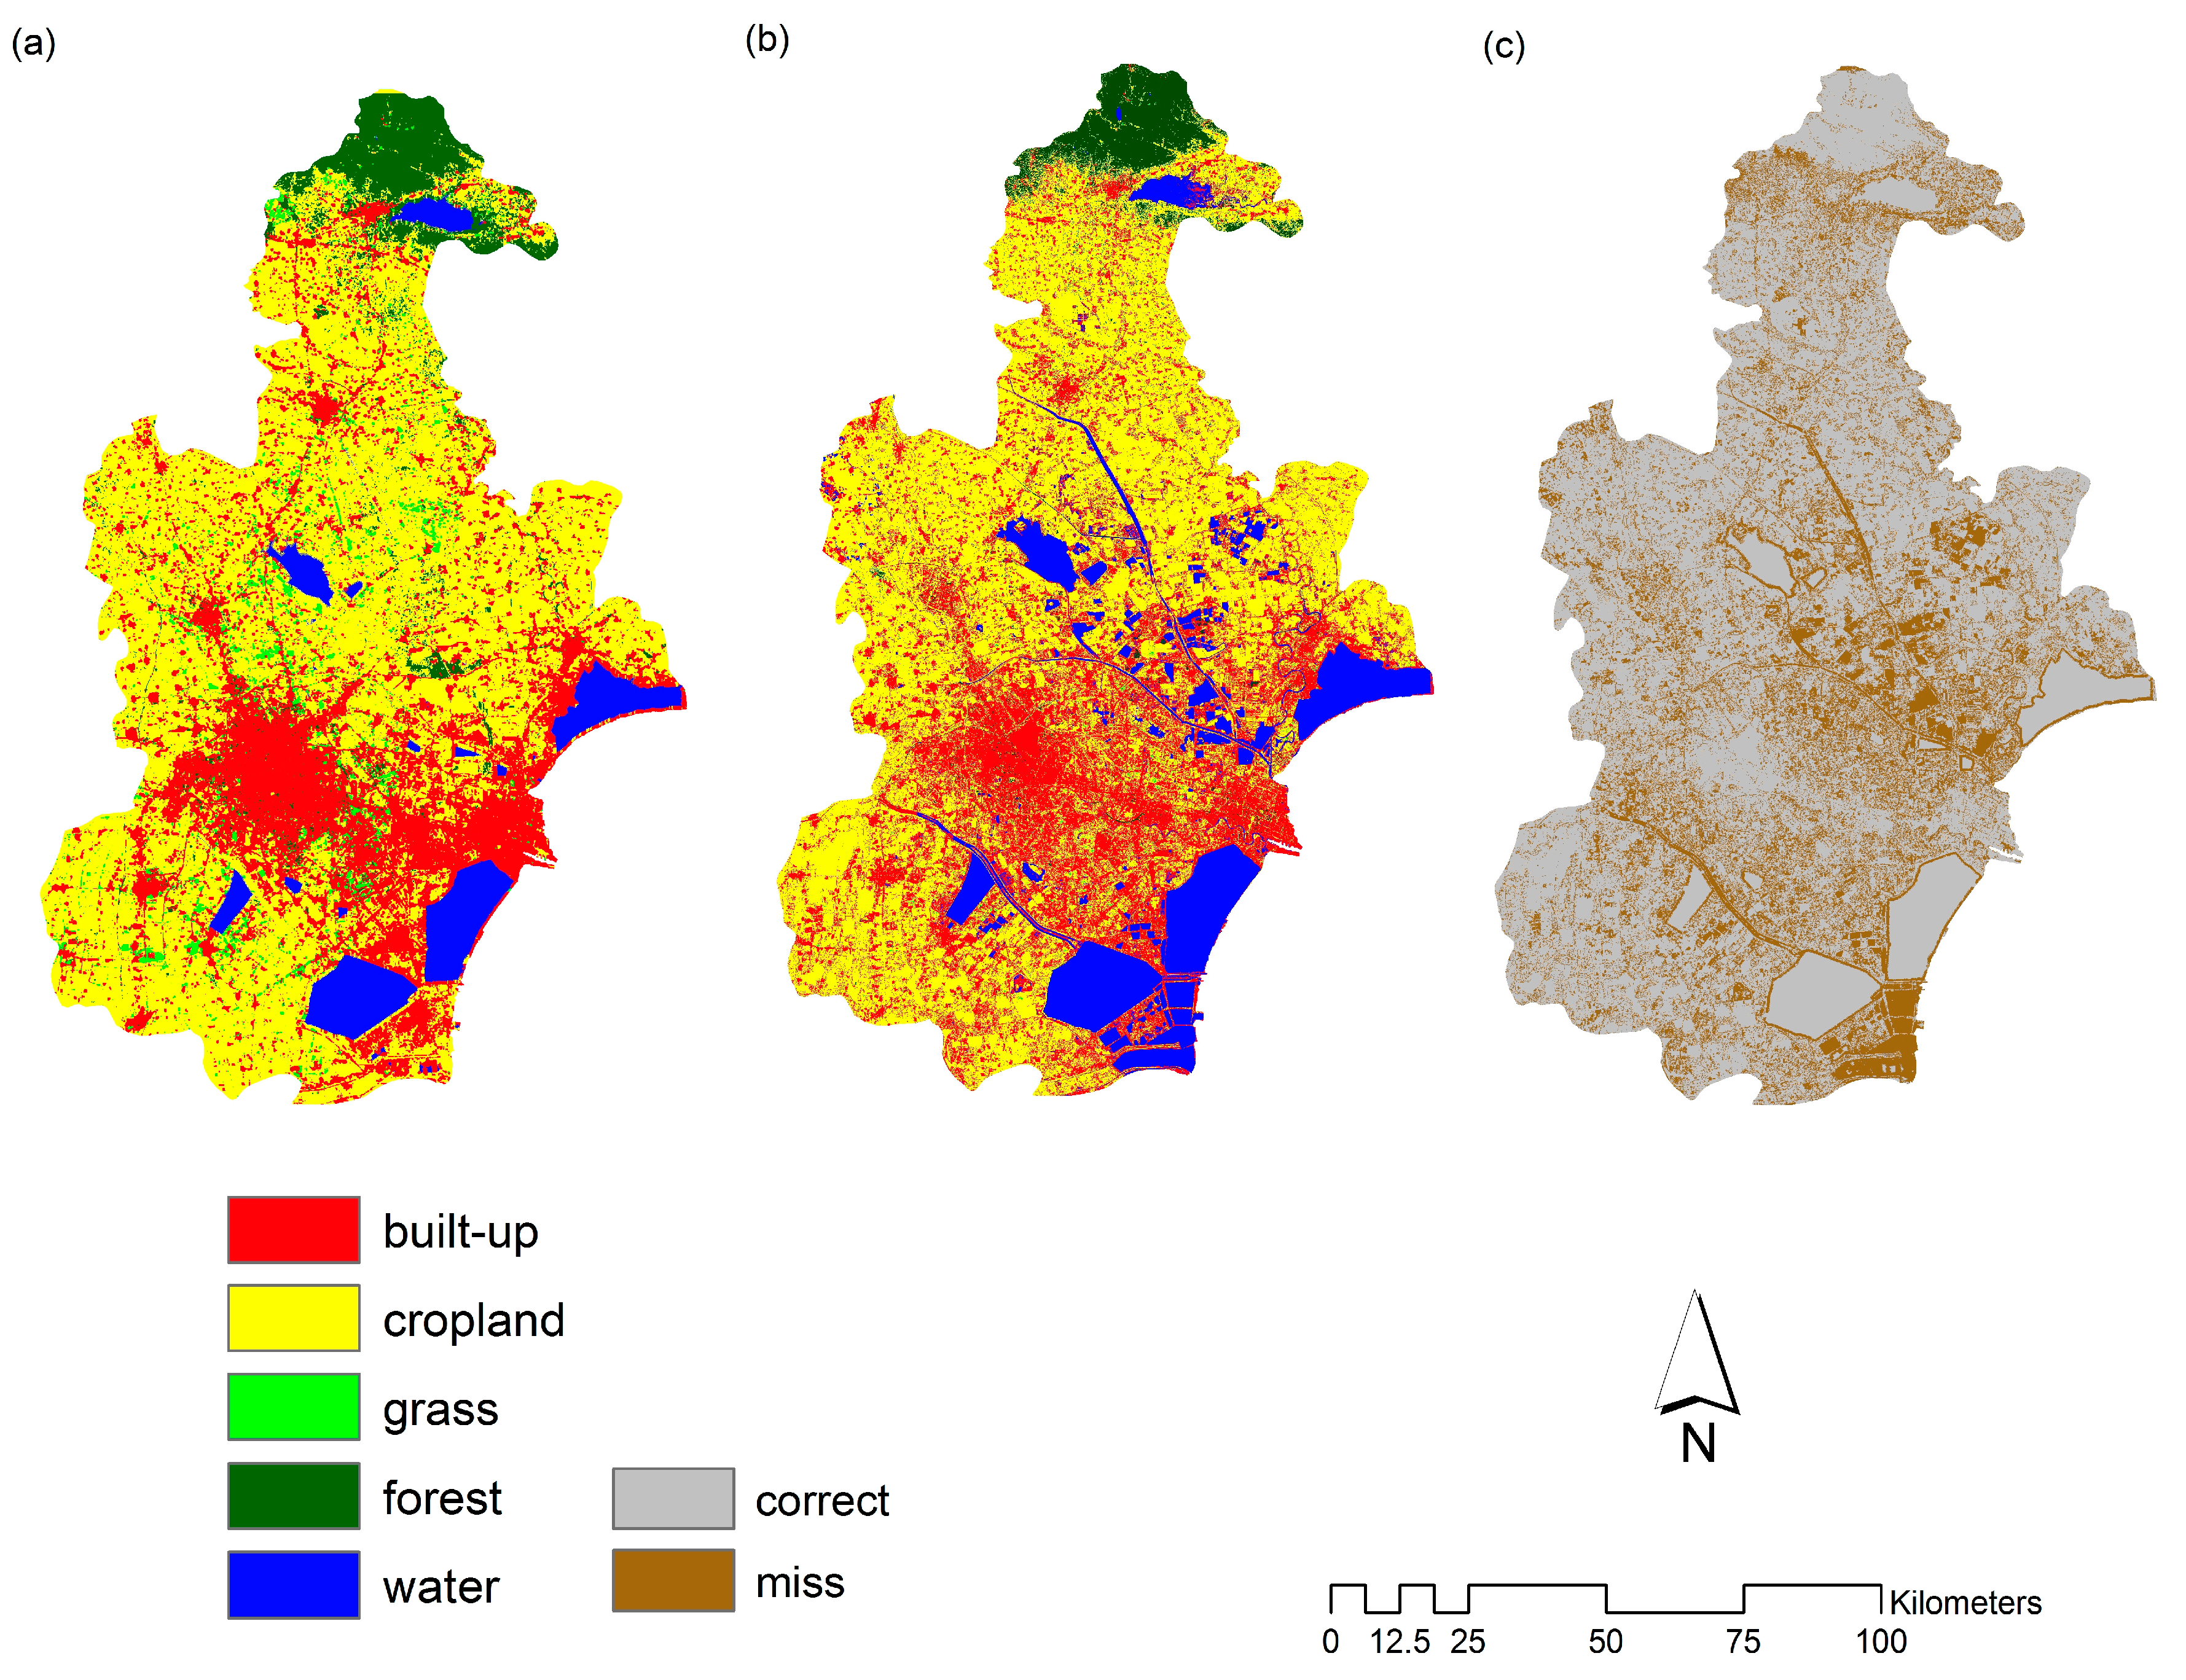
In order to test the goodness of the model, we evaluated the extent at which the simulation map and the actual LULC map were similar. Before evaluating the K coefficient, the simulation map in 2015 was derived based on the Markov model and the observed spatial data from 1995 and 2005. Figure 5 showed the actual map in 2015, the simulation map in 2015, and the comparison map between the actual map and simulation map. From Figure 5a,b, we found that they were very similar, but not the same. By comparing two maps, the result of the kappa value was 72.29%, which was a reasonable result from this study.
In order to compare the actual map in 2015, and simulation map for 2015, the FoM formula was used to calculate the FoM value, the result being 14.73%. Compared with other papers, the FoM value is above 30%, but this was from considering only two classes in LULC; for our research, there were 5 LULC categories with a FoM of 14.73%. This value demonstrated that the simulation result was well recognized [16].
Due to the kappa value not being acceptable in recent years, we calculated the K-simulation value. Using MCK software and the actual and simulation maps of 2015 as inputs, we obtained the values of K-histogram, K-location and K-simulation as 0.83, 0.86 and 0.51 respectively. According to these values, the simulation result was acceptable.
3.5. LULC Simulation of 2025 and 2035
Figure 6 shows the simulated LULC maps of Tianjin city of 2025 and 2035, and the change map from 2025 to 2035. The major roads and subways in the study area will have an enormous influence on urban growth in the near future. In general, the built-up area will extend to 2–3 times its previous coverage. The main direction for its expansion will be towards the hub. As the expansion of built-up area is at the cost of other land types, the cropland will decrease by a wide margin and will become built-up areas, since cropland is the easiest class be transformed. The forest area will remain stable. Only a small change expected to be occurred in the water area. The main reason behind this is that the water category included paddy fields in this investigation.
4. Discussion
4.1. Trend of LULC in Tianjin and China
The LULC map in 1995, 2005, and 2015 showed that built-up areas increased continuously and steadily. In 1995, built-up areas were concentrated only in the center of Tianjin city. In 2005, built-up areas in center expanded and it started to grow in harbor areas, along with the coastal line. The expansion in harbor area was accompanied by the establishment and development of Binhai District, which is regarded as the sub-center of Tianjin city. Notably, urban areas sprawl along one of the main rivers in Tianjin, Haihe. Consequently, the main urban area and the newly developed built-up areas in coastal regions are connected. In 2015, built-up areas further extended. As a result, built-up areas in these two regions have integrated as a whole, ranging from central regions to the harbor.
As shown by the simulated LULC maps in 2025 and in 2035, built-up areas will further grow. A large quantity of cropland will be converted into built-up regions. These changes will mainly take place in the southeast part. This is understandable since Tianjin city is one of the main harbor cities in northern China. The proximity to coastal regions improves access to transport infrastructure.
The LULC change in Tianjin city is just a sample of what has happened in the whole country during the past several decades. After China’s reform and establishment of opening-up policies in the 1980s, LULC change in China has been dramatic, together with economic development, industrialization, and the relaxation of Hukou system, which restricts the mobility of populations across regions. Each year, millions of rural populations settle down in urban areas. In 2015, the urbanization rate in China reached 56.10% from 35.39% in 2000. Such a trend is expected to continue, based on the experience of other countries. It is widely believed that the urbanization rate will be around 70% to 80% if economic growth continues. Therefore, LULC change will be lasting, along with urbanization.
However, from a nationwide perspective, such transformation is not homogeneous. Due to the uneven distribution of public resources such as education, medical care, and amenities, populations are mainly attracted to metropolitan areas. As a consequence, LULC change in big cities is more pronounced and rapid [40]. Tianjin, as one of the four municipalities, is a popular destination for rural residents moving to urban areas. Therefore, LULC change in Tianjin will also be huge, due to ongoing urbanization.
4.2. Methodological Issues
The CA model is an essential method for analyzing LULC changes and urban growth. Compared with other studies investigating urban growth, the adoption of the CA model in this context proved to be appropriate, based on its excellent performance. Research also exists in the literature that adopt CA model. For example, in one study investigating Logan city, Australia, researchers combined the self-adaptive genetic algorithm (SAGA) and the CA model to simulate urban growth using SAGA transition rules and spatial analysis in the CA model, and yielded a FoM value of 7.5% [41]. In our study, we obtained a FoM value of 14.73% with five categories in Tianjin city. In addition, the values of K-histogram, K-location and K-simulation were found to be 0.83, 0.86 and 0.51. All these indices suggest that the CA model was suitable for the study area and our dataset.
Without the adoption of spatial analyzing models, such as the CA model, traditional LULC research focusing on category change only derives numeric results. For example, in one study investigating LULC along Jinsha River, China, researchers combined statistical factors into their economic model and calculated the statistical result of LULC changes [42]. In order to produce better simulations for urbanization, spatial distribution should not be neglected. In our study, we implemented the CA model, integrated with the Markov model to successfully account for spatial dimensions.
Although the CA model has several merits, it suffers from certain limitations. As an example, if LULC in the far future is projected, almost all categories will end up changing into built-up areas since the CA model assumes a constant transition probability. In this simulation of LULC by the CA model, all point in the near or far future could only be based on the actual conditions of 2005 and 2015. However, these were the periods when urbanization speed in Tianjin was the highest. Such a high change of rate is not likely to persist in the long run. This trend will slow down inevitably such that the CA model is not capable of capturing the “dynamics of dynamics”. Nevertheless, despite the above limitation, using the Markov model and the CA model is still a useful method for simulating LULC conditions in the near future, and the results are critical for making urbanization plans.
4.3. Potential Implications of LULC Change
LULC change in 1995, 2005 and 2015 revealed that a large amount of cropland was converted into built-up areas. Simulation results for 2025 and 2035 also suggest that such a trend will continue in the near future. Although our study only focuses on Tianjin city, such a phenomenon prevails nationwide in China. The fast expansion of urban areas will bring about challenges in several aspects.
First of all, the construction of built-up areas is mainly at the cost of cropland. The farming population is also decreasing along with urbanization. For a country whose farmland per capita is below half the world average, the decline in farmland will undermine the food security of China. It may even influence the world food market if domestic production cannot meet global demands. Considering the large size of the Chinese population, such implications could be huge worldwide. In the last decade, the import volume of agricultural products and food has increased continuously. China has become the main buyer for certain agricultural commodities, such as soybean. Under such circumstances, improving agriculture productivity and maintaining food self-sufficiency is vital for the food security of China, and for the world.
Second, the change in land cover might influence the city climate. Evidence exists that urbanization advances the start of the growing season, and postpones the end of the growing season, prolonging the growing season length [43]. In the past half century, wetlands in Tianjin city have vanished dramatically. The ongoing urbanization process will further induce the reduction of green land, which makes the city vulnerable to the urban heat island effects.
Moreover, urbanization will increase the demand for water and sewage disposal capacity. Northern China has long suffered from water shortage. Although projects transferring water from the south to the north have been implemented two decades ago, water resources are still limited in these regions. It will be especially challenging for Tianjin, since its per capita water availability is the lowest among all provinces. Under such circumstances, measures that improve water usage efficiency, such as water reclamation, should be taken into consideration in city planning.
Finally, urban sprawl is a major driving force that increases non-point source pollution [44]. In recent years, in the North China Plain, where Tianjin city is located, air pollution, such as PM 2.5, has intensified significantly. This imposes damage to the health of residents, and reduces the living quality of people tremendously. High population density, industry production, and traffic in urban areas contribute substantially to these pollutions. Given that the urbanization in Tianjin city will be dramatic, such concerns should be made aware to city planners.
5. Conclusions
LULC changes show the track of urbanization, and the LULC condition depends on the composition of the urban spatial form. Urban land management and urban planning, as well as ecosystem monitoring, closely rely on precise and timely information about LULC changes in urban areas. The urbanization model, complemented with GIS and remote sensing techniques, is an essential part of analyzing the trend of spatial LULC changes.
Due to the large population and rapid economic growth in China, LULC changes at an unexpected rate [45]. To better understand the process and driving force of LULC in countries experiencing rapid urbanization, this study investigated historical land cover transitions and simulated future LULC changes in Tianjin city, China, with CA and Markov models.
In this study, the landscape of LULC in 1995, 2005, and 2015 was shown. It revealed that the LULC in Tianjin city had been changing at a very fast speed during 1995 to 2005, with the main change centering on cropland and built-up areas. With the acceleration of urbanization and industrialization, the built-up areas expanded at a high rate. Meanwhile, small amounts of cropland, as well as other LULC types, were changed into built-up areas.
Using the CA and Markov models as workhorses, the urbanization model was estimated and integrated with modeling variables. Before using this model to simulate future LULC, validation checks were performed. Following the literature, the kappa coefficient was employed for such a purpose [3]. Comparing the actual land cover and the simulated one in 2015, the kappa metric yielded a result of 72.29%, which suggests good fitness of the model and validated its usage for simulating LULC for future time points.
Based on the model derived previously, future land cover in 2025 and 2035 were simulated and shown in Figure 6. From the simulation map in 2025 and 2035, it was found that the built-up area will expand to 2–3 times what it was before. The expansion will mainly take place in the central and southeast area, which is mainly coastal. The north and southwest region is scattered with converted build-up areas, with the dominant land type still being cropland. Certain water areas will be transformed into built-up areas, which are expected, since paddy fields were categorized as water areas. The very northern area will remain occupied by forest. Our analysis contributes to the understanding of the development process in the Tianjin area, which will facilitate future planning, as well as constraining the potential negative consequences brought about by future LULC changes.
There are some potential directions through which our study could be improved. To alleviate the limitations that the CA model has, further investigations need to be carried out to better under the LULC process and provide more informative policy implications.
Acknowledgments
The authors wish to thank USGS for providing LANDSAT data. We also appreciate Matamyo Simwanda, University of Tsukuba, and the anonymous reviewers for their constructive comments and suggestions, which substantially improved our work.
Author Contributions
Ruci Wang and Yuji Murayama together conceived the idea and research design of this study. Ruci Wang collects the data, performed data analysis and wrote the manuscript. Yuji Murayama supervised the whole study and polished the manuscript.
Conflicts of Interest
The authors declare no conflict of interest.
Appendix A

Table A1.
Error matrix for the classified 1995 LULC map.
| Classified Data | Reference Data | Total | User’s Accuracy (%) | ||||
|---|---|---|---|---|---|---|---|
| Built-Up | Cropland | Grass | Forest | Water | |||
| Built-up | 87 | 4 | 7 | 1 | 1 | 100 | 87 |
| Cropland | 4 | 80 | 7 | 6 | 3 | 100 | 80 |
| Grass | 8 | 13 | 58 | 19 | 2 | 100 | 58 |
| Forest | 3 | 4 | 11 | 80 | 2 | 100 | 80 |
| Water | 1 | 7 | 10 | 0 | 82 | 100 | 82 |
| Total | 103 | 108 | 93 | 106 | 90 | 500 | |
| Producer’s accuracy (%) | 84.47 | 74.07 | 62.37 | 75.47 | 91.11 | ||
Table A2.
Error matrix for the classified 2005 LULC map.
| Classified Data | Reference Data | Total | User’s Accuracy (%) | ||||
|---|---|---|---|---|---|---|---|
| Built-Up | Cropland | Grass | Forest | Water | |||
| Built-up | 87 | 2 | 11 | 0 | 0 | 100 | 87 |
| Cropland | 4 | 80 | 11 | 5 | 0 | 100 | 80 |
| Grass | 7 | 17 | 57 | 19 | 0 | 100 | 57 |
| Forest | 0 | 5 | 8 | 87 | 0 | 100 | 87 |
| Water | 0 | 4 | 6 | 3 | 87 | 100 | 87 |
| Total | 98 | 108 | 93 | 114 | 87 | 500 | |
| Producer’s accuracy (%) | 88.78 | 74.07 | 61.29 | 76.32 | 100 | ||
Table A3.
Error matrix for the classified 2015 LULC map.
| Classified Data | Reference Data | Total | User’s Accuracy (%) | ||||
|---|---|---|---|---|---|---|---|
| Built-Up | Cropland | Grass | Forest | Water | |||
| Built-up | 83 | 6 | 7 | 3 | 1 | 100 | 83 |
| Cropland | 5 | 78 | 8 | 6 | 3 | 100 | 78 |
| Grass | 9 | 15 | 59 | 17 | 0 | 100 | 59 |
| Forest | 3 | 4 | 11 | 80 | 2 | 100 | 80 |
| Water | 2 | 7 | 7 | 0 | 84 | 100 | 84 |
| Total | 102 | 110 | 92 | 106 | 90 | 500 | |
| Producer’s accuracy (%) | 81.37 | 70.91 | 64.13 | 75.47 | 93.33 | ||
Appendix B
Table B1.
Matrix of transition probability in LULC, 1995–2005 (%).
| LULC in 1995 | LULC in 2005 | ||||
|---|---|---|---|---|---|
| Built-up | Cropland | Grass | Forest | Water | |
| Built-up | 83.22 | 14.55 | 1.60 | 0.31 | 0.33 |
| Cropland | 12.98 | 84.59 | 0.84 | 0.10 | 1.50 |
| Grass | 4.81 | 9.10 | 75.60 | 1.48 | 9.01 |
| Forest | 1.15 | 16.46 | 1.03 | 79.60 | 1.76 |
| Water | 0.80 | 23.02 | 0.88 | 1.56 | 73.74 |
Table B2.
Matrix of transition probability in LULC, 2005–2015 (%).
| LULC in 2005 | LULC in 2015 | ||||
|---|---|---|---|---|---|
| Built-up | Cropland | Grass | Forest | Water | |
| Built-up | 81.44 | 15.50 | 0.32 | 0.77 | 1.98 |
| Cropland | 14.72 | 82.48 | 0.34 | 0.88 | 1.58 |
| Grass | 1.03 | 38.54 | 56.79 | 2.84 | 0.79 |
| Forest | 2.74 | 17.22 | 0.19 | 78.62 | 1.23 |
| Water | 1.23 | 11.40 | 0.22 | 1.89 | 85.25 |
References
- Seto, K.C.; Fragkias, M.; Güneralp, B.; Reilly, M.K. A meta-analysis of global urban land expansion. PLoS ONE 2011, 6, e23777. [Google Scholar] [CrossRef] [PubMed]
- Liu, J.; Diamond, J. China’s environment in a globalizing world. Nature 2005, 435, 1179–1186. [Google Scholar] [CrossRef] [PubMed]
- Jantz, P.; Goetz, S.; Jantz, C. Urbanization and the loss of resource lands in the Chesapeake Bay Watershed. Environ. Manag. 2005, 36, 808–825. [Google Scholar] [CrossRef] [PubMed]
- He, C.; Okada, N.; Zhang, Q.; Shi, P.; Zhang, J. Modeling urban expansion scenarios by coupling cellular automata model and system dynamic model in Beijing, China. Appl. Geogr. 2006, 26, 323–345. [Google Scholar] [CrossRef]
- White, M.D.; Greer, K.A. The effects of watershed urbanization on the stream hydrology and riparian vegetation of Los Peñasquitos Creek, California. Landsc. Urban Plan. 2006, 74, 125–138. [Google Scholar] [CrossRef]
- Mohan, M.; Kandya, A. Impact of urbanization and land-use/land-cover change on diurnal temperature range: A case study of tropical urban airshed of India using remote sensing data. Sci. Total Environ. 2015, 506, 453–465. [Google Scholar] [CrossRef] [PubMed]
- Nagendra, H.; Munroe, D.K.; Southworth, J. From pattern to process: Landscape fragmentation and the analysis of land use/land cover change. Agric. Ecosyst. Environ. 2004, 101, 111–115. [Google Scholar] [CrossRef]
- Tayyebi, A.; Pijanowski, B.C.; Tayyebi, A.H. An urban growth boundary model using neural networks, GIS and radial parameterization: An application to Tehran, Iran. Landsc. Urban Plan. 2011, 100, 35–44. [Google Scholar] [CrossRef]
- Banerjee, S.; Carlin, B.P.; Gelfand, A.E. Hierarchical Modeling and Analysis for Spatial Data, 2nd ed.; CRC Press: Boca Raton, FL, USA, 2014. [Google Scholar]
- Ma, T.; Zhou, C.; Pei, T.; Haynie, S.; Fan, J. Quantitative estimation of urbanization dynamics using time series of DMSP/OLS nighttime light data: A comparative case study from China’s cities. Remote Sens. Environ. 2012, 124, 99–107. [Google Scholar] [CrossRef]
- Taubenböck, H.; Esch, T.; Felbier, A.; Wiesner, M.; Roth, A.; Dech, S. Monitoring urbanization in mega cities from space. Remote Sens. Environ. 2012, 117, 162–176. [Google Scholar] [CrossRef]
- Dewan, A.M.; Yamaguchi, Y. Land use and land cover change in Greater Dhaka, Bangladesh: Using remote sensing to promote sustainable urbanization. Appl. Geogr. 2009, 29, 390–401. [Google Scholar] [CrossRef]
- Jenerette, G.D.; Wu, J. Analysis and simulation of land-use change in the central Arizona – Phoenix region, USA. Landsc. Ecol. 2001, 16, 611–626. [Google Scholar] [CrossRef]
- National Bureau of Statistics of China. Available online: http://data.stats.gov.cn/english/ (accessed on 23 May 2015).
- USGS Earth Explorer. Available online: http://earthexplorer.usgs.gov/ (accessed on 12 April 2015).
- Subasinghe, S.; Estoque, R.C.; Murayama, Y. Spatiotemporal analysis of urban growth using GIS and remote sensing: A case study of the Colombo metropolitan area, Sri Lanka. ISPRS Int. J. Geo-Inf. 2016, 5, 197. [Google Scholar] [CrossRef]
- Combining top-down and bottom-up dynamics in land use modeling: Exploring the future of abandoned farmlands in Europe with the Dyna-CLUE model. Available online: https://www.researchgate.net/publication/225660279_Combining_top-down_and_bottom-up_dynamics_in_land_use_modeling_Exploring_the_future_of_abandoned_farmlands_in_Europe_with_the_Dyna-CLUE_model (accessed on 24 March 2017).
- Howard, D.M.; Howard, P.J.A.; Howard, D.C. A Markov model projection of soil organic carbon stores following land use changes. J. Environ. Manag. 1995, 45, 287–302. [Google Scholar] [CrossRef]
- Guan, D.; Li, H.; Inohae, T.; Su, W.; Nagaie, T.; Hokao, K. Modeling urban land use change by the integration of cellular automaton and Markov model. Ecol. Model. 2011, 222, 3761–3772. [Google Scholar] [CrossRef]
- Jokar Arsanjani, J.; Helbich, M.; Kainz, W.; Darvishi Boloorani, A. Integration of logistic regression, Markov chain and cellular automata models to simulate urban expansion. Int. J. Appl. Earth Obs. Geoinfor. 2013, 21, 265–275. [Google Scholar] [CrossRef]
- Han, J.; Hayashi, Y.; Cao, X.; Imura, H. Application of an integrated system dynamics and cellular automata model for urban growth assessment: A case study of Shanghai, China. Landsc. Urban Plan. 2009, 91, 133–141. [Google Scholar] [CrossRef]
- Zhang, Q.; Ban, Y.; Liu, J.; Hu, Y. Simulation and analysis of urban growth scenarios for the Greater Shanghai Area, China. Comput. Environ. Urban Syst. 2011, 35, 126–139. [Google Scholar] [CrossRef]
- Mundia, C.N.; Murayama, Y. Modeling spatial processes of urban growth in African cities: A case study of Nairobi City. Urban Geogr. 2010, 31, 259–272. [Google Scholar] [CrossRef]
- Engelen, G.; White, R.; Uljee, I.; Drazan, P. Using cellular automata for integrated modelling of socio-environmental systems. Environ. Monit. Assess. 1995, 34, 203–214. [Google Scholar] [CrossRef] [PubMed]
- Ward, D.P.; Murray, A.T.; Phinn, S.R. A stochastically constrained cellular model of urban growth. Comput. Environ. Urban Syst. 2000, 24, 539–558. [Google Scholar] [CrossRef]
- Ruiz-Luna, A.; Berlanga-Robles, C.A. Land use, land cover changes and coastal lagoon surface reduction associated with urban growth in northwest Mexico. Landsc. Ecol. 2003, 18, 159–171. [Google Scholar] [CrossRef]
- Wijesekara, G.N.; Farjad, B.; Gupta, A.; Qiao, Y.; Delaney, P.; Marceau, D.J. A comprehensive land-use/hydrological modeling system for scenario simulations in the Elbow River Watershed, Alberta, Canada. Environ. Manag. 2014, 53, 357–381. [Google Scholar] [CrossRef] [PubMed]
- Li, X.; Yeh, A.G.-O. Neural-network-based cellular automata for simulating multiple land use changes using GIS. Int. J. Geogr. Inf. Sci. 2002, 16, 323–343. [Google Scholar] [CrossRef]
- van Vliet, J.; Bregt, A.K.; Hagen-Zanker, A. Revisiting Kappa to account for change in the accuracy assessment of land-use change models. Ecol. Model. 2011, 222, 1367–1375. [Google Scholar] [CrossRef]
- Ahmed, B.; Ahmed, R.; Zhu, X. Evaluation of model validation techniques in land cover dynamics. ISPRS Int. J. Geo-Inf. 2013, 2, 577–597. [Google Scholar] [CrossRef]
- Jr, R.G. P.; Millones, M. Death to Kappa: birth of quantity disagreement and allocation disagreement for accuracy assessment. Int. J. Remote Sens. 2011, 32, 4407–4429. [Google Scholar]
- Chen, H.; Pontius, R.G. Diagnostic tools to evaluate a spatial land change projection along a gradient of an explanatory variable. Landsc. Ecol. 2010, 25, 1319–1331. [Google Scholar] [CrossRef]
- Pontius, R.G.; Peethambaram, S.; Castella, J.-C. Comparison of three maps at multiple resolutions: A case study of land change simulation in Cho Don District, Vietnam. Ann. Assoc. Am. Geogr. 2011, 101, 45–62. [Google Scholar] [CrossRef]
- Xiao, J.; Shen, Y.; Ge, J.; Tateishi, R.; Tang, C.; Liang, Y.; Huang, Z. Evaluating urban expansion and land use change in Shijiazhuang, China, by using GIS and remote sensing. Landsc. Urban Plan. 2006, 75, 69–80. [Google Scholar] [CrossRef]
- Ahmed, B.; Kamruzzaman, M.; Zhu, X.; Rahman, M.S.; Choi, K. Simulating land cover changes and their impacts on land surface temperature in Dhaka, Bangladesh. Remote Sens. 2013, 5, 5969–5998. [Google Scholar] [CrossRef]
- Olofsson, P.; Foody, G.M.; Herold, M.; Stehman, S.V.; Woodcock, C.E.; Wulder, M.A. Good practices for estimating area and assessing accuracy of land change. Remote Sens. Environ. 2014, 148, 42–57. [Google Scholar] [CrossRef]
- Malek, Ž.; Scolobig, A.; Schröter, D. Understanding land cover changes in the Italian Alps and Romanian Carpathians Combining Remote Sensing and Stakeholder Interviews. Land 2014, 3, 52–73. [Google Scholar] [CrossRef]
- Olofsson, P.; Foody, G.M.; Stehman, S.V.; Woodcock, C.E. Making better use of accuracy data in land change studies: Estimating accuracy and area and quantifying uncertainty using stratified estimation. Remote Sens. Environ. 2013, 129, 122–131. [Google Scholar] [CrossRef]
- Ahmed, B.; Ahmed, R. Modeling urban land cover growth dynamics using multi-temporal satellite images: A case study of Dhaka, Bangladesh. ISPRS Int. J. Geo-Inf. 2012, 1, 3–31. [Google Scholar] [CrossRef]
- Li, T.; Bai, F.; Han, P.; Zhang, Y. Non-point source pollutant load variation in rapid urbanization areas by remote sensing, Gis and the L-THIA model: A case in Bao’an District, Shenzhen, China. Environ. Manag. 2016, 58, 873–888. [Google Scholar] [CrossRef] [PubMed]
- Liu, Y.; Feng, Y.; Pontius, R.G. Spatially-explicit simulation of urban growth through self-adaptive genetic algorithm and Cellular automata modelling. Land 2014, 3, 719–738. [Google Scholar] [CrossRef]
- Yin, R.S.; Xiang, Q.; Xu, J.T.; Deng, X.Z. Modeling the driving forces of the land use and land cover changes along the Upper Yangtze River of China. Environ. Manag. 2010, 45, 454–465. [Google Scholar] [CrossRef] [PubMed]
- Land Surface Phenology and Land Surface Temperature Changes Along an Urban–Rural Gradient in Yangtze River Delta, China (PDF Download Available). Available online: https://www.researchgate.net/publication/237060249_Land_Surface_Phenology_and_Land_Surface_Temperature_Changes_Along_an_Urban-Rural_Gradient_in_Yangtze_River_Delta_China (accessed on 22 March 2017).
- Du, S.; Shi, P.; Van Rompaey, A. The relationship between urban sprawl and farmland displacement in the Pearl River Delta, China. Land 2013, 3, 34–51. [Google Scholar] [CrossRef]
- Modeling the Driving Forces of the Land Use and Land Cover Changes Along the Upper Yangtze River of China. Available online: https://www.researchgate.net/publication/26841511_Modeling_the_Driving_Forces_of_the_Land_Use_and_Land_Cover_Changes_Along_the_Upper_Yangtze_River_of_China (accessed on 22 March 2017).
Figure 1.
Location of the study area: (a) location of China in the world; (b) location of Tianjin city in China; (c) Tianjin area. Source: Esri, DigitalGlobe, Geoeye, Earthstar Geographics, CNES/Airbus DS, USDA, USGS, AEX, Getmapping, Aerogrid, IGN, INP, swisstopo, and the GIS User Community.
Figure 1.
Location of the study area: (a) location of China in the world; (b) location of Tianjin city in China; (c) Tianjin area. Source: Esri, DigitalGlobe, Geoeye, Earthstar Geographics, CNES/Airbus DS, USDA, USGS, AEX, Getmapping, Aerogrid, IGN, INP, swisstopo, and the GIS User Community.
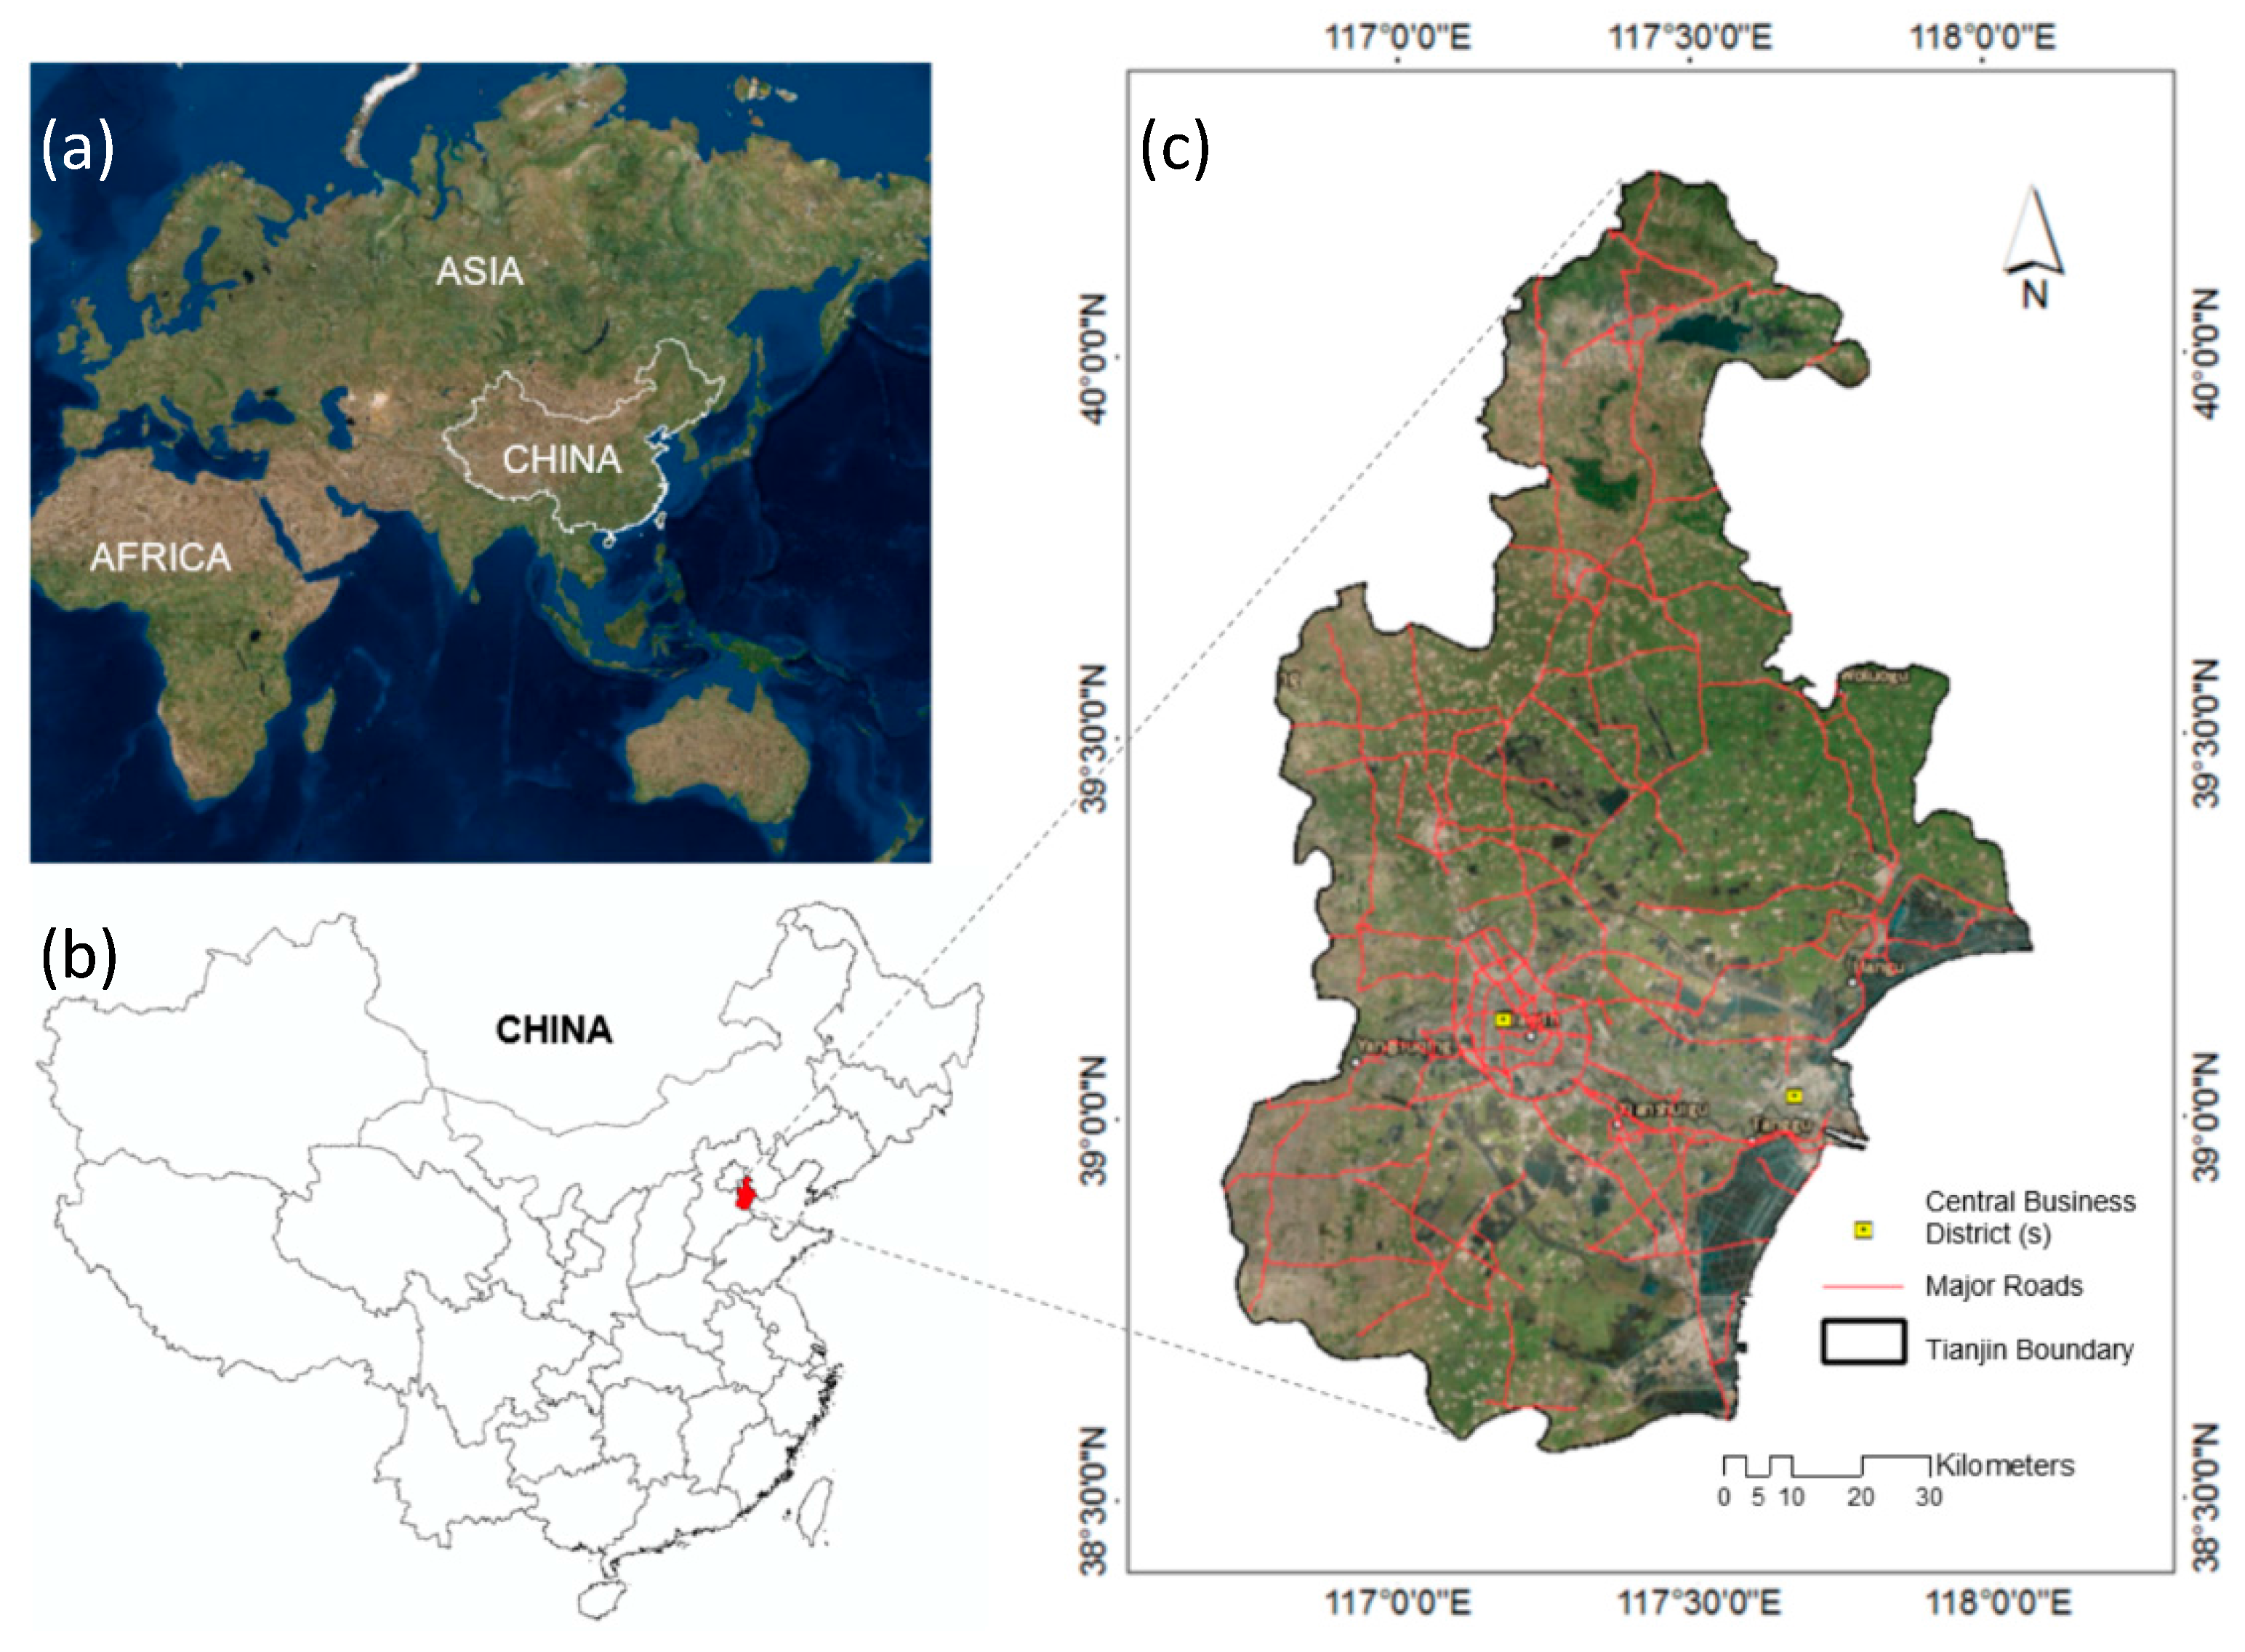
Figure 2.
Spatial patterns of five variables: (a) distance to roads; (b) distance to subways; (c) distance to the capital bus stations; (d) distance to CBDs; (e) distance to markets.
Figure 2.
Spatial patterns of five variables: (a) distance to roads; (b) distance to subways; (c) distance to the capital bus stations; (d) distance to CBDs; (e) distance to markets.
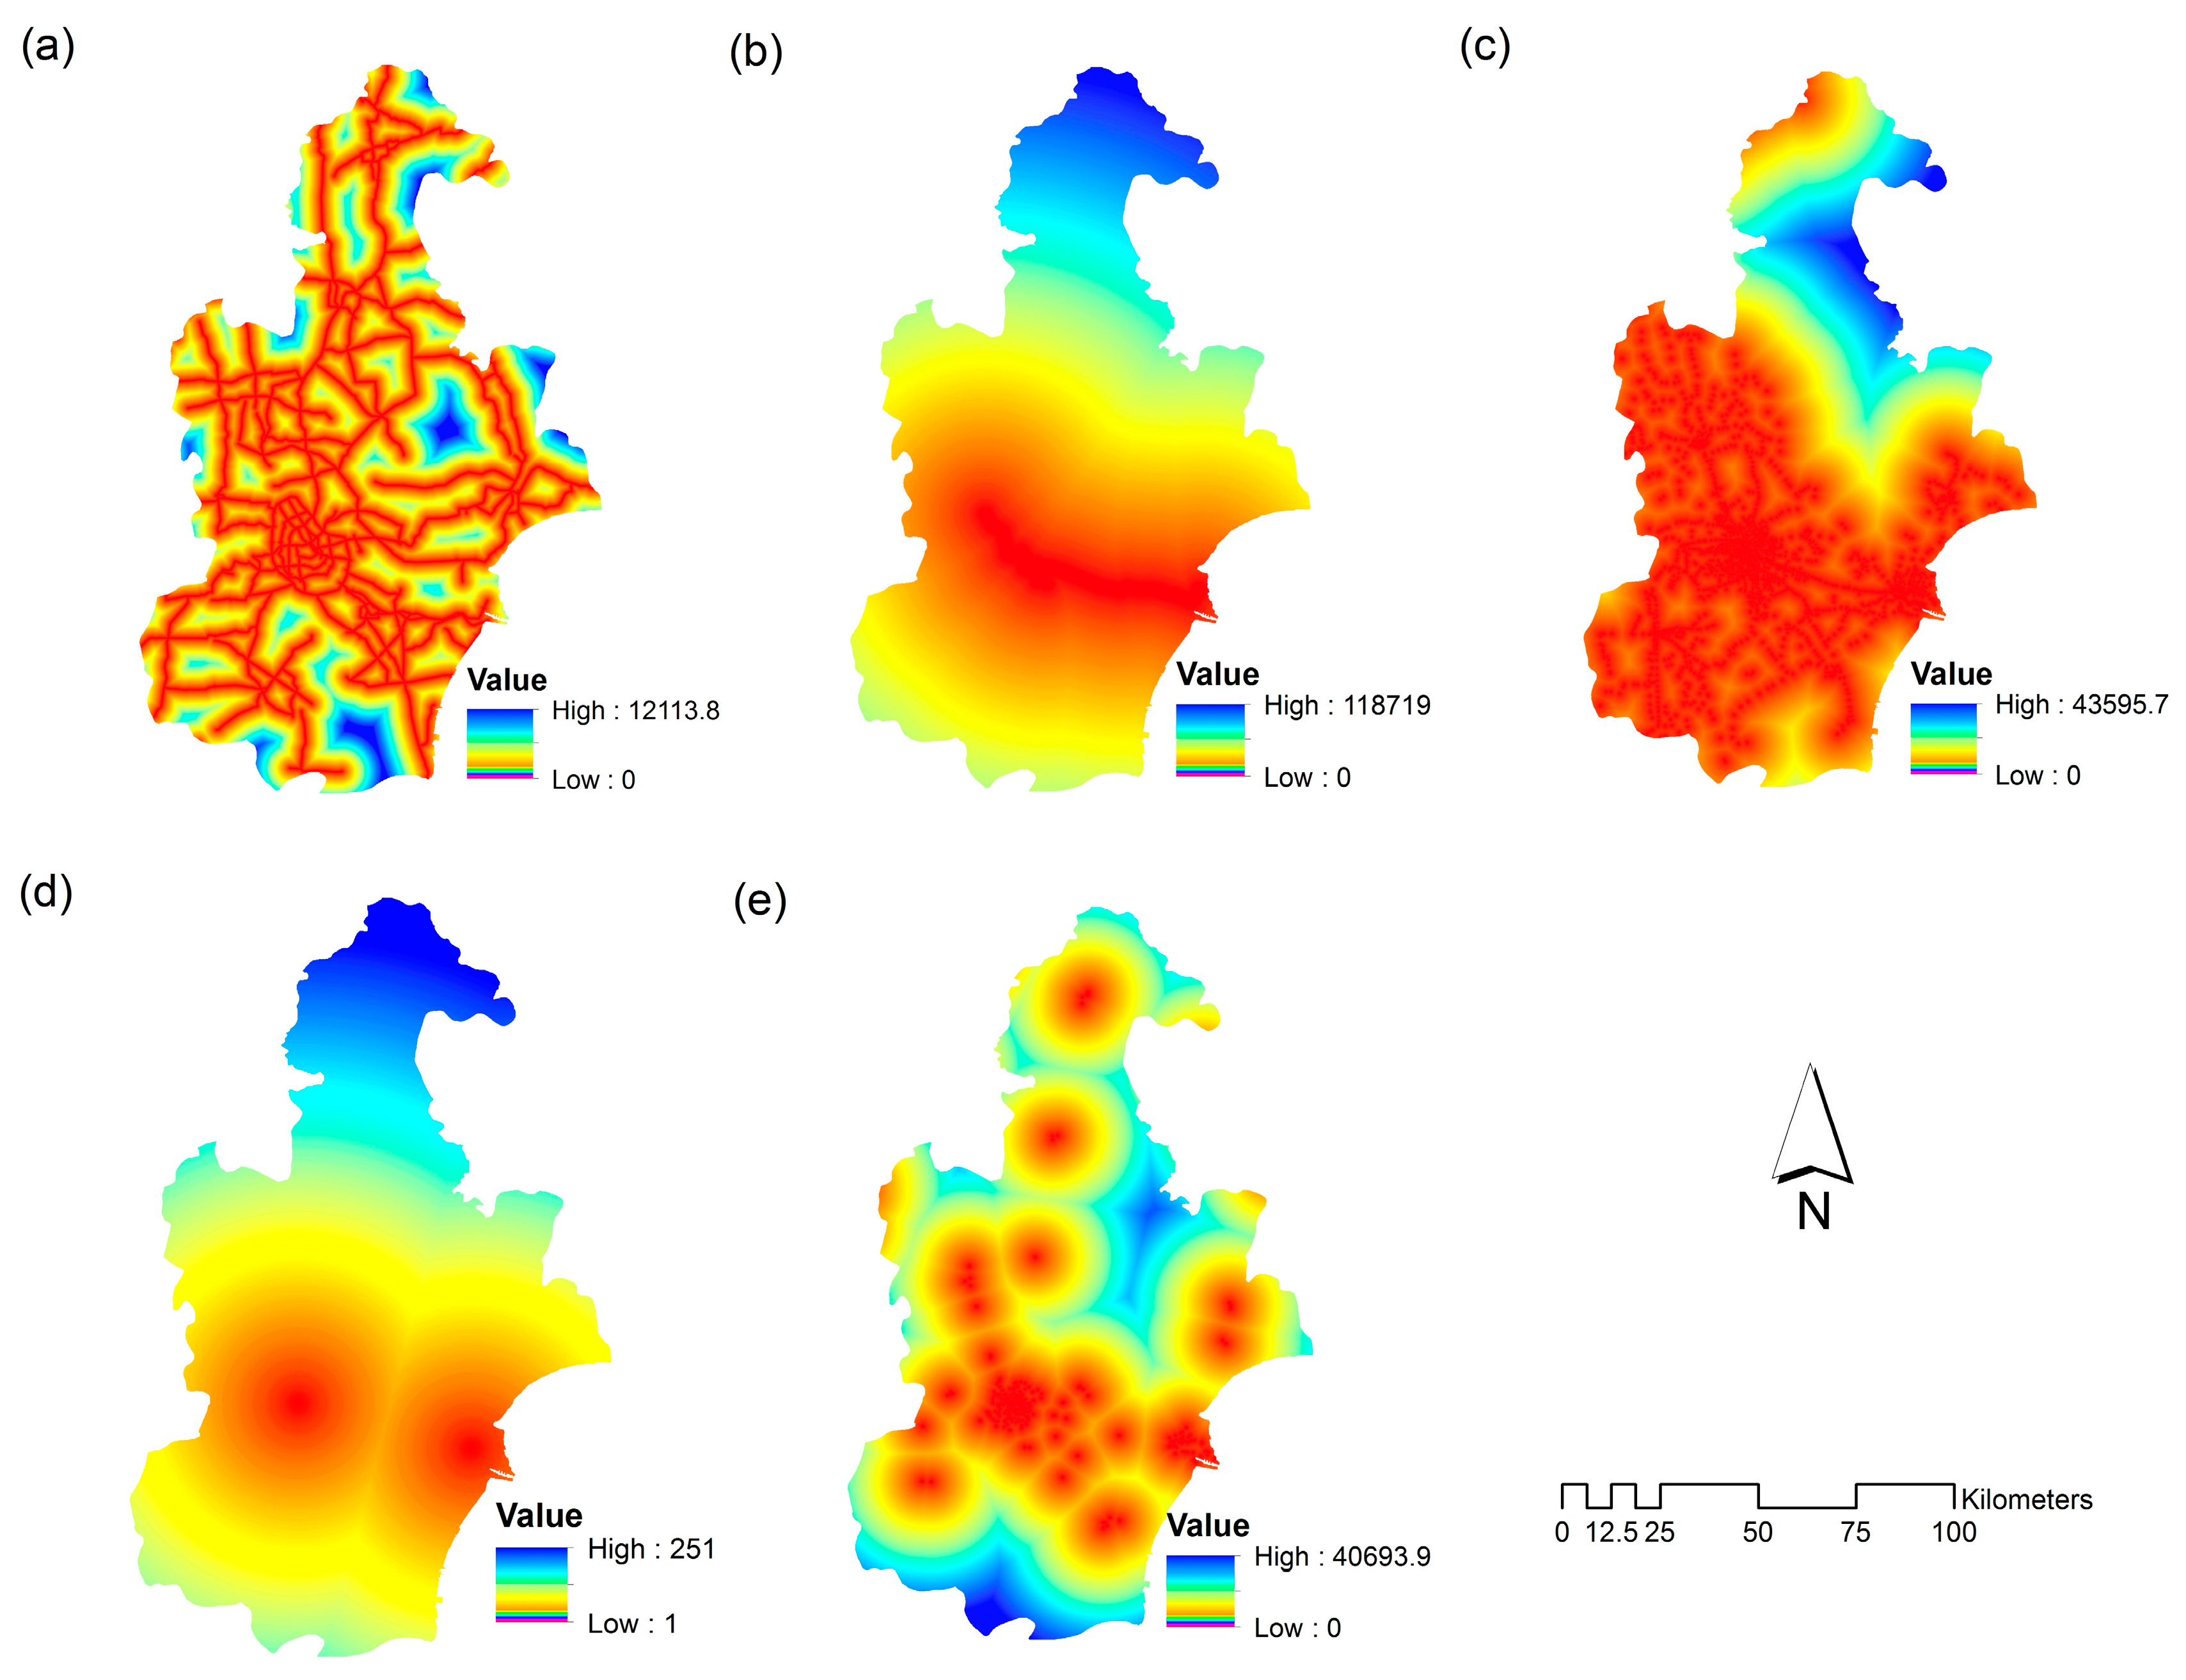
Figure 3.
Process of simulation in urbanization modeling.

Figure 4.
Land use and land cover (LULC) in 1995 (a), 2005 (b), 2015 (c), change map from 1995–2005 (d), and change map 2005–2015 (e).
Figure 4.
Land use and land cover (LULC) in 1995 (a), 2005 (b), 2015 (c), change map from 1995–2005 (d), and change map 2005–2015 (e).
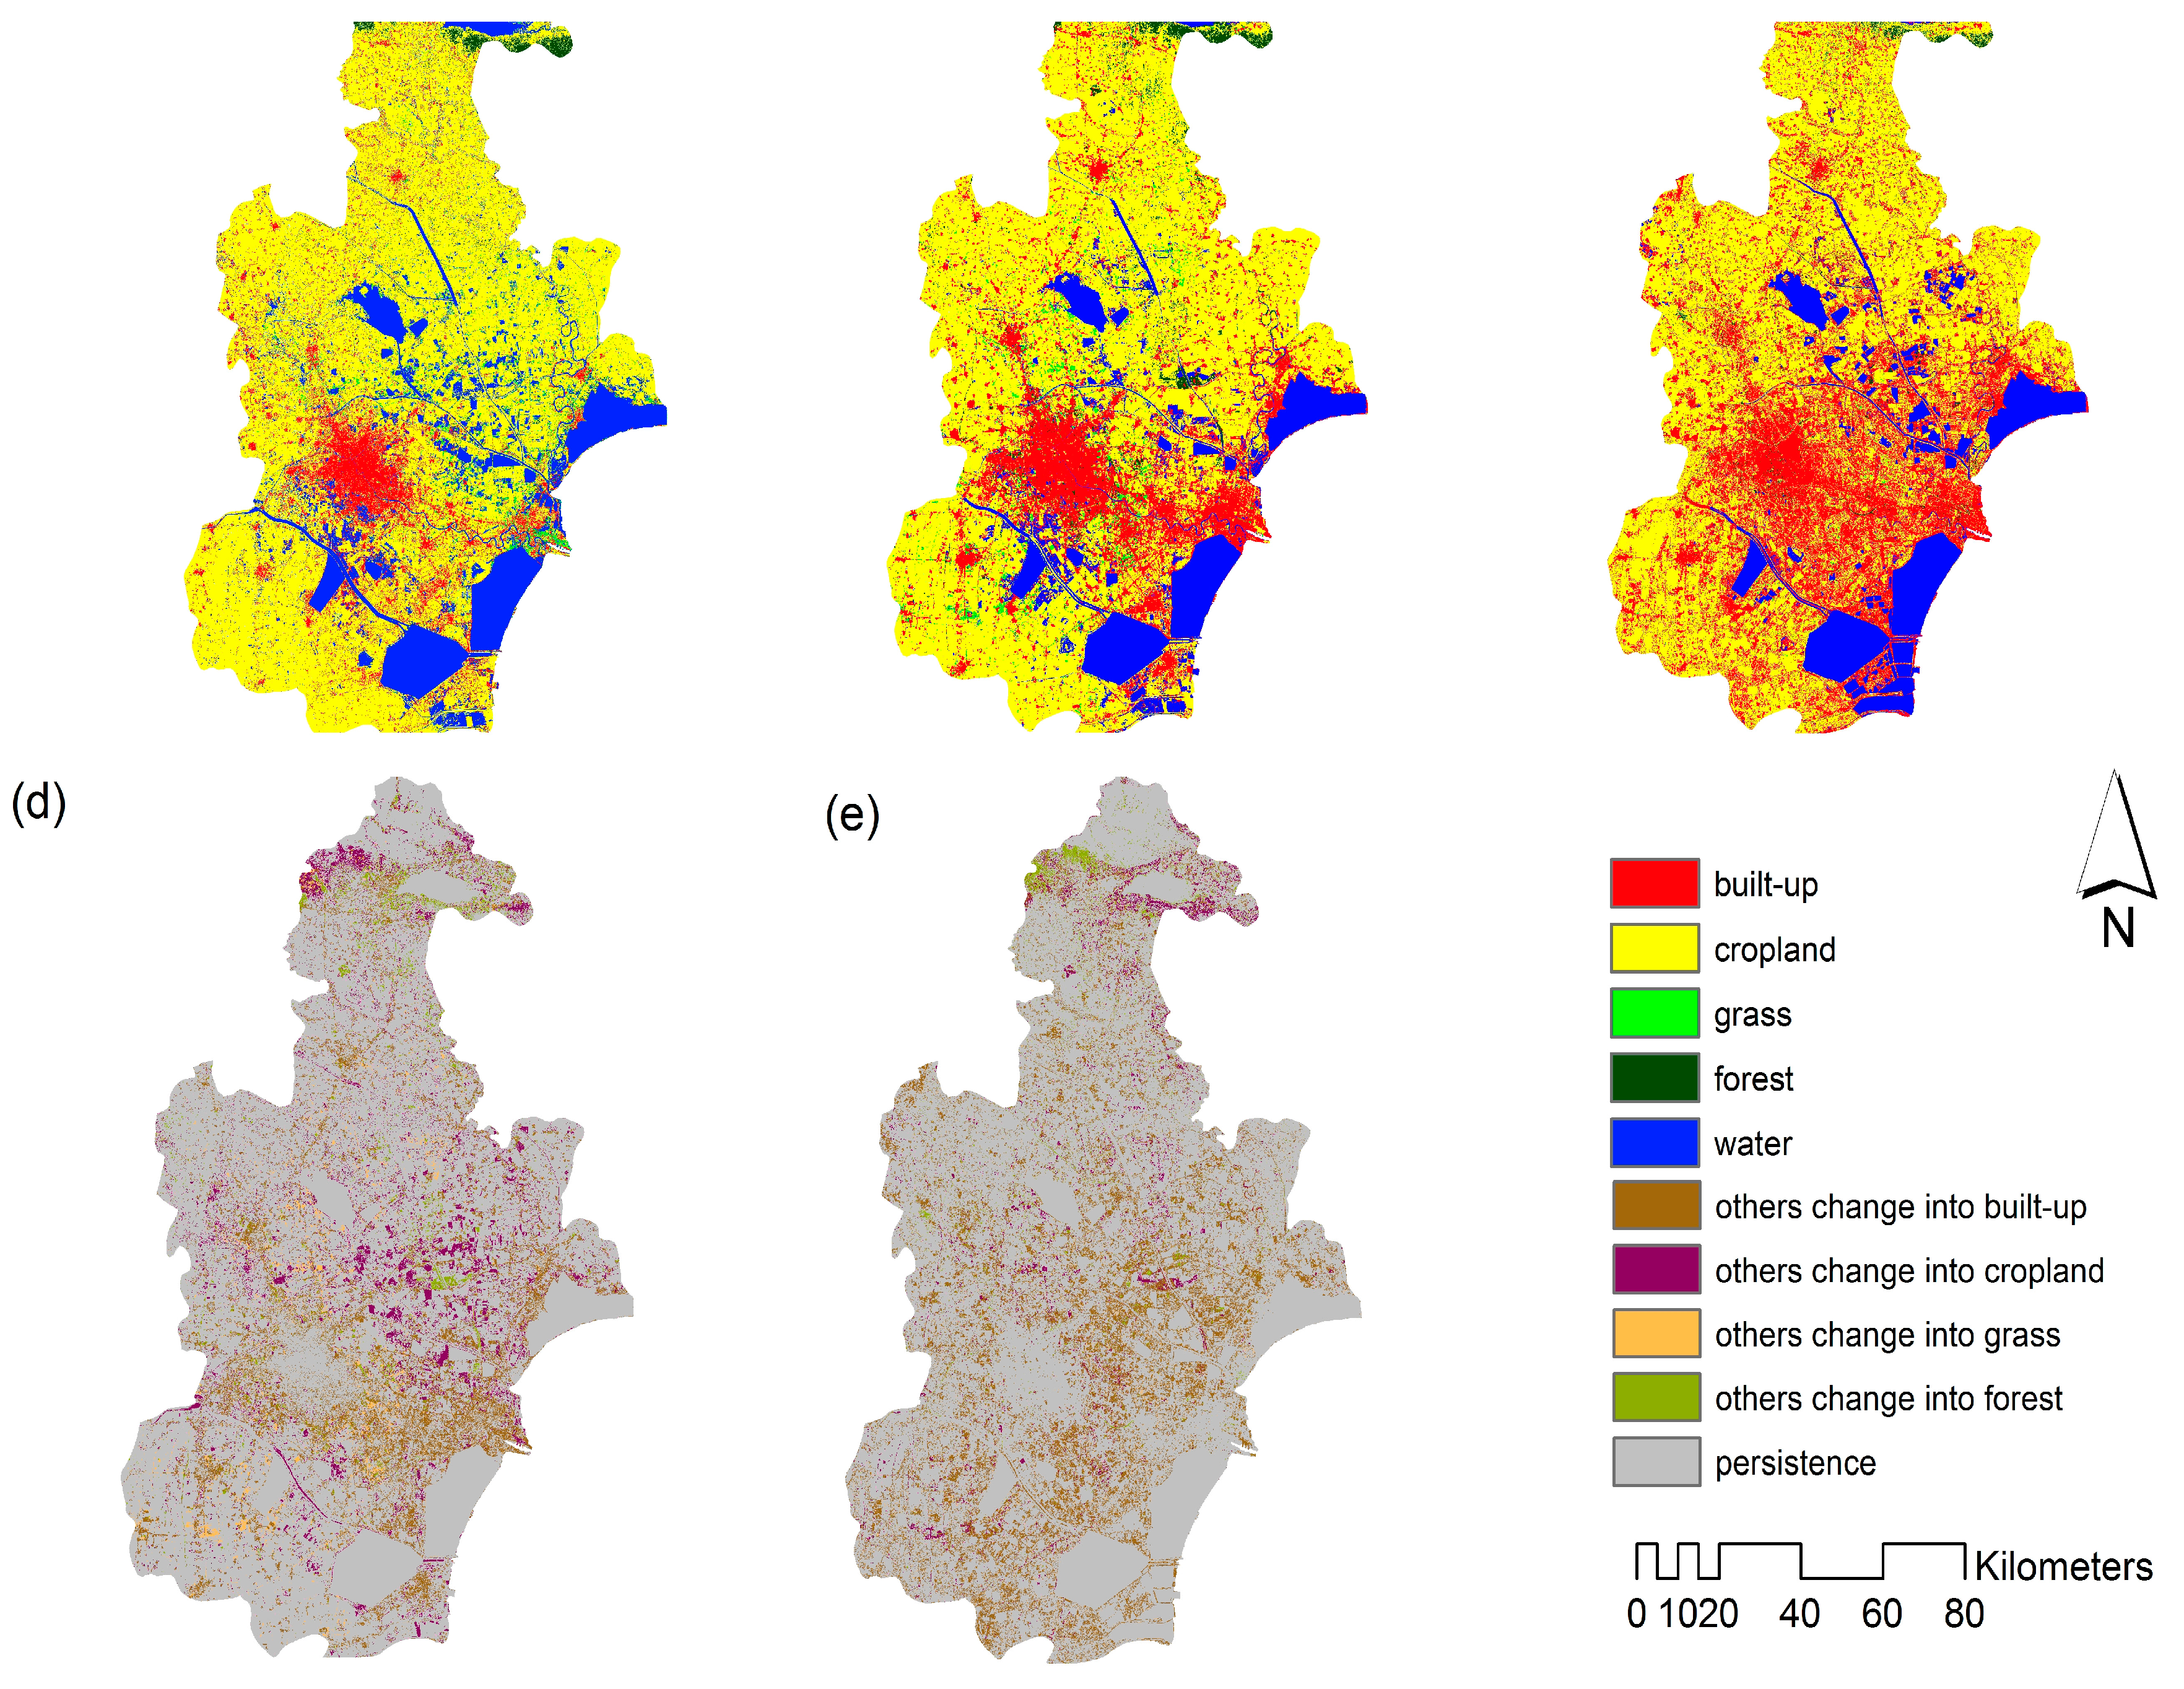
Figure 5.
Actual map in 2015 (a), simulation map in 2015 (b), and error map (c).

Figure 6.
Simulation LULC in 2025 (a) and in 2035 (b), and change map 2025–2035 (c).
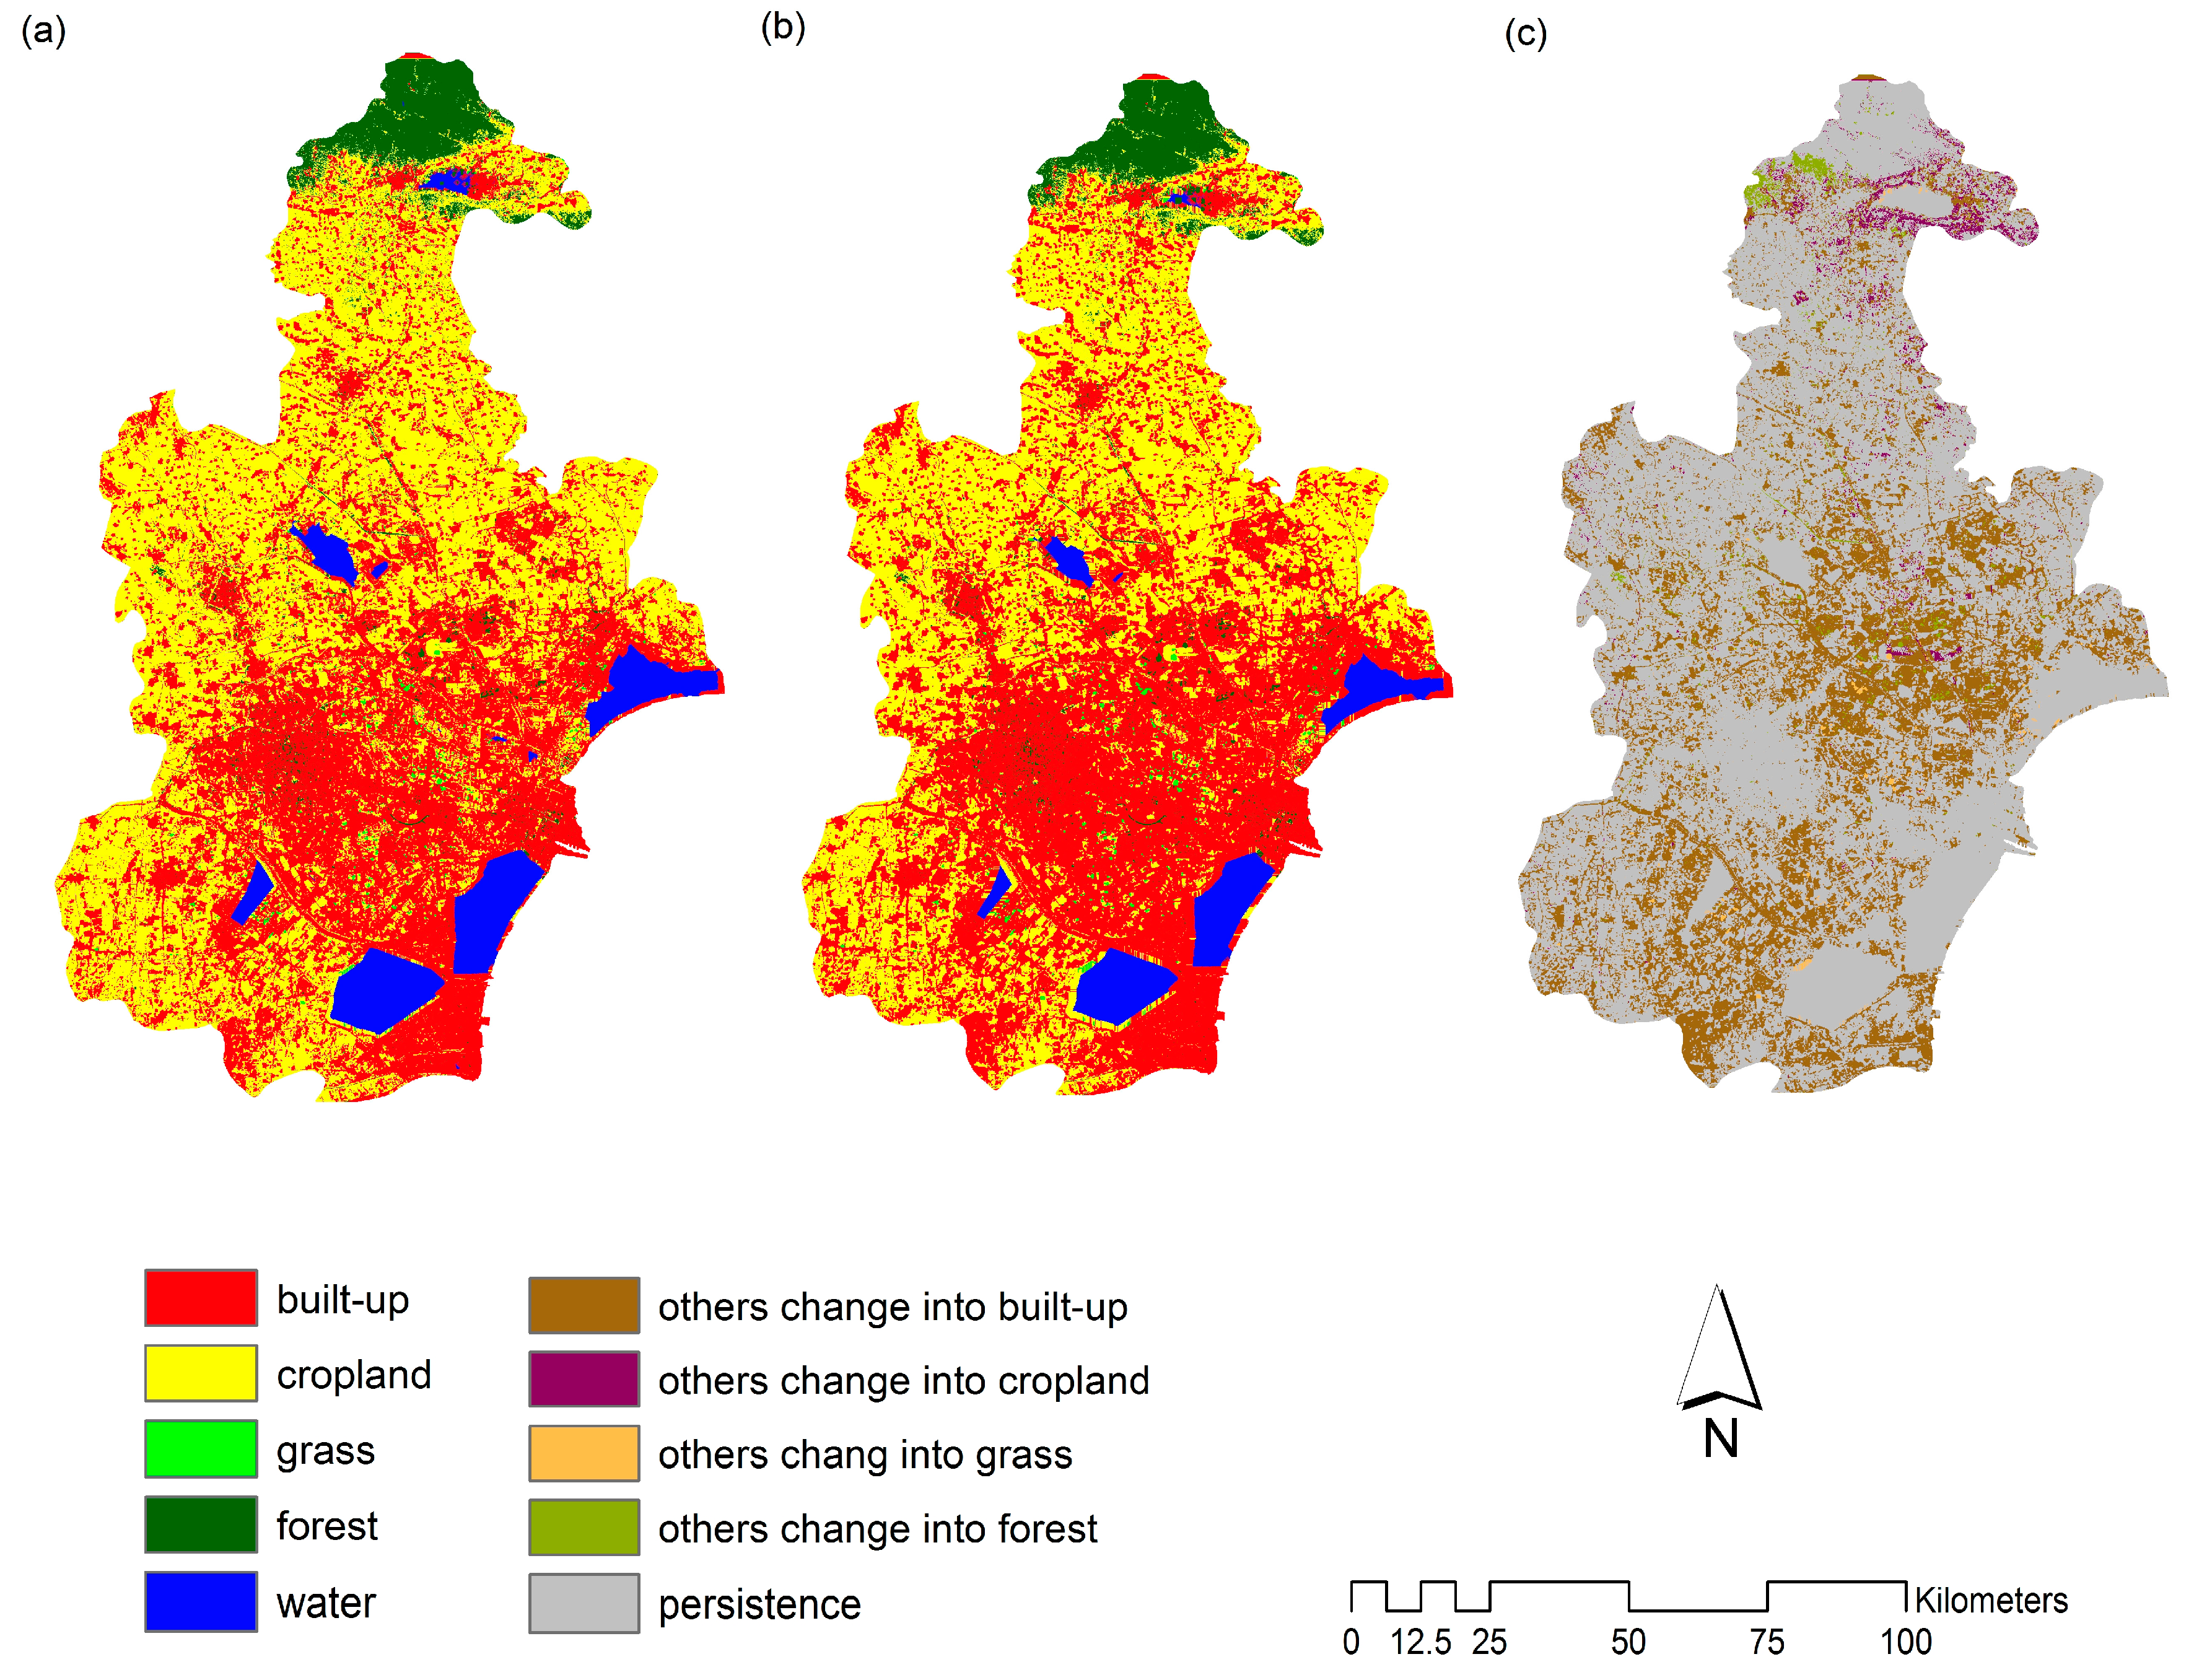
Table 1.
Landsat satellite images used.
| Data Type | Date Acquired (Day/Month/Year) | Season | Path | Row |
|---|---|---|---|---|
| Landsat 5 TM | 19 November 1995 | Autumn | 123 | 32 |
| 19 November 1995 | Autumn | 123 | 33 | |
| 28 November 1995 | Autumn | 122 | 32 | |
| 28 November 1995 | Autumn | 122 | 33 | |
| Landsat 5 TM | 22 October 2005 | Autumn | 122 | 32 |
| 29 October 2005 | Autumn | 123 | 33 | |
| 14 November 2005 | Autumn | 123 | 32 | |
| 23 November 2005 | Autumn | 122 | 32 | |
| Landsat 8 OLI | 5 December 2015 | Winter | 122 | 32 |
| 5 December 2015 | Winter | 122 | 33 | |
| 28 December 2015 | Winter | 123 | 32 | |
| 28 December 2015 | Winter | 123 | 33 |
Table 2.
LULC classification statistics.
| LULC Class | 1995 | 2005 | 2015 | |||
|---|---|---|---|---|---|---|
| Area (km2) | % | Area (km2) | % | Area (km2) | % | |
| Built-up | 1537.92 | 13.52 | 2021.7532 | 17.78 | 2747.11 | 24.15 |
| Cropland | 7632.16 | 67.1 | 7267.6775 | 63.90 | 6652.69 | 58.49 |
| Grass | 247.84 | 2.17 | 320.0716 | 2.81 | 216.76 | 1.91 |
| Forest | 451.76 | 3.97 | 355.5 | 3.13 | 394.7 | 3.47 |
| Water | 1504.8 | 13.23 | 1408.6578 | 12.39 | 1362.48 | 11.98 |
| Total | 11374 | 100 | 11374 | 100 | 11374 | 100 |
Table 3.
The rate of change for LULC.
| LULC Type | Area Change (km2) | Annual LULC Change Rate (%) | ||
|---|---|---|---|---|
| 1995~2005 | 2005~2015 | 1995~2005 | 2005~2015 | |
| Built-up | 483.83 | 725.36 | 3.15 | 3.59 |
| Cropland | −364.48 | −614.99 | −0.48 | −0.85 |
| Grass | 72.23 | −103.31 | 2.91 | −3.23 |
| Forest | −96.26 | 39.20 | −2.13 | −0.06 |
| Water | −96.14 | −46.18 | −0.64 | 0.00 |
© 2017 by the authors. Licensee MDPI, Basel, Switzerland. This article is an open access article distributed under the terms and conditions of the Creative Commons Attribution (CC BY) license (http://creativecommons.org/licenses/by/4.0/).
Share and Cite
MDPI and ACS Style
Wang, R.; Murayama, Y. Change of Land Use/Cover in Tianjin City Based on the Markov and Cellular Automata Models. ISPRS Int. J. Geo-Inf. 2017, 6, 150. https://0-doi-org.brum.beds.ac.uk/10.3390/ijgi6050150
AMA Style
Wang R, Murayama Y. Change of Land Use/Cover in Tianjin City Based on the Markov and Cellular Automata Models. ISPRS International Journal of Geo-Information. 2017; 6(5):150. https://0-doi-org.brum.beds.ac.uk/10.3390/ijgi6050150
Chicago/Turabian StyleWang, Ruci, and Yuji Murayama. 2017. "Change of Land Use/Cover in Tianjin City Based on the Markov and Cellular Automata Models" ISPRS International Journal of Geo-Information 6, no. 5: 150. https://0-doi-org.brum.beds.ac.uk/10.3390/ijgi6050150
Note that from the first issue of 2016, this journal uses article numbers instead of page numbers. See further details here.