
Spatio-Temporal Behavior Analysis and Pheromone-Based Fusion Model for Big Trace Data


1
State Key Laboratory of Information Engineering in Surveying, Mapping and Remote Sensing, Wuhan University, Wuhan 430079, China
2
School of Urban Design, Wuhan University, Wuhan 430079, China
3
Shenzhen Key Laboratory of Spatial Smart Sensing and Services, College of Civil Engineering, Shenzhen University, Shenzhen 518060, China
*
Author to whom correspondence should be addressed.
ISPRS Int. J. Geo-Inf. 2017, 6(5), 151; https://0-doi-org.brum.beds.ac.uk/10.3390/ijgi6050151
Submission received: 7 March 2017
/
Revised: 11 April 2017
/
Accepted: 9 May 2017
/
Published: 12 May 2017
Abstract
:People leave traces of movements that might affect the behavior of others both online in cyberspace and offline in real space. Previous studies, however, have used only questionnaires, network data, or GPS data to study spatio-temporal behaviors, ignoring the relationship between online and offline activities, and overlooking the influence of previous activities on future behaviors. We propose a Pheromone-based Fusion Model, viewing human behaviors as similar to insect foraging behaviors to model spatio-temporal recreational activity patterns, on and offline. In our model, website data were combined with GPS data to evaluate the attractiveness of destinations over time using twenty-nine landscapes in Beijing, China; big website data and GPS trajectories were gathered from 181 users for 57 months. The datasets were portioned into two periods. Online and offline recreational pheromones were calculated from the first period, and the visitation rates were extracted from the second period. These data were subsequently applied in a regression analysis to determine unknown parameters and estimate the attractiveness of destinations. The proposed method was compared with two other approaches that use either GPS data or online data alone, in order to verify effectiveness. The results show that the proposed method can estimate future behaviors, based on real world and online past actions.
1. Introduction
1.1. Background and Problem
Mismatches between resource configuration and public spatio-temporal behavior patterns are ongoing issues, particularly in recreation management. Stated and measured preferences often do not match. The popularity of a given resort destination changes over time [1]. Improper configuration of spatial functions in scenic areas, parks, and cultural attractions might result when real recreational activity patterns are ignored. This could lead to problems such as congestion, poor management, and wasted resources, thus marring the user comfort level [2].
Furthermore, unpleasant experiences and congested destinations affect tourists’ cognition and comments about a city. A lack of knowledge of cities leads to confined travel regions [3,4]. Most tourists flock to the most well known attractions of the city, causing congestion and affecting travel experiences, creating a negative impression.
Therefore, it is of great significance to mine spatio-temporal recreational behavior patterns to improve management of recreational assets. Recreational activity patterns suggest the future spatial distribution of visitors, useful for resource assignments. At the same time, for tourists, such an analysis could provide more information for destination choices [4].
1.2. Related Work
Many methods and instruments have been applied to unearth human behavior patterns and preferred sites or routes within cities. The most traditional is questionnaire surveys [3,5,6,7,8]. Such surveys yield rich semantic information but are quite time-consuming, expensive and require many samples to be representative. Digital traces such as GPS data and web geo-tagged data are widely used [9,10,11,12,13,14,15,16,17,18,19,20,21,22,23,24,25,26,27,28,29,30,31], as they are easy to collect; however, the raw datasets lack semantic annotation or context and have sampling errors [10]. Spatio-temporal pattern mining based on digital trails has become a focus topic and is well suited for ranking locations and making recommendations in some research [19,20,22,23,24,25,26,27,28,29,30,31,32,33]. GPS trajectory pattern mining methods were introduced a few years ago. Giannotti et al. [9,10] detailed basic algorithms to mine travel patterns, including those for the detection of interesting locations from trajectory data and finding typical spatio-temporal sequential patterns.
Offline trajectory data are used widely to mine behavior patterns and evaluate urban landmarks and tourist hotspots. GPS traces are accurate, so individual movement patterns and activity can be described in detail [10]. Mckercher et al. [21] coupled GPS data with Geographical Information System (GIS) to learn the behavior patterns of first time and repeat visitors to Hong Kong. Zheng et al. [20] utilized GPS trajectory data to extract interesting locations, classical travel sequences, and, ultimately, recommend locations. The main drawback of these methods is the difficulty in collecting data from a large number of people and a lack of semantics. GPS trace data can be combined with other datasets for richer information in ways that overcome these problems. Cord et al. [19] use Geocaching data combined with content analysis and online surveys to explore spatial gradients, preferences and motivations regarding short-term recreation; nevertheless, survey data is not comparable in size to online big data.
Online social media data exposes the digital trails left by human activities in cyberspace, involving people from all over the world and are easy to acquire. These data can link behaviors in cyberspace to the perception of geographical spaces [18] and location attractiveness. Chen et al. [24] studied personalized travel recommendations by mining user attributes from geo-tagged photos and ranked locations using data scraped from sharing websites, indicating tourist preferences. The system was further developed by Subramaniyaswamy et al. [30] to include visitor seasonal preferences. There have been many other attempts at applying online data to evaluate location attractiveness. Several density-based methods [26,32,33] using geo-tagged photos from Flicker applied a clustering algorithm for analysis of attractive areas. Zhang et al. [28] adopted social media data and Google search to evaluate landscapes in order to plan the most beautiful routes for users, based on previous survey research on beautiful and happy route recommendations in the city [5].
There is, however, a lack of research linking online and offline preferences, as well as effective means to combine online data with offline GPS trajectory data. The previous work used only online social media data or GPS data, ignoring the relationship between online and offline activities, and overlooking the influence of previous activity on future behaviors. More research on means to integrate these datasets is needed if these data are to be fully exploited.
1.3. Recreational Behavior Analysis and Digital Trace Fusion
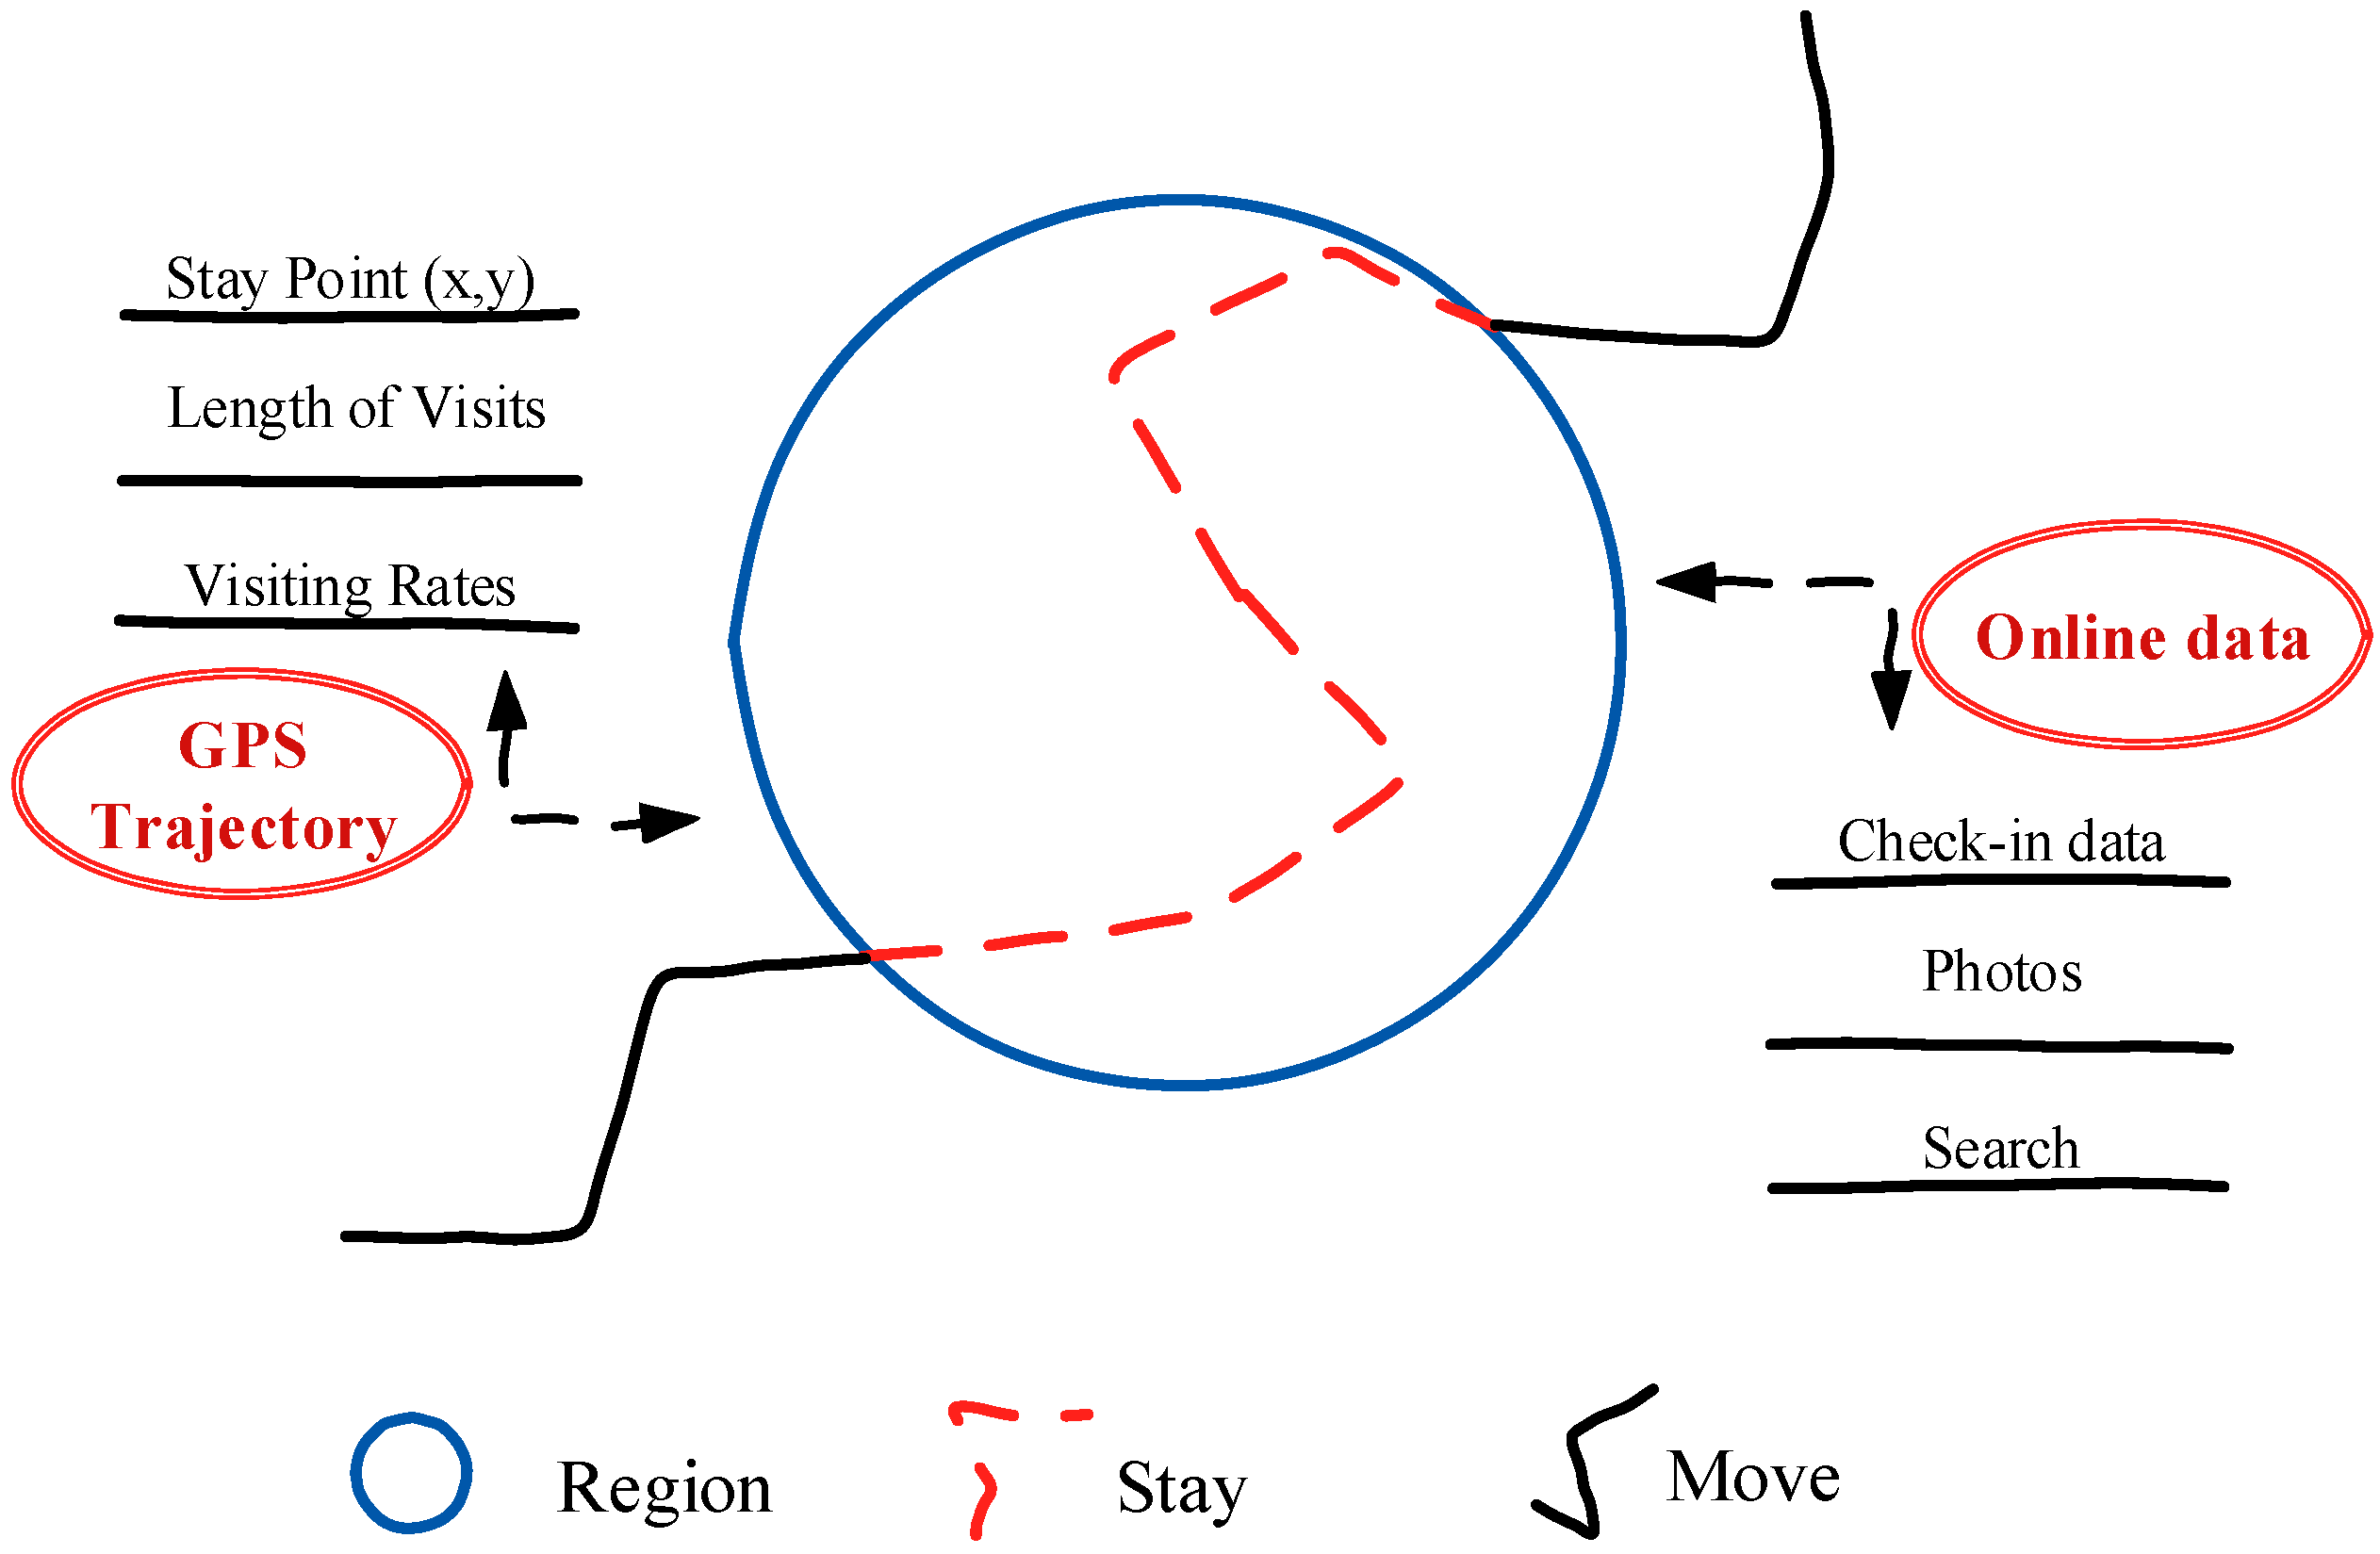
This paper aims to be a pioneer in the field of online and offline activity traces integration. We analyze spatio-temporal recreational behaviors and evaluate the attractiveness of places within cities, proposing a Pheromone-based Fusion Model, for trajectory and big website data. People, like foraging ants, leave rich information trails when they visit a place in real space or on the internet. The basic idea behind our pheromone model is that we consider visitors as “ants” engaging in recreational activities within cities in a manner similar to foraging behaviors of real ants, as illustrated in Figure 1. The integration mechanism was based on this idea as well.
In Figure 1, the red and black trails represent traces of visitors, while the blue circle represents the recreational region. The black line represents a fast moving visitor trace searching the web or moving through real space. The red dashed line in Figure 1 represents the relatively stationary trail when a visitor settles into a recreational behavior in real space or cyberspace. This lingering behavior (stay point) is extracted from GPS trajectories or online data. Trail pheromone releases can be computed from these datasets.
Using this model, we integrated online and offline trails, including outdoor GPS trajectories and immense online data, as indicated by the red labels and arrows on either side of Figure 1. The length of visits, visiting rate, stay points, online searches, check-in data, and photos on social media platforms are attributes analyzed and included in the model based on the pheromone and digital trail analogy. This work provides a new perspective, inspired by research on the behavior of real ants and data fusion [34,35,36,37,38].
The Pheromone-based Fusion Model is versatile and robust, and can be applied with adaptive changes in parameters to various regions (big cities or small towns) for a specific or generic period. Moreover, it takes advantage of online and offline preferences to combine trajectory data and big online data. Unlike rank-by-count methods, this model deploys more spatio-temporal behavior pattern characteristics, including visiting rate, length of visits, and incorporates the influence of past actions, based on the pheromone analogy, as discussed in Section 2 and Section 3.
2. Foundation Idea of Pheromone-Based Fusion Model
2.1. Pheromone Mechanism in Nature
In nature, a chemical substance called pheromone (food trail pheromones) is commonly used among insects, in order to improve the efficiency of food searches. Pheromones act outside the body of the secreting insect, affecting the behavior of the receiving members of the same species [35]. For example, ants mark foraging paths with trail pheromones consisting of volatile chemicals. This pheromone trail attracts other ants and guides group-level food searches within the entire colony. When an ant finds food, others in the same colony can find food by following the pheromone traces. Therefore, ant colonies forage in a collective manner using a simple positive feedback mechanism [34]. A path marked by more ants becomes more attractive. The ant system has been well developed in the field of route planning [34].
2.2. The Similarity between Recreation Pattern and Pheromone Pattern
Like ants, during day-to-day activities in real space or on the internet, people leave online and offline traces; these messages might affect the behaviors of others, much like insect foraging patterns based on pheromones. When individuals are interested in a place, they may well visit it on the internet. Users search online information, check in on social media platforms, leave their comments, and recommend places to their friends. These behaviors comprise online digital trails, which reflect the popularity of recreational destinations. Similarly, in real space, visitors move, stay, take pictures and revisit places, leaving digital traces recorded by mobile devices like GPS. The information generated by these traces acts like the food trail pheromones ants leave behind, thus changing the attractiveness of urban space.
Human recreational behaviors can be seen as collective activities. On the individual level, every visitor acts like a single insect, searching for pleasant locations without any experience and guide at the very beginning. The choice for a single scenic spot depends on its resource endowment advantages and external regional advantages [27]. On the collective level, humans are like cooperating agents. They coordinate their behaviors when searching for pleasant locations, influencing and being influenced by other people. Messages generated by visit behaviors act like insect pheromones, attracting individuals; even an unvisited place attracts people due to others’ visits and comments. The process is a positive feedback loop, where the probability one person visits a place increases with the number of people that previously visited the same places, whether in the real world or on the internet.
2.3. Concept of Recreational Pheromones in Human Society
Inspired by the pheromone mechanism among insects, we propose a new concept—Recreational Pheromone. The recreational pheromone is defined as abstract information, secreted when visitors engage in recreation-related online and offline activities, and attracts visitors when making destination decisions, but like insect pheromones that vaporize, these trails disappear over time. Places with high pheromone concentrations in the real world or on the internet attract crowds, reflected in high visiting rates. In reality, the recreational pheromone represents current popularity and future recreational attractiveness of a location. In this paper, M denotes the concentration of pheromones, and is dimensionless, as detailed in Section 3.
3. Pheromone-Based Fusion Model
In this section, we describe our design of the Pheromone-based Fusion Model, where the recreational pheromone is computed to measure the attractiveness of locations, integrating online and offline digital traces. The entire framework is based on spatio-temporal rules for recreational behaviors. We analyzed the behavior patterns and built the model in cyberspace and the real space separately. Heterogeneous data from two spaces were combined with specific weights as determined by the regression method, following the pheromone principle.
3.1. Recreational Patterns in the Real Space
In real-world scenarios, recreational pheromone release depends on movement patterns, including length of visits, visiting frequency, and visiting rates. In the present model, we selected the length of visits and visiting rates as the main factors affecting pheromone release in real space. As the quality of landscapes varies, these behavioral features also vary. Longer stays and more arrivals indicate a larger quantity of recreational pheromone release, possibly attracting larger crowds later on.
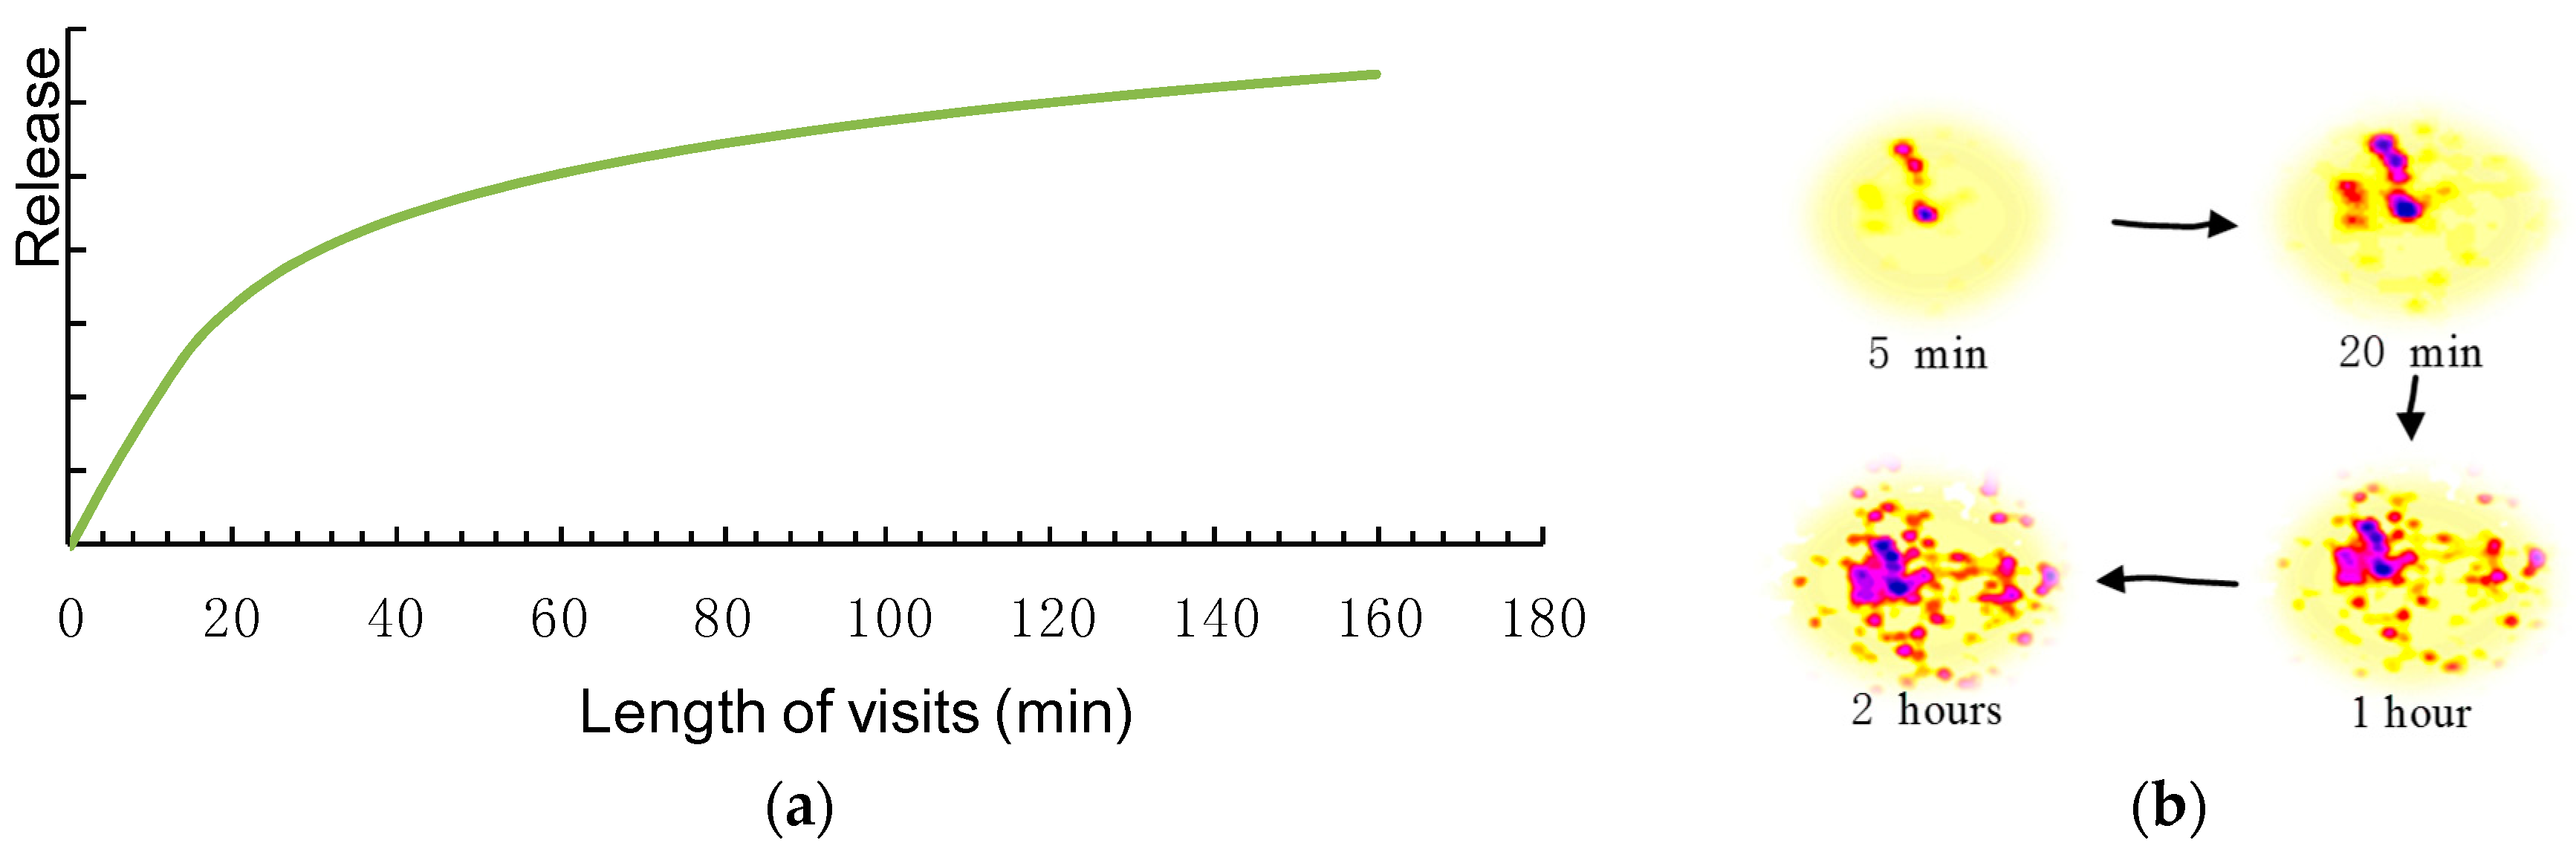
The length of visits affects the release of recreational pheromones with a positive nonlinear correlation. Visitors leave more pheromones when they stay longer in a satisfactory environment. In the case of insects, pheromones accumulate over time. The amount of pheromones that an ant can carry is limited, though. Ants deposit pheromones only for a fixed number of steps [39]. In the context of human recreation, a decision between a five-minute stay and a two-hour wander might indicate visitor preferences. We assume, however, that there is no significant difference in preferences between two attractions when visitors stay for two hours or three hours. On the basis of this characteristic, Figure 2a illustrates the probable relationship between stay time and pheromones: the speed of pheromone release changes as a stay lengthens. Figure 2b visualizes the pheromone accumulation during four periods.
When the length of visits is small, the pheromone release changes sharply; nevertheless, the rate slowed down as time passed, as shown in Figure 2. For example, there is distinct disparity between a five-minute stay and an hour while the difference between an hour and a two-hour stay is relatively small.
We built mathematical models whose graphs correspond to the shape seen in Figure 2a. Logarithmic Functions and Square Root equations are commonplace in scientific formulas and meet the graph requirements. Given a stay of longer than one minute, they performed almost the same in trials. Square Root Function was chosen in cases where visitors stay for less than one minute where the antilogarithm value was smaller than 1 in the Logarithmic Function. Therefore, in real space, a single release (τik) of recreational pheromones is as in Equation (1):
where i, k represent the i-th visitor and k-th location, respectively, T represents the length of visits, and Si is the area size.
The size of recreational areas influences the length of visits and must be taken into account during pheromone calculation. In the context of insect pheromones, a long path may have more aggregate pheromones than the shorter one, though the latter might have an equal concentration or even higher concentration of pheromones. However, a high concentration of pheromones matters more than the total amount. A similar situation exists in human recreation patterns. Visitors may stay for a long time and release a large amount of pheromones just because the site is a big space rather than as an expression of preference. The effect of the size of a site must be removed when rigorously exploring the attractiveness of places. Imitating the pheromone concentration, defined as the number of pheromone molecules in a given volume, the stay length is divided by a variable related to the area of a site. However, the sizes of the area of a site vary from 10,000 to 1,000,000 square meters, and the length of visits is only up to a few hundred minutes at maximum. Thus, the magnitude of an area is far larger than the length of visits. Logarithmic scales reduce wide-ranging quantities to tiny scopes. Thus, the area of a site is normalized by a natural logarithm to keep the same scale as the length of visits in Equation (1).
The number of visits is another key factor when determining present pheromone effects. Places are continuously visited by different visitors at different points in time. Their pheromones accumulate and renew, thus the attractiveness of spaces changes. Locations visited by more visitors at present get more pheromones from visitors, and, therefore, are more likely to be popular and attractive sites later on.
However, not all traces weigh equally when aggregated. One of the most striking characteristics of insect trail pheromones is volatility, as the chemical diffuses and evaporates over time. Changes in human preferences mirror this volatility. For example, a theme park might be outdated and unfrequented today, though it was quite popular years ago. Extraordinary events have an impact on human mobility as well [10]; some sites may attract crowds only for a particular period because of a special event like the Olympics. The volatility of recreational pheromones is formulated as a time-varying weight in Equation (2):
where ρ is a volatilization coefficient that (1 − ρ) represents the evaporation of pheromones between time t and t0, t0 represents the time point when we evaluate the locations, usually the time closest to the latest trace, and t represents the time point when the visit happens.
The volatility coefficient ρ relates to a period of pheromone volatility, as fixed to 120 days in Equation (2). Since the volatilization within one single day is hard to distinguish, a reasonable period consistent with human behaviors is preferred. Ahas et al. [11] found that seasonality produces very different consumption patterns in tourist spaces. The majority of attractions are seasonal, though it is difficult to determine a volatile period for some iconic attractions and specific events, as they are popular tourist destinations year round. Therefore, we choose 120 days as the period extending it across two seasons, considering this variable aspect of seasonality.
The aggregated pheromone concentration from offline activities is expressed as:
where wt is the time-varying weight of pheromone release. The offline recreational pheromone of a certain place is computed by aggregating every visit with a time weight.
3.2. Recreational Pheromones in Cyberspace
On the internet, the interests and comments of the public influence recreational pheromone release. These online digital trails are also much like pheromones left by insects. The places with more pheromone concentrations attract more insects. Likewise, the more searches, check-in times, and geo-tagged photos a place has, the more popular the place. In general, there is a positive correlation between a feature and recreational pheromone release.
Online pheromone computation is different from the offline case. Online trails consist of snapshots of visits rather than explicit movement trajectories. Contributed by millions of people on the internet, the magnitude of online data is also far larger than offline data. Both the type and magnitude of this data make it difficult to detail features of each online visit. Hence, our proposed method employs aggregate characteristics instead of the detailed features extracted from each online visit. Recreational pheromones in cyberspace are calculated based on an existing method as proposed by Zhang et al. [28] This model explored the attractiveness of urban landscapes in cyberspace, where the Google searches, check-in times on Weibo, and geo-tagged photos were studied, coupled with the national landscape-level rankings.
At first, the method classified urban landscapes. As destination preference involves fuzzy human emotion, fuzzy clustering analysis would be suitable for classifying landmarks [28]. Fuzzy Clusters are identified via similarity measures [40]. In this case, similarity measures include Google searches, check-in times, the number of photos, and the national landscape-level rankings. In Equation (4), a fuzzy relation matrix R = rij was created by computing the similarity relation [41] between two features. The symbols ∨ and ∧ stand for max and min, respectively. rij denotes the similarity between two objects (i and j):
where xik is the k-th feature of the i-th location and m is the amount of the features (search, check-in times, etc.). Recreational places were classified with the fuzzy relation matrix R. Places in the same clusters are as similar as possible and items in different clusters are as dissimilar as possible. Based on this classification, Zhang et al. [28] proposed criteria to build up the mathematical model.
The mathematical model was designed and adjusted using the following criteria: (i) the evaluation result must fit with public perception; and (ii) the landscapes in the same class have successive sequences (rank) since they have many feature similarities. There is a positive correlation between each feature and recreational pheromone release. However, the specific mathematical formula is unknown. The model went through a number of trials to meet the criteria as detailed in previous work [28]. The eventual calculation method is as below:
where Li, Hi, Gi, Qi, respectively, represent the national scenic area level, photos on Weibo, the number of Google searches and check-in data of the i-location; w1, w2 are fixed as 0.5 according to Zhang et al. [28].
In Equation (5), the listed parameters are preprocessed in different ways. The national landscape-level rankings with A-rating system are quantified into scores where landscapes with 5A, 4A, and 3A rankings get 5, 4, and 3, respectively, and others are given 2. To fit the scale of ranking scores, the numbers of searches, check-in times, and the numbers of photos are normalized by a common logarithm before the Ai calculation. As the amounts of photos are far too large, the photo parameter is measured by the amount of photos for each site rather than photo processing.
3.3. Establishing Proper Weights for Online and Offline Data to Be Fused
Digital traces on the internet and in real-world space have different dimensions; to eliminate the effects of this discrepancy, the output of each space is normalized into comparable values. Using a non-dimensional method, the two pheromones in online and offline space are integrated to calculate the aggregate pheromones (Mi) in urban recreational areas. The mathematical Equation (6) shows the normalization, and Equation (7) is the integration with a polynomial expression, inspired by Li et al. [37]:
where x, x′ denote the dimensionless value and original value, respectively:
where wτ and wA denote the weights of offline and online behaviors, respectively.
The optimal weights (wτ, wA) in Equation (7) are determined by regression analysis in experiments. People in different regions have different recreational patterns and the quantity and quality of data sources differ. For example, metropolises on the eastern coast in China have a higher density of online data than the rural regions, thus a greater weight is attributed to internet data. In each specific case, parameters depend on experimental regression results.
Spaces with higher pheromone concentration will likely attract more people in the future, similar to the ant pheromone mechanism. On this basis, the optimal weights of integration are obtained with the regression method. In regression analysis, τi and Ai are calculated as independent variables by Equations (3) and (5), and the dependent variable is the possibility of a visit in the near future. P is introduced to fit the true visit ratio:
where ΣMi denotes the sum of pheromones in all locations, α, η are coefficients, and n means n visitors visit the attraction in the near future among all people (N).
Equation (8) shows the fitting model in regression analysis. The ratio (n/N) on the right denotes the true visit ratio in future. Correspondently, P was designed based on the ratio concept using two unknown coefficients.
4. An Experiment in Beijing
4.1. Experimental Data and Preliminary Analysis
To validate the method, we applied the proposed Pheromone-based Fusion Model in an experiment in Beijing where 29 recreational regions were measured. In this case, offline traces were extracted from the Microsoft GeoLife GPS trajectory dataset obtained from Official Microsoft Download Center, and massive internet data were gathered from Weibo and Google for the corresponding time. The areas of these 29 sites were obtained and the national landscape-level rankings were collected as well.
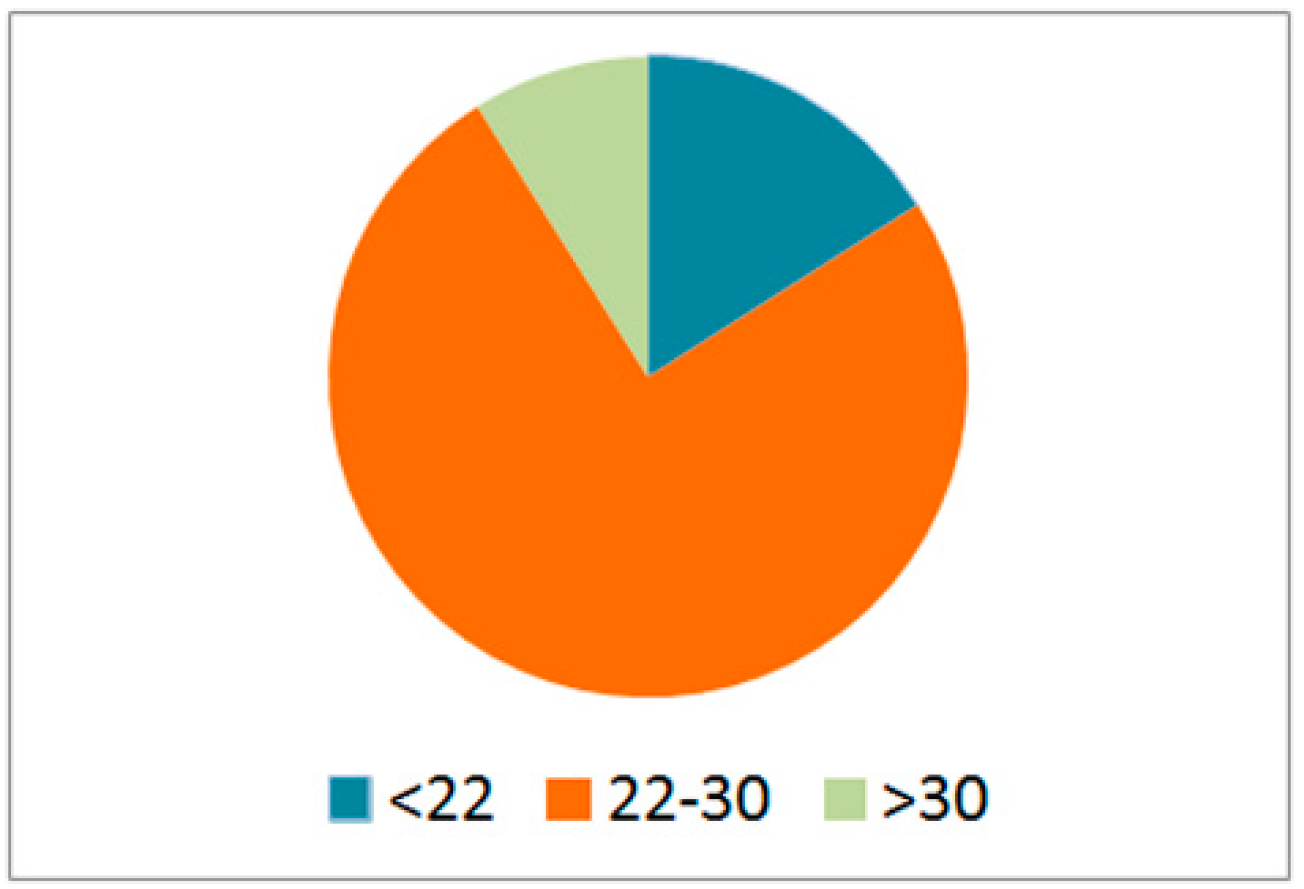
Offline GPS data were collected in 181 samples over a period of five years, from April 2007 to April 2012. Young people were the main offline GPS data contributors. The overall age structure is presented in Figure 3. The majority were between 22 and 30 years old, accounting for 75% of participants. Participants younger than 22 and participants over than 30 contributed 16% and 9% of the data, respectively.
People in their twenties are the most active group on the internet and travel extensively. Participants consisted of full-time students (58%) and workers (42%), with gender balance. Thus, this data was well suited for this experiment.
Online datasets include Google searches of locations, check-in times, and geo-tagged photos. Google searches were collected using advanced search, with time limits. Check-in data and the number of photos were obtained from Weibo (http://open.weibo.com/), the largest online social media platform in China. The timeframe of online datasets corresponds to the offline dataset.
A preliminary step is required before processing in order to extract essential characteristics of traces and improve efficiency, including data selection, attribute extraction, and normalization. As clarified in Section 3.2, to fit the scale of ranking scores, the three datasets of online traces were normalized by Equation (9). As for GPS trajectories, the preliminary work followed the following steps, as in Zheng et al. [20]:
- Identify the trajectory from raw GPS data;
- Compute the velocity of each GPS record and select the low-speed segment (<1.6 m/s);
- Compute the center of each low-speed trajectory segment:where x denotes the processed data and x* is the original data.
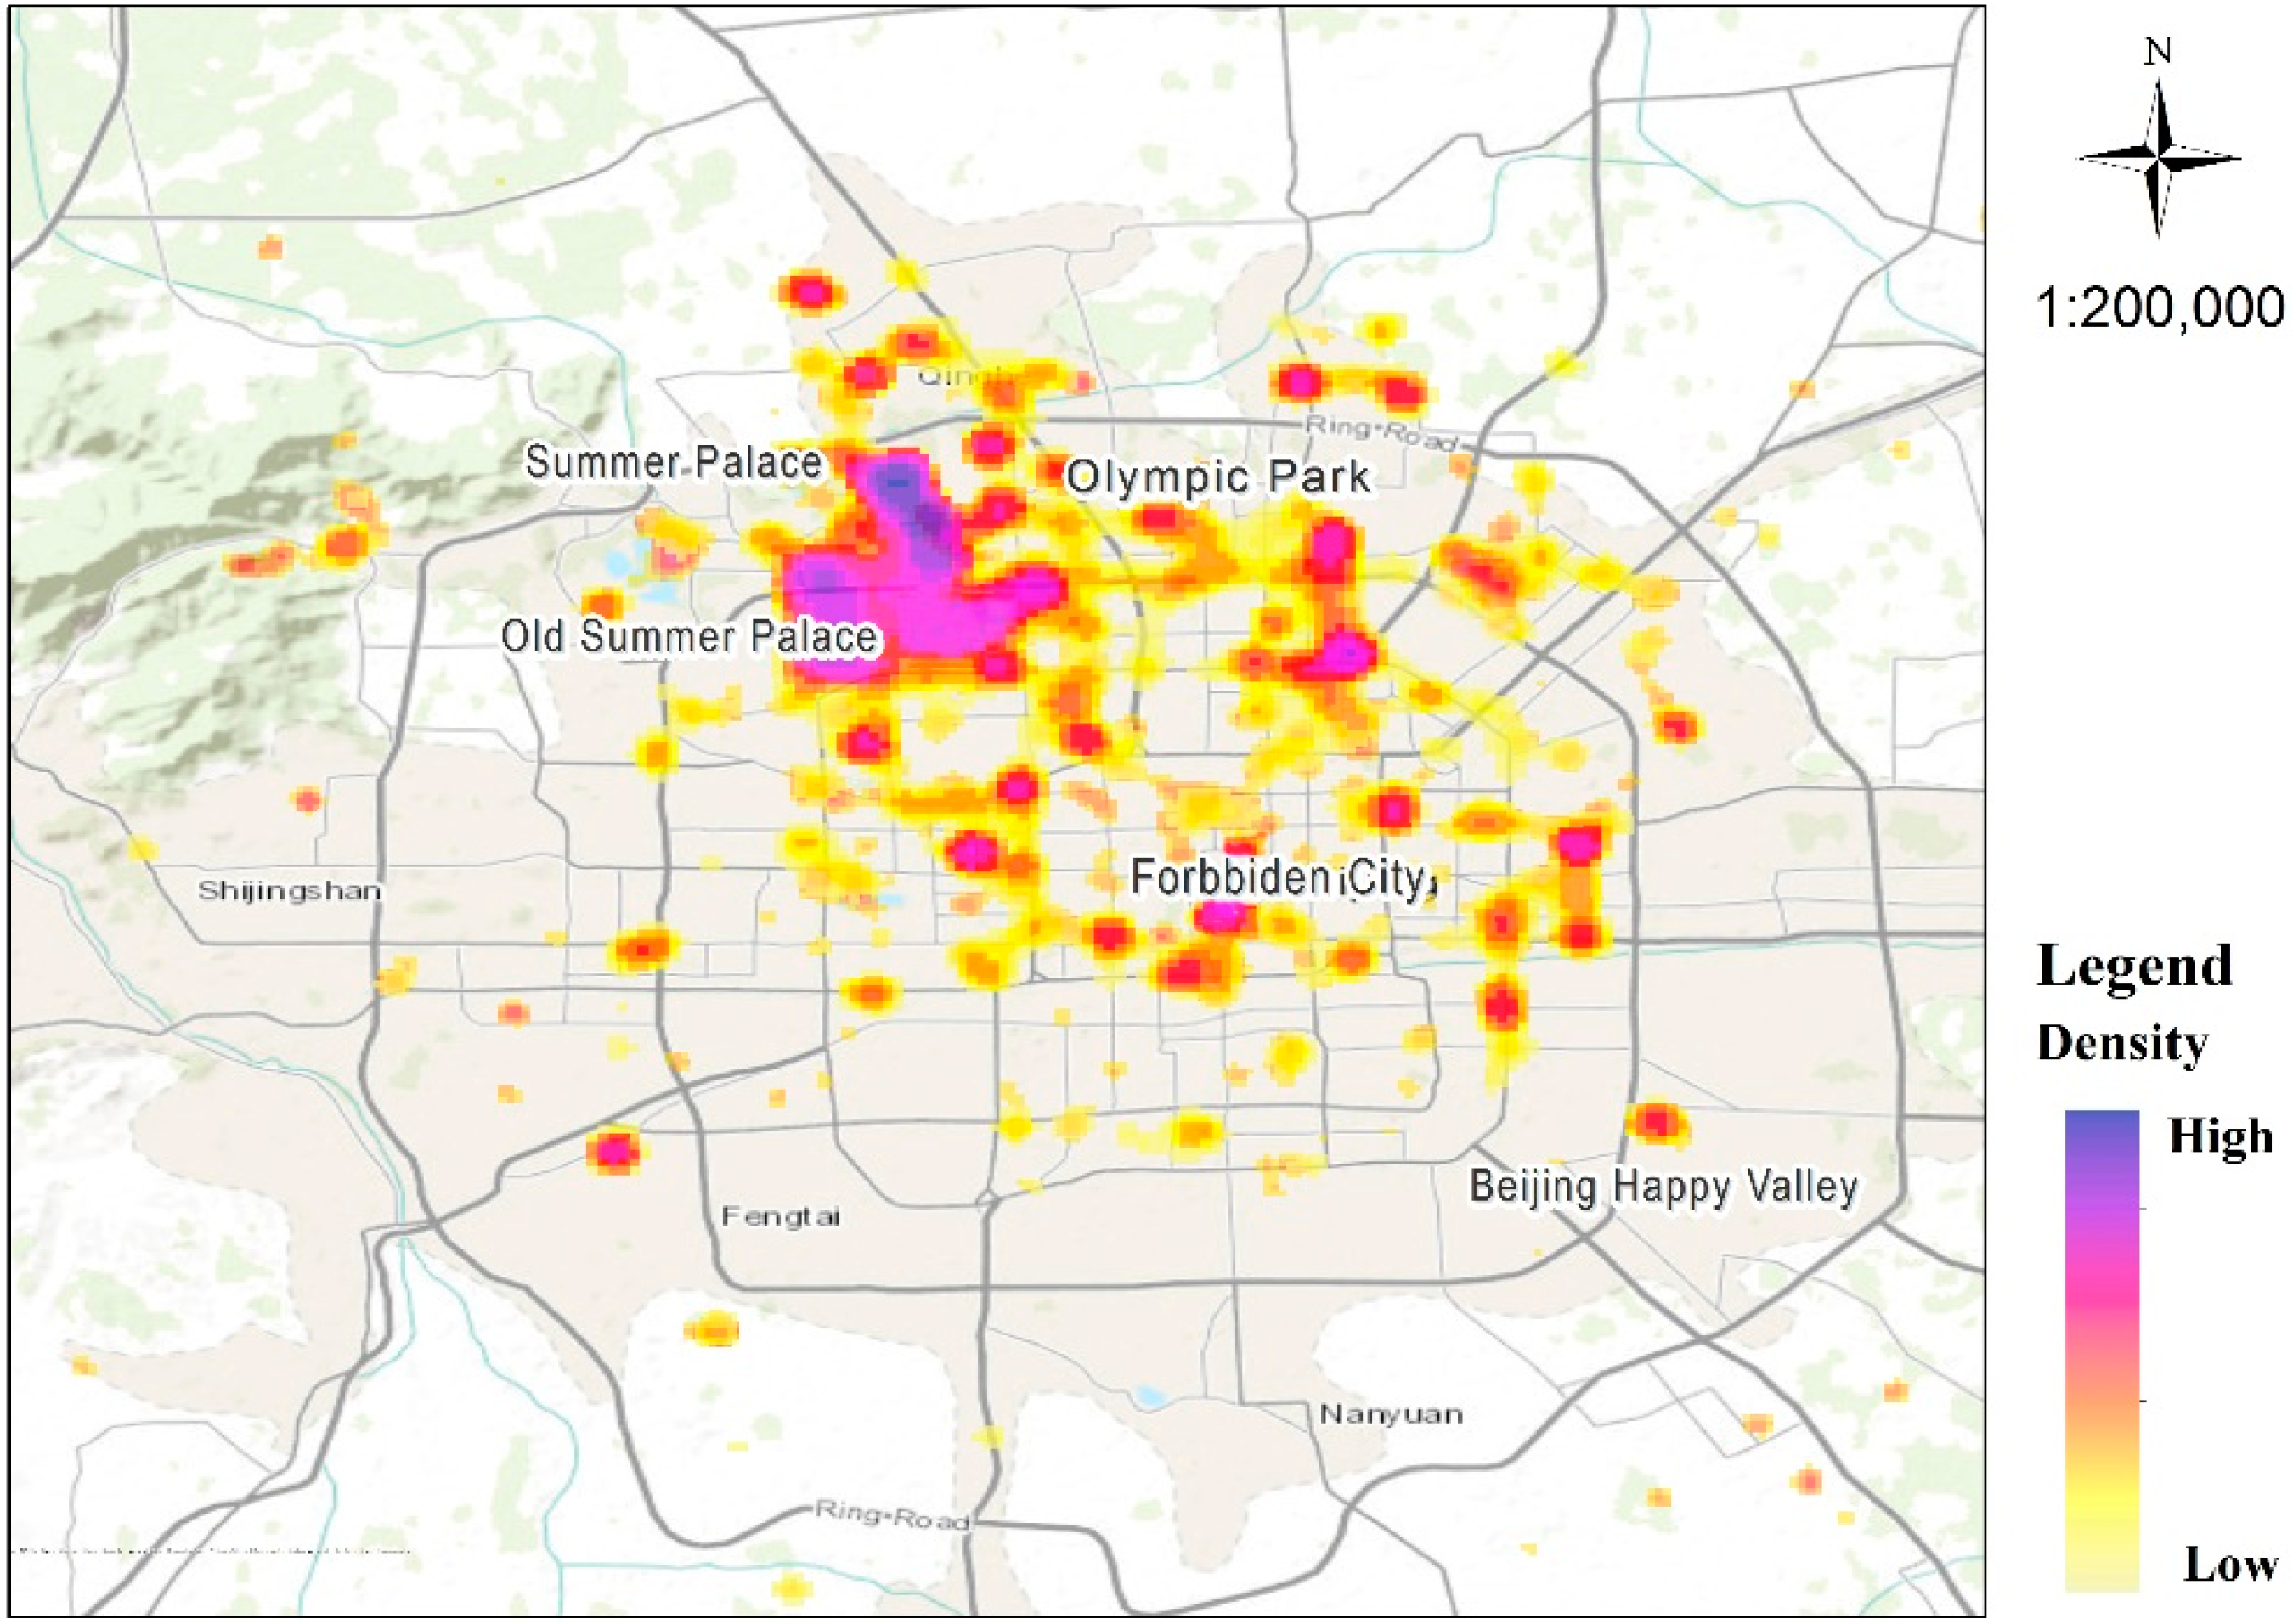
In addition, the selection of recreational places as study objects was determined by related research [8,29,42,43], popular tourist attractions on the internet, and from the results of kernel density estimation. Related work and website information were consulted prior to selection. Kernel density estimation of recreation activities, as denoted by the center of low-speed GPS segments, was applied to get the hotspots from the data. A similar kernel density-based clustering algorithm was proposed in Zhang et al. [31] to detect urban residential hotspots from GPS data collected by floating cars. The results of kernel density estimation are illustrated in Figure 4, where the darker color represents a higher density of recreation activities.
The spots in blue, purple or red in Figure 4 are popular locations where many outdoor visits were detected from GPS traces. Comparing hotspots with the geographic positions of the prior research-based selection, the locations with high density in the prior set were selected as the study locations. This preliminary estimation served for the selection of recreational places rather than the detailed analysis of recreational preference. Therefore, features like the length of visits and seasonality were not considered.
4.2. Weights and Volatilization Coefficient
Section 3 introduced the basic framework of the model, where some parameters are unknown, including integration weights. These were determined in the following experiment. Given that the optimal parameters are the values that make the line fitting results most closely match the true visiting rates, there were overall five unknown parameters in the model: wτ, wA, ρ, α, and η. In this experiment, only wτ, wA, and ρ were tested. α was fixed as 1 for the sake of simplification, while η is not discussed, as it was not important in this case, but will be explored in future studies.
The datasets were divided into two periods to mimic how people visit recreational places in relation to previous activities and online traces in a pheromone pattern. As Figure 5 shows, spatio-temporal activity traces in the first period affected visitation in the second period through recreational pheromones.
Recreational pheromones depend on the first period dataset, influencing the visits in the second period in turn, as analyzed through Ordinary Least Squares (OLS) regression analysis. The independent variables were calculated from the first period by Equations (3) and (5). The dependent variable was extracted from the second period, that is, the true visiting rate (n/N) for the second period.
In this case, the pheromone concentrations in online space and the real space were computed and normalized according to Equations (3), (5), and (6). The two spaces were integrated by Equation (7). To obtain the integration weights for Equation (7) and the volatility coefficient for Equation (3), a regression analysis was carried out as in Equation (8). The volatility coefficient was tested for 0.7, 0.8 and 0.9, and compared with the result using the non-volatile coefficient. Table 1 shows that 0.9 was the optimal value for ρ. It outperformed the other two values and the non-volatile coefficient. The weight assignments for Equation (10), thus, were wτ = 0.61, and wA = 0.39, respectively; therefore,
where τi and Ai are normalized values.
To evaluate the performance of various models, we adopted the R-squared value as the main measure. R-squared indicates the overall distance from each fitting output to the true visit and indicates how close the evaluation results are to the true attractiveness. The higher the value, the closer the estimation is to the true attractiveness and thus the better the performance.
4.3. Comparison of Methods and Evaluation Results
In this section, by comparing the proposed Pheromone-based Fusion Model with the other methods, we demonstrated the advantages of combining online and offline traces with a pheromone mechanism. We also explored the effectiveness of using the pheromone idea in human activity analysis. The approach based solely on online data [28] was utilized as a baseline method for comparative purposes.
Summarizing the performance of all the methods in terms of R-squared, the Pheromone-based Fusion Model is superior to the models based on single-source, reaching 0.575 (Table 2). This approach as proposed in this paper demonstrates an advantage in balancing the similarity and differences of two kinds of traces and modeling reliability using the pheromone mechanism. The method solely based on GPS data, which computes the recreational pheromone in real space, also shows a good performance (0.497) given the effectiveness of the pheromone pattern, although R-squared value of the Pheromone-based Fusion Model is higher (0.575).
In the regression analysis, the Pheromone-based Fusion Model has a high R-squared value, ranging up to 57.5%, and corresponding to spatio-temporal behavior patterns. Thus, the evaluation results are of significance for future research. In Figure 6, the fitting results based on the OLS regression method are compared with the baselines. The proposed Pheromone-based Fusion Model outperformed the other two methods. Nevertheless, the 27th and 28th locations had the largest residuals, where the true values were larger than the fitted values, probably resulting from special events or sampling error.
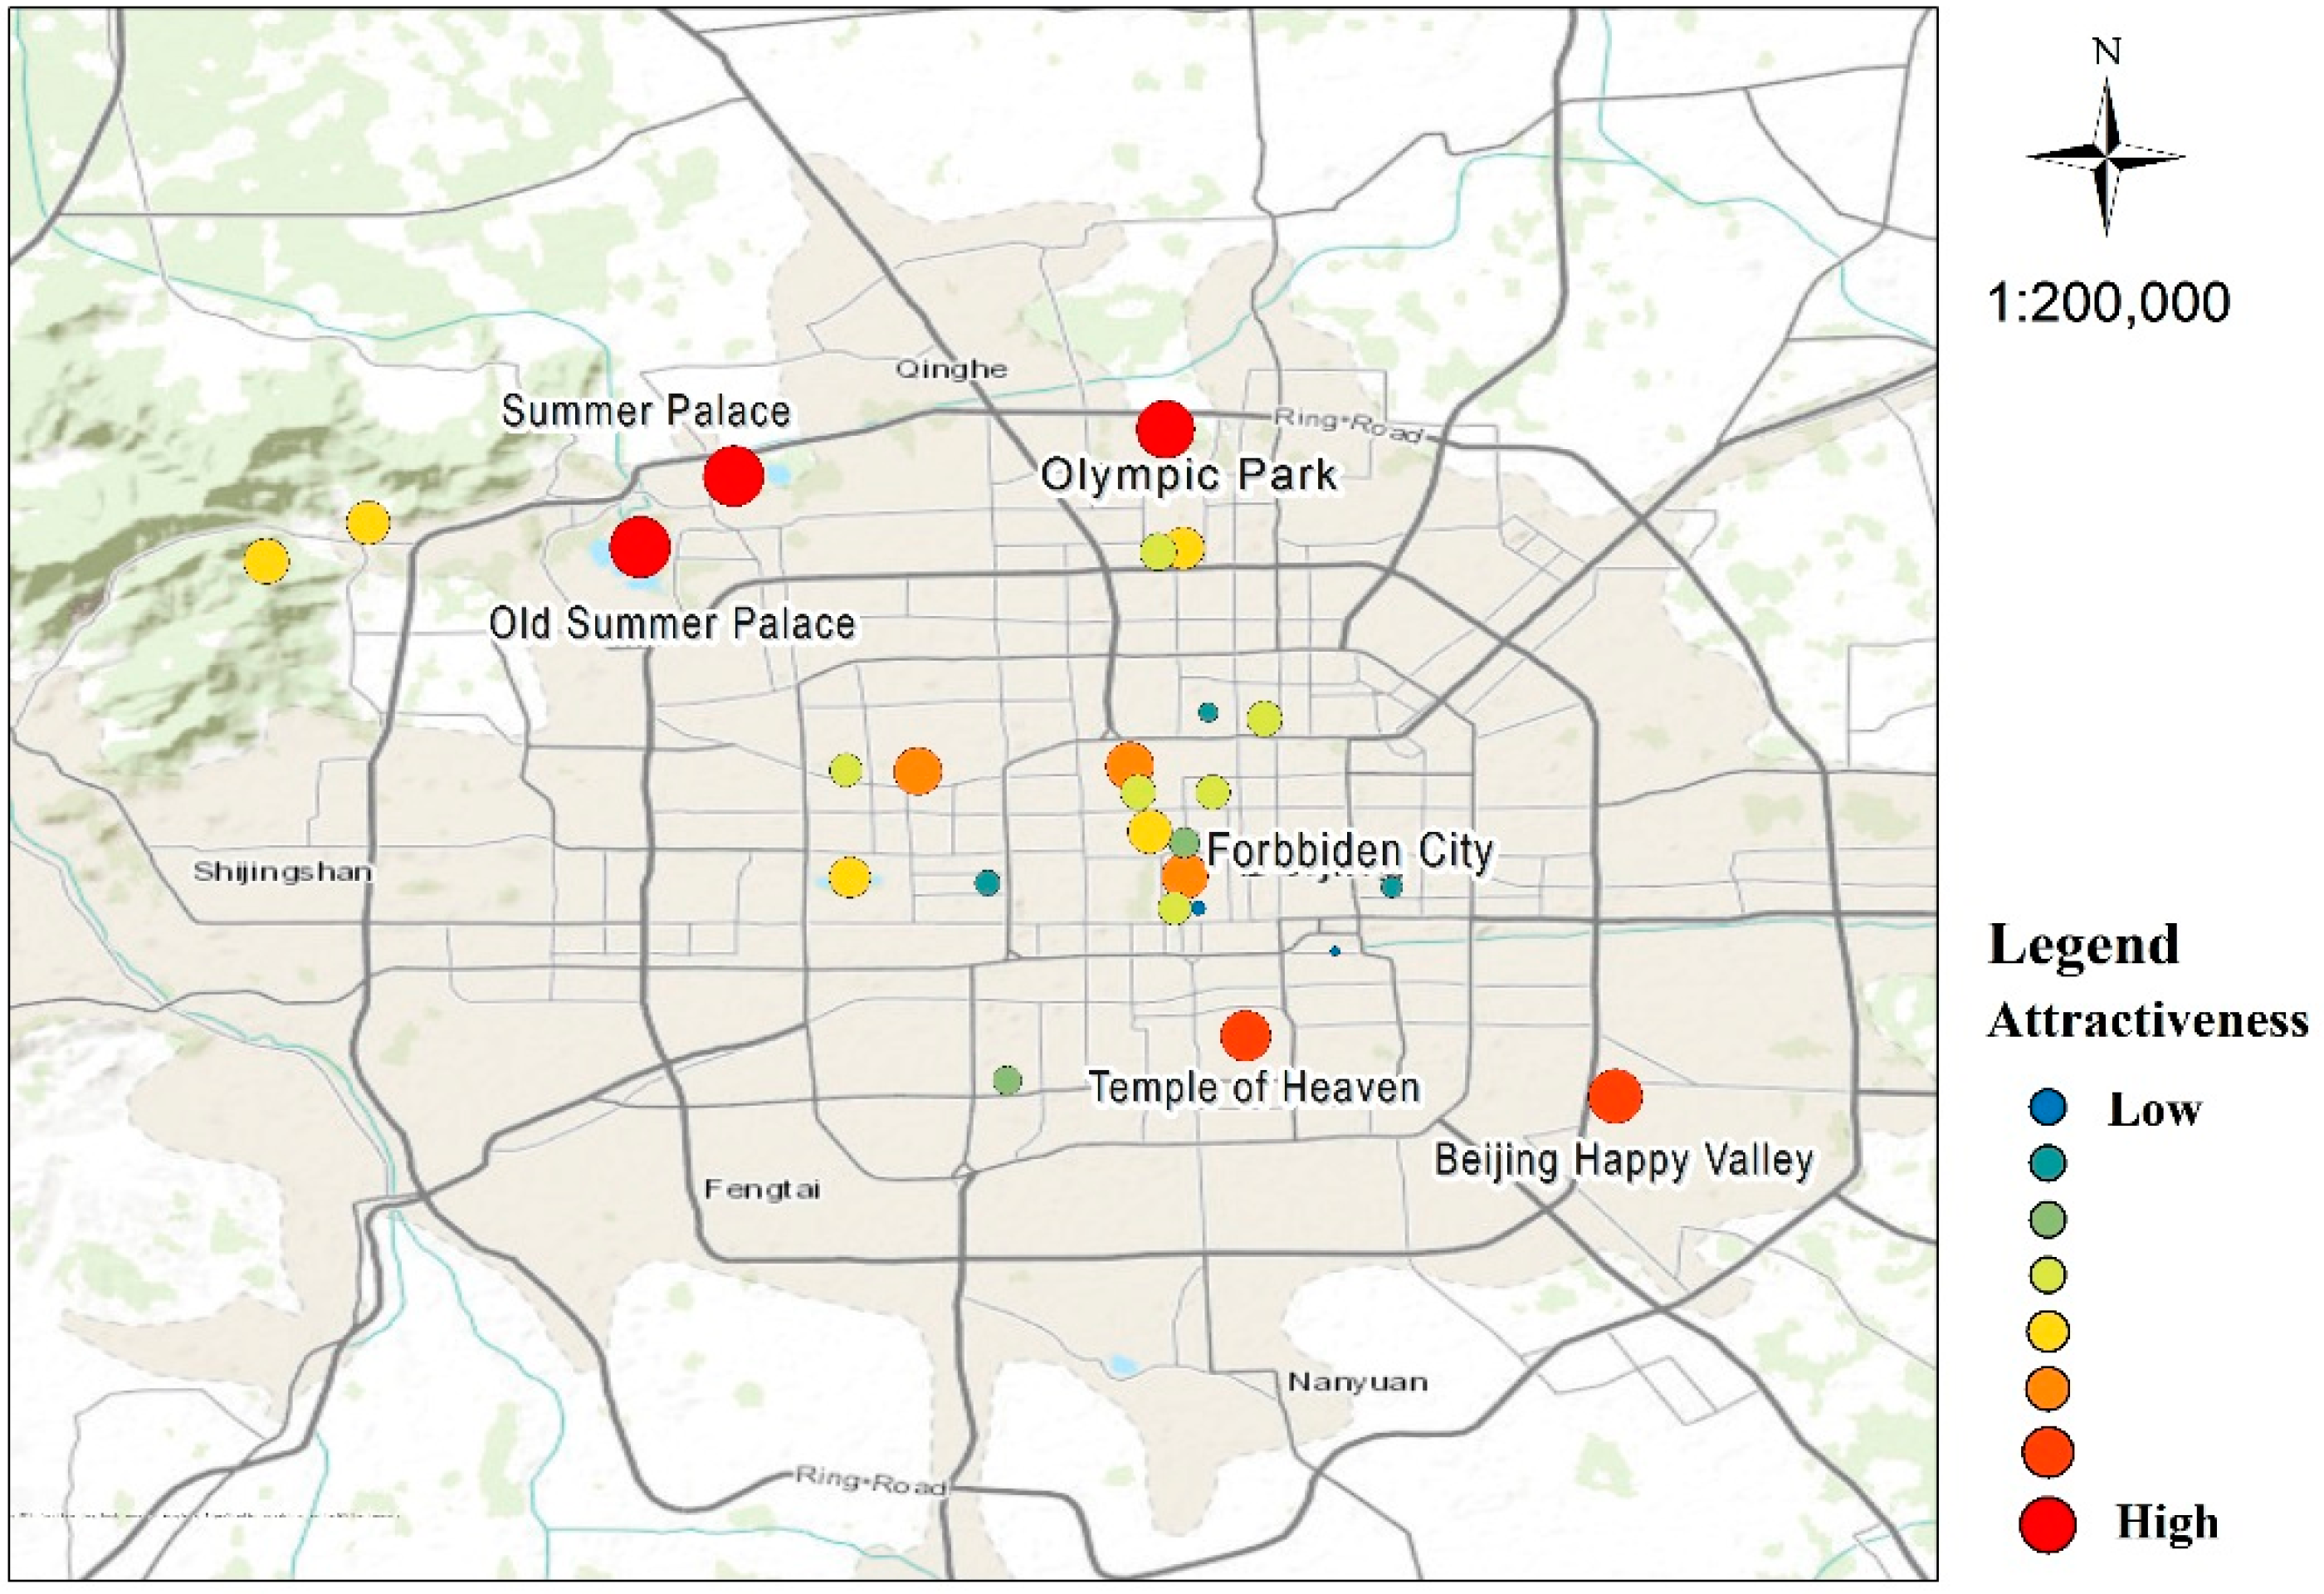
Using the Pheromone-based Fusion Model, the destination attractiveness of 29 urban landscapes was evaluated, based on overall five-year datasets. The spatial distribution and pheromone concentrations are shown in Figure 7. Red points indicate high pheromone concentrations while light blue indicates a low concentration. The three red points located in the north had the highest pheromones, representing the Summer Palace, Olympic Park, and the Old Summer Palace, respectively. Great wall has a very high pheromone concentration, though it is not contained in Figure 7.
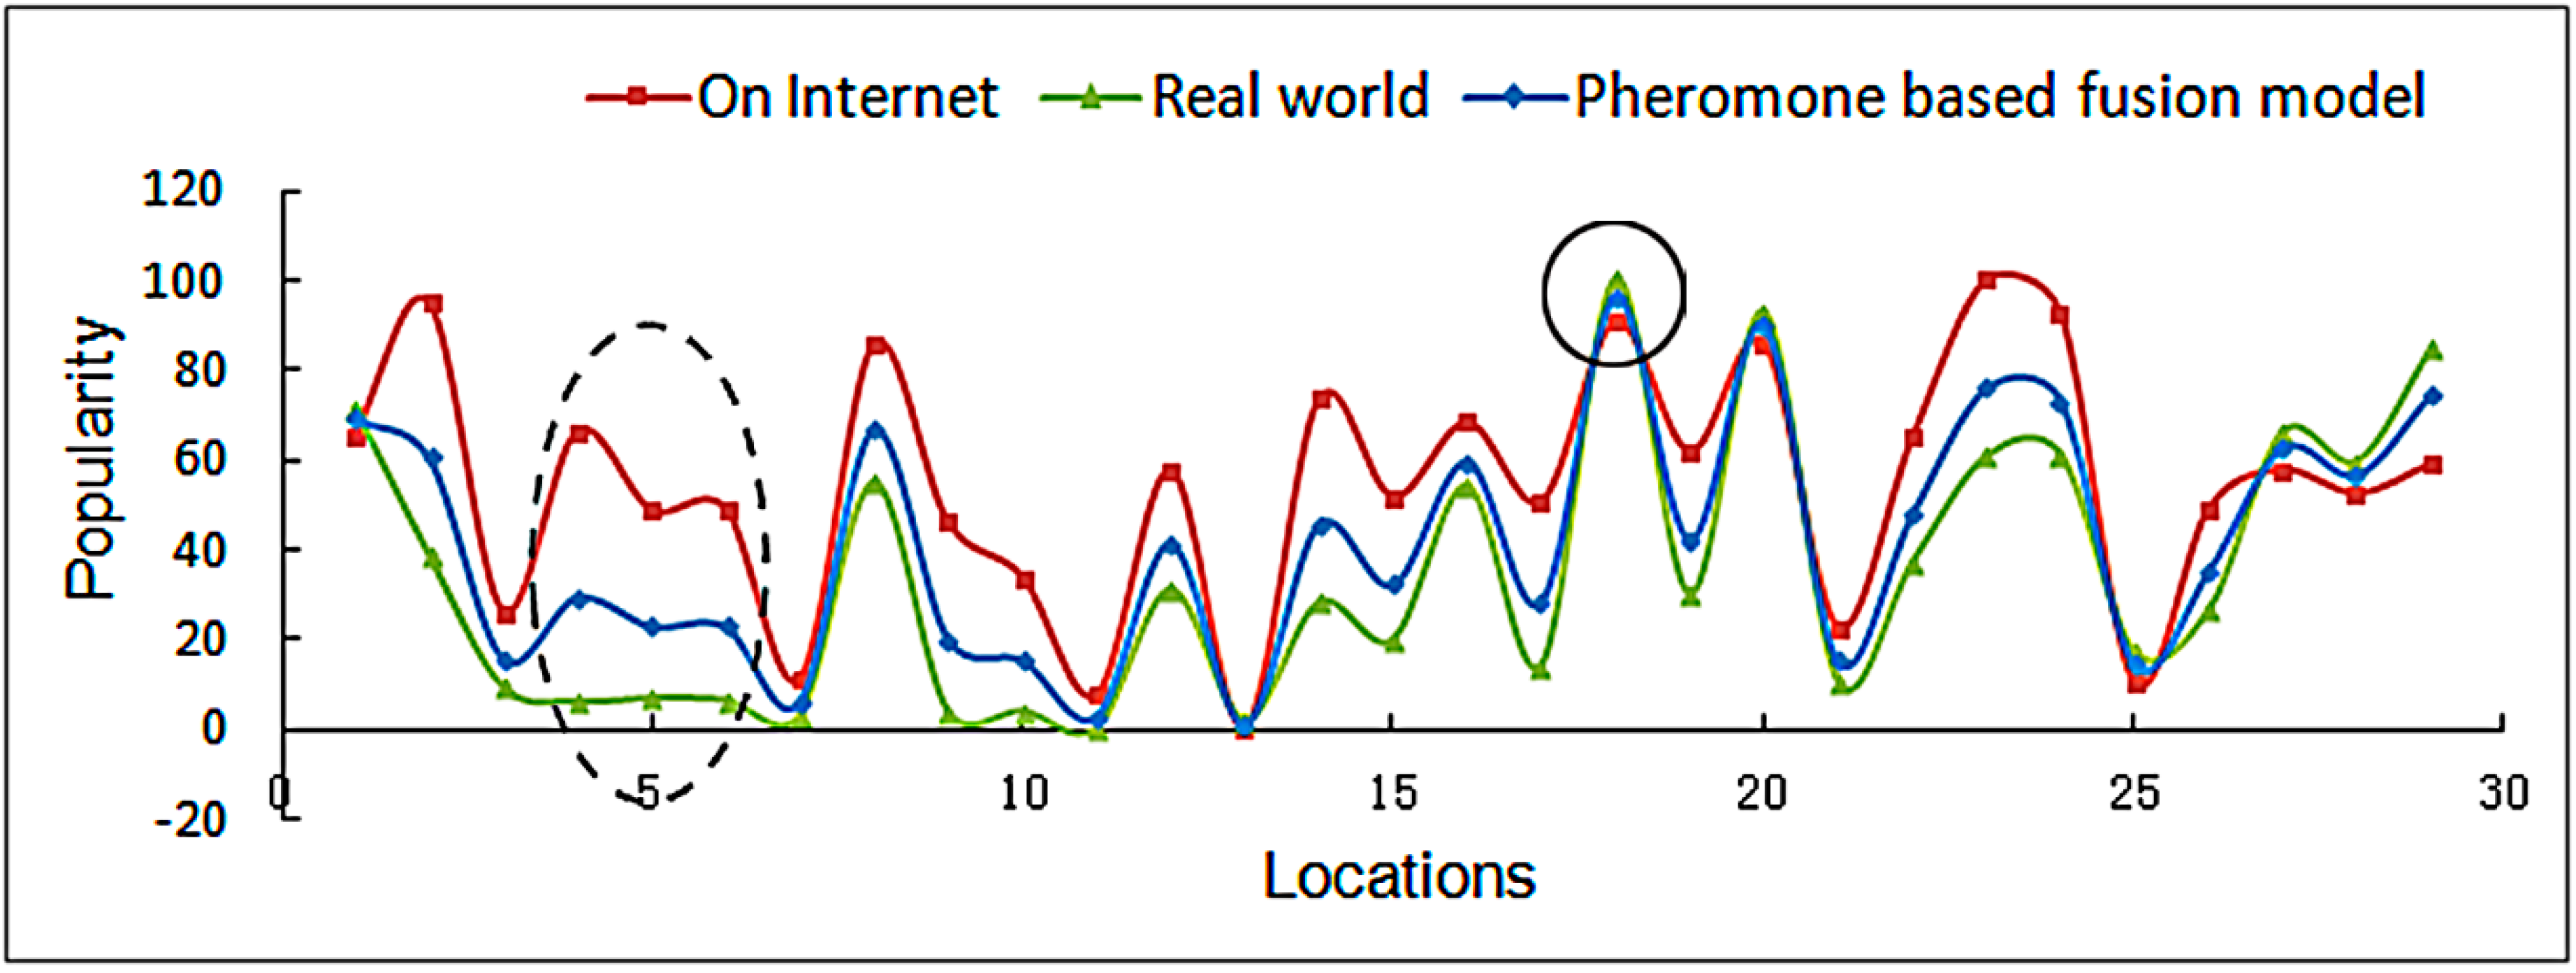
An evaluation of the three tested methods, based on five-year data, is shown in Figure 8. The locations with high pheromone concentrations show minor discrepancies in the two spaces (online and offline) and both spaces have relatively high concentrations. The Summer Palace, highlighted by the small black circle in Figure 8, had the highest pheromone concentration due to the high profile and frequent visitation behaviors to the Summer Palace both on the internet and in the real world.
However, certain places, highlighted by the dotted line circle in Figure 8, showed discrepancy between online and real world visits, with high online visits but low visitation rates in the real space. This was likely caused by long-time dwellers or repeat visitors in offline samples, people who visit quiet, beautiful, and accessible places rather than crowded tourist attractions. In contrast, the online pheromone tends to concentrate on iconic attractions. Therefore, a high proportion of long-time dwellers have a great influence on the online and offline weight assignments in the fusion model (wτ = 0.61, wA = 0.39). It could be reasonably argued that, compared to a sample consisting totally of tourists, the offline visiting traces in the real world have a larger weight in this kind of situation.
These results were also compared with traditional methods such as that proposed by Li [8], exploring the attractiveness of Beijing urban park wetlands using statistical data and surveys. In the traditional method, the five top recreational attractive parks are the Summer Palace, Olympic Park, Qinglong Lake Park, Beihai Park, and the Old Summer Palace. The Summer Palace, Olympic Park, and the Old Summer Palace had the highest rankings in the Pheromone-based Fusion Model as well. Nevertheless, the objects studied using the proposed method included famous landmarks along with park wetlands. Therefore, apart from the availability of recreational activities, uniqueness and tourism value were also considered.
Digital data reflect human activity patterns objectively, collected as traces. The proposed Pheromone-based Fusion Model simulates circumstances and contexts where people are influenced by information left by others much like pheromone patterns found among insects. This new method corresponds with the volatile nature of public preferences, as it is highly adaptable to time and place. The adaptive ability makes it possible to explore the attractiveness of a recreational site during a specific period (seasons, national holidays, etc.). This adaptive ability makes the Pheromone-based Fusion Model applicable to various regions with diverse information richness.
In addition, the recreational attraction results in the experiment were time limited because of the information volatilization. The pheromone concentrations only indicate the near future situation after comment time (September 2012 in this case), and special events will change that. For example, the Beijing Olympic Game made the Bird-Nest and Water Cube high-profile attractions, but, as time goes by, their attractiveness recedes.
5. Conclusions
In this paper, a new approach, the Pheromone-based Fusion Model, is proposed to mine behavior patterns and evaluate the attractiveness of places, integrating GPS data and immense online data, based on the pheromone trail analogy. There is remarkable similarity between pheromone-related insect foraging behaviors and recreation activities of human beings that can be robustly used to mine spatio-temporal behavior patterns. This new method balances online and offline preferences, and exposes the influences of previous activities on later behaviors based on pheromone mechanisms. Furthermore, this new Pheromone-based Fusion Model evaluates the attractiveness of destinations.
The model was validated in experiments, outperforming the baselines and verifying its effectiveness. These findings might have value in practice. The Pheromone-based Fusion Model will be applied in further studies to understand the experience and impressions of visitors, thus to act as a meaningful guide to urban planners and managers when managing recreational resources.
However, the rate at which attractiveness will vaporize in the future is not addressed. Experiments at different temporal resolutions are needed. In this case, the amount of offline data is not adequate for high temporal resolutions; the outcome would be not statistically significant if we divide the time window into smaller slices. Thus, results might mislead analysis. For the sake of accuracy, we choose a reliable time window; we did not investigate different temporal resolutions.
Finally, further research on the fusion of trajectory datasets and online social media datasets is needed. One direction is the quest for richer semantics in mobility data, assisted by the online texts and photos. A second direction is exploring the relationship of scale to fusion. The individual level is quite different from a group level when fusing online and offline traces, and behavior patterns are quite different among various groups, yet another direction to explore.
Acknowledgments
This work was supported by the National Natural Science Foundation of China under Grant Nos. 41671442, 41571430, and 41271442. We would also like to thank Steve McClure for his kind help and suggestions.
Author Contributions
L.T. and Q.Z. conceived and designed the algorithm; Q.Z. and C.R. performed the experiments and analyzed the result; X.Z and Q.L. contributed materials; and Q.Z. and L.T. wrote the paper.
Conflicts of Interest
The authors declare no conflict of interest. The founding sponsors had no role in the design of the study; in the collection, analyses, or interpretation of data; in the writing of the manuscript, and in the decision to publish the results.
References
- Plog, S.C. Why destination areas rise and fall in popularity. Cornell Hotel Restaur. Adm. Q. 1974, 14, 55–58. [Google Scholar] [CrossRef]
- Lynch, K. Reconsidering the image of the city. In Cities of the Mind: Images and Themes of the City in the Social Sciences; Rodwin, L., Hollister, R.M., Eds.; Springer: Boston, MA, USA, 1984; pp. 151–161. [Google Scholar]
- Debbage, K.G. Spatial behavior in a bahamian resort. Ann. Tour. Res. 1991, 18, 251–268. [Google Scholar] [CrossRef]
- Lew, A.; McKercher, B. Modeling tourist movements—A local destination analysis. Ann. Tour. Res. 2006, 33, 403–423. [Google Scholar] [CrossRef]
- Quercia, D.; Schifanella, R.; Aiello, L.M. The Shortest Path to Happiness: Recommending Beautiful, Quiet, and Happy Routes in the City. In Proceedings of the 25th ACM Conference on Hypertext and Social Media, Santiago, Chile, 1–4 September 2014. [Google Scholar]
- Lloyd, R.E.; Ader, R. A cognitive model for recreational spatial behaviour in an urban area. Southeast. Geogr. 1980, 20, 145–159. [Google Scholar] [CrossRef]
- Otero Pastor, I.; Casermeiro Martinez, M.A.; Ezquerra Canalejoa, A.; Esparcia Marino, P. Landscape evaluation: Comparison of evaluation methods in a region of Spain. J. Environ. Manag. 2007, 85, 204–214. [Google Scholar] [CrossRef] [PubMed]
- Li, F.; Sun, R.H.; Chen, L.D. Recreational attraction of urban park wetlands in Beijing. Chin. J. Appl. Ecol. 2012, 23, 2093–2099. [Google Scholar]
- Giannotti, F.; Nanni, M.; Pinelli, F.; Pedreschi, D. Trajectory Pattern Mining. In Proceedings of the 13th ACM SIGKDD International Conference on Knowledge Discovery and Data Mining, San Jose, CA, USA, 12–15 August 2007. [Google Scholar]
- Giannotti, F.; Nanni, M.; Pedreschi, D.; Pinelli, F.; Renso, C.; Rinzivillo, S.; Trasarti, R. Unveiling the complexity of human mobility by querying and mining massive trajectory data. VLDB J. 2011. [Google Scholar] [CrossRef]
- Ahas, R.; Aasa, A.; Mark, Ü.; Pae, T.; Kull, A. Seasonal tourism spaces in Estonia: Case study with mobile positioning data. Tour. Manag. 2007, 28, 898–910. [Google Scholar] [CrossRef]
- Ahas, R.; Aasa, A.; Roose, A.; Mark, Ü.; Silm, S. Evaluating passive mobile positioning data for tourism surveys: An Estonian case study. Tour. Manag. 2008, 29, 469–486. [Google Scholar] [CrossRef]
- Toader, B.; Sprumont, F.; Faye, S.; Popescu, M.; Viti, F. Usage of smartphone data to derive an indicator for collaborative mobility between individuals. ISPRS Int. J. Geo.-Inf. 2017. [Google Scholar] [CrossRef]
- Zhou, X.L. Understanding spatiotemporal patterns of biking behavior by analyzing massive bike sharing data in Chicago. PLoS ONE 2015. [Google Scholar] [CrossRef] [PubMed]
- Li, L.; Yang, L.; Zhu, H.; Dai, R. Explorative analysis of Wuhan intra-urban human mobility using social media check-in data. PLoS ONE 2015, 10, e0135286. [Google Scholar] [CrossRef] [PubMed]
- Liu, Y.; Sui, Z.; Kang, C.; Gao, Y. Uncovering patterns of inter-urban trip and spatial interaction from social media check-in data. PLoS ONE 2014. [Google Scholar] [CrossRef] [PubMed]
- Jurdak, R.; Zhao, K.; Liu, J.; AbouJaoude, M.; Cameron, M.; Newth, D. Understanding human mobility from twitter. PLoS ONE 2014. [Google Scholar] [CrossRef] [PubMed]
- Zeile, P.; Resch, B.; Exner, J.-P.; Sagl, G. Urban emotions: Benefits and risks in using human sensory assessment for the extraction of contextual emotion information in urban planning. In Planning Support Systems and Smart Cities; Geertman, S., Ferreira, J.J., Goodspeed, R., Stillwell, J., Eds.; Springer International Publishing: Cham, Switzerland, 2015. [Google Scholar]
- Cord, A.F.; Roeßiger, F.; Schwarz, N. Geocaching data as an indicator for recreational ecosystem services in urban areas: Exploring spatial gradients, preferences and motivations. Landsc. Urban Plan 2015, 144, 151–162. [Google Scholar] [CrossRef]
- Zheng, Y.; Zhang, L.; Xie, X.; Ma, W.-Y. Mining Interesting Locations and Travel Sequences from Gps Trajectories. In Proceedings of the 18th Tnternational Conference on World Wide Web, Madrid, Spain, 20–24 April 2009. [Google Scholar]
- McKercher, B.; Shoval, N.; Ng, E.; Birenboim, A. First and repeat visitor behaviour: GPS tracking and GIS analysis in Hong Kong. Tour. Geogr. 2012, 14, 147–161. [Google Scholar] [CrossRef]
- Edwards, D.; Griffin, T. Understanding tourists’ spatial behaviour: GPS tracking as an aid to sustainable destination management. J Sustain. Tour. 2013, 21, 580–595. [Google Scholar] [CrossRef]
- Zheng, Y.; Xie, X. Learning travel recommendations from user-generated gps traces. ACM Trans. Intell. Syst. Technol. 2011, 2, 1–29. [Google Scholar] [CrossRef]
- Chen, Y.Y.; Cheng, A.J.; Hsu, W.H. Travel recommendation by mining people attributes and travel group types from community-contributed photos. IEEE Trans. Multimed. 2013, 15, 1283–1295. [Google Scholar] [CrossRef]
- Crandall, D.J.; Backstrom, L.; Huttenlocher, D.; Kleinberg, J. Mapping the World’s Photos. In Proceedings of the 18th International Conference on World Wide Web, Madrid, Spain, 20–24 April 2009. [Google Scholar]
- Kisilevich, S.; Mansmann, F.; Keim, D. P-dbscan: A Density Based Clustering Algorithm for Exploration and Analysis of Attractive Areas Using Collections of Geo-Tagged Photos. In Proceedings of the 1st International Conference and Exhibition on Computing for Geospatial Research & Application, Washington, DC, USA, 21–23 June 2010. [Google Scholar]
- Gu, Z.; Zhang, Y.; Chen, Y.; Chang, X. Analysis of attraction features of tourism destinations in a mega-city based on check-in data mining—A case study of ShenZhen, China. ISPRS Int. J. Geo.-Inf. 2016, 5, 210. [Google Scholar] [CrossRef]
- Zhang, X.; Zhao, W.D.; Jiang, W.P. Road landscape evaluation and the most beautiful route planning based on big website data. J. Tongji Univ. 2016, 44, 383–388. [Google Scholar]
- Zhu, H.; Liu, J.M.; Tao, H.; Zhang, J. Evaluation and spatial analysis of tourism resources attraction in BeiJing based on the internet information. J. Nat. Res. 2015, 30, 2081–2094. [Google Scholar]
- Subramaniyaswamy, V.; Vijayakumar, V.; Logesh, R.; Indragandhi, V. Intelligent travel recommendation system by mining attributes from community contributed photos. Procedia Comput. Sci. 2015, 50, 447–455. [Google Scholar] [CrossRef]
- Zhang, P.; Deng, M.; Shi, Y.; Zhao, L. Detecting hotspots of urban residents’ behaviours based on spatio-temporal clustering techniques. GeoJournal 2016. [Google Scholar] [CrossRef]
- Chen, J.; Shaw, S.-L. Representing the spatial extent of places based on flickr photos with a representativeness-weighted kernel density estimation. In GIScience 2016: Geographic Information Science; Miller, J.A., O’Sullivan, D., Wiegand, N., Eds.; Springer International Publishing: Cham, Switzerland, 2016. [Google Scholar]
- Hu, Y.; Gao, S.; Janowicz, K.; Yu, B.; Li, W.; Prasad, S. Extracting and understanding urban areas of interest using geotagged photos. Comput. Environ. Urban Syst. 2015, 54, 240–254. [Google Scholar] [CrossRef]
- Dorigo, M.; Maniezzo, V.; Colorni, A. Ant system: Optimization by a colony of cooperating agents. IEEE Trans. Syst. Man. Cybern. Part B 1996, 26, 29–41. [Google Scholar] [CrossRef] [PubMed]
- Deneubourg, J.L.; Goss, S. Collective patterns and decision-making. Ethol. Ecol. Evol. 1989, 1, 295–311. [Google Scholar] [CrossRef]
- Dong, X.L.; Srivastava, D. Big Data Integration. In Proceedings of the 2013 IEEE 29th International Conference on Data Engineering (ICDE), Brisbane, Australia, 8–12 April 2013. [Google Scholar]
- Li, Q.; Li, Y.; Gao, J.; Zhao, B.; Fan, W.; Han, J. Resolving Conflicts in Heterogeneous Data by Truth Discovery and Source Reliability Estimation. In Proceedings of the 2014 ACM SIGMOD International Conference on Management of Data, Snowbird, UT, USA, 22–27 June 2014. [Google Scholar]
- Wu, X.D.; Zhu, X.Q.; Wu, G.Q.; Ding, W. Data mining with big data. IEEE Trans. Knowl. Data Eng. 2014, 26, 97–107. [Google Scholar]
- Malíčková, M.; Yates, C.; Boďová, K. A stochastic model of ant trail following with two pheromones. arXiv 2015. [Google Scholar]
- Fuzzy Clustering. Available online: https://reference.wolfram.com/legacy/applications/fuzzylogic/Manual/12.html (accessed on 26 October 2016).
- Zadeh, L.A. Similarity relations and fuzzy orderings. Inf. Sci. 1971, 3, 177–200. [Google Scholar] [CrossRef]
- Zhu, H.; Feng, J. The hierarchy and distribution of city park in Beijing. Urban Stud. 2008, 4, 76–83. [Google Scholar]
- China Highlights. Available online: http://www.chinahighlights.com/beijing/attraction/ (accessed on 9 October 2015).
Figure 1.
Digital trails left by a spatio-temporal behavior.

Figure 2.
Characteristics of the pheromone release mechanism: (a) pheromone accumulation; and (b) accumulation in different periods.
Figure 2.
Characteristics of the pheromone release mechanism: (a) pheromone accumulation; and (b) accumulation in different periods.

Figure 3.
Age composition.

Figure 4.
Kernel density estimation for recreation activities.

Figure 5.
Effects of pheromone on future visitors.

Figure 6.
OLS regression analysis results: (a) Pheromone-based Fusion Model; (b) offline GPS trajectories; and (c) online digital trace.
Figure 6.
OLS regression analysis results: (a) Pheromone-based Fusion Model; (b) offline GPS trajectories; and (c) online digital trace.
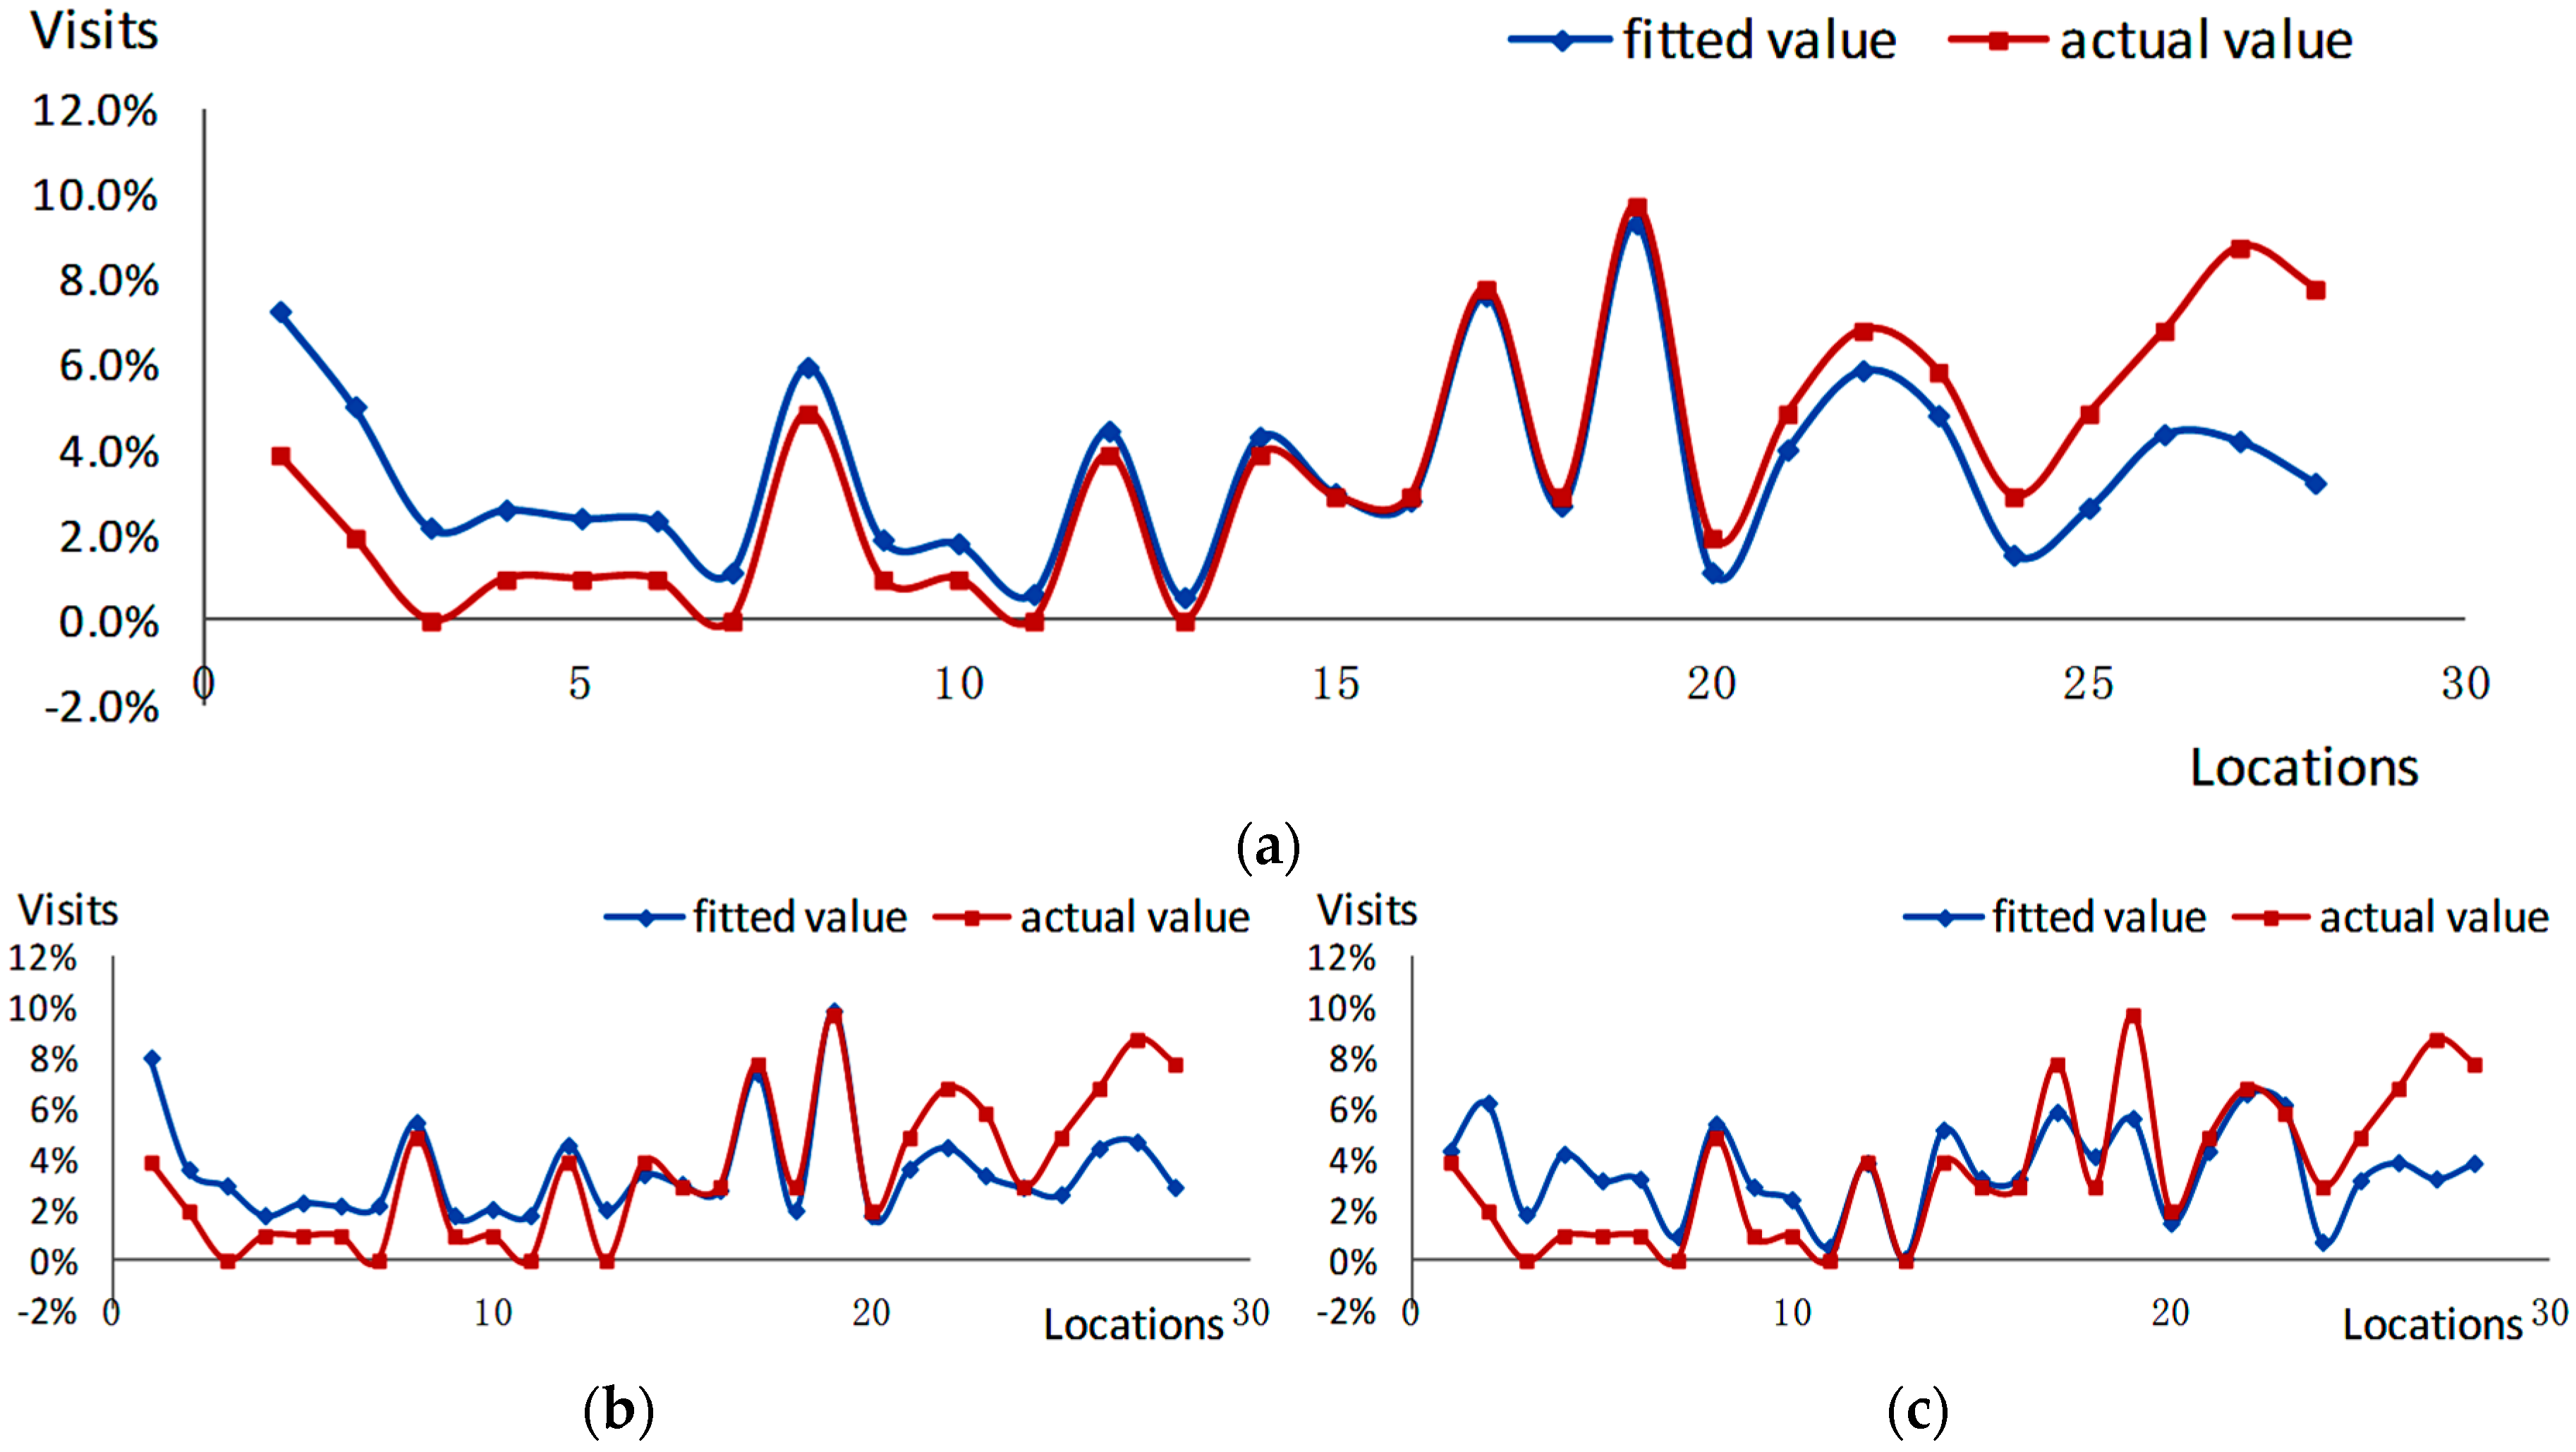
Figure 7.
Spatial distribution of popular locations in Beijing.

Figure 8.
Contrasting evaluations.


Table 1.
Regression Results for Different Coefficients (ρ).
| Volatilization Coefficient ρ | R-squared | The Correlation between τ 1 and n 2 |
|---|---|---|
| 0.7 | 0.570 | 0.702 |
| 0.8 | 0.567 | 0.700 |
| 0.9 | 0.575 | 0.719 |
| Non-volatile(1.0) | 0.556 | 0.685 |
1 τ: offline pheromone concentrations; 2 n: future visitation.
Table 2.
The comparison of regression results.
| Method | R-squared |
|---|---|
| Based solely on GPS data | 0.497 |
| Based solely on online data | 0.391 |
| Pheromone-based Fusion Model | 0. 575 |
© 2017 by the authors. Licensee MDPI, Basel, Switzerland. This article is an open access article distributed under the terms and conditions of the Creative Commons Attribution (CC BY) license (http://creativecommons.org/licenses/by/4.0/).
Share and Cite
MDPI and ACS Style
Tang, L.; Zou, Q.; Zhang, X.; Ren, C.; Li, Q. Spatio-Temporal Behavior Analysis and Pheromone-Based Fusion Model for Big Trace Data. ISPRS Int. J. Geo-Inf. 2017, 6, 151. https://0-doi-org.brum.beds.ac.uk/10.3390/ijgi6050151
AMA Style
Tang L, Zou Q, Zhang X, Ren C, Li Q. Spatio-Temporal Behavior Analysis and Pheromone-Based Fusion Model for Big Trace Data. ISPRS International Journal of Geo-Information. 2017; 6(5):151. https://0-doi-org.brum.beds.ac.uk/10.3390/ijgi6050151
Chicago/Turabian StyleTang, Luliang, Qianqian Zou, Xia Zhang, Chang Ren, and Qingquan Li. 2017. "Spatio-Temporal Behavior Analysis and Pheromone-Based Fusion Model for Big Trace Data" ISPRS International Journal of Geo-Information 6, no. 5: 151. https://0-doi-org.brum.beds.ac.uk/10.3390/ijgi6050151
Note that from the first issue of 2016, this journal uses article numbers instead of page numbers. See further details here.