Article

Accuracy Assessment and Inter-Comparison of Eight Medium Resolution Forest Products on the Loess Plateau, China

1
School of Earth Sciences and Resources, China University of Geosciences, Beijing 100083 China
2
Key Laboratory of Land Surface Pattern and Simulation, Institute of Geographic Sciences and Natural Resources Research, CAS, Beijing 100101, China
3
University of Chinese Academy of Sciences, Beijing 100049, China
4
Satellite Environment Center, Ministry of Environmental Protection, Beijing 100094, China
5
Department of Microbiology and Plant Biology, and Center for Spatial Analysis, University of Oklahoma, Norman, Oklahoma 73019, USA
6
Ministry of Education Key Laboratory of Biodiversity Science and Ecological Engineering, Institute of Biodiversity Science, Fudan University, Shanghai, 200438, China
*
Author to whom correspondence should be addressed.
ISPRS Int. J. Geo-Inf. 2017, 6(5), 152; https://0-doi-org.brum.beds.ac.uk/10.3390/ijgi6050152
Submission received: 20 March 2017 / Revised: 2 May 2017 / Accepted: 11 May 2017 / Published: 14 May 2017
(This article belongs to the Special Issue Analysis and Applications of Global Land Cover Data)

Abstract

:
Forests play an important role in maintaining ecosystem services, especially in ecologically fragile areas such as the Loess Plateau (LP) in China. However, there is still great uncertainty in the spatial extent and distribution of forests in such a fragmented region. In order to examine the advantages and disadvantages of existing forest mapping products, we conducted a thorough accuracy assessment on the eight recent, medium resolution (30–50 m) products by using the LP in 2010 as the region of interest. These mapping products include Landsat and/or PALSAR images, including the forest products from GlobeLand30, FROM-GLC, Hansen, ChinaCover, NLCD-China, GLCF VCF, OU-FDL, and JAXA. The same validation data were used to assess and rank the accuracy of each product. Additionally, the spatial consistency of the different forest products and their dependence on the terrain were analyzed. The results showed that the overall accuracies of the eight forest products on the LP in 2010 were between 0.93 ± 0.003 and 0.97 ± 0.002 with a 95% confidence interval, and GlobeLand30 presented the highest overall accuracy (0.97 ± 0.002). Among them, the PALSAR-based products (OU-FDL and JAXA) indicated relatively high accuracies, while the six Landsat-based products showed a large diversity in the accuracy. According to the eight products, the total estimated forest area of the LP varied from 7.627 ± 0.077 to 10.196 ± 0.1 million ha with a 95% confidence interval. We also found that the consistency in the spatial distribution of forests between these maps: (1) increased substantially with increasing elevation until 2000m, but then decreased at higher elevations, and (2) showed mild variation along increasing slope, but had a slight rate of increase. Our findings implied that future forest mapping studies should consider topographical attributes such as elevation and slope in their final products. Our results are fundamental in guiding future applications of these existing forest maps.

1. Introduction

As the largest body of terrestrial ecosystems, forests play a dominant role in global ecosystem services [1], such as maintaining biodiversity [2], carbon storage [3], water conservation [4], and climate regulation [5]. Forest loss is followed by losses of ecosystem services. Although the global deforestation rate has slowed, it remains high in many countries and regions [6]. Reducing emissions from deforestation and forest degradation (REDD) is considered to be an important, cost-effective way to achieve large-scale emission reductions [7,8]. Since the end of the 20th century, the central government of China has implemented a set of forest restoration projects, including the Grain for Green (GFG) Project, the Natural Forest Protection Project, and the Three North Shelterbelt Project [9,10]. The Loess Plateau, an ecotone with a prototypically fragmented landscape, was selected as a pilot region for the GFG project and has also been an important region of interest for other projects. However, the current status (spatial extent and distribution) of the forests on the Loess Plateau (LP) continues to be uncertain, which hinders our ability to gauge the effectiveness of China’s ecological restoration projects and forest management practices. Therefore, an accurate evaluation of the existing forest products within a baseline year is important for characterizing the forest extent and distribution on the LP.
Remote sensing has become the primary approach for regional and global forest surveys [11,12]. Due to limitations in the availability of remote sensing data and the technological incapacity to acquire and process large amounts of remote sensing data prior to 2010, the existing global and regional forest maps were generally based on data obtained using sensors with coarse resolutions [13]. For example, these coarse platforms include the IGBP DISCOVER land cover data based on the Advanced Very High Resolution Radiometer (AVHRR) [14], the UMD Land Cover Data Set based on the AVHRR [15], the GLC2000 data based on the SPOT-VGT [16], the GlobCover data based on the MEdium Resolution Imaging Spectrometer (MERIS) [17], and the MCD12Q1 data based on the Moderate Resolution Imaging Spectroradiometer (MODIS) [18].
Since 2008, with the free release of all the Landsat archive data by United States Geological Survey (USGS), land cover and forest mapping efforts based on Landsat data have increased rapidly. These products include the global land cover data product (GlobeLand30) from the China National Geomatics Center of China (NGCC) [19] and the Finer Resolution Observation and Monitoring-Global Land Cover (FROM-GLC) dataset from the Tsinghua University [20]. Utilizing the Google Earth Engine (GEE) computing platform, Hansen et al. [11] used all the available Landsat 7 data for global forest dynamic monitoring. Based on this approach, the World Resources Institute (WRI) developed the Global Forest Watch program (http://www.globalforestwatch.org/). The University of Maryland’s Global Land Cover Facility Data Center (GLCF) also produced a global, 30-m resolution product named Landsat Tree Cover Continuous Fields (VCF) [21]. In addition to Landsat data, the ALOS/PALSAR data has also been widely used in recent years after the Japan Aerospace Exploration Agency (JAXA) released global forest maps in 2007, 2008, 2009, 2010, and 2015 at 25 m and 50 m resolutions [22]. In addition to the global scale products, several national scale forest mapping efforts have been made in China. Through the integration of PALSAR and MODIS/Landsat data, Qin et al. [13] generated a new forest map of China. Another land cover and land use product widely used in China is the NLCD-China from the Chinese Academy of Sciences [23], which has produced several epochs of datasets for 1990, 1995, 2000, 2005, 2010, and 2015. The ChinaCover dataset is another important land cover mapping product, which was generated by the 10-year Environmental Monitoring Program in China [24].
Sexton et al. [25] found that the global forest maps with coarse resolutions showed a large discrepancy. However, the performance and consistency of the aforementioned eight medium resolution forest maps in China are still unclear. Previous studies conducted inter-comparisons among some of the products; for example, Wang et al. [26] found substantial differences among the ChinaCover, FAO FRA, WRI, and NLCD-China data on forest area in China. The reasons for these uncertainties could be complicated, due to different factors, including data types, algorithms, validation methods, forest definitions, etc. [13,25]. It is of great significance to thoroughly evaluate the accuracies of the existing medium resolution forest maps and examine the uncertainties of existing Landsat- and PALSAR-based forest mapping approaches.
Based on the above concerns, we collected, evaluated, and analyzed the uncertainty of the eight latest 30–50 m resolution forest products for 2010 on the Loess Plateau. This study attempts to answer three scientific questions: (1) What are the differences in the accuracies of a variety of medium resolution forest products on the Loess Plateau? (2) Are there any differences in the forest area estimates according to the various products? and (3) Is the spatial consistency of the eight forest maps showing a certain regulation along with different topographic gradients? The uncertainty analysis of the eight forest products not only provides a clear picture of forest distribution on the Loess Plateau, which will help us to understand the effectiveness of the existing ecological restoration projects, but also provides implications for future forest monitoring efforts based on remote sensing.

2. Materials and Methods
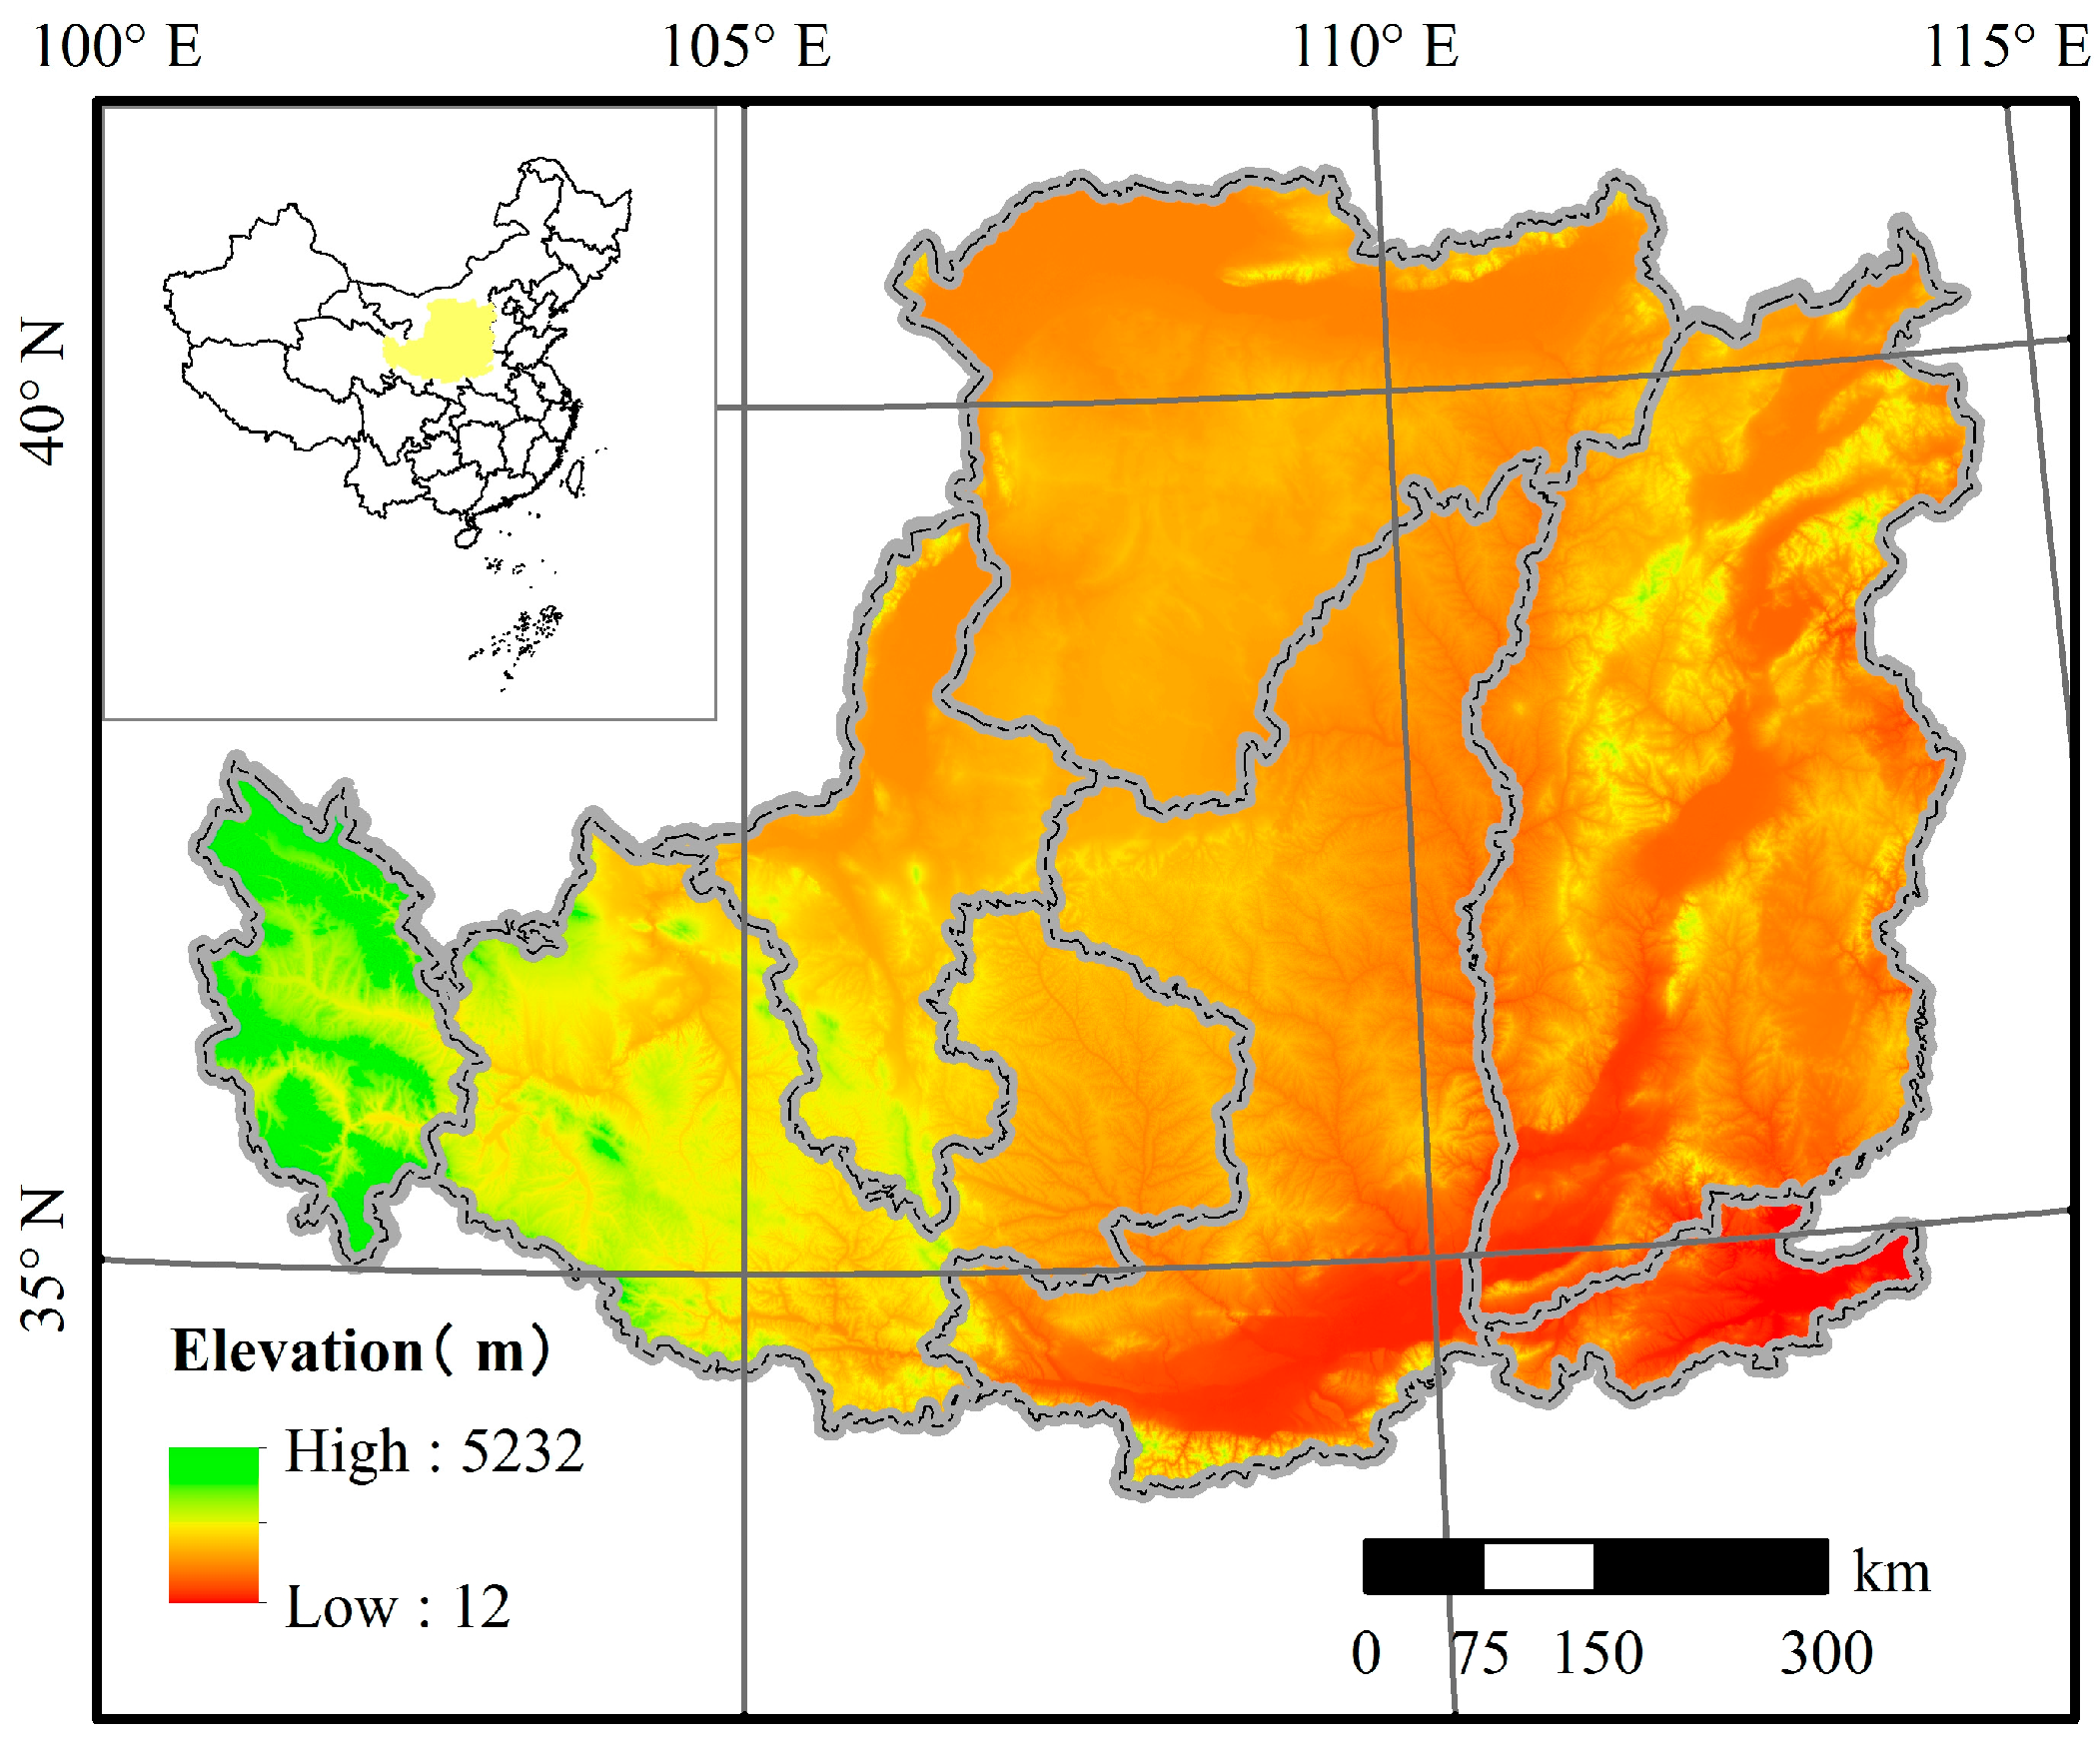
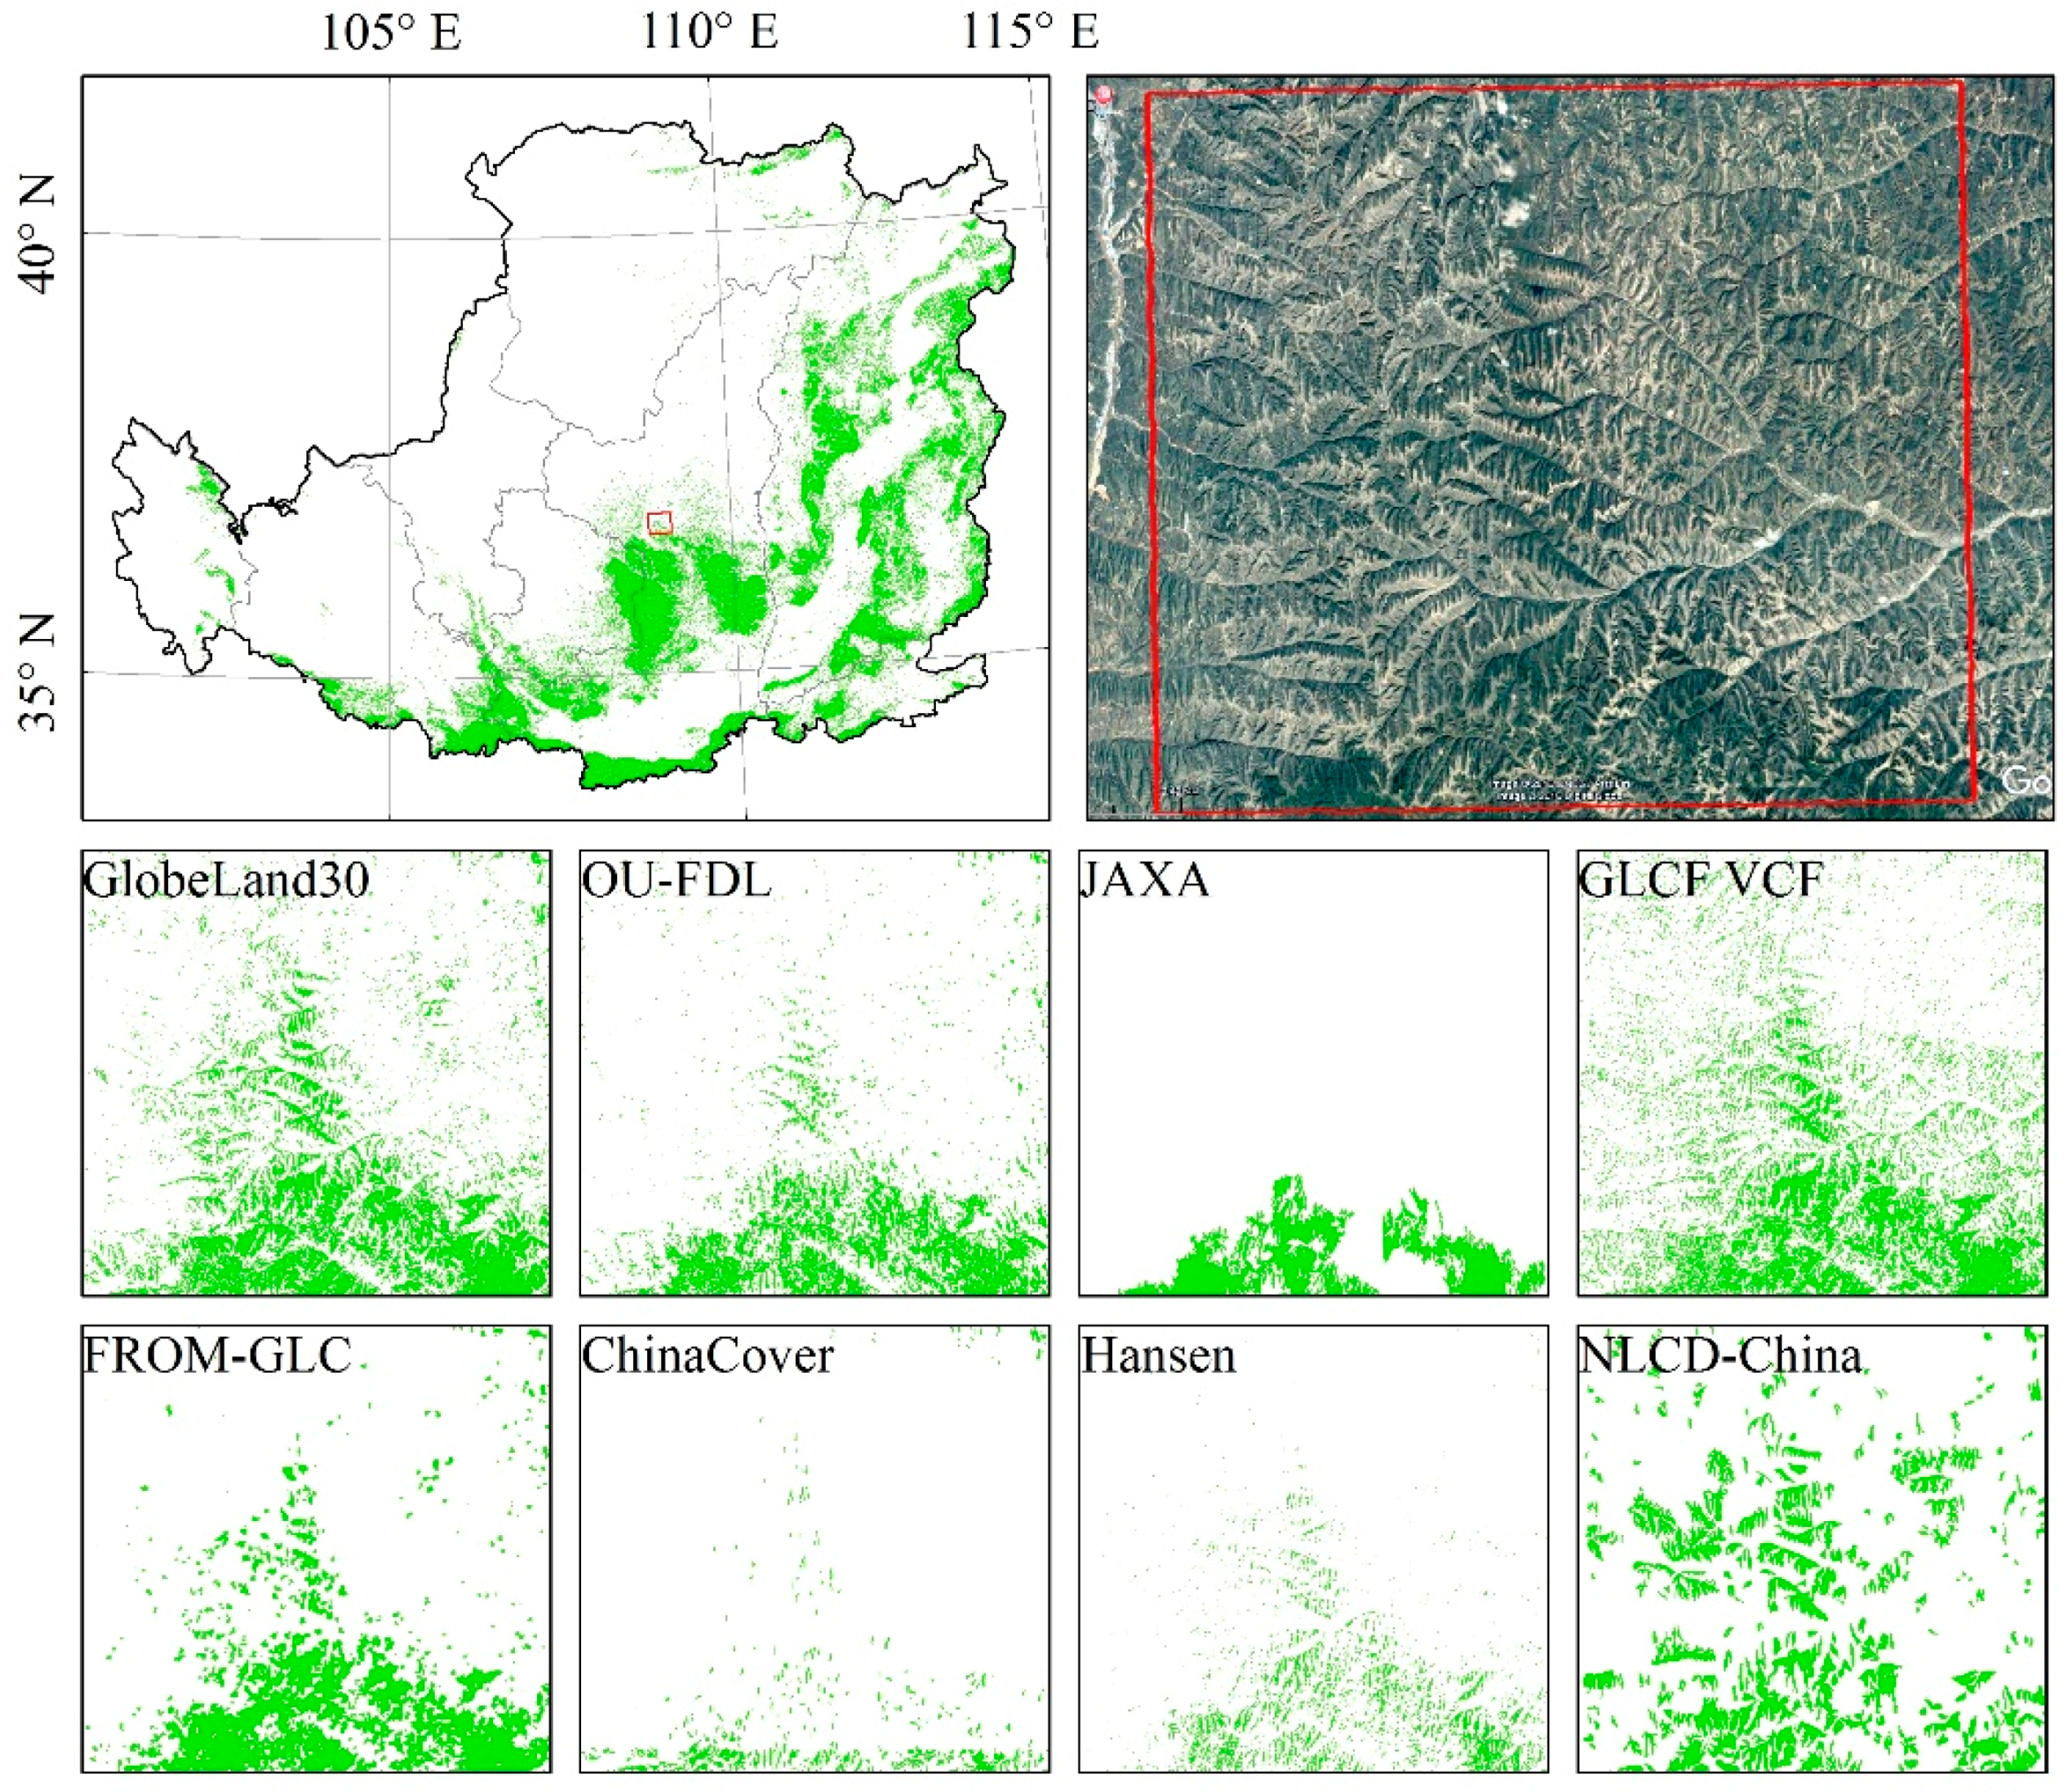
2.1. Study Area

The Loess Plateau, located in Northcentral China, and is one of the most highly erodible regions in the world. The Loess Plateau (33°41′–41°16′ N, 100°52′–114°33′ E) covers an area of 62.14 million (m) ha, with average elevations ranging from 1500 to 2000 m above sea level (asl.) (Figure 1). It is a transitional region between the Tibetan Plateau of the west and the North China Plain of the east. The climate is continental monsoonal, which stretches across warm and mid temperate zones from south to north and spans semi-humid and semi-arid zones from east to west. In most regions of the Loess Plateau, a majority (60%) of annual precipitation (about 400 mm) falls between July and September. Annual evapotranspiration is typically 1400–2000 mm [27,28]. A vegetation gradient exists in the plateau, which transitions from forests in the southeast to woody steppe, steppe, and desert steppe in the northwest.

2.2. DEM Data

The DEM data was downloaded from the freely available ASTER GDEM version 2 (v2) dataset with a resolution of approximately 30 m, which was released by National Aeronautics and Space Administration (NASA) and Ministry of Economy, Trade, and Industry (METI). We processed the original data with image mosaicking and projective transformation, and then extracted the DEM data on the Loess Plateau (Figure 1).

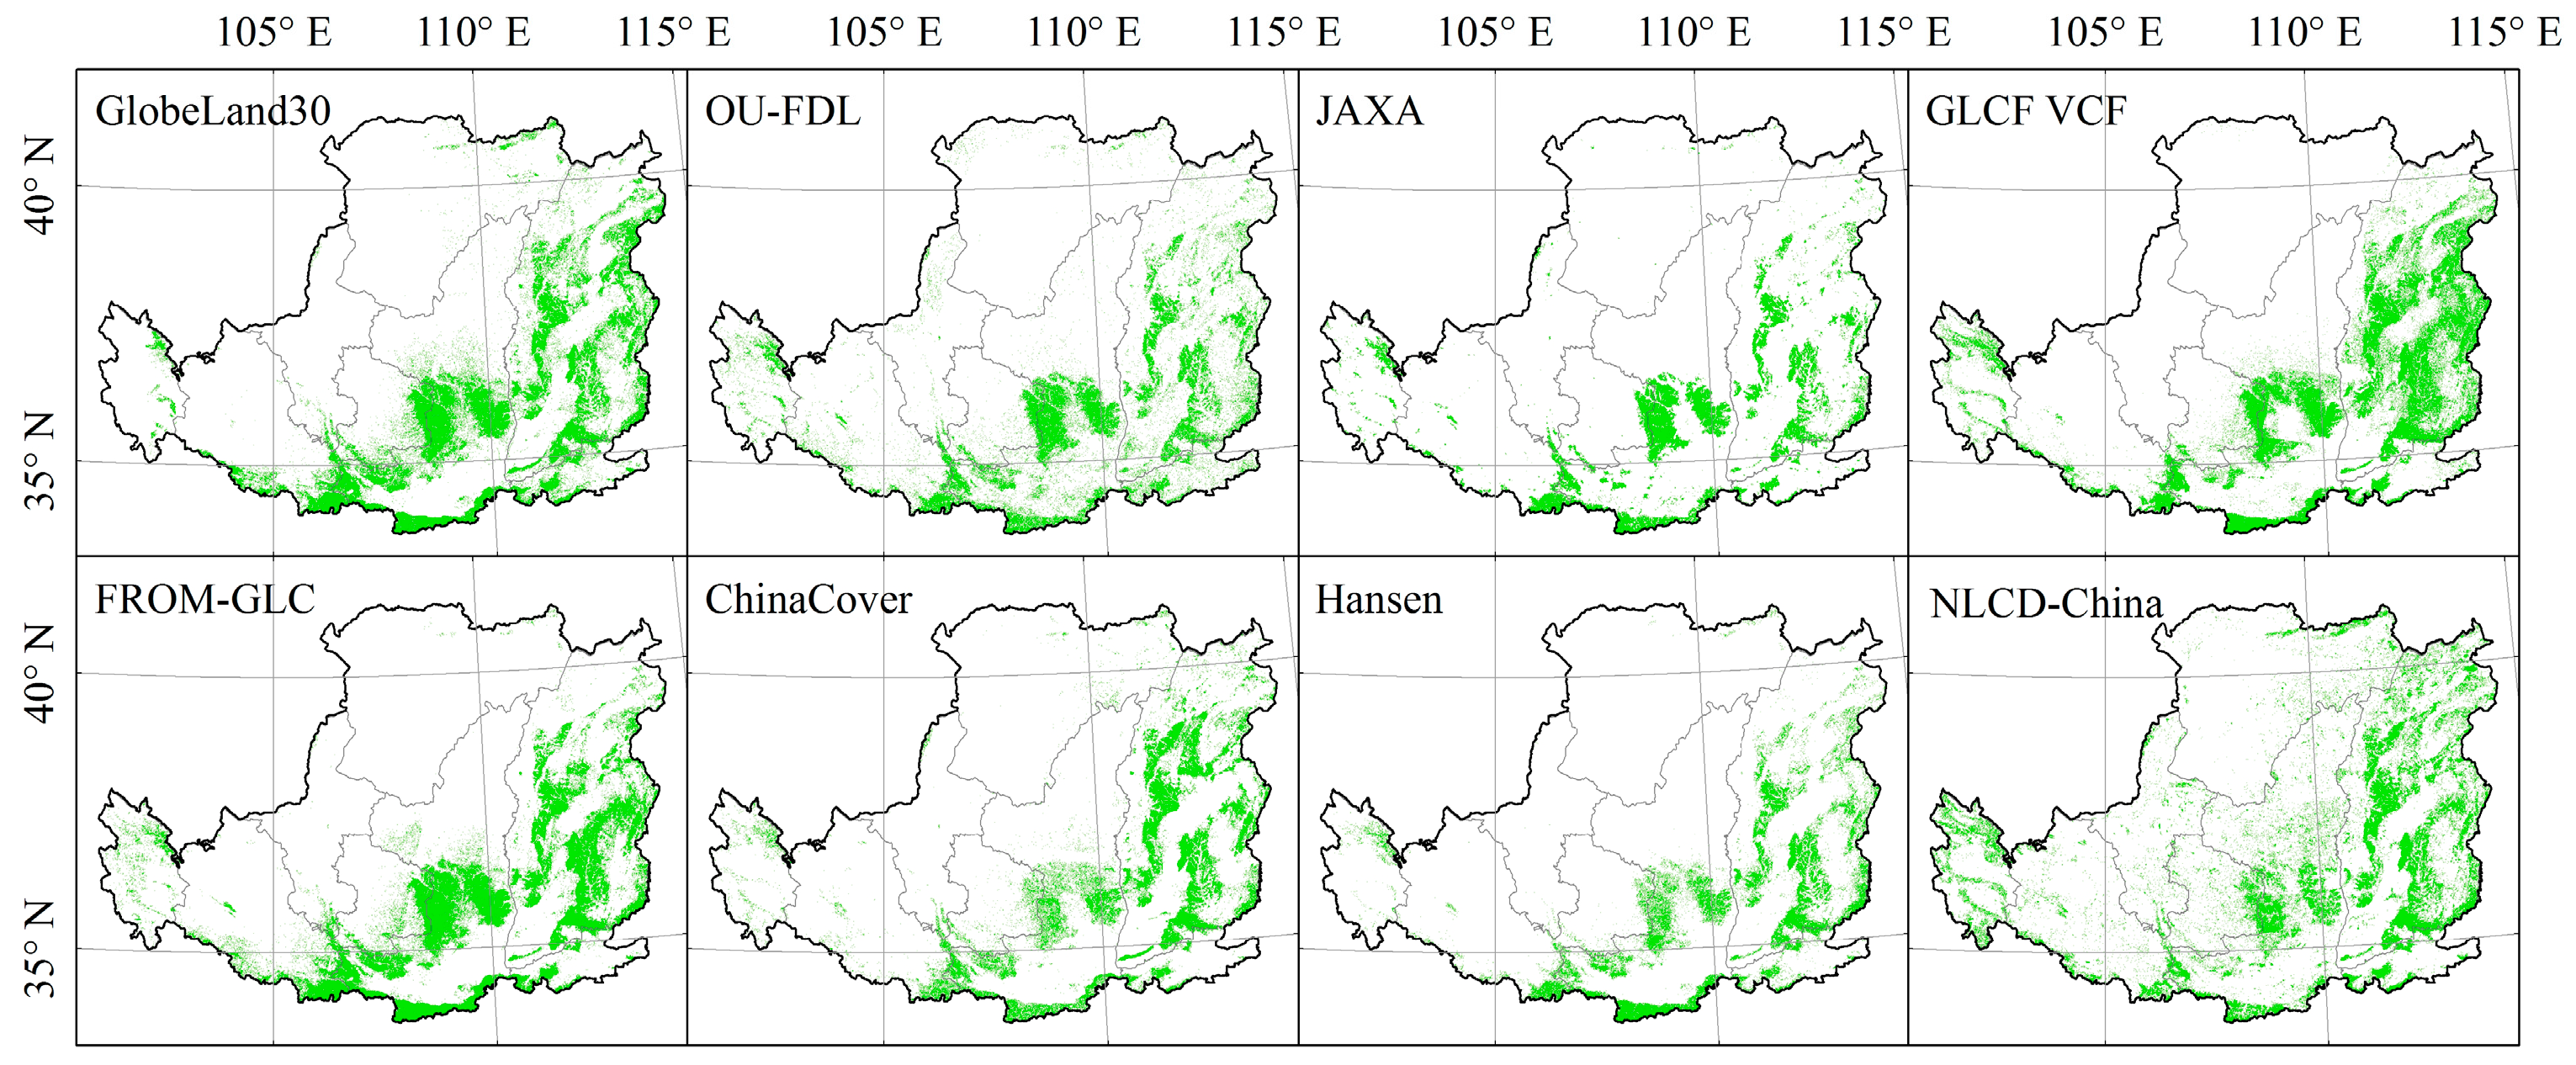
2.3. Eight Medium Resolution Forest Products in 2010

We collected eight forest products in the year of 2010 with a medium resolution (30–50 m), including four general land cover products and four forest thematic products (Table 1).
(1) GlobeLand30 dataset
The GlobeLand30 dataset was developed by NGCC [19]. The product was based primarily on Landsat TM/ETM+ data, with HJ-1 satellite data as supplemental, from 2000 and 2010 (http://www.globallandcover.com/GLC30Download/index.aspx). A pixel-object-knowledge-based (POK-based) method was used. The land cover classification system included ten land cover types. The definition of forest included deciduous and coniferous forests with vegetation cover over 30%, and sparse woodland with cover of 10–30%.
(2) FROM-GLC dataset
The FROM-GLC dataset was the first global land cover product at 30 m resolution and was generated by the Tsinghua University [20] (http://0-data-ess-tsinghua-edu-cn.brum.beds.ac.uk/). It utilized Landsat TM/ETM+ images data from the Global Land Surveys (GLS) project [31,32] and automatic supervised classifiers. The product has been updated a couple of times and the accuracy improved greatly [33,34]. The land cover classification system included 10 first-level classes and 20 second-level classes. The definition of forest was tree density cover over 15% and tree height over 3 m.
(3) Hansen forest map
The Hansen global forest cover map (30 m) was acquired from the USGS (https://landcover.usgs.gov/glc/), which is global tree canopy cover data (also called treecover2010) based on cloud-free, annual growing season composite Landsat 7 ETM+ data [11]. A regression tree model was applied to estimate per pixel maximum (peak of growing season) percent tree canopy cover by using all the available Landsat ETM+ images during the 2010 growing season as inputs.
(4) ChinaCover dataset
The ChinaCover data was generated by the 10-year Environmental Monitoring Program in China [24], including products in 2000 and 2010. The Landsat TM/ETM+ and HJ-1 satellite data were used for classification. An object-based classification method was utilized based on vast ground truth data. The land cover classification system targeted the carbon budget and had two categories: Intergovernmental Panel on Climate Change (IPCC) and Land Cover Classification System (LCCS) land cover classification systems. The definition of forest was tree density cover over 20% and tree height over 3 m.
(5) NLCD-China dataset
The NLCD-China product was generated by the Chinese Academy of Sciences, which includes several epochs of land use datasets from 1990, 1995, 2000, 2005, and 2010 [29]. The Landsat TM/ETM+ growing season images with cloud filtering were the major data sources, with HJ satellite data being supplemental. The visual interpretation approach was used, and the land cover classification system included six first-level classes and 25 second-level classes. The first-level woodland class of the NLCD-China dataset was used as a definition of the forest. Therefore, the definition of forest included natural forests, planted forests, and other woodlands with vegetation cover over 10%, shrubland with canopy cover over 40%, and tree height below 2 m.
(6) GLCF VCF forest map
The University of Maryland’s Global Land Cover Facility Data Center (GLCF) produced a 30 m resolution continuous tree cover product [21] called the Vegetation Continuous Fields (VCF) dataset (http://glcf.umd.edu/data/landsatTreecover/). The product was derived from all seven bands of Landsat 5 and 7 images based on rescaling the 250 m MODIS VCF Tree Cover layer.
(7) OU-FDL forest map
Through the integration of PALSAR and MODIS/Landsat data, the University of Oklahoma (OU) [13] generated an updated forest data layer (FDL), referred to as OU-FDL in this paper. Its data sources mainly came from 50 m PALSAR fine dual-polarized data and 250 m MODIS NDVI data from June to September. The forest definition for OU-FDL was the same as the definition used in the Food and Agriculture Organization (FAO) forest resource survey: tree density cover over 10% and tree height over 5 m.
(8) JAXA forest map
Based on the ALOS/PALSAR L-band remote sensing data, JAXA produced global forest maps (http://www.eorc.jaxa.jp/ALOS/en/palsar_fnf/fnf_index.htm) from 2007 to 2010 and 2015 at 25 m and 50 m resolutions [22]. These maps mainly came from mosaicked PALSAR fine dual-polarized data obtained between June and September. A rule-based decision tree was used for the forest extraction, and the forest definition was tree density cover over 10%.
The original OU-FDL and JAXA forest products were binary in format (forest and non-forest), while the forest layers of Globeland30, ChinaCover, FROM-GLC, and NLCD-China were produced using the four land cover classifications. The additional two tree cover fraction datasets (Hansen, GLCF VCF) were converted into forest binary maps by using the threshold value of 10%, to be comparable with the other forest products.

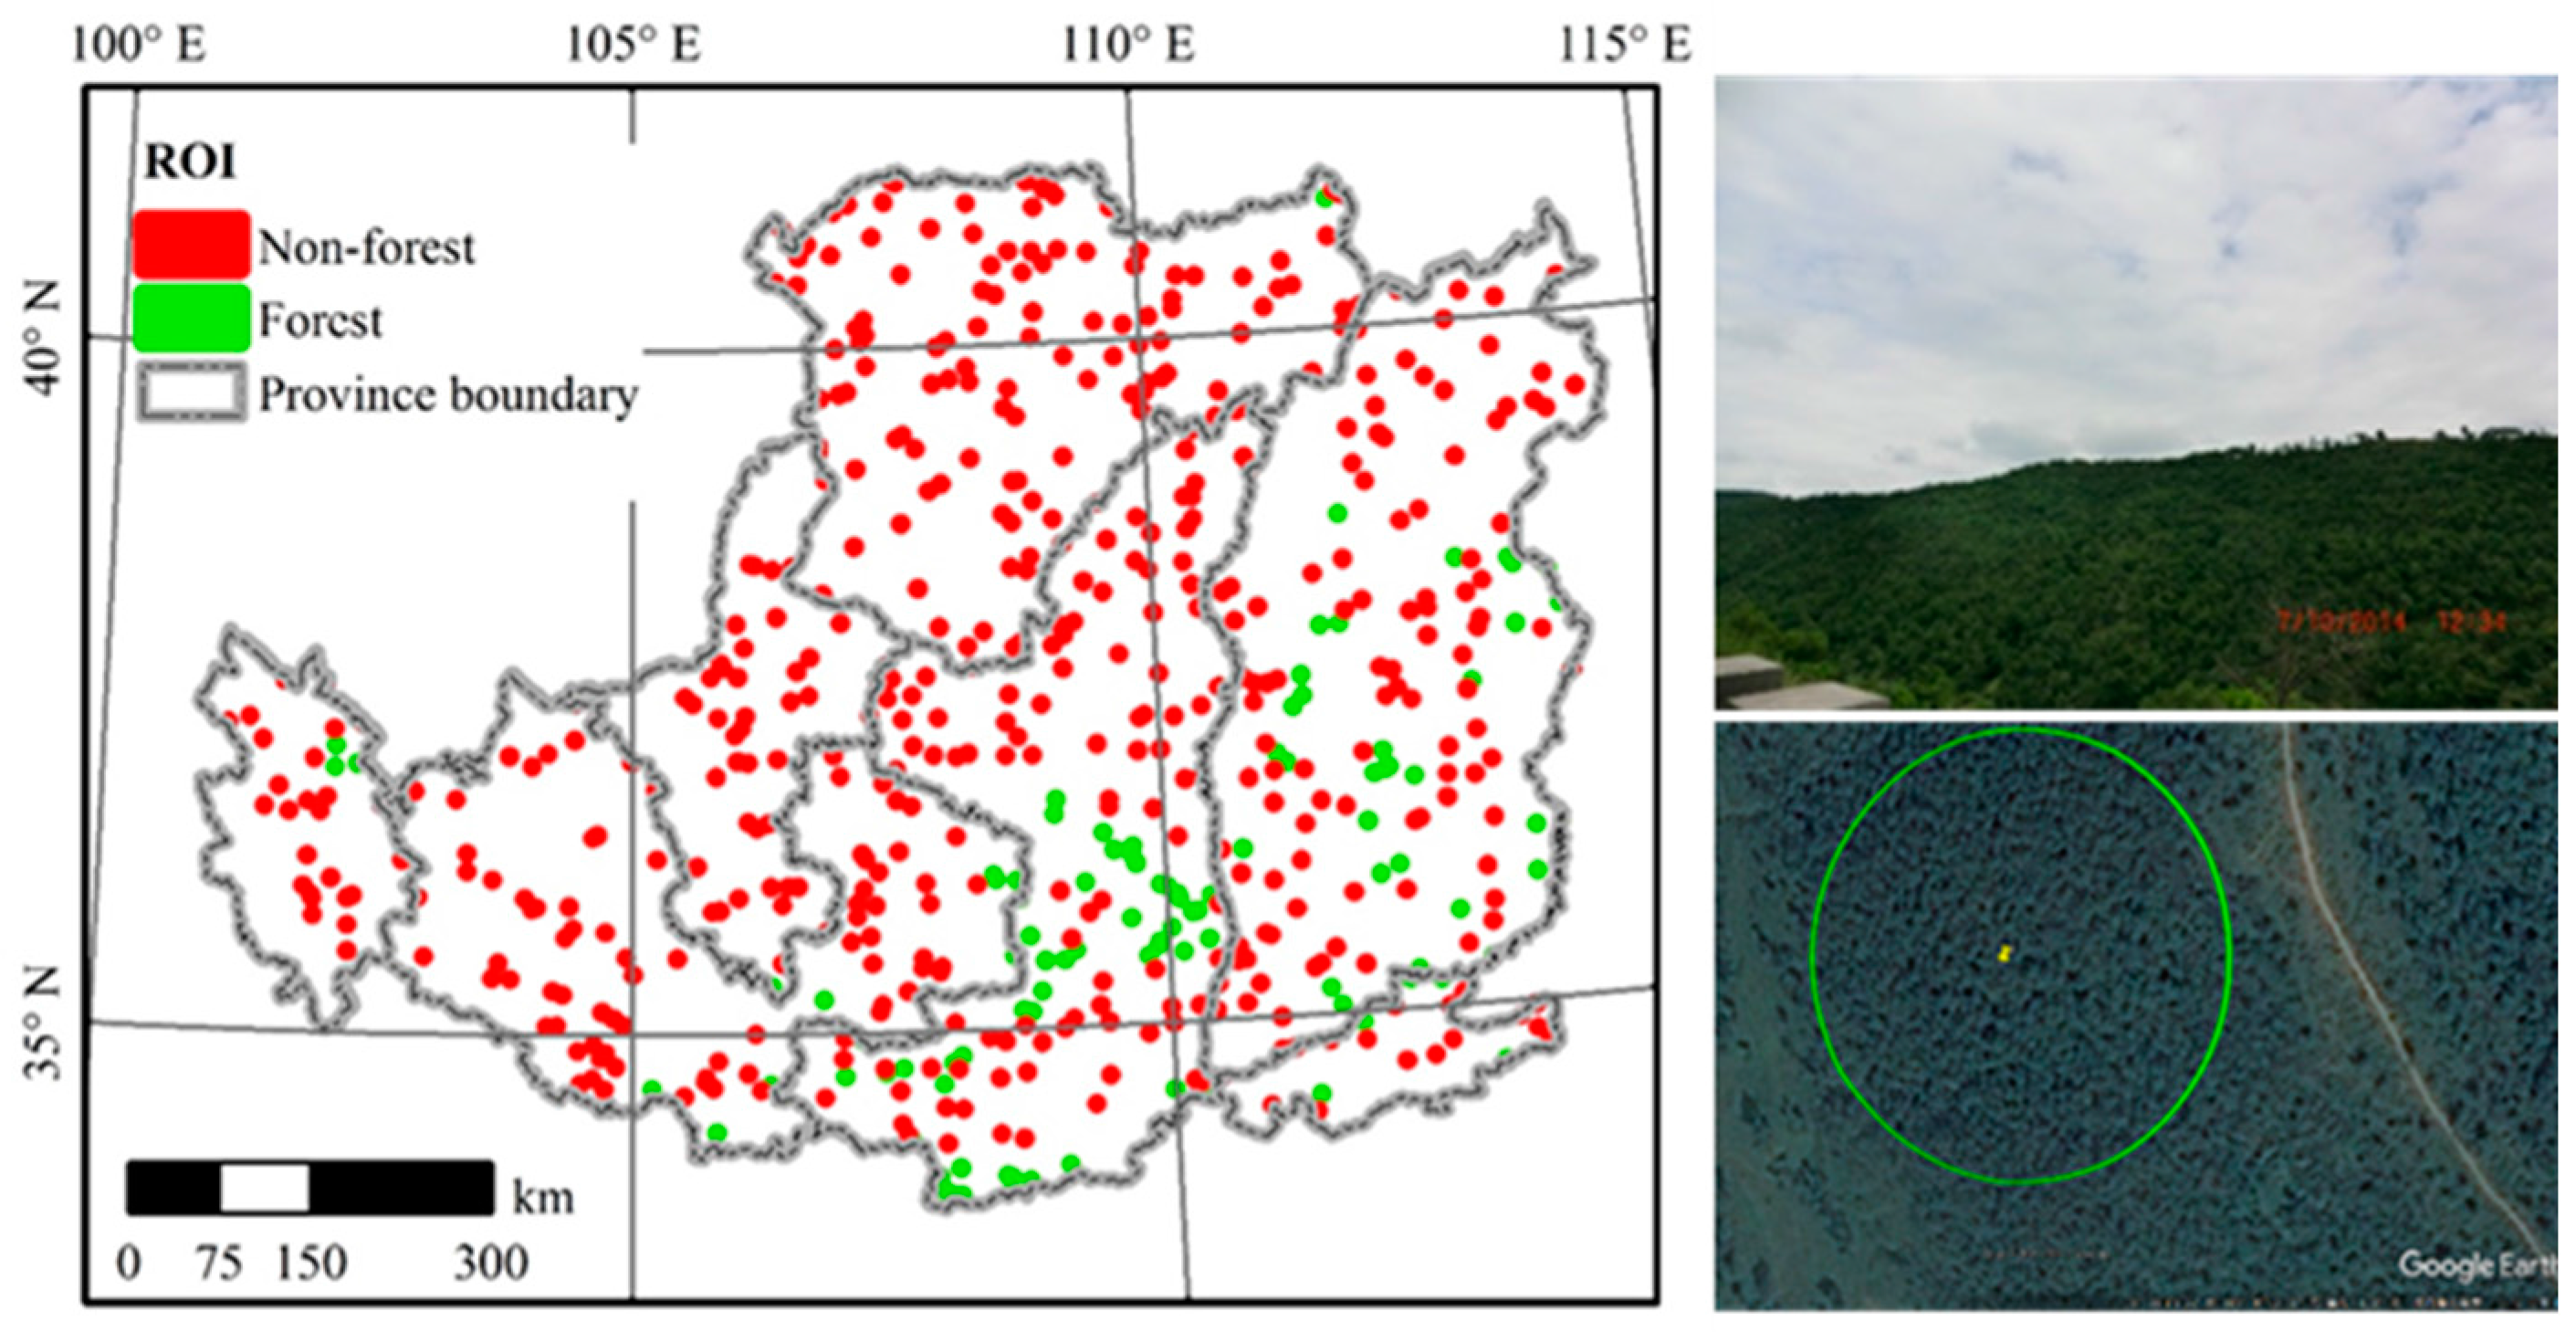
2.4. Validation Data Collected by Google Earth Imagery and Field Photos

The algorithm calibration and result validation are important components in land cover classification researches. Accurate in situ land cover samples are fundamental to ensure that the classification algorithms are reliable and that the results are valid. The validation data used in this study were Google Earth high resolution remote sensing images taken in 2010 and field photos from 2013 archived in the global geo-reference field photo library (http://www.eomf.ou.edu/photos) [35]. Google Earth has been widely used in result validation of broad land cover products because of its high spatial accuracy [36]. The horizontal positional accuracy of Google Earth’s high-resolution imagery ranges from 0.4 to 171.6 m, with average accuracies of 24 m in developed countries and 44 m in developing countries [36,37]. The global geo-reference field photo library is maintained by the University of Oklahoma, which is a data portal used to archive, share, and manage geotagged field photos. Researchers from all over the world can upload photos collected by GPS-enabled cameras and smart phones to the data portal, which serves as an archive of in situ observations with detailed information about land cover types. Users can upload, edit, search, and download various formats of photos or points of interest (POIs) conveniently to support land cover mapping efforts [38]. This platform has archived around 8000 field photos on the Loess Plateau during 2010–2013.
In this study, a stratified random sampling method was used to obtain validation samples. We used the FAO forest definition, that is, the tree canopy cover over was over 10%, but not include minimum mapping unit of 0.5 ha. To collect samples, we adhered to the following steps. Firstly, the study area was divided into two strata (forest and non-forest) based on existing land cover datasets. Secondly, in each strata, random points were generated with circular, radial buffers of 100 m to serve as regions of interest (ROIs). These buffers gained more validation pixels with 30 m resolution, which improved the accuracy assessment [39]. For example, if the size of the ROIs are too small, than the inherent location errors of the satellite images can affect the validation results and produce more uncertainty in landscape heterogeneity [40,41]. Finally, the ROIs were put into the Google Earth and interpreted referring to the very high resolution images from around 2010. In addition, if there were field photos around ROIs, we referred to these field photos to conduct a visual interpretation. In total, we obtained 593 ROIs to validate eight forest products in this paper, including 100 forest ROIs and 493 non-forest ROIs (Figure 2).

2.5. Methods

2.5.1. Accuracy Assessment of Forest Products

The accuracies of the eight forest products were assessed via the mutual ROIs mentioned above. The overall accuracy, producer accuracy, and user accuracy of the forest and non-forest types were calculated to form a confusion matrix for each product. Furthermore, the area proportion was considered to adjust the accuracy assessment results and evaluate the uncertainties of the forest products’ accuracies and area estimates [42,43,44], based on a 95% confidence interval.

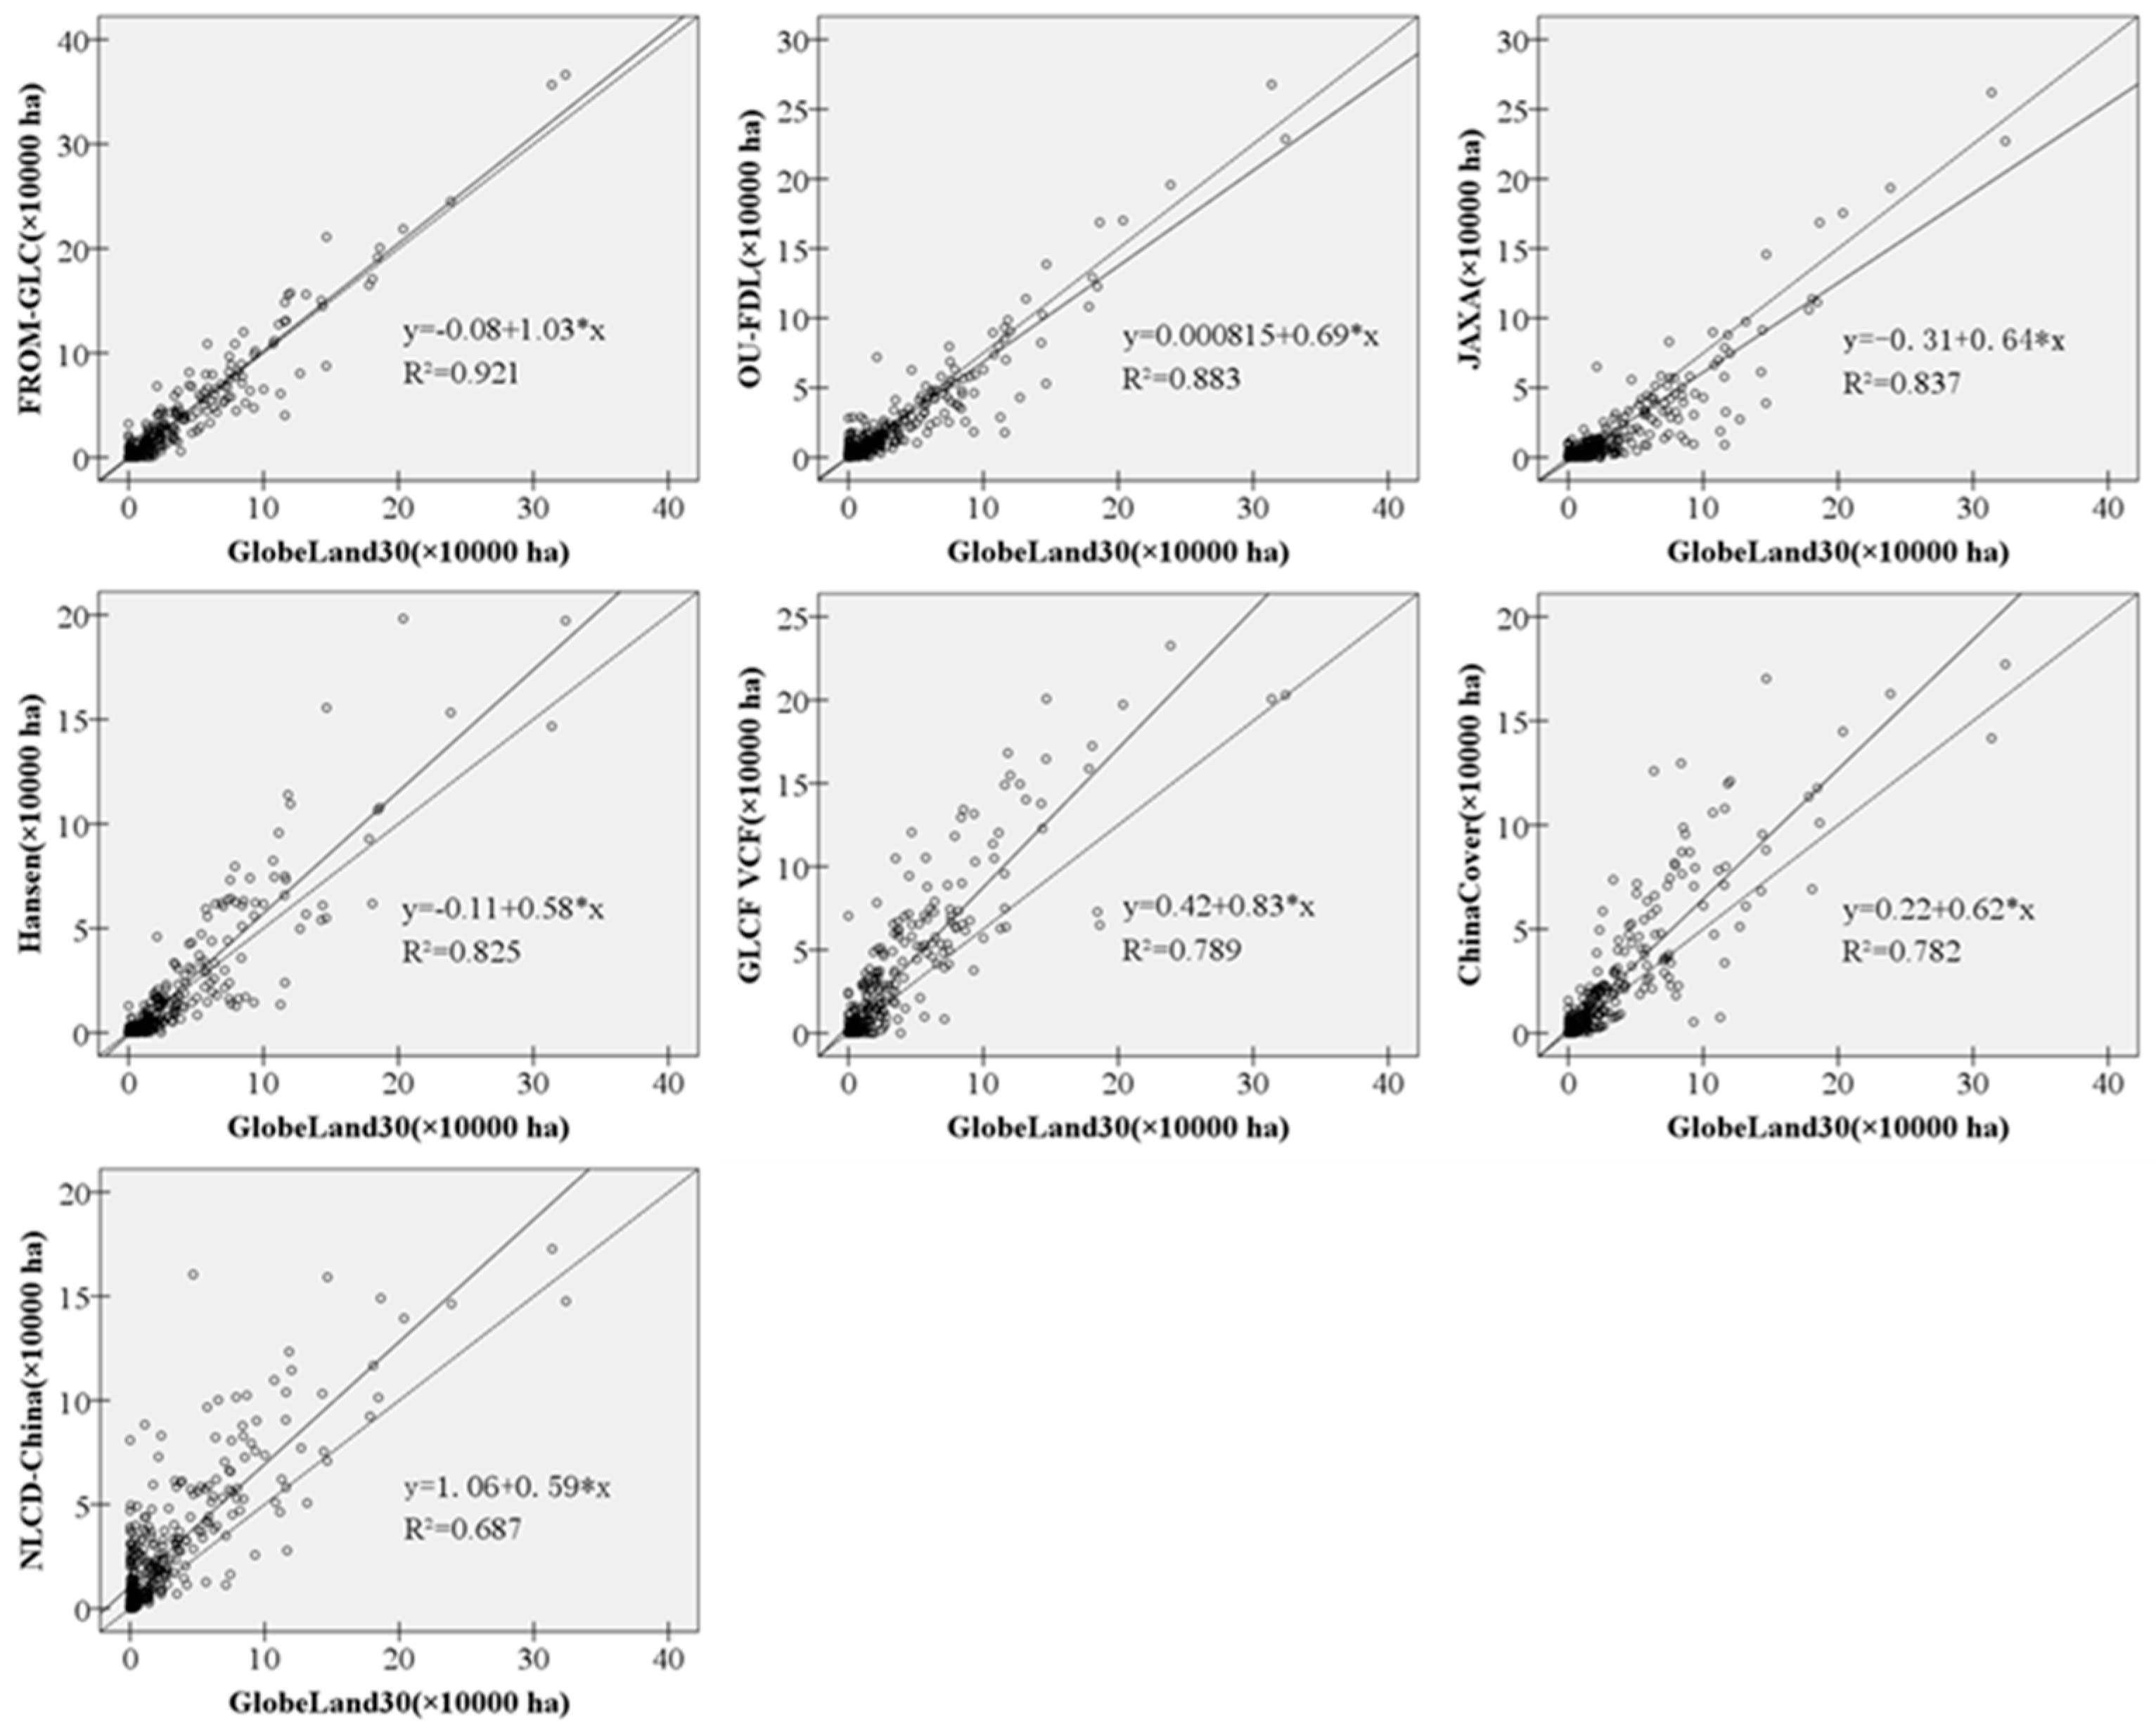
2.5.2. Area Comparison among Various Forest Products

The county-level forest areas were calculated to conduct the inter-comparison among the eight forest products. First, all the forest products were converted into the same equal area projection (Krasovsky_1940_Albers) to avoid area calculation errors in the process. Second, the county-level administrative boundaries were obtained from NGCC. Third, the forest areas of each county were acquired by spatial analysis using ArcGIS software. The inter-comparison among the forest product-based areas was conducted using linear regression and correlation analyses.

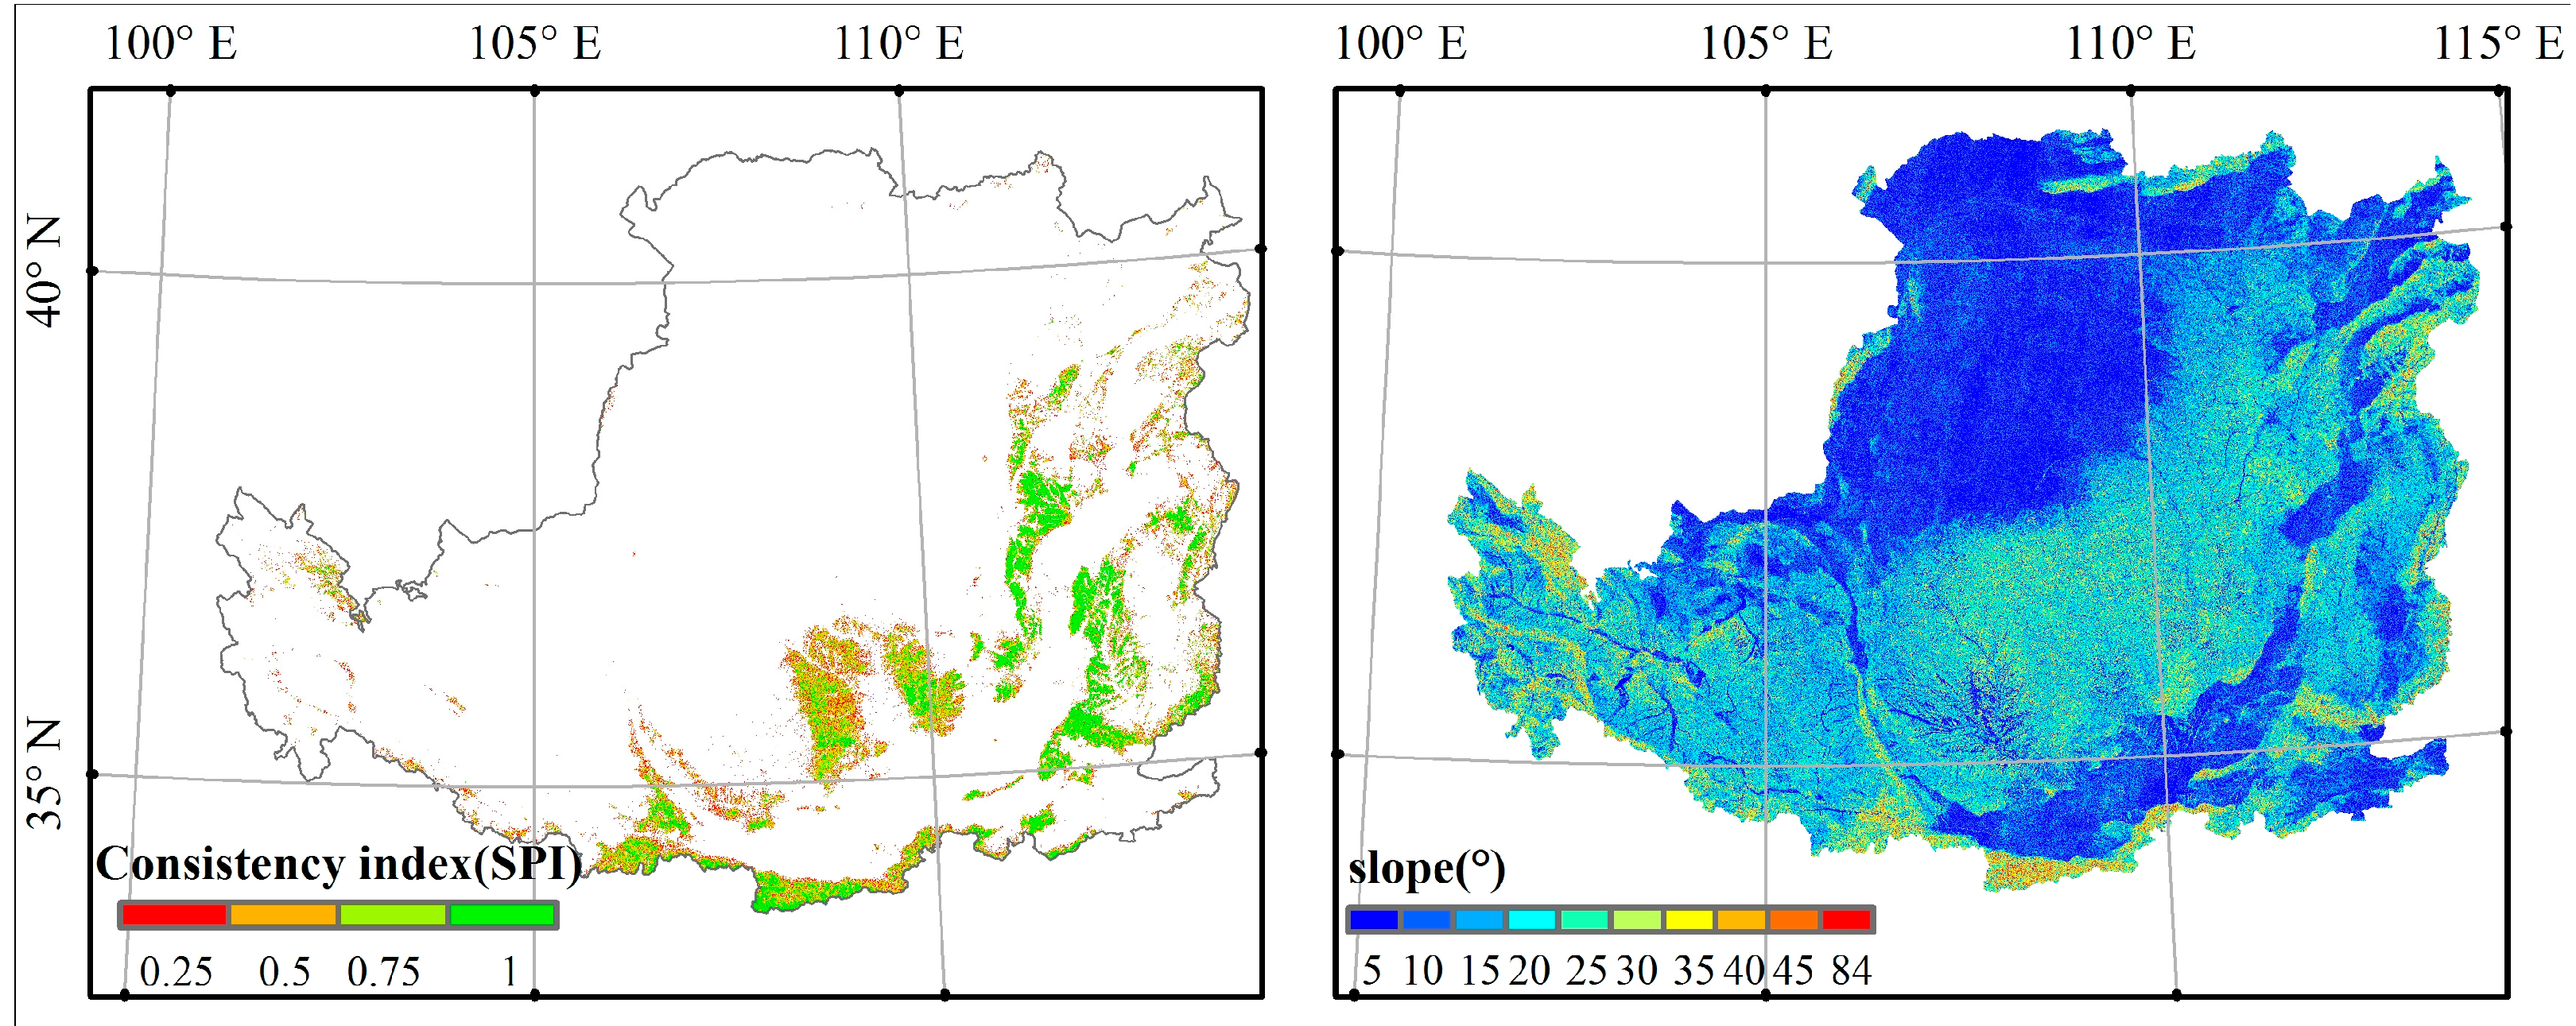
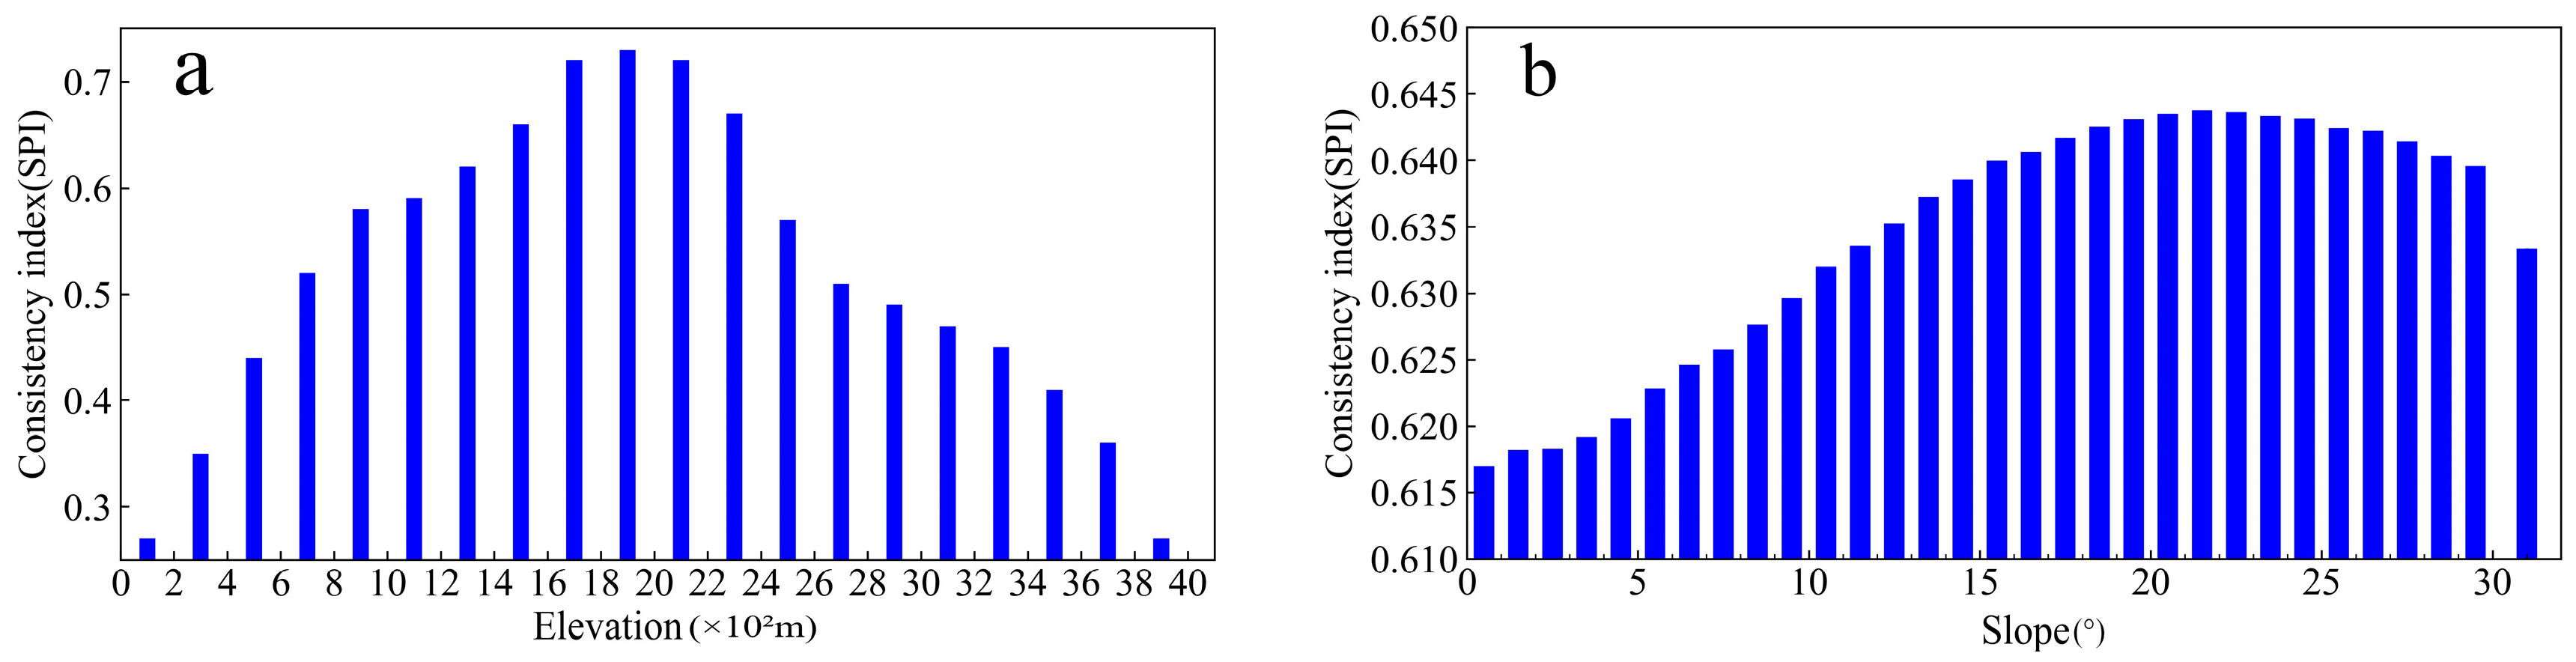
2.5.3. Spatial Consistency of Different Forest Products and Its Attribution to Terrain Factors

To further evaluate the spatial consistency of the eight forest products on the LP, we conducted the nearest neighboring method to resample all of the forest products into the same resolution (30 m). Then, we acquired the frequency distribution (0–8) of the forest binary maps via overlay analysis. In the resultant frequency layer, the value 0 in one pixel indicated that the eight forest products did not recognize forest in the pixel, and the value 8 meant that all products showed forest in the pixel. Pixels with a value of 4 represented the most disagreement between the forest products, when half of the products recognized the pixels as forest while the other half did not.
Our focus was forest, so the high consistency in non-forest regions could mislead our understanding about forest consistency. Therefore, we created a forest-dominant mask to focus our study on forests using the aforementioned frequency layer to build a spatial consistency index following the formula below:
S P I = ( F 4 ) / 4 ,   F > 4
where SPI is the spatial consistency index of the forest area in a certain pixel, ranging from 0 to 1, and F is the frequency of the eight forest maps. Higher values of SPI reflect higher consistency among the forest map products.
We further attributed the spatial consistency inside the forest-dominant region to two topographical factors (elevation and slope) by using statistical analyses of SPI in different topographical gradients. Mean values of SPI were calculated among different elevation and slope gradients.

3. Results

3.1. Accuracies of the Eight Forest Products

Utilizing both sources of ground truth data to assess the accuracies of various forest products on the Loess Plateau in 2010 (Table 2), we found that each of the eight forest maps were in general highly accurate. The GlobeLand30 forest map had the highest overall accuracy (0.97 ± 0.002) with a 95% confidence interval, followed by the FROM-GLC, OU-FDL, and JAXA forest maps. While the other four products (ChinaCover, NLCD-China, GLCF VCF, and Hansen forest maps) had lower overall accuracies (0.93 ± 0.003–0.94 ± 0.003). In terms of sensor type, the Landsat-based forest maps showed a variable difference while the PALSAR-based forest maps (OU-FDL and JAXA) had relatively stable performances (Overall Accuracy = 0.95 ± 0.003 with a 95% confidence interval).
The overall accuracy is a balance between producer accuracy and user accuracy. It is important to note that some products had higher omission errors while others had higher commission errors. For example, despite higher user accuracies, the Hansen, ChinaCover, and JAXA forest maps had lower producer accuracies (<0.62 ± 0.02) and higher omission errors (>0.38). The higher omission errors from the Hansen, ChinaCover, and JAXA forest products could be related to the spatial fragmentation or heterogeneity of forest patches in the study area (Figure 3). This implies that these three products may not be perfectly suitable for fragmented landscape regions.
Furthermore, in order to show the performance of different products in the small forest patches or fragmented regions, we selected one case region and showed zoom in maps with more details (Figure 4). The eight forest products showed different patterns of forest cover. More specifically, the Hansen, ChinaCover, and JAXA forest products classified less area as forest cover in the highly fragmented region, which was related to the bigger omission errors (lower producer accuracy) of these three products. The results were consistent with the above accuracy assessment results.

3.2. Inter-Comparison in Forest Area Estimates

Using forest area statistics at the county scale, we conducted inter-comparisons among the forest products. Since the GlobeLand30 forest map had a higher accuracy, we used the GlobeLand30 forest areas as the reference for the comparisons (X-axis in the Figure 5). In general, all the other seven forest products showed remarkable linear relationships with the GlobeLand30, with an R2 valued that ranged from 0.69 to 0.92. The linear relationships were basically in accordance with the results of the accuracy assessment. The relationship between the FROM-GLC and GlobeLand30 forest maps was strongest (R² = 0.92), which could be related to more similar data sources in both products. In addition, both the OU-FDL and JAXA forest areas showed significant correlations with the reference data (R² = 0.88 and 0.84, respectively), which indicated that the radar data had a great potential in estimating forest area. The R2 results from the the regression analyses between the GlobeLand30-based forest area and the Hansen, GLCF VCF, ChinaCover, and NLCD-China-based forest area were 0.83, 0.79, 0.78, and 0.69 respectively.

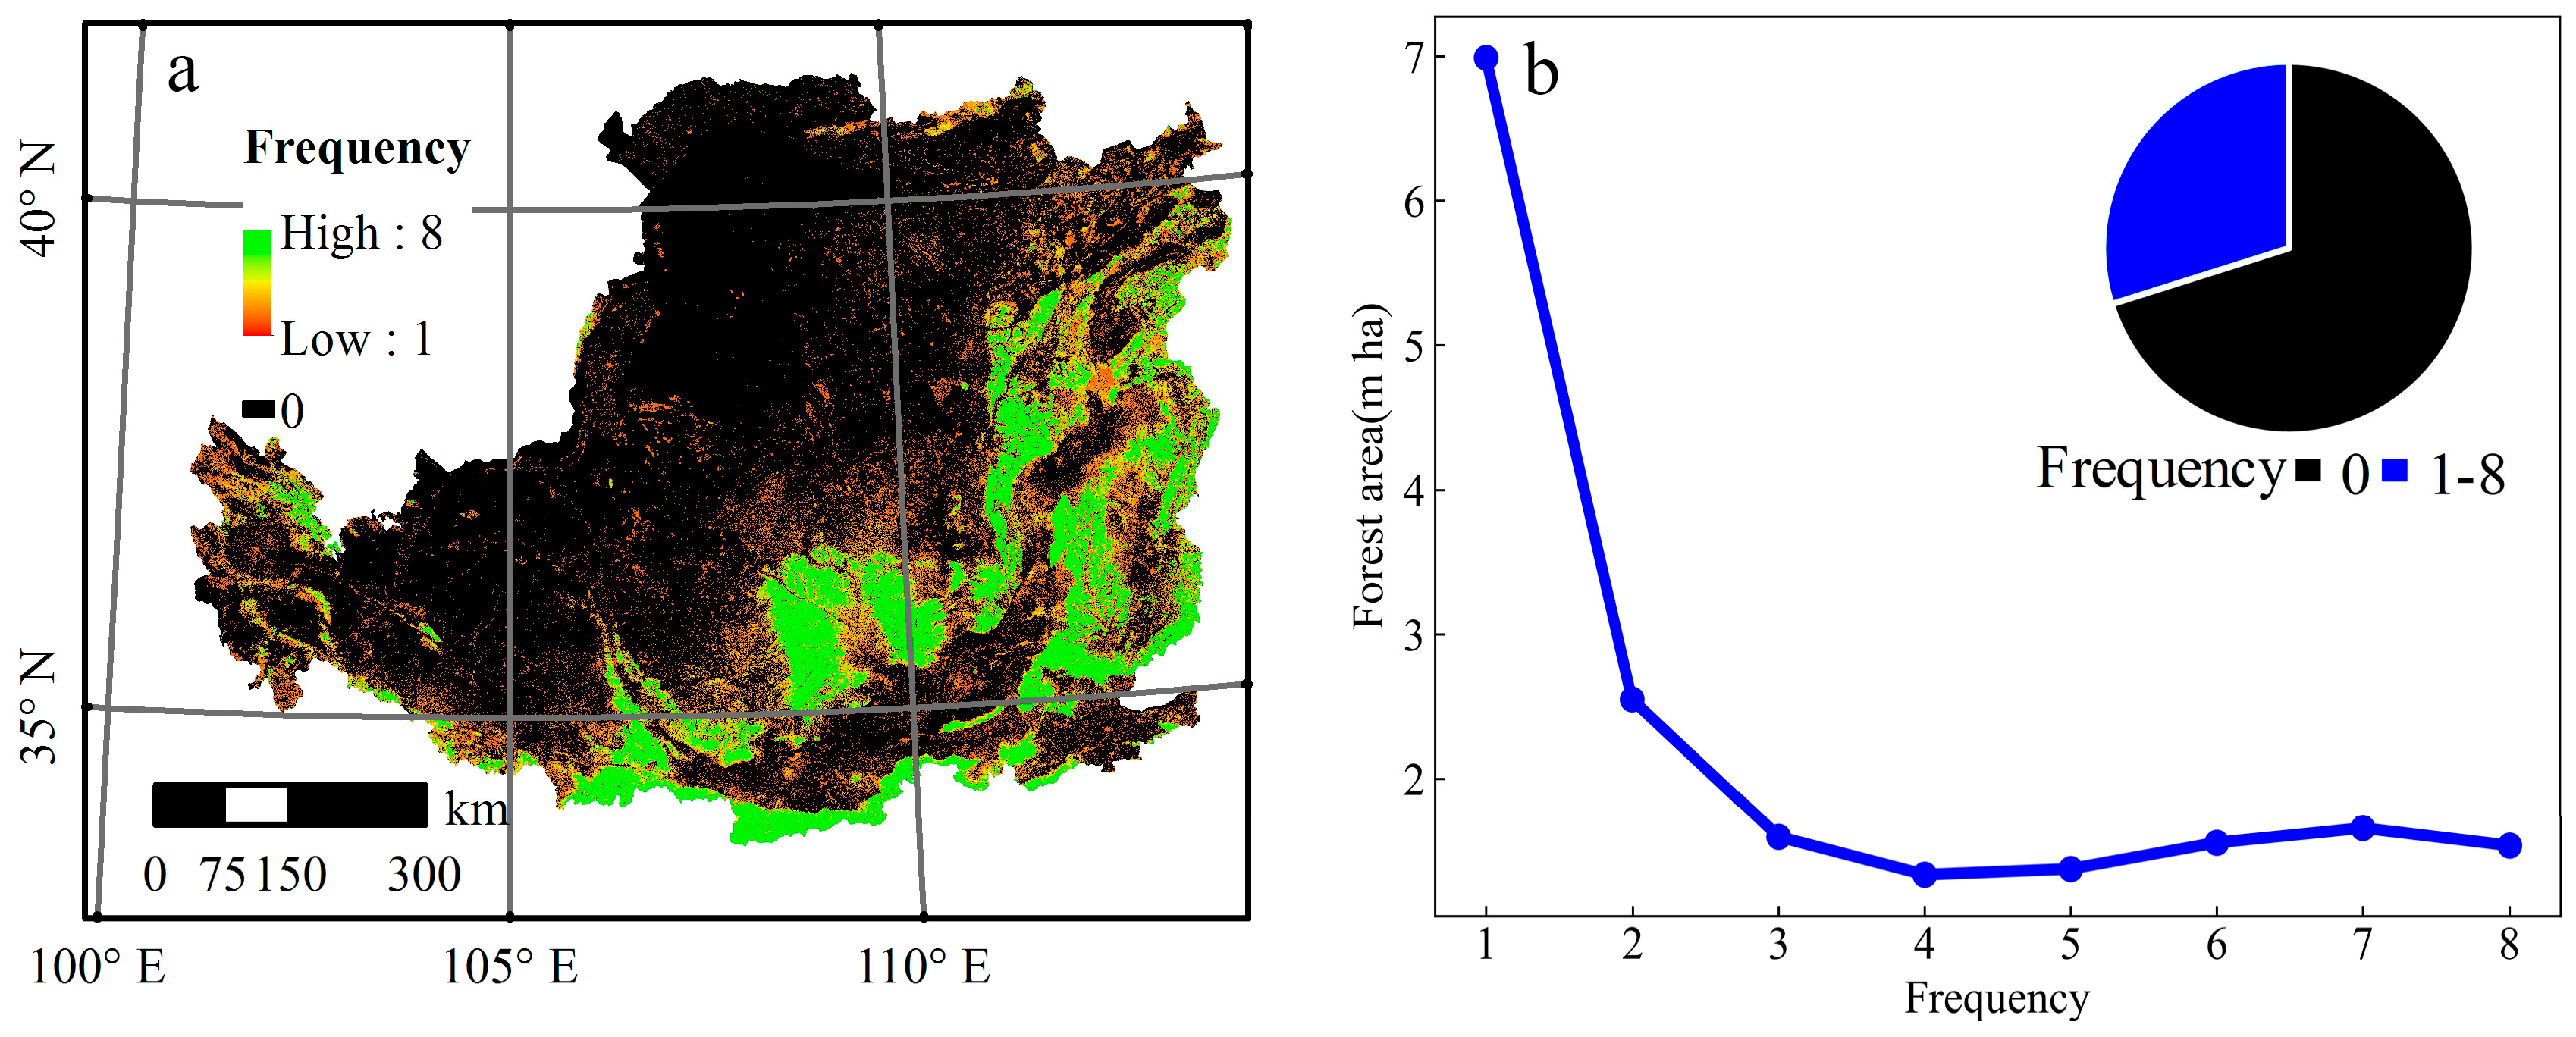
3.3. Spatial Consistency of Eight Forest Maps and Its Dependence on Topographical Factors

Despite strong relationships at the county level between the eight forest products, a spatially explicit consistency analysis was still needed to study the pattern of uncertainties for each forest maps. Figure 6a showed the distribution of forest frequency among the eight forest products. The pixels with a frequency value of 0, pixels which all the forest products identified as non-forest, accounted for about 70% of all pixels (43.76 m ha, Figure 6b inset). The pixels with a frequency value of 8, shaded green in Figure 6a, indicated that the eight forest products recognized those pixels as forest, which accounted for about 2.5 % (1.55 m ha) of the total area. The pixels with the value of 4, shaded yellow, showed that the eight forest products had the biggest discrepancy and accounted for about 2% of the area (1.34 m ha) of the total area. The frequency values ranging from 1 to 7 indicated the magnitudes of forest product consistency.
As shown in Figure 6b, most of the study area was classified as non-forest. Thus, we extracted the forest-dominant region for further attribution analysis. The spatial distribution of the spatial consistency index (SPI) in the forest-dominant region was shown in Figure 7a. The spatial consistency analysis within the forest-dominant region was attributed to two topographical factors, elevation and slope (Figure 7b).
We conducted a statistical analysis of the SPI in the forest-dominant region along different elevation and slope gradients (Figure 8). In terms of elevation, the consistency of the eight forest products increased from 0.3 to 0.7 along with increases in elevation until 2000 m above sea level (asl.), and then continued to decrease with increased elevation (Figure 8a). That elevation distribution of SPI may be related to the flat platform with around 2000 m asl. on the LP. The variation in the consistency among the eight products could be related to different forest definitions or to changes in tree species composition across different elevation gradients. In terms of slope, we found that the SPI was stable in the range of 0.62–0.64, but generally showed slight increases with increased slope. The increases in SPI with increased slope may indicate denser forest canopy cover in higher slope regions, where all the forest products tend to have consistently high accuracies.

4. Discussion

4.1. Reasons for Uncertainty of the Eight Medium Resolution Forest Maps

All eight forest products studied in this paper used remote sensing imagery with medium resolutions (30–50 m), which were obtained by the Landsat and/or PALSAR space-borne platforms, which have improved features compared to previous coarse resolution platforms such as AVHRR, SPOT-VGT, and MODIS. However, these medium resolution forest products still have substantial discrepancy among them. Potential reasons for these discrepancies include the use of different forest definitions, data sources, and algorithms.

4.1.1. Forest Definitions

The definition of forests usually includes two aspects: tree density and tree height. However, different forest products have different criteria for tree density and tree height [13,25]. For example, both the criteria of tree density and tree height vary greatly between the Hansen, ChinaCover, NLCD-China, and FROM-GLC forest map products. The Hansen and GLCF VCF products use the same tree density (>10%) and the tree height threshold (5 m), which is why the Hansen forest estimated a relatively similar forest area (8.57 ± 0.1 m ha with a 95% confidence interval) with the GLCF VCF (9.07 ± 0.1 m ha). However, the FROM-GLC adopted more stringent density threshold of 15%. Due to its more stringent definition in tree density, the FROM-GLC estimated a smaller forest area (7.63 ± 0.077 m ha) than the Hansen and GLCF VCF products. The NLCD-China forest category includes shrublands with a tree density of over 40% and a height of less than 2 m, and thus the product had a higher forest area estimate (10.196 ± 0.1 m ha) with a 95% confidence interval. As for the GlobeLand30, OU-FDL, and JAXA forest products, forests were defined with the same tree density threshold (e.g., 10%), and that similarity could be one reason for their relatively consistent area statistics (Figure 5).
Above all, the definition of forest plays an important role in estimating the forest area. However, forest area estimates differ, even with the same definition. On the one hand, these criteria in the forest definition is conceptual, and to some degree, the forest characteristics are difficult to be ascertained from satellite images [45]. On the other hand, there could be more factors influencing forest mapping and area estimates, such as data sources and algorithms.

4.1.2. Data Sources

The JAXA and OU-FDL forest products used the ALOS PALSAR fine dual-polarized data and/or optical data while the others only used Landsat data. The PALSAR observations were not affected by weather conditions or clouds, but is vulnerable to the terrain and soil water content; thus, a terrain correction and filtering method to remove speckle noises is needed. Given the higher penetration capacity by L-band, PALSAR can retrieve more structural information, whereas optical remote sensing is more sensitive to the canopy level characteristics. Based on the backscatter differences of land covers, JAXA developed a global forest map by using PALSAR mosaicked data and a threshold-based approach. However, the PALSAR-based forest maps could be influenced by buildings in the urban area, which could also have high backscatter values. The OU-FDL forest improved the algorithm by involving optical data (MODIS or Landsat) [13]. The combination of optical data and radar data integrates structure, biomass, and spectral information of forests, which can reduce some commission errors compared to PALSAR-based forest maps [13]. The other six products are generated based on Landsat data only, but with different considerations in data source selection. Specifically, the ChinaCover, GlobeLand30, and NLCD-China forest products used one static scene with least clouds and supplemented by HJ-1 satellite data [19,23,24], thus the effects of clouds and cloud shadows could still exist [46]. The FROM-GLC30 and GLCF VCF products used multiple Landsat images to eliminate cloud effects [20]. With cloud computing technology, the Hansen product utilized all good observations from all of the available cloudless Landsat 7 Top of Atmosphere (TOA) reflectance data in the growing season [11].

4.1.3. Algorithms

Most of these eight forest products used automatic classification algorithms. For example, FROM-GLC used supervised classification algorithms [20]; ChinaCover used an object-oriented classification algorithm [24]; and GlobeLand30 used a POK-based classification approach [19]. Each of these three algorithms need to collect forest and non-forest training samples through field survey and/or very high resolution images for algorithm calibration. Thus, these algorithms were influenced by the richness, spatial distribution, and spatial representativeness of training samples. Instead, the JAXA and OU-FDL forest products used the rule-based segmentation approach, and made full use of the information of forest structure based on signature analysis of training samples. The method was straightforward and easier to extend to other regions. JAXA applied regionally different thresholds for global forest mapping, while OU-FDL used a universal rule for different regions and found the results were reasonably good. The NLCD-China adopted a visual interpretation approach. Compared with automatic classification algorithms, the visual interpretation method could identify the complex features of certain land cover types which could be hard for automatic classifiers. However, the approach is labor intensive and the accuracy of results largely depends on the experiences of professionals. As the minimum texture unit for human eye to identify is about 3 × 3 pixels, thus the resultant map could have a coarser resolution than that from automatic classifiers (Figure 4).

4.2. Uncertainty of this Study and Implications for Future Works

This study used a stratified random sampling method to obtain ground truth data from Google Earth images and field photos to validate the eight forest products. However, some sampling samples were missed due to the unavailability of high resolution images in certain regions. In addition, forest and shrubs were difficult to distinguish in some areas given the intrinsic limitation of optical images. The potential bias in the validation samples could affect final accuracy assessments to some degree. Nevertheless, this study in the Loess Plateau, an especially fragile and erodible region, may provide valuable references for other regions with complex and sensitive mountainous landscapes.
Based on the validation and inter-comparison of the most recent medium resolution forest maps on the Loess Plateau, this study provided some implications for future studies. First, this study suggests that a consistent forest definition should be agreed upon to reduce the uncertainty of forest area and distribution from various forest mapping efforts. Second, the Landsat data has been the major data source for forest mapping, but PALSAR showed a reliable alternative in rapid forest mapping. How to integrate spectral data from Landsat imagery and structural data from radar observations to improve the accuracy of future forest maps should be considered a priority [47]. The OU-FDL forest map made use of both spectral and structural data from optical and radar observations for a simple and effective mapping strategy. In the future, an improved strategy to fuse both types of data could result in more accurate forest or forest species mapping. Finally, while validation plays an important role in the generation of new land cover products [20], the acquisition of ground truth samples is one of the most fundamental components. An open access validation data collection platform can not only effectively avoid repetitive work in collecting those samples, but also harness the power of citizen science to facilitate a global scale validation database. The Global Geo-reference Field Photo Library (http://www.eomf.ou.edu/photos/) used in this study and the Geo-Wiki [48] are durable demonstrations of such a robust, in situ data collection and archival platform. A more comprehensive data portal, including not only photos but also samples in other formats (shapefiles, points, video, etc.), could promote future land cover mapping.

5. Conclusions

With the rapid development of remote sensing technology in recent years, especially the open access of Landsat and PALSAR data, meaningful breakthroughs have been made in the field of forest mapping. A variety of medium resolution forest maps at the regional and global scales have emerged. In this study, we collected all the medium resolution forest cover maps in a typical forest restoration region, the Loess Plateau, from 2010. The eight forest maps, including GlobeLand30, FROM-GLC, Hansen, ChinaCover, NLCD-China, GLCF VCF, OU-FDL, and JAXA, were generated by Landsat and/or PALSAR images. We evaluated and ranked all the eight forest maps based on the ground truth samples derived from a stratified sampling approach, which utilized very high resolution images from Google Earth and field photos from the Global Geo-referenced Field Photo Library. We found that for the Loess Plateau, (1) the six Landsat-based forest maps showed large variances in accuracy, (2) the 2010 GlobeLand30 forest map had the highest accuracy (0.97 ± 0.002), and (3) the PALSAR-based forest maps (OU-FDL, JAXA) generally had a relatively high accuracy (0.95 ± 0.003). Forest area estimates based on these various forest products were different, and ranged from 7.627 ± 0.077 to 10.196 ± 0.1 m ha. With the GlobeLand30 forest map as a reference, we found the county-level forest areas of OU-FDL and JAXA forest maps had high correlation with that of GlobeLand30. These high correlations indicated that the radar data is reliable in the classification of forested areas. This study also suggested that the integration of the latest optical and radar data for more accurate forest mapping is a necessity for future research. The spatial consistency of the forest maps increased along with the increasing elevation until 2000 m asl. and then decreased with higher elevation, while the forest maps showed higher consistency as slope increased. These analyses can guide the direction of future forest mapping efforts by considering topographical factors.

Acknowledgments

This study is funded by the Key Research Program of Frontier Sciences, the Chinese Academy of Sciences (QYZDB-SSW-DQC005), the “Thousand Youth Talents Plan”, the National Natural Science Foundation of China (41371409, 41501484), the National Key Technology Research and Development Program (2013BAC03B00), and the Open Fund of State Key Laboratory of Remote Sensing Science (OFSLRSS201606). We thank Russell B. Doughty for his helps in the proof editing of the manuscript.

Author Contributions

Jinwei Dong, Xiangming Xiao, and Zhiqi Yang conceived and designed the experiments; Wenhui Kuang and Jun Zhai contributed forest datasets; Zhiqi Yang performed the experiments; Zhiqi Yang, Jinwei Dong, Jiyuan Liu, Guosong Zhao, Wei Shen, and Yan Zhou analyzed the data; Zhiqi Yang and Jinwei Dong wrote the paper.

Conflicts of Interest

The authors declare no conflict of interest.

References

  1. Foley, J.A.; DeFries, R.; Asner, G.P.; Barford, C.; Bonan, G.; Carpenter, S.R.; Chapin, F.S.; Coe, M.T.; Daily, G.C.; Gibbs, H.K. Global consequences of land use. Science 2005, 309, 570–574. [Google Scholar] [CrossRef] [PubMed]
  2. Gibson, L.; Lee, T.M.; Koh, L.P.; Brook, B.W.; Gardner, T.A.; Barlow, J.; Peres, C.A.; Bradshaw, C.J.A.; Laurance, W.F.; Lovejoy, T.E.; et al. Primary forests are irreplaceable for sustaining tropical biodiversity. Nature 2011, 478, 378–381. [Google Scholar] [CrossRef] [PubMed]
  3. Saatchi, S.S.; Harris, N.L.; Brown, S.; Lefsky, M.; Mitchard, E.T.A.; Salas, W.; Zutta, B.R.; Buermann, W.; Lewis, S.L.; Hagen, S.; et al. Benchmark map of forest carbon stocks in tropical regions across three continents. Proc. Natl. Acad. Sci. USA 2011, 108, 9899–9904. [Google Scholar] [CrossRef] [PubMed]
  4. Aubinet, M.; Grelle, A.; Ibrom, A.; Rannik, U.; Moncrieff, J.; Foken, T.; Kowalski, A.S.; Martin, P.H.; Berbigier, P.; Bernhofer, C.; et al. Estimates of the annual net carbon and water exchange of forests: The EUROFLUX methodology. Adv. Ecol. Res. 2000, 30, 113–175. [Google Scholar]
  5. Bonan, G.B. Forests and climate change: Forcings, feedbacks, and the climate benefits of forests. Science 2008, 320, 1444–1449. [Google Scholar] [CrossRef] [PubMed]
  6. Keenan, R.J.; Reams, G.A.; Achard, F.; de Freitas, J.V.; Grainger, A.; Lindquist, E. Dynamics of global forest area: Results from the FAO Global Forest Resources Assessment 2015. For. Ecol. Manag. 2015, 352, 9–20. [Google Scholar] [CrossRef]
  7. DeFries, R.; Achard, F.; Brown, S.; Herold, M.; Murdiyarso, D.; Schlamadinger, B.; de Souza, C. Earth observations for estimating greenhouse gas emissions from deforestation in developing countries. Environ. Sci. Policy 2007, 10, 385–394. [Google Scholar] [CrossRef]
  8. Grassi, G.; Monni, S.; Federici, S.; Achard, F.; Mollicone, D. Applying the conservativeness principle to REDD to deal with the uncertainties of the estimates. Environ. Res. Lett. 2008, 3, 51–55. [Google Scholar] [CrossRef]
  9. Yu, D.Y.; Shi, P.J.; Han, G.Y.; Zhu, W.Q.; Du, S.Q.; Xun, B. Forest ecosystem restoration due to a national conservation plan in China. Ecol. Eng. 2011, 37, 1387–1397. [Google Scholar] [CrossRef]
  10. Li, M.-M.; Liu, A.-T.; Zou, C.-J.; Xu, W.-D.; Shimizu, H.; Wang, K.-Y. An overview of the “Three-North” Shelterbelt project in China. For. Stud. China 2012, 14, 70–79. [Google Scholar] [CrossRef]
  11. Hansen, M.C.; Potapov, P.V.; Moore, R.; Hancher, M.; Turubanova, S.; Tyukavina, A.; Thau, D.; Stehman, S.; Goetz, S.; Loveland, T. High-resolution global maps of 21st-century forest cover change. Science 2013, 342, 850–853. [Google Scholar] [CrossRef] [PubMed]
  12. Hansen, M.C.; Stehman, S.V.; Potapov, P.V. Quantification of global gross forest cover loss. Proc. Natl. Acad. Sci. USA 2010, 107, 8650–8655. [Google Scholar] [CrossRef] [PubMed]
  13. Qin, Y.; Xiao, X.; Dong, J.; Zhang, G.; Shimada, M.; Liu, J.; Li, C.; Kou, W.; Moore, B., III. Forest cover maps of China in 2010 from multiple approaches and data sources: PALSAR, Landsat, MODIS, FRA, and NFI. ISPRS J. Photogramm. Remote Sens. 2015, 109, 1–16. [Google Scholar] [CrossRef]
  14. Loveland, T.R.; Reed, B.C.; Brown, J.F.; Ohlen, D.O.; Zhu, Z.; Yang, L.; Merchant, J.W. Development of a global land cover characteristics database and IGBP DISCover from 1 km AVHRR data. Int. J. Remote Sens. 2000, 21, 1303–1330. [Google Scholar] [CrossRef]
  15. Hansen, M.C.; Defries, R.S.; Townshend, J.R.G.; Sohlberg, R. Global land cover classification at 1 km spatial resolution using a classification tree approach. Int. J. Remote Sens. 2000, 21, 1331–1364. [Google Scholar] [CrossRef]
  16. Bartholome, E.; Belward, A.S. GLC2000: A new approach to global land cover mapping from Earth observation data. Int. J. Remote Sens. 2005, 26, 1959–1977. [Google Scholar] [CrossRef]
  17. Bontemps, S.; Defourny, P.; Bogaert, E.V.; Arino, O.; Kalogirou, V.; Perez, J.R. GLOBCOVER 2009—Products Description and Validation Report; UCL: London, UK, 2011. [Google Scholar]
  18. Friedl, M.A.; Sulla-Menashe, D.; Tan, B.; Schneider, A.; Ramankutty, N.; Sibley, A.; Huang, X. MODIS Collection 5 global land cover: Algorithm refinements and characterization of new datasets. Remote Sens. Environ. 2010, 114, 168–182. [Google Scholar] [CrossRef]
  19. Chen, J.; Chen, J.; Liao, A.; Cao, X.; Chen, L.; Chen, X.; He, C.; Han, G.; Peng, S.; Lu, M. Global land cover mapping at 30 m resolution: A POK-based operational approach. ISPRS J. Photogramm. Remote Sens. 2015, 103, 7–27. [Google Scholar] [CrossRef]
  20. Gong, P.; Wang, J.; Yu, L.; Zhao, Y.; Zhao, Y.; Liang, L.; Niu, Z.; Huang, X.; Fu, H.; Liu, S.; et al. Finer resolution observation and monitoring of global land cover: first mapping results with Landsat TM and ETM+ data. Int. J. Remote Sens. 2013, 34, 2607–2654. [Google Scholar] [CrossRef]
  21. Sexton, J.O.; Song, X.P.; Feng, M.; Noojipady, P.; Anand, A.; Huang, C.Q.; Kim, D.H.; Collins, K.M.; Channan, S.; DiMiceli, C.; et al. Global, 30-m resolution continuous fields of tree cover: Landsat-based rescaling of MODIS vegetation continuous fields with lidar-based estimates of error. Int. J. Digit. Earth 2013, 6, 427–448. [Google Scholar] [CrossRef]
  22. Shimada, M.; Itoh, T.; Motooka, T.; Watanabe, M.; Shiraishi, T.; Thapa, R.; Lucas, R. New global forest/non-forest maps from ALOS PALSAR data (2007–2010). Remote Sens. Environ. 2014, 155, 13–31. [Google Scholar] [CrossRef]
  23. Liu, J.; Zhang, Z.; Xu, X.; Kuang, W.; Zhou, W.; Zhang, S.; Li, R.; Yan, C.; Yu, D.; Wu, S. Spatial patterns and driving forces of land use change in China in the early 21st century. J. Geogr. Sci. 2010, 20, 483–494. [Google Scholar] [CrossRef]
  24. Wu, B.; Yuan, Q.; Yan, C.; Wang, Z.; Yu, X.; Li, A.; Ma, R.; Huang, J.; Chen, J.; Chang, C. Land cover changes of China from 2000 to 2010. Quat. Sci. 2014, 34, 723–731. [Google Scholar]
  25. Sexton, J.O.; Noojipady, P.; Song, X.P.; Feng, M.; Song, D.X.; Kim, D.H.; Anand, A.; Huang, C.Q.; Channan, S.; Pimm, S.L.; et al. Conservation policy and the measurement of forests. Nat. Clim. Chang. 2016, 6, 192–196. [Google Scholar] [CrossRef]
  26. Wang, H.; Liu, Z.; Gu, L.; Wen, C. Observations of China’s forest change (2000–2013) based on Global Forest Watch dataset. Biodivers. Science 2015, 23, 575–582. [Google Scholar]
  27. Zhai, J.; Liu, R.; Liu, J.; Huang, L.; Qin, Y. Human-Induced Landcover Changes Drive a Diminution of Land Surface Albedo in the Loess Plateau (China). Remote Sens. 2015, 7, 2926–2941. [Google Scholar] [CrossRef]
  28. Sun, W.; Shao, Q.; Liu, J.; Zhai, J. Assessing the effects of land use and topography on soil erosion on the Loess Plateau in China. Catena 2014, 121, 151–163. [Google Scholar] [CrossRef]
  29. Liu, J.Y.; Liu, M.L.; Tian, H.Q.; Zhuang, D.F.; Zhang, Z.X.; Zhang, W.; Tang, X.M.; Deng, X.Z. Spatial and temporal patterns of China's cropland during 1990-2000: An analysis based on Landsat TM data. Remote Sens. Environ. 2005, 98, 442–456. [Google Scholar] [CrossRef]
  30. Liu, J.Y.; Tian, H.Q.; Liu, M.L.; Zhuang, D.F.; Melillo, J.M.; Zhang, Z.X. China’s changing landscape during the 1990s: Large-scale land transformations estimated with satellite data. Geophys. Res. Lett. 2005, 32, L02405. [Google Scholar] [CrossRef]
  31. Channan, S.; Feng, M.; Kim, D.H.; Sexton, J.O.; Song, X.P.; Song, D.X.; Noojipady, P.; Collins, K.; Anand, A.; Townshend, J.R. THE GLS Plus an Enhancement of the Global Land Survey Datasets. Photogramm. Eng. Remote Sens. 2015, 81, 521–525. [Google Scholar]
  32. Gutman, G.; Huang, C.Q.; Chander, G.; Noojipady, P.; Masek, J.G. Assessment of the NASA-USGS Global Land Survey (GLS) datasets. Remote Sens. Environ. 2013, 134, 249–265. [Google Scholar] [CrossRef]
  33. Yu, L.; Wang, J.; Gong, P. Improving 30 m global land-cover map FROM-GLC with time series MODIS and auxiliary data sets: A segmentation-based approach. Int. J. Remote Sens. 2013, 34, 5851–5867. [Google Scholar] [CrossRef]
  34. Yu, L.; Wang, J.; Clinton, N.; Xin, Q.C.; Zhong, L.H.; Chen, Y.L.; Gong, P. FROM-GC: 30 m global cropland extent derived through multisource data integration. Int. J. Digit. Earth 2013, 6, 521–533. [Google Scholar] [CrossRef]
  35. Xiao, X.; Dorovskoy, P.; Biradar, C.; Bridge, E. A library of georeferenced photos from the field. Eos Trans. Am. Geophys. Union 2011, 92, 453–454. [Google Scholar] [CrossRef]
  36. Potere, D. Horizontal Positional Accuracy of Google Earth’s High-Resolution Imagery Archive. Sensors 2008, 8, 7973–7981. [Google Scholar] [CrossRef] [PubMed]
  37. Viña, A.; Mcconnell, W.J.; Yang, H.; Xu, Z.; Liu, J. Effects of conservation policy on China’s forest recovery. Sci. Adv. 2016, 2, e1500965. [Google Scholar] [CrossRef] [PubMed]
  38. Dong, J.; Xiao, X.; Sheldon, S.; Biradar, C.; Duong, N.D.; Hazarika, M. A comparison of forest cover maps in Mainland Southeast Asia from multiple sources: PALSAR, MERIS, MODIS and FRA. Remote Sens. Environ. 2012, 127, 60–73. [Google Scholar] [CrossRef]
  39. Dong, J.; Xiao, X.; Menarguez, M.A.; Zhang, G.; Qin, Y.; Thau, D.; Biradar, C.; Moore, B., III. Mapping paddy rice planting area in northeastern Asia with Landsat 8 images, phenology-based algorithm and Google Earth Engine. Remote Sens. Environ. 2016, 185, 142–154. [Google Scholar] [CrossRef] [PubMed]
  40. Yang, Y.; Xiao, P.; Feng, X.; Li, H. Accuracy assessment of seven global land cover datasets over China. ISPRS J. Photogramm. Remote Sens. 2017, 125, 156–173. [Google Scholar] [CrossRef]
  41. Mayaux, P. Validation of the global land cover 2000 map. IEEE Trans. Geosci. Remote Sens. 2006, 44, 1728–1739. [Google Scholar] [CrossRef]
  42. Card, D.H. Using known map category marginal frequencies to improve estimates of thematic map accuracy. Photogramm. Eng. Remote Sens. 1982, 48, 431–439. [Google Scholar]
  43. Olofsson, P.; Foody, G.M.; Stehman, S.V.; Woodcock, C.E. Making better use of accuracy data in land change studies: Estimating accuracy and area and quantifying uncertainty using stratified estimation. Remote Sens. Environ. 2013, 129, 122–131. [Google Scholar] [CrossRef]
  44. Mcroberts, R.E.; Walters, B.F. Statistical inference for remote sensing-based estimates of net deforestation. Remote Sens. Environ. 2012, 124, 394–401. [Google Scholar] [CrossRef]
  45. Kobayashi, T.; Tsend-Ayush, J.; Tateishi, R. A new tree cover percentage map in Eurasia at 500 m resolution using MODIS data. Remote Sens. 2013, 6, 209–232. [Google Scholar] [CrossRef]
  46. Ju, J.; Roy, D.P. The availability of cloud-free Landsat ETM+ data over the conterminous United States and globally. Remote Sens. Environ. 2008, 112, 1196–1211. [Google Scholar] [CrossRef]
  47. Reiche, J.; Lucas, R.; Mitchell, A.L.; Verbesselt, J.; Hoekman, D.H.; Haarpaintner, J.; Kellndorfer, J.M.; Rosenqvist, A.; Lehmann, E.A.; Woodcock, C.E. Combining satellite data for better tropical forest monitoring. Nat. Clim. Chang. 2016, 6, 120–122. [Google Scholar] [CrossRef]
  48. Fritz, S.; McCallum, I.; Schill, C.; Perger, C.; See, L.; Schepaschenko, D.; Van der Velde, M.; Kraxner, F.; Obersteiner, M. Geo-Wiki: An online platform for improving global land cover. Environ. Model. Softw. 2012, 31, 110–123. [Google Scholar] [CrossRef]
Figure 1. Digital elevation map of the Loess Plateau. The inset shows the location of the Loess Plateau in China.
Ijgi 06 00152 g001
Figure 2. Ground truth samples derived from Google Earth and ground field photos. The procedures of the generation of regions of interest (ROIs) are described in detail in Section 2.4.
Ijgi 06 00152 g002
Figure 3. Distribution of forests according to the eight different forest products (GlobeLand30, OU-FDL, Hansen, NLCD-China, FROM-GLC, JAXA, GLCF VCF, and ChinaCover).
Ijgi 06 00152 g003
Figure 4. A zoom-in comparison of eight forest products across a case region with fragmented landscapes.
Ijgi 06 00152 g004
Figure 5. Relationships of different forest products in terms of county-level areas, using the GlobeLand30 forest map as the reference.
Ijgi 06 00152 g005
Figure 6. Discrepancy of the eight types of forest products. (a) Spatial distribution of forest product discrepancy based on forest frequency; (b) frequency distribution of forest counts.
Ijgi 06 00152 g006
Figure 7. The spatial consistency index (SPI) of forests and spatial distribution of slope on the Loess Plateau. (a) The SPI in the forest-dominant region, and (b) slope gradients.
Ijgi 06 00152 g007
Figure 8. Variation of the spatial consistency index along different (a) elevation gradients, and (b) slope gradients.
Ijgi 06 00152 g008
Table 1. A brief summary of the basic characteristics of the eight remote sensing forest products used in this study.
Forest/Land Cover ProductsForest DefinitionResolutionData SourcesAlgorithmsReferences
Tree DensityTree Height
GlobeLand3010% 30mLandsat, HJ-1POK-based method[19]
FROM-GLC15%3 m30 mLandsatAutomatic classification algorithms[20]
Hansen10%5 m30 mLandsat ETM+Supervised classification (decision tree)[11]
ChinaCover20%3 m30 mHJ-1A/B, MODISObject-oriented classification[24]
NLCD-China10%(1)30 mLandsat, CBERS and HJ-1AVisual interpretation approach[29,30]
GLCF VCF10%5 m30 mLandsatSupervised classification[21]
OU-FDL10%5 m50 mPALSAR, MODISDecision Tree[13]
JAXA10% 50 mPALSARDecision Tree[22]
(1) Including natural, planted forests and other woodlands with vegetation cover over 10%, and <2 m shrublands with tree density >40%.
Table 2. Area-weighted confusion matrix of accuracy assessments of the eight forest products with a 95% confidence interval.
Forest Products GT SamplesWiUAPAOA
ForestNon-Forest
GlobeLand30forest34096380.190.84 ± 0.010.93 ± 0.0090.97 ± 0.002
non-forest194117,0270.810.99 ± 0.0020.97 ± 0.002
FROM-GLCforest340813220.220.72 ± 0.010.92 ± 0.010.95 ± 0.002
non-forest195116,3430.780.99 ± 0.0010.95 ± 0.002
Hansenforest25641580.130.94 ± 0.0080.63 ± 0.010.94 ± 0.003
non-forest1039117,5070.870.94 ± 0.0030.99 ± 0.001
ChinaCoverforest26483990.140.87 ± 0.010.67 ± 0.010.94 ± 0.003
non-forest955117,2660.860.95 ± 0.0030.98 ± 0.002
NLCD-Chinaforest26997010.160.79 ± 0.010.74 ± 0.010.93 ± 0.003
non-forest904116,9640.840.95 ± 0.0030.96 ± 0.002
GLCF VCFforest298510000.190.75 ± 0.010.79 ± 0.010.93 ± 0.003
non-forest618116,6650.810.96 ± 0.0030.95 ± 0.002
OU-FDLforest29024600.160.86 ± 0.010.73 ± 0.010.95 ± 0.003
non-forest701117,2050.840.96 ± 0.0030.98 ± 0.001
JAXAforest26641940.130.93 ± 0.0080.62 ± 0.020.95 ± 0.003
non-forest939117,4710.870.95 ± 0.0030.99 ± 0.001
Note: UA: User Accuracy; PA: Producer Accuracy; OA: Overall Accuracy; GT: Ground Truth; Wi: proportion of area mapped.

