Article

Extraction of Terraces on the Loess Plateau from High-Resolution DEMs and Imagery Utilizing Object-Based Image Analysis

1
Key Laboratory of Virtual Geographic Environment of Ministry of Education, Nanjing Normal University, Nanjing 210023, China
2
Jiangsu Center for Collaborative Innovation in Geographical Information Resource Development and Application, Nanjing 210023, China
3
School of Environment Science, Nanjing Xiaozhuang University, Nanjing 211171, China
4
Department of Geoinformatics–Z_GIS, University of Salzburg, Salzburg 5020, Austria
*
Author to whom correspondence should be addressed.
ISPRS Int. J. Geo-Inf. 2017, 6(6), 157; https://0-doi-org.brum.beds.ac.uk/10.3390/ijgi6060157
Submission received: 14 March 2017 / Revised: 28 April 2017 / Accepted: 24 May 2017 / Published: 27 May 2017

Abstract

:
Terraces are typical artificial landforms on the Loess Plateau, with ecological functions in water and soil conservation, agricultural production, and biodiversity. Recording the spatial distribution of terraces is the basis of monitoring their extent and understanding their ecological effects. The current terrace extraction method mainly relies on high-resolution imagery, but its accuracy is limited due to vegetation coverage distorting the features of terraces in imagery. High-resolution topographic data reflecting the morphology of true terrace surfaces are needed. Terraces extraction on the Loess Plateau is challenging because of the complex terrain and diverse vegetation after the implementation of “vegetation recovery”. This study presents an automatic method of extracting terraces based on 1 m resolution digital elevation models (DEMs) and 0.3 m resolution Worldview-3 imagery as auxiliary information used for object-based image analysis (OBIA). A multi-resolution segmentation method was used where slope, positive and negative terrain index (PN), accumulative curvature slope (AC), and slope of slope (SOS) were determined as input layers for image segmentation by correlation analysis and Sheffield entropy method. The main classification features based on DEMs were chosen from the terrain features derived from terrain factors and texture features by gray-level co-occurrence matrix (GLCM) analysis; subsequently, these features were determined by the importance analysis on classification and regression tree (CART) analysis. Extraction rules based on DEMs were generated from the classification features with a total classification accuracy of 89.96%. The red band and near-infrared band of images were used to exclude construction land, which is easily confused with small-size terraces. As a result, the total classification accuracy was increased to 94%. The proposed method ensures comprehensive consideration of terrain, texture, shape, and spectrum characteristics, demonstrating huge potential in hilly-gully loess region with similarly complex terrain and diverse vegetation covers.

1. Introduction

The Loess Plateau is one of the areas in the world that experience severe soil erosion due to its structured terrain and loose loess substrate, and it is a major agricultural production region in China [1]. The sloping farmlands, accounting for 83.38% of the total arable area in the Loess Plateau (no statistics for Henan and Qinghai provinces), are the main source of surface water runoff and soil loss [2]. Changing sloping fields into agricultural terraces is one of the main measures for conserving water and soil and improving agricultural production in the Loess Plateau because terracing enhances water infiltration, reduces soil erosion risks, and improves biodiversity by increasing landscape diversity [3]. The European Common Agricultural Policy also emphasizes the importance of terraces as an integrated system of land and natural resource management [4]. A series of studies reported on the effects of terraces on soil and water processes, which is an important research field regarding terraces [5,6,7,8]; many of these studies were carried out on the Loess Plateau [9,10,11,12]. However, these studies mainly focused on individual slopes or small watersheds [6,11], thus having finite applicability and providing limited guidance for large-scaled regions. The effects of terracing are complex problems influenced by topography, soil, precipitation, vegetation cover, and land use. They are also associated with difficulties in obtaining the precise spatial distribution of terraces at a large scale. Moreover, the premise for terraces exhibiting a positive ecological function is that they are properly constructed and managed [12]. Conversely, terraces will collapse and aggravate erosion, generating a negative ecological effect [12,13]. Therefore, monitoring terraces is of great significance in understanding their ecological value. Obtaining the accurate areas and boundaries of terraces are essential tasks for understanding the large-scale regional ecological effects and land use management of terraces.
With high-resolution imagery, which is necessary for extracting terraces due to the small size of single terraces, manual visual interpretation from high-resolution images [12,14] has gradually become a common method for terrace identification, which was also applied in monitoring the soil and water conservation measures in the loess hilly-gullied region on the Loess Plateau [15]. At the same time, an automatic extraction method using spectral, shape, and textural features from imagery was developed [12,16].
Although terraces could be extracted automatically by using imagery, the ability and validity of extraction are affected by terrace covers, which may lead to confusion between terraces and non-terraces with similar covers. Topographic information reflecting the relief of true terrace topographies and excluding the effect of vegetation coverage is therefore necessary. The development of high-resolution digital elevation model (DEM) made it possible to identify terraces through terrain features. Moreover, research aimed at the automatic extraction of agricultural terraces based on topographic information is receiving increased attention [17,18]. However, research on the Loess Plateau with its extremely complex terrain has not yet been carried out. Moreover, with the implementation of the vegetation recovery program “Grain for Green” for conserving water and soil, a large number of agricultural terraces on the Loess Plateau have been changed to grassland or forestland. Thus, the discrimination of terraces and non-terraces from the spectral characteristics of image was reduced because of the relatively high vegetation coverage. The terrace extraction of the Loess Plateau after vegetation recovery needs more detailed terrain data reflecting the actual terrace morphology, which is a challenging direction of research.
Object-based image analysis (OBIA) has been widely used over the last decade [19]. Blaschke and Strobl pointed out that compared with the traditional pixel-based methods, the OBIA method is superior because the analysis unit transfers from pixels to meaningful objects [20]. Compared with pixel-based methods that do not use any spatial concepts [20], OBIA could determine object classes more accurately [21] by combining spectral information with spatial information of target features [22]. More important, OBIA is more effective than pixel-based approaches in classifying high-resolution data, which are necessary in terraces extraction to cluster grid elements into objects; high-resolution data have high spectral variety between pixels, which often results in oversampling of the scene [23,24].
On the basis of the above considerations, this study was performed to explore the terrace extraction. The objectives of this study were as follows: (1) to propose a method for algorithmically identifying terraces on the Loess Plateau from integrating high-resolution DEMs and imagery using the OBIA method; (2) to discuss the validity and application of the method integrating terrain features and satellite imagery.

2. Data Sets and Methods

2.1. Study Area

The study area, Qingshuigou, is located in Suide County of the Northern Shaanxi Province of China, and it covers an area of 1.9 km2 (Figure 1). Suide County is situated in the key soil erosion region of the Loess Plateau and is one of the focal areas of soil loss and erosion control. In addition, an experimental scientific station for ecology and environment is set up in the study area, thus facilitating field works.
The study area is located in the hilly and gully region of the Loess Plateau. It has elevations that range from 784 m to 988 m above sea level, 66.1% of which has slopes steeper than 25° and slopes averaging 33° overall. On the top of loess hills and above the full shoulder line, most of the land is terraced farmland, much of which has been converted to shrub land, grass land, or abandoned cropland since the implementation of the Grain to Green project in 1999. Sloping farmland and many shallow gullies are observed between the shoulder line and the bottom of the gully.

2.2. Data Acquisition

In this study, DEMs and WorldView-3 imagery were used to extract terraces. 1 m resolution DEMs were generated by unmanned aerial vehicles (UAVs) and digital aerial photogrammetry method [25]. A digital system camera, Sony ILCE-7R (Sony Corporation, Tokyo, Japan) with a sensor of 7360 × 4912 pixels, was mounted on the UAV. The acquisition process of DEM was as follows: first, 49 ground control points were obtained by the GPS-RTK (Global Positioning System, Real-time Kinematic) method; second, aerial triangulation based on control points was implemented; third, digital surface model (DSM) with 0.2 m resolusion including the vegetation and manmade features above the bare earth surface) were extracted using photogrammetric software; finally, DEMs were generated from DSMs by removed building and vegetation manually [26].
The dataset of WorldView-3 imagery with a cloud cover of about 1% and an off nadir angle of less than 15°, contained a panchromatic band with 0.31 m resolution and multispectral bands (red, green, blue, and near-infrared bands) with 1.24 m resolution. The pan-sharpening process was done to transform 1.24 m resolution multispectral images to higher spatial resolution color images by fusing 0.31 m resolution panchromatic images. The WorldView-3 “basic level” imagery has been corrected for radiometric distortions, internal sensor geometry, and optical and sensor distortions. The orthorectification was made using the the ground control points [27] which was obtained in the acquisition process of DEM.
For the accuracy assessment of terraces extraction, an actual terrace map was digitalized by visual interpretation based on WorldView-3 images, aerial photographs, and field photographs.

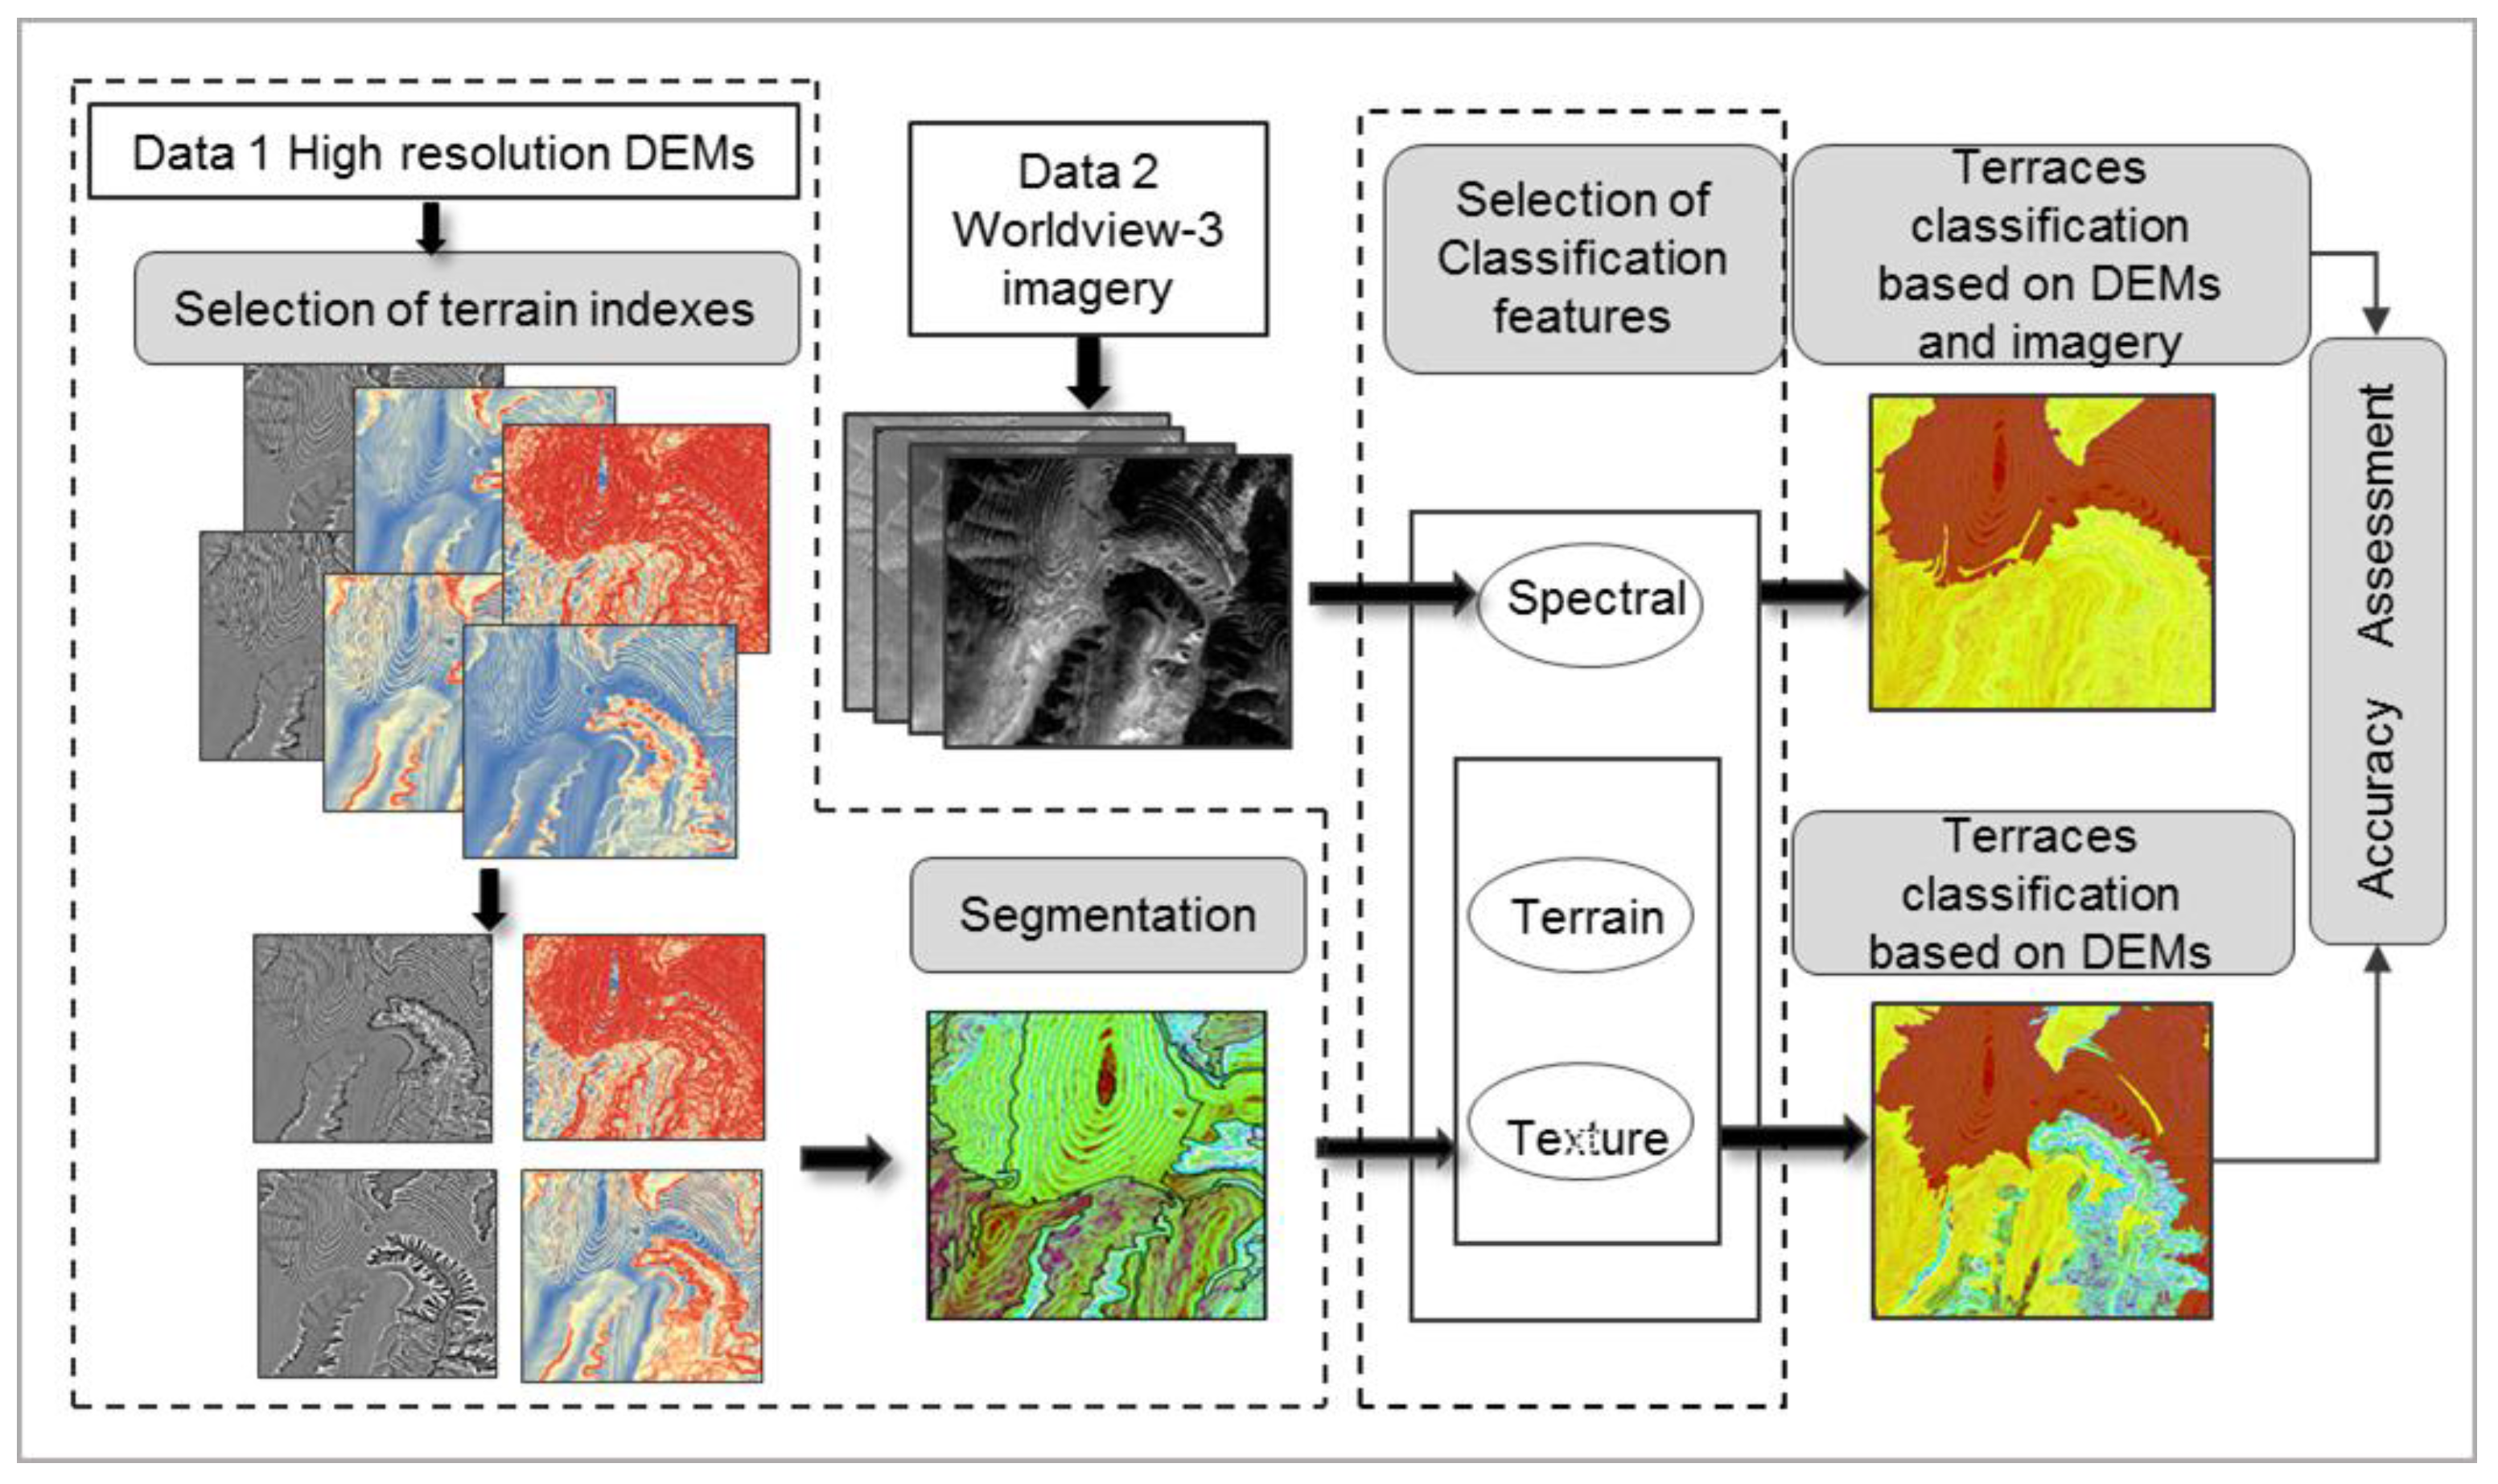
2.3. Overview of Extraction

The proposed method of terrace extraction based on OBIA includes the following stages (Figure 2): (1) selection of terrain indexes derived from DEMs for segmentation; (2) segmentation based on the selected terrain indexes; (3) determination of the classification features considering the terrain and texture information from DEMs and the spectral information from the images; and (4) classification of terraces based on the classification features and accuracy assessment. Two classifications and evaluations were performed to clarify the validation of the method. The first one was based solely on DEMs, and the second one was based on DEMs and images.

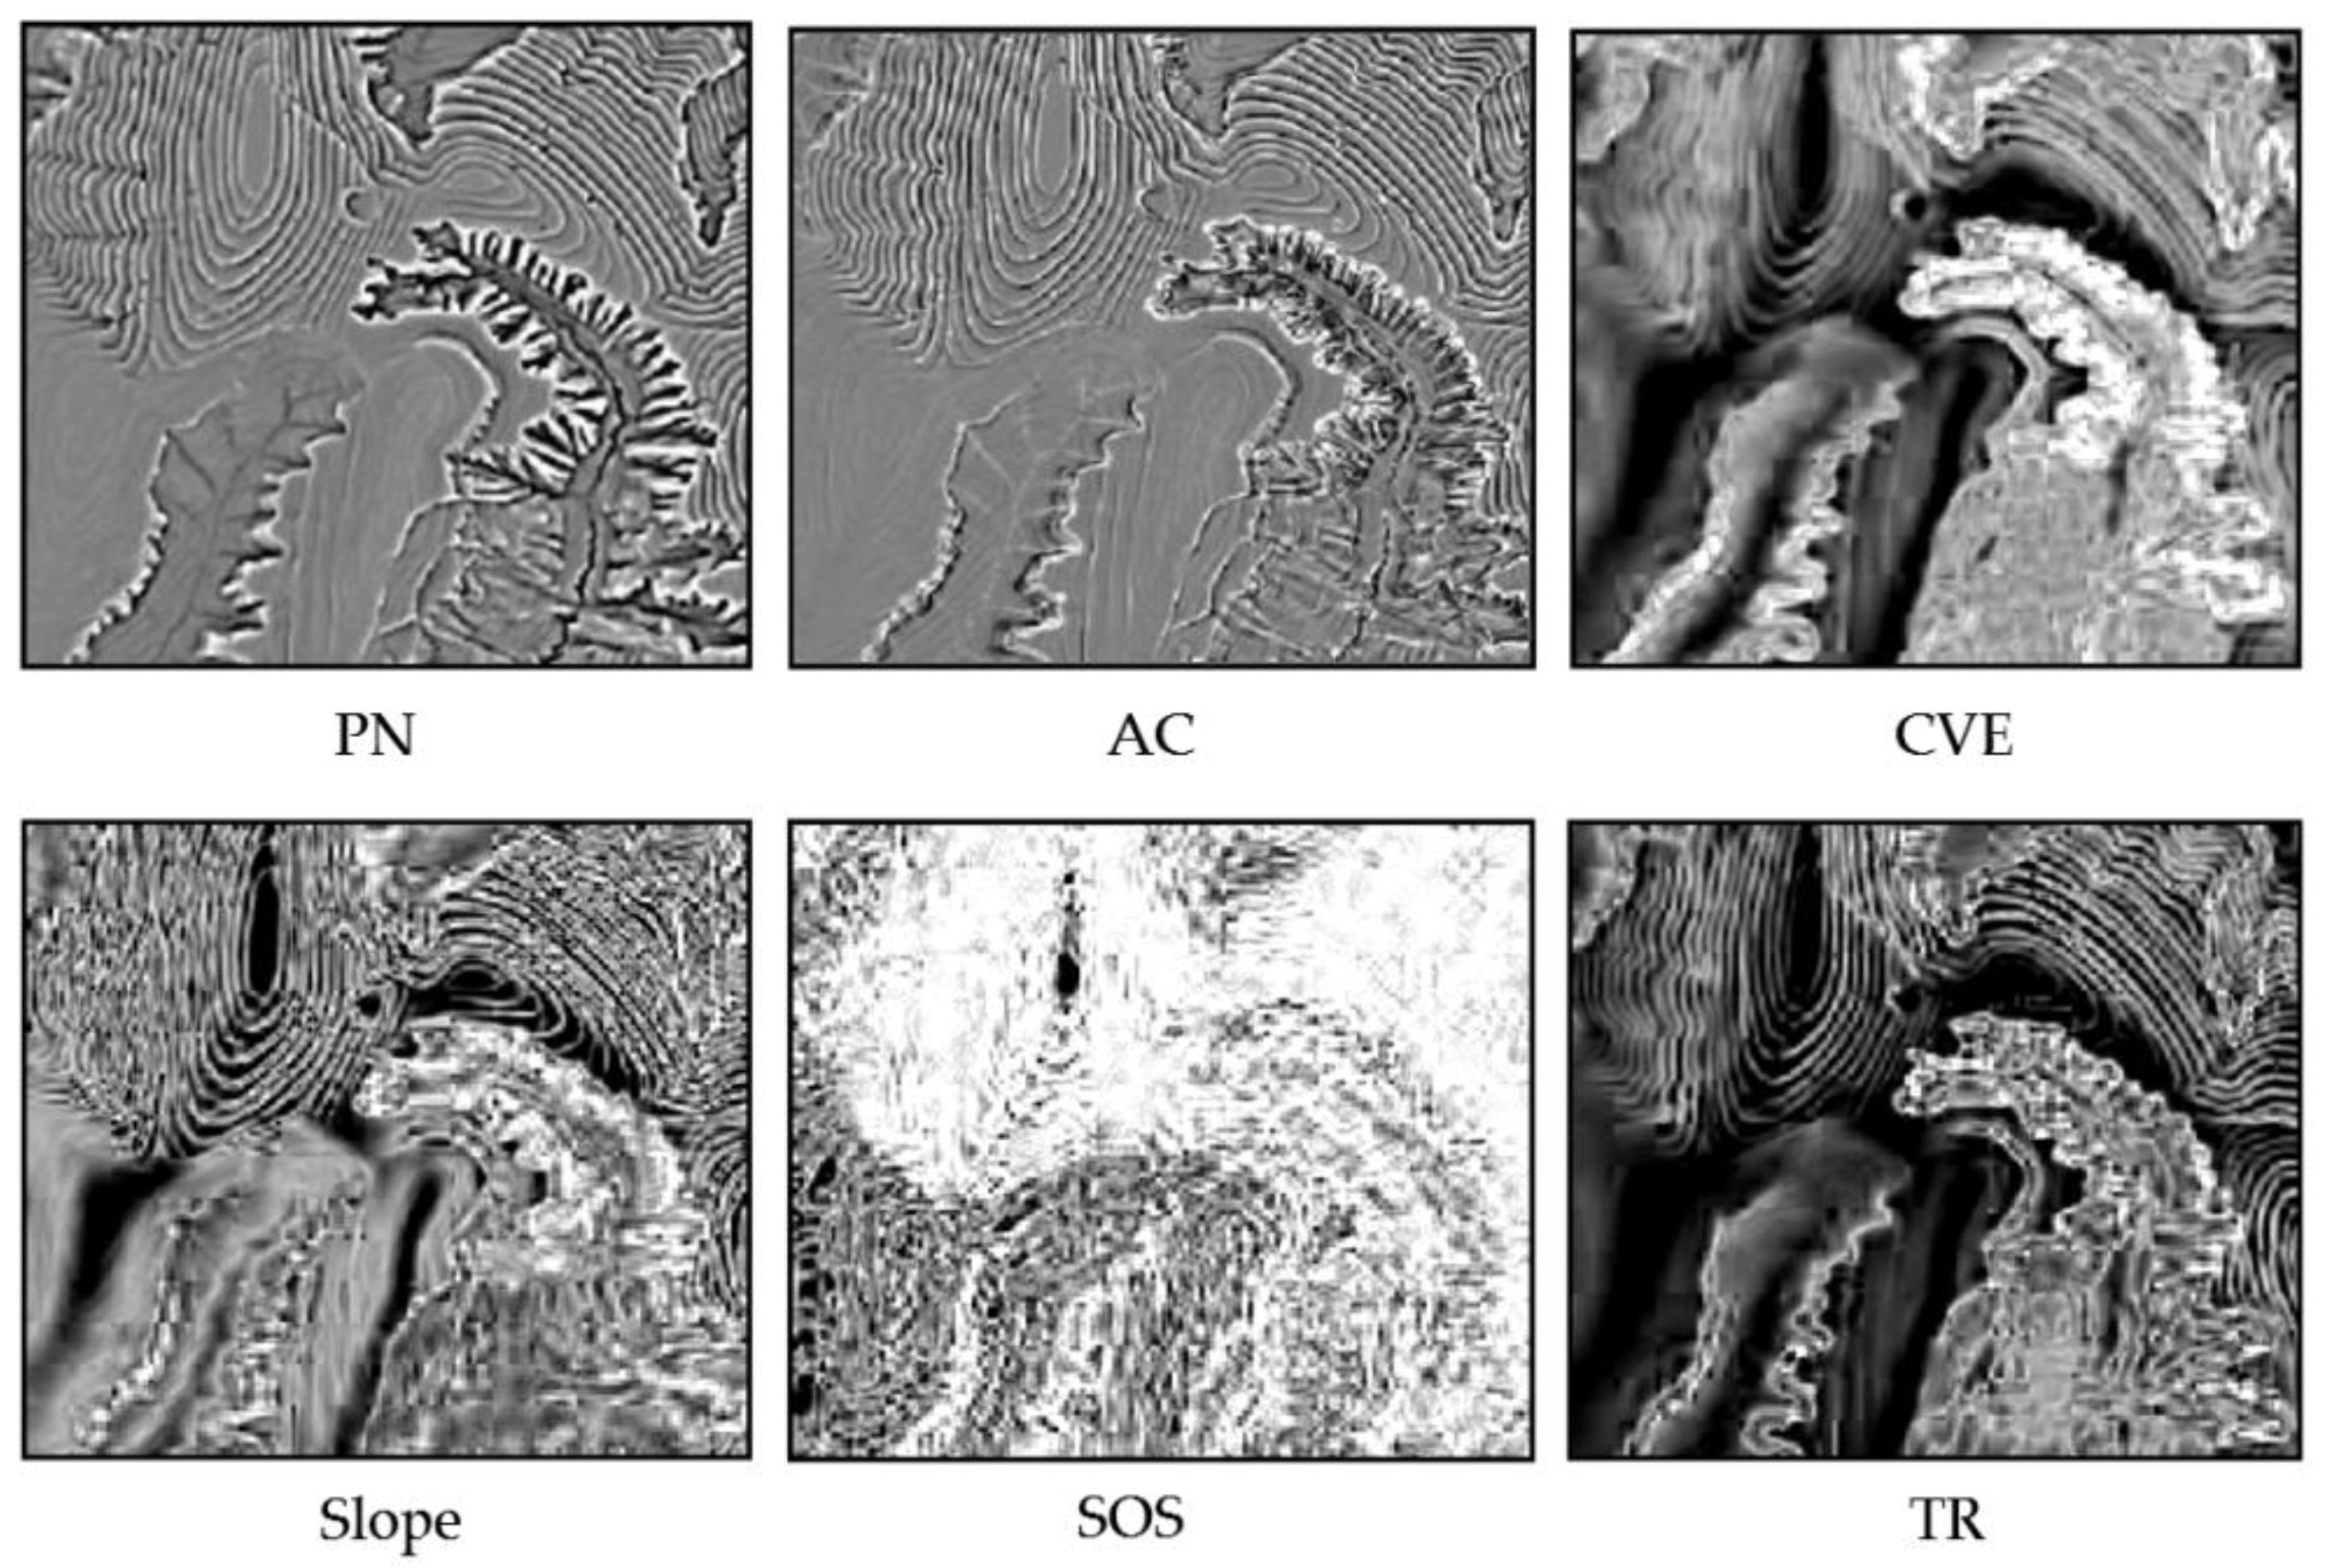
2.4. Selection of Terrain Indexes
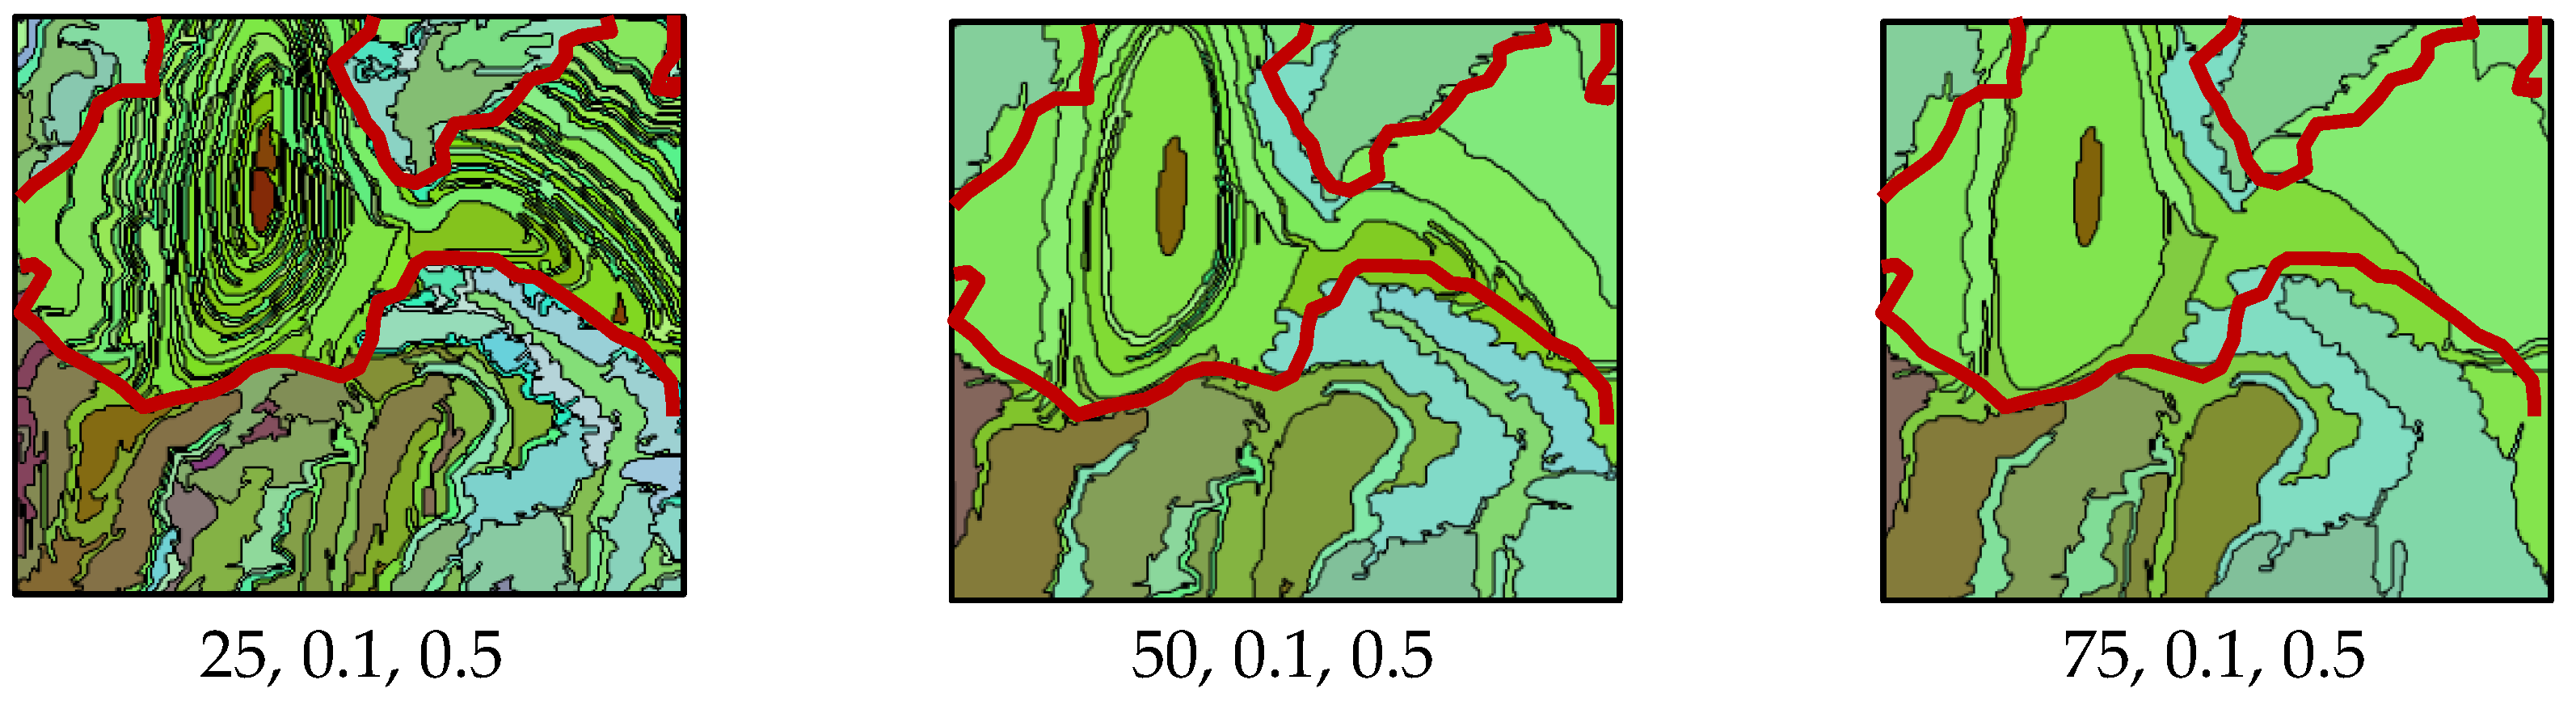
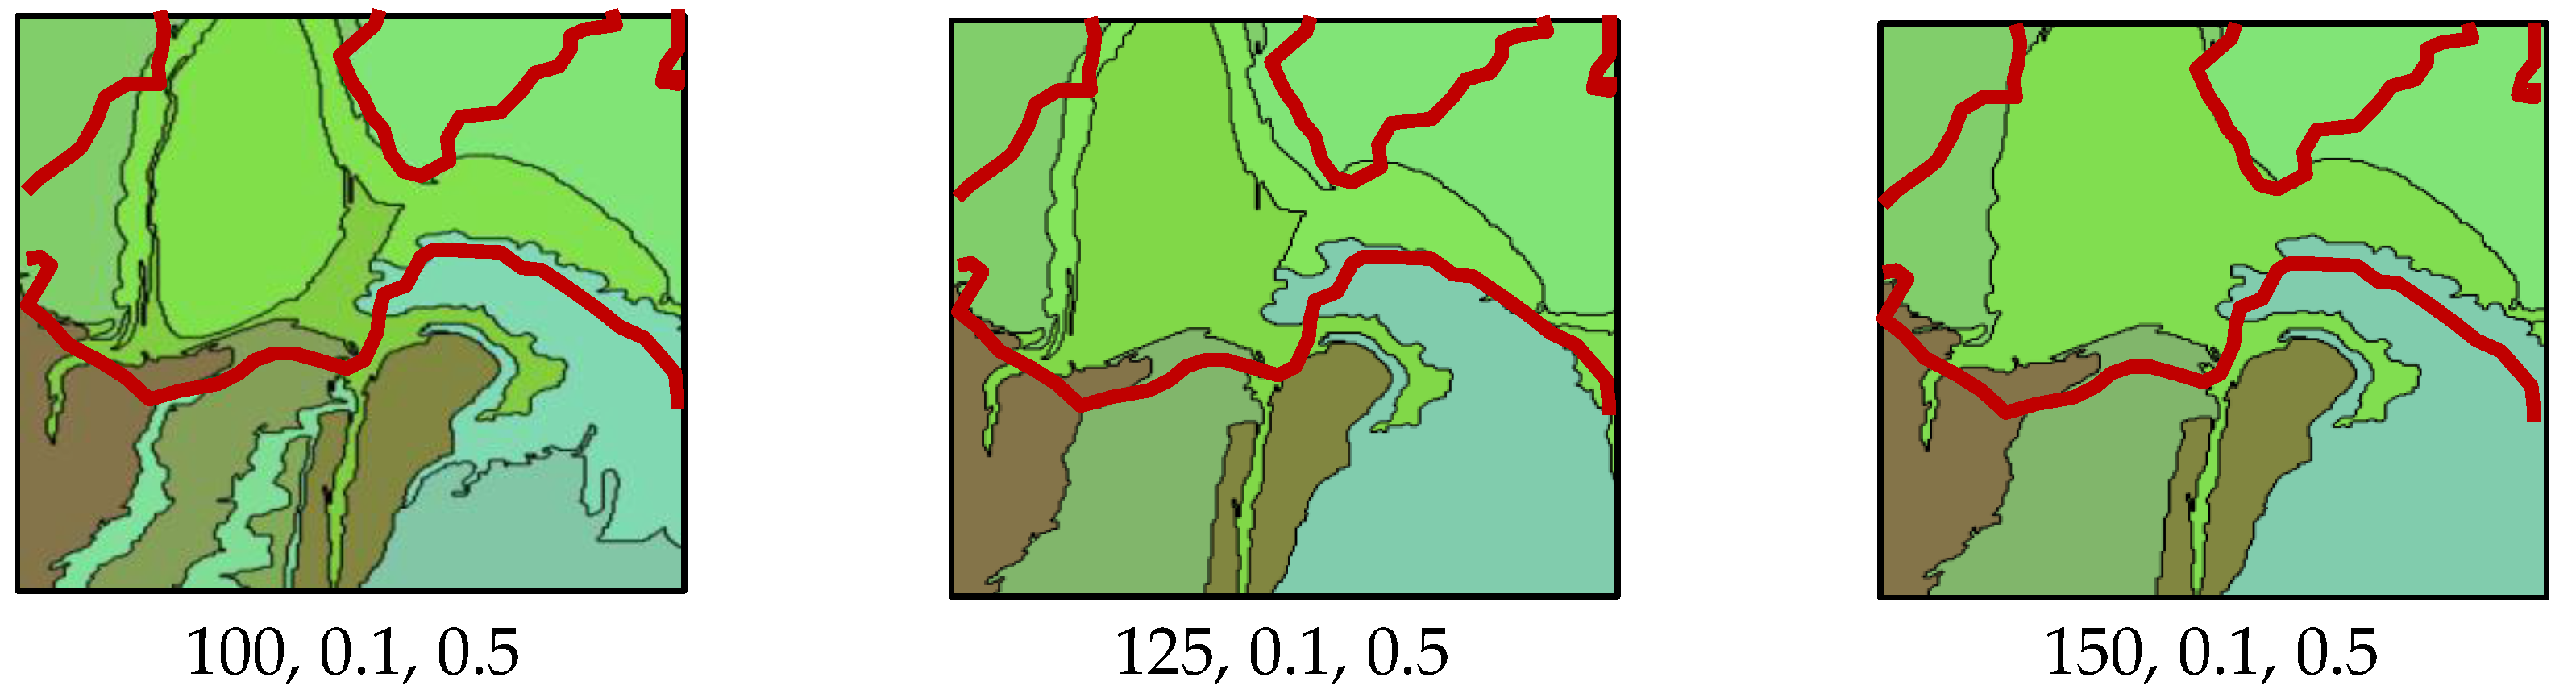
According to the Chinese national standard, “comprehensive control of soil and water conservation–technical specification–technique for erosion control of slope land” (GB/T 16453.1-2008), elevation is not a factor in restricting the construction of terraces; thus, the DEMs were not directly used for segmentation in this study. The standard requires the construction of terraces to follow certain requirements on hillside slope.
The pattern of positive and negative loess terrain is typical topographic characteristics of the Loess Plateau. The loess shoulder lines, as crucial feature lines of loess geomorphy, are the boundaries of positive and negative terrains [28]. The positive terrain is the area up the shoulder line, and the negative terrain is the area under the shoulder line. Typically, the negative terrain is characterized by steep slopes, high erosion, and weak light; thus, it is not suitable for terrace building. As terraces consist of steps with obvious and regular mutations, the topographic features of the terrace surface, such as altitude variation, curvature, and roughness, clearly differ from those of other natural slopes.
The combination of terrain indexes derived from DEMs can express landscape and morphological characteristics comprehensively [29] and was thus used for a multi-layer image segmentation. The above characteristics of terraces motivated us to pre-select the following terrain indexes: positive and negative terrain index (PN, Equation (1), accumulative curvature (AC, Equations (2)–(6)), coefficient of variation in elevation (CVE, Equations (7) and (8)), slope (Equation (9)), slope of slope (SOS, Equation (10)), and terrain roughness (TR, Equation (11)).
PN = H m a x H m e a n
where
Hmax = the maximum elevation in the neighborhood
Hmean = the mean elevation in the neighborhood
A C = K p K c
K p = z x x z x 2 + 2 z x y z x z y + z y y z y 2 p q 3 / 2
K c = z x x z y 2 2 z x y z x z y + z y y z x 2 p 3 / 2
p = z x 2 + z y 2
q = p + 1
where
AC = accumulative curvature
K p = profile curvature
K c = planiform curvature
z x x , z x y , z y y are the second-order derivatives that describe the rate of elevation change with direction along the x and y axes.
C V E = S D z ¯
S D = [ 1 n 1 k = 1 n ( z k z ¯ ) 2 ] 1 2
where
SD = standard deviation
z ¯ = average elevation in the neighborhood
S l o p e = z x 2 + z y 2
where
z x = the first-order derivative that describes the rate of elevation change in the x direction
z y = the rate of elevation change in y direction.
S O S = S l o p e ( s )
T R = 1 / cos ( s )
where
S = slope
The black rectangular box zone in the study area (Figure 1c), was chosen to display the results of the extraction of terrain indexes and that of the segmentation. The comparison of the calculation results of the six pre-selected terrain indexes (Figure 3) with the real terrace distribution (Figure 1d) revealed that these terrain indexes all contributed to terrain segmentation. Terraced fields were mostly distributed in the positive terrain areas, thus indicating that PN is a good indicator of terrace lands. The SOS figure showed that terrace areas had a large SOS value due to the terraces having two mutations, namely, that under the ridgeline and that over the ridgeline. However, not all the high values of SOS corresponded to terrace ridgelines because the shoulder line of the valley and rough gaps might also have high SOS values. Therefore, the SOS value could be used to roughly exclude some non-terraces. The values of CVE and TR were all high on the shoulder line of the valley and relatively smooth in other regions. The high values of AC and slope were distributed on the shoulder line and terrace ridge. The texture of these terrain index maps showed that the indexes facilitated the interpretation of terraces and that the texture of terraces on the AC map was much clearer than that on the other maps.
Correlation analysis was used to select a set of low-correlation terrain indexes from the six pre-selected indexes, avoiding the overlap and redundancy of information. The correlation coefficient of 0.9 was the correlation threshold. The indexes with coefficients greater than 0.9 were determined to be strong-correlation indexes. Only one index out of the strong-correlation indexes could be used. Different strong-correlation factors and all the non-strong-correlation factors constituted different index combinations. The Sheffield entropy method was adopted to calculate the entropy of the terrain index combinations and finally determine the optimal index combination. This method, which was proposed by Sheffield [30], is commonly used in feature selection optimization and can be calculated with Equation [12]. The greater value of the entropy value, the more information the terrain indexes combination has. The optimized terrain index combination selected with this method can effectively reflect terrain characteristics and be taken as the input data for image segmentation [31].
S E = n 2 + n 2 · ln ( 2 n ) + 1 2 · ln | M s |
where
SE = Sheffield entropy
n = dimension
| M s | = the determinant value of the covariance matrix

2.5. Segmentation

Segmentation is the basic step for extracting terraces in OBIA. Multi-resolution segmentation, considered as an optimization approach for high-quality image segmentation that is widely used in image classification [32,33,34,35], was applied in this analysis. Segmentation was based on a bottom-up iterative spatial aggregation of objects with low spatial entity to minimize heterogeneity and was weighted by the final segment size [35].
The input layers, namely, the selected terrain indexes, were equally weighted by 1 in the segmentation. The determination of an optimal segmentation scale for the final segment size was the key to multi-resolution segmentation [36]. The optimal scale was selected in two steps, namely, rough choice and fine choice. First, with the default shape and compactness values of 0.1 and 0.5, respectively, the segmentations for the rough choice of scale were tested by repeated experiments with different scales from 25 to 125, with the interval of 25. Second, the estimation of a scale parameter (ESP) method, as developed by Dragut et al. [37], was used to obtain an objective segmentation scale, which was just the fine choice. The ESP method is an automated approach to test different scale parameters by the rate of local variance (LV) change with fixed shape and compactness values in an image. This tool uses the LV as the value of standard deviation in a small neighborhood (3 × 3 moving window) and then computes the mean of this value over the entire image [38]. Then the rate of change was used to measure the dynamics of LV from an object level to another [32]. The segmentation scale corresponding to the peak value of the rate of LV change was considered an optimal segmentation scale. Shape and compactness values were determined by a trial-and-error procedure, and visual inspection was used to facilitate these parameter decisions, adjusting the parameters until the segmented objects fit the real target objects well [17].

2.6. Classification

2.6.1. Selection and Calculation of Classification Features

After segmentation, the determination of classification features is the next key step in the OBIA process. Topographic and geometric information from DEMs and spectral information from the image were taken into account for classifying terraces and non-terraced lands in this study. Topographic information was considered as the basis of classification because it does not contain the effect of land cover on terrain while spectral information does not.
The topographic features used in this study were selected on the basis of the analysis of terrain indexes and topographic-based texture. First, the mean and variance of the terrain indexes, the importance of which was proven in the segmentation step, were also pre-selected as topographic classification features. Second, a gray-level co-occurrence matrix (GLCM), which was presented by Haralick [39] and is commonly used in topographic research [40,41], was used for texture feature calculation. GLCM characterizes the image texture by analyzing combinations of gray-level occurrences considering the relationships of two neighboring pixels. The matrix defines the probability that gray-level i occurs at a distance d in the direction θ from gray-level j in the texture image [39]. These probabilities created the co-occurrence matrix M (i, j, d, θ), where L is the number of gray scale and the direction θ generally takes values of 0°, 45° and 90°, 135° starting from the Ox axis and computed in a counter-clockwise direction [32]. In this research, a set of GLCM variables was considered as the pre-selected classification feature indexes; the set includes (1) GLCM contrast, measuring diversity and dominance; (2) GLCM correlation; and (3) GLCM homogeneity, measuring similarity; and (4) GLCM entropy; and (5) GLCM angular second moment (ASM), assessing chaos and order lines (Table 1). These texture variables were based on a calculation over all directions. In this study, the GLCM features were calculated on topographic data rather than imagery because compared with the texture from imagery, the texture from topographic data reflects the topographic relief of the real terrace morphology without vegetation cover. Among the topographic indexes, AC with clear texture determined by visual inspection in the terrace region (see Figure 3 in Section 2.4) was used to calculate the GLCM features.
To optimize the selection of topographic classification features, the classification and regression tree (CART) algorithm [42] was used to calculate the importance of the mean and variance of the selected terrain indexes and the five GLCM features based on AC. On the basis of the segmentation result obtained through visual comparison between segmented objects and real objects, 5% of the total number of segmented terrace objects and 5% of the total number of segmented non-terrace objects were interpreted and used as training samples for the classification importance test. The features with high importance scores served as inputs in the classification step. The importance analysis was implemented with the Salford Systems® data mining and prediction analysis tool [40]. The boxplot method, which could show the distribution of feature variable values and thereby reflect the function of these features in distinguishing between terrace and non-terrace objects, was used to validate further the rationality of the topographic classification features. The boxplot of the topographic classification features was calculated on the basis of the above training samples.
In addition to topographic features, shapes, area, and brightness were also obtained from DEMs and used as auxiliary features in classification. Extracting terraces only with topographic features might cause some artificial ground objects with surface terrain features like terraces to be misinterpreted as small and narrow terraces, such as roads and buildings. Therefore, spectral features, including R-value and NIR value from images (WorldView-3), were adopted as auxiliary information to exclude the non-terrace areas more accurately.

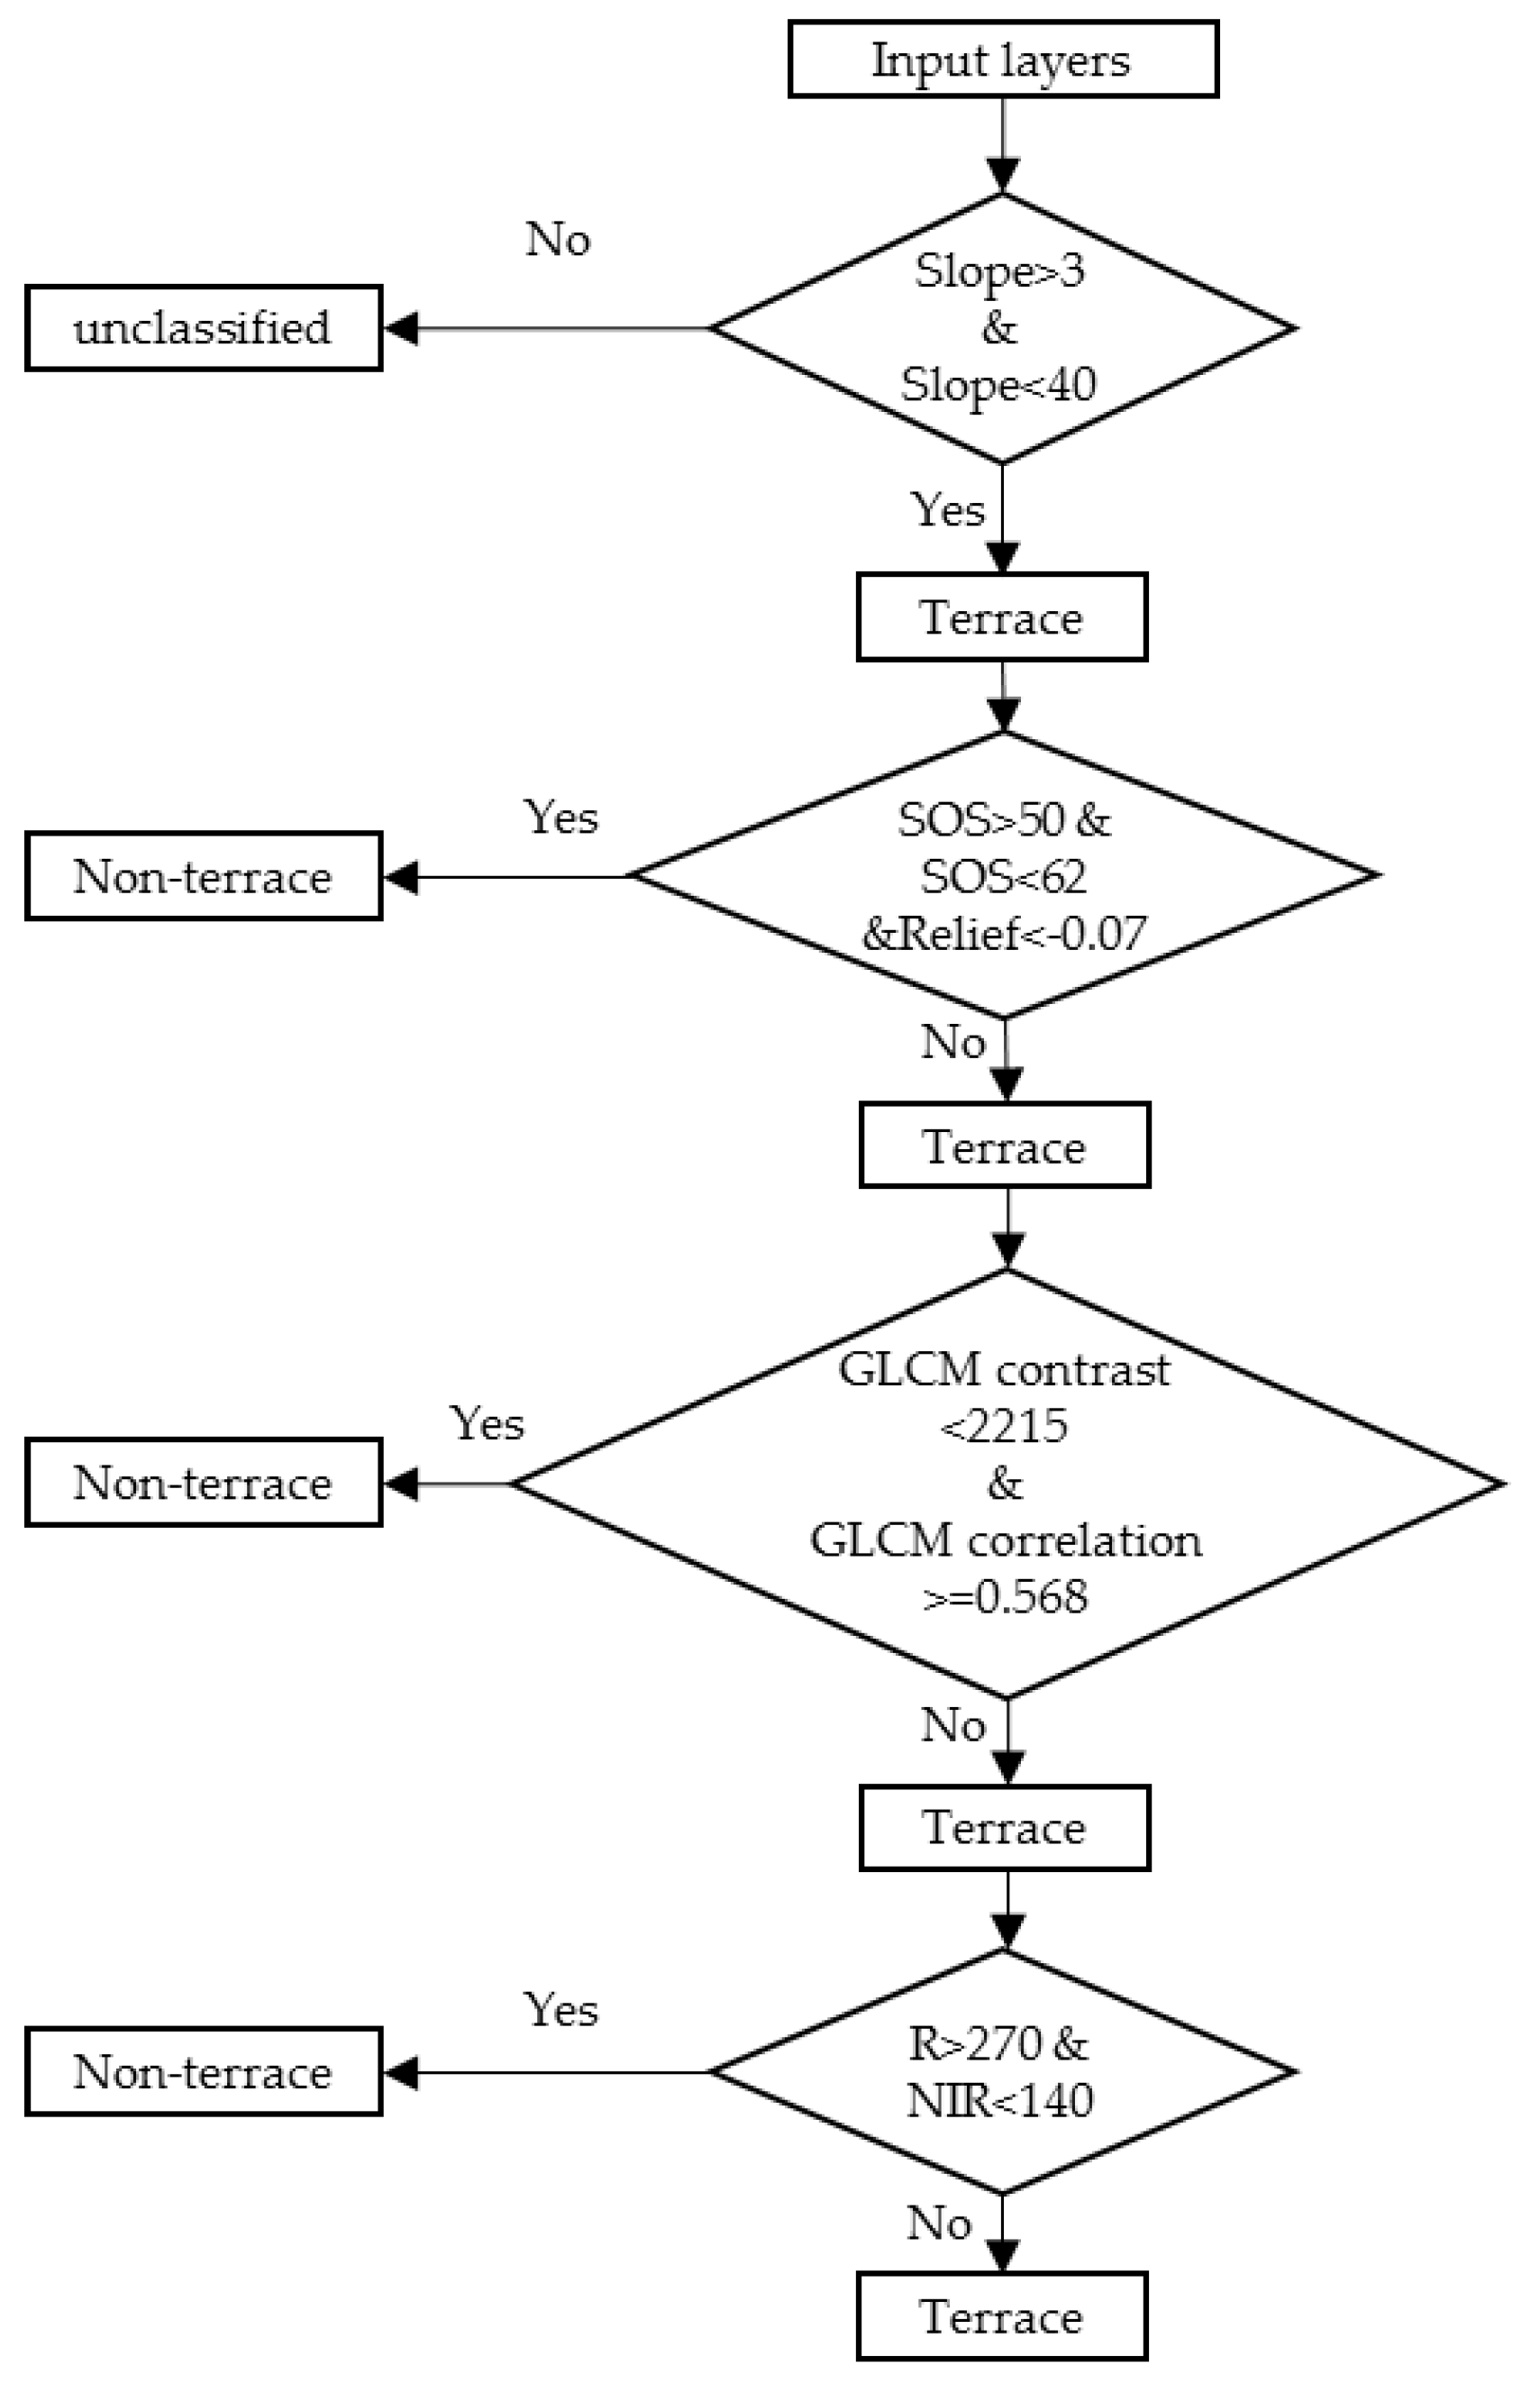
2.6.2. Classification Rules and Validation

After the selection of the optimal features for classification, the threshold value of the classification features was set. The threshold value of the topographic features based on the DEMs was set by their value distribution in the boxplot. The threshold value of the spectral features based on imagery was set by performing a trial-error test. Thereby the rule of terrace extraction was ultimately set up and run in the eCognition software.
The terrain extraction was validated by the confusion matrix [41] of the extracted terrace areas and actual terrace; this matrix stated user accuracy, producer accuracy, omission, and commission error per class. The boundary and area comparison between the classified objects and the actual objects facilitated the understanding of extraction accuracy. These statistical values of the confusion matrix were calculated by comparing the actual terrace/non-terrace areas and classified terrace/non-terrace areas. These areas were derived by spatially overlaying the extracted terrace/non-terrace boundaries and the actual terrace/non-terrace boundaries. For discussing the importance of DEM data and images in terrace extraction, two hierarchies of validation of terrain extraction were adopted: assessment of the accuracy of the extraction based on DEMs and assessment of the accuracy of the extraction based on the combination of DEMs and images.

3. Results

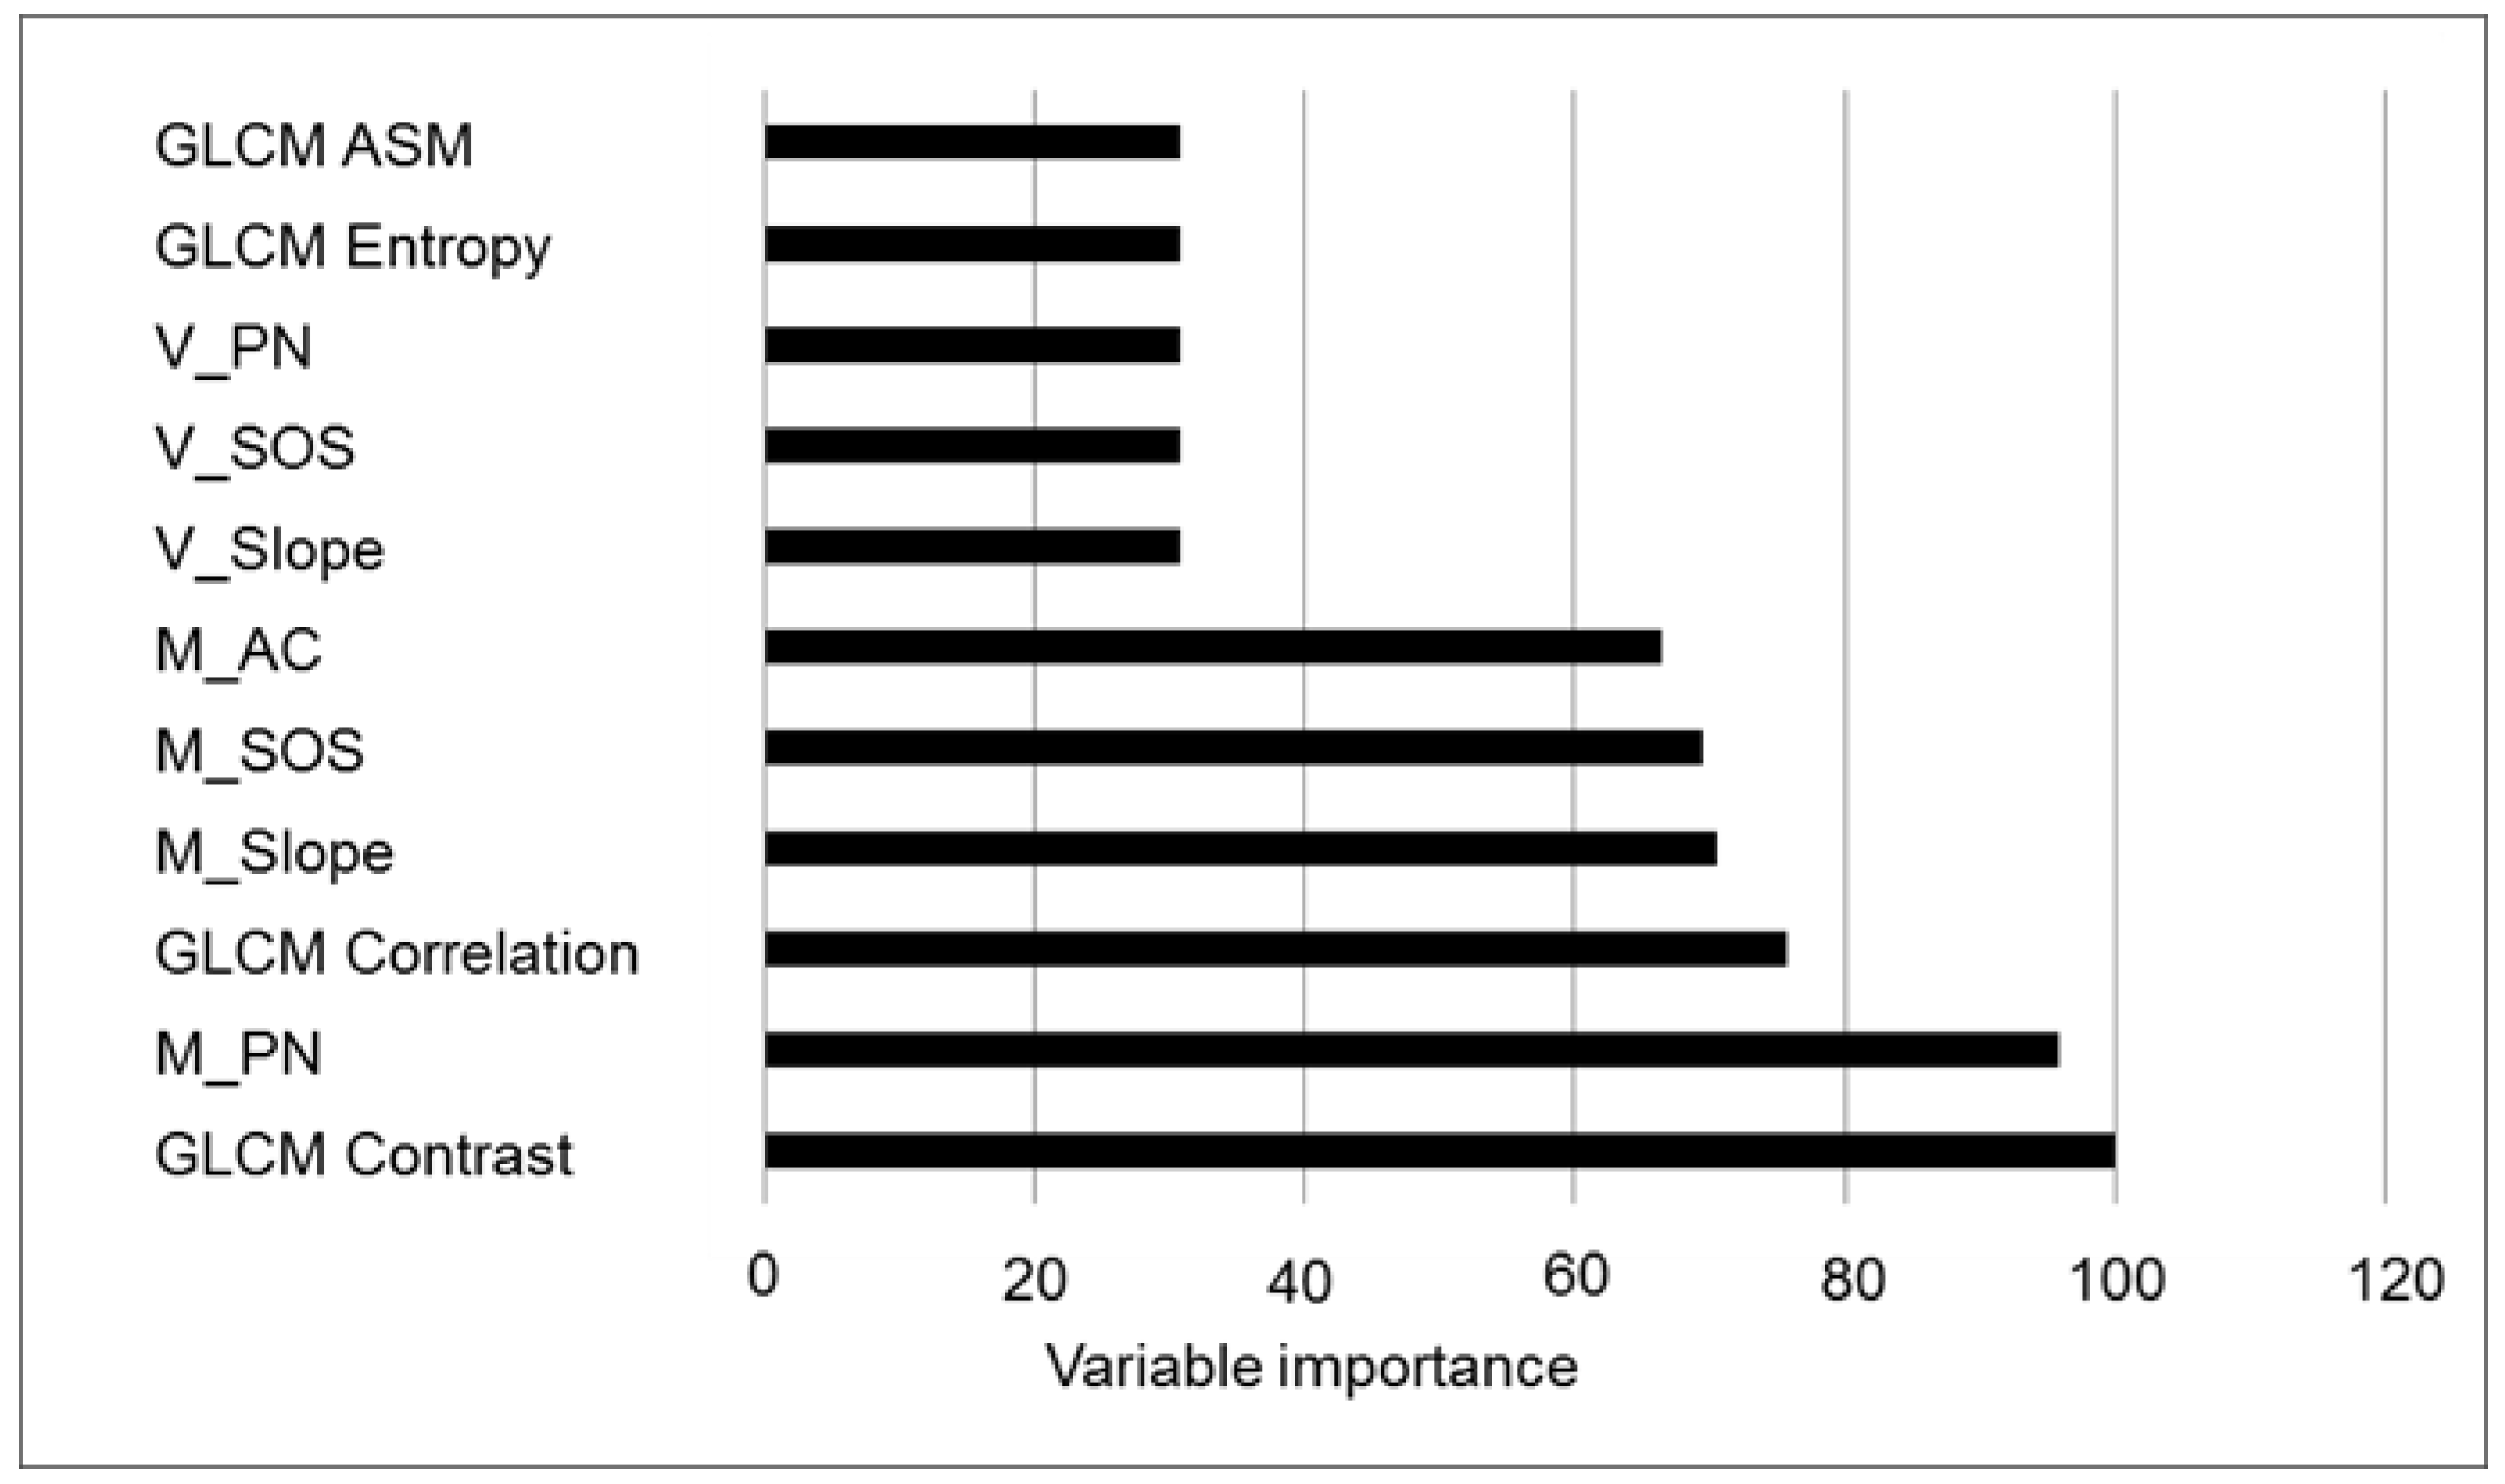
3.1. Results of Terrain Indexes Selection

The selection of terrain indexes as input layers was the basis of segmentation. Among the six terrain indexes, slope, CVE, and TR, showed strong inter-correlation (Table 2), which indicated that only one of these three indexes could be selected for combination with the indexes PN, AC, and SOS without strong inter-correlation for segmentation. Thus, three combinations were tested. The combination of PN, SOS, slope, and AC showed the highest entropy value of 13.189 (Table 3) and was selected as the input for segmentation.

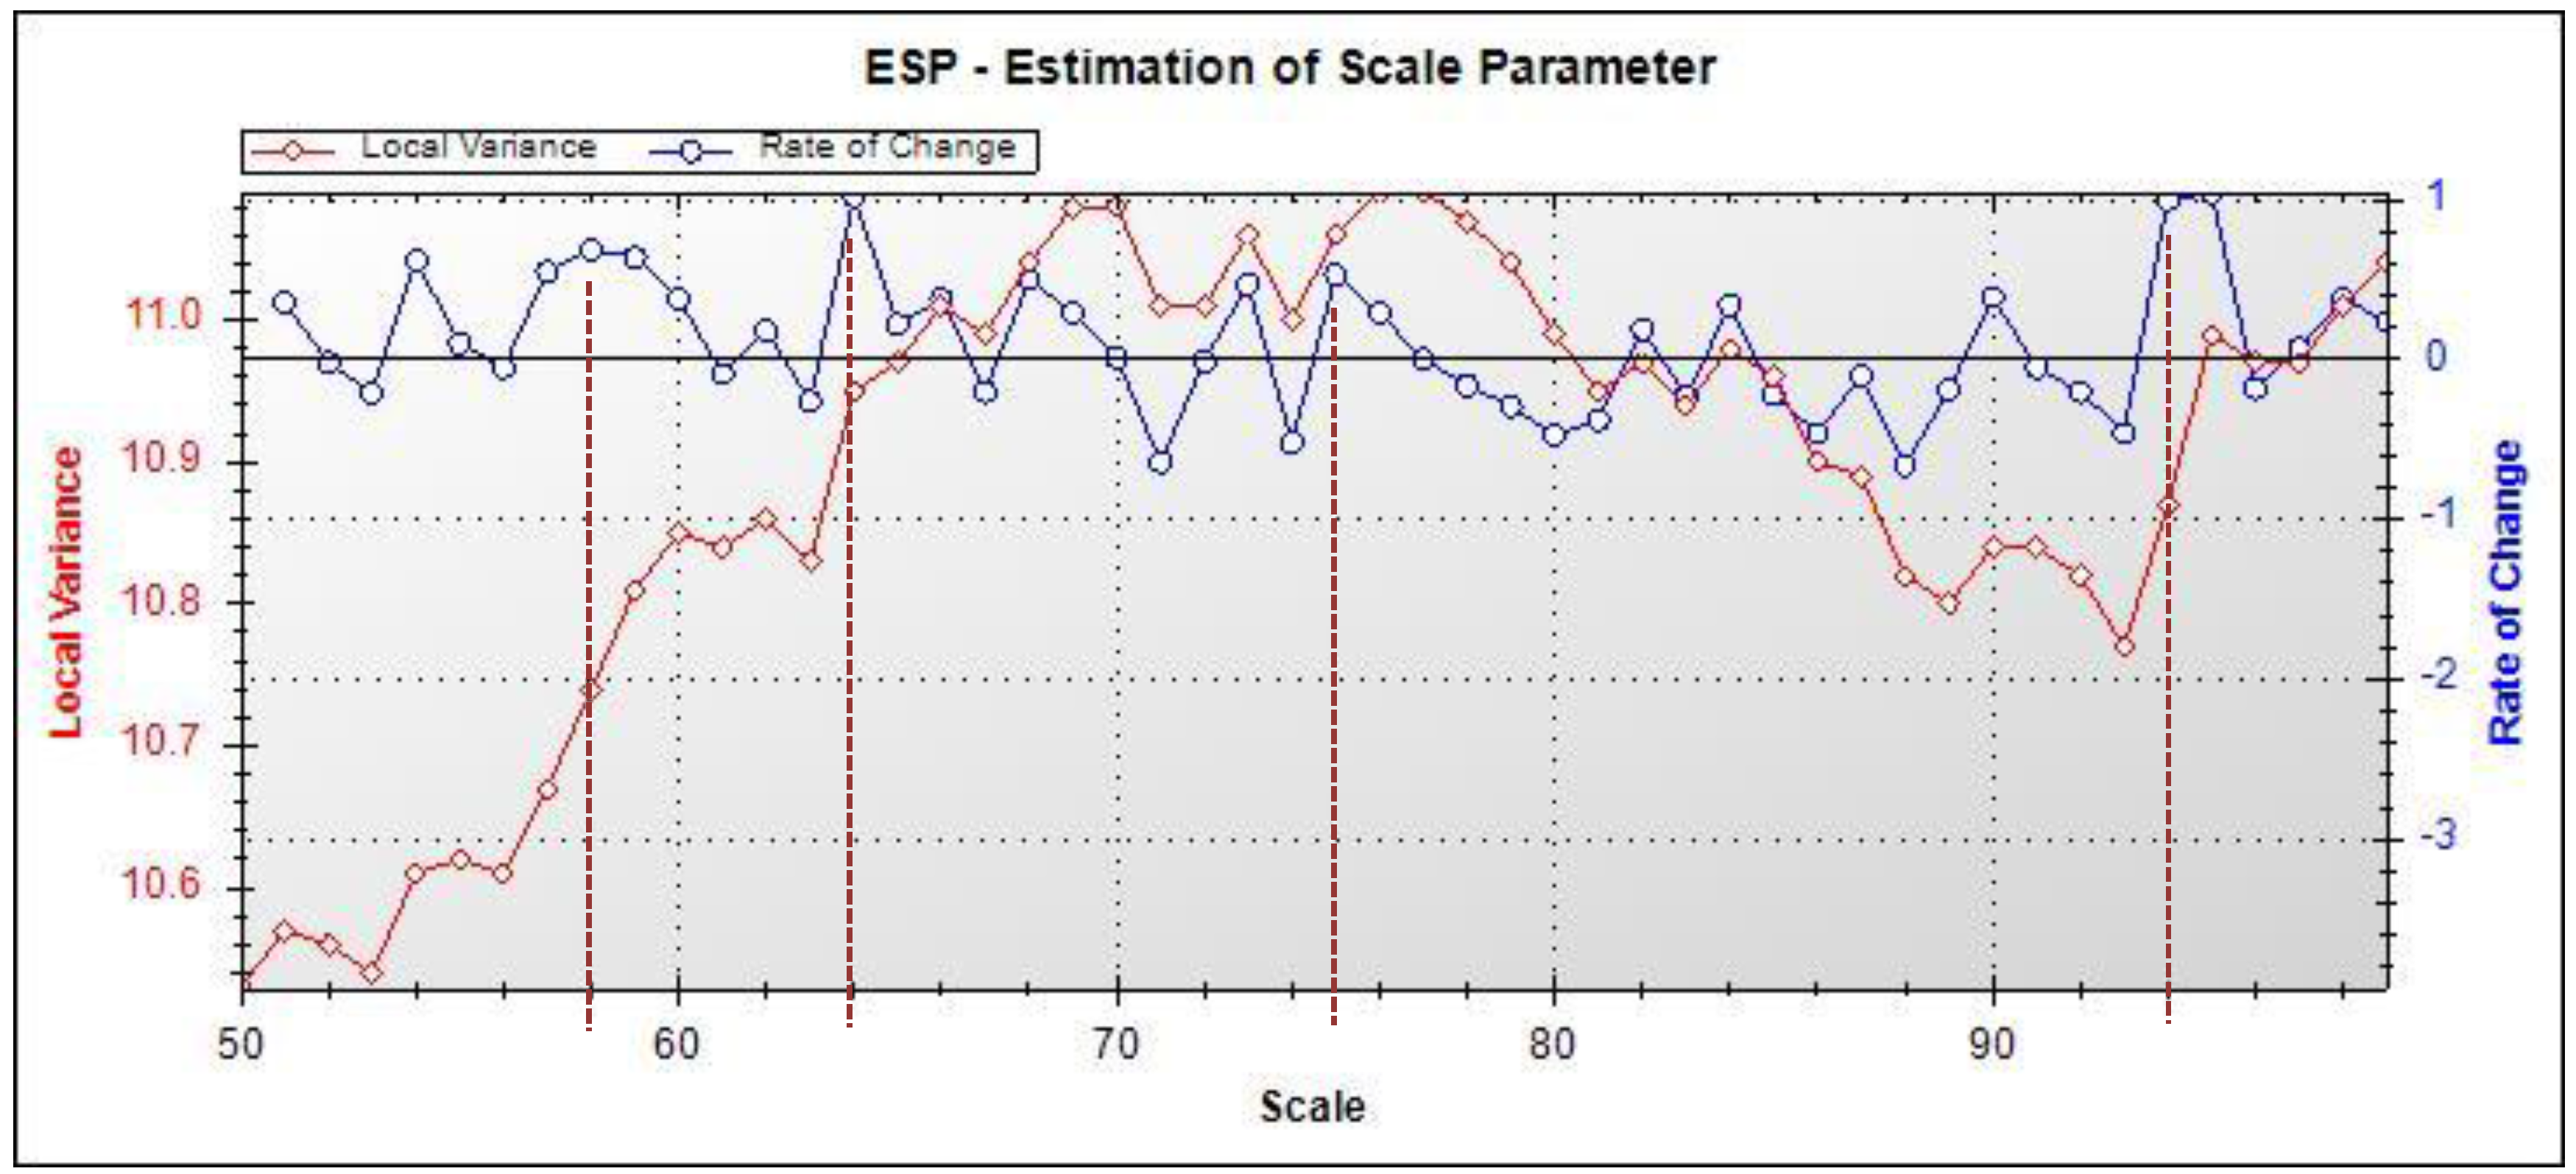
3.2. Characteristics of Produced Segmentation

The segments of the scales 50, 75, and 100 were much closer to the actual boundaries of terraces than others (Figure 4). Hence, the range scale of 50 to 100 was relatively reasonable scale. Given a fixed scale of 75, which is the median value of the segmentation scale range of 50 to 100, different shape and compactness values were tested, and the optimal shape and compactness values were determined to be 0.1 and 0.5, respectively.
On the basis of the optimal shape and compactness values and the range of reasonable segmentation scale (50 to 100), the optimal segmentation scale was estimated with the ESP tools. Figure 5 indicates that the four best scale parameters were 58, 64, 75, and 94 because their rates of change of LV were at the peak. Given the four different scales, the segmentation results (Figure 6) showed that the segments at the scale of 58 were most consistent with the true target; these segments were considered to be the optimal scale.

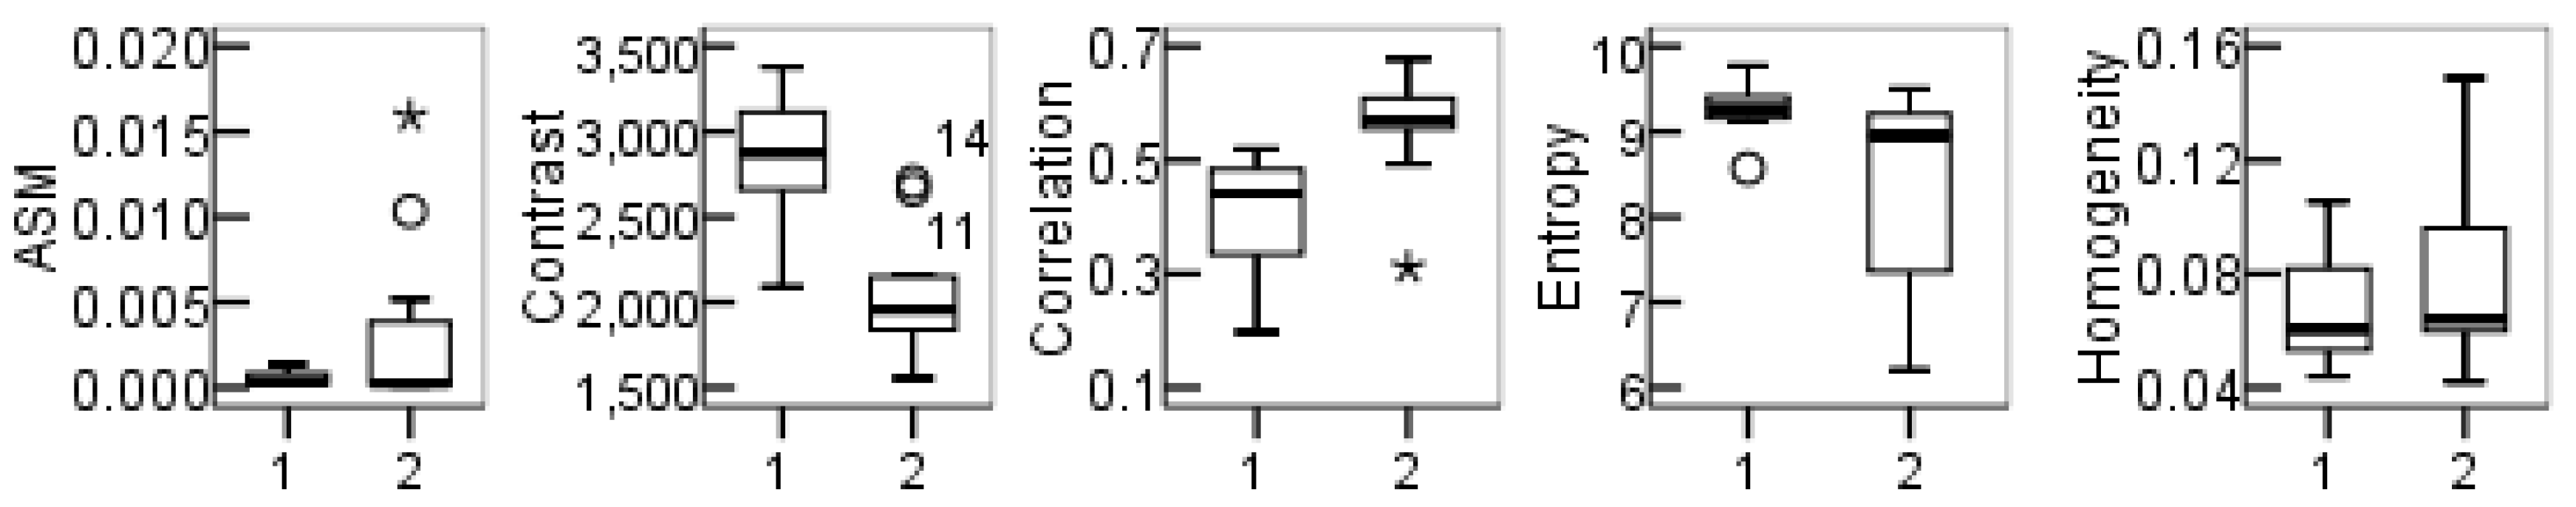
3.3. Characteristics of Topographic Classification Features

Figure 7 shows that the following indexes, including GLCM contrast, mean of PN terrains, mean of slope, GLCM correlation, and GLCM entropy, had higher importance scores than the other indexes. The above five indexes could therefore be chosen as the classification features for distinguishing terraces and non-terraces.
The boxplot of the GLCM features is shown in Figure 8. In comparison with the non-terrace objects, the terrace objects have a smaller ASM and a larger GLCM contrast. The terrace objects also showed a smaller average GLCM correlation than the non-terrace objects which is relative to terraces having high correlation in a particular direction, but low correlation in other directions. The entropy value showed that the terrace texture areas contained larger amounts of information than the non-terrace areas. However, the GLCM homogeneity values of the terraces and non-terraces showed no significant difference, thus indicating the similar texture. From the boxplot of the five GLCM features, it could be indicated that GLCM contrast and GLCM correlation had the highest differentiation on terraces and non-terraces.
Figure 9 shows the distribution of the mean and variance values of the terrain indexes. The mean curvature of the terrace area is mostly less than 0, which is obviously different from that of the non-terrace area. The mean of the SOS of the terraces mostly ranged from 65° to 80°, which is larger than that of the non-terraces. The mean slope of the terraces mostly concentrated in the 18°–30° range, whereas that of the non-terraces was scattered. The mean of PN showed that the terraces were mostly distributed in the positive terrain area. The variances of AC and PN were not significantly different, whereas the variances of SOS and slope showed a slight difference. Overall, in comparison with the variance values of terrain factors, their mean values are more conducive to distinguish between terraces and non-terraces. The result of the boxplot analysis is consistent with that of the importance analysis via CART. Thus, GLCM contrast, GLCM correlation, and the mean values of PN, slope, and SOS were ultimately chosen as classification features for terrace extraction.

3.4. Characteristics of Two Classifications

3.4.1. DEM-Based Classification

Classification features and their thresholds constitute classification rules. In this study, the threshold of the topographic classification features was set on the basis of the value of the classification features in the terrace and non-terrace areas (Figure 8 and Figure 9), trial and error as assistance. For example, the threshold of the mean slope was determined as follows. If the mean slope was greater than 36, this object was considered a non-terrace area. To avoid the misclassification, the upper threshold of the slope was set to 40, excluding the objects with average slopes greater than 40. At the same time, the objects with extremely low average slopes were not terraces but residential areas. Therefore, the low threshold of the average slope was set to 3 on the basis of repeated experiments; the objects with an average slope less than 3 were excluded. In the same way, the objects with the mean SOS of 50 to 62 were removed from the terrace category. The low threshold of GLCM correlation, the upper threshold of GLCM contrast, and the upper threshold of PN were set to be 0.568, 2215, and 0.07 to exclude non-terrace areas. Additionally, the objects with a narrow shape or small size were deleted by adjusting the shape index and area.
Through the execution of the above classification rules with consideration of topographic and geometric characteristics (Figure 10), terraces were extracted based on DEMs (Figure 11a). The confusion matrix (Table 4) showed that both the omission error (0.309) and the commission error (0.166) of terraces classification were lower than those of classifying non-terraces. It means that there is still space for improving the validation of identifying terraces. The cause of the omission and commission can be found through the spatial overlay of the extracted and actual terrace areas (Figure 11c). For instance, some areas on large terrace patches along the ditch were mistaken for terrace areas, and some small patches of non-terraces with a flat surface were mistaken for terraces. Such errors were related to the threshold of the area being too small to ensure that the very small terrace could be identified. The overall accuracy was 89.96%, and the kappa coefficient was 0.70.

3.4.2. Dem and Image-Based Classification

The spectral information based on images was combined with the classification features based on DEMs to extract terraces. A classification rule in which the objects with high R-values and low NIR values were considered non-terraces was added to remove some artificial objects with surface terrain feature like terraces. The lower threshold of R was 270, and the upper threshold of NIR was 140. The final classification result and its confusion matrix are shown in Figure 11b and Table 5, respectively. With the addition of image information, the overall accuracy increased to 94%, and the kappa coefficient was 0.80 because the buildings and roads located at the bottom of the gully were effectively removed.

4. Discussion

4.1. Rationality of the Proposed Method

The automatic classification method using high-resolution imagery and topographic data is a promising approach for general landscape classification [43,44,45], mountain hazard monitoring [46,47,48], and geomorphology mapping [49,50]; it is also advisable in agricultural terrace extraction [17]. In the Loess Plateau, terraces have diverse vegetation cover and are located in an undulating and broken landform environment. On the basis of these characteristics, high-resolution DEMs and imagery were selected for the study data with consideration of the topographic and texture characteristics as well as the spectral characteristics of coverage for terrace extraction. The method was implemented with terrain indexes, GLCM texture, and spectral response. Compared with the pertinent studies on the Loess Plateau, which relied solely on imagery [15,16] that lack terrain information, the overall classification accuracy (94%) in this work was improved from about 85%, thus indicating the ability of the method using integrated high-resolution elevation data along with satellite imagery. Moreover, two hierarchies of extractions using DEMs only and using DEMs and imagery were performed in this study; the corresponding overall accuracy results of 89.96% and 94% indicated that the topographic information from DEMs played a key role in improving the accuracy of terrace extraction.
High-resolution topographic data generated from UAVs have been widely applied in various aspects of land inventory [51], environment monitoring [52,53], and terrain construction [54,55]. Our study confirmed that the topographic data from UAVs meet the requirements of terraces extraction, which was also found in 2014’s research by R.A. Diaz-Varela in Southern Spain [17]. In the agricultural terrace extraction in Spain, DSMs containing vegetation and manmade features above the pure earth surface were applied, and a high overall accuracy of 90% was achieved. However, these vegetation and manmade features could decrease extraction accuracy. When applying DEMs processed by DSMs with vegetation removal, the real ground surface could increase the success of extraction. High-resolution DEMs could be obtained by UAVs with LiDAR [56] or just a single camera; however, LiDAR was necessary in this work because the 1 m DEM generated by camera-based adequately fit the scale of a terrace field in the Loess Plateau. Moreover, DEM generation from camera-based UAVs involves more efficient mechanisms for processing data in comparison with DEM generation from LiDAR [17]. Therefore, the acquisition and adoption of terrain data in this study is reliable and reasonable.
The choice of study area was carefully considered. Small watershed is the basic unit of the hydrology and geomorphology processes, soil and water conservation, and ecological comprehensive management in the Loess Plateau [57]. Although the study area is very small, it is an approximately complete small watershed that includes hills and gullies along the shoulder line as the boundary; such characteristic indicates the basic terrain features of the hilly and gully region of the Loess Plateau. Such a small catchment scale is conducive to creating a consistent method or a method system for terrace extraction in the whole Loess Plateau.

4.2. Application of the Proposed Method

Terrace extraction is the basis for knowing the quantity, quality, and land cover of terraces and is the basic requirement for knowing its effect on agriculture production and various earth surface processes, e.g., soil process and hydrological process. This study focused on the extraction of terraces with very complex terrain in the Loess Plateau. The proposed method not only made full use of the characteristics of the size, morphology, surface textures, and distribution of the terraces but also considered the effect of land cover on the topography; such consideration can provide support for terrace extraction in other regions.
As for the specific classification features and rules, it is difficult to directly apply them in other regions with different terrain characteristics, even in the whole Loess Plateau. It is attributed to that the landform of the Loess Plateau has spatial heterogeneity, including different landform sub-types [58]. However, this heterogeneity has certain regularity [28,59]. Therefore, the proposed method can be applied to a certain area with a same landform sub-type due to the landform self-similarity. At the same time, the automatic terraces extraction method in the whole Loess Plateau is a challenging task that requires further exploration. For different sub-types of the Loess Plateau with regular variation, we are optimistic about applying our method in automatic extraction.

5. Conclusions

The vegetation cover of terraces decreases the accuracy of image-based feature extraction, especially in the Loess Plateau where a vegetation restoration policy has been implemented. Therefore, we carried out research on automatically extracting terraces in the Loess Plateau using a combination of high-resolution DEMs and imagery based on OBIA. This study put forward a segmentation method using the terrain indexes of distinguishing terraces and non-terrace areas that were screened out by statistical analysis. The classification features and rules considering topographic, textural, geometric, and spectral characteristics were generated on the basis of a machine learning method.
The overall accuracies of the two-hierarcies classifications based on DEMs only vs. based on DEMs and imagery combined were 89.96% and 94%, respectively, indicating the importance of terrain information from DEMs in terrace extraction and the advantages of the proposed method. The extraction accuracy meets the needs of terrace monitoring in small watershed scales in the Loess Plateau. The study area location, which is in a hilly-gully loess region with the most complex terrain in the Loess Plateau and diverse vegetation cover, demonstrates the successful application of the method in identifying terraces. Given the complexity of landforms and overall heterogeneity, the extraction rules of different landform types on the Loess Plateau will need further exploration.

Acknowledgments

This work was supported by the National Natural Science Foundation of China (Nos. 41401441, 41671389, and 41271284) and the Natural Science Foundation of Jiangsu Province (No. BK20161118).

Author Contributions

Hanqing Zhao and Hu Ding designed the methodology and performed the experiments; Xuan Fang wrote the paper; and Hu Ding, Josef Strobl, Guoan Tang, Liyang Xiong and Jiaming Na supervised the study and reviewed the manuscript. All authors read and approved the manuscript.

Conflicts of Interest

The authors declare no conflict of interest.

References

  1. Ritsema, C.J. Introduction: Soil erosion and participatory land use planning on the Loess Plateau in China. Catena 2003, 54, 1–5. [Google Scholar] [CrossRef]
  2. Jiao, J.Y.; Wang, W.Z. Quality and soil water conservation effectiveness of level terrace on the Loess Plateau. Trans. Chin. Soc. Agric. Eng. 1999, 15, 59–63. [Google Scholar]
  3. Rey Benayas, J.M.; Martins, A.; Nicolau, J.M.; Schulz, J.J. Abandonment of agricultural land: An overview of drivers and consequences. CAB Rev. Perspect. Agric. Vet. Sci. Nutr. Nat. Resour. 2007, 2, 1–14. [Google Scholar] [CrossRef]
  4. Arnáez, J.; Lana-Renault, N.; Lasanta, T.; Ruiz-Flañoa, P.; Castroviejoa, J. Effects of farming terraces on hydrological and geomorphological processes. A review. Catena 2015, 128, 122–134. [Google Scholar] [CrossRef]
  5. Strehmel, A.; Jewett, A.; Schuldt, R.; Schmalz, B.; Fohrer, N. Field data-based implementation of land management and terraces on the catchment scale for an eco-hydrological modelling approach in the Three Gorges Region, China. Agric. Water Manag. 2015, 175, 43–60. [Google Scholar] [CrossRef]
  6. Shi, Z.H.; Ai, L.; Fang, N.F.; Zhu, H.D. Modeling the impacts of integrated small watershed management on soil erosion and sediment delivery: A case study in the Three Gorges Area, China. J. Hydrol. 2012, 438, 156–167. [Google Scholar] [CrossRef]
  7. Arabi, M.; Frankenberger, J.A.; Engel, B.A.; Arnold, J.G. Representation of agricultural conservation practices with SWAT. Hydrol. Process. 2008, 22, 3042–3055. [Google Scholar] [CrossRef]
  8. Shao, H.; Baffaut, C.; Gao, J.E.; Nelson, N.O.; Janssen, K.A.; Pierzynski, G.M.; Barnes, P.L. Development and application of algorithms for simulating terraces within SWAT. Trans. ASABE 2013, 56, 1715–1730. [Google Scholar]
  9. Lu, H.S.; Zhu, Y.H.; Skaggs, T.H.; Yu, Z.B. Comparison of measured and simulated water storage in dryland terraces of the Loess Plateau, China. Agric. Water Manag. 2009, 96, 299–306. [Google Scholar] [CrossRef]
  10. Liu, X.; He, B.; Yi, X.; Zhang, L.; Han, F. The soil water dynamics and hydraulic processes of crops with plastic film mulching in terraced dryland fields on the Loess Plateau. Environ. Earth Sci. 2016, 75, 1–16. [Google Scholar] [CrossRef]
  11. Xu, Y.; Yang, B.; Tang, Q.; Liu, G.; Liu, P. Analysis of comprehensive benefits of transforming slope farmland to terraces on the Loess Plateau: A case study of the Yangou Watershed in Northern Shaanxi Province, China. J. Mt. Sci. 2011, 8, 448–457. [Google Scholar] [CrossRef]
  12. Martínez-Casasnovas, J.A.; Ramos, M.C.; Cots-Folch, R. Influence of the EU CAP on terrain morphology and vineyard cultivation in the Priorat region of NE Spain. Land Use Policy 2010, 27, 11–21. [Google Scholar] [CrossRef]
  13. Dunjó, G.; Pardini, G.; Gispert, M. Land use change effects on abandoned terraced soils in a Mediterranean catchment, NE Spain. Catena 2003, 52, 23–37. [Google Scholar] [CrossRef]
  14. Agnoletti, M.; Cargnello, G.; Gardin, L.; Santoro, A.; Bazzoffi, P.; Sansone, L.; Pezza, L.; Belfiore, N. Traditional landscape and rural development: Comparative study in three terraced areas in northern, central and southern Italy to evaluate the efficacy of GAEC standard 4.4 of cross compliance. Ital. J. Agron. 2011, 6, 121–139. [Google Scholar] [CrossRef]
  15. Zhao, B.Y.; Ma, N.; Yang, J.; Li, Z.H.; Wang, Q.X. Extracting features of soil and water conservation measures from remote sensing images of different resolution levels: Accuracy analysis. Bull. Soil Water Conserv. 2012, 32, 154–157. [Google Scholar]
  16. Li, Y.; Gong, J.; Wang, D.; An, L.; Li, R. Sloping farmland identification using hierarchical classification in the Xi-He region of China. Int. J. Remote Sens. 2013, 34, 545–562. [Google Scholar] [CrossRef]
  17. Diaz-Varela, R.A.; Zarco-Tejada, P.J.; Angileri, V.; Loudjani, P. Automatic identification of agricultural terraces through object-oriented analysis of very high resolution DSMs and multispectral imagery obtained from an unmanned aerial vehicle. J. Environ. Manag. 2014, 134, 117–126. [Google Scholar] [CrossRef] [PubMed]
  18. Bailly, J.S.; Levavasseur, F. Potential of linear features detection in a Mediterranean landscape from 3D VHR optical data: Application to terrace walls. In Proceedings of the IEEE International Geoscience and Remote Sensing Symposium (IGARSS 2012), Munich, Germany, 22–27 July 2012. [Google Scholar]
  19. Duro, D.C.; Franklin, S.E.; Dubé, M.G. A comparison of pixel-based and object-based image analysis with selected machine learning algorithms for the classification of agricultural landscapes using SPOT-5 HRG imagery. Remote Sens. Environ. 2012, 118, 259–272. [Google Scholar] [CrossRef]
  20. Blaschke, T.; Strobl, J. What’s wrong with pixels? Some recent developments interfacing remote sensing and GIS. Z. Geoinformationssysteme 2001, 14, 12–17. [Google Scholar]
  21. Frohn, R.C.; Autrey, B.C.; Lane, C.R.; Reif, M. Segmentation and object-oriented classification of wetlands in a karst Florida landscape using multi-season Landsat-7 ETM+ imagery. Int. J. Remote Sens. 2007, 32, 1471–1489. [Google Scholar] [CrossRef]
  22. Hay, G.J.; Castilla, G. Object-based image analysis: Strengths, weaknesses, opportunities and threats (SWOT). In Proceedings of the 1st International Conference on Object-based Image Analysis (OBIA 2006), Salzburg, Austria, 4–5 July 2006. [Google Scholar]
  23. Chen, G.; Hay, G.J.; Castilla, G.; St-Onge, B.; Powers, R. A multiscale geographic object-based image analysis to estimate lidar-measured forest canopy height using Quickbird imagery. Int. J. Geogr. Inf. Sci. 2011, 25, 877–893. [Google Scholar] [CrossRef]
  24. Malinverni, E.S.; Tassetti, A.N.; Mancini, A.; Zingaretti, P.; Frontoni, E.; Bernardini, A. Hybrid object-based approach for land use/land cover mapping using high spatial resolution imagery. Int. J. Geogr. Sci. 2011, 25, 1025–1043. [Google Scholar] [CrossRef]
  25. Liu, K.; Ding, H.; Tang, G.; Na, J.; Huang, X.; Xue, Z.; Yang, X.; Li, F. Detection of Catchment-Scale Gully-Affected Areas Using Unmanned Aerial Vehicle (UAV) on the Chinese Loess Plateau. ISPRS Int. J. Geo-Inf. 2016, 5, 238. [Google Scholar] [CrossRef]
  26. Harwin, S.; Lucieer, A. Assessing the accuracy of georeferenced point clouds produced via multi-view stereopsis from unmanned aerial vehicle (UAV) imagery. Remote Sens. 2012, 4, 1573–1599. [Google Scholar] [CrossRef]
  27. Kux, H.J.; Souza, U.D. Object-based image analysis of WORLDVIEW-2 satellite data for the classification of mangrove areas in the city of São Luís, Maranhão State, Brazil. ISPRS Ann. Photogramm. Remote Sens. Spat. Inf. Sci. 2012, I-4, 95–100. [Google Scholar]
  28. Zhou, Y.; Tang, G.A.; Yang, X.; Xiao, C.; Zhang, Y.; Luo, M. Positive and negative terrains on northern Shaanxi Loess Plateau. J. Geogr. Sci. 2010, 20, 64–76. [Google Scholar] [CrossRef]
  29. Tang, G.A. Progress of DEM and digital terrain analysis in China. Acta Geogr. Sin. 2014, 69, 1305–1325. [Google Scholar]
  30. Sheffield, C. Selecting band combinations from multispectral data. Photogramm. Eng. Remote Sens. 1985, 51, 681–687. [Google Scholar]
  31. Chang, Z.Y.; Wang, J.; Bai, S.B.; Zhang, Z.G. Auto-classification of landform in three gorges region based on SRTM DEM. Resour. Environ. Yangtze Basin 2014, 23, 1665. [Google Scholar]
  32. Drăguţ, L.; Tiede, D.; Levick, S.R. ESP: A tool to estimate scale parameter for multiresolution image segmentation of remotely sensed data. Int. J. Geogr. Inf. Sci. 2010, 24, 859–871. [Google Scholar] [CrossRef]
  33. Singh, M.; Evans, D.; Tan, B.S.; Nin, C.S. Correction: Mapping and Characterizing Selected Canopy Tree Species at the Angkor World Heritage Site in Cambodia Using Aerial Data. PLoS ONE 2016, 11, e0154548. [Google Scholar] [CrossRef] [PubMed]
  34. Ruan, R.; Ustin, S. Mapping of freshwater lake wetlands using object-relations and rule-based inference. Chin. Geogr. Sci. 2012, 22, 462–471. [Google Scholar] [CrossRef]
  35. Baatz, M.; Schäpe, A. Multiresolution segmentation: An optimization approach for high quality multi-scale image segmentation. Angew. Geogr. informationsverarbeitung XII 2000, 58, 12–23. [Google Scholar]
  36. Burnett, C.; Blaschke, T. A multi-scale segmentation/object relationship modelling methodology for landscape analysis. Ecol. Model. 2003, 168, 233–249. [Google Scholar] [CrossRef]
  37. Drăguţ, L.; Csillik, A.; Eisank, C.; Tiede, D. Automated parameterisation for multi-scale image segmentation on multiple layers. ISPRS J. Photogramm. Remote Sens. 2014, 88, 119–127. [Google Scholar] [CrossRef] [PubMed]
  38. Drăguţ, L.; Eisank, C.; Strasser, T. Local variance for multi-scale analysis in geomorphometry. Geomorphology 2011, 130, 162. [Google Scholar] [CrossRef] [PubMed]
  39. Haralick, R.M.; Shanmugam, K.; Dinstein, I. Textual Features for Image Classification. JEEE Trans. Syst. Man Cybern. SMC 1973, 3, 610–617. [Google Scholar] [CrossRef]
  40. Steinberg, D.; Cardell, N.S. The hybrid CART-Logit model in classification and data mining. Presented at the Joint Statistical Meeting of the American Statistical Association, Dallas, TX, USA, August 1998. [Google Scholar]
  41. Morsy, S.; Shaker, A.; El-Rabbany, A.; LaRocque, P.E. Airborne multispectral lidar data for land-cover classification and land/water mapping using different spectral indexes. ISPRS Ann. Photogramm. Remote Sens. Spat. Inf. Sci. 2016, 3, 217–224. [Google Scholar] [CrossRef]
  42. Loh, W.Y. Classification and regression trees. WIREs Data Min. Knowl. Discov. 2011, 1, 14–23. [Google Scholar]
  43. Myint, S.W.; Gober, P.; Brazel, A.; Grossman-Clarke, S.; Weng, Q. Per-pixel vs. object-based classification of urban land cover extraction using high spatial resolution imagery. Remote Sens. Environ. 2011, 115, 1145–1161. [Google Scholar] [CrossRef]
  44. Yu, B.; Shu, S.; Liu, H.; Song, W.; Wu, J.; Wang, L.; Chen, Z. Object-based spatial cluster analysis of urban landscape pattern using nighttime light satellite images: A case study of China. Int. J. Geogr. Inf. Sci. 2014, 28, 2328–2355. [Google Scholar] [CrossRef]
  45. Bohlin, J.; Wallerman, J.; Fransson, J.E. Forest variable estimation using photogrammetric matching of digital aerial images in combination with a high-resolution DEM. Scand. J. For. Res. 2012, 27, 692–699. [Google Scholar] [CrossRef]
  46. Vassilopoulou, S.; Hurni, L.; Dietrich, V.; Baltsavias, E.; Pateraki, M.; Lagios, E.; Parcharidis, I. Orthophoto generation using IKONOS imagery and high-resolution DEM: A case study on volcanic hazard monitoring of Nisyros Island (Greece). ISPRS J. Photogramm. Remote Sens. 2002, 57, 24–38. [Google Scholar] [CrossRef]
  47. Lucieer, A.; de Jong, S.; Turner, D. Mapping landslide displacements using Structure from Motion (SfM) and image correlation of multi-temporal UAV photography. Prog. Phys. Geogr. 2014, 38, 97–116. [Google Scholar]
  48. Lin, C.W.; Tseng, C.M.; Tseng, Y.H.; Fei, L.Y.; Hsieh, Y.C.; Tarolli, P. Recognition of large scale deep-seated landslides in forest areas of Taiwan using high resolution topography. J. Asian Earth Sci. 2013, 62, 389–400. [Google Scholar] [CrossRef]
  49. El Bastawesy, M.; Cherif, O.H.; Sultan, M. The geomorphological evidences of subsidence in the Nile Delta: Analysis of high resolution topographic DEM and multi-temporal satellite images. J. Afr. Earth Sci. 2016. [Google Scholar] [CrossRef]
  50. Anders, N.S.; Seijmonsbergen, A.C.; Bouten, W. Segmentation optimization and stratified object-based analysis for semi-automated geomorphological mapping. Remote Sens. Environ. 2011, 115, 2976–2985. [Google Scholar] [CrossRef]
  51. Amorós López, J.; Izquierdo Verdiguier, E.; Gómez Chova, L.; Muñoz Marí, J.; Rodríguez Barreiro, J.Z.; Camps Valls, G.; Calpe Maravilla, J. Land cover classification of VHR airborne images for citrus grove identification. ISPRS J. Photogr. Remote Sens. 2011, 66, 115–123. [Google Scholar] [CrossRef]
  52. Fornace, K.M.; Drakeley, C.J.; William, T.; Espino, F.; Cox, J. Mapping infectious disease landscapes: Unmanned aerial vehicles and epidemiology. Trends Parasitol. 2014, 30, 514–519. [Google Scholar] [CrossRef] [PubMed]
  53. D’Oleire-Oltmanns, S.; Marzolff, I.; Peter, K.D.; Ries, J.B. Unmanned Aerial Vehicle (UAV) for monitoring soil erosion in Morocco. Remote Sens. 2012, 4, 3390–3416. [Google Scholar] [CrossRef]
  54. Mancini, F.; Dubbini, M.; Gattelli, M.; Stecchi, F.; Fabbri, S.; Gabbianelli, G. Using unmanned aerial vehicles (UAV) for high-resolution reconstruction of topography: The structure from motion approach on coastal environments. Remote Sens. 2013, 5, 6880–6898. [Google Scholar] [CrossRef]
  55. Lucieer, A.; Turner, D.; King, D.H.; Robinson, S.A. Using an Unmanned Aerial Vehicle (UAV) to capture micro-topography of Antarctic moss beds. Int. J. Appl. Earth Obs. Geoinformation 2014, 27, 53–62. [Google Scholar] [CrossRef]
  56. Artuso, R.; Bovet, S.; Streilein, A. Practical methods for the verification of countrywide terrain and surface models. Int. Arch. Photogramm. Remote Sens. Spat. Inf. Sci. 2003, 34, 6. [Google Scholar]
  57. Liu, G.B.; Yang, Q.K.; Zheng, F.L. Chinese small watershed in the Loess Plateau governance and ecological construction. Sci. Soil Water Conserv. 2004, 2, 11–15. (In Chinese) [Google Scholar]
  58. Chen, H.X.; Cheng, W.M.; Qiao, Y.L. Classification System of 1:1 000 000 Digital Loess Geomorphology in China. Geo-Inf. Sci. 2006, 8, 6–13. [Google Scholar]
  59. Tang, G.; Li, F.; Liu, X.; Long, Y.; Yang, X. Research on the slope spectrum of the Loess Plateau. Sci. China Ser. E Technol. Sci. 2008, 51, 175–185. [Google Scholar] [CrossRef]
Figure 1. Location of the study area: (a) location of the Loess Plateau in China; (b) location of the study area and cities in the Loess Plateau; (c) digital terrain map of the study area and the location of the sample plot for displaying the result of the terrain index analysis and segmentation; (d) terrace distribution (red region) in the sample plot.
Ijgi 06 00157 g001
Figure 2. Flowchart of the proposed extraction method.
Ijgi 06 00157 g002
Figure 3. Calculation results of the terrain indexes. PN—positive and negative terrain index; AC—accumulative curvature; CVE—the coefficient of variation in elevation; SOS—slope of slope; TR—terrain roughness. White—for high values; black—for low values.
Ijgi 06 00157 g003
Figure 4. Segmentation results with the scale parameters of 25 to 150 and the shape and compactness values of 0.1 and 0.5, respectively. The three values under each figure represent the scale, shape, and compactness. The terrace areas are highlighted by red lines.
Ijgi 06 00157 g004aIjgi 06 00157 g004b
Figure 5. Estimation of scale parameter (ESP) output graphs showing local variance against rate of change. The orange vertical lines indicate suggested scale.
Ijgi 06 00157 g005
Figure 6. Segmentation results with the four scales (58, 64, 75, and 94) generated from the ESP and the shape and compactness values of 0.1 and 0.5, respectively. The three values under each figure represent the scale, shape, and compactness. The terrace areas are highlighted by red lines.
Ijgi 06 00157 g006
Figure 7. Importance of topographic classification features obtained by classification and regression tree algorithm. GLCM ASM—gray-level co-occurrence matrix angular second moment; V_PN—variance of positive and negative terrain indexes; V_SOS—variance of slope of slope; V_Slope—variance of slope; M_AC—mean of accumulative curvature; M_SOS—mean of slope of slope; M_Slope—mean of slope; M_PN—mean of positive and negative terrain indexes.
Ijgi 06 00157 g007
Figure 8. Boxplot of GLCM features, including GLCM ASM, GLCM contrast, GLCM contrast, GLCM correlation, GLCM entropy, and GLCM homogeneity. “1”—terraces; “2”—non-terraces.
Ijgi 06 00157 g008
Figure 9. Boxplot of the mean and variance values of the terrain indexes. M_AC—mean of accumulative curvature; M_SOS—mean of slope of slope; M_Slope—mean of slope; M_PN—mean of positive and negative terrain indexes; V_AC—variance of accumulative curvature; V_SOS—variance of slope of slope; V_Slope—variance of slope; V_PN—variance of positive and negative terrain index. “1”—terraces; “2”—non-terraces.
Ijgi 06 00157 g009
Figure 10. Flow chart of classification based on DEMs and imagery.
Ijgi 06 00157 g010
Figure 11. Terrace distribution in the study area. (a) Terrace distribution via extraction based on DEMs; (b) terrace distribution by the extraction based on DEMs and image; (c) actual terrace distribution.
Ijgi 06 00157 g011
Table 1. Variables of GLCM [39].
FeatureEquationExplanation
Angular Second Moment (ASM) i = 0 L 1 j = 0 L 1 P ( i , j ) 2 Angular second moment (ASM) is a measure of the homogeneity of an image. High values of ASM or energy occur when the window is highly orderly.
Contrast n = 0 L 1 n 2 { i = 0 L 1 j = 0 L 1 P ( i , j ) } This measure of contrast or local intensity variation favors contributions from P(i, j) away from the diagonal, i.e., i! = j.
Homogeneity i = 0 L 1 j = 0 L 1 P ( i , j ) 1 + ( i j ) 2 Homogeneity measures the closeness of the distribution of elements in the GLCM to the GLCM diagonal.
Entropy i = 0 L 1 j = 0 L 1 P ( i , j ) log P ( i , j ) Inhomogeneous scenes exhibit low first-order entropy, whereas homogeneous scenes exhibit high entropy.
Correlation i = 0 L 1 j = 0 L 1 i j P ( i , j ) u 1 u 2 σ 1 σ 2 2 Correlation is a measure of gray-level linear dependence between pixels at specified positions relative to each other.
Table 2. Correlation coefficient matrix of terrain indexes.
ACSlopeCVESOSTRPN
AC1
Slope−0.0031
CVE0.0040.9131
SOS−0.0110.2120.2471
TR−0.0010.9310.9360.2311
PN−0.387−0.010−0.0090.002−0.0291
PN—positive and negative terrain index; AC—accumulative curvature; CVE—coefficient of variation in elevation; SOS—slope of slope; TR—terrain roughness.
Table 3. Entropy values of terrain index combinations.
Combination of IndexesPN, SOS, CVE, ACPN, SOS, Slope, ACPN, SOS, TR, AC
Entropy3.27813.18910.680
PN—positive and negative terrain index; AC—accumulative curvature; CVE—coefficient of variation in elevation; SOS—slope of slope; TR—terrain roughness.
Table 4. Confusion matrix and accuracy statistics of terrace extraction based on DEMs.
ClassificationReferenceClass. TotalsProd. Ac.User. Ac.Omi. Er.Com. Er.
TerracesNon-Terraces
Terraces2605751163433769180.8350.6910.3090.166
Non-terraces51719124578912975080.9150.9600.0400.085
Ref. Totals31229313621351674428
Reference—ground truth frequencies (in columns). Classification—per-class classification frequencies (in rows); Class. Totals—per-class classification totals; Ref. totals—per-class reference totals; Prod. Ac.—Producer accuracy; User. Ac.—User accuracy; Omi. Er.—Omission error; Com. Er.—Commission error.
Table 5. Confusion matrix and accuracy statistics of the method based on DEMs and images.
ClassificationReferenceClass. TotalsProd. Ac.User. AcOmi. Er.Com. Er.
TerracesNon-Terraces
Terraces257549461983037470.8250.8480.1520.175
Non-terraces54742131603913707810.9660.9600.0400.034
Ref. Totals31229313621351674428
Reference—ground truth frequencies (in columns). Classification—per-class classification frequencies (in rows); Class. Totals—per-class classification totals; Ref. totals—per-class reference totals; Prod. Ac. —Producer accuracy; User Ac.—User. accuracy; Omi. Er.—Omission error; Com. Er.—Commission error.

