Project Report

A High Performance, Spatiotemporal Statistical Analysis System Based on a Spatiotemporal Cloud Platform

1
Yunnan Provincial Geomatics Centre, Kunming 650034, Yunnan, China
2
Department of Geoinformation Science, Kunming University of Science and Technology, Kunming 650504, Yunnan, China
3
Department of Geography, Eastern China Normal University, Shanghai 200062, China
4
School of Remote Sensing Information and Engineering, Wuhan University, Wuhan 430071, Hubei, China
5
Beijing Yunhe Spatiotemporal Tehnology Co. Ltd, Beijing 100080, China
*
Authors to whom correspondence should be addressed.
ISPRS Int. J. Geo-Inf. 2017, 6(6), 165; https://0-doi-org.brum.beds.ac.uk/10.3390/ijgi6060165
Submission received: 9 February 2017 / Revised: 17 May 2017 / Accepted: 24 May 2017 / Published: 6 June 2017

Abstract

:
With the increase in size and complexity of spatiotemporal data, traditional methods for performing statistical analysis are insufficient for meeting real-time requirements for mining information from Big Data, due to both data- and computing-intensive factors. To solve the Big Data challenges in geostatistics and to support decision-making, a high performance, spatiotemporal statistical analysis system (Geostatistics-Hadoop) is proposed in this paper. The proposed system has several features: (1) Hadoop is enhanced to handle spatial data in a native format and execute a number of parallelized spatial analysis algorithms to solve practical geospatial analysis problems; (2) the Oozie-based workflow system is utilized to ease the operation and sharing of spatial analysis services; and (3) a private cloud platform based on Eucalyptus is leveraged to provide on-the-fly and elastic computing resources. Experimental results show that Geostatistics-Hadoop efficiently conducts rapid information mining and analysis of big spatiotemporal data sets, with the support of elastic computing resources from a cloud platform. The adoption of cloud computing and the Hadoop cluster to parallelize statistical calculations significantly improves the performance of Big Data analyses.

1. Introduction

Observation of geographical conditions and the detection of changes are critical for monitoring the physical and social environment. In recent years, many countries and organizations have conducted observations of geographical conditions to better understand and manage energy, the environment, and other resources. In 2000, the U.S. National Science Foundation (NSF) established the National Ecological Observation Network (NEON), a continental-scale observational system, to detect ecological change over time and support decision-making in a dynamic global environment by integrating observations, experiments and forecasts [1,2]. In 2002, the Geographic Analysis and Monitoring (GAM) Program of the U.S. Geological Survey assessed the nation’s land surface at multiple spatiotemporal scales to understand rates, causes and consequences of natural- and human-induced changes affecting the environment over time [3]. This program plays an important role in providing fundamental data to support decision-making for environmental protection, disaster prevention, responses to climate change and sustainable economic development.
The database, constructed as an outcome of the First National Geographic Condition Data Acquisition of China (http://chzt13.sbsm.gov.cn/article/zxgz/dycdlsqpc/), has stored large volumes of topographical data, remote sensing images, surface coverage data and different types of thematic data at different spatiotemporal scales. Meanwhile, spatiotemporal statistical analyses of the datasets need to be conducted to monitor the national geographical condition in order to transform this “Big Data” into “big value” [4,5]. At the provincial or countrywide scale, the spatiotemporal statistical processing is data- and computing- intensive. It usually requires real-time processing of a continuous stream of incoming geospatial data. Emerging spatiotemporal cloud computing platforms and the MapReduce computing framework offer an opportunity for scalable computing resources and parallelized solutions to address the data- and computing-intensive issues in big geospatial data analytics. Using high performance cloud-based analytical systems, statistical results (e.g., number of residents and facilities, length of roads, and area of land-use) can be quickly obtained for a specific region to provide information for government decision-making, including land-use planning, ecological and environmental coordination and regional economic development.
This research utilizes cloud computing to develop a high performance, spatiotemporal statistical analysis system (Geostatistics-Hadoop) to support analyses of the First National Geographic Condition Data Acquisition database of China. Section 2 reviews spatiotemporal statistical analysis, cloud computing, big data, MapReduce and the Hadoop Distributed File System. Section 3 introduces the architecture of the proposed Geostatistics-Hadoop system, the parallel statistical algorithms implemented using MapReduce and the dynamic cloud computing platform. These algorithms include measuring size, shape, and distribution of geospatial objects), and are experimented with different geospatial features and statistical units, which demonstrates the value of the cloud platform and the possibility of implementing more advanced functions. Section 4 evaluates the performance of the Geostatistics-Hadoop system. Finally, Section 5 discusses conclusions and provides suggestions for future research.

2. Related Work

Traditionally, spatial statistics [6,7] has focused on the spatial interactions and variations of phenomena with geospatial features. It combines statistics with modern graphical technology to reveal patterns over multiple spatial scales (e.g., spatial distributions, spatial patterns, and interactions). Spatiotemporal statistics expands on spatial statistics by adding the dimension of time. It is based on the regionalized variable theory in the time domain and uses variation functions as a tool to study natural phenomenon with randomness and structure in their time series [8,9]. Initially, it was applied to atmospheric processes, including spatiotemporal patterns of precipitation, atmospheric pollutants and meteorology. Currently, it has been expanded to other fields, including geography and the geosciences. Major spatiotemporal statistical methods include empirical orthogonal functions [10], Markov chain [11], Markov–Bayes [12] and space–time Kriging methods [13]. These methods are widely used for monitoring national geographic conditions, simulating changes in land use over the past decades and forecasting future trends in land use [14]. With the increase in size and complexity of spatiotemporal data, traditional statistical analyses are not able to meet real-time requirements.
Data on national geographic conditions qualifies as Big Data with characteristics of large volume, data variety (e.g., vector, image, documents, and social media), natural veracity, and capture at different rates. To obtain valuable information from Big Data, the following challenges should be addressed [5,15]: (1) Big Data storage and a management strategy for handling large volumes of geographic data hosted in a novel storage architecture; (2) fast and efficient analytical approaches to data processing; and (3) presentation of information to support decisions, including effective Big Data visualization to understand geographic phenomena by converting data and information into graphical displays.
Fortunately, cloud computing provides scalable computing resources to enable Big Data analyses for scientific research and decision-support [16]. Cloud services are categorized as Infrastructure as a Service (IaaS); Platform as a Service (PaaS); Software as a Service (SaaS); Data as a Service (DaaS). The first three are defined by National Institute of Standards & Technology (NIST) [17], and DaaS is essential for geospatial sciences. In addition to public domain cloud services, many open source solutions build private clouds to meet specific demands. These include Eucalyptus, CloudStack, OpenStack and Open Nebula [18]. Geospatial science has utilized cloud computing (e.g., EC2, Eucalyptus, OpenStack) to address many problems, including data, computing, concurrent, and spatiotemporal intensity [5,19,20]. To address issues of data intensity, the authors of [21] developed a DaaS, a distributed inventory and portal system based on spatial cloud computing for the discovery, access and utilization of geospatial data. To address issues of computing intensity, the authors of [4] utilized spatiotemporal principles to optimize computing resources for data mining, parameter extraction and phenomena simulations.
Apache Hadoop, as an open source framework for distributed storage and processing of very large datasets, has been proven to be an efficient framework for Big Data analysis in many applications, such as graph analysis and machine learning [22,23]. Researchers in the geospatial domain are attracted to working with massive geospatial data with Hadoop. For example, Hadoop-GIS extended Hive to a scalable high-performance spatial data warehousing system to run large-scale spatial queries on Hadoop. It utilized global partitioning, indexing and customization for on-demand local spatial indexing to achieve efficient and accelerated spatial query processing [24]. MD-HBase extended HBase and leveraged a multi-dimensional indexing structure layered over a key–value store, to allow for efficient multi-dimensional query processing. However, these systems treat these spatial data as non-spatial data because they rely on Hadoop as a black box, which itself has insufficient support for spatial data. To enable Hadoop to directly process spatial data, Environmental Systems Research Institute (ESRI) developed a geometry Application Programming Interface (API) for Java to allow users to build geometrical functions for Hadoop-related systems, such as HBase, Storm, Hive and Cassandra; however, it lacked the capability of indexing geometrical objects. To overcome these limitations, SpatialHadoop comprehensively extended Hadoop to inject spatial data awareness into each Hadoop layer including the language, storage, MapReduce and operational layers. It implemented a set of spatial indexing structures (e.g., Grid, R-tree, and R+-tree) to form a two-level spatial indexing mechanism to accelerate spatial queries. It also allowed users to interact with Hadoop directly to develop a variety of spatial functions [22]. However, SpatialHadoop placed more focus on improving the performance of geospatial querying and not on spatial data analysis, such as with the procedures of clip and union. Users can only input commands to run the services provided by SpatialHadoop, which impacts its usability.
The above studies provide inspiration and tools to leverage Hadoop MapReduce and Hadoop Distribute File System (HDFS) to process geospatial data. However, more work is still needed to improve and integrate these technologies so that they work better on the practical big geospatial data statistic problems. To address the challenges of complex spatiotemporal analyses, GeoStatistics-Hadoop is proposed with the following capabilities: (1) Hadoop is enhanced to treat spatial data in a native format and developed to execute a number of parallelized spatial analysis algorithms to solve the practical geospatial analysis problems; (2) an Oozie-based workflow system is utilized to ease the operation and sharing of spatial analysis services; and (3) the private cloud platform based on Eucalyptus is leveraged to provide on-the-fly and elastic computing resources for the Hadoop cluster and to support high performance spatiotemporal statistical analysis.

3. Methodology

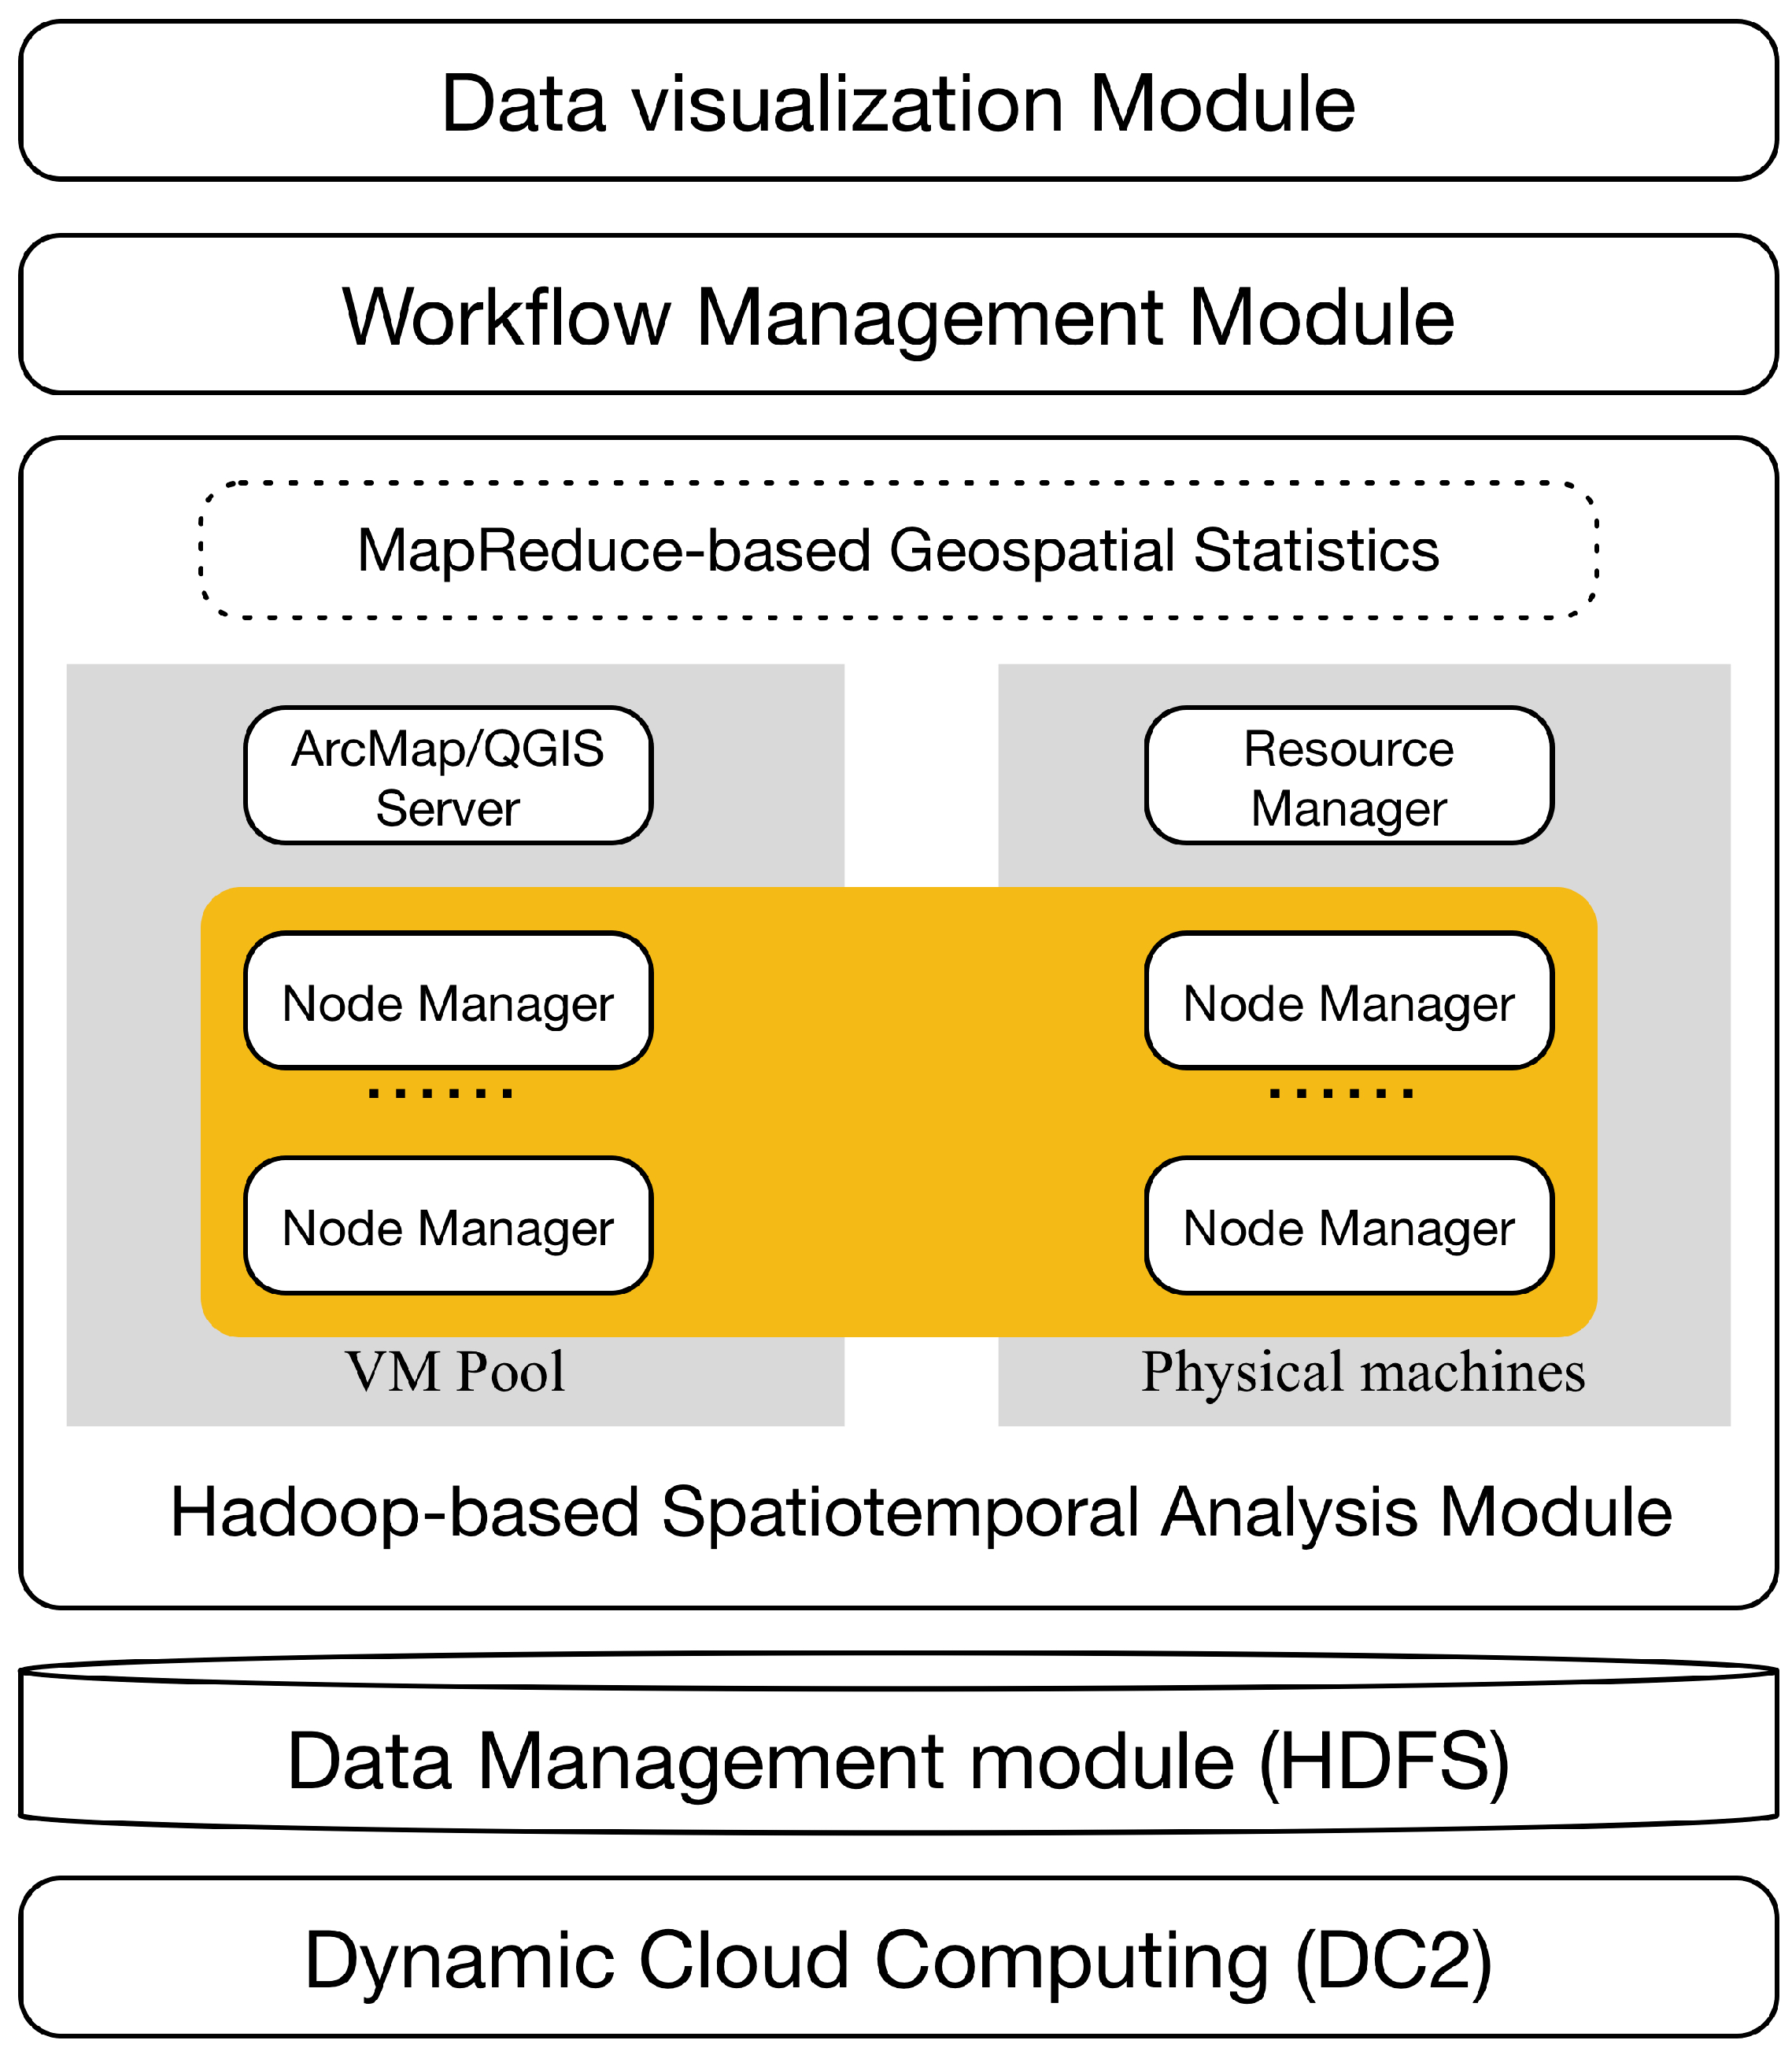
3.1. The Architecture of GeoStatistics-Hadoop

The proposed cloud-based Geostatistics-Hadoop system solves the computing and data-intensive issues faced in analyzing China’s national geographic condition database. The system includes four modules (Figure 1): The dynamic cloud computing system (DC2); the distributed data manager; the Hadoop-based spatiotemporal analysis module; the module for workflow management and data visualization. Each of these modules is outlined below (Figure 1):
  • The dynamic cloud computing system (DC2) is a private cloud environment built using Eucalyptus, which is a free and open-source computer software used for deploying Amazon Web Services (AWS)-compatible private and hybrid cloud computing systems. With an elastic utility computing architecture, DC2 can dynamically scale computing, storage, and network resources as the spatiotemporal statistical analytics workloads change. It provides a cost-efficient and fast way for the proposed Geostatistics-Hadoop system to better utilize computing and storage resources. The Hadoop cluster, including MapReduce, Apache Oozie, and the QGIS/Arcmap server can be deployed on the virtual resources supplied by DC2, which provides on-demand computing and storage resources for geospatial data processing.
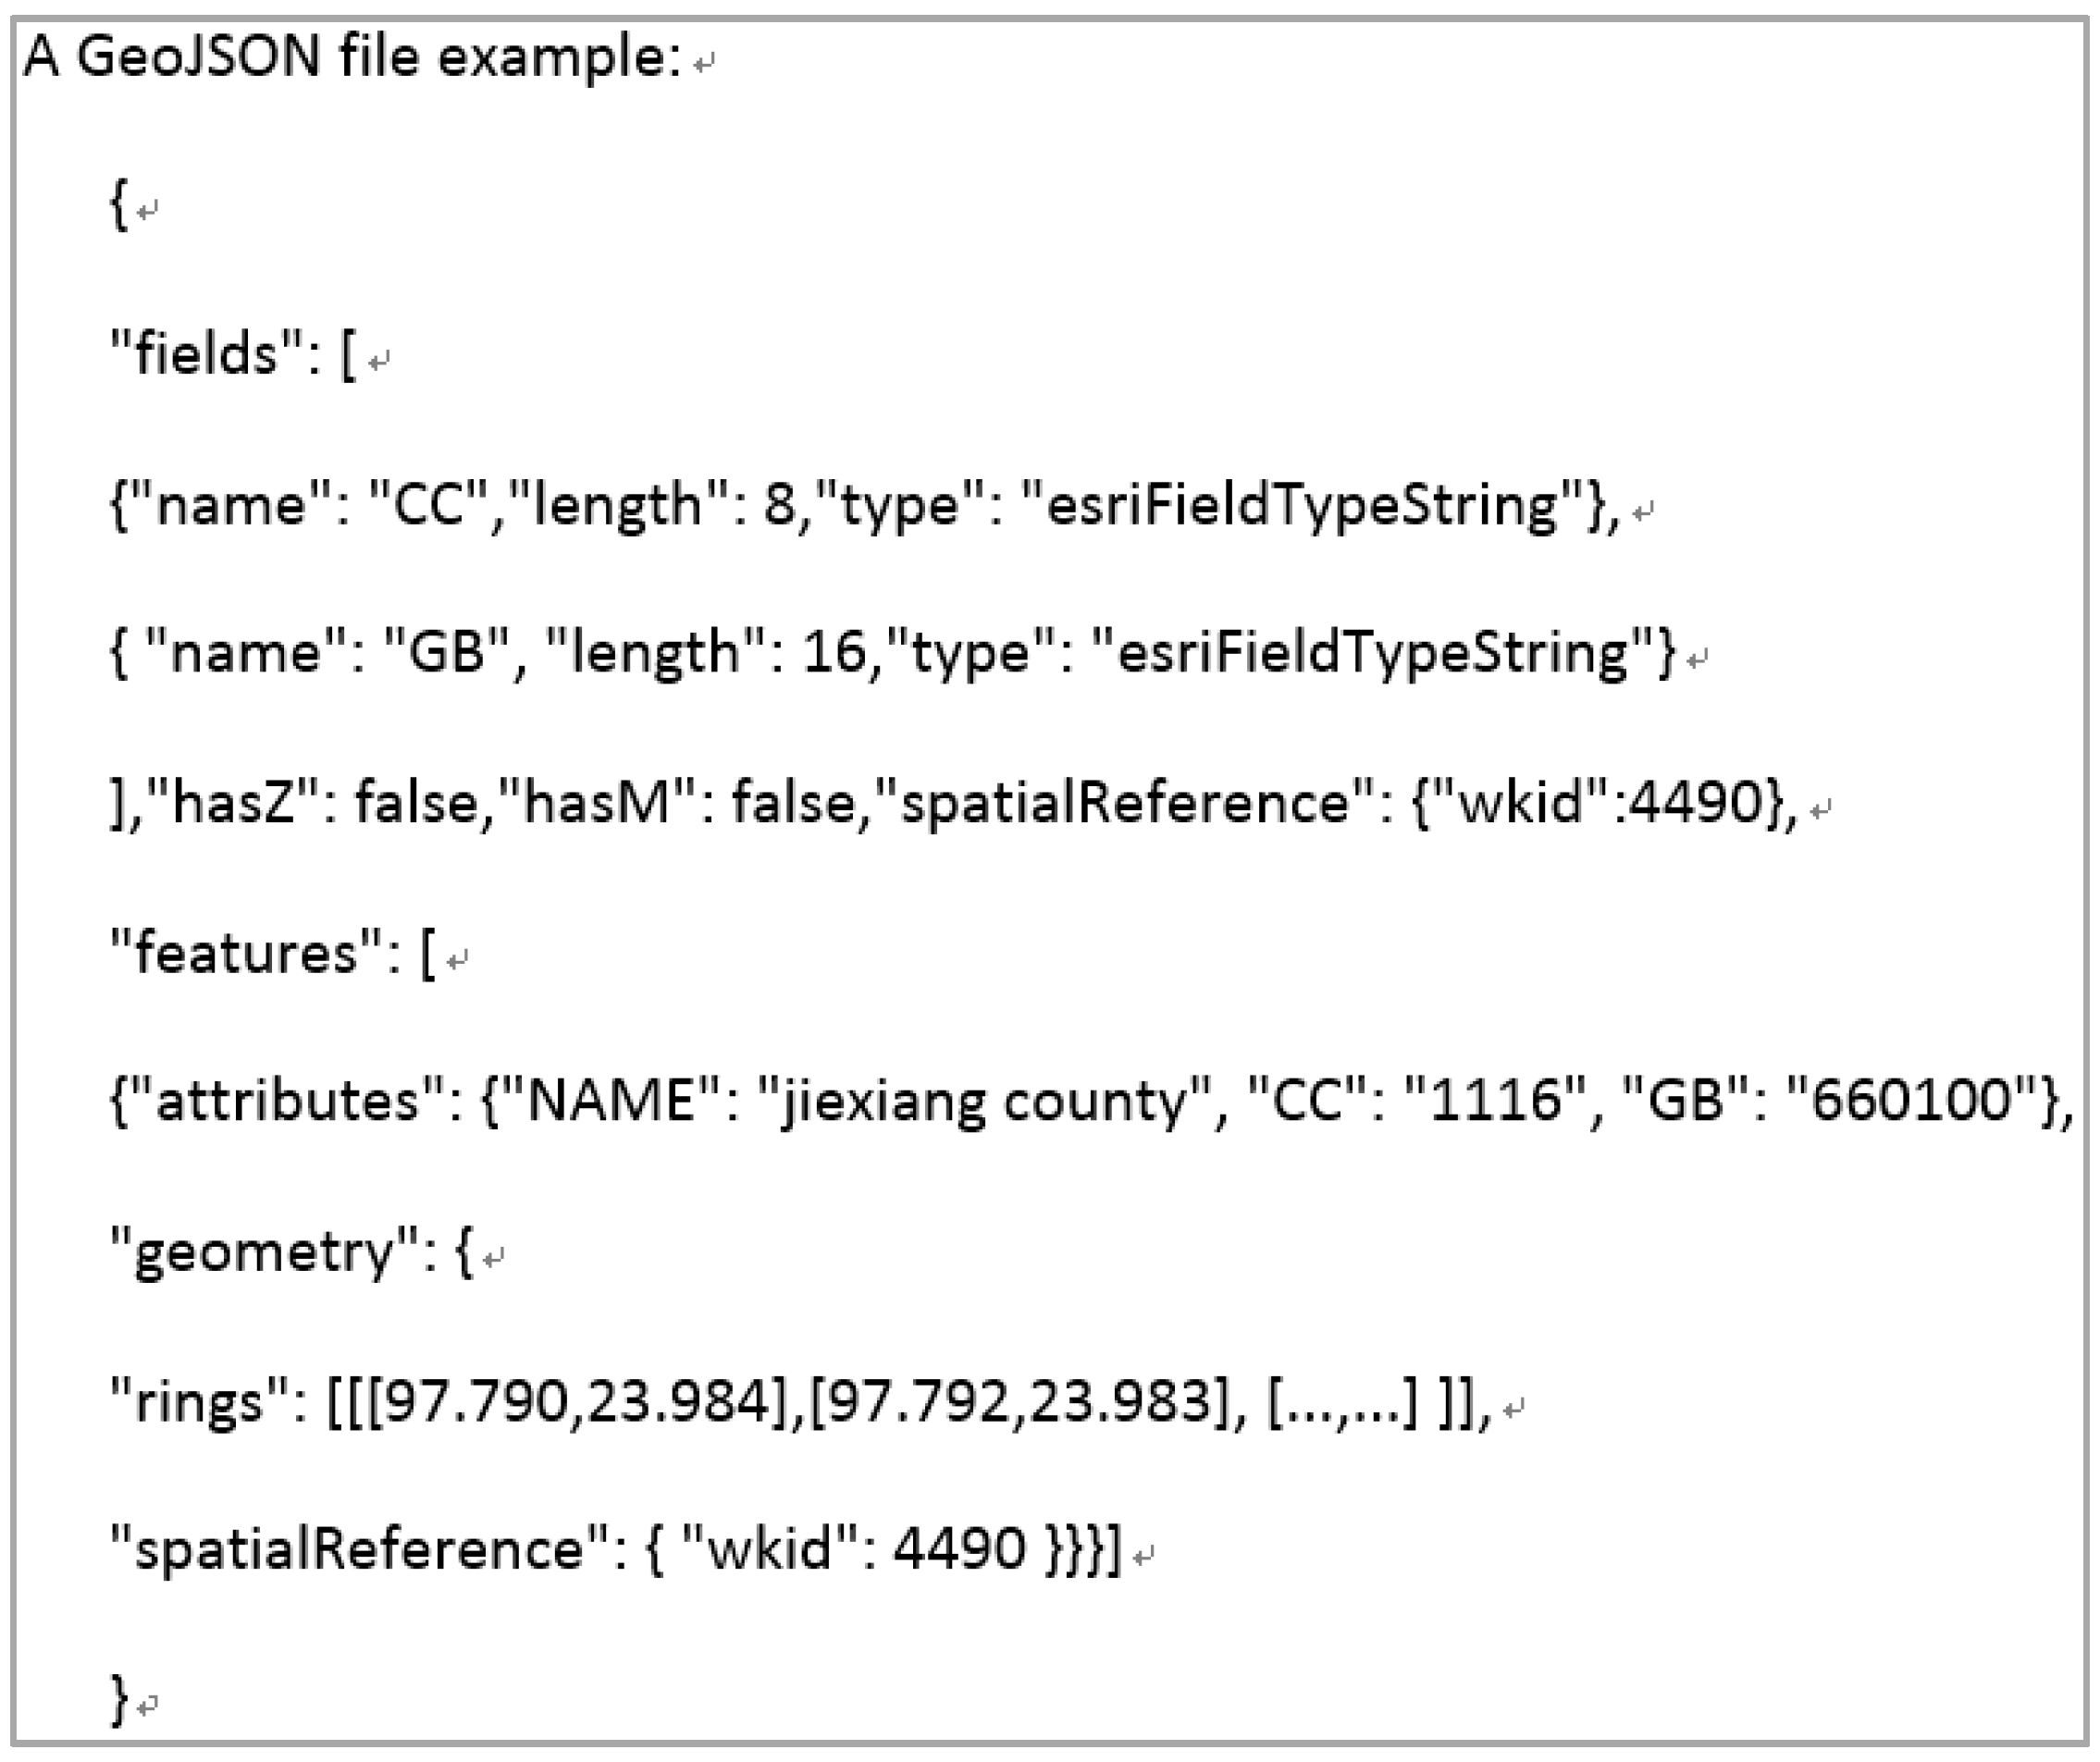
  • The data management module is a geospatial data management engine. The Hadoop distributed file system is adopted to store geospatial data in a distributed and scalable environment to meet the challenges of the unprecedented growth of big geospatial data. Since HDFS is not a fully POSIX-compliant file-system, existing GIS libraries do not effectively work on HDFS to read or write data stored in binary formats (e.g., shapefile). Accordingly, the proposed system utilizes the GeoJSON data format, a plain-text format supported by HDFS, to encode geographical objects (e.g., points, polylines, and polygons) and store their associated properties. As a standard geospatial data interchange format, GeoJSON is supported by much open source software and libraries and is easy to implement and customize. In the proposed implementation, the GeoJSON library for Hadoop developed by Esri to convert, read, and write vector data as GeoJSON on HDFS is adopted. All geospatial vector data will be archived in GeoJSON and stored in HDFS.
  • The Hadoop-based spatiotemporal analysis module supports parallelized spatial analysis using MapReduce for points, polylines and polygons. Currently, a number of basic spatial analysis algorithms are implemented for computing distance, area, and performing basic operations (e.g., clip, intersect, buffer, contain, and overlap). If the input data size fits a single virtual machine’s (VM) capacity, the QGIS/ArcMap server can be used to conduct the spatial analysis jobs. Based on these basic geospatial operations and statistical methods, users can develop their own statistics algorithms in the Map-Reduce style.
  • The workflow management module utilizes Apache Oozie to manage the analytic services developed in the Hadoop-based spatiotemporal analysis module. Users can reuse the analytical services that exist in this platform, or are shared by other users in a drag-dropping mode, as well as chain the existing basic services together to build a more powerful workflow to be submitted to the Hadoop cluster and executed in parallel. It avoids duplicated development, and supports service/workflow sharing.
  • The data visualization module uses a virtual machine with QGIS/ArcMap to visualize spatiotemporal statistical results fetched from the HDFS.

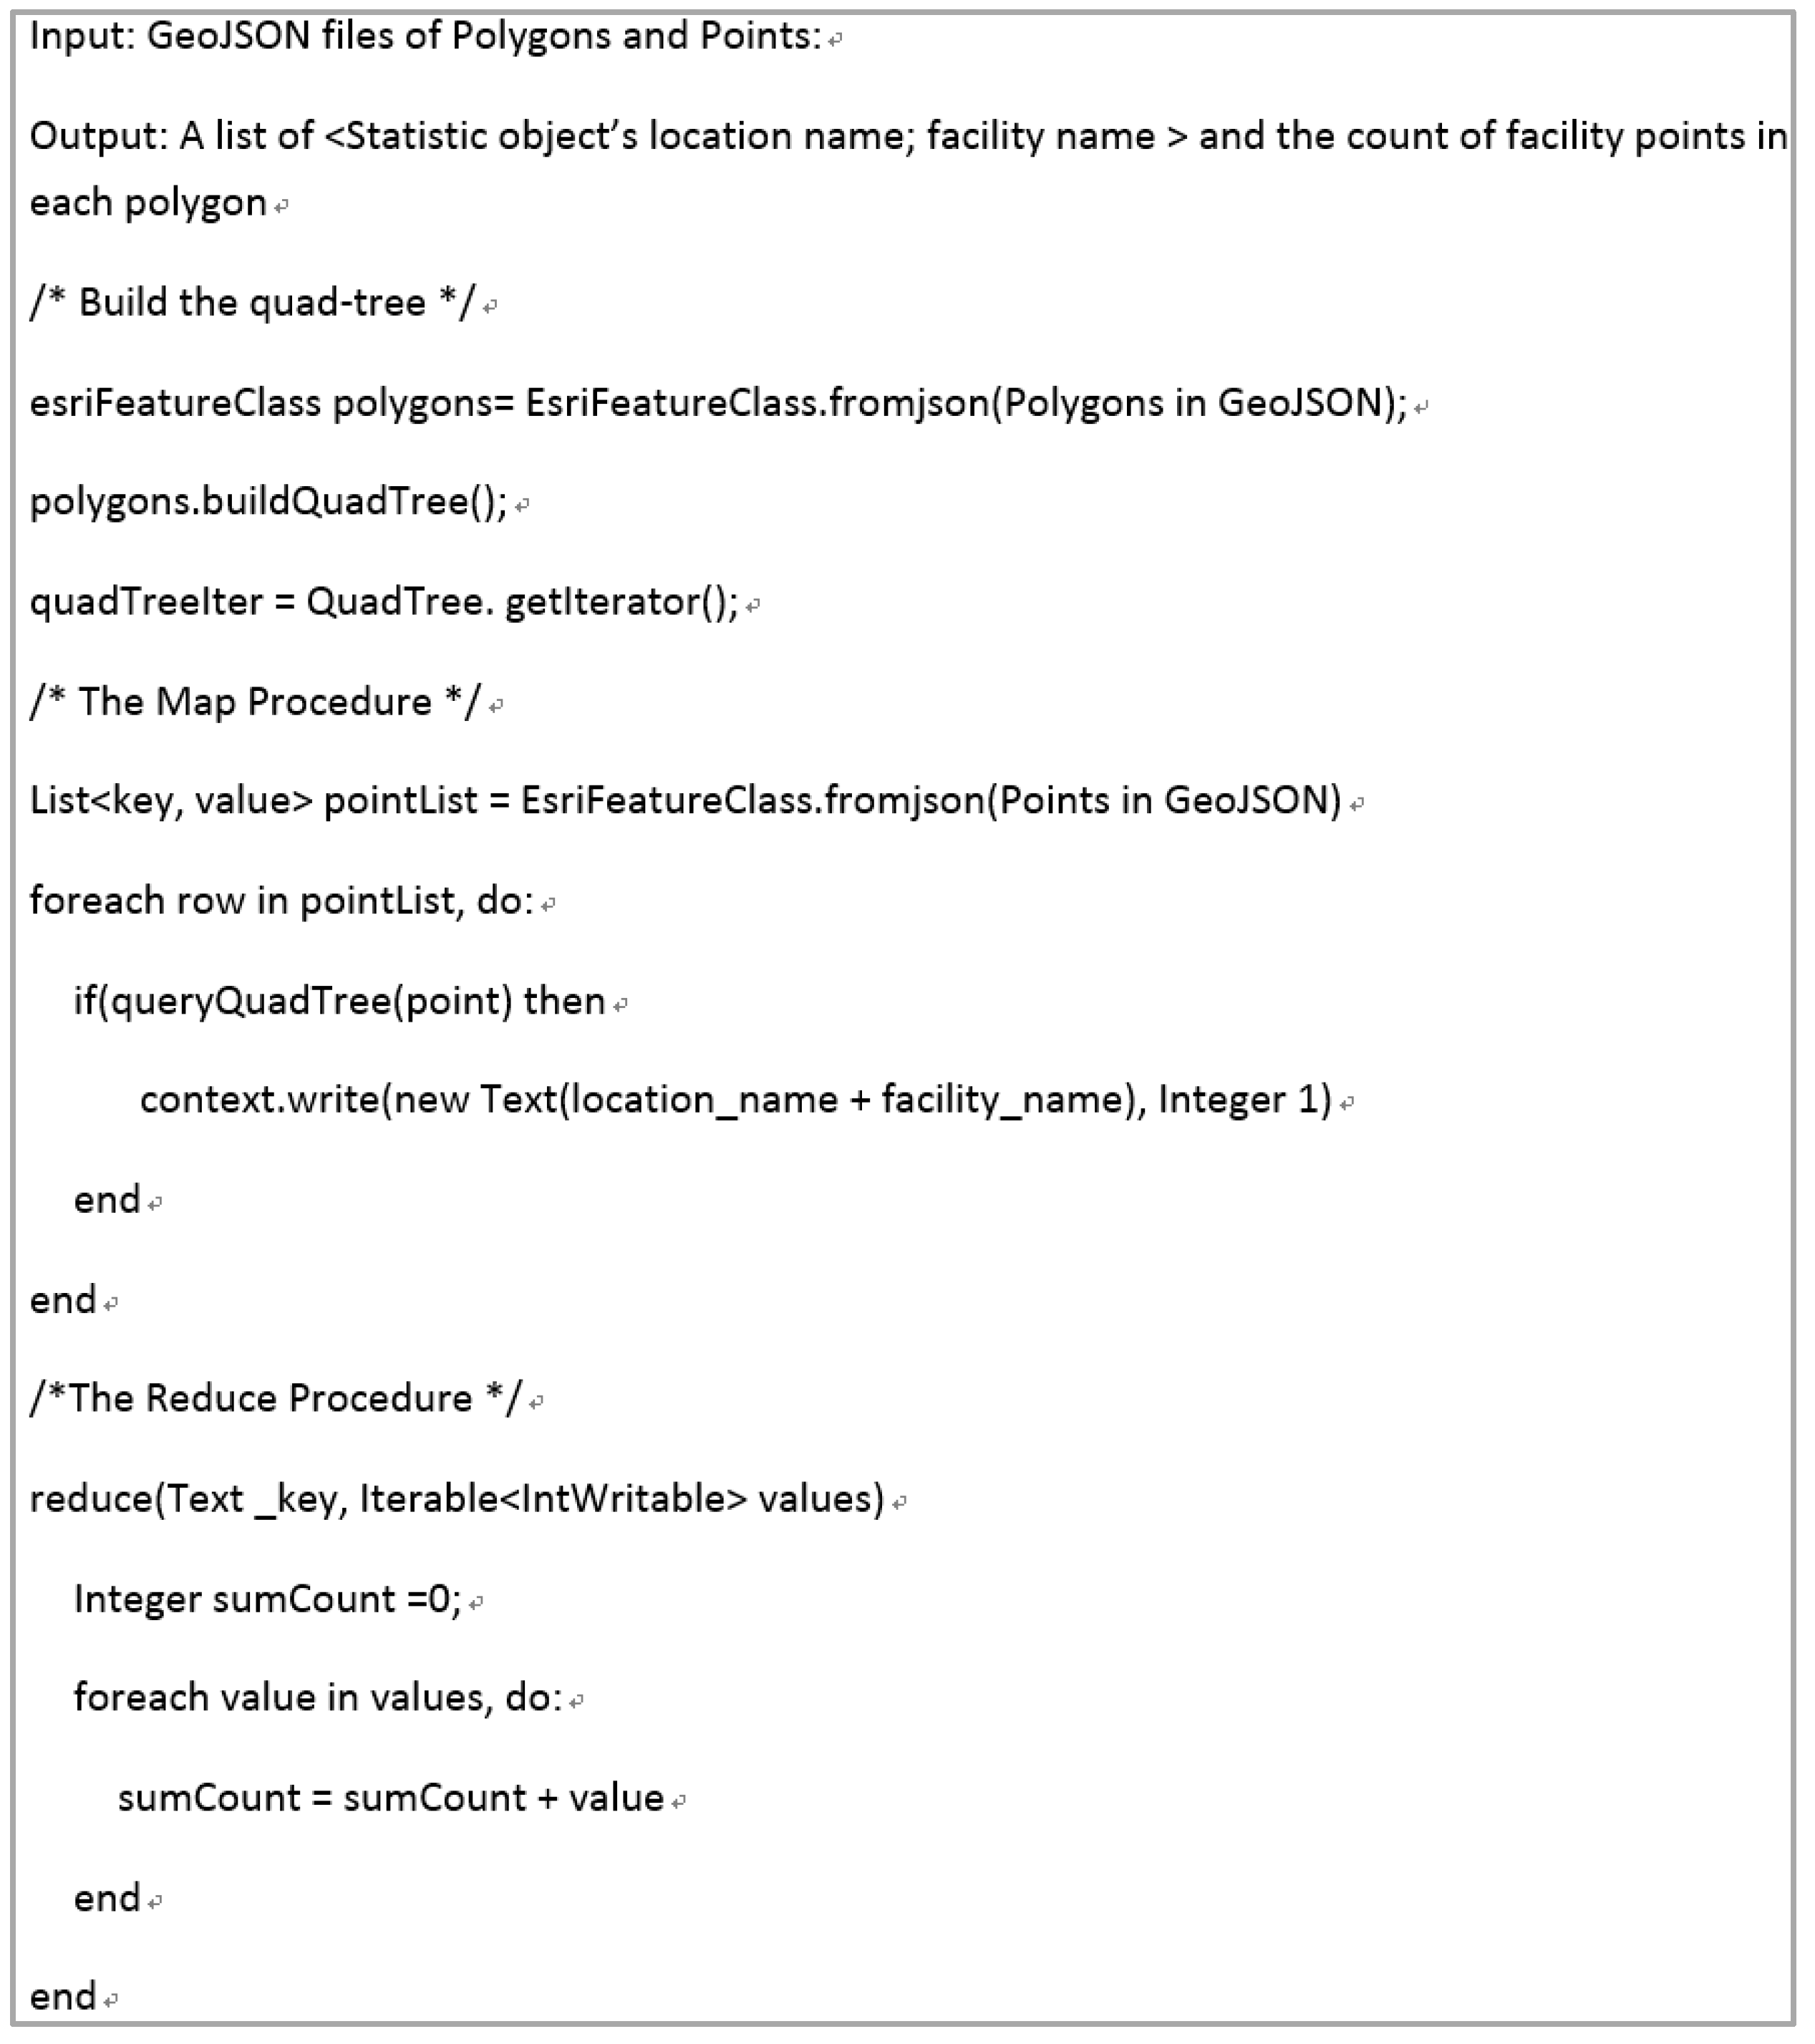
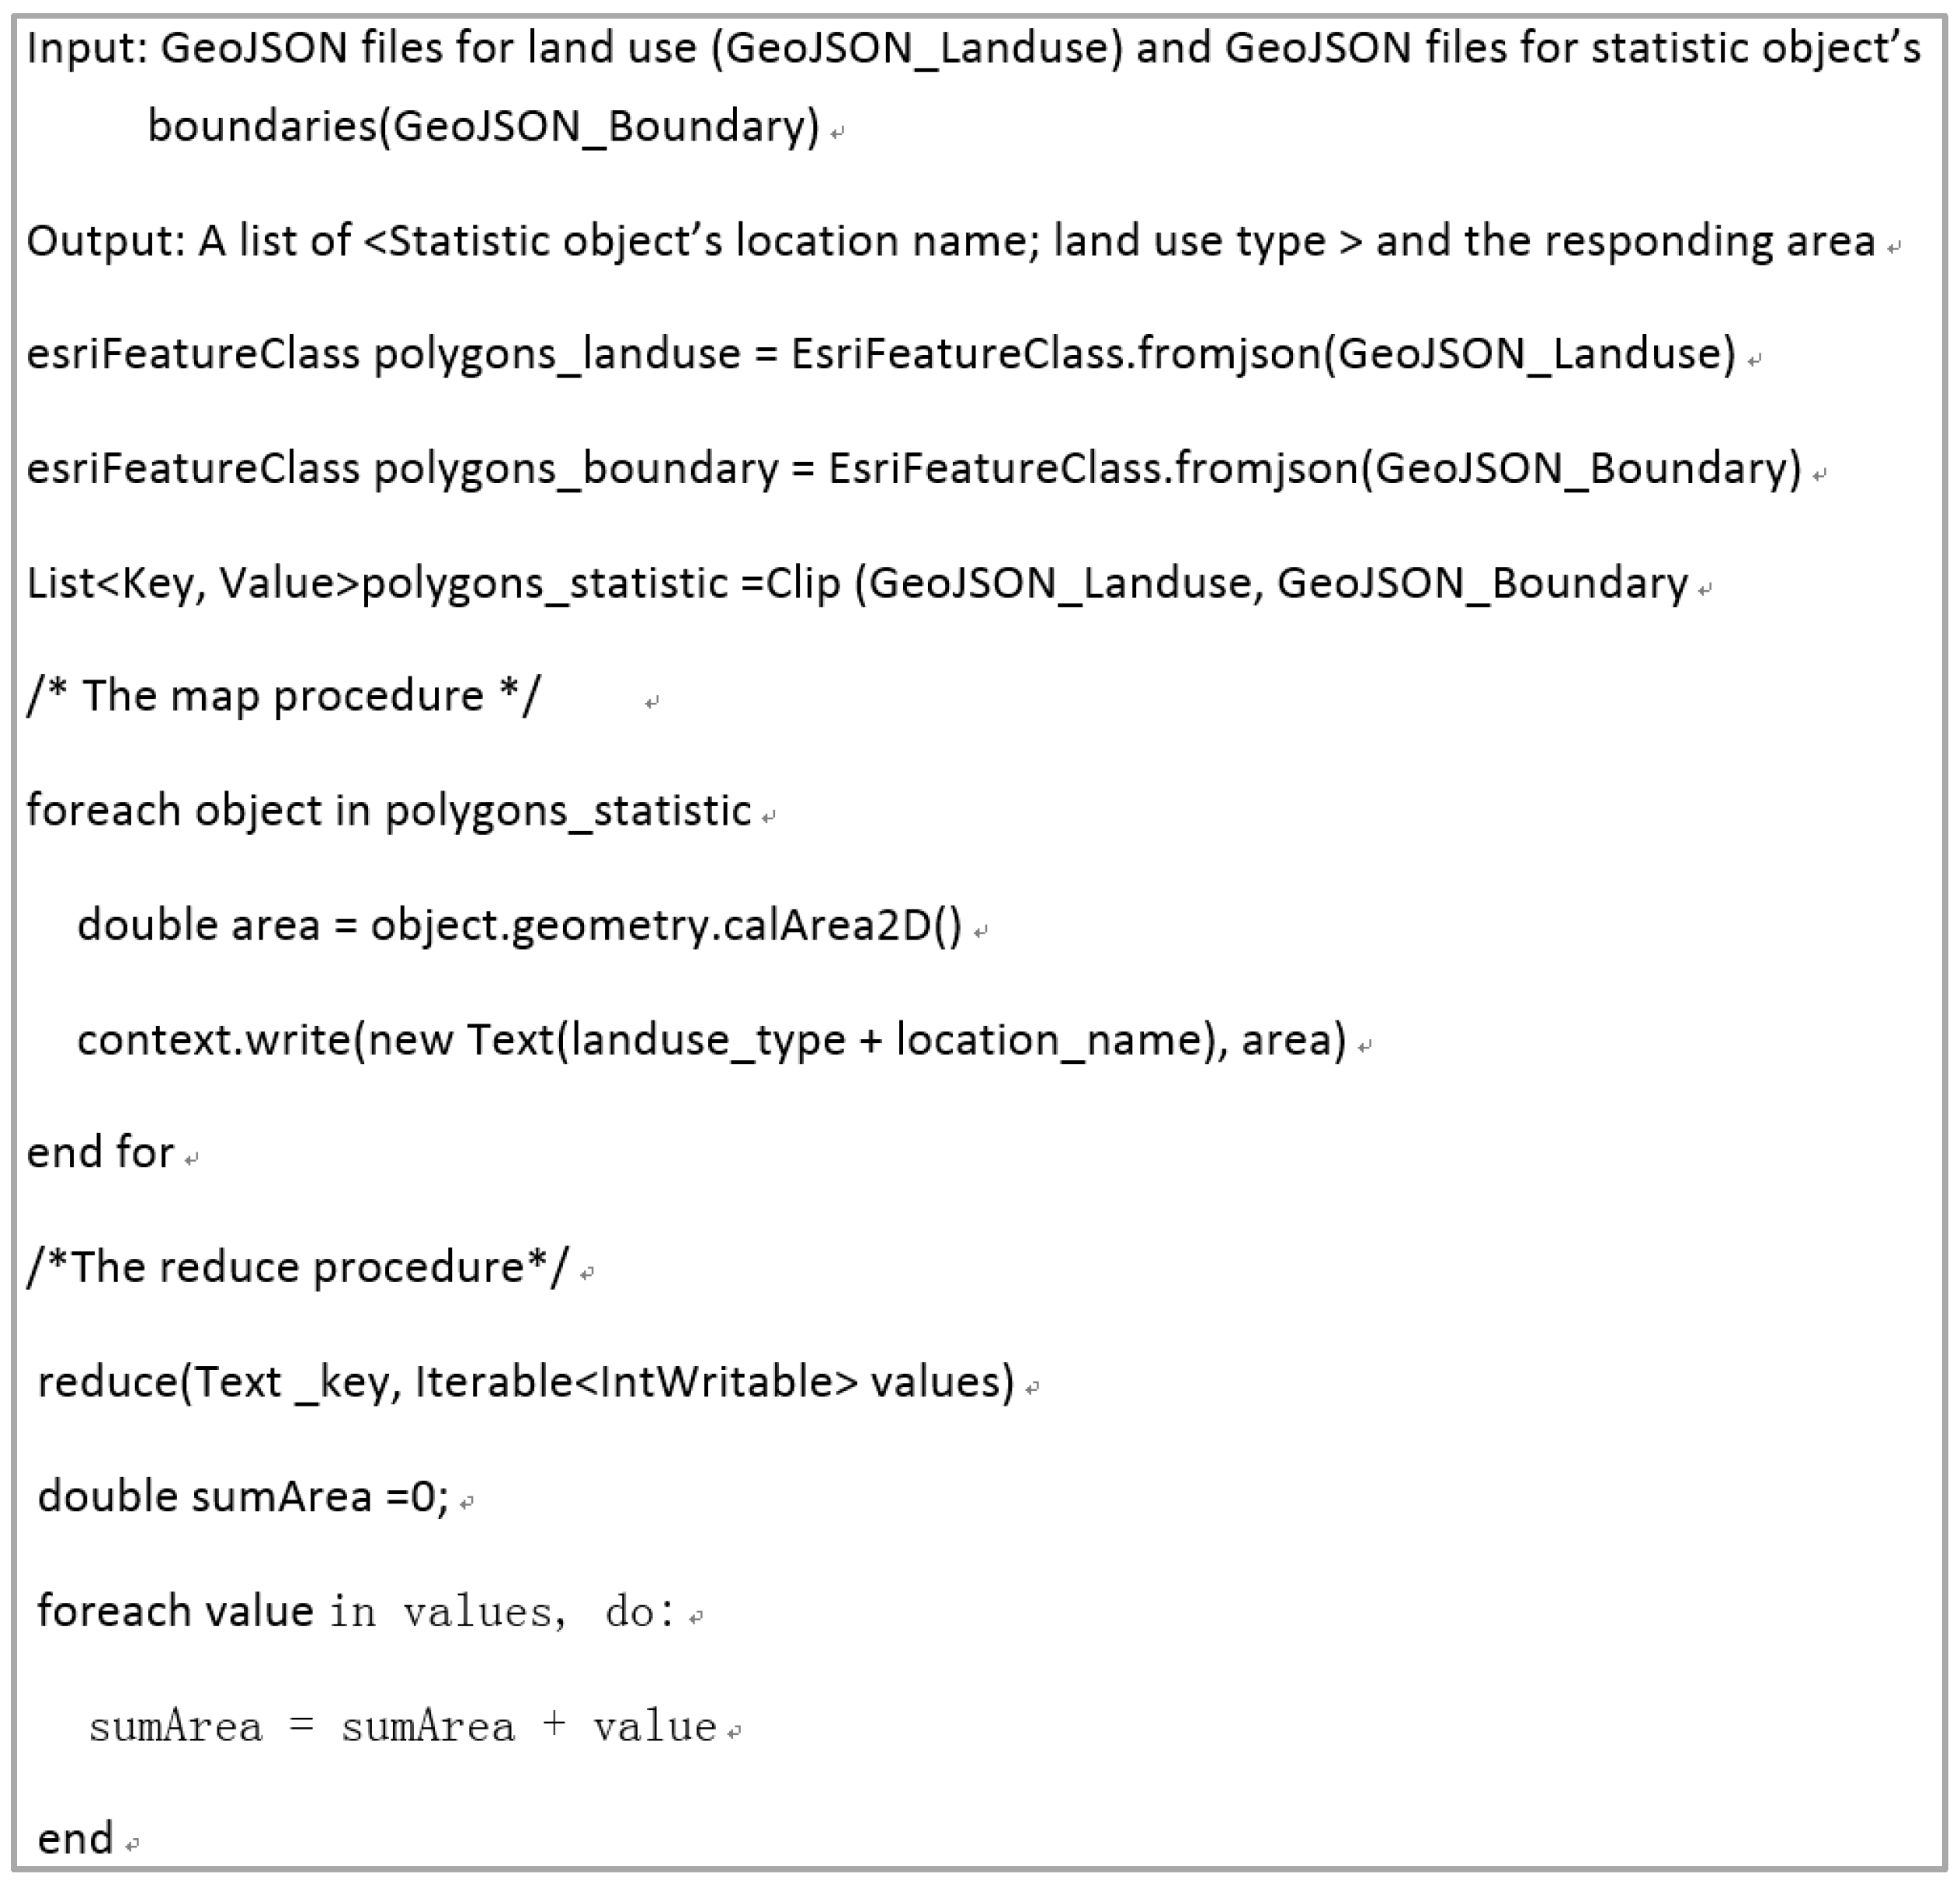
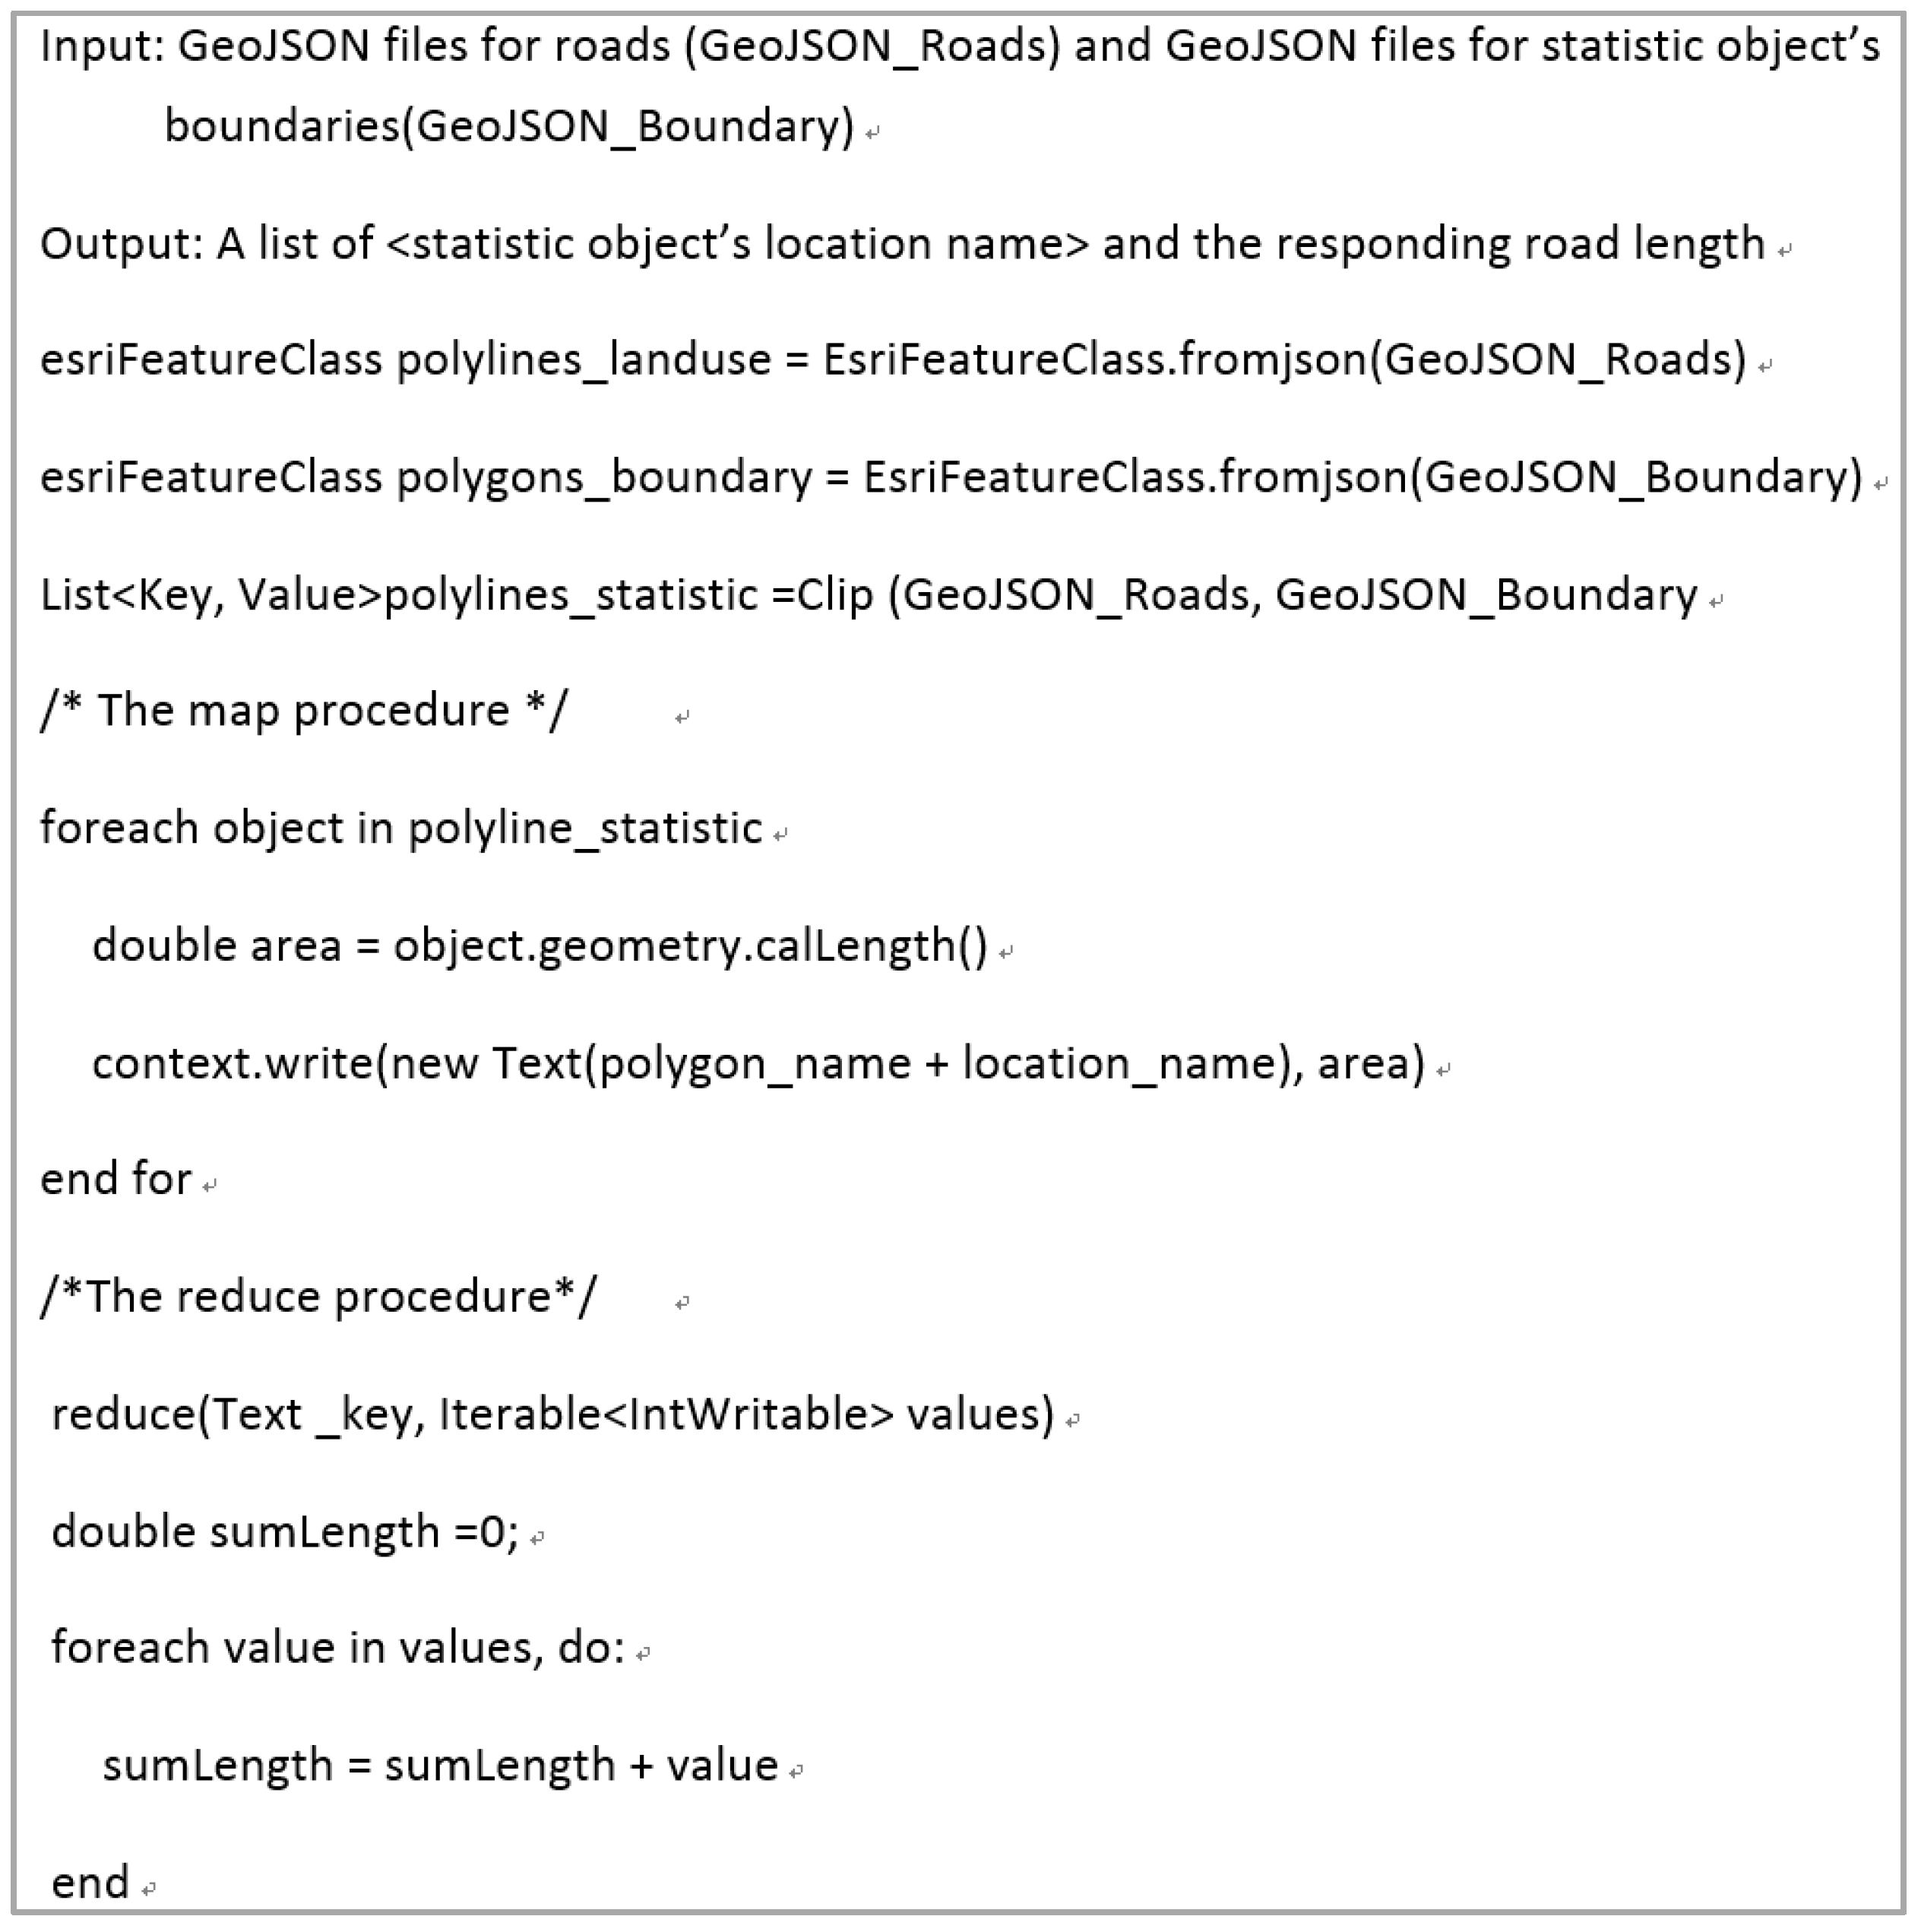
3.2. Parallel Spatiotemporal Statistics Using MapReduce

The Geostatistics-Hadoop system supports spatiotemporal statistical analyses for different statistical features (e.g., surface coverage, polyline, and point) and in multiple statistical units (administrative region, elevation zone, and slope zone).
The statistical workflow is characterized by four main procedures (Figure 2). The first is data preprocessing. Due to the limitations of HDFS in supporting binary data formats, the proposed system includes data format conversion functions to convert vector data formats to GeoJSON formats and to upload them to HDFS. The second is data transformation. Geospatial data usually needs to be preprocessed to extract target data constrained within the spatiotemporal bounding box at a suitable scale for further spatiotemporal statistical analysis. A number of basic spatial and temporal operations (e.g., cut, union, and overlap) are implemented in a Map-Reduce style. The third is spatiotemporal statistical analysis. Some spatiotemporal analytic services are provided to calculate geo-information (e.g., changes to land use of developed, cultivated, commercial, residential, forest, water, and farm areas) from the massive amount of geospatial data. Finally, the fourth module is data visualization. The computed results are stored in a table or generated graphically for visualization. The results are delivered to the QGIS/ArcMap server to be visualized as maps. In addition, the results usually require several MapReduce jobs to conduct a spatiotemporal statistical analysis involving data transformation, data analysis and visualization. To ease operation and programming, Apache Oozie manages the existing MapReduce services. Users drag and drop the spatial operation services and chain them together. Subsequently, each service is launched in parallel or sequentially as the logical workflow indicates. The output of the previous service functions as the input for the next service.
Vector data (e.g., point, polyline and polygon) is converted to GeoJSON formats by the GeoJSON library for Hadoop. An example of GeoJSON follows. There are three reasons to choose GeoJSON as the vector data format for the proposed system. First, HDFS is not a fully POSIX-compliant file-system, so the existing GIS libraries do not work well on HDFS for reading or writing binary data, such as an ESRI shapefile. Second, as a standard geospatial data interchange format, GeoJSON is supported by many open source software libraries and is easy to interpret and customize. It is treated as a native format by HDFS to read and write. Third, in addition to encoding the geographical data formats, GeoJSON also contains the associated attributes for the geographic features. An example of GeoJSON is presented in Figure 3.
In the proposed system, calculating the area, length and quantity of spatial objects is implemented in order to calculate the distribution of facilities, changes in land-use and the lengths of urban roads. These algorithms involve the spatial analysis of polygon–point, polygon–polyline, and polygon–polygon relationships. These functions are necessary to process the national geographical condition data acquisition. The spatiotemporal algorithms discussed in the following section provide a general overview of how to perform spatial statistical analysis using MapReduce.
The first algorithm calculates the distribution of facilities in parallel. The input datasets are stored in GeoJSON and consist of polygons and points. The polygons are the geographic boundaries of objects, and the points are the locations of the facilities. The first step reads the polygons and builds a quad-tree to accelerate the spatial query. The second step reads the point data out in parallel. Each point is organized as a key–value pair in which the key is the latitude and longitude of the facility, and the value is the facility type. In the mapping procedure, each point is searched to find the polygon in which it is contained. After finding the polygon, the key representing the point is changed to a composite key consisting of the polygon name and facility type and is assigned the value 1. The third step in the reduce procedure aggregates and sums the key–value pairs of the same key. Thus, one knows how many types of facilities exist in a polygon and a detailed number of each type of facility that a polygon contains. The MapReduce algorithm to calculate the distribution of facilities in parallel is presented in Figure 4.
The second algorithm calculates the areas of different land use types in parallel. The input datasets are the land use data and geographic boundaries of the statistical objects. Both are of the polygon type and are stored in GeoJSON. Initially, a spatial “Clip” operation is conducted using an overlaying land cover layer with the statistical object polygon layer. Each “Clip” object contains two attributes: land use type and the name of the geographic location. Next, in the map phase, each input object is stored as key–value pairs, where the key is the geographic boundary polygon of the input object and the value is the object’s attributes. To calculate the area of each land type at the city level, the key is transformed to combine the land type and location name. The value is the area of the type of land. Finally, in the reduce phase, objects with the same key are aggregated to estimate the land use area for each land type per city. The algorithm to calculate the area of different land use types in parallel is illustrated in Figure 5.
The third algorithm calculates the length statistics in parallel (e.g., lengths of roads in each city). This algorithm is similar to the second algorithm, but calculates the length of each polyline instead of the area of a polygon. The input datasets are the polylines for the roads and the geographic boundaries of the statistical objects (Figure 6).

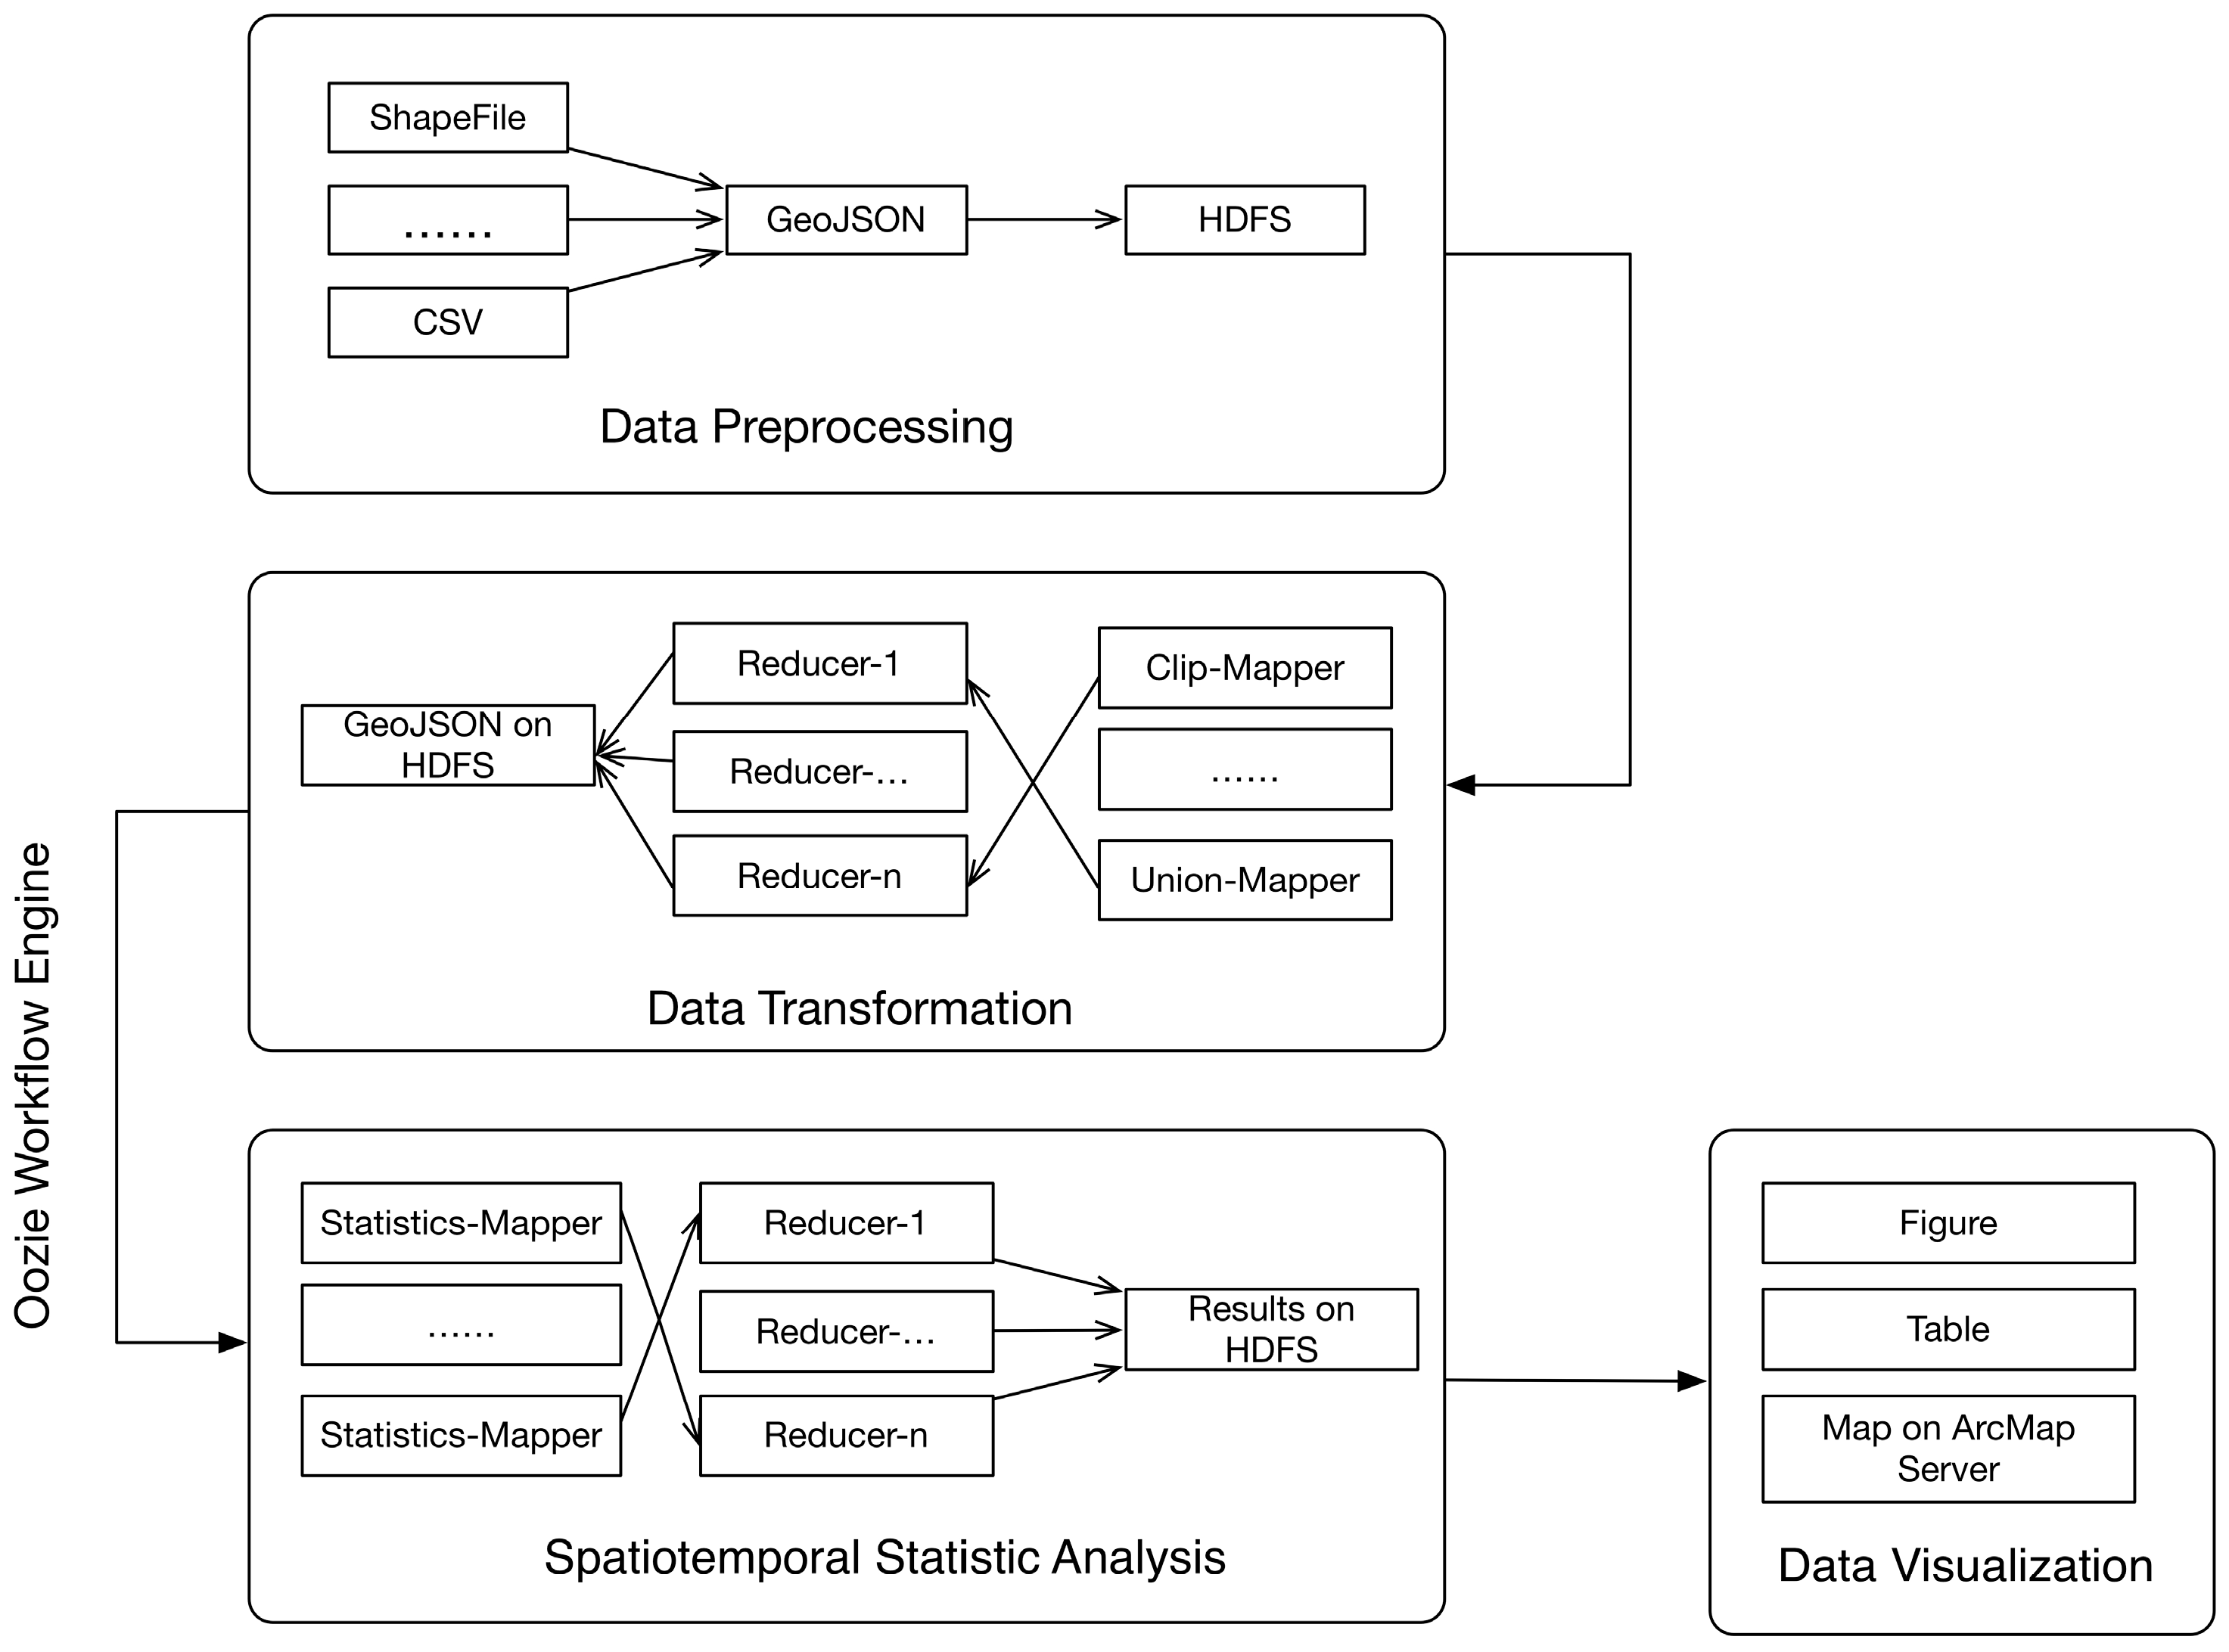
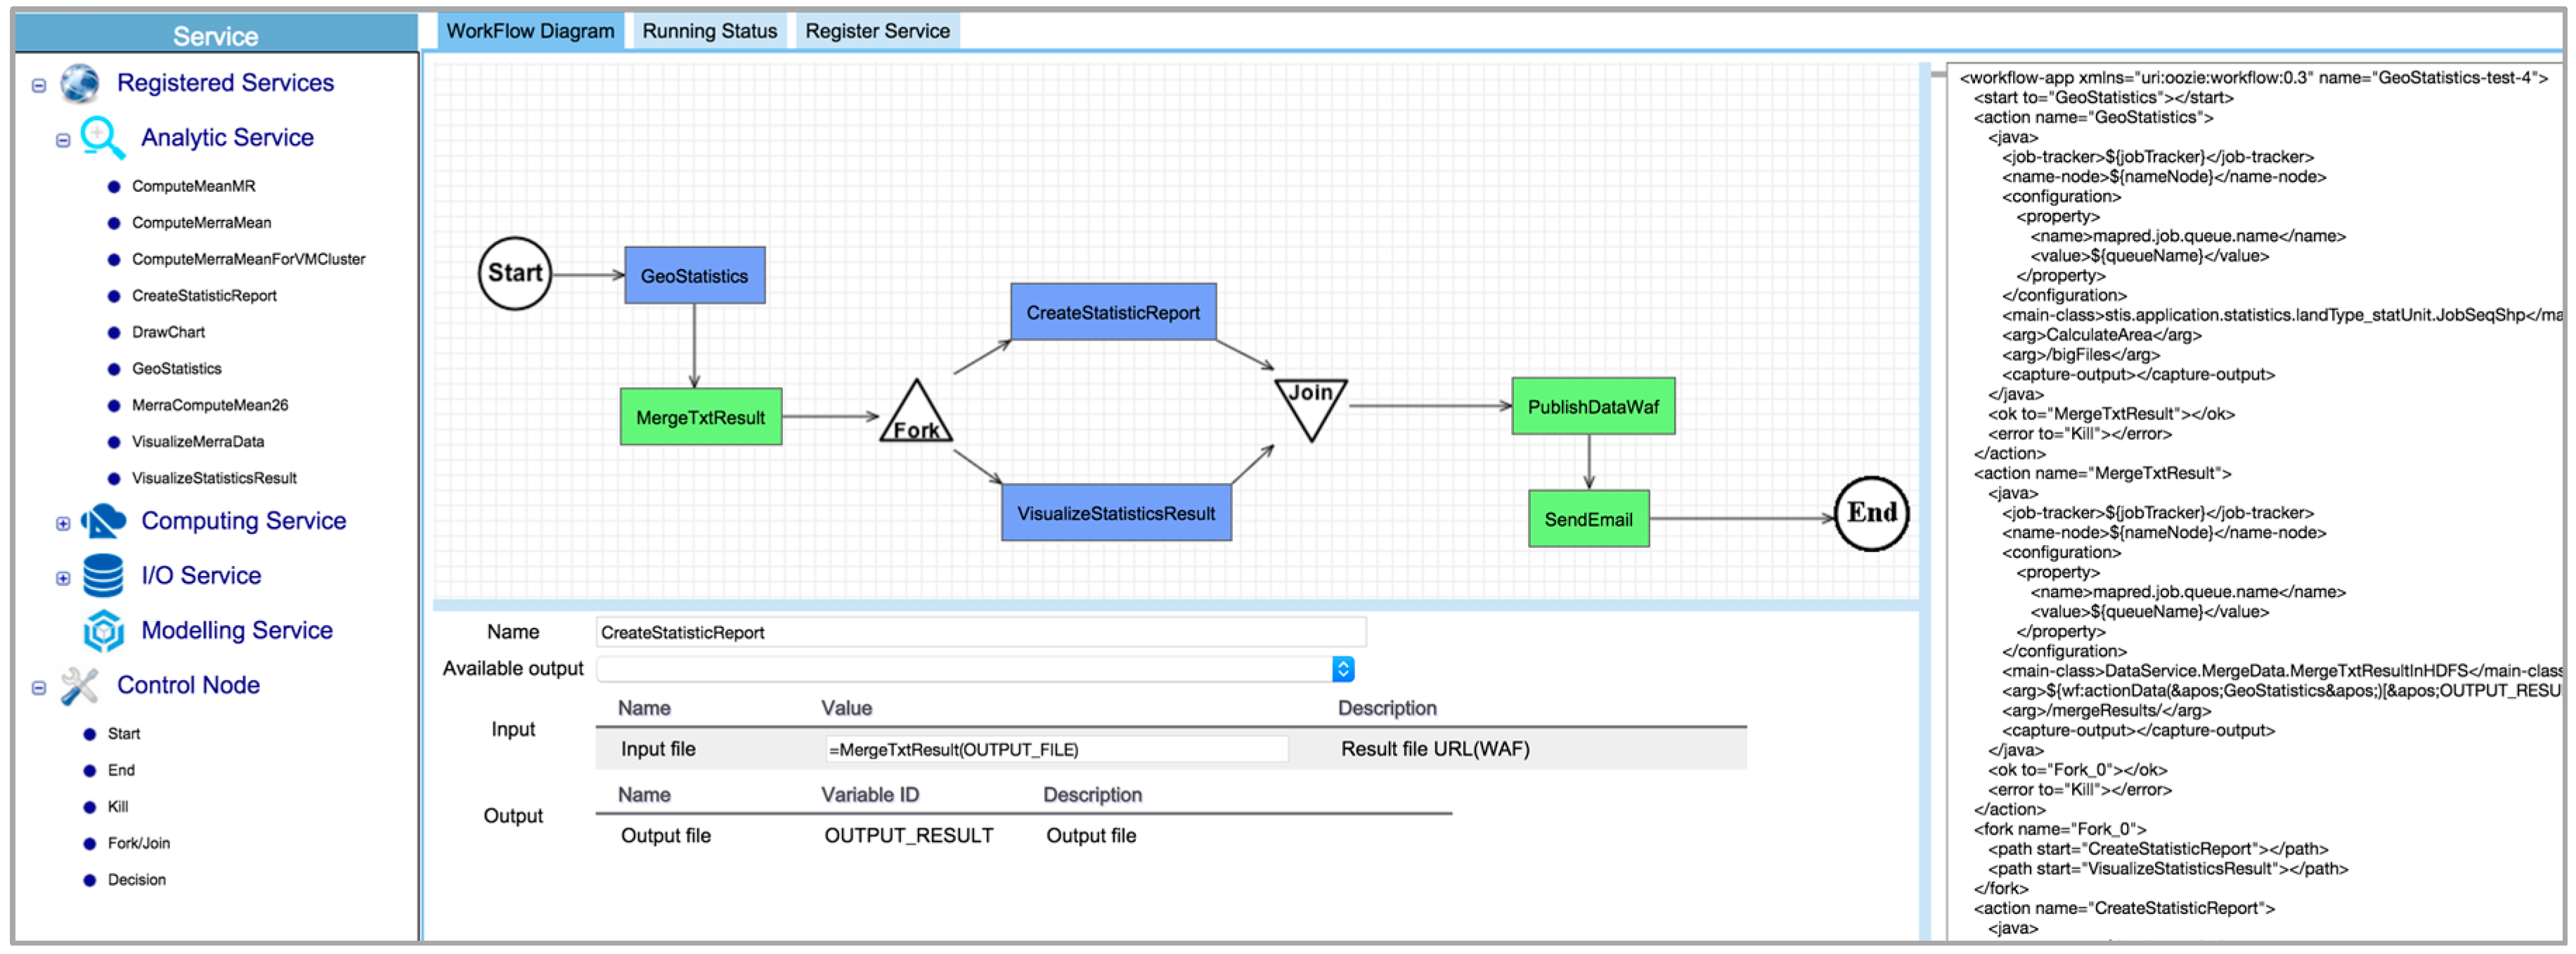
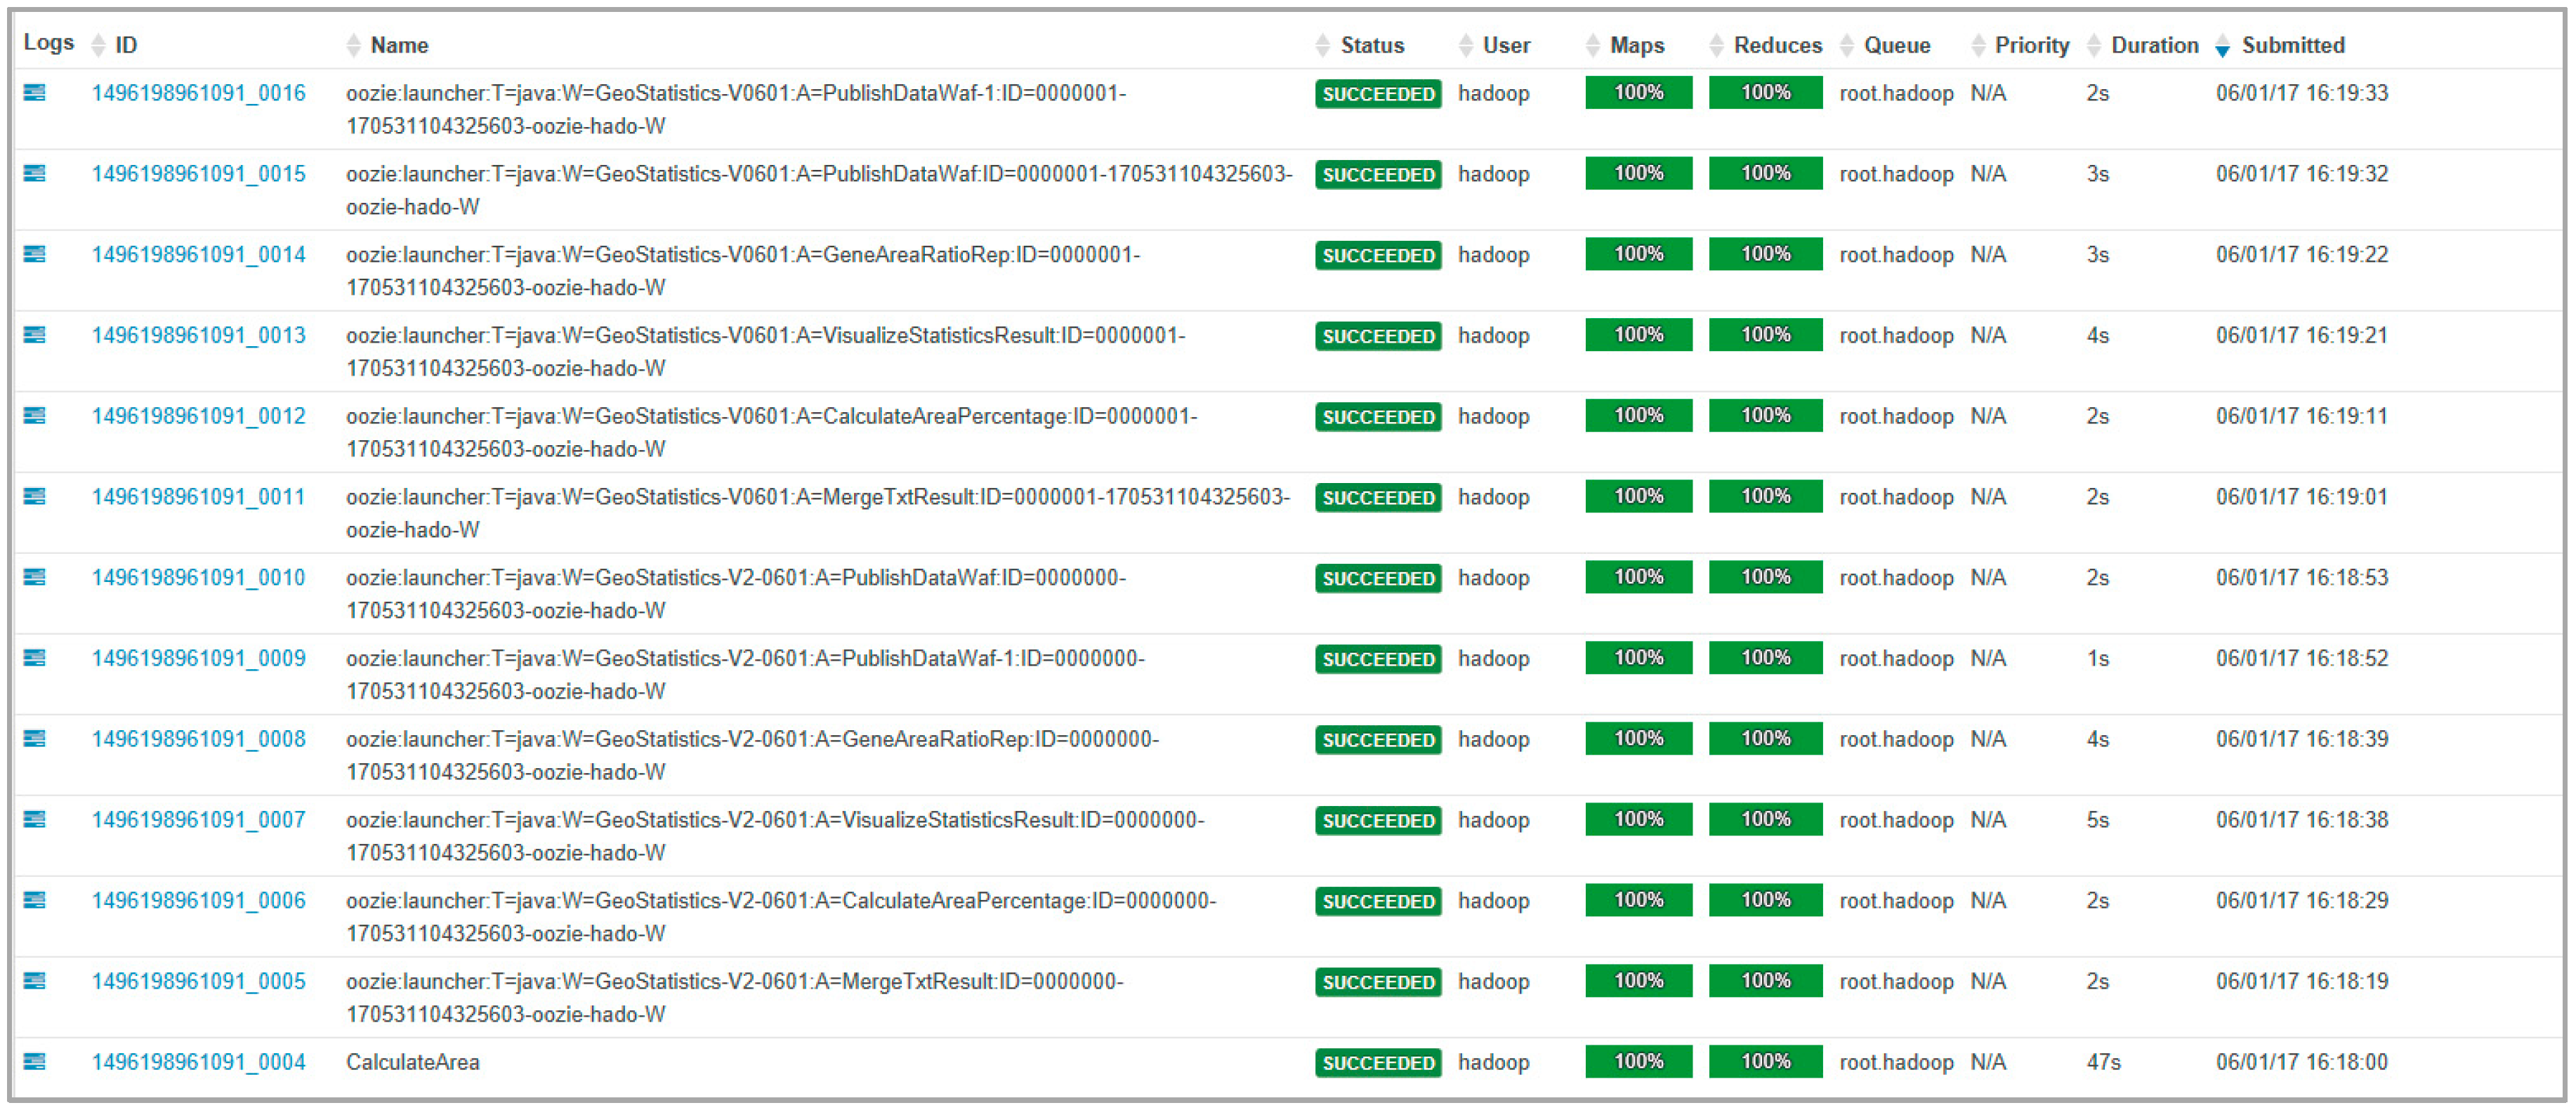
3.3. Oozie-Based Workflow System

A workflow platform is developed based on Apache Oozie to permit chaining of the statistical operations in a drag-and-drop fashion to generate a workflow. The workflow system provides a user-friendly interface to ease the operation of GeoStatistics-Hadoop. The front end of the workflow system is depicted (Figure 7). The left panel shows the registered services, including analytic, computing and I/O services. By dragging and chaining the services in the upper middle canvas, a workflow is generated from data preprocessing to data computing, to data visualization and to result publishing. The lower middle panel illustrates the tables for configuring each service. Thereafter, an XML configuration file (right panel) is automatically generated based on these configurations. The XML file describes the location of the service programs and the logistics among these services. The XML file is submitted to the Oozie engine after users initiate the workflow. Subsequently, the Oozie engine launches the services provided by GeoStatistics-Hadoop, in sequence or in parallel, according to the XML file. The submitted workflow is also saved for future use, or made available to be shared with others. Users can also upload their own MapReduce programs to this platform and share them with others. In addition, the submitted jobs can be monitored in real time as shown in Figure 8.

4. Results and Evaluation

4.1. Experimental Design

Two datasets were selected to be used as experimental data to evaluate the proposed methodology. The first one is from the Ruili city area in Yunnan Province. The data was extracted from the First National Geographic Condition Data Acquisition database and includes a 30 m Digital Elevation Model (DEM), administrative regions (polygons), land cover (polygons), roads (polylines), residences and facilities (points). The elevation and slope data are derived from the DEM. The experimental data (i.e., DEM, elevation, counties, facilities, road and land cover) is illustrated (Figure 9, and the volume of raw data is listed (Table 1). Ruili city is split into 39,387 polygons to represent its land use, 588 polylines to represent the city’s roads and 600 points to represent residential locations. The second set of experimental data is the land cover data for Fuxian Lake in Yunnan province (Figure 10) in 1994 and 2014. In order to obtain more data to evaluate the performance of the proposed system, the original vector datasets (2.93 MB) were duplicated 107 times to generate more data (approximately 27.94 TB), as Ruili City is a typical area in Yunnan province.
For the computing environment, five physical machines were used to build a Hadoop cluster (version 2.5). The structure of the Hadoop cluster and hardware information is provided (Table 2). For HDFS, all nodes operate as data nodes, and two work as the primary and secondary Namenode to manage the file system namespace and regulate file access. For Yarn, all nodes operate as node managers, and one is selected as the resource manager. Each node is configured with 24 CPU cores running at 3.2 GHz, with 128 GB RAM, a 6 TB SAS disk and CentOS 6.6. The workflow system is deployed based on Apache Oozie (v4.2.0) to ease the operations of GeoStatistics-Hadoop by a user-friendly graphical interface. Three experimental scenarios were designed as follows: (1) baseline using X86 PC server to conduct spatial calculations using ArcGIS 10.1, and configured with 24 CPU cores running at 3.2 GHz, with 128 GB RAM, a 2 TB SSD/20TB SATA and Windows 8.1 Enterprise (Table 3), and designed as a check of the single processor environment; (2) the second scenario uses the physical Hadoop cluster consisting of five physical nodes to conduct the experiments; and (3) the third scenario uses the DC2 cloud platform to launch and add five additional computing nodes to the physical Hadoop cluster.
Three experiments were conducted to evaluate the utility of the methodology. In the first experiment, a statistical analysis of the objects was conducted in sequence on a PC with the 5-node Hadoop and the 10-node Hadoop cluster. Three parameters were counted: resident and facility number, road length and land coverage. In the computing process, objects were classified by administrative region, elevation and slope and then their values were determined. The second experiment is similar to the first, except that the three statistical parameters are calculated concurrently. The third experiment calculated the change in land coverage of Fuxian Lake from 1994 to 2014 using three different computing environments. For the PC, a thread was created for each object statistic. For the Hadoop cluster, the platform was used to parallelize MapReduce for each object statistic. To reduce variability and measurement error, each experiment was executed five times, and the average run-time was used for comparison.

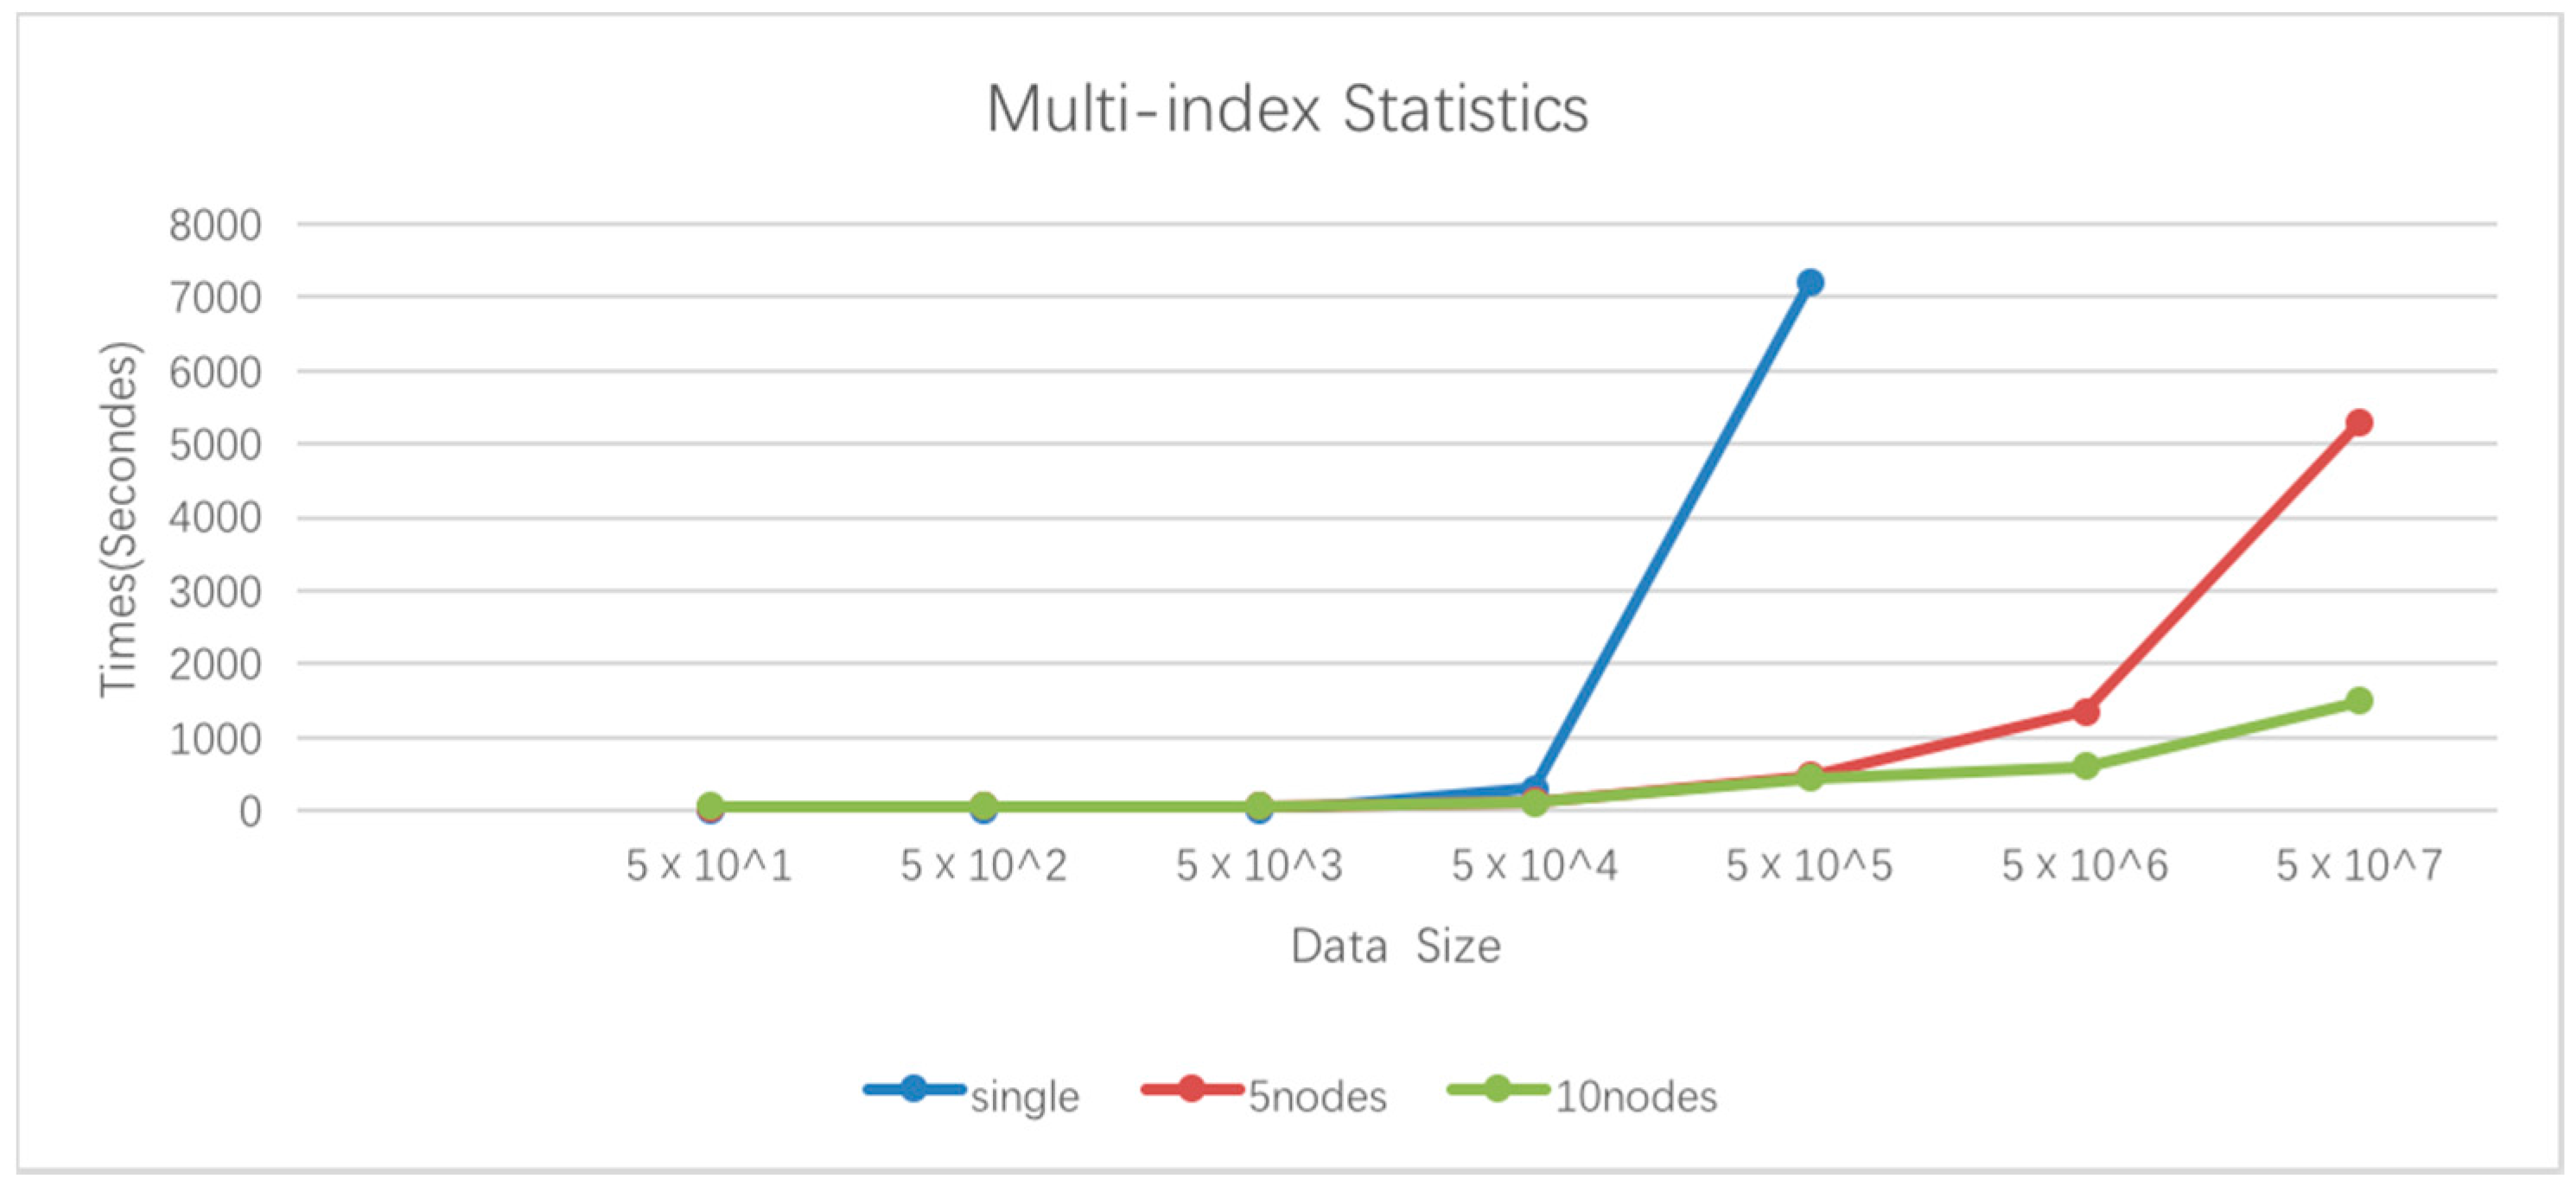
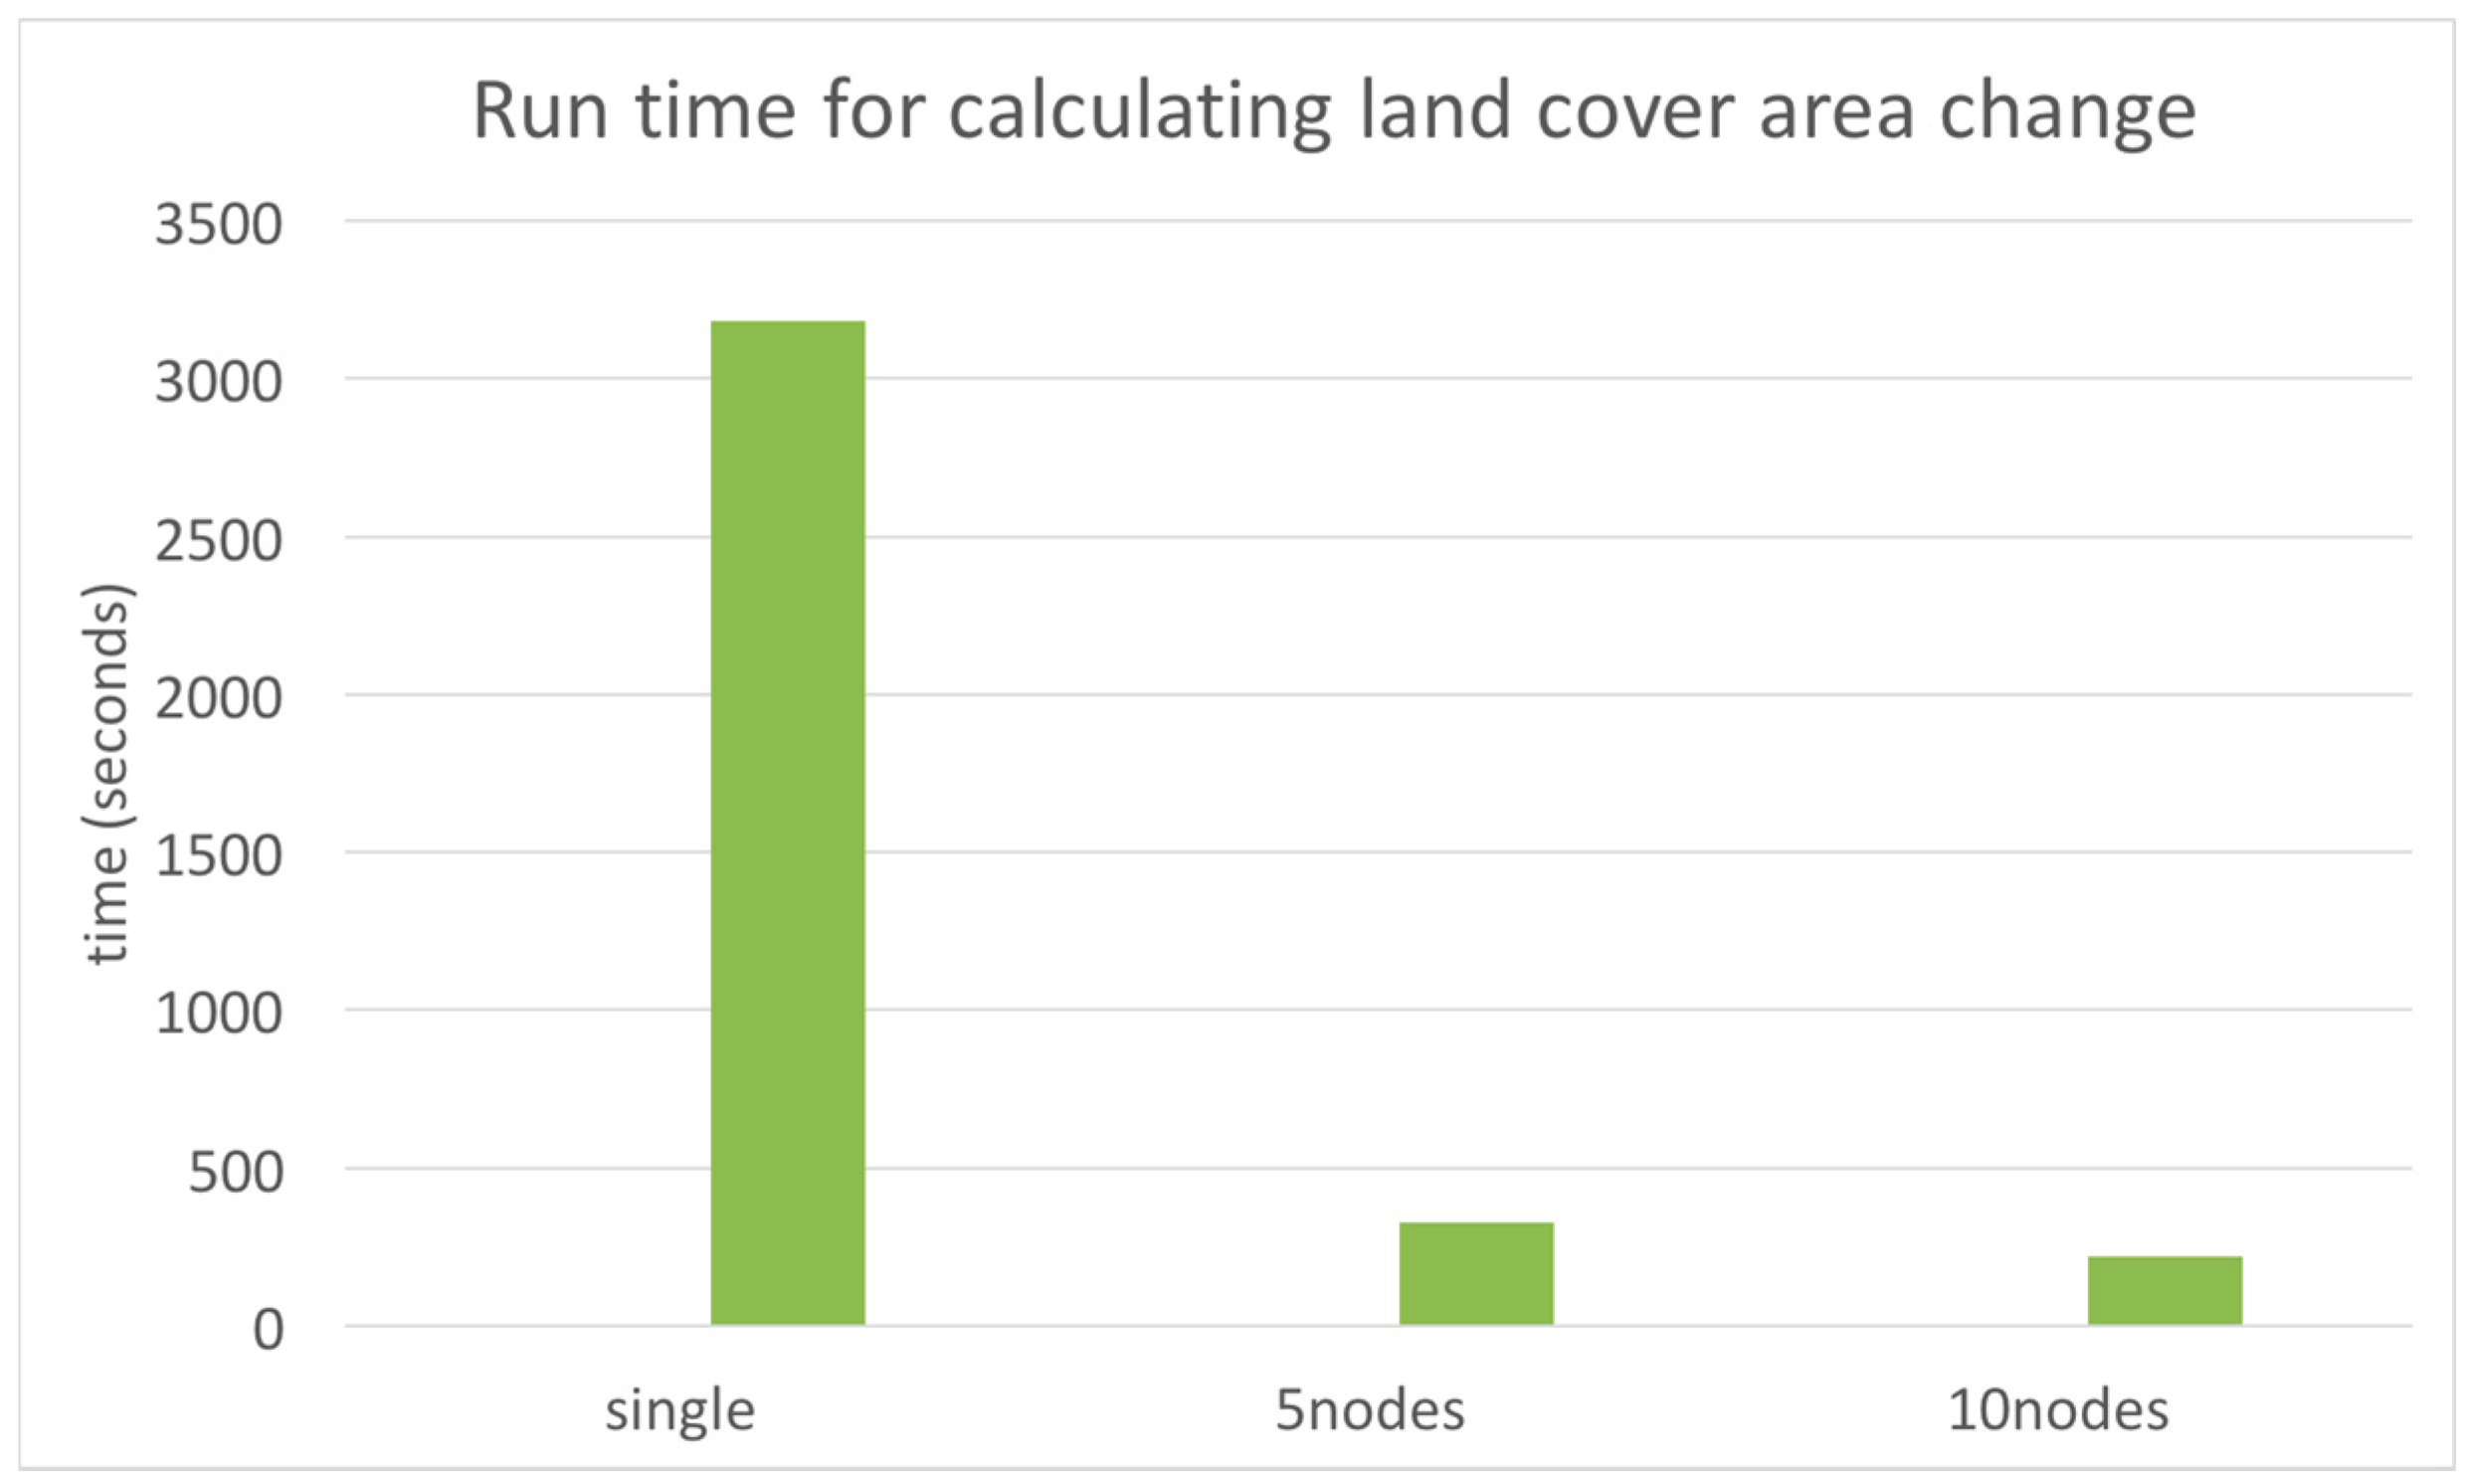
4.2. Experimental Results and Discussion

The run-time for the first experiment (Figure 11) demonstrates that as the data size increases, the PC’s run-time starts off smaller than that of the Hadoop cluster at the beginning; but after the data size reaches about 100,000 geometry, the run-times of the 5-node cluster and the 10-node cluster are smaller than that of the PC. As an example (Figure 11a), when the number of polygons is <60,000, the PC’s run-time is the smallest, but increases dramatically, and becomes much larger than that of the 5-node cluster and 10-node cluster when the number of polygons is >600,000. Two factors lead to the smaller run-time on the PC at the beginning. The first is that the Hadoop cluster takes 30–50 seconds to launch and initialize a job. The second is that, when compared with the standalone computing mode, a Hadoop cluster is not an efficient way to handle small datasets as it adds extra overhead (e.g., network data shuffle, intermedia data writing to disk, data serialization and deserialization). However, when the data size becomes larger than 6,000,000, the computing job exceeds the capabilities of the PC’s CPU and memory. Since the Hadoop cluster coordinates the computing nodes in the cluster to run the job in parallel, the Hadoop cluster supplies enough computing resource. Accordingly, the Hadoop cluster is faster than the PC after the processing data size reaches 100,000 of geometry. In comparing the run-time for the 5- and 10-node clusters, their run-time is similar when the processing data is smaller than 100,000 of geometry, because the size of the experimental data is small for the 5-node cluster. Adding five virtual machines to the Hadoop cluster does not improve the performance when the datasets are small and it even initiates more overhead. For example, the run-time of the 5-node cluster is smaller than that of the 10-node cluster (Figure 11d). Nevertheless, when the number of polygons increases to the 6,000,000, the run-time for the 10-node cluster becomes smaller than that of the 5-node cluster (Figure 11a, b, c, d, e, f, g, and h). This pattern indicates that the 10-node cluster improves the performance with more computing resources.
The results of the second experiment (performance comparison for multiple parameter statistics computed in parallel) indicate that the Hadoop cluster is faster than the PC when data volume increases to 5,000,000 geometries (Figure 12). As the amount of data increases exponentially, the run-time for the Hadoop cluster increases at a much slower rate than that of the PC. This is because Geostatistics-Hadoop can coordinate a cluster of worker nodes to read and process the data concurrently, but the single VM can only use a single machine’s storage and computing resources in this experimental configuration. This demonstrates that Geostatistics-Hadoop supplies sufficient computing resources to efficiently process geospatial data in parallel.
In the third experiment, the result of the land coverage changes for Fuxian Lake from 1994 to 2014 is depicted in the cross-tabulation matrices (Table 4). The table quantitatively depicts how the land coverage classes in Fuxian Lake shifted from 1994 to 2014. For example, 34.1% of the garden area in 1994 was converted to cultivated land in 2014. The run-time for calculating the changes to land coverage in Fuxian Lake from 1994 to 2014 (Figure 13) shows that the execution time for a single node was 3181 seconds, whereas the 5- and 10-node clusters were executed in 325 and 221 seconds, respectively. The single node takes much longer to perform the analysis than the Hadoop cluster, because the limited memory size and CPU resources become a bottleneck when conducting complex analysis on a large set of data. This demonstrates that scalable computing resources are necessary to execute complex statistical research in a reasonable time.

5. Conclusions

With the increase in the size and complexity of spatiotemporal data, traditional processing systems are unable to meet the real-time requirement of efficiently mining information from Big Data due to data- and computing-intensive factors. A high performance, statistical analysis system (Geostatistics-Hadoop) is proposed to provide on-demand computing and storage resources and to parallelize spatiotemporal analysis with MapReduce and Oozie-based workflow platforms. Specifically, the research offers the following:
  • A methodology integrating GIS tools with the Hadoop ecosystem to enable spatiotemporal data processing and geospatial analysis in parallel to address the computing-intensive issues in geospatial data processing of big data;
  • A methodology providing Hadoop-based workflow services capable of being customized, shared and executed concurrently to simplify the data analytic process;
  • A system built on the virtual environment of a cloud platform and a Hadoop cluster that leverages the cloud platform to rapidly provide on-demand computing and storage resources.
This new methodology opens new avenues for research, and three initiatives are offered:
  • More complicated spatiotemporal statistical analytical services (e.g., Kriging, SVM, Markov chain, and land use classification) based on MapReduce and a spatiotemporal cloud platform to meet near real-time demands by China’s national geographic condition monitoring; and
  • I/O middleware for the raster data stored in HDFS or other cloud storage systems, and raster data processing and analysis algorithms; and
  • Based on these complicated analytical tools, the development of a geospatial real-time monitoring and simulation system to facilitate public decision-making.
  • Based on the pros and cons of a single-node computing paradigm and the Hadoop cluster computing paradigm, a computing scheduling strategy will be designed for different kinds of computing jobs by considering both the run-time and cost.

Acknowledgments

The authors acknowledge Mr. Wenhua LI’s assistance with calculating the area of polygons and valuable discussions. Dr. Shihua LI provided the geographical conditions data for Ruili. The authors appreciate Sen Yang’s assistance with the experiments. This research is supported by the National Natural Science Foundation of China (41661086).

Author Contributions

Baoxuan Jin proposed the original research idea. Weiwei Song, Kang Zhao, and Xiaoyan Wei performed the experiments. Boxuan Jin and Weiwei Song analyzed the data. Fei Hu and Yongyao Jiang provided substantial feedback on system development and improvement. Baoxuan Jin, Fei Hu, and Yongyao Jiang wrote the paper. Kang Zhao and Xiaoyan Wei revised the paper.

Conflicts of Interest

The authors declare no conflict of interest.

References

  1. Keller, M.; Schimel, D.S.; Hargrove, W.W.; Hoffman, F.M. A continental strategy for the National Ecological Observatory Network. Front. Ecol. Environ. 2008, 6, 282–284. [Google Scholar] [CrossRef]
  2. Goodman, K.J.; Parker, S.M.; Edmonds, J.W.; Zeglin, L.H. Expanding the scale of aquatic sciences: The role of the National Ecological Observatory Network (NEON). Freshwater Sci. 2015, 34, 377–385. [Google Scholar] [CrossRef]
  3. Findley, J. Geographic analysis and monitoring at the United States Geological Survey. Cartogr. Geogr. Inform. Sci. 2003, 30, 203–210. [Google Scholar] [CrossRef]
  4. Yang, C.; Wu, H.; Huang, Q.; Li, Z.; Li, J. Using spatial principles to optimize distributed computing for enabling the physical science discoveries. Proc. Natl. Acad. Sci. USA 2011, 108, 5498–5503. [Google Scholar] [CrossRef] [PubMed]
  5. Yang, C.; Sun, M.; Liu, K.; Huang, Q.; Li, Z.; Gui, Z.; Jiang, Y.; Xia, J.; Yu, M.; Xu, C.; et al. Contemporary computing technologies for processing big spatiotemporal data. In Space-Time Integration in Geography and GIScience; Springer: Berlin, Germany, 2014; pp. 327–351. [Google Scholar]
  6. Getis, A.; Ord, J.K. Local spatial statistics: An overview. In Spatial Analysis: Modelling in a GIS Environment; John Wiley and Sons: New York, NY, USA, 1996. [Google Scholar]
  7. Ripley, B.D. Spatial Statistics; John Wiley & Sons: New York, NY, USA, 2005; Volume 575. [Google Scholar]
  8. Dolores Ugarte, M. Statistical Methods for Spatio-Temporal Systems. J. R. Stat. Soc. Series A 2007. [Google Scholar] [CrossRef]
  9. Cressie, N.; Wikle, C.K. Statistics for Spatio-Temporal Data; John Wiley and Sons: New York, NY, USA, 2011. [Google Scholar]
  10. Kaihatu, J.M.; Handler, R.A.; Marmorino, G.O.; Shay, L.K. Empirical Orthogonal Function Analysis of Ocean Surface Currents Using Complex and Real-Vector Methods. J. Atmos. Ocean. Technol. 1998, 15, 927–941. [Google Scholar] [CrossRef]
  11. Yang, X.; Zheng, X.Q.; Lv, L.N. A spatiotemporal model of land use change based on ant colony optimization, Markov chain and cellular automata. Ecol. Model. 2012, 233, 11–19. [Google Scholar] [CrossRef]
  12. Miller, S.M.; Luark, R.D. Spatial simulation of rock strength properties using a Markov-Bayes method. Int. J. Rock Mech. Min. Sci. Geomech. Abstr. 1993, 30, 1631–1637. [Google Scholar] [CrossRef]
  13. Kyriakidis, P.C.; Journel, A.G. Geostatistical space—time models: A review. Math. Geol. 1999, 31, 651–684. [Google Scholar] [CrossRef]
  14. Li, S.H.; Jin, B.X.; Wei, X.Y.; Jiang, Y.Y.; Wang, J.L. Using Ca-Markov Model to Model the spatiotemporal change of land use/cover in Fuxian Lake for decision support. ISPRS Ann. Photogramm. Remote Sens. Spat. Inf. Sci. 2015, II-4/W2, 163–168. [Google Scholar] [CrossRef]
  15. Ji, C.; Li, Y.; Qiu, W.; Awada, U.; Li, K. Big data processing in cloud computing environments. In Proceedings of the 2012 12th International Symposium on Pervasive Systems, Algorithms and Networks, Washington, DC, USA, 13–15 December 2012; pp. 17–23. [Google Scholar]
  16. Yang, C.; Huang, Q. Spatial Cloud Computing: A Practical Approach; CRC Press: Boca Raton, FL, USA, 2013. [Google Scholar]
  17. Mell, P.; Grance, T. The NIST Definition of Cloud Computing. 2011. Available online: http://nvlpubs.nist.gov/nistpubs/Legacy/SP/nistspecialpublication800-145.pdf (accessed on 28 September 2016).
  18. Huang, Q.; Xia, J.; Yang, C.; Liu, K.; Li, J.; Gui, Z.; Hassan, M.; Chen, S. An experimental study of open-source cloud platforms for dust storm forecasting. In Proceedings of the 20th International Conference on Advances in Geographic Information Systems, Redondo Beach, CA, USA, 6–9 November 2012; pp. 534–537. [Google Scholar]
  19. Liu, Y.; Sun, A.Y.; Nelson, K.; Hipke, W.E. Cloud computing for integrated stochastic groundwater uncertainty analysis. Int.J. Digit. Earth 2013, 6, 313–337. [Google Scholar] [CrossRef]
  20. Sun, A. Enabling collaborative decision-making in watershed management using cloud-computing services. Environ. Model. Softw. 2013, 41, 93–97. [Google Scholar] [CrossRef]
  21. Yang, C.; Xu, Y.; Nebert, D. Redefining the possibility of digital Earth and geosciences with spatial cloud computing. Int. J. Digit. Earth 2013, 6, 297–312. [Google Scholar] [CrossRef]
  22. Ghoting, A.; Krishnamurthy, R.; Pednault, E.; Reinwald, B.; Sindhwani, V.; Tatikonda, S.; Tian, Y.; Vaithyanathan, S. SystemML: Declarative machine learning on MapReduce. In Proceedings of the 2011 IEEE 27th International Conference on Data Engineering, Hannover, Germany, 11–16 April 2011; pp. 231–242. [Google Scholar]
  23. Eldawy, A.; Mokbel, M.F. Spatialhadoop: A mapreduce framework for spatial data. In Proceedings of the 2015 IEEE 31st International Conference on Data Engineering, Seoul, Korea, 13–17 April 2015; pp. 1352–1363. [Google Scholar]
  24. Aji, A.; Wang, F.; Vo, H.; Lee, R.; Liu, Q.; Zhang, X.; Saltz, J. Hadoop GIS: a high performance spatial data warehousing system over mapreduce. In Proceedings of the VLDB Endowment, Riva del Garda, Italy, 26–30 August 2013; pp. 1009–1020. [Google Scholar]
Figure 1. Geostatistics-Hadoop system architecture.
Ijgi 06 00165 g001
Figure 2. Statistics analysis workflow.
Ijgi 06 00165 g002
Figure 3. An example of GeoJSON.
Ijgi 06 00165 g003
Figure 4. Algorithm to calculate the distribution of facilities.
Ijgi 06 00165 g004
Figure 5. Algorithm to calculate the area of different land use types in parallel.
Ijgi 06 00165 g005
Figure 6. Algorithm to calculate the lengths of different land use types in parallel.
Ijgi 06 00165 g006
Figure 7. The graphical user interface for the workflow system.
Ijgi 06 00165 g007
Figure 8. The graphical user interface to monitor workflow status.
Ijgi 06 00165 g008
Figure 9. Experimental data for Ruili city in Yunnan province: (a) DEM; (b) elevation zone polygon; (c) counties polygon; (d) facility point; (e) road polyline; and (f) land cover polygon.
Ijgi 06 00165 g009
Figure 10. Second set of experimental data for the land cover of Fuxian Lake in Yunnan province.
Ijgi 06 00165 g010
Figure 11. Performance comparison for a PC 5-node cluster and 10-node cluster: (a) number of facilities in different counties; (b) number of facilities at different elevations; (c) land coverage in different counties; (d) land coverage in different slope zones; (e) land coverage at different elevations; (f) road length in different counties; (g) road length at different elevations; and (h) road length in different slope zones. The X-axis is data size or the number of geographic objects processed in the experiment. The Y-axis is the run-time in seconds.
Ijgi 06 00165 g011aIjgi 06 00165 g011b
Figure 12. Run-time for computing multiple parameters with a PC, and 5- and 10-node clusters.
Ijgi 06 00165 g012
Figure 13. Run-time for calculating the land coverage change in Fuxian Lake from 1994 to 2014.
Ijgi 06 00165 g013
Table 1. Experiment data.
Statistical ObjectStatistical UnitStatistical IndexData Volume (Number of Geometry)
Land covercountyarea39387 (2.6 MB)
elevation zonearea
slope zonearea
Roadcountylength588 (0.26 MB)
elevation zonelength
slope zonelength
Facility/residentcountynumber600 (0.07 MB)
Table 2. Experimental configuration for statistical analysis system.
NumberConfigurationClusterYarn RolesHDFS Roles
1CPU 3.2GHz 24 coreHadoop2.5resource manager, node managerNamenode, Datanode
RAM 128GB;
DISK 6TB
2CPU 3.2GHz 24 coreHadoop2.5node managerSecondary Namenode, Datanode
RAM 128GB;
DISK 6TB
3CPU 3.2GHz 24 coreHadoop2.5node managerDatanode
RAM 128GB;
DISK 6TB
Table 3. The machine in the baseline experiment.
SystemCPUDiskRAMSoftware
Windows 8.1 Enterprise x64CPU 3.2GHz 24 coreSSD 2 TB SATA 20TB128 GBArcGIS 10.1; Python 2.6
Table 4. Cross tabulation of land coverage changes in Fuxian Lake from 1994 to 2014.
2014DevelopedCultivatedCommercialResidentialForestWaterFarm AreasGrasslandRoad
1994Area(m2)Ratio(%)Area(m2)Ratio(%)Area(m2)Ratio(%)Area(m2)Ratio(%)Area(m2)Ratio(%)Area(m2)Ratio(%)Area(m2)Ratio(%)Area(m2)Ratio(%)Area(m2)Ratio(%)
Developed8.37 × 10857.2100.001.19 × 1088.113.90 × 1072.6700.004.32 × 1072.951.28 × 1088.732.98 × 10820.3300.00
Cultivated00.002.62 × 10865.0200.0000.0000.0000.001.37 × 10834.063.71 × 1060.9200.00
Commercial00.0000.001.49 × 108100.0000.0000.0000.0000.0000.0000.00
Residential00.0000.0000.001.94 × 108100.0000.0000.0000.0000.0000.00
Forest00.0000.009.79 × 1060.0500.001.91 × 101094.641.62 × 1080.801.50 × 1080.745.88 × 1082.911.73 × 1080.86
Water00.0000.003.32 × 1050.1800.005.07 × 1062.828.83 × 10749.125.53 × 1063.088.06 × 10744.8000.00
Farm areas00.0000.003.57 × 1070.434.47 × 1070.535.42 × 1070.651.42 × 1081.706.86 × 10981.841.18 × 10914.036.99 × 1070.83
Grassland00.0000.007.10 × 1060.2800.001.60 × 1070.622.05 × 1060.081.03 × 1084.042.42 × 10994.471.29 × 1070.50
Road00.0000.0000.0000.0000.0000.0000.0000.002.50 × 108100.00

