Article

Spatial Variation Relationship between Floating Population and Residential Burglary: A Case Study from ZG, China

1
Center of Integrated Geographic Information Analysis, School of Geography and Planning, Sun Yat-sen University, Guangzhou 510275, China
2
Department of Geography, University of Cincinnati, Cincinnati, OH 45221-0131, USA
*
Author to whom correspondence should be addressed.
ISPRS Int. J. Geo-Inf. 2017, 6(8), 246; https://0-doi-org.brum.beds.ac.uk/10.3390/ijgi6080246
Submission received: 5 July 2017 / Revised: 3 August 2017 / Accepted: 3 August 2017 / Published: 12 August 2017

Abstract

:
With the rapid development of China’s economy, the demand for labor in the coastal cities continues to grow. Due to restrictions imposed by China’s household registration system, a large number of floating populations have subsequently appeared. The relationship between floating populations and crime, however, is not well understood. This paper investigates the impact of a floating population on residential burglary on a fine spatial scale. The floating population was divided into the floating population from other provinces (FPFOP) and the floating population from the same province as ZG city (FPFSP), because of the high heterogeneity. Univariate spatial patterns in residential burglary and the floating population in ZG were explored using Moran’s I and LISA (local indicators of spatial association) models. Furthermore, a geographically weighted Poisson regression model, which addressed the spatial effects in the data, was employed to explore the relationship between the floating population and residential burglary. The results revealed that the impact of the floating population on residential burglary is complex. The floating population from the same province did not have a significant impact on residential burglary in most parts of the city, while the floating population from other provinces had a significantly positive impact on residential burglary in most of the study areas and the magnitude of this impact varied across the study area.

1. Introduction

The household registration system was established in China in the 1950s to facilitate population management. Each person is registered at their birthplace and the individual’s household registration status is also defined in terms of residence place. People can only live and work in the place where their household was registered before 1980. In the past four decades, with the rapid development of China’s economy since the reform and opening-up policies, the economic disparity between urban and rural areas has increased. In order to find better jobs and earn higher incomes, a large number of people have been pouring into the coastal cities from inland areas. However, the change of household registration from one place to another remains officially difficult. As a result, many people who work and live in a city do not have local household registration there; these people are said to comprise the floating population [1,2]. By 2015, official statistics reported that the floating population had grown to about 247 million, accounting for around 18 percent of the total Chinese population [3].
This floating population has become an essential part of urbanization process and plays an important role in contemporary China. It has therefore attracted significant research. Some studies have focused on the relationship between the floating population and disease spread [4,5,6]. Others have investigated determinants of the settlement intentions of floating populations [7,8,9,10]. The changing patterns in the floating population were also examined [11,12]. The large floating population also creates enormous challenges for social services and public security administration [13,14]. From a theoretical perspective, a concentration of the floating population in a certain place is likely to lead to physical and social disorder, which may increase the incidence of crimes such as residential burglary. This is discussed in more detail in the next section. At the same time, the crime rate has risen sharply in China over the period in question. The total number of crimes committed rose from 500 thousand in the early 1980s to nearly 7.2 million by the end of 2015 [15]. Therefore, the general public attributes this rise in crime to the floating population, but little empirical evidence has hitherto been produced to support this alleged relationship.
Though a few studies have been conducted on the relationship between floating population growth and crime in recent years, their results are inconclusive. Some scholars found that the crime rates increased with the growth of the floating population. Based on data published by the Administrator of Public Security, which showed a large proportion of offenders arrested by the police are part of the floating population, they concluded that the floating population has a positive impact on crime rates [13,14]. Other researchers, however, argued that these assertions are demonstrably biased [16]. The existing research has also focused on the overall crime rate, rather than separating crimes by type [17,18], and has tended to be based simply on questionnaires or field surveys, due to limited access to official crime data in China [19,20]. Recently, with increased data disclosure, researchers have begun to use more accurate data for crime analysis, such as crime data provided by the Public Security Bureau [21]. However, there remains inadequate geographic research focused on the spatial relationship between the floating population and crime.
In addition, the social integration of immigrants was proved to have an impact on crime [22,23]. Social exclusion will be reduced if immigrants are well integrated into the local community, which may improve the community’s safety. China has a vast territory, and people in different provinces vary greatly in culture, religion, linguistic backgrounds, and so on, while people from the same province tend to be similar in these respects. Therefore, the impact of the floating population from the same province might be different from that of the floating population from other provinces. It is therefore necessary to separate the floating population by origin. This research was carried out to fill the above-mentioned research shortfall by answering the following questions:
(1)
Does concentration of the floating population lead to higher levels of crime?
(2)
Do floating populations with different origins have different impacts on crime?
(3)
Does the relationship between crime and the floating population vary, or is it consistent across the space?
This research contributes to the current literature in two respects. Firstly, the impact of the floating population on residential burglary was analyzed on a fine spatial scale, allowing us to investigate whether the effects vary across the space. Secondly, the floating population was divided into two categories: floating population from the same province and floating population from other provinces.

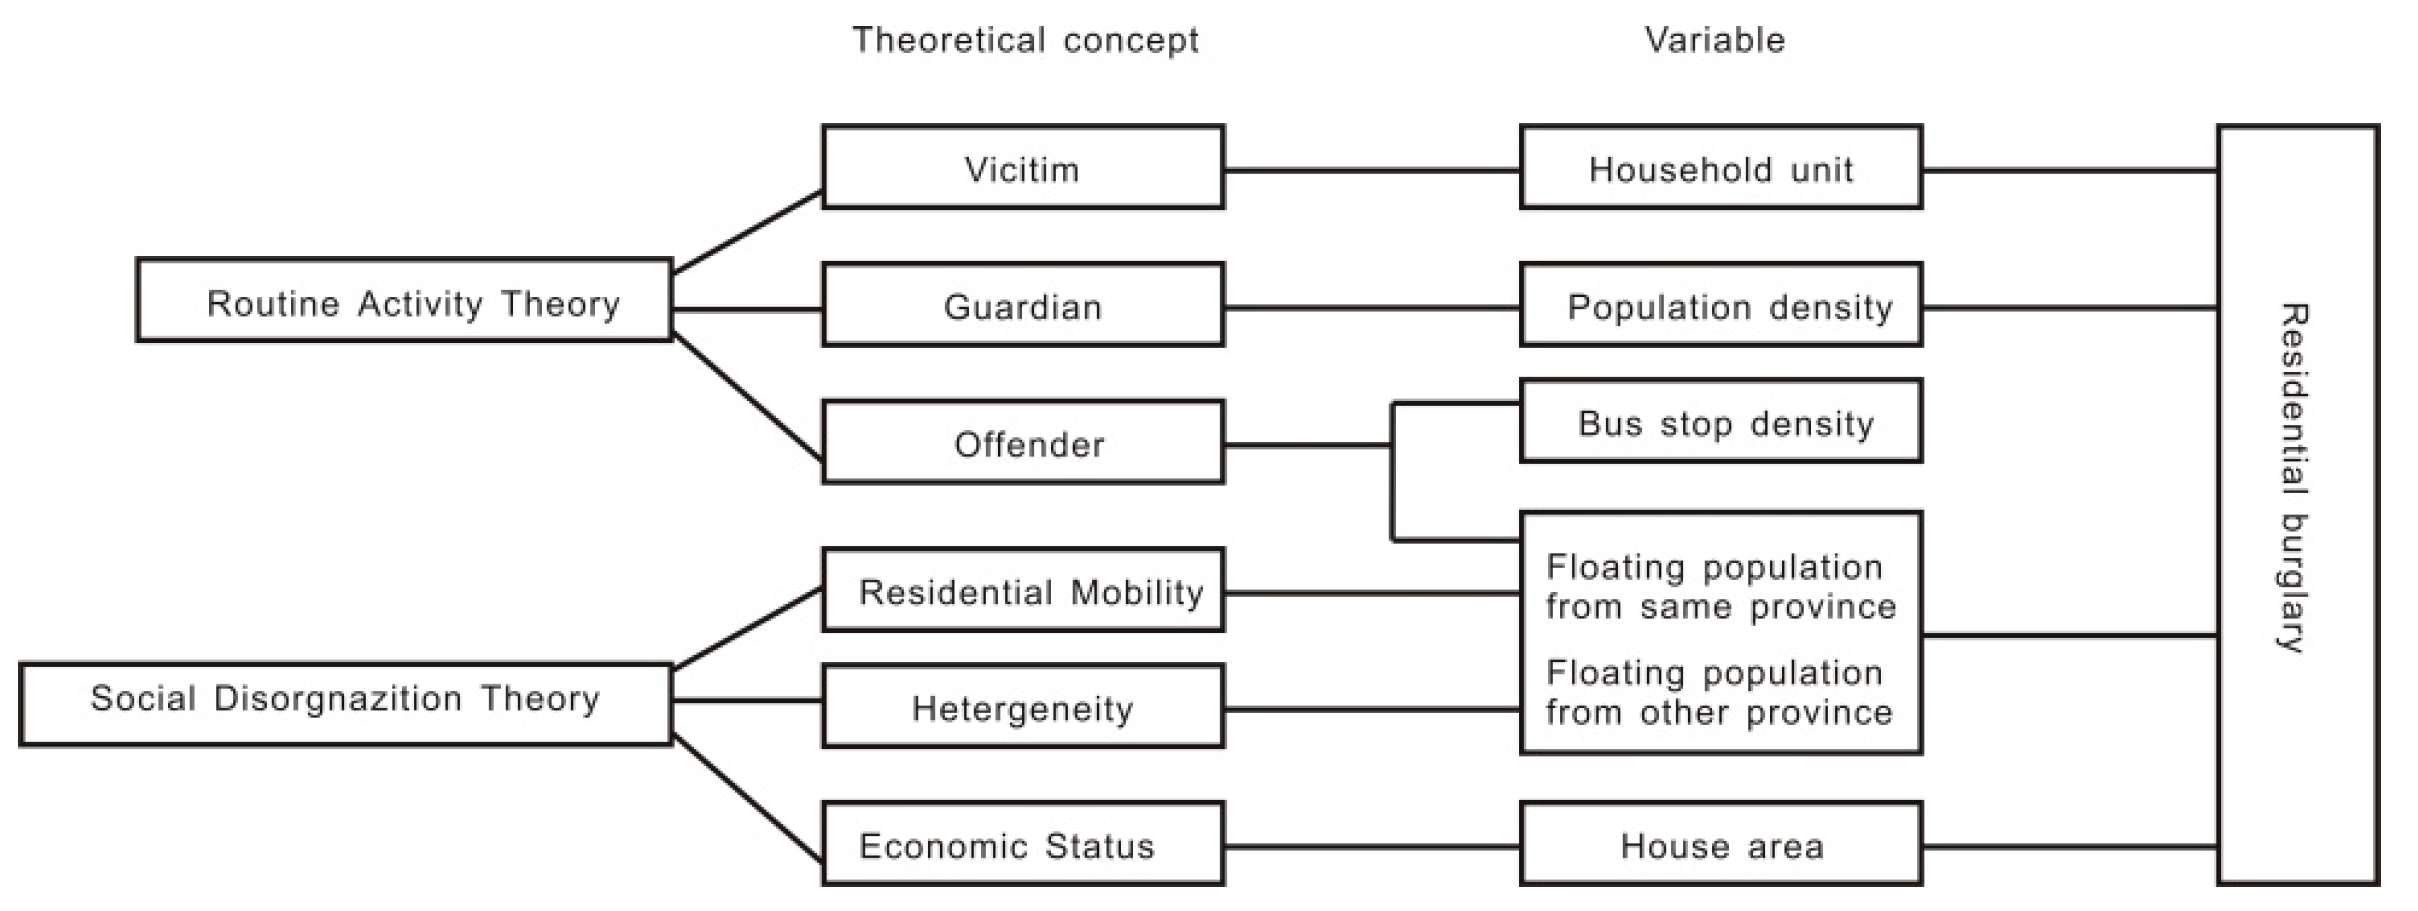
2. Theoretical Foundations of the Association between Floating Population and Crime

Whether a person has local household registration is important in China. For example, as many job opportunities are only available to local residents, most members of the floating population cannot find their ideal job. More often than not, the floating population is engaged in labor-intensive jobs with low wages. Furthermore, many aspects of social welfare and security are closely related to household registration, such as education, housing, and medical care—only people with local household registration can enjoy these rights. In addition to disadvantages in these respects, the floating population are far from the emotional stability of home, tend to have little money, and be frequently moving. Therefore, the impact of the floating population on crime rates can be explained by two criminology theories: social disorganization theory and routine activity theory.
According to the social disorganization theory, informal social control is important for a neighborhood to prevent crime, which includes controls on residential mobility, ethnic heterogeneity, and economic status [24]. The mobility of the floating population is higher than that of the local residents. A community with a large floating population will have many people moving in and out. It is difficult for people who have lived in such a community to know each other, which is very important for informal social control. In addition, people from different places speaking different dialects usually do not have a cohesive culture. The cultural heterogeneity among floating population will introduce fear and mistrust. Therefore, the floating population will have a greater impact on residential burglary offenses.
In the routine activity theory, crime is said to occur often in places where suitable targets and motivated offenders come together at the same time, without capable guardians [25]. The lack of guardianship may lead to occurrence of crime. The guardians could be divided into two categories: formal and informal. The formal guardians are police officers or security guards, while the informal ones include, for example, people walking on the street, or homeowners monitoring their houses [26]. According to this framework, the floating population would increase crime in different ways. For example, most of the floating population live in rental properties, so they do not want to spend as much time and money improving their homes as they might if they were homeowners.

3. Data and Method

3.1. Study Area

This study was carried out in a large metropolitan city on the southeastern coast of China. For confidentiality reasons, we will refer to it as ZG city. ZG has been the frontier of China’s economic reform since 1978. With the rapid development of industry and commerce, ZG city has attracted a large floating population. ZG has a total population of over 13 million, with a floating population almost 5 million in 2015, or 36.7% of the total population [27]. This makes it one of the five largest floating populations among Chinese cities. Along with rapid economic growth and this increase in floating population, the crime rate in ZG is rising sharply. Residential burglary is the largest crime type in ZG, as in country at large [27].

3.2. Data

3.2.1. Spatial Analysis Unit

Many different scales for spatial units have been used for crime analysis, such as census tracts and block groups. The police station is the most basic security management unit in China. Each police station has its own jurisdiction, called the Police Station Management Area (PSMA). Compared with census tracts or other spatial units, PSMAs are superior insofar as they are more easily integrated with crime prevention and control. Therefore, PSMA was selected as the spatial unit for analysis in this study. There are 226 PSMAs in ZG city, but eleven of them were excluded from further analysis because they cover tourist areas with no residents living in them. These excluded PSMAs are located on the periphery of the city and therefore do not have much impact on the analysis. The area covered by each PSMA varies from 0.5 km2 to 463.5 km2.

3.2.2. Crime Data

The residential burglary data from 2013 to 2015 were obtained from ZG Municipal Public Security Bureau. Three years of data were used to mitigate fluctuations in burglary rates between years. A total of 150,113 cases were recorded during the study period. All the incidents were aggregated by PSMA. The burglary count in each PSMA varied from 9 to 3547.

3.2.3. Floating Population Data

The focus of this research was to investigate the impact of floating population on residential burglary. In the census data, the floating population was divided into two categories on the basis of origin. The first is comprised of members of the floating population from other provinces (FPFOP) and the other from members from the same province (FPFSP). The spatial distributions of each floating population are presented in Figure 1.

3.2.4. Control Variables

Previous studies have proved an association between neighborhood socio-demographic characteristics and burglary [28,29,30]. Therefore, we had to inevitably account for these characteristics when analyzing a possible linkage between burglary and floating population. Four variables were incorporated in this study, according to the above-mentioned criminology theories and literature, including total number of housing units, bus stop density, population density, and housing area.
Bus stop density was considered as a proxy for transit accessibility and was calculated as the number of bus stops divided by the neighborhood area. According to the environmental criminology theory, increased convenience of public transportation leads to more human activity, thus enhancing informal surveillance and reducing crime [31].
Population density was estimated by dividing the total number of residents in a neighborhood by its area. From the routine activity theory perspective, higher population density means more street monitors to reduce residential crime, as has been confirmed by some studies [32]. Other researchers, however, have found a positive association between residential crime and population density [33,34].
The greater the number of housing units, the more burglary targets available. Some research has confirmed that areas with larger numbers of housing units are likely to have more residential offenses [35,36]. To measure the attractiveness of a particular target (housing unit), area of the unit was used as a metric; theoretically, larger households are more attractive to potential offenders. The percentage of housing units equal to or greater than 120 m2 in area was used as an explanatory variable. Figure 2 presents the conceptual framework of our model development.

3.3. Statistical Model Design

LISA (local indicators of spatial association) is a local statistical method proposed by Anselin [37]. This method can indicate hot or cold spots by mapping the locations of spatial autocorrelation and has been used in many areas, including disease analysis [38,39], traffic crash analysis [40,41], and crime analysis [42,43,44]. Therefore, we employed the LISA model to identify crime hot spots in this research.
According to the First Law of Geography, everything is related to everything else, but near things are more related to one another [45]. Due to an uneven distribution of the factors which influence burglary, such as population dynamics and income inequity, burglary is spatially concentrated. Traditional crime analysis approaches such as the negative binominal model (NB) do not account for spatial autocorrelation in spatial data such as crime data. Neglect of spatial dependence leads to bias in statistical result and incorrect inferences [46]. Spatial eigenvector filtering regression models have been introduced to address spatial autocorrelation issues in crime analysis [47].
Both the NB model and the spatial eigenvector filtering regression models belong to the global model. The relationship between dependent and explanatory variables is assumed to be constant across the study area in these models. However, this may not be true: The impact of explanatory variables on residential burglary might not be stationary across the area. The spatial variation of this relationship is referred as spatial heterogeneity [48]. For example, Zhang and McCord found that the relationship between foreclosures and residential burglary varies over space [36]. Geographically weighted regression (GWR) is a modeling technique proposed by Fotheringham et al. [49] which allows some or all regression parameters to vary spatially, and can be used to address this issue. Recent studies have demonstrated the applicability of the GWR model to the varying relationship between crime and related factors [50,51,52,53]. Geographically weighted Poisson regression (GWPR) is an extension of GWR for count data which takes the following form:
Y i ~ Poisson ( λ i )
ln ( λ i ) = β 0 ( u i , v i ) + β 1 ( u i , v i ) ln ( POP i ) + k = 2 p β k ( u i , v i ) X ik
where, for the ith PSMA, Y i is the total number of residential burglaries, λ i is the expected number of incidents, ( u i , v i ) is the centroid, POP i is the residential population, and the β k ( u i , v i ) are the regression coefficients. β k ( u i , v i ) is estimated by observations in surrounding PSMAs, the magnitude of the impact on ith PSMA is determined by the distance between the surrounding PSMAs and the focal PSMA. In this study, the bi-square kernel density function was employed as the spatial weight scheme:
w ij = { ( 1 ( d ij b i ) 2 ) 2   if   d ij < b i 0   otherwise
where d ij is the distance between the i th and j th PSMA and b i is the bandwidth selected using the AIC criterion.

4. Results

The distributions of residential burglary and floating population in space are not uniform (Figure 1 and Figure 3). Both are concentrated in the suburban areas in the north and south of ZG city. These spatial patterns indicate that PSMAs with greater floating population tend to have more burglaries, especially when considering floating population from other provinces. The descriptive statistics of the variables used in this study are presented in Table 1. The large ranges between the maximum and the minimum values demonstrate the uneven distribution of residential burglaries and floating population.

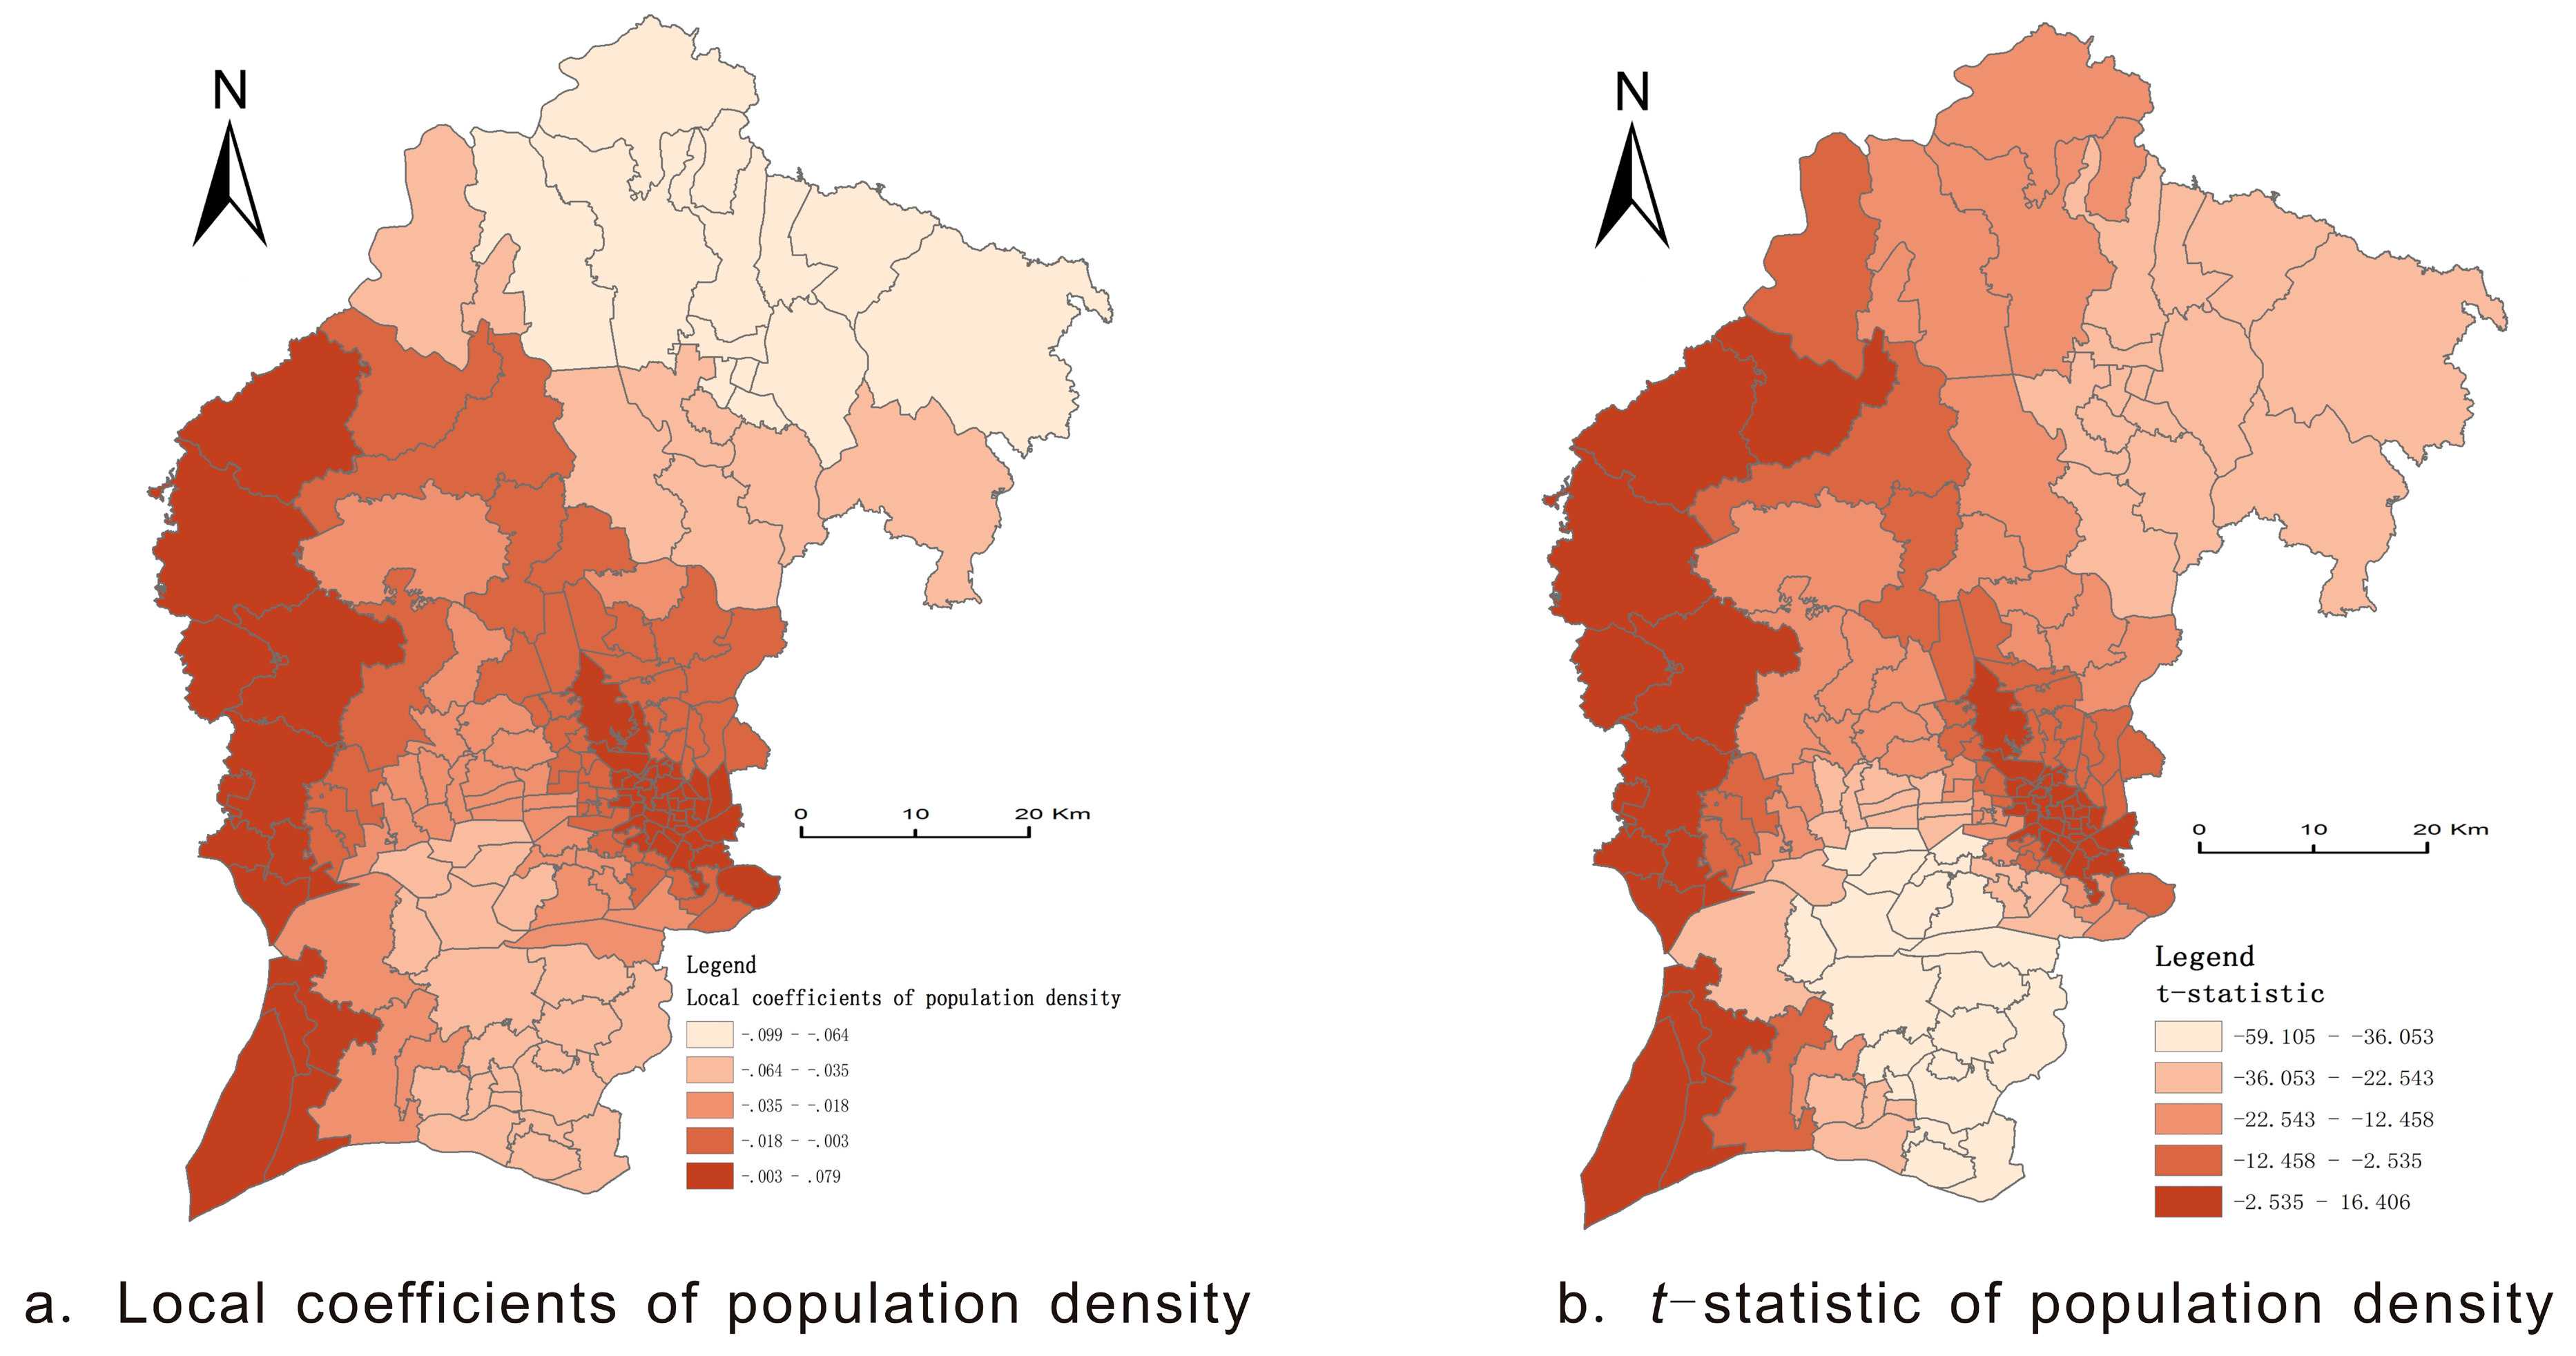
4.1. Results of Spatial Analysis

The spatial patterns of burglary and related factors were examined by Moran’s I test and the local indicator spatial association (LISA) test. The results of Moran’s I test for residential burglaries and floating population from other provinces (Moran’s I value is 0.425 and 0.452, and p-value is 0.000 and 0.000 respectively) indicate that burglary and FPFOP are significantly positively correlated in ZG.
Furthermore, the LISA test was employed to identify the local clusters, as in previous studies [47,48]. Four main clusters of residential burglary were identified and presented in Figure 4. Two of them are hot spots (High-High) and the other two are cold spots (Low-Low). The hot spots are located in the northern and southern fringes of the city center, where a large number of burglaries in a given neighborhood are accompanied by large number of burglaries in nearby neighborhoods. One cold spot is located in the center of the city and the other is located in the outer suburbs in northern part of the city.
In order to avoid multicollinearity in further regression analysis, the bivariate correlations between explanatory variables were tested and the results are presented in Table 2. All the correlation coefficients are below 0.7, which indicates that there are no strong correlations between independent variables. The variance inflation factor (VIF) values were also investigated and results showed that the VIF value varies from 1.426 to 3.077 (VIF value less than 5 is considered acceptable), which indicates that the multicollinearity is not a problem in this study. The population density, bus stop density, household unit, floating population from the same province, and floating population from other provinces showed a positive impact on residential burglary, while housing area was negatively correlated with residential burglary.

4.2. Regression Analysis Results

The global model (a negative binominal model) was estimated to first explore the relationship between floating population and residential burglary. The second column in Table 3 presents the results of the NB model, including the regression coefficients and metrics for goodness of model fit. The negative binominal (NB) model explained 72% of the variance in residential burglary. The sign of the regression coefficients showed an intuitive relationship between floating population and residential burglary. The floating population from other provinces (FPFOP) has a significantly positive impact on residential burglary. The floating population from the same province (FPFSP) has a positive influence but it is not statistically significant. Among the four control variables used in this study, the housing area and bus stop density are statistically and positively significant. The increase of population density is significantly associated with a decrease in burglary. The Moran’s I for the NB model residual is 0.234 (p = 0.000), which indicates that spatial autocorrelation exists in the model, and therefore a spatial model should be employed. We conducted further analysis using the GWPR model.
The results of the GWPR model are listed in the third column of Table 3. The performances of the above two models were compared using mean absolute deviance (MAD) and R d 2 . R d 2 is the non-linear counterpart of R 2 in ordinary least squares (OLS), and was proposed by Carmeron and Windmeijer [54] for evaluating model fit. The decrease in MAD from 259.339 (for NB) to 145.273 (for GWPR) suggests an improvement of model fit for the spatial models. The increase in R d 2 from 0.721 (for NB) to 0.907 (for GWPR) also indicates an improvement. Figure 5 plots the residual value of the two models, and reveals that the residual value is reduced for almost all the PSMAs. More importantly, Moran’s I test for the residual of GWPR is insignificant, which confirms the spatial dependence was mitigated, or even eliminated, by the spatial model.
It is important to identify whether a coefficient is local or global when using the GWR approach. Fotheringham et al. [49] proposed a method to test the degree of spatial non-stationarity within a relationship. Firstly, the ranges of the local coefficients are estimated with a confidence interval around the global estimate of the equivalent parameter. Then the range of values of the local coefficients between the lower and upper quartiles is compared with the range of values at ±1 standard deviations of the global coefficients. If the range of the former is greater than the latter, the relationship might be non-stationary. As presented in Table 4, the local variation in FPFSP and households with housing area equal to or greater than 120 m2 do not show obvious spatial non-stationarity, whereas the other explanatory variables do. A further investigation was carried out to examine the significance of the spatial variability in the local coefficient estimate using the chi-squared test. As Nakaya [55] stated, a positive “DIFF of Criterion” indicates that there is no spatial variability in the relationship. The results of the chi-squared test are presented in Table 5 and it is revealed that all variables are significantly spatial non-stationary.
The local coefficients for FPFOP are positive in all of the PSMAs but the intensity of the relationship is not constant across the space. The distribution of coefficients for FPFOP over all PSMAs is presented in Figure 6a. The coefficient values range from 0.007 to 0.065. All the coefficients are positive, suggesting that the FPFOP has a positive impact on the number of residential burglaries in a given PSMA. The local t-statistics for the coefficients are also estimated to evaluate their significance. As shown in Figure 6b, all the coefficients for FPFOP are significant using a 95% confidence level. The PSMAs demonstrating a positive and strong impact of FPFOP on residential burglary are located in the center of the city. The effect of the FPFOP on residential burglary in these areas is higher than in other PSMAs, which means that appropriate strategies related to the FPFOP should be carried out to enhance community safety.
The distribution map for coefficients for FPFSP illustrate that FPFSP has a positive impact on residential burglary in the south, east, and southeast of the city (Figure 7a), which accounts for only 37 percent of the total PSMAs. Figure 7b presents the results of the local t-statistics for FPFSP. Of the PSMAs where FPFSP has a positive relationship with residential burglary, 60 percent are significant at a 95% confidence level.
The local coefficients for bus stop density in most parts of the study area are significantly positive. Similar findings have been reported in previous studies [52,56]. As Figure 8a shows, the PSMAs where bus stop density has stronger effects on residential burglary are located in the northern and southern outer suburbs of the city. PSMAs where the relationship between bus stop density and residential burglary are weaker and positive lie in the center of the city. Public transport is the main mode of transportation for urban residents in China. In the suburbs of the city, offenders usually travel by public transport, whether arriving at or leaving the crime scene. Public buses are the primary mode of public transit in ZG, especially in the suburbs. However, in the city center, there are other means of transportation available, such as the subway or bicycles. It is therefore not surprising that bus stop density has greater impact in the outer suburbs than in the city center.
Across the studied area, about 72 percent of the PSMAs suggest a negative relationship between population density and residential burglary, which means that an increase in population is expected to result in decreased residential burglary. This finding has been reported in some studies [57,58]. According to the routine activity theory, residents lived in a community can be regarded as informal security, which reduces crime. It should be noted that population density has positive impact in a few PSMAs in the west of the city (Figure 9). In less populated areas, it is easier for criminals to choose an appropriate target in more densely populated subareas [59].

5. Discussion

The primary goal of this study was to examine the impact of the floating population size on residential burglary numbers. The floating population was classified into two categories: Floating population from other provinces (FPFOP) and floating population from the same province as the study area (FPFSP). Two models were used to model the relationship between the floating population and residential burglary. The results revealed that the GWPR model fits the data better by addressing its spatial heterogeneity. Both the FPFSP and the FPFOP have a significant impact on residential burglary numbers, but there are differences in these effects.
Firstly, the FPFOP has an absolutely positive impact on residential burglary across the study area, while the sign of the coefficients for FPFSP varies from negative to positive. The influences of FPFOP in all the PSMAs are significant but only a few PSMAs show a significant influence of FPFSP. The proportion of people from the same province with relatives and friends in ZG will be much higher for those from other provinces, due to geography relations. Therefore, the FPFSP has more social connections than the FPFOP, which makes it easier, for example, for its members to find employment. Furthermore, elements of the FPFSP usually come to ZG with their family and this is likely to help them build social networks and integrate into the local community quicker. By comparison, members of the FPFOP do not have the same cultural background as people in ZG, including language and religion, which allows fear and mistrust to arise. As a result, the social order of the area dominated by the FPFOP becomes segmented, providing the heterogeneity studied in the theory of social disorganization. The negative impact of heterogeneity on crime is confirmed by several previous studies [60,61,62].
Secondly, the spatial patterns of the impacts of the FPFSP and FPFOP on residential burglary are different. The FPFOP has a greater impact on residential burglary south of the urban center, while the impact of the FPFSP on residential burglary is greater in the south and east of the city. This may be explained by differences in the occupations these populations engage in. The FPFOP is mainly engaged in low-end manufacturing, and the largest textile trade market in Asia is located in the south of the city, with a large number of factories related to the textile industry. The FPFSP, however, is mainly engaged in business, service, and housekeeping, which require greater communication skills—the greater similarity to the local language and culture providing the FPFSP with such an advantage. The traditional city center is located in the east of the city, where many local residents live, and there is a corresponding demand for such workers.
In addition to the above differences, there are similarities in the impact of the floating population on residential burglary rates. High mobility is a key feature of the floating population, regardless of origin. There are two meanings of the term “floating”. One is that they move from rural to urban, and the other is they do not stay in the same place for a long time due to lack of job opportunities. They may work in a different PSMA in ZG with each passing month. Prior researchers have found that higher mobility leads to more crime [63,64]. High heterogeneity and mobility among the floating population make it difficult for them to form strong social networks with one other. Without effective informal social control, the floating population is more likely to commit crimes [65,66].
The inequality derived from the social system is another cause of the floating population committing crime in greater numbers [67,68,69]. The floating population move from the countryside to the city to pursue a higher quality of life, and when they come to the city, they are aware of their disadvantages relative to the local residents. Though they believe they deserve the same treatment as the city dwellers, this is currently difficult to achieve through legitimate means. The floating population may therefore resort to illegal means to achieve their goal.
Broken window theory can also explain the relationship between floating population and crime. In order to save money and reduce commuting time, most of the floating population live in suburban areas with excessive litter, graffiti-covered walls, and other physical signs of disorder. According to theory, this physical disorder will inspire potential offenders to commit crimes. For the residents living in these areas, the physical disorder is an indication that the government cannot control the social order efficiently. This attitude will increase their fear and eventually weaken informal forms social control [70].

6. Conclusions

This study investigated the relationship between the floating population and residential burglary, using crime data from ZG, China. Two models, a negative binominal model and a Geographically Weighted Poisson Regression model, were employed to examine the relationship between floating population and residential burglary, while controlling for some other neighborhood characteristics. It is generally believed that the floating population has a significant positive impact on crime in China, while the reality is more complex. Results from this research reveal that the floating population from other provinces has a significantly positive impact on residential burglary, while the impact of floating population from the same province on burglary varies across the city.
The findings from this study deepen our understanding of the spatially-varying relationship between floating population and residential burglary. The findings can also justify aforementioned theories, including the social disorganization, routine activity, and broken window theories. In addition, this research shows that the spatial effect should be considered as a factor related to crime. Furthermore, the findings of this research have implications for local law enforcement departments. Appropriate policies should be proposed to mitigate crime, according to these relationships between the floating population and residential burglaries. For example, measures should be taken to help the floating population integrate into the local society easily. Corresponding measures should also be taken according to the origin of the floating population.
Although this research seems to explain the relationship between the floating population and residential burglary well, there are still some limitations. Firstly, the model estimated in ZG could not transfer to another city directly since the GWPR model produced a series of local coefficients for each PSMA. Secondly, research based on spatial units would be subjected to the modifiable areal unit problem (MAUP). The size of the research units might have had a significant impact on the results. Limited by the availability of data, this study employed PSMA as the research unit. A sensitivity analysis should be carried out related to the MAUP in the future. Thirdly, the time lag effect between the floating population and residential burglary was not incorporated in this research, which should be considered for future study. Lastly, this research was conducted in a single city of a developing country, which may limit the applicability of its findings. The relationship between floating population and residential burglary may vary among different cities or countries. Future study should pay more attention to the impact of floating population on burglary, or other types of crime, in different countries and cities.

Acknowledgments

This study was supported by a Grant from a Key Program of National Natural Science Foundation of China (Grant No. 41531178), the Natural Science Foundation of Guangdong Province (Grant No. 2014A030312010) and the National Natural Science Foundation for Outstanding Youth (Grant No. 41522104).

Author Contributions

Jianguo Chen and Lin Liu conceived and designed the study, wrote the manuscript. Jianguo Chen, Luzi Xiao and Chao Jiang carried out the experiment and analyzed the results. Suhong Zhou provided key suggestions and helped with writing the manuscript. All authors have read and approved the final manuscript.

Conflicts of Interest

The authors declare no conflicts of interest

References

  1. Goodkind, D.; West, L.A. China’s floating population: Definitions, data and recent findings. Urban Stud. 2002, 39, 2237–2250. [Google Scholar] [CrossRef]
  2. Chen, J.; Guo, F. One decade of urban housing reform in China: Urban housing price dynamics and the role of migration and urbanization, 1995–2005. Habitat Int. 2011, 35, 1–8. [Google Scholar] [CrossRef]
  3. National Bureau of Statistics of China. China Statistical Yearbook; China Statistical Publishing House: Beijing, China, 2016.
  4. Anderson, A.F.; Qingsi, Z.; Hua, X.; Jianfeng, B. China’s floating population and the potential for HIV transmission: A social-behavioural perspective. AIDS Care 2003, 15, 177–185. [Google Scholar] [CrossRef] [PubMed]
  5. Liu, X.; Erasmus, V.; Wu, Q.; Richardus, J.H. Behavioral and psychosocial interventions for HIV prevention in floating populations in China over the past decade: A systematic literature review and meta-analysis. PLoS ONE 2014, 9, e101006. [Google Scholar] [CrossRef] [PubMed] [Green Version]
  6. Jang, J.; Ahn, I. Predicting the infectious disease spread using floating population data in Seoul, South Korea. Int. J. Bio-Sci. Bio-Technol. 2016, 8, 51–60. [Google Scholar] [CrossRef]
  7. Zhu, Y. China’s floating population and their settlement intention in the cities: Beyond the Hukou reform. Habitat Int. 2007, 31, 65–76. [Google Scholar] [CrossRef]
  8. Tang, S.; Feng, J. Understanding the settlement intentions of the floating population in the cities of Jiangsu Province, China. Asian Pac. Migr. J. 2012, 21, 509–532. [Google Scholar] [CrossRef]
  9. Gu, P.; Ma, X. Investigation and analysis of a floating population’s settlement intention and environmental concerns: A case study in the Shawan River Basin in Shenzhen, China. Habitat Int. 2013, 39, 170–178. [Google Scholar] [CrossRef]
  10. Tan, S.; Li, Y.; Song, Y.; Luo, X.; Zhou, M.; Zhang, L.; Kuang, B. Influence factors on settlement intention for floating population in urban area: A China study. Qual. Quant. 2017, 51, 147–176. [Google Scholar] [CrossRef]
  11. Liang, Z.; Li, Z.; Ma, Z. Changing patterns of the floating population in China, 2000–2010. Popul. Dev. Rev. 2014, 40, 695–716. [Google Scholar] [CrossRef] [PubMed]
  12. Qiao, L.; Li, Y.; Liu, Y.; Yang, R. The spatio-temporal change of China’s net floating population at county scale from 2000 to 2010. Asia Pac. Viewp. 2016, 57, 365–378. [Google Scholar] [CrossRef]
  13. Situ, Y.; Liu, W. Transient population, crime, and solution: The Chinese experience. Int. J. Offender Ther. Comp. Criminol. 1996, 40, 293–299. [Google Scholar] [CrossRef]
  14. Curran, D.J. Economic reform, the floating population, and crime: The transformation of social control in china. J. Contemp. Crim. Justice 1998, 14, 262–280. [Google Scholar] [CrossRef]
  15. National Health and Family Planning Commission of China. Report on China’s Migrant Population Development; China Population Publishing House: Beijing, China, 2016.
  16. Shukai, Z.; Kipnis, A. Criminality and the policing of migrant workers. China J. 2000, 43, 101–110. [Google Scholar]
  17. Lo, T.W.; Jiang, G. Inequality, crime and the floating population in china. Asian J. Criminol. 2006, 1, 103–118. [Google Scholar] [CrossRef]
  18. Cheong, T.S.; Wu, Y. Crime rates and inequality: A study of crime in contemporary China. J. Asia Pac. Econ. 2015, 20, 202–223. [Google Scholar] [CrossRef]
  19. Jiang, S.; Land, K.C.; Wang, J. Social ties, collective efficacy and perceived neighborhood property crime in Guangzhou, China. Asian J. Criminol. 2013, 8, 207–223. [Google Scholar] [CrossRef]
  20. Jiang, S.; Jin, X.; Xiang, D.; Goodlin-Fahncke, W.; Yang, S.; Xu, N.; Zhang, D. Punitive and rehabilitative orientations toward offenders among community correctional officers in china. Prison J. 2016, 96, 771–792. [Google Scholar] [CrossRef]
  21. Song, W.; Liu, D. Exploring spatial patterns of property crime risks in Changchun, China. Int. J. Appl. Geospatial Res. 2013, 4, 80–100. [Google Scholar] [CrossRef]
  22. Xiong, L.; Nyland, C.; Sue Fisher, B.; Smyrnios, K.X. International students’ fear of crime: An Australian case study. Aust. N. Z. J. Criminol. 2017, 50, 77–99. [Google Scholar] [CrossRef]
  23. Vladimirovich, U.M. Migrants integration as a solution to problem of extremist crimes prevention. Criminol. J. Baikal Natl. Univ. Econ. Law. 2013, 4, 175–178. [Google Scholar]
  24. Shaw, R.C.; McKay, D.H. Juvenile Delinquency and Urban Areas; University of Chicago Press: Chicago, IL, USA, 1942. [Google Scholar]
  25. Cohen, L.E.; Felson, M. Social change and crime rate trends: A routine activity approach. Am. Sociol. Rev. 1979, 44, 588–608. [Google Scholar] [CrossRef]
  26. Eck, J.E. Drug markets and drug places: A Case-Control study of the spatial structure of illicit drug dealing. Ph.D. Thesis, University of Maryland, College Park, MD, USA, 1994. [Google Scholar]
  27. Statistics Bureau of ZG Municipality. ZG Statistical Yearbook; China Statistical Publishing House: Beijing, China, 2016.
  28. Soo Chon, D. Residential burglary victimization: Household- and country-level mixed modeling. Int. Rev. Victimol. 2017, 23, 47–61. [Google Scholar] [CrossRef]
  29. Hedayati Marzbali, M.; Abdullah, A.; Ignatius, J.; Maghsoodi Tilaki, M.J. Examining the effects of crime prevention through environmental design (CPTED) on Residential Burglary. Int. J. Law Crime Justice 2016, 46, 86–102. [Google Scholar] [CrossRef]
  30. Santos, R.B.; Santos, R.G. Offender-Focused police intervention in residential burglary and theft from vehicle hot spots: A partially blocked randomized control trial. J. Exp. Criminol. 2016, 12, 373–402. [Google Scholar] [CrossRef]
  31. Sohn, D.W. Residential crimes and neighbourhood built environment: Assessing the effectiveness of crime prevention through environmental design (CPTED). Cities 2016, 52, 86–93. [Google Scholar] [CrossRef]
  32. Liu, H.; Zhu, X. Exploring the influence of neighborhood characteristics on burglary risks: A bayesian random effects modeling approach. ISPRS Int. J. Geo-Inf. 2016, 5, 102. [Google Scholar] [CrossRef]
  33. Christens, B.; Speer, P.W. Predicting violent crime using urban and suburban densities. Behav. Soc. Issues. 2006, 14, 113–127. [Google Scholar] [CrossRef]
  34. Zhang, H.; Peterson, M.P. A spatial analysis of neighbourhood crime in omaha, nebraska using alternative measures of crime rates. Internet J. Criminol. 2007, 31, 1–28. [Google Scholar]
  35. Katz, C.M.; Wallace, D.; Hedberg, E.C. A longitudinal assessment of the impact of foreclosure on neighborhood crime. J. Res. Crime Delinq. 2013, 50, 359–389. [Google Scholar] [CrossRef]
  36. Zhang, H.; Mccord, E.S. A spatial analysis of the impact of housing foreclosures on residential burglary. Appl. Geogr. 2014, 54, 27–34. [Google Scholar] [CrossRef]
  37. Anselin, L. Local indicators of spatial association—LISA. Geogr. Anal. 1995, 27, 93–115. [Google Scholar] [CrossRef]
  38. Dewan, A.M.; Corner, R.; Hashizume, M.; Ongee, E.T. Typhoid fever and its association with environmental factors in the dhaka metropolitan area of bangladesh: A spatial and Time-Series approach. PLoS Negl. Trop. Dis. 2013, 7, e1998. [Google Scholar] [CrossRef] [PubMed]
  39. Stiel, L.; Soret, S.; Montgomery, S. Geographic patterns of change over time in mammography: Differences between Black and White U.S. Medicare enrollees. Cancer Epidemiol. 2017, 46, 57–65. [Google Scholar] [CrossRef] [PubMed]
  40. Xie, K.; Ozbay, K.; Kurkcu, A.; Yang, H. Analysis of traffic crashes involving pedestrians using big data: Investigation of contributing factors and identification of hotspots. Risk Anal. 2017, 2, 1–18. [Google Scholar] [CrossRef] [PubMed]
  41. Nie, K.; Wang, Z.; Du, Q.; Ren, F.; Tian, Q. A network-constrained integrated method for detecting spatial cluster and risk location of traffic crash: A case study from Wuhan, China. Sustainability 2015, 7, 2662–2677. [Google Scholar] [CrossRef]
  42. Dewan, A.M.; Haider, M.R.; Amin, M.R. Exploring crime statistics. In Dhaka Megacity: Geospatial Perspectives on Urbanisation, Environment and Health; Springer: Dordrecht, The Netherlands, 2014; pp. 257–282. [Google Scholar]
  43. Wang, F.; Hu, Y.; Wang, S.; Li, X. Local indicator of colocation quotient with a statistical significance test: Examining spatial association of crime and facilities. Prof. Geogr. 2017, 69, 22–31. [Google Scholar] [CrossRef]
  44. Curtis-Ham, S.; Walton, D. Mapping crime harm and priority locations in New Zealand: A comparison of spatial analysis methods. Appl. Geogr. 2017. [Google Scholar] [CrossRef]
  45. Tobler, W.R. A computer movie simulating urban growth in the Detroit region. Econ. Geogr. 1970, 46, 234–240. [Google Scholar] [CrossRef]
  46. Yoo, S.; Wagnerb, J.E. A review of the hedonic literatures in environmental amenities from open space: A traditional econometric vs. Spatial econometric model. Int. J. Urban Sci. 2016, 20, 141–166. [Google Scholar] [CrossRef]
  47. Helbich, M.; Arsanjani, J.J. Spatial eigenvector filtering for spatiotemporal crime mapping and spatial crime analysis. Cartogr. Geogr. Inf. Sci. 2015, 42, 134–148. [Google Scholar] [CrossRef]
  48. Lesage, J.; Pace, R.K. Introduction to Spatial Econometrics; CRC Press: Boca Raton, FL, USA, 2009. [Google Scholar]
  49. Fotheringham, A.S.; Brunsdon, C.; Charlton, M. Geographically Weighted Regression: The Analysis of Spatially Varying Relationships; John Wiley & Sons Ltd.: Chichester, UK, 2002. [Google Scholar]
  50. Arnio, A.N.; Baumer, E.P. Demography, foreclosure, and crime: Assessing spatial heterogeneity in contemporary models of neighborhood crime rates. Demogr. Res. 2012, 26, 449–488. [Google Scholar] [CrossRef]
  51. Nezami, S.; Khoramshahi, E. Spatial modeling of crime by using of GWR method. In Proceedings of the 2016 Baltic Geodetic Congress (Geomatics), BGC Geomatics, Gdansk, Poland, 2–4 June 2016; pp. 222–227. [Google Scholar]
  52. Chen, J.; Liu, L.; Zhou, S.; Xiao, L.; Song, G.; Ren, F. Modeling spatial effect in residential burglary: A case study from ZG city, China. ISPRS Int. J. Geo-Inf. 2017, 6, 138. [Google Scholar] [CrossRef]
  53. Leitner, M.; Helbich, M. The impact of hurricanes on crime: A spatio-temporal analysis in the city of Houston, Texas. Cartogr. Geogr. Inf. Sci. 2011, 38, 214–222. [Google Scholar] [CrossRef]
  54. Cameron, A.C.; Windmeijer, F.A.G. R-squared measures for count data regression models with applications to health-care utilization. J. Bus. Econ. Stat. 1996, 14, 209–220. [Google Scholar] [CrossRef]
  55. Nakaya, T. 2012 GWR4 User Manual. WWW Document. Available online: http://geoinformatics.wp.st-andrews.ac.uk/download/software/GWR4manual.pdf (accessed on 11 August 2017).
  56. Chang, D. Social crime or spatial crime? Exploring the effects of social, economical, and spatial factors on burglary rates. Environ. Behav. 2011, 43, 26–52. [Google Scholar] [CrossRef]
  57. Battin, J.R.; Crowl, J.N. Urban sprawl, population density, and crime: An examination of contemporary migration trends and crime in suburban and rural neighborhoods. Crime Prev. Commun. Saf. 2017, 19, 136–150. [Google Scholar] [CrossRef]
  58. Faria, J.R.; Ogura, L.M.; Sachsida, A. Crime in a planned city: The case of Brasília. Cities 2013, 32, 80–87. [Google Scholar] [CrossRef]
  59. Zhang, W. Does compact land use trigger a rise in crime and a fall in ridership? A role for crime in the land use–travel connection. Urban Stud. 2016, 53, 3007–3026. [Google Scholar] [CrossRef]
  60. Melo, S.N.D.; Andresen, M.A.; Matias, L.F. Geography of Crime in a Brazilian Context: An Application of Social Disorganization Theory. Urban Geogr. Available online: http://0-www-tandfonline-com.brum.beds.ac.uk/doi/abs/10.1080/02723638.2016.1255920?journalCode=rurb20 (accessed on 11 August 2017). [CrossRef]
  61. Kim, Y.A. Examining the relationship between the structural characteristics of place and crime by imputing census block data in street segments: Is the pain worth the gain? J. Quant. Criminol. Available online: https://0-link-springer-com.brum.beds.ac.uk/article/10.1007/s10940-016-9323-8 (accessed on 11 August 2017). [CrossRef]
  62. Hipp, J.R.; Steenbeek, W. Types of crime and types of mechanisms: What are the consequences for neighborhoods over time? Crime Delinq. 2016, 62, 1203–1234. [Google Scholar] [CrossRef]
  63. Caminha, C.; Furtado, V.; Pequeno, T.H.C.; Ponte, C.; Melo, H.P.M.; Oliveira, E.A.; Andrade, J.S. Human mobility in large cities as a proxy for crime. PLoS ONE 2017, 12, e0171609. [Google Scholar] [CrossRef] [PubMed]
  64. Mburu, L.W.; Helbich, M. Crime risk estimation with a commuter-harmonized ambient population. Ann. Am. Assoc. Geogr. 2016, 106, 804–818. [Google Scholar] [CrossRef]
  65. Marshall, H.; Lombardo, R.M. Public reputation and organized crime: Explicating the relationship between racket subcultures and informal social control. Glob. Crime 2016, 17, 202–220. [Google Scholar] [CrossRef]
  66. Groff, E.R. Informal social control and crime events. J. Contemp. Crim. Justice 2015, 31, 90–106. [Google Scholar] [CrossRef]
  67. Stucky, T.D.; Payton, S.B.; Ottensmann, J.R. Intra- and inter-neighborhood income inequality and crime. J. Crime Justice 2016, 39, 345–362. [Google Scholar] [CrossRef]
  68. Hällsten, M.; Szulkin, R.; Sarnecki, J. Crime as a price of inequality? Br. J. Criminol. 2013, 53, 456–481. [Google Scholar] [CrossRef]
  69. Whitworth, A. Local Inequality and Crime: Exploring how Variation in the Scale of Inequality Measures Affects Relationships between Inequality and Crime. Urban Stud. 2013, 50, 725–741. [Google Scholar] [CrossRef]
  70. Wilson, J.Q.; Kelling, G.L. Broken windows: The police and neighborhood safety. Atl. Monthly 1982, 249, 29–38. [Google Scholar]
Figure 1. Distribution of floating population.
Ijgi 06 00246 g001
Figure 2. Conceptual framework of model development.
Ijgi 06 00246 g002
Figure 3. Distribution of residential burglary in 2013–2015.
Ijgi 06 00246 g003
Figure 4. LISA clusters of residential burglary.
Ijgi 06 00246 g004
Figure 5. Distribution of model residual.
Ijgi 06 00246 g005
Figure 6. Distribution for local regression coefficients and t-statistics of FPFOP.
Ijgi 06 00246 g006
Figure 7. Distribution for local regression coefficients and t-statistics of FPFSP.
Ijgi 06 00246 g007
Figure 8. Distribution for local regression coefficients and t-statistics of bus stop density.
Ijgi 06 00246 g008
Figure 9. Distribution for local regression coefficients and t-statistics of population density.
Ijgi 06 00246 g009
Table 1. Descriptive statistics of all variables in this study (Number of observations = 215).
VariableMinMaxMeanStandard Deviation
Burglary (count)93547698.2668.17
FPFSP (%)0.4246.9612.318.608
FPFOP (%)0.46273.61721.69515.795
Household with house area equal to or greater than 120 m2 (%)072.321.86516.502
Bus stop density018.714.3434.128
House hold unit (thousands)1.20677.88220.01313.089
Population density (%)0.04182.58114.2618.82
Table 2. Bivariate correlation coefficient for explanatory variables.
VariableBurglaryPopulation DensityHousing AreaBus Stop DensityFPFSPFPFOPHousehold Unit
Burglary1
Population density0.272 **1
Household with housing area equal to or greater than 120 m2−0.165 *−0.650 **1
Bus stop density0.317 **0.621 **−0.579 **1
FPFSP0.449 **0.248 **−0.439 **0.263 **1
FPFOP0.569 **−0.079−0.108−0.0320.535 **1
Household unit0.681 **0.491 **−0.434 **0.434 **0.412 **0.263 **1
Note: ** Parameters are significant at 0.01 confidence level. * Parameters are significant at 0.05 confidence level.
Table 3. Results of regression models.
VariableNB (Standard Error)GWPR
MeanMinLwrMedUprMax
Intercept−5.633 (0.167)−4.949–6.301–5.345–4.873–4.505–3.671
FPFSP0.004 (0.006)−0.007–0.069–0.019–0.0040.0040.039
FPFOP0.025 ** (0.003)0.0250.0070.0160.0220.0320.065
Bus stop density0.087 ** (0.014)0.069–0.0680.0150.0470.110.298
Household unit−0.001 (0.003)−0.003–0.02–0.012–0.0030.0050.022
Household with house area equal to or greater than 120 m20.013 ** (0.003)−0.008–0.05–0.025–0.0030.0070.021
Population density−0.008 * (0.003)−0.012–0.099–0.029–0.00900.079
MAD (Mean absolute deviance)259.339145.273
Rd20.7210.907
Moran’s I of residual0.234 **−0.031
Note: * Parameters are significant at 0.05 confidence level. ** Parameters are significant at 0.01 confidence level.
Table 4. Results of testing spatial non-stationarity.
VariableLwrGlobal − 1SDGlobal + 1SDUpr
FPFSP−0.019−0.0020.010.004
FPFOP0.0160.0210.0280.032
Bus stop density0.0150.0730.1010.11
Housing unit−0.012−0.0050.0020.005
Household with house area equal to or greater than 120 m2−0.0250.010.0160.007
Population density−0.029−0.011−0.0050
Table 5. Results of geographical variability testing of local coefficients using Chi-Square test.
VariableDiff of DevianceDiff of DOFDIFF of Criterion
FPFSP1476.0067.38−1448.904
FPFOP1915.1456.678−1890.516
Bus stop density984.0945.875−962.317
Housing unit2189.7817.158−2163.458
Household with house area equal to or greater than 120 m21987.9147.748−1959.526
Population density1862.1255.558−1841.483

