Article

Examining the Driving Factors Causing Rapid Urban Expansion in China: An Analysis Based on GlobeLand30 Data

School of Geography, Faculty of Geographical Science, Beijing Normal University, No. 19, Xinjiekouwai Street, Haidian District, Beijing 100875, China
*
Author to whom correspondence should be addressed.
ISPRS Int. J. Geo-Inf. 2017, 6(9), 264; https://0-doi-org.brum.beds.ac.uk/10.3390/ijgi6090264
Submission received: 29 June 2017 / Revised: 19 August 2017 / Accepted: 21 August 2017 / Published: 25 August 2017

Abstract

:
A large number of studies have dealt with the driven forces of land expansion, in which the remote sensing data and statistical data are most commonly used. The recent progress based on the statistical data have not been fully tested and discussed by the remote sensing data, and the remote sensing data used in the previous studies are usually interpreted within certain areas which is not convenient for global comparison. In this paper, the 30-m GlobalLand Cover Dataset (GlobeLand30) and socioeconomic data from 2000 to 2010 are adopted to investigate the factors driving impervious surface expansion in China based on a multilevel regression model. The GlobeLand30 provides a world-wide data framework which has a sound basis for regional comparison research. The variables are selected according to the existing research. Most, but not all, results are consistent with the previous studies when using impervious surface data of GlobeLand30. The main findings are: (1) the market demand caused by economic development, such as the increase in GDP from 2000 to 2010, plays a positive role in the expansion of developed land; (2) the land supply, as reflected by the ratio of the total of land transfer fees to fiscal revenue, also has a positive effect on the increase in impervious surfaces; (3) the percentage of the increase by private workers to the increase in total workers and certain other frequently-used variables are not relevant after controlling for land demand- and supply-related variables; and (4) the growth in impervious surfaces is related to the amount of the cultivated land, which implies the necessity for a more stringent farmland protection policy. Considering the need to compare across regions, we suggest that GlobeLand30 should be used for more studies to better understand the driving forces of land expansion.

1. Introduction

In the background of fast urbanization and industrialization in China, the growth of cities and towns is accompanied by an intensive transformation of the original landscape into impervious surfaces. The total increase of China in impervious surfaces ranks first in the world from 2000 to 2010 and accounts for 28.17% of the global total [1]. The massive expansion of impervious surfaces has a noticeable impact on many aspects of human life, such as energy use and food security [2,3,4,5]. The impact on the environment, such as CO2 emissions and land surface temperatures from urbanization, has also been revealed [6,7]. In addition, some complex urban problems, such as housing and disaster risk with respect to water, are found to have close relationships with land urbanization [8,9,10]. Understanding the characteristics and causes of land development in China is critical to economic growth and sustainable environmental protection. Many studies have focused on the drivers of land development, aiming at an in-depth understanding of the patterns of human activity and rationally guiding further development [11,12,13]. These studies indicate that the patterns and driving forces of the growth in developed land in China are quite different from those in the western world, and these differences are closely related to the institutional context of China.
In order to capture characteristics and analyze the causes of land use expansion in different regions, data with a variety of sources and different formats are adopted in the previous studies. In general, two types of basic data are used to study the drivers of developed land expansion: government statistics and remote sensing data [14,15]. Recently, considerable progress has been made in theory development based on government statistics [16]. These studies have revealed many institutional- and policy-based reasons for the expansion of developed land in China [17]. However, the land data from government statistics in China may be questioned for reliability. For example, illegal land use changes are not involved in the statistics, which is also mentioned in the literature [18]. In contrast, the remote sensing data have an advantage on reliability. However, the recent progress has been little tested by the remote sensing data. As the remote sensing data used in the previous studies lack uniformity, the conclusions are weakened to compare across countries or regions.
This paper aims to examine the drivers of developed land expansion in China according to the recent progress, using the global-comparable remote sensing interpretation data (a 30-m global land cover dataset) between 2000 and 2010. The dataset has the highest accuracy among similar global data products. As part of the global application of the dataset, this study has a better database of land expansion for international comparisons.
The remainder of the paper is organized as follows: Section 2 provides a literature review; Section 3 describes the study area, research data, and methods; Section 4 analyzes the characteristics of China’s impervious surfaces; Section 5 presents the results; and Section 6 presents the discussion and conclusion.

2. Literature Review

In the past two decades, a number of studies have focused on the causes of developed land expansion in China and have provided some important insights [17,19]. A variety of factors have been included in these analyses. The existing literature has identified different causes of expansion, such as physical and agricultural conditions, location, economic conditions, urbanization, industrialization, and institutional factors [20,21,22,23]. The selected variables in these studies can be categorized into two types: economic variables and institutional variables.
Economic factors, such as economic growth, investment, trade, employees, average wages, the value of agricultural land, and other variables, are often used in such studies [24,25,26]. Most empirical research indicates that the economic variables are usually significant in explaining the land development in China, implying an effective explanatory power of market-based theory and urban economic models for China [27]. However, China’s land market is not a fully competitive market [28]. Many studies have also attempted to identify the causes of land development by quantitatively focusing on the specific institutional context in China [29]. It has been found that the land transfers provide abundant benefits for local fiscal revenue in China, and land development is used as tools to attract investments and promote economic development, which motivates local government officials to lease land to developers in the pursuit of revenues and political gains [30,31]. Some institutional variables related to the land quotas allocation, such as the administrative level and national policy, are found to be significant to the land development [32]. Some other variables have also been used to reflect the effects of Chinese institutions, such as the performance appraisal system [33], promotion incentives [34], and competition between local governments [35].
The data availability and reliability are crucial for these studies. Most early studies on China used remote sensing data [36,37]. Due to the large workload involved in the interpretation of data from satellite images, study areas have been limited to specific cities or regions [38]. The first nationwide study was conducted by Liu using the 1-km GRID (a raster format developed by Environmental Systems Research Institute, Inc.) land use dataset [39]. However, the variable choices in these studies are relatively weak in theoretical basis [15,40]. The recent studies based on the official statistics from the governments have begun to emphasize the construction of a theoretical framework and made more in-depth progress on institutional driving factors, in which some distinctive Chinese characteristics have been included, such as decentralization, fiscal incentives, and administrative competition [41]. However, there may be some problems with the statistical data. The transfer of developed land has a close relationship with fiscal revenue, and local officials have the incentives to sell land without permission. Illegal construction is difficult to record in the statistical data. Human intervention in the statistical data may affect the associated reliability [42]. As compared with statistical land data from governments, the remote sensing data are not likely to be distorted by the realistic interests.
Generally speaking, there are also some differences in the definition of developed land between remote sensing data and statistical data. It must be noted that developed land in the statistical data refers to the potential purpose (the function defined by the government) of land use, while developed land in the remote sensing data is identified by the observed physical cover (whether the land is covered by buildings) [43,44]. In China, when a plot of land is transferred by the government, it is labeled as developed land in the statistical data by the government [45]. However, this does not necessarily lead to the actual development by the market and bring about the increase of impervious surfaces. In fact, a plot of land may be identified as developed land by the government, but it may actually be developed several years later, or developed without any increase of impervious surfaces, such as parks or green infrastructures. Despite such data inconsistencies, the recent progress based on the statistical data have not been fully tested and discussed with respect to the remote sensing data.
In this research, the remote sensing data will be used to investigate the driving forces of impervious surface growth in China. Based on the latest progress in the relative literature, a multilevel model is designed to evaluate the effects of the selected variables. Controlling the economic and demographic variables at the provincial level, we analyze the variation in impervious surface expansion caused by provincial variables. Meanwhile, this paper focuses on the effects of the variables at the prefecture level.

3. Material and Methods
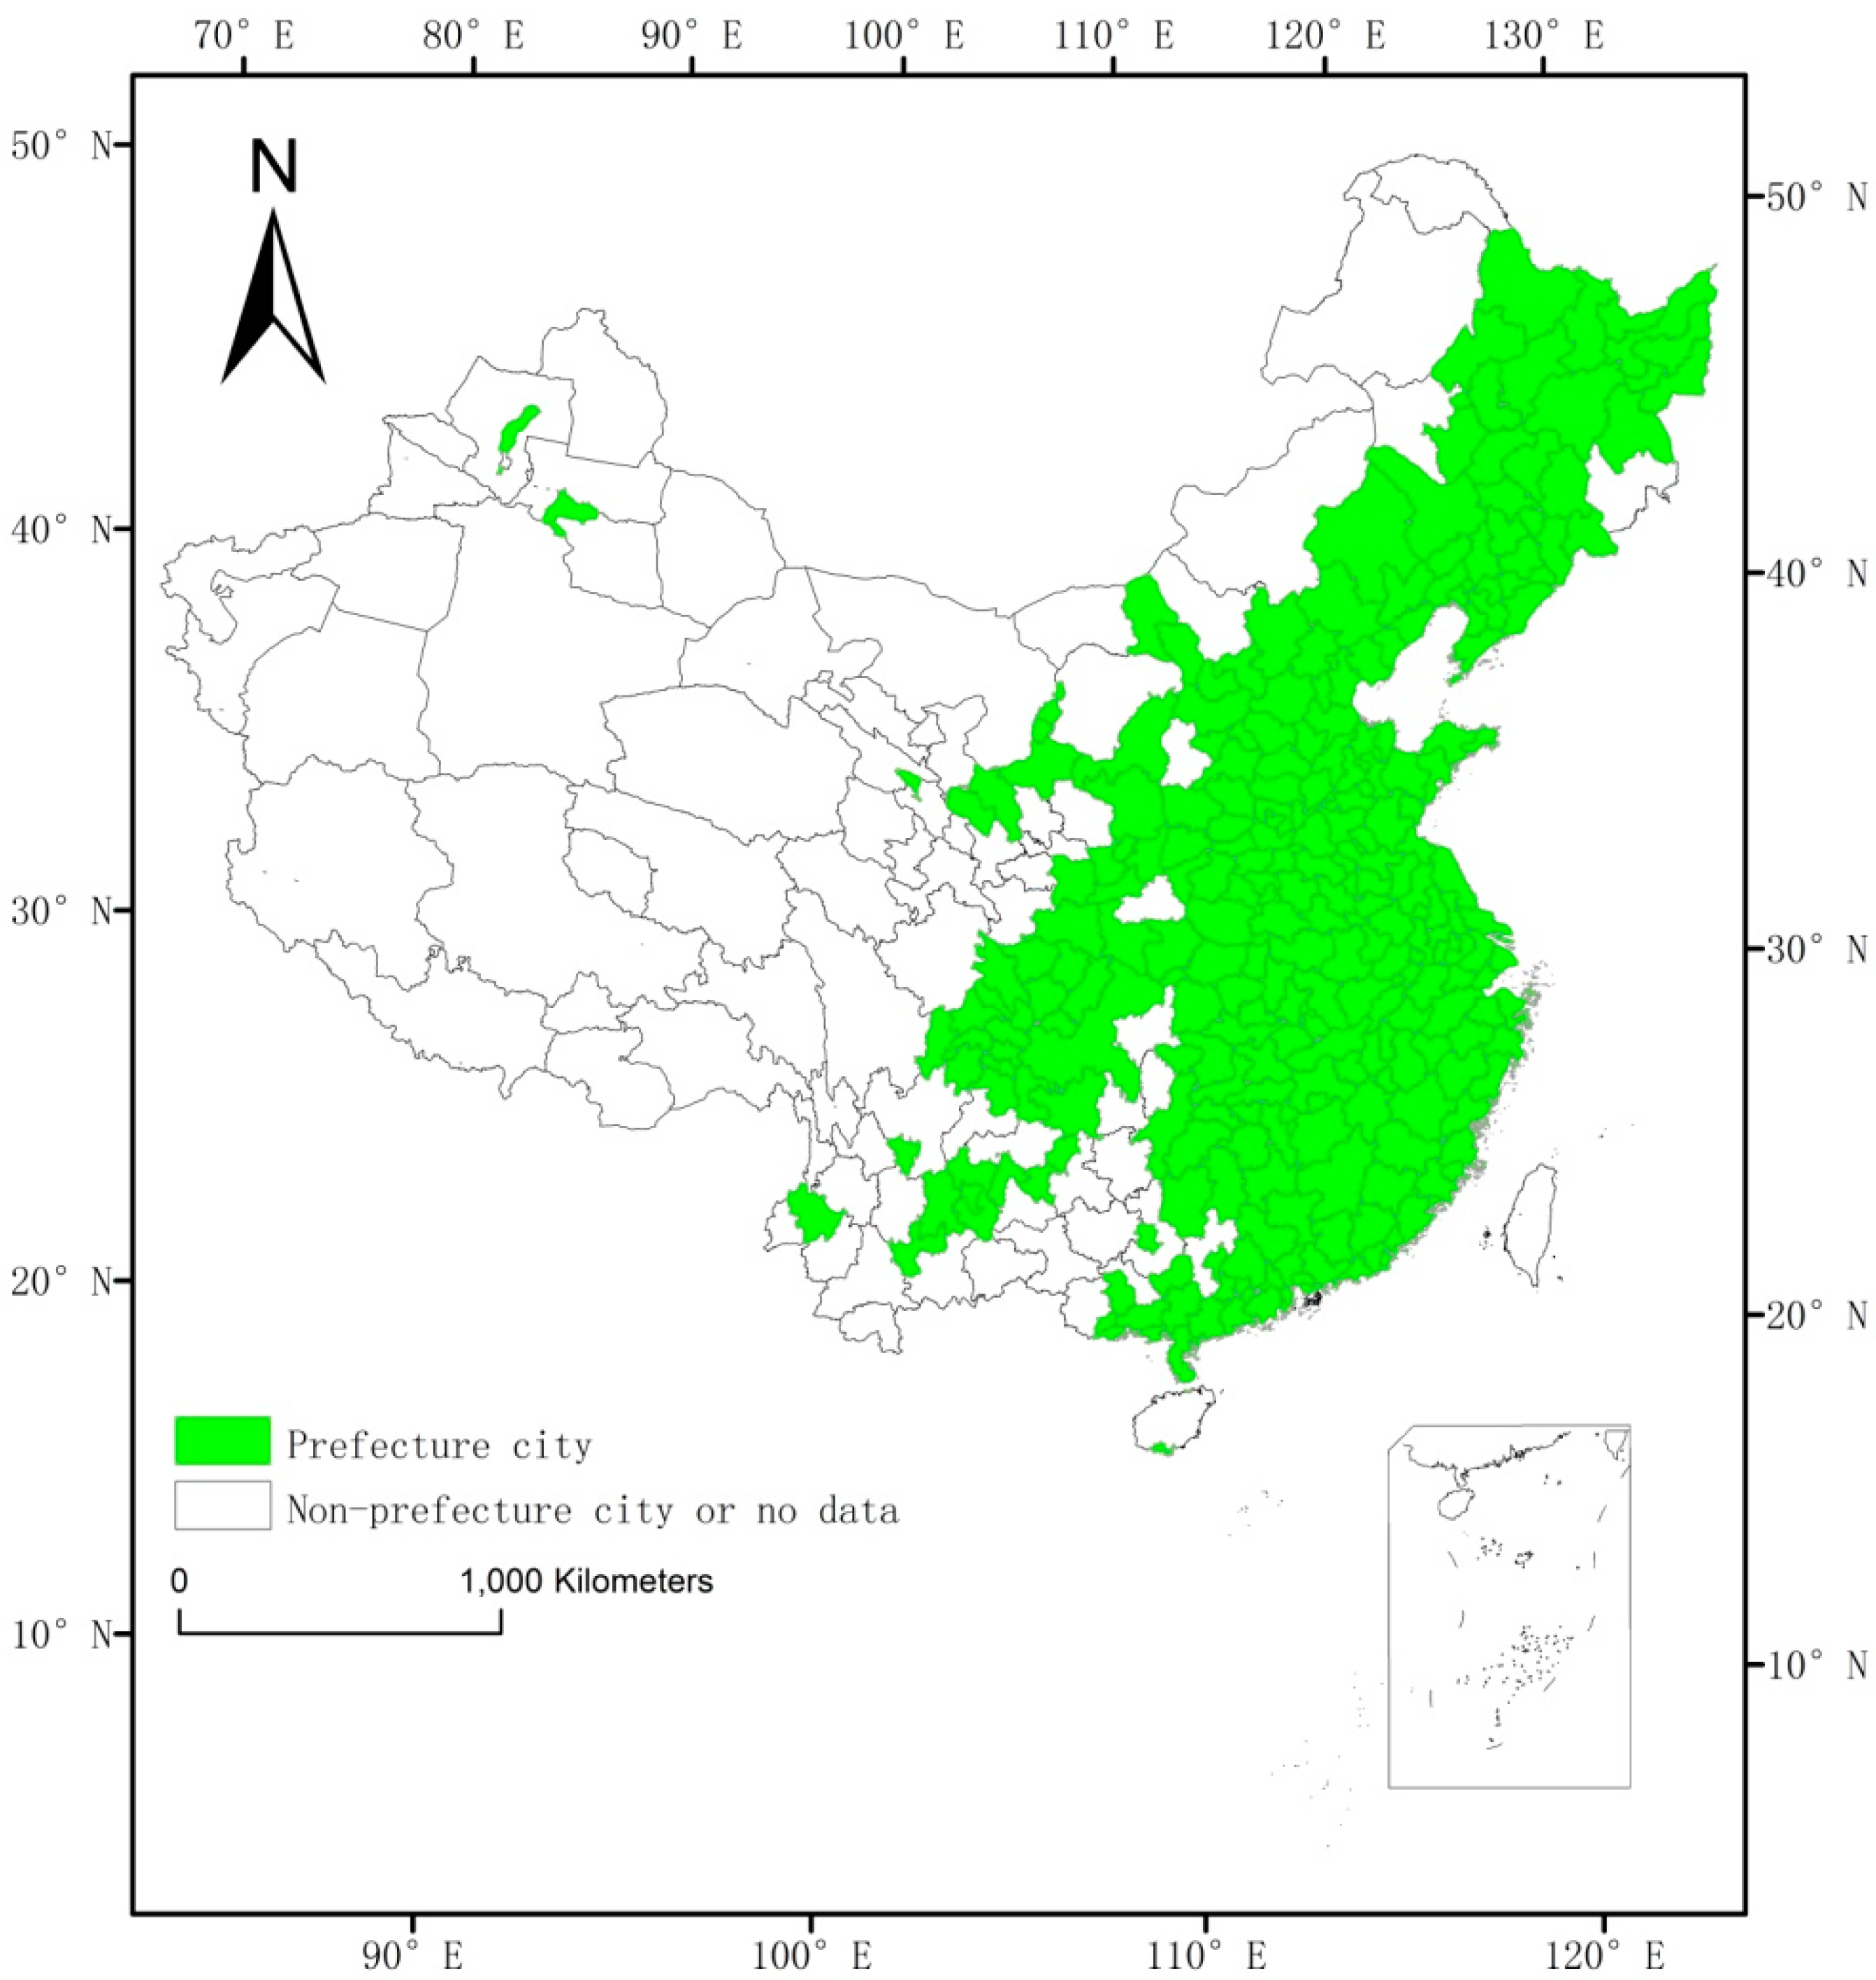
3.1. Study Area

In this paper, we examine the drivers of the increase of impervious surfaces in China from 2000 to 2010. The study area includes 259 prefecture-level cities in China (Figure 1). These cities’ social and economic statistical data are available in the public yearbooks. They are located mainly in the central and eastern regions of China, which have been the main areas of land development over the past few decades. Based on the availability of social and economic statistics, Hong Kong, Macao, Taiwan, and other areas without a prefecture-level city are not included, such as Sansha City in Hainan Province, which was established in 2012.

3.2. Research Data

The land data used in this study is the 30-m GlobalLand Cover Dataset (GlobeLand30). The dataset spans from 2000 to 2010 and was produced by the Ministry of Science and Technology of the PRC and the National Geomatics Center of China (NGCC), and 18 institutions from seven ministries participated in the technological research and data production [46]. The dataset covers a land area from 80° N to 80° S, with a coordinate system of WGS84 and a projection of UTM. The images used for data interpretation are mainly 30 m multispectral images, including Landset5 TM and ETM+ multispectral images and multispectral images from the Chinese Environmental Disaster Alleviation Satellite (HJ-1). The integrated approach of pixel- and object-based methods with knowledge (POK-based) have been developed [47]. The dataset consists of 10 land cover types, including cultivated land, forest, artificial surfaces, etc. [47]. The data are stored in raster format, and the overall classification accuracy of GlobeLand30 for the years 2000 and 2010 is better than 80% [47,48,49].
Other statistics used in this article are from the China Statistical Yearbook, the China City Statistical Yearbook and the China Land and Resources Yearbook from 2000 to 2010.

3.3. Methods and Variables

3.3.1. Multilevel Regression Model

To reflect the forces involved at the government level, recent empirical models are typically based on hierarchical modeling [28]. We use a multilevel regression model to address the problem of correlations among data within a province (prefecture-level cities) caused by the hierarchical structure of the administrative management system in China. The advantage of the multilevel regression model is that it can control for correlations between sample groups, and it does not require the hypothesis that the observed data are independent. The variables at the contextual level can influence the variables at individual level. The method can be used to analyze the influence of variables at both the individual level and the context level, and is suitable for a dataset with a nested structure [50]. Therefore, a two-level model was established to estimate the mechanisms of increases in impervious surfaces, including one at the prefecture level and one at the provincial level. The regression model is as follows:
y i j = β 0 j + β 1 D e m a n d i j + β 2 S u p p l y i j + β 3 S o c i o e c o _ P j + ε i j + u 0 j
where y i j , the dependent variable, represents the increase in impervious surface expansion at the prefecture level in city i in province j; β 0 j represents a constant term that varies in different provinces and reflects the degree of influence on the average value y of different samples; β i is the coefficient to be estimated, which reflects the influence of the independent variable; D e m a n d i j represents the land demand originating from the market in prefecture-level city i in province j; S u p p l y i j represents the land supply provided by the government; S o c i o e c o j represents the control variable, which is related to the socioeconomic context at the provincial level; and the suffix P represents the second-level variable.

3.3.2. Variables

The selection of variables is based on results obtained in the published literature [15,16,17,18,19,20,21]. After reviewing existing studies, variables that are used in published papers more than three times are listed in Table 1. To examine the driving forces by the data of GlobeLand30, the frequent variables are selected in this study. The variables which exhibit little short-term variation are not included, such as precipitation and temperature. The selected explanatory variables are divided into land demand-related variables and land supply-related variables. Aside from the main variables, several control variables are also used. The interpretations of the dependent and independent variables are shown in Table 2.
Demand-related variables: Based on the previous studies, land demand is a key factor that influences increases in impervious surfaces and is, in turn, influenced by economic transition [16]. To reflect the influences of economic development, urbanization and industrialization, an increase in GDP from 2000 to 2010, the share of the total increase in actual foreign investment to GDP, the ratio of fiscal expenditure per capita at the prefectural level to that at the provincial level, and the percentage of increase by private workers to the increase in total workers are selected in this paper. Particularly, considering that people with high incomes tend to consume more land, the increase in average wages per capita and the increase in total population are also included.
Supply-related variables: In China, land development and construction must be first approved by the government. In the land supply system, which is guided by administrative management, the available land quota is influenced by non-market factors, such as political and administrative relationships [51,52]. In this paper, the ratio of the total of land transfer fees to fiscal revenue is used to reflect the amount of land transferred. Whether a city has national economic and technological development zones is an important practical consideration for the supply of developed land. Furthermore, the administrative levels have a close relationship with economic and urban expansion [32]. We choose whether a location was a sub-provincial city or provincial capital as an index to reflect the influence of the administrative levels. All of these supply variables are used to reflect the supply of available land quotas at the prefectural level.
Control variables: The proportion of the secondary economic sector and the cultivated area in 2000 are used as control variables. These variables are basic indicators of urbanization and the potential available land for construction.
Provincial-level variables: To control for provincial differences and to remain consistent with the aforementioned methods, variables related to the socioeconomic conditions of provinces, such as the increase in the population density of the provinces and the increase in the GDP density of the provinces, are added to control the homogeneity in provinces.
To test for collinearity, we examine the variance inflation factor (VIF) and the correlation coefficients between variables. The diagnostic results of the collinear statistics show that no VIF values are greater than 10. Additionally, the correlations between the independent variables and results are shown in Table 3. The correlation coefficients are generally low and acceptable (most are under 0.5, and the highest was 0.61), which suggests that there are no multi-collinearity problems in the model. The increase in gross domestic product (GDP) and the increase in the average wages per capita (WAG) are moderately correlated, with a correlation coefficient of 0.61. It is not surprising that the GDP, CAP (whether a city is a provincial capital), and RLFE (the ratio of fiscal expenditure per capita at the prefectural level to that at the provincial level) are correlated moderately (the coefficients are approximately 0.5) given that regions with high economic development and high administrative level usually have more revenue.

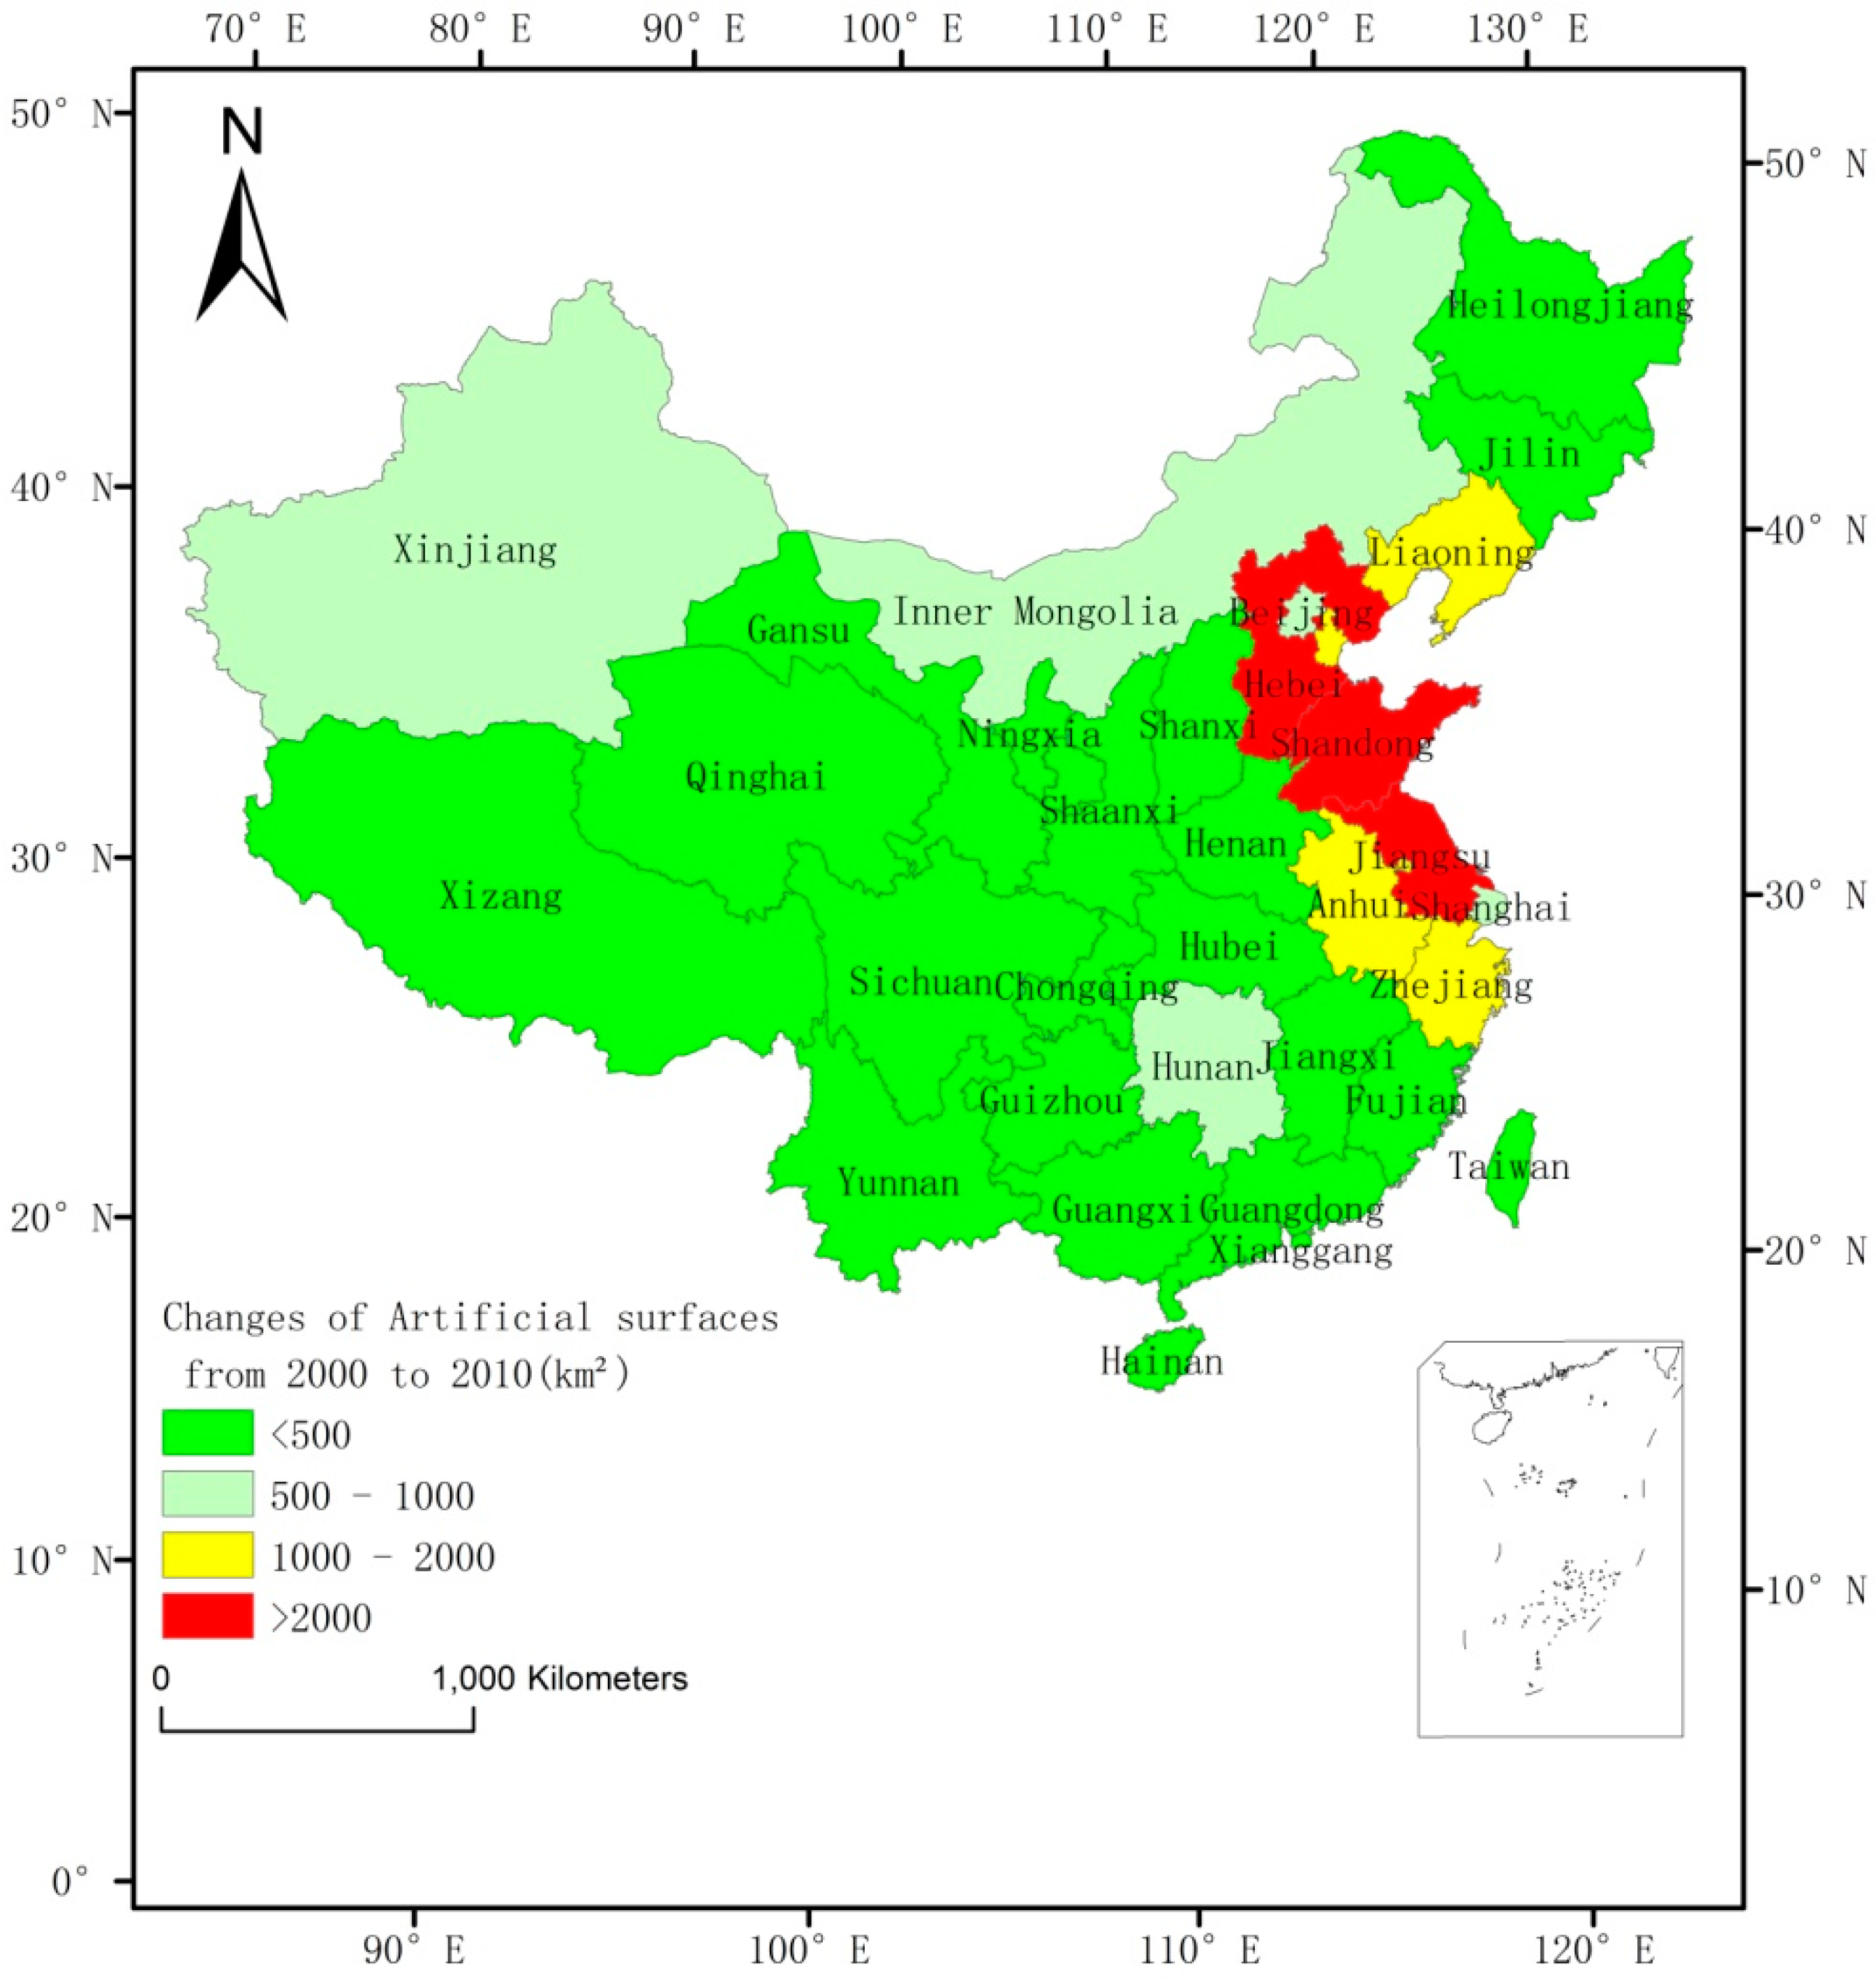
4. Characteristics of Impervious Surface Expansion in China

4.1. The Expansion of Impervious Surfaces in China

This article is concerned with the impervious surfaces in GlobeLand30 data. Extensive land conversion has occurred from 2000 to 2010 (1.61 × 10⁴ km) [1]. Figure 2 shows the changes of impervious surface expansion from 2000 to 2010 of all provinces. Land development within the country is not balanced. At the regional level, the growth in impervious surfaces was unbalanced between the provinces in the eastern, central, and western regions. The eastern coastal regions grew most rapidly, followed by the central and the western inland regions. This pattern is consistent with the overall speed of economic development. The eastern regions had the highest degree of industrialization and urbanization. At the provincial level, provinces, such as Shandong and Jiangsu, exhibited the most expansion at 4370 km2 and 3744 km2, respectively. The provinces in the western regions, such as Tibet and Qinghai, exhibited the least expansion, and most of the provinces in this region grew less than 200 km2.

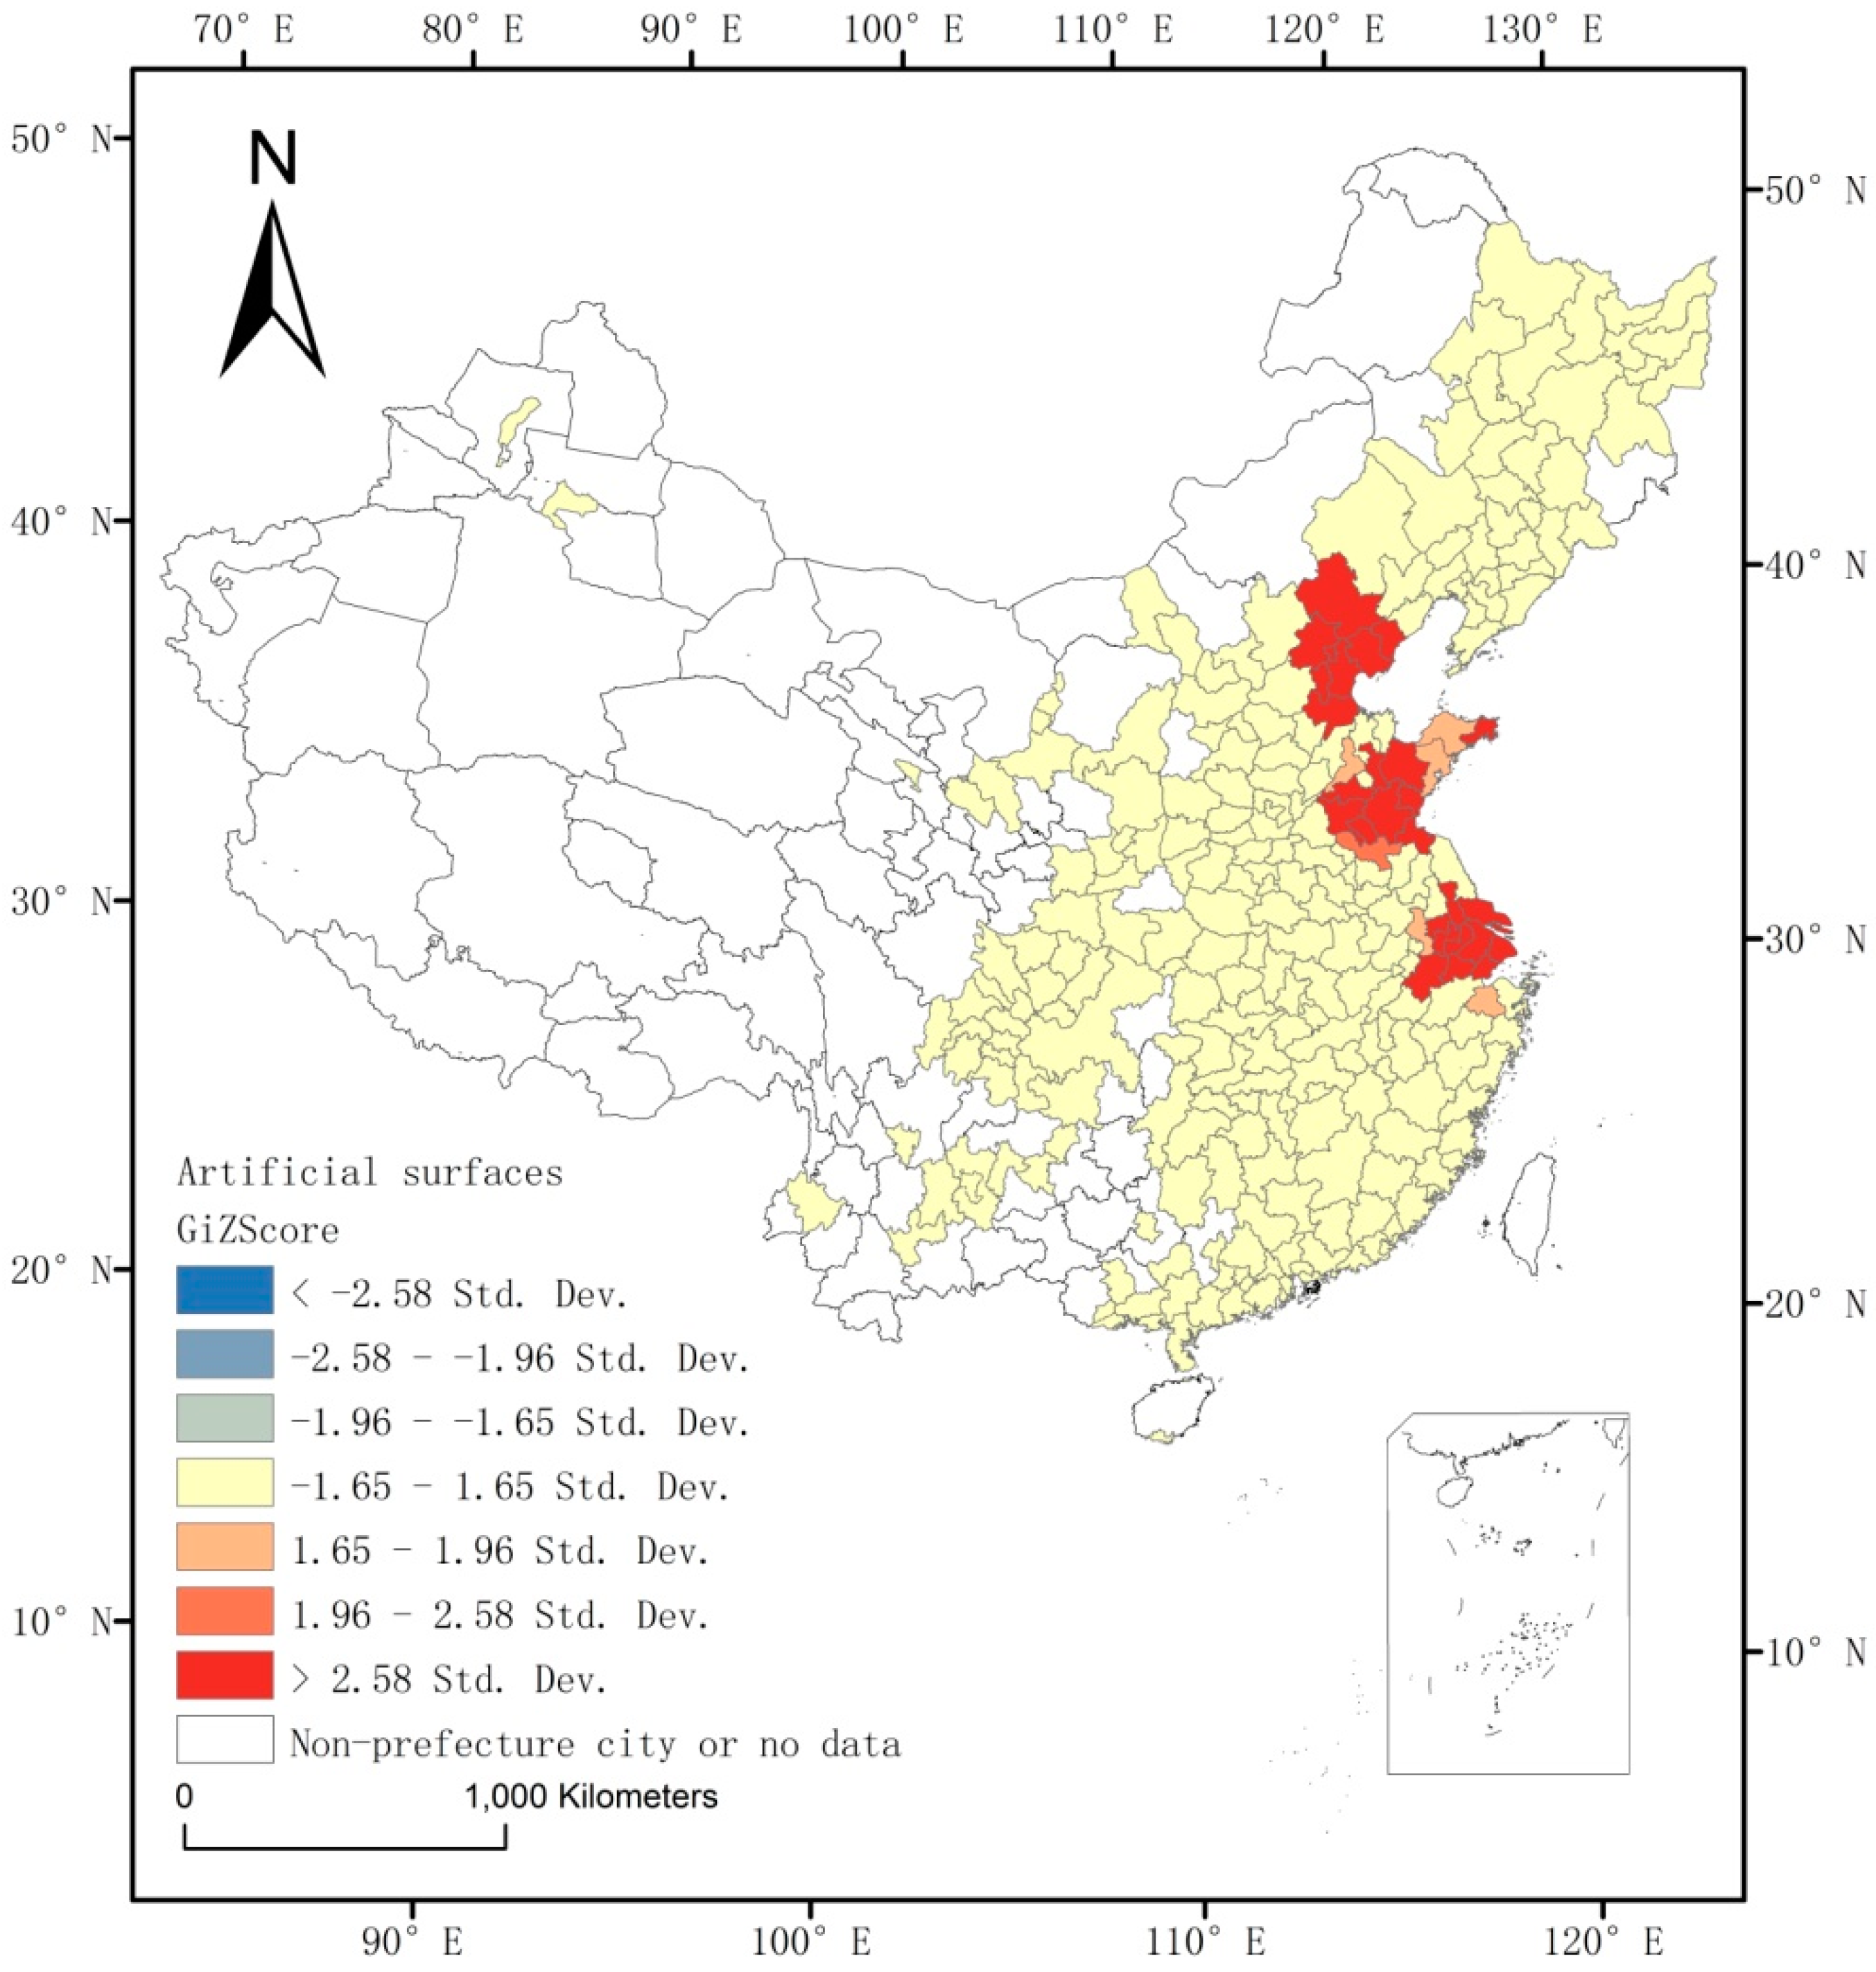
4.2. Spatial Pattern of Impervious Surface Expansion

To understand the pattern of the increase in impervious surfaces, we calculated the spatial autocorrelation and local autocorrelation of the increase in developed land. Moran’s I and the Getis-Ord Gi* are the two most commonly used methods to identify hotspots [53,54]. The Getis-Ord Gi* can accurately detect aggregation areas in hotspot analysis, and Moran’s I can detect the core areas of data, but has a shorter range than the results based approach of the Getis-Ord Gi*. Therefore, Getis-Ord General G and Getis-Ord Gi* were employed to analyze the global and local patterns. The advantage of these indicators of spatial association lies in their capability to identify clustered values at a certain location and their surrounding neighbors. Local spatial autocorrelation can provide a basis for classification or division. We conducted hotspot analysis using the corresponding method. The General G and Gi* values were calculated as follows:
G = i = 1 n j = 1 n w i j x i x j i = 1 n j i n x i x j
G i * = j i w i j x j j i w j
where wij represents the spatial relationship between i and j. There are several approaches to define wij. In this study, only neighboring polygon features that share a boundary are adopted to be relevant. When two features share a boundary, the value of wij is 1, otherwise the value is 0. xi represents the spatial observation at position i; xj represents the spatial observation at another location. If G is greater than 1.96, a hotspot exists; if G is less than 1.96, a coldspot exists.
The spatial patterns of increases in impervious surfaces at the prefecture level of cities are discussed based on the results of global Getis-Ord G. The observed values of G are greater than their mathematical expectations, and the Z scores of impervious surfaces are significant, with a total value of 8.69. The results of the local Getis-Ord G i * values are shown in Figure 3, which illustrates the hotspots of impervious surface development from 2000 to 2010 at the prefectural level. Local autocorrelation revealed significant spatial heterogeneity. The increases in impervious surfaces in space are not uniform. Hotspots of impervious surfaces were mainly concentrated in the Yangtze River Delta, Beijing-Tianjin-Hebei region, and on the Shandong Peninsula.
To evaluate the changes in impervious surfaces at hotspots more clearly, we analyzed the statistics of land use change in the three aforementioned regions. The differences between these regions and other regions in the study area are compared, and the results are shown in Table 4. Both the average increase and the ratio of the increase to the total of the three regions are far greater than the national average values. Shandong Peninsula has the largest number of prefecture-level cities, up to 13. The Beijing-Tianjin-Hebei region exhibited the largest average increased area (602.58 km2), and the Yangtze River Delta exhibited the largest ratio of increased area to the total area at 6.1%.

5. Results

The results of the multilevel regression are presented in Table 5. Maximum likelihood ratio tests are applied to test the quality of the models. The results indicate that the models can pass the chi-squared test with a high significance and a p-value of less than 0.01, which suggests that the models are statistically valid. For comparison, we generate results using a random effects model without the level-2 variables. The small variation in the −2×log likelihood implies that the result is more stable after adding the level-2 variables.
The residuals of the regression results at level 2 indicate that the deviation between the average value and increased value is caused by the economic performance of the provinces. By analyzing the significance test results and the residuals, we can further detect the effect of the economic level on impervious surface expansion in the different provinces. The results are shown in Figure 4. Developed provinces, such as Shandong, Jiangsu, and Zhejiang, exhibit large variations in impervious surface expansion. However, no similar effects are observed in the central and western regions. The prefecture cities in these provinces also experienced considerable impervious surface expansion. The normal probability plot of the level-1 residuals in Figure 5 is used to assess model assumptions. By controlling the differences between provinces, the associated plot is relatively linear, which suggests that the normality assumption is reasonable.
In terms of the results at the provincial level, PGDP (the increase in the GDP density of provinces) has a positive relationship with the expansion of impervious surfaces, with a coefficient of 0.125. The results of the variables at the provincial level indicate that wealthy provinces are associated with more developed land than non-wealthy provinces. This relationship reflects the speed of economic development in different regions of China. In China, the eastern provinces have prominent economic advantages, leading to a large demand for developing land. PPOP (the coefficient of the increase in the population density of provinces) is −0.061, but not statistically significant.

5.1. Demand Variables

GDP reflects the level of economic development, and the coefficient of GDP is 0.289. The significances of the results are in line with previous studies [39]. The results of GDP indicate that increases in the total economy play a positive role in the expansion of developed land. During China’s rapid development, GDP has been an important indicator of the governments’ performance. Local governments are usually actively engaged in attracting investment and constructing infrastructure to promote economic growth. Both industrial factories and transportation construction will lead to increases in developed land. From the perspective of competition between local governments, transferring land at a low price is used as a mean of attracting investment. Therefore, increases in developed land and economic development in China are often mutually reinforced [41].
The coefficient of WAG is 0.215 and related to the positive expansion of impervious surfaces, which indicates that the wealthier regions tend to have greater land demands. This fits well to the classic Alonso model. The comparative statistical analysis of the Alonso model has suggested that the gradient of the bid price curve will decrease with increased income, which is often explained as land is a quality good and the rich tend to consume more land [55]. Areas with high wages generally occur in developed regions, and high WAG is associated with high land demand. These results imply that the market demands are usually satisfied by the land system in China. To meet the consumption demand in these places, real estate transactions and other material production in the wealthier regions are more extensive.
In this study, RLFE exhibits no significant correlation between fiscal decentralization and developed land expansion. RLFE is used to represent the ability of a local government to promote its own development, and it is usually significant in the studies using statistical data [16]. Similar results are found for the variables reflecting globalization and marketization, such as FDI (the share of the total increase in actual foreign investment to GDP), DZ (whether a city has national economic and technological development zones), and LAB (the ratio of the increase in private workers to the increase in overall workers). As compared with the previous studies based on statistical data, our results indicate that the local economic growth is most relative to the expansion of impervious surfaces, while some other characteristics (indirect indicators of economic growth), such as FDI or DZ, are less relative, though they may significantly contribute to the statistical numbers.

5.2. Supply Variables

The variable of RLTF (the ratio of the total amount of land transfer fees to fiscal revenue) is used to reflect the degree of marketization in the previous studies, and it is often found to be significant. Generally, as the value of RLTF increases, the amount of land supplied from the government increases. In this study, the coefficient of RLTF is about 0.163, and it is positively correlated with the expansion of impervious surfaces. This is also in agreement with our expectation. In China, the state has the exclusive power to supply available land for development. As controlled by the government, the supply of developed land affects land development.
The land allocation system in China has a hierarchical structure [33]. A limited literature has quantified the relationship between the rank of administration and the land expansion, most of which indicates that the high administrative-level cities tend to expand more rapidly [56]. In this study, CAP and SUB (whether a city is a sub-provincial city) are used to reflect the roles of the administrative levels. The coefficient of CAP is not significant, while SUB is negatively correlated with the expansion of impervious surfaces, with a moderate coefficient of −0.305. This is not particularly consistent with the previous studies. Our results indicate that the actual impervious surface expansions are less likely promoted by the political levels. This may be caused by the data resource. The existing studies are based on official land use data, while this study uses remote sensing data. As mentioned above, the data of impervious surfaces in GlobeLand30 reflects the actual land development, rather than the allocation of quotas. Higher administration may have an advantage in land quotas acquisition, but the illegal land use is often active at the lower administration levels of towns or villages [57]. In fact, land use in rural China was weakly regulated by government in the period of 2000 to 2010 [58].
As a control variable, the proportion of the secondary economic sector (PSEN) is not significant, but the cultivated area in 2000 (CUL) is positively correlated with the expansion of impervious surfaces. The coefficient of CUL is 0.18. This result indicates that the prefecture cities with more cultivated areas tend to develop more land. In China, the arable lands surrounding urban areas are the most vulnerable areas to be converted into developed land, as the terrain, slope, and other natural conditions of cultivated land are conducive to reduce development costs in general. This implies a great pressure of implementing a stringent policy concerning farmland protection. In fact, although the Chinese government has strict protection policies for agricultural land, such as the basic Farmland Protection Regulation [59], the cultivated land protection policies in China are difficult to implement well [23].

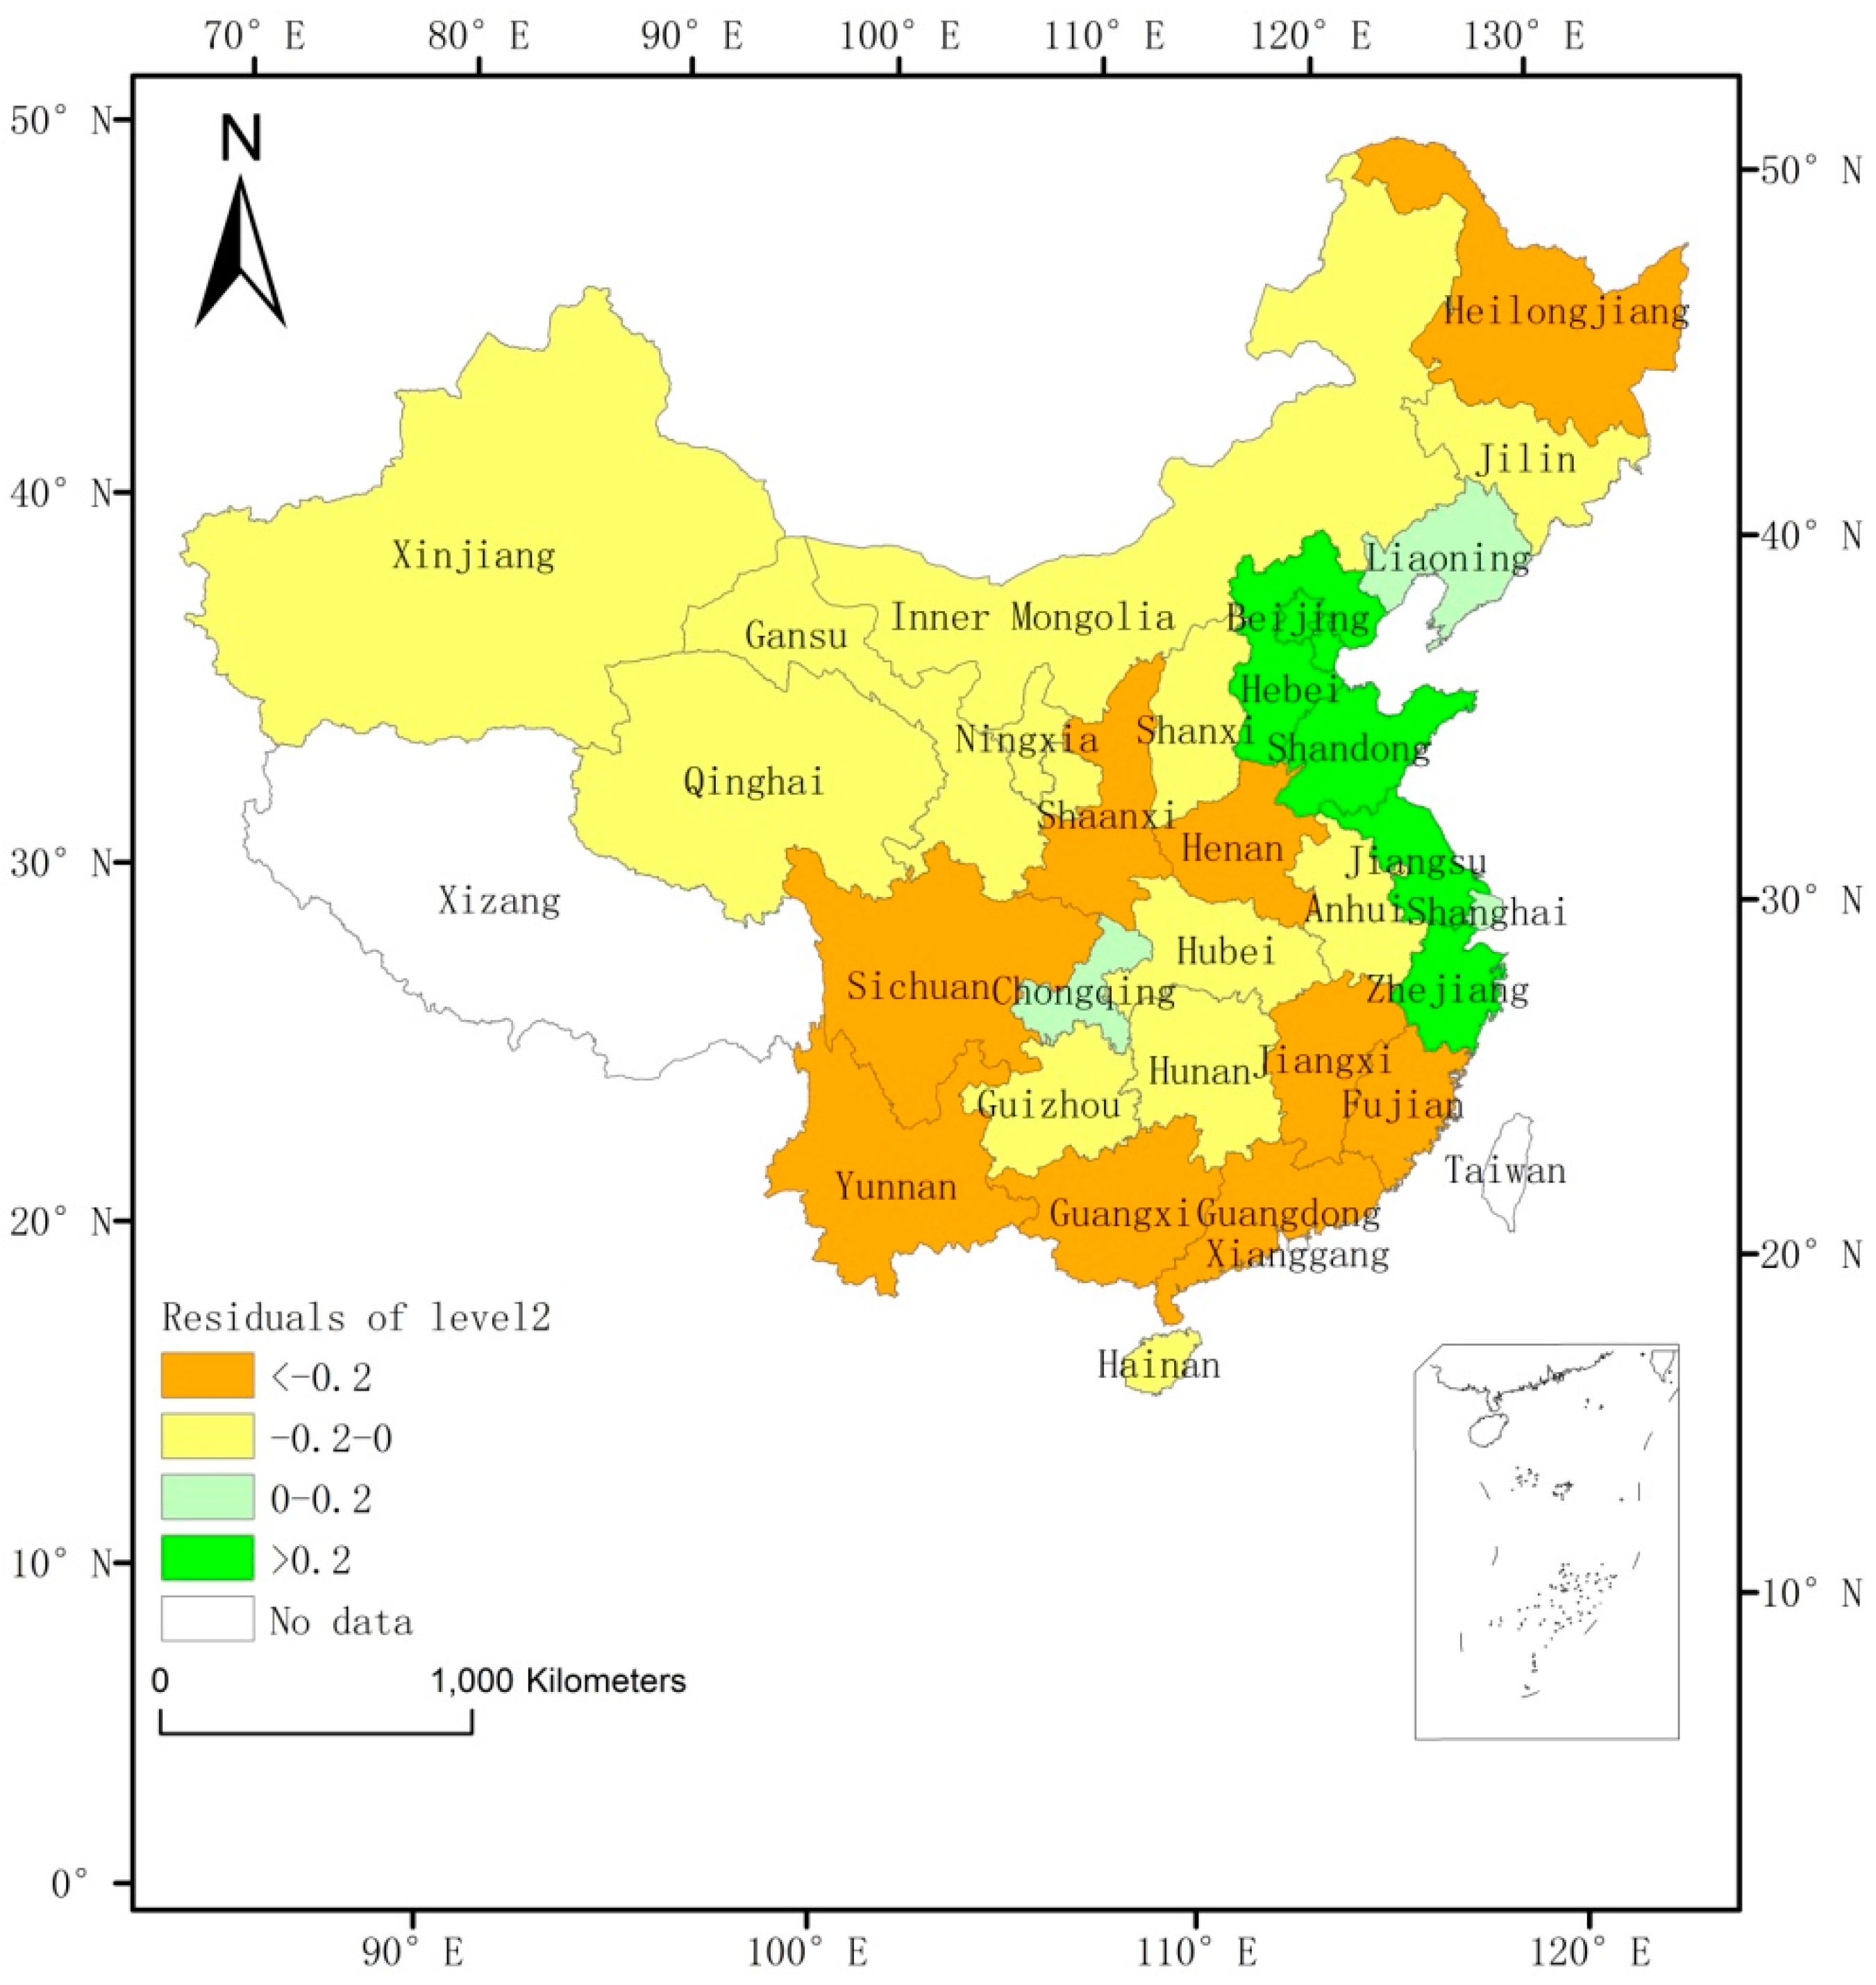
6. Discussion and Conclusions

In the studies of China’s expansion of developed land, the data of land expansion are from a variety of sources. In this study, we use GlobeLand30 data of year 2000 and 2010 to investigate the drivers of impervious surface expansion in China. The GlobeLand30 used in this study is high in accuracy and can provide a sound basis for global comparative study. Based on the existing literature, a multilevel model was applied to validate the recent theoretical progress and the most commonly used variables by controlled for provincial differences.
Most results are consistent with the previous research [15,19,40]. The demand of the market is important to promote the expansion of the impervious surfaces. The GDP and WAG are positively correlated with the expansion of impervious surfaces, which is in agreement with the market-based theory. Meanwhile, the variables related to the supply of land exhibited positive effects. The results imply that the expansion of impervious surfaces in China is deeply affected by the land supply controlled by the government. Additionally, our study reveals that the amount of cultivated land is related to the increase of impervious surfaces. This implies the appeal to strengthen the protection of arable land is not outdated. Meanwhile, a few variables in this study exhibit some differences from those of previous studies that are based on the government statistics [16,17,18]. For example, according to the statistical data, the factors of decentralization and administrative level are usually significant, but it is not significant to the results of this paper. Inconsistencies in these results may be due to differences in the data itself. A comparison of the results from different data sources provides us with a better understanding of these variables.
In this study, for the variables that are statistically significant, their correlation index values are less than 0.3. GDP has the highest positive impact on the expansion of impervious surfaces. When the GDP rose by 1%, the size of the impervious surfaces rose by 0.29%. The variable of RLTF reflects the land institution. It has also a relatively higher positive impact. These results are consistent with some existing studies [17,18,19]. Some variables have a negative impact, such as SUB. This may be caused by the illegal land use which is reflected more in the remote sensing data. Out results confirm that economic growth and the land supply institution are the most important driving factors of the expansion of impervious surfaces. It is helpful for urban planners and government officials to predict the future expansion. When the economic growth slows down, they should consider adjusting the expectation on impervious surface expansion, and pay attention to the impact of land supply institution.
The latest GlobeLand30 dataset at a global scale provides new opportunities for studying land use and is beneficial for comparisons with different countries and other data sources. If more data in the framework of the GlobeLand30 are published in the future, the studies for some specific policy implementation periods are also necessary. Nevertheless, the data also have limits. For example, the data from the remote sensing cannot provide further research on the driving forces of different land types. Additionally, in further research, combining the remote sensing data in the global framework with the statistical data at different scales at high resolutions should be pursued.

Acknowledgments

This work was supported by the Surveying, Mapping, and Geoinformation Public Science and Technology Projects of China (201512028), National Natural Science Foundation of China (41761023).

Author Contributions

Cong Liao and Teqi Dai conceived the study, supervised the experiments, and edited the manuscript. The other co-authors contributed to the discussion and manuscript editing. All the authors contributed significantly and participated sufficiently to take responsibility for this research. Moreover, all the authors are in agreement with the submitted and accepted versions of the publication.

Conflicts of Interest

The authors declare no conflict of interest.

References

  1. Chen, J.; Chen, L.J.; Li, R.; Liao, A.P.; Peng, S.; Lu, N.; Zhang, Y.S. Spatial distribution and ten years change of global built-up areas derived from GlobeLand30. Acta Geod. Cartogr. Sin. 2015, 44, 1181–1188. (In Chinese) [Google Scholar]
  2. Chen, J. Rapid urbanization in China: A real challenge to soil protection and food security. Catena 2007, 69, 1–15. [Google Scholar] [CrossRef]
  3. Li, B.; Chen, D.; Wu, S.; Zhou, S.; Wang, T.; Chen, H. Spatio-temporal assessment of urbanization impacts on ecosystem services: Case study of Nanjing City, China. Ecol. Indic. 2016, 71, 416–427. [Google Scholar] [CrossRef]
  4. He, C.; Liu, Z.; Xu, M.; Ma, Q.; Dou, Y. Urban expansion brought stress to food security in China: Evidence from decreased cropland net primary productivity. Sci. Total Environ. 2017, 576, 660–670. [Google Scholar] [CrossRef] [PubMed]
  5. Poumanyvong, P.; Kaneko, S.; Dhakal, S. Impacts of urbanization on national transport and road energy use: Evidence from low, middle and high income countries. Energy Policy 2012, 46, 268–277. [Google Scholar] [CrossRef]
  6. Yi, Y.; Ma, S.; Guan, W.; Li, K. An Empirical Study on the Relationship between Urban Spatial Form and CO2 in Chinese Cities. Sustainability 2017, 9, 672. [Google Scholar] [CrossRef]
  7. Rahman, M.T.; Aldosary, A.S.; Mortoja, M.G. Modeling Future Land Cover Changes and Their Effects on the Land Surface Temperatures in the Saudi Arabian Eastern Coastal City of Dammam. Land 2017, 6, 36. [Google Scholar] [CrossRef]
  8. Aluko, O.E. The Impact of Urbanization on Housing Development: The Lagos Experience, Nigeria. Ethiop. J. Environ. Stud. Manag. 2011, 3, 64–74. [Google Scholar] [CrossRef]
  9. Lanrewaju, F. Urbanization, housing quality and environmental degeneration in Nigeria. J. Geogr. Reg. Plan. 2012, 16, 422–429. [Google Scholar] [CrossRef]
  10. Urbanization and Disaster Risk. Available online: http://citeseerx.ist.psu.edu/viewdoc/download;jsessionid=889D7B1D9F0FD946691837AD80659C9D?doi=10.1.1.365.6082&rep=rep1&type=pdf (accessed on 12 August 2017).
  11. Parker, D.C.; Manson, S.M.; Janssen, M.A.; Hoffmann, M.J.; Deadman, P. Multi-Agent systems for the simulation of Land-Use and Land-Cover change: A review. Ann. Assoc. Am. Geogr. 2003, 93, 314–337. [Google Scholar] [CrossRef]
  12. Seto, K.C.; Fragkias, M.; Güneralp, B.; Reilly, M.K. A Meta-Analysis of Global Urban Land Expansion. PLoS ONE 2011, 6, e23777. [Google Scholar] [CrossRef] [PubMed]
  13. Liu, Y.; Yang, Y.; Li, Y.; Li, J. Conversion from rural settlements and arable land under rapid urbanization in Beijing during 1985–2010. J. Rural Stud. 2017, 51, 141–150. [Google Scholar] [CrossRef]
  14. Tan, M.H.; Li, X.B.; Xie, H.; Lu, C.H. Urban land expansion and arable land loss in China—A case study of Beijing–Tianjin–Hebei region. Land Use Policy 2005, 22, 187–196. [Google Scholar] [CrossRef]
  15. Huang, J.K.; Zhu, L.F.; Deng, X.Z. Regional differences and determinants of built-up area expansion in China. Sci. China Ser. D 2007, 50, 1835–1843. [Google Scholar] [CrossRef]
  16. Huang, Z.J.; Wei, Y.D.; He, C.F.; Li, H. Urban land expansion under economic transition in China: A multi-level modeling analysis. Habitat Int. 2015, 47, 69–82. [Google Scholar] [CrossRef]
  17. He, C.F.; Zhou, Y.; Huang, Z.J. Fiscal decentralization, political centralization, and land urbanization in China. Urban Geogr. 2016, 37, 436–457. [Google Scholar] [CrossRef]
  18. Li, H.; Wei, Y.D.; Liao, F.H.; Huang, Z.J. Administrative hierarchy and urban land expansion in transitional China. Appl. Geogr. 2015, 56, 177–186. [Google Scholar] [CrossRef]
  19. Deng, X.Z.; Huang, J.K.; Rozelle, S.; Uchida, M. Economic growth and the expansion of urban land in China. Urban Stud. 2010, 47, 813–843. [Google Scholar] [CrossRef]
  20. Ding, C.R. Policy and praxis of land acquisition in China. Land Use Policy 2007, 24, 1–13. [Google Scholar] [CrossRef]
  21. Ma, Y.L.; Xu, R.S. Remote sensing monitoring and driving force analysis of urban expansion in Guangzhou City, China. Habitat Int. 2010, 34, 228–235. [Google Scholar] [CrossRef]
  22. Liu, Y.L.; Luo, T.; Liu, Z.Q.; Kong, X.S.; Li, J.W.; Tan, R.H. A comparative analysis of urban and rural construction land use change and driving forces: Implications for urban-rural coordination development in Wuhan, Central China. Habitat Int. 2015, 47, 113–125. [Google Scholar] [CrossRef]
  23. Huang, D.Q.; Jin, H.R.; Zhao, X.S.; Liu, S.H. Factors influencing the conversion of arable land to urban use and policy implications in Beijing, China. Sustainability 2014, 7, 180–194. [Google Scholar] [CrossRef]
  24. You, H.Y. Quantifying megacity growth in response to economic transition: A case of Shanghai, China. Habitat Int. 2016, 53, 115–122. [Google Scholar] [CrossRef]
  25. Seto, K.C.; Kaufmann, R.K. Modeling the Drivers of Urban Land Use Change in the Pearl River Delta, China: Integrating Remote Sensing with Socioeconomic Data. Land Econ. 2003, 79, 106–121. [Google Scholar] [CrossRef]
  26. Gao, J.L.; Wei, Y.D.; Chen, W.; Chen, J.L. Economic transition and urban land expansion in Provincial China. Habitat Int. 2014, 44, 461–473. [Google Scholar] [CrossRef]
  27. Alonso, W. Location and Land Use, Toward a General Theory of Land Rent; Harvard University Press: Cambridge, UK, 1964. [Google Scholar]
  28. Jiang, L.; Deng, X.Z.; Seto, K.C. Multi-level modeling of urban expansion and cultivated land conversion for urban hotspot counties in China. Landsc. Urban Plan. 2012, 108, 131–139. [Google Scholar] [CrossRef]
  29. Ping, Y.C. Explaining land use change in a Guangdong county: The supply side of the story. China Q. 2011, 207, 626–648. [Google Scholar] [CrossRef]
  30. Zhong, T.; Chen, Y.; Huang, X. Impact of land revenue on the urban land growth toward decreasing population density in Jiangsu Province, China. Habitat Int. 2016, 58, 34–41. [Google Scholar] [CrossRef]
  31. Kuang, W.H.; Liu, J.Y.; Dong, J.W.; Chi, W.F.; Zhang, C. The rapid and massive urban and industrial land expansions in China between 1990 and 2010: A CLUD-based analysis of their trajectories, patterns, and drivers. Landsc. Urban Plan. 2016, 145, 21–33. [Google Scholar] [CrossRef]
  32. Liu, W.; Liu, J.; Kuang, W.; Jia, N. Examining the influence of the implementation of Major Function-oriented Zones on built-up area expansion in China. J. Geogr. Sci. 2017, 27, 644–660. [Google Scholar] [CrossRef]
  33. Lichtenberg, E.; Ding, C.R. Local officials as land developers: Urban spatial expansion in China. J. Urban Econ. 2009, 66, 57–64. [Google Scholar] [CrossRef]
  34. Chen, Z.; Tang, J.; Wan, J.; Chen, Y. Promotion incentives for local officials and the expansion of urban construction land in China: Using the Yangtze River Delta as a case study. Land Use Policy 2017, 63, 214–225. [Google Scholar] [CrossRef]
  35. Zhang, Q.; Wallace, J.; Deng, X.Z.; Seto, K.C. Central versus local states: Which matters more in affecting China’s urban growth? Land Use Policy 2014, 38, 487–496. [Google Scholar] [CrossRef]
  36. Yeh, G.O.A.; Li, X. Economic development and agricultural land loss in the Pearl River delta, China. Habitat Int. 1999, 23, 373–390. [Google Scholar]
  37. Liu, J.; Deng, X. Spatio-Temporal Patterns and Driving Forces of Urban Land Expansion in China during the Economic Reform Era. Ambio 2005, 34, 450–455. [Google Scholar] [CrossRef] [PubMed]
  38. Schneider, A.; Mertes, C.M. Expansion and growth in Chinese cities, 1978–2010. Environ. Res. Lett. 2014, 9, 024008. [Google Scholar] [CrossRef]
  39. Liu, J.Y.; Liu, M.L.; Zhuang, D.F.; Zhang, Z.X.; Deng, X.Z. Study on spatial pattern of land-use change in China during 1995–2000. Sci. China Ser. D 2003, 46, 373–384. [Google Scholar]
  40. Deng, X.Z.; Huang, J.K.; Rozelle, S.; Uchida, E. Growth, population and industrialization, and urban land expansion of China. J. Urban Econ. 2008, 63, 96–115. [Google Scholar] [CrossRef]
  41. He, C.F.; Huang, Z.J.; Wang, R. Land use change and economic growth in urban China: A structural equation analysis. Urban Stud. 2014, 51, 2880–2898. [Google Scholar] [CrossRef]
  42. Seto, K.C.; Kaufmann, R.K.; Woodcock, C.E. Landsat reveals China’s farmland reserves, but they’re vanishing fast. Nature 2000, 406, 121. [Google Scholar] [CrossRef] [PubMed]
  43. Martínez, S.; Mollicone, D. From Land Cover to Land Use: A Methodology to Assess Land Use from Remote Sensing Data. Remote Sens. 2012, 4, 1024–1045. [Google Scholar] [CrossRef]
  44. Mundia, C.N.; Aniya, M. Analysis of land use/cover changes and urban expansion of Nairobi city using remote sensing and GIS. Int. J. Remote Sens. 2005, 26, 2831–2849. [Google Scholar] [CrossRef]
  45. Tian, L.; Ma, W. Government intervention in city development of China: A tool of land supply. Land Use Policy 2009, 26, 599–609. [Google Scholar] [CrossRef]
  46. National Geomatics Center of China (NGCC). Available online: http://ngcc.sbsm.gov.cn/article/en/ps/mp/201302/20130200001694.shtml (accessed on 8 February 2017).
  47. Chen, J.; Liao, A.P.; Cao, X.; Chen, L.J.; Chen, X.H.; He, C.Y.; Han, G.; Peng, S.; Lu, M.; Zhang, W.W.; et al. Global land cover mapping at 30 m resolution: A POK-based operational approach. ISPRS J. Photogramm. Remote Sens. 2015, 103, 7–27. [Google Scholar] [CrossRef]
  48. Brovelli, M.; Molinari, M.; Hussein, E.; Chen, J.; Li, R. The First Comprehensive Accuracy Assessment of GlobeLand30 at a National Level: Methodology and Results. Remote Sens. 2015, 7, 4191–4212. [Google Scholar] [CrossRef] [Green Version]
  49. Xie, H.; Du, L.; Liu, S.C.; Chen, L.; Gao, S.; Liu, S.; Pan, H.Y.; Tong, X.H. Dynamic Monitoring of Agricultural Fires in China from 2010 to 2014 Using MODIS and GlobeLand30 Data. Int. J. Geo-Inf. 2016, 5, 172. [Google Scholar] [CrossRef]
  50. Pan, W.K.Y.; Bilsborrow, R.E. The use of a multilevel statistical model to analyze factors influencing land use: A study of the Ecuadorian Amazon. Glob. Planet Chang. 2005, 47, 232–252. [Google Scholar] [CrossRef]
  51. Qian, Z. Master plan, plan adjustment and urban development reality under China’s market transition: A case study of Nanjing. Cities 2013, 30, 77–88. [Google Scholar] [CrossRef]
  52. Zhong, T.Y.; Mitchell, B.; Huang, X.J. Success or failure: Evaluating the implementation of China’s National General Land Use Plan (1997–2010). Habitat Int. 2014, 44, 93–101. [Google Scholar] [CrossRef]
  53. Anselin, L.; Syabri, I.; Kho, Y. GeoDa: An introduction to spatial data analysis. Geogr. Anal. 2006, 38, 5–22. [Google Scholar] [CrossRef]
  54. Ord, J.K.; Getis, A. Local spatial autocorrelation statistics: Distributional issues and an application. Geogr. Anal. 1995, 27, 286–306. [Google Scholar] [CrossRef]
  55. Straszhei, M.; Mahlon, R. An Econometric Analysis of the Urban Housing Market; National Bureau of Economic Research: New York, NY, USA, 1975. [Google Scholar]
  56. Wang, Y.; Scott, S. Illegal Farmland Conversion in China’s Urban Periphery: Local Regime and National Transitions. Urban Geogr. 2008, 29, 327–347. [Google Scholar] [CrossRef]
  57. Lin, G.C.S.; Ho, S.P.S. The state, land system, and land development processes in contemporary China. Ann. Assoc. Am. Geogr. 2005, 95, 411–436. [Google Scholar] [CrossRef]
  58. Liu, Y.; Yang, R.; Long, H.; Gao, J.; Wang, J. Implications of land-use change in rural China: A case study of Yucheng, Shandong province. Land Use Policy 2014, 40, 111–118. [Google Scholar] [CrossRef]
  59. Lichtenberg, E.; Ding, C. Chapter 5: Assessing Farmland Protection Policy in China. Land Use Policy 2008, 25, 59–68. [Google Scholar] [CrossRef]
Figure 1. Study area.
Ijgi 06 00264 g001
Figure 2. Spatial distribution of impervious surface expansion.
Ijgi 06 00264 g002
Figure 3. Hotspot analysis of impervious surface expansion at the prefecture level.
Ijgi 06 00264 g003
Figure 4. The province residuals.
Ijgi 06 00264 g004
Figure 5. Normal plot of the level-1 residuals.
Ijgi 06 00264 g005
Table 1. Variables with more than three occurrences and their significance frequency.
VariableImpervious Surface Expansion
Frequency of OccurrenceFrequency of Significance of Level 0.1
FDI (or the ratio of FDI to GDP)87
The increase in GDP77
Total population (or non-agricultural population)76
Population density54
GDP2 (or the proportion)54
The ratio of private workers (Employees)44
Average wages44
development zones dummy (or high-tech industrial number)44
Cultivation land area (or per capita)42
Plain ratio44
Precipitation44
Temperature42
Distance to the provincial capital42
GDP3 (or the proportion)32
The ratio of total amount of international trade to GDP (or international trade)32
Agricultural investment32
The ratio of land transferring fees to fiscal revenue33
Fiscal expenditure33
The ratio of fiscal revenue to fiscal expenditure33
Neighboring effect33
Time dummy33
Slope32
Elevation32
Administration dummy (municipalities, sub-provincial cities, or provincial capital)33
Table 2. Definitions and descriptive statistics of variables.
VariablesDescriptionsMinimumMaximumMeanStandard Deviation
GDPAn increase in GDP from 2000 to 2010 (billion RMB)125.21261512541627
FDIThe share of the total increase in actual foreign investment to GDP (%)−0.0020.020.0020.002
RLFEThe ratio of fiscal expenditure per capita at the prefectural level to that at the provincial level (%)010.110.16
RLTFThe ratio of the total of land transfer fees to fiscal revenue (%)0.042.330.800.47
LABThe percentage of increase by private workers to the increase in total workers (%)0.020.980.310.62
WAGThe increase in average wages per capita (10 thousand RMB)0.705.332.320.60
POPThe increase in total population (number)−534153847
CAPWhether a city was a provincial capital010.120.32
SUBWhether a city was a sub-provincial city010.060.23
DZWhether a city has national economic and technological development zones010.260.44
control variables
PSENThe proportion of the secondary economic sector (%)0.170.890.510.10
CULThe cultivated area in 2000 (thousand hectares)31815308266
provincial level
PPOPThe increase in the population density of the provinces (person/km2)426641.935.37
PGDPThe increase in the GDP density of the provinces (hundred million RMB/km2)0.011.990.120.15
Table 3. Correlation coefficients among dependent variables.
GDPFDIRLFERLTFLabWagPopCapSubDZPSENCul
GDP1
FDI0.29 **1
RLFE0.56 **0.15 **1
RLTF0.110.16 *−0.111
Lab−0.020.04−0.100.031
Wag0.61 **0.25 **0.43 **0.11−0.101
Pop0.37 **0.040.32 **−0.07−0.030.111
Cap0.50 **0.20 **0.59 **0.00−0.17 **0.39 **0.44 **1
Sub0.44 **0.24 **0.24 **0.110.030.26 **0.18 **0.43 **
DZ0.43 **0.36 **0.36 **0.19 **−0.110.34 **0.23 **0.50 **0.30 **1
PSEN−0.050.08−0.19 **−0.090.010.13 **−0.18 **−0.23 **−0.12−0.051
Cul0.12−0.060.15−0.070.05−0.080.190.080.090.02−0.251
** p-value < 0.01; * p-value < 0.05.
Table 4. Statistical analysis of impervious surface expansion in hotspots areas.
The Number of Prefecture Level CitiesAverage Increased Area (km2)The Ratio of the Increased Area to the Total Area
Beijing-Tianjin-Hebei region7602.583.88%
Yangtze River Delta12399.246.10%
Shandong peninsula13312.623.28%
the total samples259990.74%
Table 5. The result of the regression.
VariablesMulti-Level Regression (2000–2010)
prefecture level
GDP0.289 ***
FDI0.072
RLFE−0.03
RLTF0.163 ***
LAB0.023
WAG0.215 ***
POP−0.101 *
CAP0.06
SUB−0.305 ***
DZ−0.144
PSEN−0.033
CUL0.18 ***
provincial level
PGDP0.125 *
PPOP−0.061
−2×log likelihood637.13
likelihood ratio test<0.001
Note: * p < 0.1, *** p < 0.01.

