Using Eye Tracking to Explore the Guidance and Constancy of Visual Variables in 3D Visualization

1
State Key Laboratory of Remote Sensing Science, Beijing Key Laboratory for Remote Sensing of Environment and Digital Cities, Research Center of Geospatial Cognition and Visual Analytics, and Faculty of Geographical Science, Beijing Normal University, Beijing 100875, China
2
Technical University of Munich, Munich 80333, Germany
*
Author to whom correspondence should be addressed.
ISPRS Int. J. Geo-Inf. 2017, 6(9), 274; https://0-doi-org.brum.beds.ac.uk/10.3390/ijgi6090274
Submission received: 1 August 2017
/
Revised: 27 August 2017
/
Accepted: 29 August 2017
/
Published: 1 September 2017
Abstract
:An understanding of guidance, which means guiding attention, and constancy, meaning that an area can be perceived for what it is despite environmental changes, of the visual variables related to three-dimensional (3D) symbols is essential to ensure rapid and consistent human perception in 3D visualization. Previous studies have focused on the guidance and constancy of visual variables related to two-dimensional (2D) symbols, but these aspects are not well documented for 3D symbols. In this study, we used eye tracking to analyze the visual guidance from shapes, hues and sizes, and the visual constancy that is related to the shape, color saturation and size of 3D symbols in different locations. Thirty-six subjects (24 females and 12 males) participated in the study. The results indicate that hue and shape provide a high level of visual guidance, whereas guidance from size, a variable that predominantly guides attention in 2D visualization, is much more limited in 3D visualization. Additionally, constancy of shape and saturation are perceived with relatively high accuracy, whereas constancy of size is perceived with only low accuracy. These first empirical studies are intended to pave the way for a more comprehensive user understanding of 3D visualization design.
1. Introduction
Currently, three-dimensional (3D) visualizations are widely used in geo-visualization [1,2], urban planning [3], the teaching of various subjects [4,5] and other applications [6]. Many researchers have attempted to improve the 3D models and solve 3D modeling problems such as the limited resources of portable devices for 3D displays [7]. However, the rapid and correct perception of 3D symbols is important for users because such perceptions are the basis of pattern searching, a task at which humans perform better than computational systems [8].
Visual guidance [9,10,11] and visual constancy [12] are two attributes of visual variables that can help people to quickly and correctly perceive their surroundings. Vision is very important in perceiving the world. When we must find a specific object, we do not search randomly; instead, our attention is guided by certain objects. For example, when we search for an apple, we look for spheres and ignore long cylinders, such as bananas. This phenomenon is called guided search [11]. The concept of the specific visual variables (e.g., hue, size, and shape) that lead such guided searches to likely targets [9,11] is called visual guidance in this study. Meanwhile, visual constancy or visual perceptual constancy refers to the ability of our eyes to constantly perceive the world as it truly is despite changes to the images that form on our retinas [12]. For example, the fact that we perceive the color of an object as unchanged despite changes in illumination or viewing angle is referred to as color constancy [13]. Here ‘color’ represents hue, one of the three visual variables that color has (the other two are saturation and value [14]).
The development of 3D visualization techniques and the use of these methods in cartography (i.e., the creation of 3D maps) call for further studies of how people perceive 3D visualizations. Various types of visualizations are called ‘3D’. While headsets can be used to create immersive 3D or virtual reality environments, cartographers also regard 3D models presented on 2D screens as 3D visualizations [3,15,16] because they provide height information as well. Generally, 3D visualizations are created from a lateral view to show height information in 2D graphs. Although textures can make 3D visualizations more vivid, symbolized and abstracted 3D visualizations are common at present (Supplementary Figure S1). In this study, 3D refers to graphics of 3D models represented on 2D screens.
3D maps can be highly interactive [17,18]; these maps are rotatable, and the azimuth angle can vary continuously. Additionally, the visual variables of 3D symbols may perform differently compared to those of flat symbols in traditional two-dimensional (2D) maps due to environmental factors, for example, depth cues can influence perceptions of shape [19] and size [20,21,22]. Therefore, we must understand the rules of visual variables with regard to guidance and constancy in 3D visualizations. Complex symbols, such as building models featuring high-levels of detail and texture, may show guidance or constancy properties that differ from those of simple 3D symbols. However, simple 3D symbols, which are more generic in nature and are the basis of more complex 3D symbols, may be suitable for use in a larger number of situations, such as in various types of data visualizations. Therefore, our study focuses on simple geometric symbols such as spheres, cylinders and cones.
In this study, our goal is to determine whether hue, shape and size show visual guidance and saturation, shape and size already are known to show constancy in 3D visualizations. The paper is organized in five further sections. In Section 2, we review related works concerning the perception of visual variables that employ eye-tracking to investigate visual guidance in 2D visualization and constancy in the physical world. The experimental design and analysis are described in Section 3. The experimental results are described in Section 4 and discussed in Section 5. In Section 6, we summarize the results and discuss future work to solve scientific questions not addressed in this study.
2. Background and Related Work
Following the widespread adoption of Berlin’s seven visual variables in cartography [14], researchers have investigated map design from the perspective of visual variables. Subsequently, many researchers have proposed new visual variables [23,24,25,26,27] (Supplementary Figure S2). Eye tracking is an objective, precise and quantitative way to investigate how users perceive certain information [28,29], and it has been widely used to conduct empirical studies of visual variables to aid researchers in understanding how tasks are completed and “why certain visual variables look good.” Garlandini and Fabrikant [10] applied eye-tracking technology to flicker tasks to evaluate the visual guidance from four commonly used visual variables in 2D map symbols (i.e., size, color value, color hue and orientation) and found that size is the most efficient and effective visual variable to enable change detection under flicker conditions. However, flicker displays are not commonly used for maps or other visualizations. In addition, 3D visualization is a markedly different visualization method [29]; therefore, visual variables may perform differently in a 3D context than in a 2D context. In this study, we use static displays of 3D objects to evaluate the guidance and constancy of visual variables.
Visual perception is a reaction of the human visual system to physical stimuli. According to Marr’s (1982) approach to vision (cited by [25]), two visual stages exist; first, a person determines the pixel-to-pixel contrast of a retinal image in a process called pre-attention; second, the person groups this information to form edges, regions and shapes. Consequently, processing visual variables that require only information related to individual pixels, such as colors, should be easier than processing visual variables that require edge recognition, such as shapes. In addition to developing the above visual theories, researchers have conducted various experiments to determine the rules that govern the guidance properties of visual variables (Supplementary Table S1).
Previous studies have demonstrated that color provides important guidance in 2D-object searches [9,30,31]. Similar experiments have shown that shape provides weaker guidance than color and size in 2D tasks [32,33]. Wolfe and Horowitz [9] concluded that size clearly guides visual attention, but this finding was based on only one-dimensional (1D) sizes (length) [34] and spatial frequencies [35,36]. Few studies have investigated the guidance properties of these variables in 3D visualizations, even though their perceptions may differ because of the increased dimensionality. For example, shape is more variable in a 3D visualization than in a 2D visualization, providing more identical characteristics [37] on which people can rely to identify objects and therefore providing stronger guidance.
Perceptual constancy is typically evaluated in the physical world. Studies have shown that various factors can influence the perception of color under certain conditions [38,39,40,41], shapes [42] and sizes [20,43]. Although the phenomenon of constancy in 3D visualization remains poorly documented, studies have shown that perceptual constancy is a contextual factor that is strongly influenced by the environment [44,45,46,47]. A 3D visualization is a model of reality to some degree [48]; therefore, its constancy properties should show different trends according to the level of realism, and they may not be the same in simple geometric environments as they are in the physical world.
In this study, we focus on the guidance and constancy properties of size, shape and hue (for guidance) or saturation (for constancy) in 3D visualization. According to Bertin, size is the only dissociative and quantitative visual variable (Supplementary Table S2); consequently, visually detecting variations in size is easier than detecting variations in other variables [8]. Shape is not selective; therefore, symbols cannot be easily selected to form a group based on shape. In contrast, hue is selective, associative and non-quantitative [10,14], and it is the most distinctive visual variable of color. Previous studies have shown that deviations in color perception are related to either saturation or value rather than hue [38,39]. In addition, saturation can effectively code ordinal data [8] that require precise perception. Therefore, we chose saturation as our focus with regard to constancy.
3. Methods and Materials
3.1. Experimental Design
The main goal of this study was to evaluate the guidance and constancy properties of three commonly used visual variables (i.e., size, shape and color) in 3D visualization. The experiment consisted of two parts: Experiment 1 (Exp. 1) was related to guidance and Experiment 2 (Exp. 2), was related to constancy (as affected by location). Each component included three sub-tasks (task groups), each of which addressed one visual variable (Table 1). For Exp. 2, we selected saturation as the color variable of interest, as mentioned in the Background and Related Studies section.
Identification is the least sophisticated task in interactive geo-visualizations [49,50], and it is also applied in guidance experiments related to non-geo-visualizations [9]. In Exp. 1, we focused on identification tasks by considering three shapes (spheres, cones and cubes) and three hues (red, yellow and blue). However, we used only one color, one shape and one directional change (expansion, not shrinking) for the size-related sub-task because the scene was already complex (meaning that the retinal sizes were variant) even without any variations.
Three factors were considered in the design of Exp. 2.1: the position where the change occurred, the memory effect and the training effect. The perception of identical changes in size may differ if those changes occur at different positions; therefore, size changes at each possible position should be investigated. In this experiment, we defined six positions (explained in detail in the Materials section). If all six objects were to change at the same time, the stimulus could cause the subject to become confused. Therefore, the size of only one object was changed at a time.
In this case, replacing some objects to form new scenes was necessary to avoid memory effects. To this end, six different scenes (Supplementary Table S3, ①–⑥) were used, and each subject was asked to complete each task six times to eliminate differences among individuals. We used 6 (positions) × 6 (scenes) = 36 materials in Exp. 2.1 to investigate the corresponding visual variable. The six groups associated with each scene (Supplementary Table S3 G1–G6) were shown to each subject only once.
If all the subjects had undertaken these tasks in the same sequence, the accuracy for the last administered task might be significantly higher than that for the first because of training effects on the subjects during the tasks [51]. Therefore, we used a Latin Square design (Supplementary Table S3) to adjust the sequence of the position changes. The entire experimental procedure is explained in the Procedures section. The same design was used for Exp. 2.2 (shape) and Exp. 2.3 (color saturation).
3.2. Participants
Thirty-six undergraduate and graduate students from Beijing Normal University participated in this experiment. Each subject received ¥10 or a gift of equal value for his/her participation. The participants included 12 males and 24 females with an average age of 22 years (SD = 4.06). None reported having color blindness. All the subjects had normal or corrected-normal vision.
Knowledge of the size-distance effect (i.e., the fact that the same object can appear smaller from a greater distance) can influence a participant’s performance in estimating objective size [52]. In this experiment, all the male subjects and 20 of the female subjects reported that they were aware of this visual effect; the remaining 4 female subjects reported they had not been aware of this effect before participating in the study. The study was approved by the institutional review board of the university to which the authors belong. All participants provided their written informed consent to participate in the experiment.
3.3. Apparatus
Eye-tracking technology from Tobii Studio (http://www.tobii.com/) was used in this experiment. The software, Tobii Studio 3.2, was installed on a Lenovo PC. A Tobii T120 Eye Tracker, with a sampling rate of 120 Hz, was mounted on a 17-in thin-film transistor (TFT) display with a screen resolution of 1024 × 768 and used to record the participants’ eye movements. At the time of the study, this display had been in use for two years.
3.4. Materials
We used Trimble SketchUp to edit the stimuli (FOV = 35°, using a viewpoint height of h = 50 m, default lighting and background settings). The original materials were true-3D in nature, and we took screenshots of the models; thus, the stimuli that were used in the experiment were pseudo-3D in nature. We ensured that all the objects could be completely seen to eliminate the potential influence of interposition and occlusion effects.
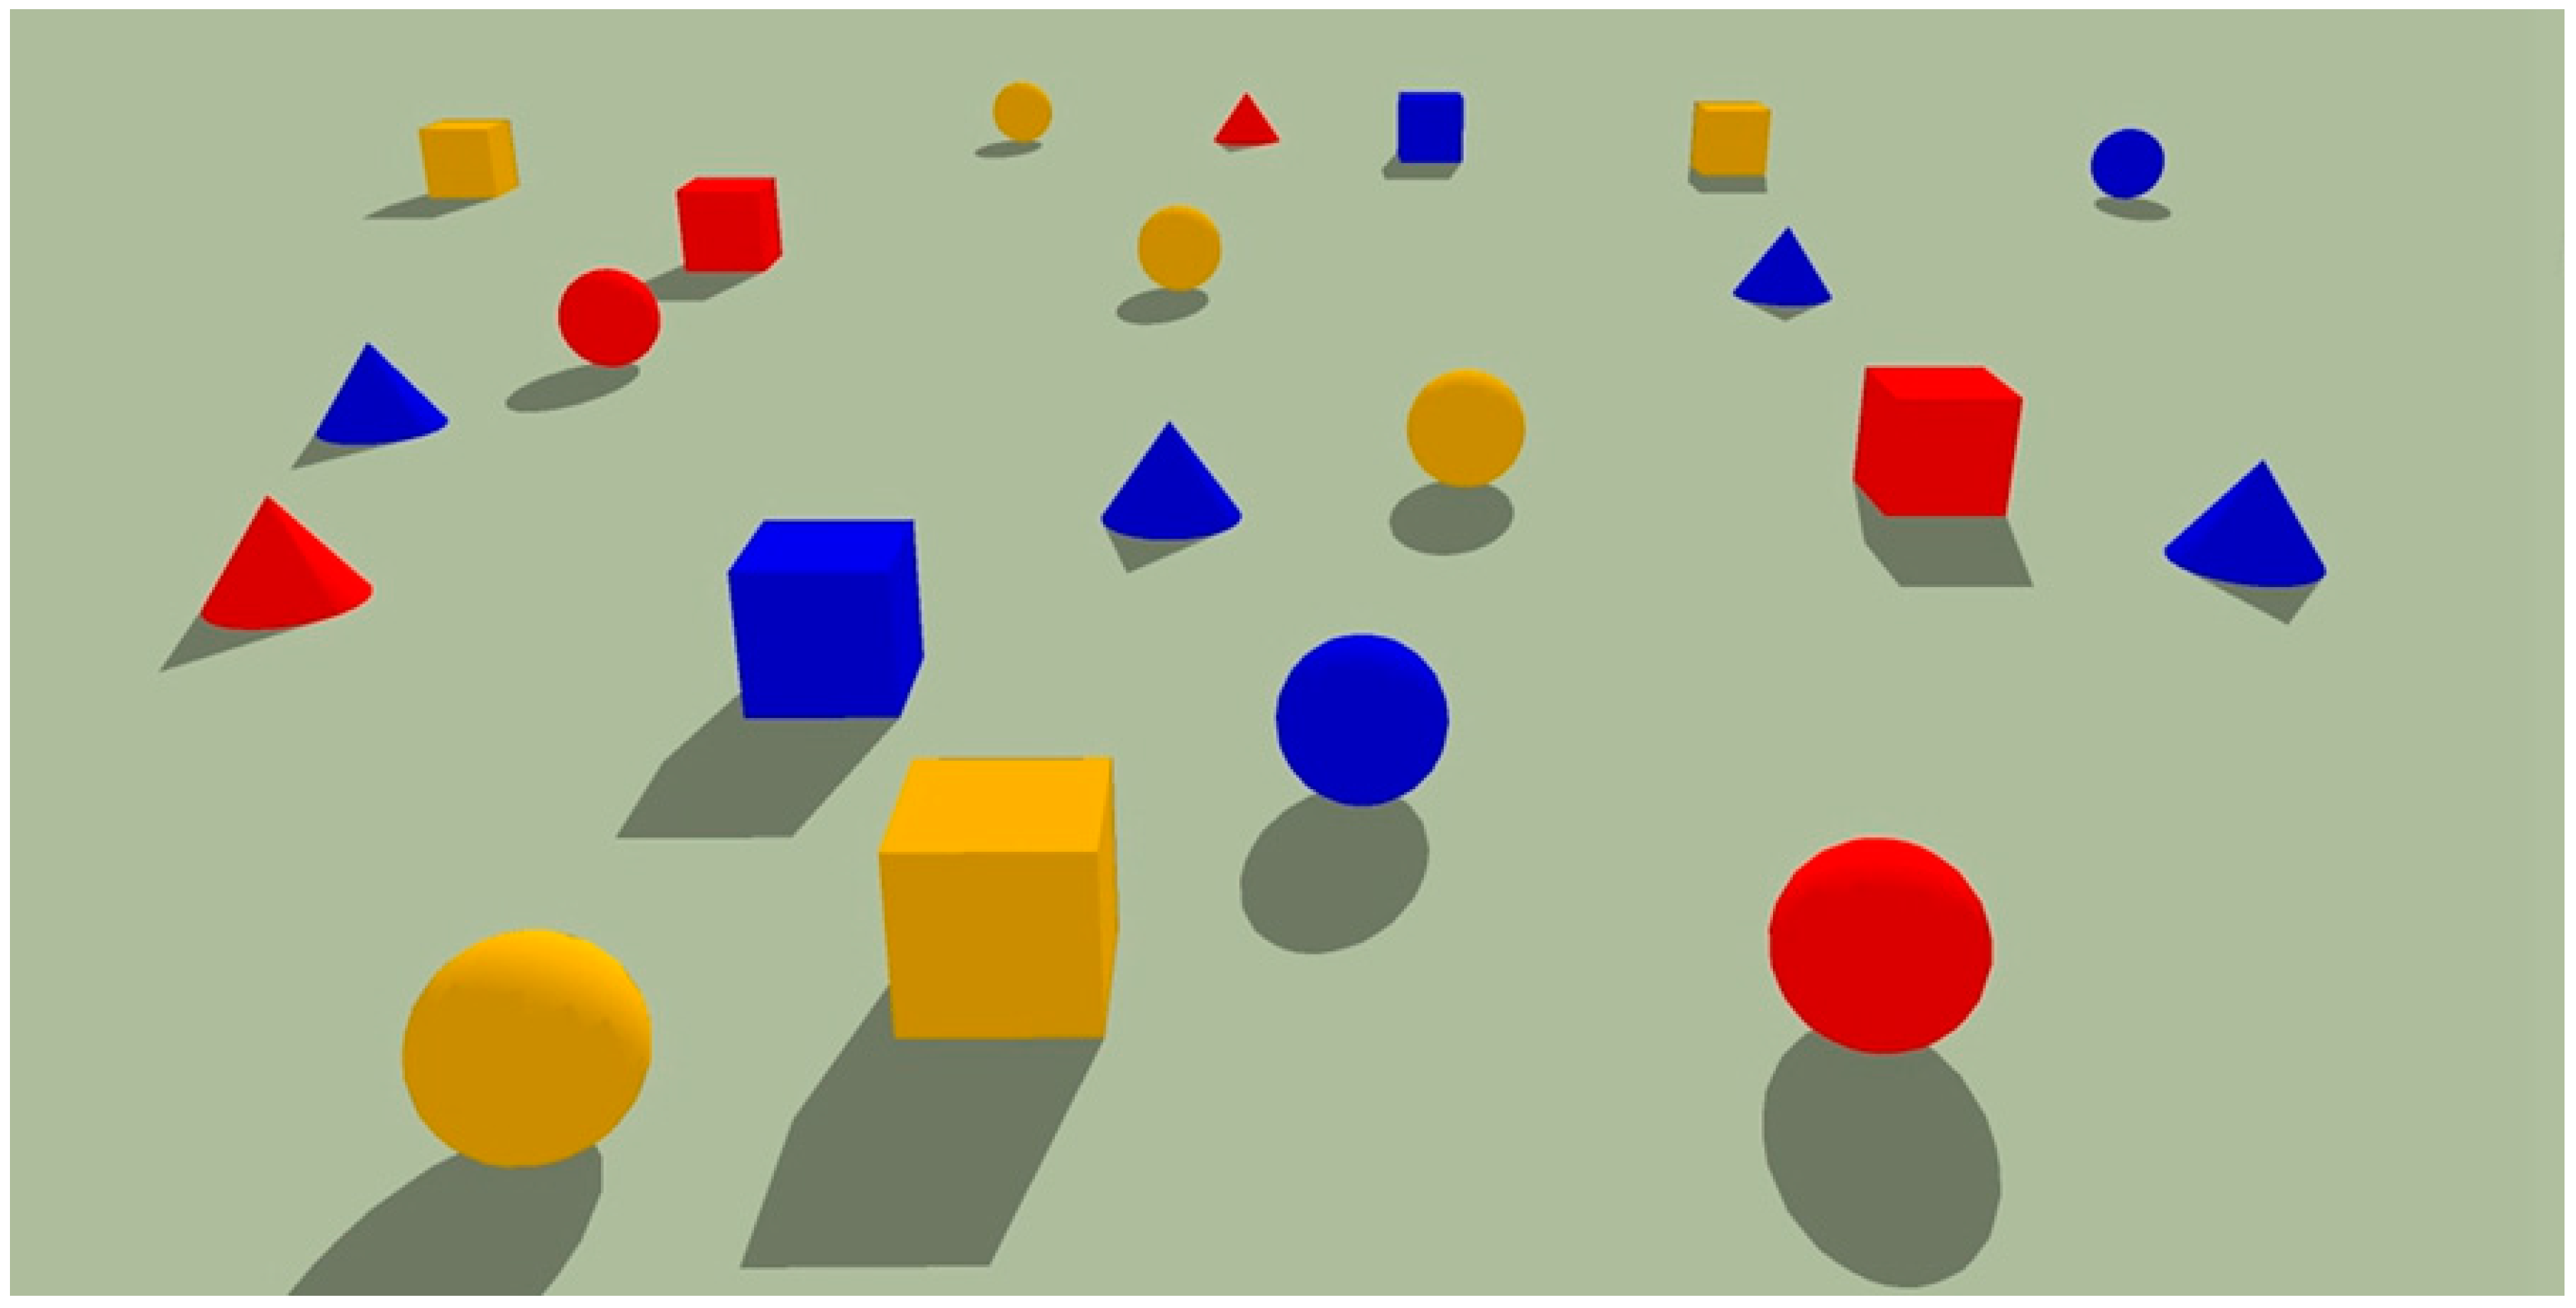
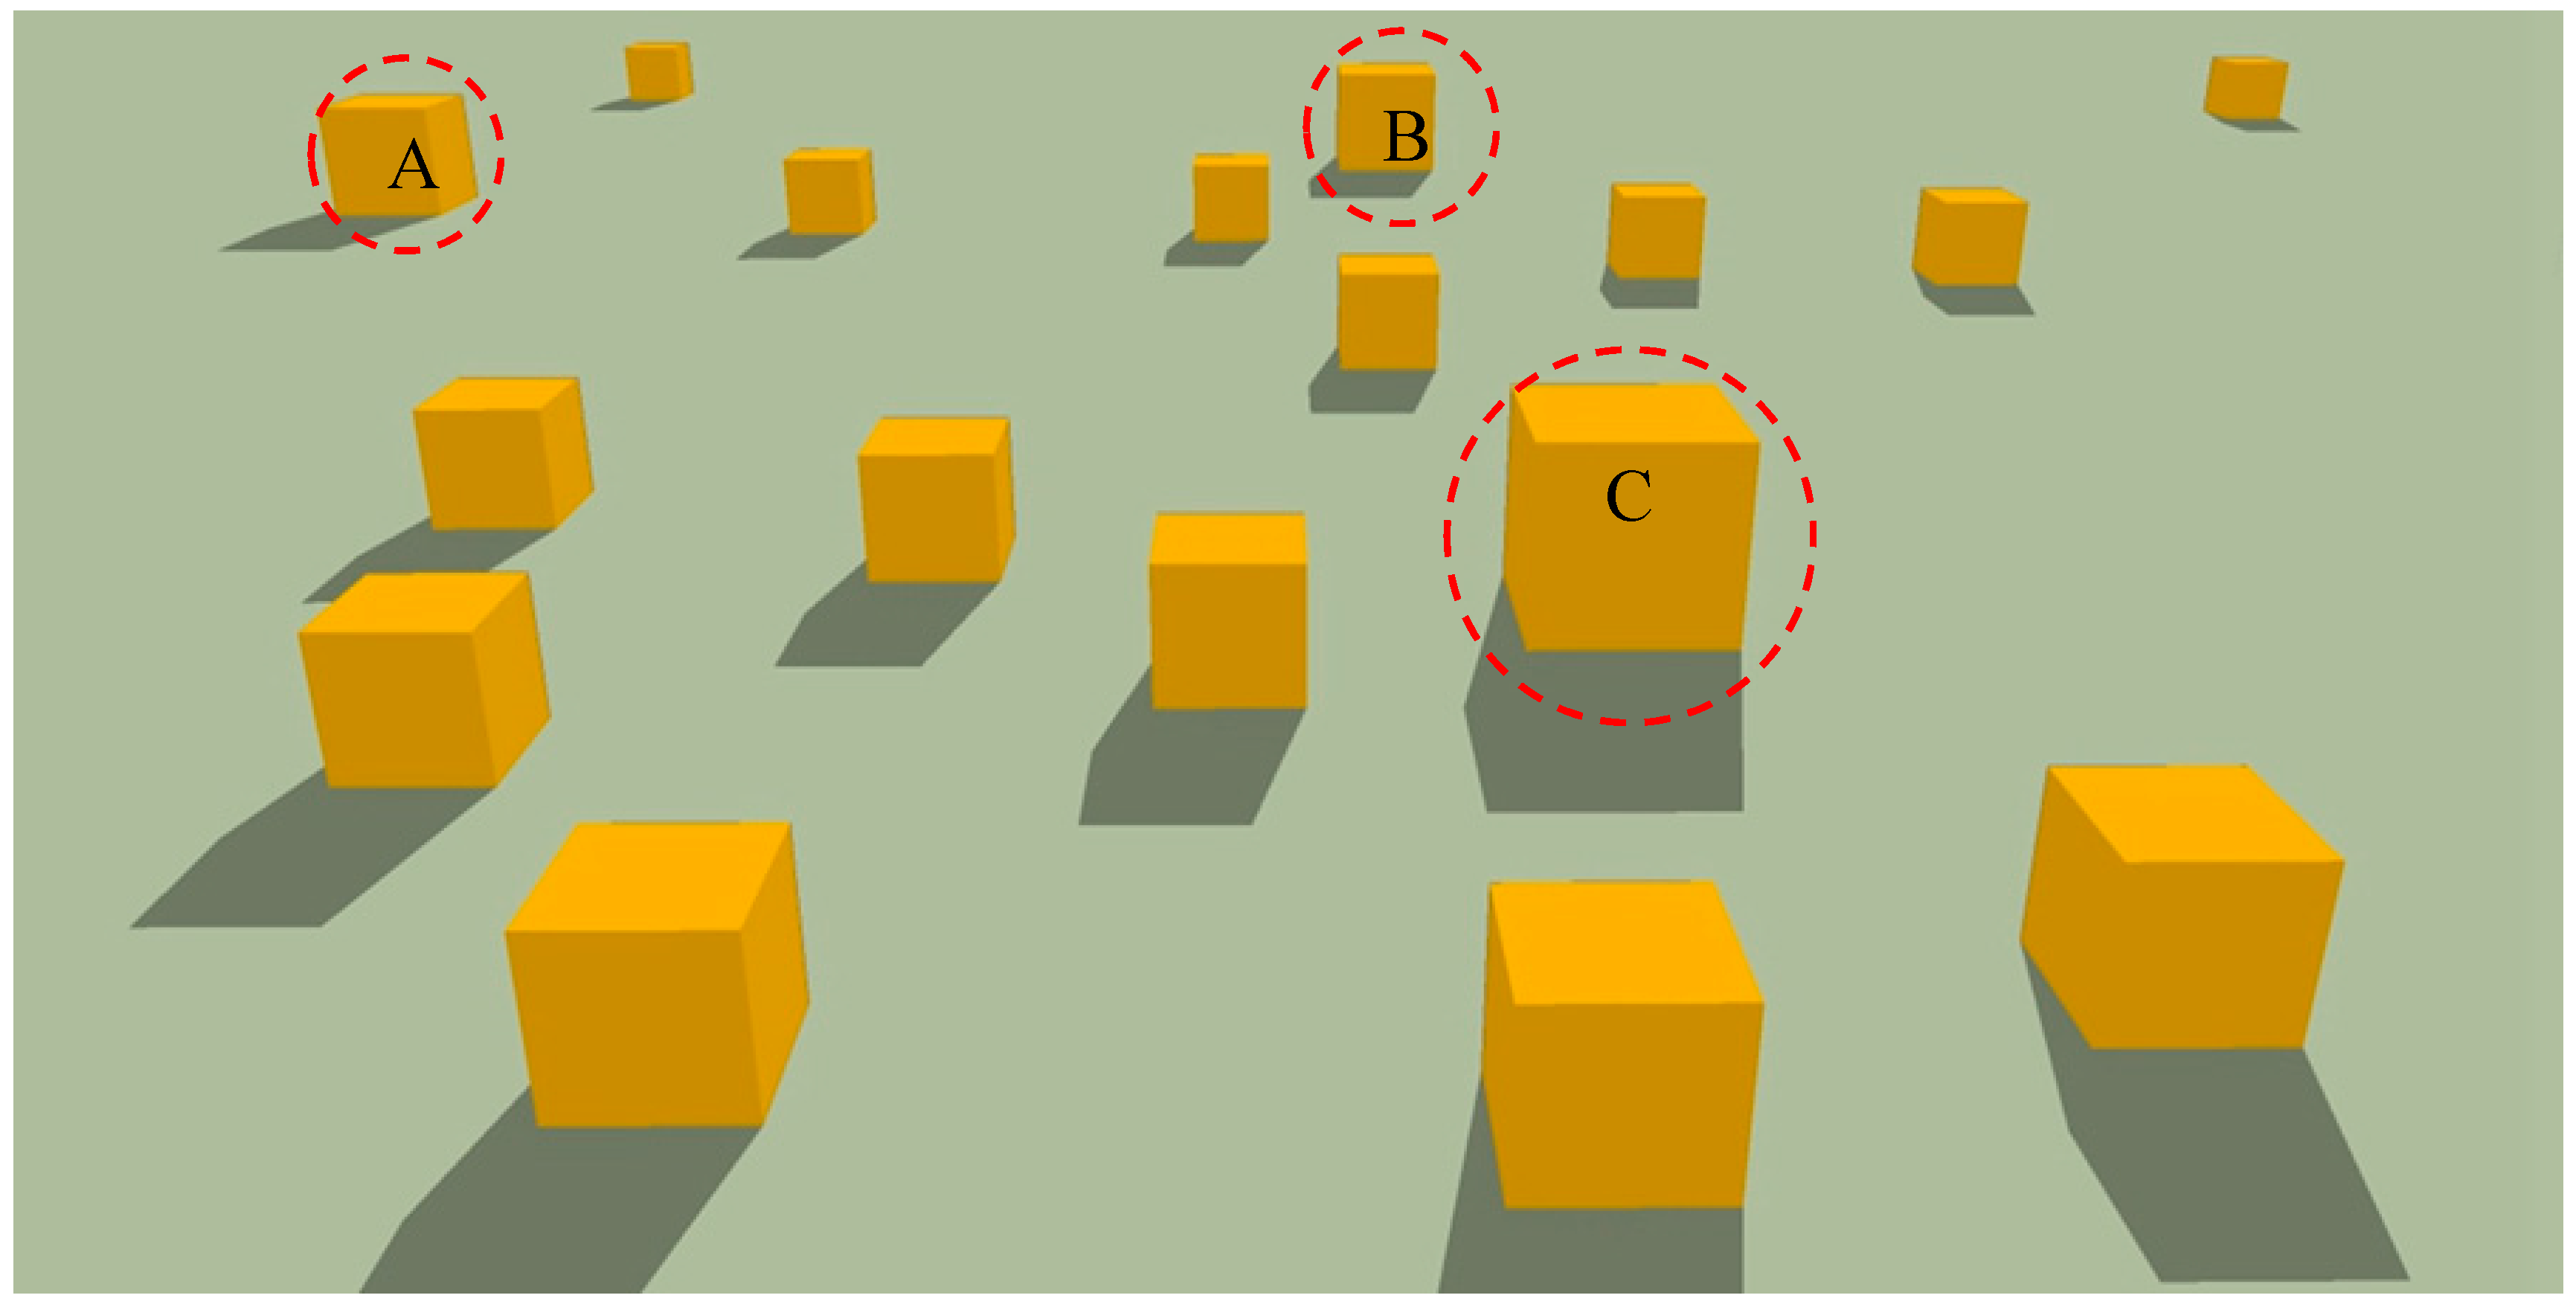
The experiment consisted of two parts. Exp. 1 focused on guidance, and Exp. 2 focused on constancy. Exp. 1 included three tasks (Table 1). The first two testing stimuli included cubes, spheres and cones of the same size (the side length of the cubes was equal to the diameter of the spheres and cones) but different hues (red, yellow or blue) (Figure 1). In Exp. 1.3, the presented stimulus consisted of yellow cubes, and the side lengths of three of them were expanded to 120% their original length (Figure 2).
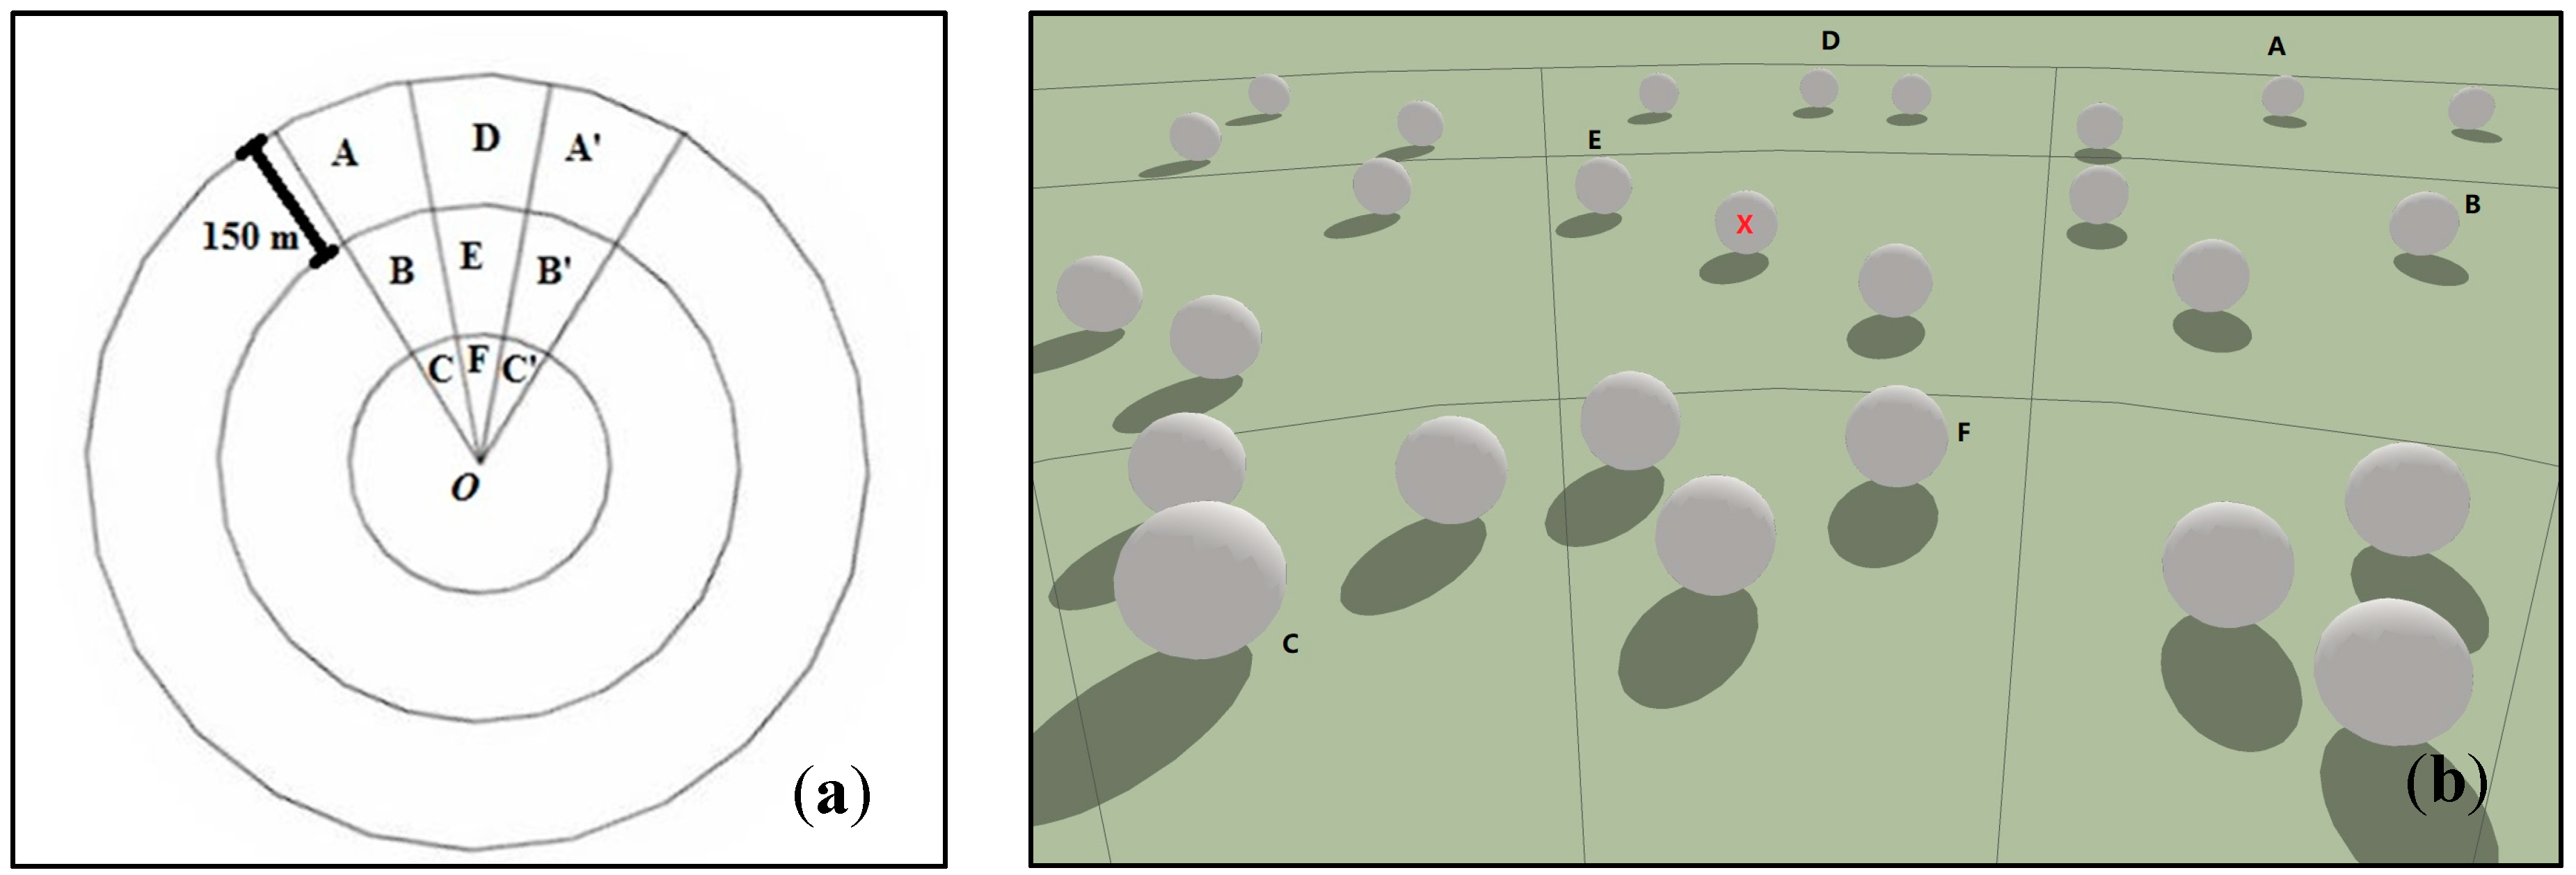
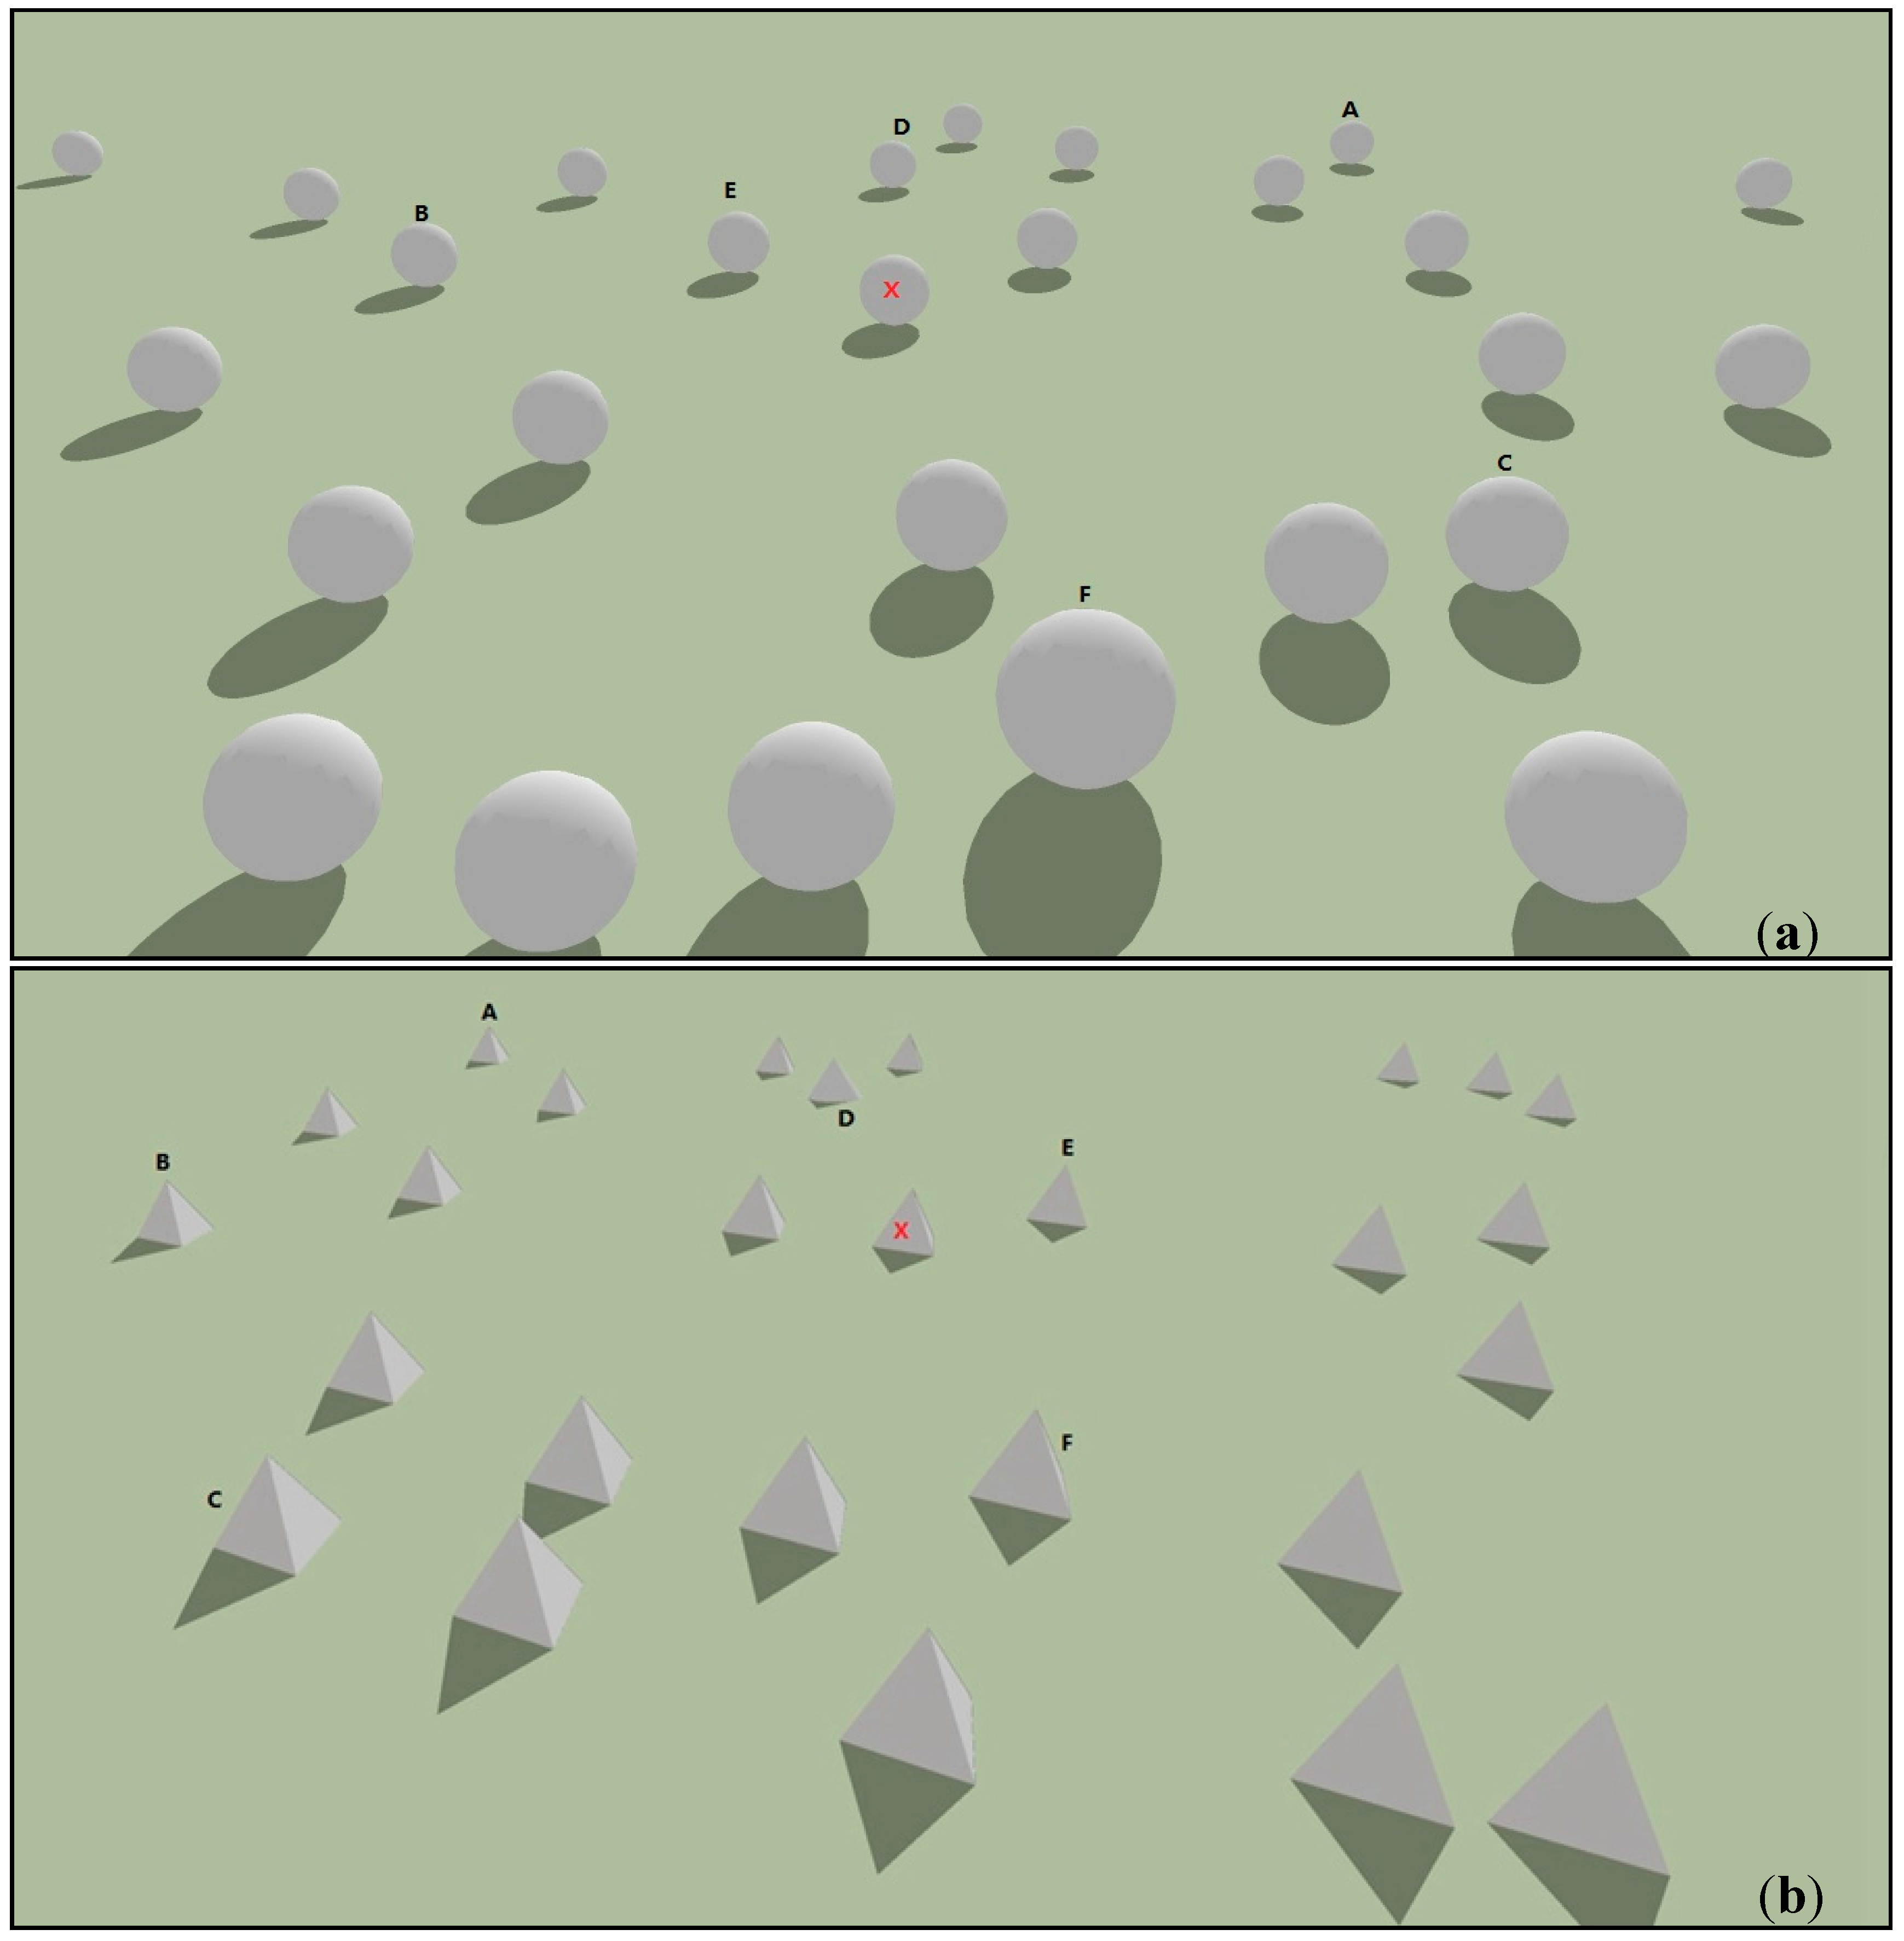
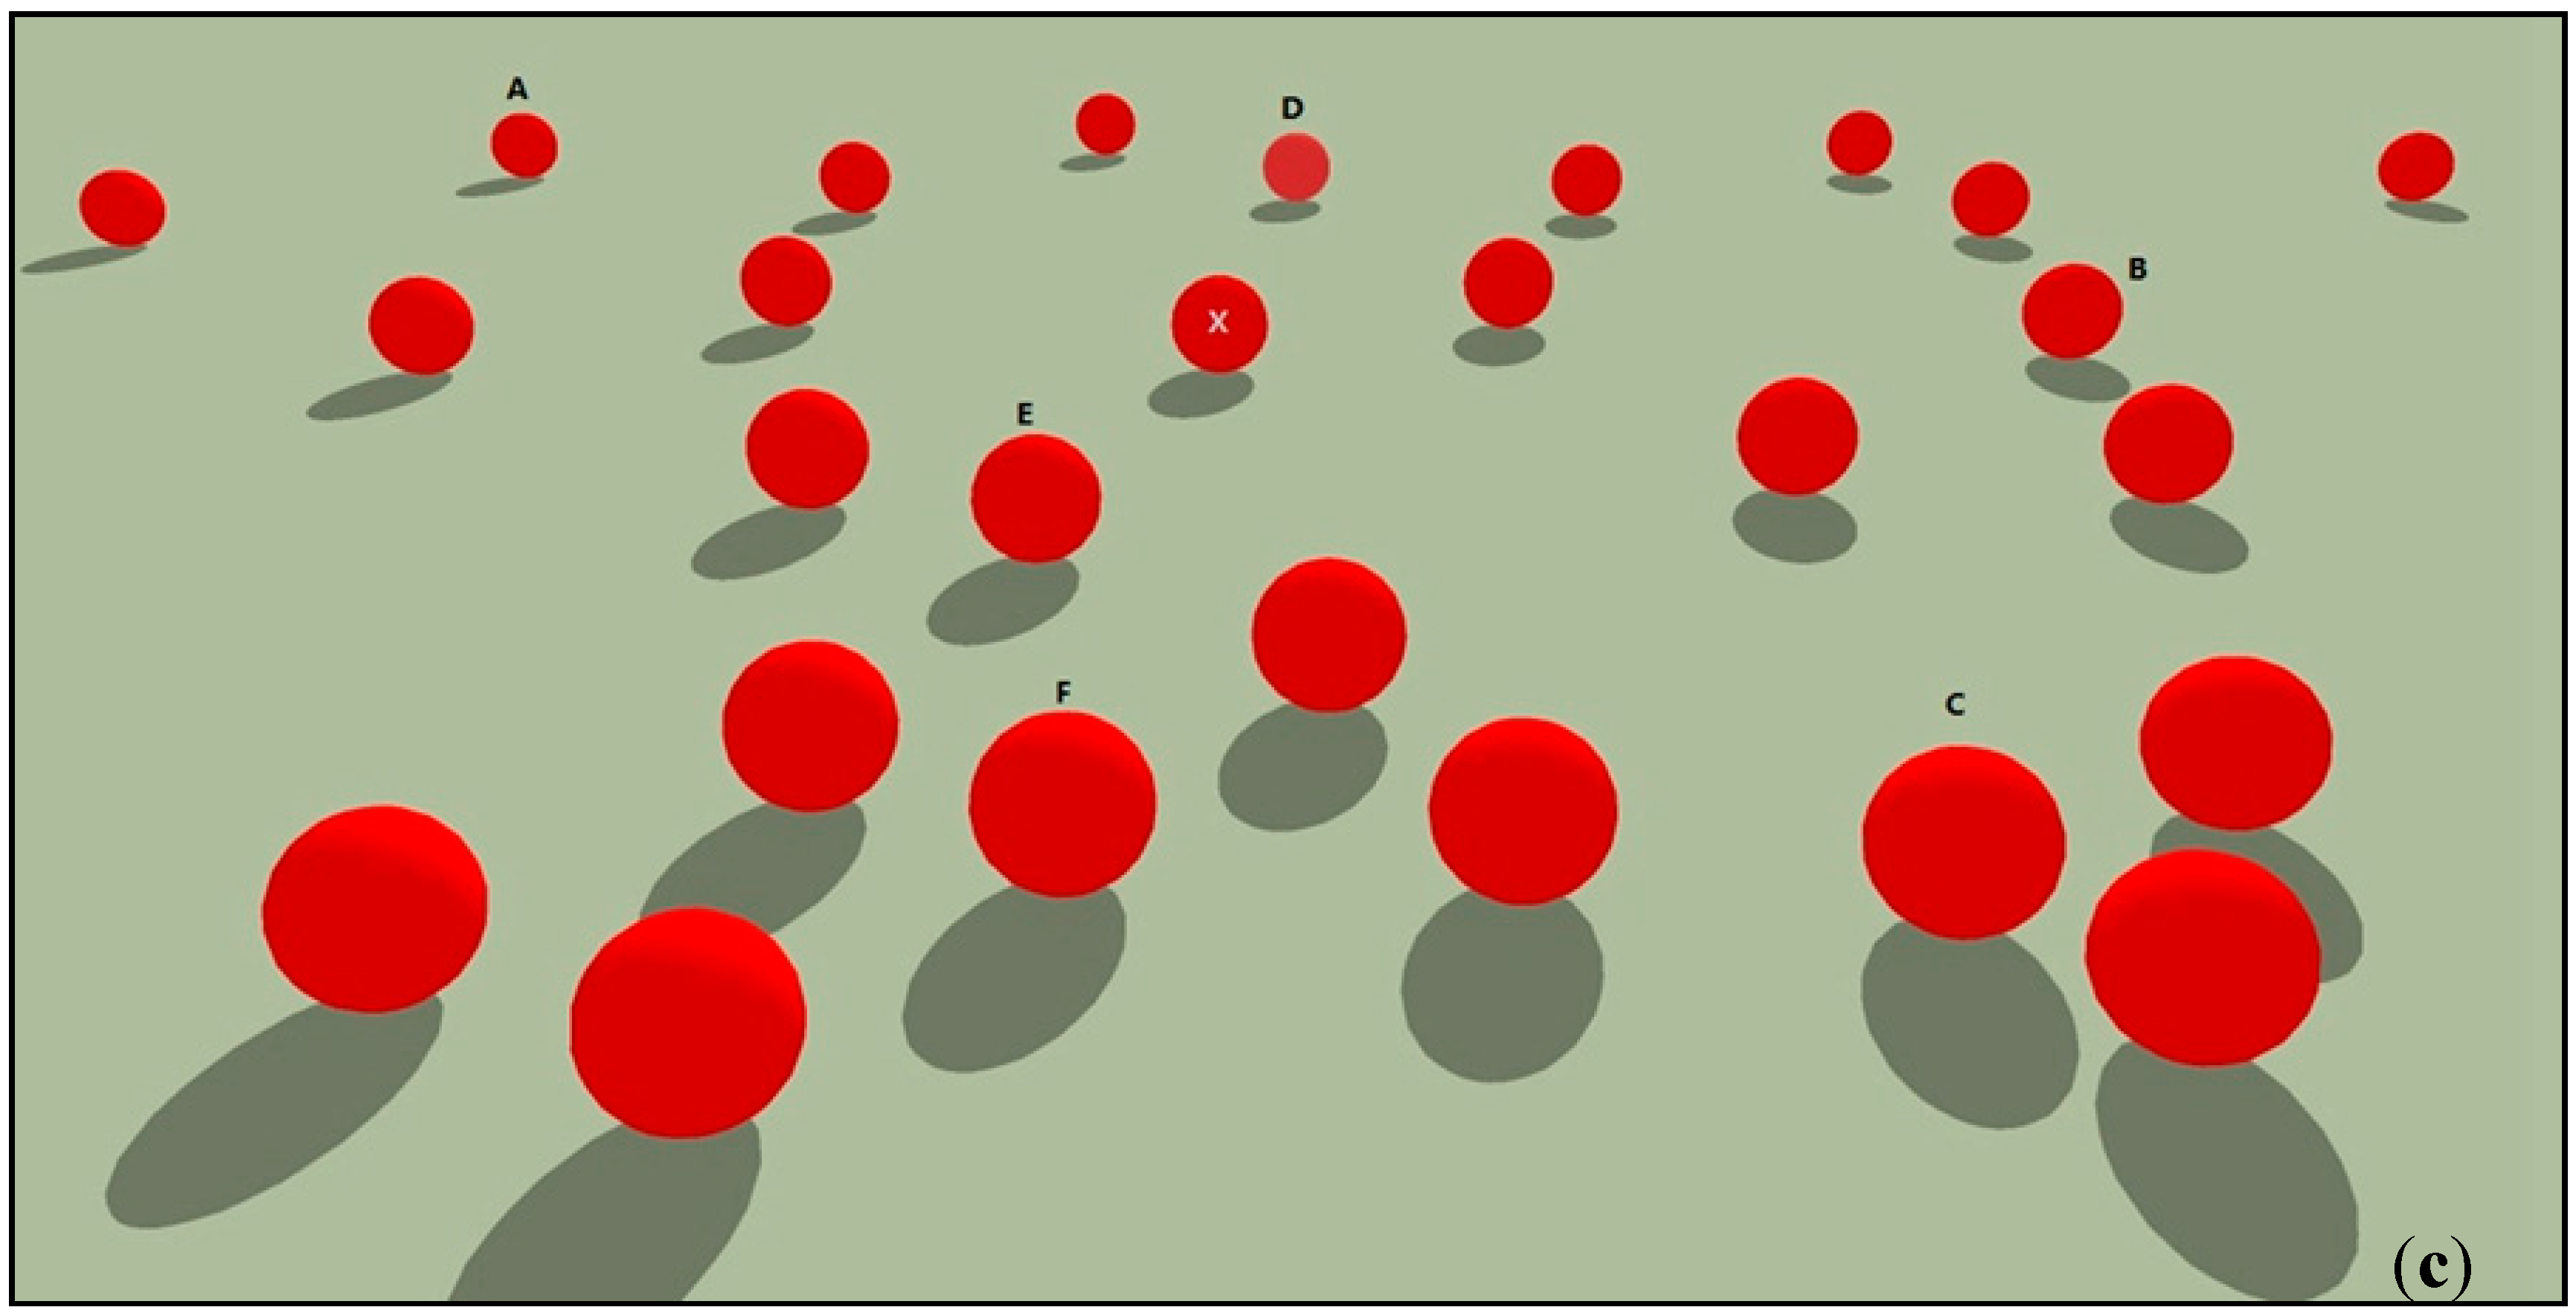
For Exp. 2’s stimuli, the distances were categorized as far, middle and near. The directions were labeled as either to the side or straight ahead, and the entire view was divided into 9 regions that were defined by these 6 different properties (Figure 3): side-far (A), side-middle (B), side-near (C), straight ahead-far (D), straight ahead-middle (E), and straight ahead-near (F). The regional contours were not shown to the subjects. Each region contained 3 objects, for 27 objects in total (Figure 4). One of the 3 objects was marked with its corresponding region code (A–F). The central object was marked with an X and was treated as the standard object. To investigate size constancy, we used spheres and expanded the changed object to 120% of its original size. To investigate shape constancy, we used triple prisms, and the changed object was replaced with a cone of the same size. To investigate color constancy, we used a red hue and changed the saturation to 75% of the original color.
3.5. Procedures
The subjects were randomly divided into 6 groups during the whole experiment (the reason for this choice is explained in the section that describes the experimental design) and completed similar tasks (Table 2 and Table 3). All the tasks were performed without time limits.
The experiment began with a calibration to identify the positions of the subjects’ eyes. Then, a practice stimulus for Exp. 1.1 was administered in which the subjects first listened to the experimenter explain the task while the practice stimulus was shown on the screen. After subjects confirmed that they understood the task, they could click the mouse to review the instructions and complete the tasks (Table 1) with no interference from the experimenter.
In Exp. 1.1, the subjects were instructed to find and click on all objects of the specified shape: cubes, spheres or cones. The click would be recorded in the software but no mark appeared on the materials. Then, subjects were instructed to press the spacebar on the keyboard to continue to the next task, Exp. 1.2, which involved color. No practice session was provided for Exp. 1.2 or Exp. 1.3 (which was related to size), because both tasks were similar to the task in Exp. 1.1.
Exp. 2 began with a practice procedure similar to that for Exp. 1. In Exp. 2.1/2/3, the subjects were instructed to complete every task 6 times (as explained in the section describing the experimental design); during each trial, the subjects were asked to orally report whether each indicated object A through F (in alphabetical order) was the same size/shape/color as object X. The experimenter recorded the subjects’ answers manually. The experiment ended with an appreciation page.
3.6. Analysis Framework
Eye-tracking data were used to analyze the visual guidance and constancy properties of the investigated variables. Different analysis frameworks were used for visual guidance and constancy. The default fixation settings in Tobii Studio were used (I-VT filter, max gap length = 75 ms).
3.6.1. Guidance
In the first part of the experiment, we used five indices for quantitative analysis to investigate the guidance from the hue, shape and size.
In this section, each target was identified as an Area of Interest (AOI), and all the AOIs within a single image formed an AOI group. Five indices were used to analyze the guidance from a visual variable (Table 2): (1) the finish time (FT), which represents the overall performance, where a short FT indicates strong visual guidance; (2) the time to first fixation (TtFF), which should be short for a visual variable that provides strong guidance and thus should quickly guide the participants’ attention; (3) the average time required for a correct click (ACC), which is a more precise and average index of participants’ performance, where a short ACC indicates strong visual guidance; (4) the visit ratio (VR), which should be high for a visual variable that provides strong guidance because the participants should pay less attention to irrelevant objects; and (5) the accuracy (AC), a measure of correctness, where a high AC indicates strong visual guidance.
Student’s t-tests (labeled t) were used to test the significance of the differences, when the statistics fit a normal distribution. Mann-Whitney (M-W) U tests (labeled Z) were used when they did not.
3.6.2. Constancy
In Exp. 2, the chosen indices (Table 2) were the finish time (FT), the average fixation duration (AFD), the visit count (VC), and the accuracy (AC). While AC alone shows the perception results, which can represent perception constancy, the other three indices can illustrate the perception process and help explain the resulting constancy. The test methods were the same as in Exp. 1.
4. Results
In this section, we report quantitative analyses of the visual guidance and constancy results based on the collected eye-tracking data. The results show that the visual guidance and constancy properties of the visual variables of shape, size and color in 3D visualization are different from those in 2D visualization.
4.1. Guidance Task
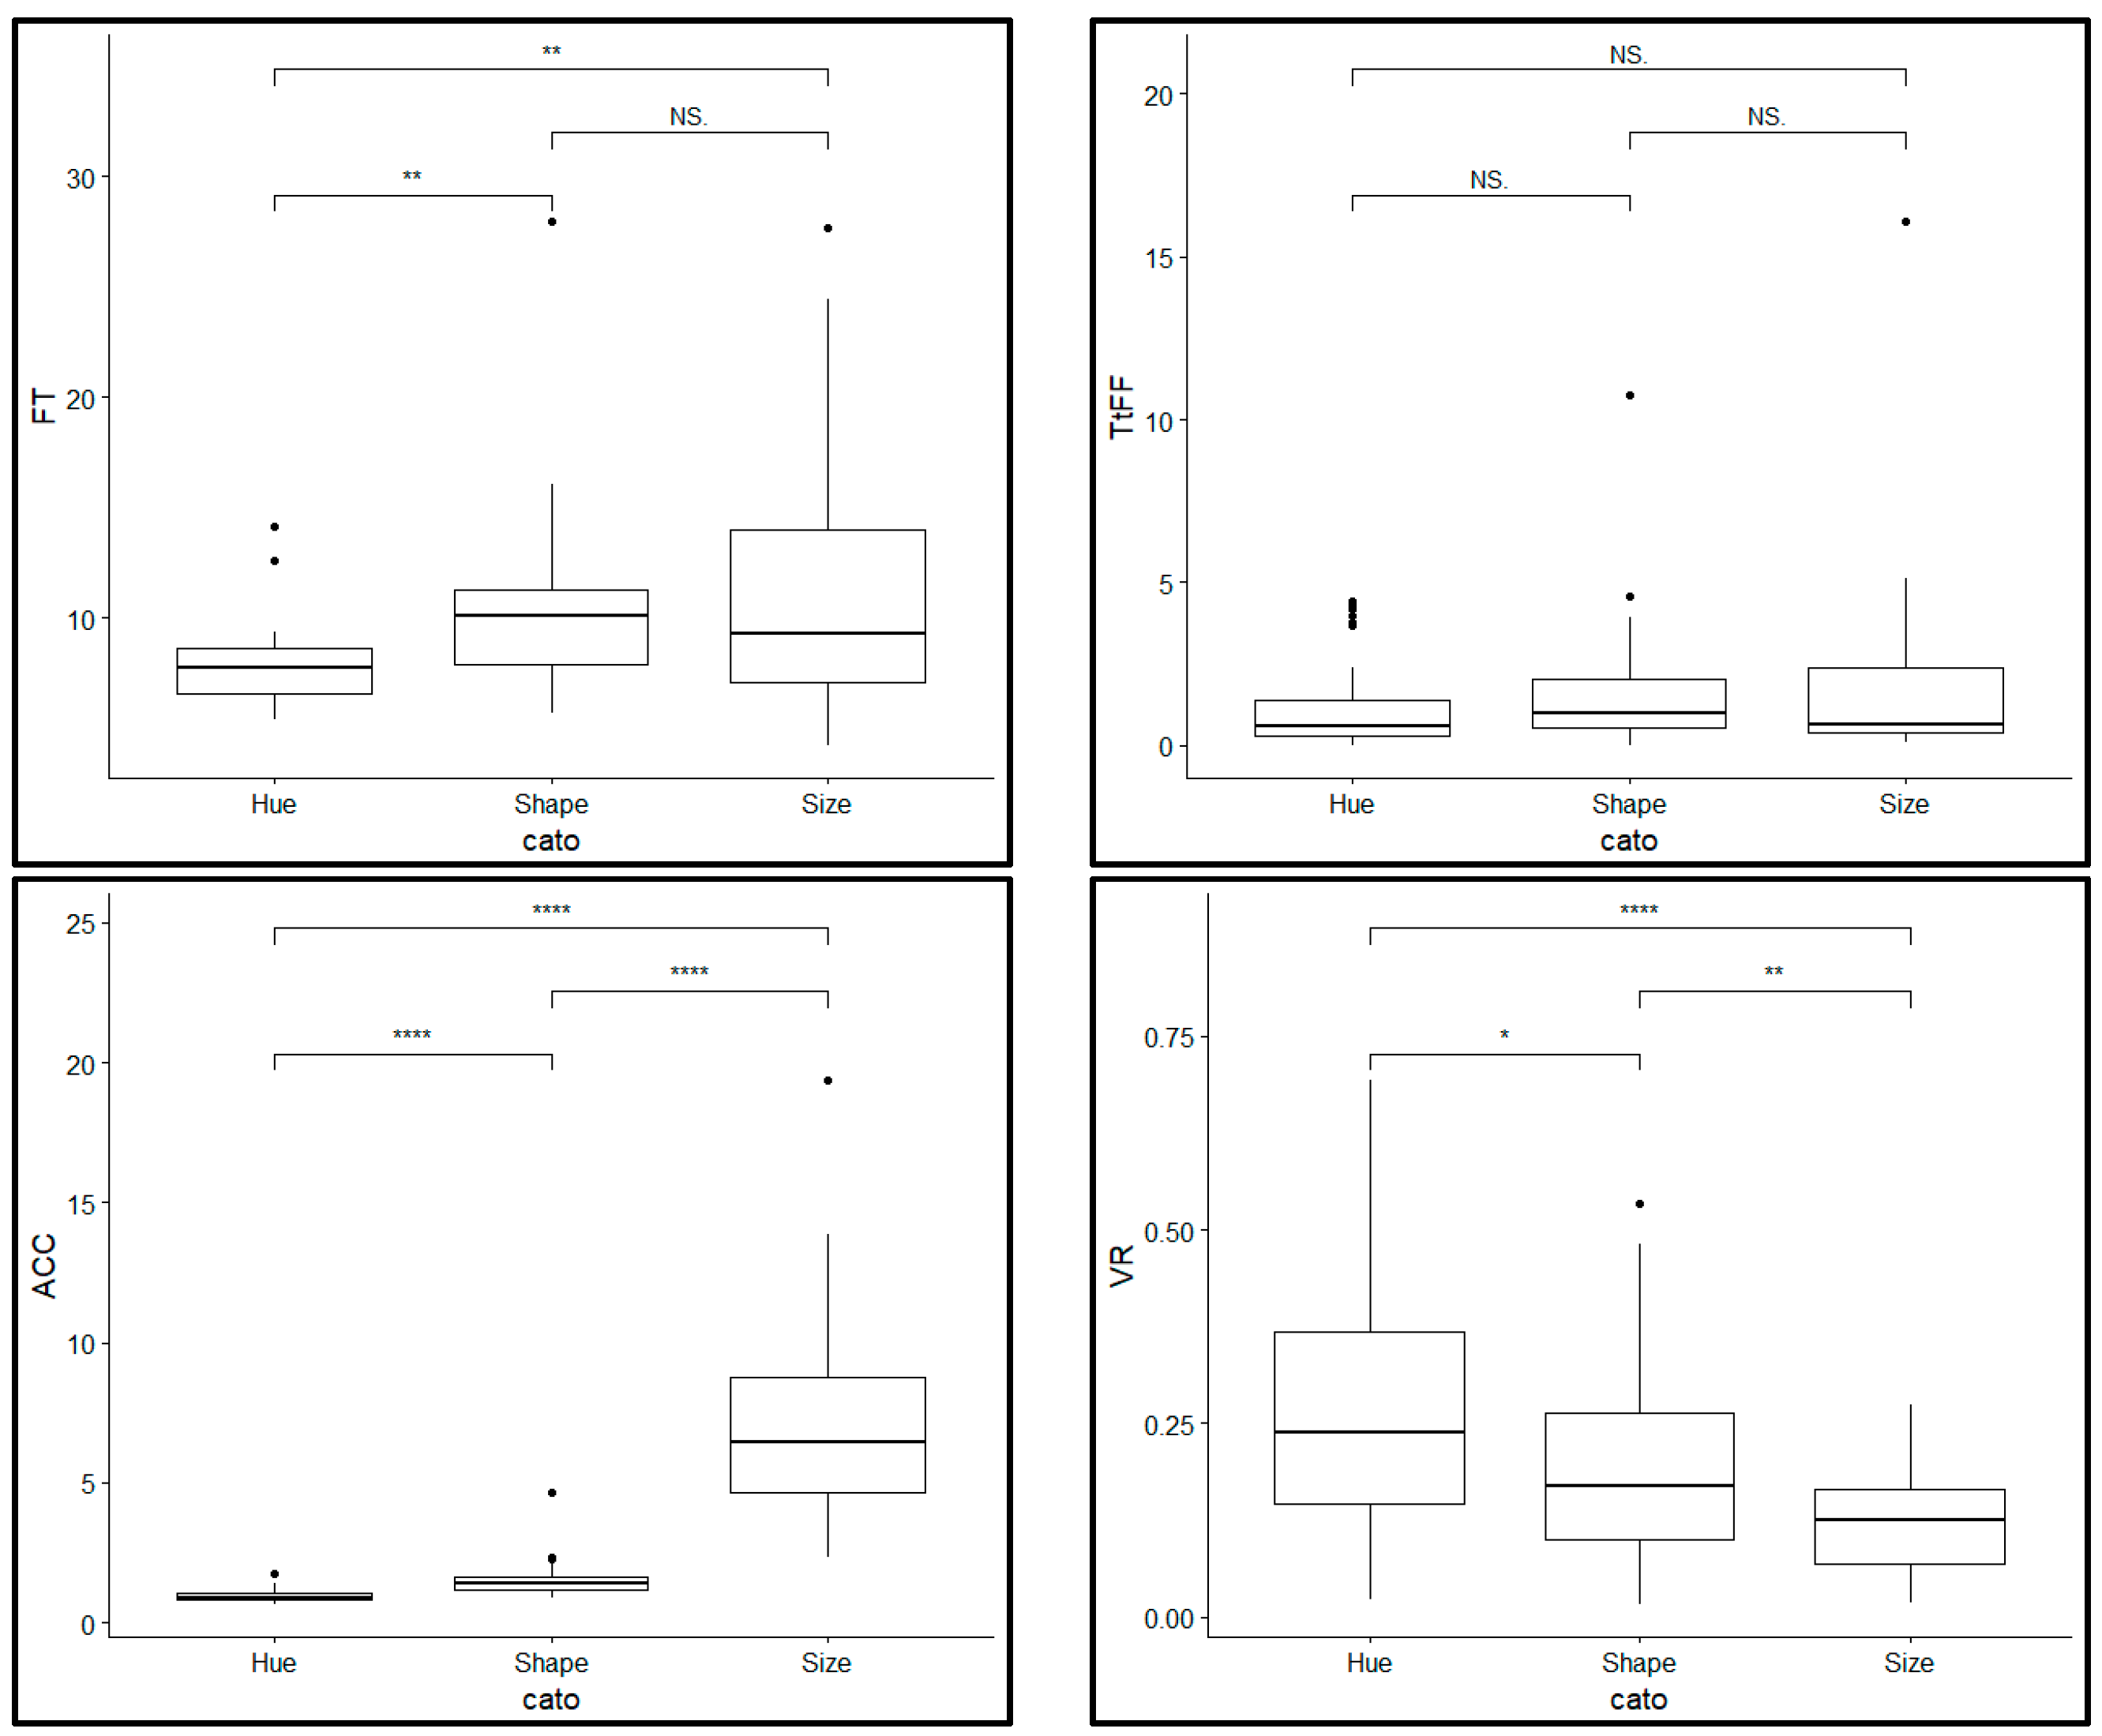
The statistics and significance testing results for the guidance tasks are shown in Figure 5. The FT for hue is shorter than that for shape, and the FT for size is the longest, as expected (FTHue = 7.924 s, FTShape = 10.318 s, FTSize = 11.298 s). The difference in FT between hue and shape/size is significant, whereas the difference between shape and size is not significant (tHue-Shape = 3.390, pHue-Shape = 0.001 < 0.01; tHue-Size = −3.401, pHue-Size = 0.001 < 0.01; tShape-Size = −0.856, pShape-Size = 0.395).
The TtFF for hue is the shortest. Indeed, the subjects required only 1.281 s on average to fixate on a target, whereas they required 1.635 s and 1.744 s on average to fixate on the first target object with a certain shape or size. However, none of these differences are significant (ZHue-Shape = −0.192, pHue-Shape = 0.192; ZHue-Size = −0.501, pHue-Size = 0.616; ZShape-Size = −0.746, pShape-Size = 0.456).
As Figure 5 shows, the ACC has the same trend as do the FT and TtFF. The ACC for hue is 0.952 s—significantly shorter than that for shape or size (ACCShape = 1.554 s, ACCSize = 7.280 s; tHue-Shape = 5.143, pHue-Shape = 0.000 < 0.01; tHue-Size = −10.440, pHue-Size = 0.000 < 0.01). The ACC for shape is also significantly shorter than that for size (tShape-Size = −9.304, pShape-Size = 0.000 < 0.01).
Numerically, the VR displays a different tendency from the above indices. The VR for hue is the largest, while the VR for size is the smallest (VRHue = 0.276, VRShape = 0.192, VRSize = 0.116). The differences between hue and shape, between hue and size, and between shape and size are all significant (tHue-Shape = −2.182, pHue-Shape = 0.033 < 0.05; tHue-Size = 5.001, pHue-Size = 0.000 < 0.01; tShape-Size = 3.050, pShape-Size = 0.004 < 0.01). Nevertheless, a larger VR means that the subjects were performing more useful work and paying less attention to irrelevant information while completing the corresponding task. Thus, the VR trend has the same interpretation as the trends of the other indices.
The accuracy for hue is the highest: all the subjects correctly completed this task. The accuracy for shape is lower, at 0.956. One subject clicked so fast that he must not have fully understood the task instructions, and three subjects failed to find all the targets. The accuracy for size is 0.593, which is the lowest. Only 12 subjects found all the targets without also incorrectly identifying other objects as targets.
In this part of the experiment, we used five quantitative indices to investigate the guidance from shape, hue and size in 3D visualization. Overall, the results indicate that hue and shape more clearly attract attention in 3D displays, whereas the guidance for size is weaker (the heat maps shown in Supplementary Figure S3 indicate a similar trend).
4.2. Constancy Task
4.2.1. Finish Time
The finish time is a measure of the overall performance. When a visual variable has strong visual guidance, the participants should perform similarly regardless of where the variation is located.
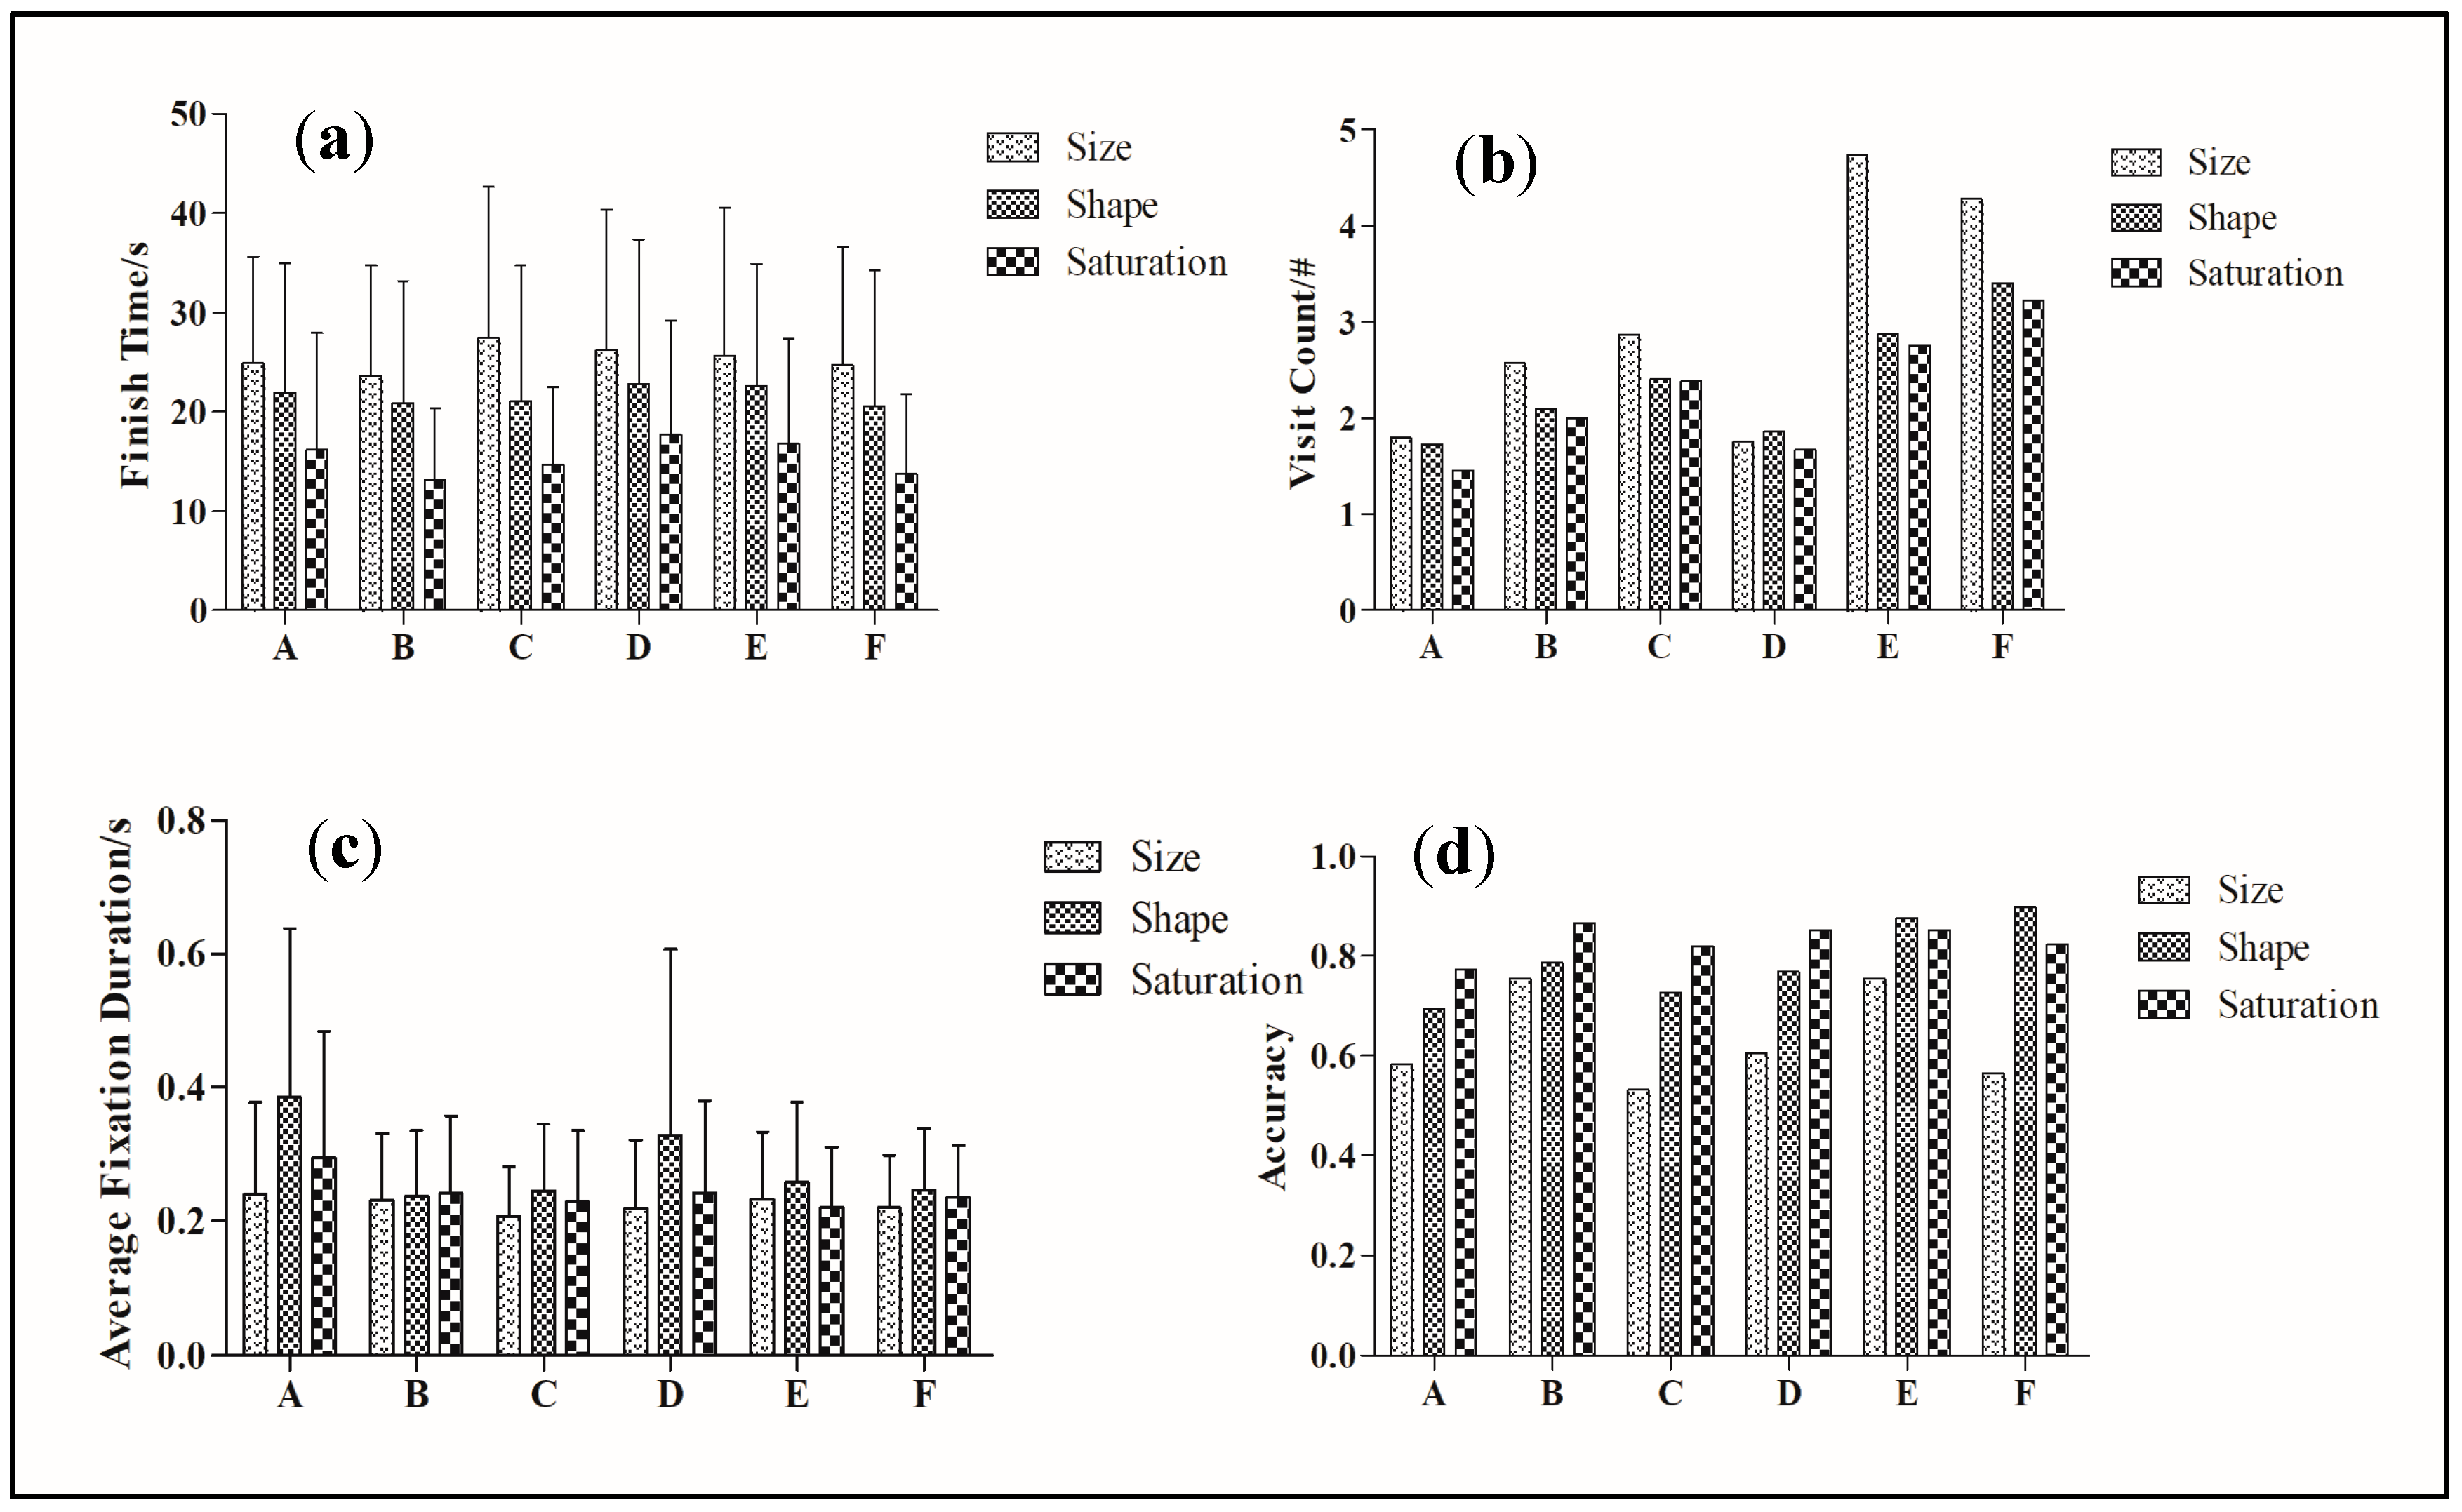
As Figure 6a shows, the judgment speed did not change much for variations in size that occurred at different positions, except for the difference between positions B and C (FTA = 24.911 s, FTB = 23.620 s, FTC = 27.456 s, FTD = 26.253 s, FTE = 25.652 s, FTF = 24.694 s, tB-C = −2.267, pB-C = 0.030). In the regions to the side (A–C), the judgment speed for size is influenced by distance, whereas no such influence is obvious in the central regions.
The FT for the shape variation task is not influenced by the position of the variation (FTA = 21.881 s, FTB = 20.835 s, FTC = 21.020 s, FTD = 22.804 s, FTE = 22.586 s, FTF = 20.527 s; there is no significant difference between any two positions). However, the differences in judgment speed for saturation variations are more significant. When a variation in the saturation of an object appeared in A, D or E, the subjects required more time to complete the task (FTA = 16.203 s, FTD = 17.686 s, FTE = 16.779 s). The FT was much shorter when the variation occurred in B, C or F (FTB = 13.131 s, FTC = 14.727 s, FTF = 13.718 s). The FTs for B and F are significantly shorter than those for D and E (tB-D = −2.627, pB-D = 0.013; tB-E = −2.233, pB-E = 0.032; tD-F = 2.542, pD-F = 0.016; tE-F = 2.280, pE-F = 0.029) and not significantly shorter than that for A (tA-B = 1.763, pA-B = 0.087; tA-F = 1.708, pA-F = 0.096). This difference may have occurred because the objects in A and D had smaller retinal sizes; therefore, recognizing a change was more difficult. We labeled X and A–F with different colors (white/black); consequently, objects in E that were too close to X may have appeared to be different colors than X because of comparison effects.
The FT results show that the participants’ judgments regarding saturation were faster than those regarding shape and that both were faster than judgments regarding size, which is consistent with the results for shape and size in Experiment 1. The FT of saturation was most affected by variations in position, while that of shape was least affected.
4.2.2. Average Fixation Duration
The AFD is a measurement of the complexity of the viewed object. A long AFD indicates that the eye has encountered some difficult information [53,54,55].
As Figure 6b and Table 3 show, the perception of size was most difficult in A, the side-far position, and easiest in C, the side-near position. However, none of the six positions had a significantly longer AFD than any of the other five.
As for shape, the AFD was much longer at positions A and D, which were the most distant positions, than it was at the other positions. This result indicates that the perception of shape at greater distances is relatively more difficult. This difference may have had a similar cause as the difference in the FT for saturation: the reduction in area increased the difficulty of perception [56].
Similarly, only the AFD of position A was longer in terms of saturation. This tendency was similar to the tendencies for size and shape; thus, as the distance increases, the retinal area decreases and the possible distortion in regions to the side increases in 3D visualization, causing the perceptions of these visual variables to become more difficult.
In terms of the complexity of perception as measured by the AFD, that of shape was influenced most by position, and the perception of the two farthest positions was more difficult than perception of the others. The perception complexity of size was the least influenced by position because none of the six positions was significantly more difficult to perceive in terms of size.
4.2.3. Visit Count
The fixation count has often been used as a measure in studies that involve eye-tracking analysis [11]. However, we believe that the VC better represents the perception process because more than one fixation may be involved in any given aspect of perception.
At all positions, the maximum VC occurred when the target variable was size. In contrast, the VC was lower when the target variable was shape, and the lowest VC resulted from a change in saturation. These findings are consistent with the tendency observed for the FT. The VC values were relatively small (1–5) and were integer values for each subject; therefore, we did not apply the t-test. In both the side and central regions, the VC values for all three visual variables decreased as the distance increased (Figure 6c). At the same distance, the VC was higher in the central region.
More specifically, the average VC for size changes ranged from 1.750 (VCD) to 4.730 (VCE) for variations that occurred in different positions. The variation for saturation ranged from 1.458 (VCA) to 3.228 (VCF). The variation for shape was the smallest, ranging from 1.726 (VCA) to 3.408 (VCF). In addition, the VC was numerically negatively related to the AFD. In terms of the size, the AFDs at positions A, B and E were longer than the others (although this difference was not significant), whereas the VCs for positions A and B were lower. The results for shape and saturation were similar.
For all three visual variables, the VCs for positions A, B and D were noticeably lower than those of positions C, E and F. Thus, although A and D were difficult to perceive, subjects tended to fixate on them rather than comparing them with the standard X object.
Overall, the VC results show that position had the greatest influence on size, while saturation had a weaker influence and shape had the weakest influence.
4.2.4. Accuracy
When a visual variable shows strong constancy, the accuracy should be high and vary little among different locations. Participants’ accuracy for color saturation was the highest and had the smallest variation range: 0.773 (ACA) to 0.866 (ACB) (Figure 6d). The participants’ judgments regarding shape were less accurate, with an accuracy range from 0.694 (ACA) to 0.898 (ACF). Their accuracy for size was the poorest, with a range from only 0.532 (ACC) to 0.755 (ACE).
The AFD represents how difficult the subjects considered the task to be, whereas accuracy objectively represents how difficult the task was. Thus, we compared the trends from these two indices. The accuracy variation range for size was wide; the accuracies in different positions followed the sequence C < F < A < D < B = E, whereas the AFD values followed the sequence C < F = D < B < E < A (although the differences were not significant). The latter sequence was similar (but, as expected, not identical) to that of the accuracies, C and F appear toward the left and B and E appear toward the right in both sequences. Therefore, when subjects find some positions difficult to perceive, they will fixate on them, which can help them make the right decision. However, these subjects may make the wrong choices for C and F, which they may believe are easy to judge and therefore pay less attention to. When the visual variable is size, subjects’ perceptions may differ from reality.
The variation range for the shape accuracy was narrower. The accuracies followed the sequence A < C < D < B < E < F, whereas the AFD values followed the sequence B < C < F < E < D < A. When asked to judge shapes, the subjects spent more time assessing A and D because they found the attributes of objects in these positions to be difficult to judge; correspondingly, the actual accuracies at these positions were relatively low. In contrast, their judgments for positions B and F, which they found easier, were more likely to be correct.
The judgment of saturation was the least strongly influenced by position among the three variables; the accuracies followed the sequence A < C < F < D < E < B, while the AFD values followed the sequence E < C < F < B < D < A—similar to the tendencies for size.
This accuracy assessment suggests that the constancy of object size is the weakest, saturation shows the strongest constancy, and constancy of shape lies between them.
5. Discussion
5.1. Guidance for Hue, Size and Shape
Wolfe and Horowitz [9] summarized previous research on the guidance from visual variables in 2D displays and found that hue and size unambiguously provide guidance, whereas the level of guidance from shape is less clear. However, the guidance strengths of these variables reveal a different trend in 3D visualization.
In our 3D-object experiment, hue provided the same strong guidance as for 2D objects [30,31]. This finding occurred because hue is an associative visual variable that requires pre-attention and the addition of an extra dimension does not cause the hue to change. Although an object’s color appearance may be influenced by illumination [38], the hues used here were quite distinct from each other; consequently, the subjects could still identify the targets.
However, the guidance from shape is stronger than that from size in 3D visualization. In 3D displays, the retinal image from the same object is smaller when it is far away. Although some researchers have stated that users can correctly perceive objects to be of the same size under this condition [57], Exp. 2 indicated the opposite. Subjects who are aware of this effect will automatically adjust for the perceived size [58,59,60], which requires additional time. Moreover, in a symbolic representation, which differs from real-world conditions, fewer objects are present in the background; therefore, depth cues [48], which are important for size perception [20,21,22], are lacking. The results of Exp. 2 support this conclusion because size cannot successfully guide visual attention when people are unable to correctly perceive size.
In 3D visualization, the shape of each symbol takes on an additional dimension compared to the 2D case; therefore, more characteristics are required to identify a particular shape. The complexity of shape guidance may also be related to the type of shape that is used. For example, shapes that use letters provide strong guidance [32] in 2D visualization, but according to Chen [61], the shape sensitivity for a line, which is an even simpler object, is influenced by its relationships to other shapes. In the physical world, where shape complexity can be very high, shape is also a practical visual variable for distinguishing landmarks in wayfinding [26,62]. Moreover, judgment regarding the shapes of distant objects, which requires more details than hue judgment, may be difficult. Although the shapes in our stimuli were simple geometric shapes, distant objects may have been obscured by the low resolution. For example, the participants may have been unsure whether the more distant cubes were other hexahedrons; therefore, they spent more time on these objects. Generally, our guidance experiment shows that the guidance from simple geometric 3D shapes is not as strong as those from hue.
5.2. Constancy of Saturation, Size and Shape
Constancy is a persistent topic in geo-visualization and in 3D visualization in general, because it is unlike 2D visualization, in which the retinal signal of an object does not change regardless of where that object is located. As the AC results show, size constancy is the weakest and saturation constancy is the strongest. In addition, FT, AFD, and VC help to reveal the perception processes.
In this study, the FT results show that the total time of saturation perception is strongly influenced by where the variation occurs. A shorter FT may indicate a quick judgment of the variation in one location and a decreased judgment time for one process out of six. The data show that the subjects finished the tasks quickly when the saturation variation was located nearby or at a relatively near side position; however, when the variation in saturation was located far away or at a relatively near central position, subjects required more time to finish the task. We did not collect the FT values for each separate location, so we can only assume that subjects may have expected that there was at least one symbol that was different from the reference object. Because the participants found changes in nearby or relatively near side locations easier to judge, they might have felt “more comfortable” judging the rest to be the same as the reference object after finding an object that was different. If this inference is correct, then this finding (i.e., that detecting changes in certain locations is more difficult than detecting changes in others) may be related to the decreased area occupied by more distant objects or to a location-related illusion, which would be consistent with the findings of Olkkonen and Brainard [63].
The VC results show that size perception is influenced most by position and requires more processing than shape and saturation do, and indicates that perception of size is more difficult, which is also supported by the poor size guidance in Exp. 1. This result is also consistent with the metacognitive theory that people supplement their perceptions with deliberate judgments when they are aware of the size-distance effect [52,58,59,64], a process that requires further investigation.
However, the AFD of size was the least influenced by position, indicating that the participants subjectively considered the difficulties at different locations to be equal, whereas the AC results show that location actually exerts the greatest objective influence on the difficulty of size judgment. This discrepancy indicates that size perception is difficult and that the low AC of size perception may result from subjects’ inattention to detail. Meanwhile, the AFD results for shape indicate that subjective perception difficulty of shape increases as the object becomes more distant (location A). This observation is consistent with previous findings that a change in size can increase the effort required to identify shapes [56].
AC shows the constancy of perception results. As for size, judgments for near objects (C and F) are less likely to be correct, whereas judgments for objects at middle distances are most accurate. Concerning orientation, the accuracy for central objects is greater than that for objects to the side. This result is consistent with the findings of Gori, Giuliana, Sandini and Burr [60], who stated that the perception of close-to-standard objects is more precise, which indicates that judgment may be influenced by the retinal size of an object. However, in size constancy research in the physical world, the estimation bias seems to increase when the object is positioned farther away [65], whereas our work produced a different result. This difference may be related to the integration of the haptic [60,66] and assumed-size strategies [59,67] that people use in the physical world. Regarding shape, the accuracy for distant objects is lower because the image may become blurred from the lower resolution of the stimulus. In addition, judgments for objects near the sides of the image are less likely to be correct. These objects are subject to stronger deformation, which results in asymmetry; therefore, subjects may judge them to be different from the target. This finding is consistent with previous research on 3D objects [19,68], which revealed a greater capacity for shape discrimination for symmetrical objects. Judgments of saturation for near and far symmetrical objects are less likely to be correct, and no clear rule exists regarding orientation.
From Exp. 1, we know that subjects are not sensitive to variations in size in 3D visualization; therefore, the subjects may have relied on instinct when making size judgments, which is not always reliable. The subjects were sensitive to variations in shape (Exp. 1 did not address changes in saturation), and they can rationally identify shape variations when they occur, so the constancy of shape is stronger than that of size. However, distance may influence the visible level of detail or the visible area of an object, and orientation can influence an object’s deformation and its visible surface. Thus, the judgments regarding shape or saturation at different positions are not uniform.
In summary, Exp. 2 suggests that the constancy of shape and saturation is strong, whereas that of size is very poor. In addition, size is more difficult to perceive and judge than are shape and saturation, as reflected by a longer FT and an increased VC; consequently, size perception requires more processing but has lower accuracy. According to the same indices, judgments of shape and saturation are easier.
6. Summary and Future Work
In this study, we applied eye-tracking technology to study the guidance from hues, shapes and sizes in identification tasks and the relationship between the positions of objects and the constancy of their saturation, shape and size in 3D visualization.
The results showed that the hue provides the strongest guidance, while size provides the weakest guidance among the three visual variables in 3D visualization. This result indicates that visual variables do show different trends in 3D visualization than in 2D visualization. However, the summary by Wolfe and Horowitz [9] indicated that the guidance for a visual variable may vary among different types of tasks; that is, the guidance can be task dependent. Our work involving guidance included no quantitative tasks; therefore, size was outperformed by hue and shape. In the future, we plan to consider different types of tasks and conduct a study that more thoroughly addresses this topic.
In the experiment to investigate constancy, we found that saturation and shape show better constancy than size does. These three visual variables may influence each other; therefore, more work is required to determine the reliability of this result. Our experimental design lacked certain details because our objective was to investigate the existence of constancy. In future work, we plan to explore the extent and direction of misperceptions.
In addition, similarly designed experiments that use different stimuli and 2D objects could improve our understanding of the guidance and constancy properties of 3D visual variables and how they differ from simple 2D visualizations. First, the stimuli used in this research contained no rich cues for depth, illumination, shadows or other environmental parameters, which can influence the perception of visual variables [19,38,48,69,70] and reference information. In addition, although most current 3D displays have no reference grid or legend, such references may play an important role in 3D perception, as it has been found that for 2D maps, grids can improve recall performance and the spatial accuracy of learned object locations [71]. Similar experiments that involve reference grids are required to determine whether such legends are necessary. Second, only pseudo-3D visualizations generated from 3D models were used in this experiment to test the rules that govern guidance and constancy. However, the quantitative analysis could not fully explain why the visual variables exhibited the observed behavior. Further experiments that address 2D symbols in a pseudo-3D visualization space and the application of a novel scanpath comparison method [72], which can analyze participants’ strategies, may help us to better understand the perception mechanism.
Supplementary Materials
The following are available online at www.mdpi.com/2220-9964/6/9/274/s1.
Acknowledgments
This research is supported by the National Natural Science Foundations of China (NSFC, Grant No. 41471382) and the National Key Research and Development Program of China (2017YFB0503602). The authors would like to thank all the reviewers for their helpful comments and suggestions.
Author Contributions
Bing Liu and Weihua Dong conceived the experiments; Bing Liu designed and performed the experiments; Bing Liu analyzed the data and wrote the paper; and Weihua Dong and Liqiu Meng revised the paper.
Conflicts of Interest
The authors declare no conflicts of interest.
References
- Kersting, O.; Dollner, J. Interactive 3D visualization of vector data in gis. In Proceedings of the Tenth ACM International Symposium on Advances in Geographic Information Systems, Mclean, VA, USA, 8–9 November 2002; pp. 107–112. [Google Scholar]
- Mccarthy, J.D.; Graniero, P.A. A gis-based borehole data management and 3D visualization system. Comput. Geosci. 2006, 32, 1699–1708. [Google Scholar] [CrossRef]
- Wu, H.; He, Z.; Gong, J. A virtual globe-based 3D visualization and interactive framework for public participation in urban planning processes. Comput. Environ. Urban Syst. 2010, 34, 291–298. [Google Scholar] [CrossRef]
- Korakakis, G.; Pavlatou, E.A.; Palyvos, J.A.; Spyrellis, N. 3D visualization types in multimedia applications for science learning: A case study for 8th grade students in greece. Comput. Educ. 2009, 52, 390–401. [Google Scholar] [CrossRef]
- Petersson, H.; Sinkvist, D.; Wang, C.; Smedby, Ö. Web-based interactive 3D visualization as a tool for improved anatomy learning. Anat. Sci. Educ. 2009, 2, 61–68. [Google Scholar] [CrossRef] [PubMed]
- St John, M.; Cowen, M.B.; Smallman, H.S.; Oonk, H.M. The use of 2D and 3D displays for shape-understanding versus relative-position tasks. Hum. Factors J. Hum. Factors Ergon. Soc. 2001, 43, 79–98. [Google Scholar] [CrossRef] [PubMed]
- Suárez, J.P.; Trujillo, A.; Santana, J.M.; Calle, M.D.L.; Gómez-Deck, D. An efficient terrain level of detail implementation for mobile devices and performance study. Comput. Environ. Urban Syst. 2015, 52, 21–33. [Google Scholar] [CrossRef]
- Swienty, O. Attention-Guiding Geovisualisation: A Cognitive Approach of Designing Relevant Geographic Information; TUM: Munich, Germany, 2008. [Google Scholar]
- Wolfe, J.M.; Horowitz, T.S. What attributes guide the deployment of visual attention and how do they do it? Nat. Rev. Neurosci. 2004, 5, 495–501. [Google Scholar] [CrossRef] [PubMed]
- Garlandini, S.; Fabrikant, S.I. Evaluating the effectiveness and efficiency of visual variables for geographic information visualization. In Proceedings of the International Conference on Spatial Information Theory, Aber Wrac’h, France, 21–25 September 2009; Springer: Berlin/Heidelberg, Germany, 2009; pp. 195–211. [Google Scholar]
- Wolfe, J.M. The rules of guidance in visual search. In Proceedings of the Perception and Machine Intelligence: First Indo-Japan Conference, Permin 2012, Kolkata, India, 12–13 January 2012; Kundu, M.K., Mitra, S., Mazumdar, D., Pal, S.K., Eds.; Springer: Berlin/Heidelberg, Germany, 2012; pp. 1–10. [Google Scholar]
- Cohen, J. Perceptual constancy. In Oxford Handbook of Philosophy of Perception; Oxford University Press: Oxford, UK, 2012. [Google Scholar]
- Bloj, M.; Hedrich, M. Color perception. In Handbook of Visual Display Technology; Springer: Berlin/Heidelberg, Germany, 2012; pp. 171–178. [Google Scholar]
- Bertin, J. Semiology of Graphics: Diagrams, Networks, Maps; University of Wisconsin Press: Madison, WI, USA, 1983. [Google Scholar]
- Bandrova, T. Designing of symbol system for 3D city maps. In Proceedings of the 20th International Cartographic Conference, Beijing, China, 6–10 August 2001; pp. 1002–1010. [Google Scholar]
- Haeberling, C. 3D map presentation—A systematic evaluation of important graphic aspects. In Proceedings of the ICA Mountain Cartography Workshop, Mt. Hood, OR, USA, 15–19 May 2002. [Google Scholar]
- Wilkening, J.; Fabrikant, S.I. How users interact with a 3D geo-browser under time pressure. Cartogr. Geogr. Inf. Sci. 2013, 40, 40–52. [Google Scholar] [CrossRef] [Green Version]
- Liao, H.; Dong, W.; Peng, C.; Liu, H. Exploring differences of visual attention in pedestrian navigation when using 2D maps and 3D geo-browsers. Cartogr. Geogr. Inf. Sci. 2016, 44, 1–17. [Google Scholar] [CrossRef]
- Li, Y.; Pizlo, Z. Depth cues versus the simplicity principle in 3D shape perception. Top. Cognit. Sci. 2011, 3, 667–685. [Google Scholar] [CrossRef] [PubMed]
- Brenner, E.; van Damme, W.J. Perceived distance, shape and size. Vis. Res. 1999, 39, 975–986. [Google Scholar] [CrossRef]
- Kenyon, R.V.; Phenany, M.; Sandin, D.; Defanti, T. Accommodation and size-constancy of virtual objects. Ann. Biomed. Eng. 2008, 36, 342–348. [Google Scholar] [CrossRef] [PubMed]
- Hatfield, G. Psychological experiments and phenomenal experience in size and shape constancy. Philos. Sci. 2014, 81, 940–953. [Google Scholar] [CrossRef]
- Morrison, J.L. A theoretical framework for cartographic generalization with the emphasis on the process of symbolization. Int. Yearb. Cartogr. 1974, 14, 115–127. [Google Scholar]
- Caivano, J.L. Visual texture as a semiotic system. Semiotica 1990, 80, 239–252. [Google Scholar] [CrossRef]
- MacEachren, A.M. How Maps Work: Representation, Visualization, and Design; Guilford Press: New York, NY, USA, 1995. [Google Scholar]
- MacEachren, A.M.; Roth, R.E.; O’Brien, J.; Li, B.; Swingley, D.; Gahegan, M. Visual semiotics & uncertainty visualization: An empirical study. IEEE Trans. Vis. Comput. Gr. 2012, 18, 2496–2505. [Google Scholar]
- Roth, R.E. Visual variables. Int. Encycl. Geogr. Available online: http://0-onlinelibrary-wiley-com.brum.beds.ac.uk/doi/10.1002/9781118786352.wbieg0761/abstract;jsessionid=6FB775930ACD5EAA6CA0D611A3B91EA8.f04t03 (accessed on 1 September 2017). [CrossRef]
- Brychtova, A.; Coltekin, A. An empirical user study for measuring the influence of colour distance and font size in map reading using eye tracking. Cartogr. J. 2016, 53, 202–212. [Google Scholar] [CrossRef]
- Keskin, M.; Dogru, O.; Guney, C.; Basaraner, M.; Ulugtekin, N. Contribution of neuroscience related technologies to cartography. In Proceedings of the International Conference on Cartography and Gis, Albena, Bulgaria, 13–17 June 2016. [Google Scholar]
- Grubert, A.; Eimer, M. Qualitative differences in the guidance of attention during single-color and multiple-color visual search: Behavioral and electrophysiological evidence. J. Exp. Psychol. Hum. Percept. Perform. 2013, 39, 1433–1442. [Google Scholar] [CrossRef] [PubMed]
- D’Zmura, M. Color in visual search. Vis. Res. 1991, 31, 951–966. [Google Scholar] [CrossRef]
- Quinlan, P.T.; Humphreys, G.W. Visual search for targets defined by combinations of color, shape, and size: An examination of the task constraints on feature and conjunction searches. Percept. Psychophys. 1987, 41, 455–472. [Google Scholar] [CrossRef] [PubMed]
- Williams, L. The effect of target specification on objects fixated during visual search. Percept. Psychophys. 1966, 1, 315–318. [Google Scholar] [CrossRef]
- Treisman, A.; Gormican, S. Feature analysis in early vision: Evidence from search asymmetries. Psychol. Rev. 1988, 95, 15–48. [Google Scholar] [CrossRef] [PubMed]
- Sagi, D. The combination of spatial frequency and orientation is effortlessly perceived. Atten. Percept. Psychophys. 1988, 43, 601–603. [Google Scholar] [CrossRef]
- Moraglia, G. Visual search: Spatial frequency and orientation. Percept. Motor Skills 1989, 69, 675–689. [Google Scholar] [CrossRef] [PubMed]
- Pizlo, Z. 3d Shape: Its Unique Place in Visual Perception; MIT Press: Cambridge, MA, USA, 2008. [Google Scholar]
- Bloj, M.G.; Kersten, D.; Hurlbert, A.C. Perception of three-dimensional shape influences colour perception through mutual illumination. Nature 1999, 402, 877–879. [Google Scholar] [PubMed]
- Giesel, M.; Gegenfurtner, K.R. Color appearance of real objects varying in material, hue, and shape. J. Vis. 2010, 10, 10. [Google Scholar] [CrossRef] [PubMed]
- Granzier, J.J.; Vergne, R.; Gegenfurtner, K.R. The effects of surface gloss and roughness on color constancy for real 3-d objects. J. Vis. 2014, 14, 16. [Google Scholar] [CrossRef] [PubMed]
- Radonjić, A.; Cottaris, N.P.; Brainard, D.H. Color constancy supports cross-illumination color selection. J. Vis. 2015, 15, 13. [Google Scholar] [CrossRef] [PubMed]
- Pizlo, Z.; Sawada, T.; Li, Y.; Kropatsch, W.G.; Steinman, R.M. New approach to the perception of 3d shape based on veridicality, complexity, symmetry and volume. Vis. Res. 2010, 50, 1–11. [Google Scholar] [CrossRef] [PubMed]
- Gibson, J.J. The Perception of the Visual World; Houghton Mifflin: Oxford, UK, 1950. [Google Scholar]
- Todd, J.T. The visual perception of 3D shape. Trends Cognit. Sci. 2004, 8, 115–121. [Google Scholar] [CrossRef] [PubMed]
- Werner, A. Color constancy improves, when an object moves: High-level motion influences color perception. J. Vis. 2007, 7, 19. [Google Scholar] [CrossRef] [PubMed]
- Gert, J. Color constancy and dispositionalism. Philos. Stud. 2013, 162, 183–200. [Google Scholar] [CrossRef]
- Patterson, R.E. Contextual factors, continued. In Human Factors of Stereoscopic 3d Displays; Springer: London, UK, 2015; pp. 57–62. [Google Scholar]
- Wagner, M. Sensory and cognitive explanations for a century of size constancy research. In Visual Experience: Sensation, Cognition, and Constancy; Oxford University Press: Oxford, UK, 2012; pp. 1–35. [Google Scholar]
- Crampton, J.W. Interactivity types in geographic visualization. Cartogr. Geogr. Inf. Sci. 2002, 29, 85–98. [Google Scholar] [CrossRef]
- Dong, W.; Liao, H.; Roth, R.E.; Wang, S. Eye tracking to explore the potential of enhanced imagery basemaps in web mapping. Cartogr. J. 2014, 51, 313–329. [Google Scholar] [CrossRef]
- Lawton, C.A. Gender, spatial abilities, and wayfinding. In Handbook of Gender Research in Psychology; Springer: New York, NY, USA, 2010; pp. 317–341. [Google Scholar]
- Granrud, C.E. Development of size constancy in children: A test of the metacognitive theory. Atten. Percept. Psychophys. 2009, 71, 644–654. [Google Scholar] [CrossRef] [PubMed]
- Castner, H.W.; Eastman, R.J. Eye-movement parameters and perceived map complexity—I. Am. Cartogr. 1984, 11, 107–117. [Google Scholar] [CrossRef]
- Brodersen, L.; Andersen, H.H.; Weber, S. Applying Eye-Movement Tracking for the Study of Map Perception and Map Design; National Survey and Cadastre: Copenhagen, Denmark, 2002. [Google Scholar]
- Manson, S.M.; Kne, L.; Dyke, K.R.; Shannon, J.; Eria, S. Using eye-tracking and mouse metrics to test usability of web mapping navigation. Cartogr. Geogr. Inf. Sci. 2012, 39, 48–60. [Google Scholar] [CrossRef]
- Ashbridge, E.; Perrett, D.I. Generalizing across object orientation and size. In Perceptual Constancy. Why Things Look as They Do; Cambridge University Press: Cambridge, UK, 1998; pp. 192–209. [Google Scholar]
- Plewan, T.; Rinkenauer, G. Simple reaction time and size-distance integration in virtual 3D space. Psychol. Res. 2016, 81, 653–663. [Google Scholar] [CrossRef] [PubMed]
- Granrud, C.E. Visual metacognition and the development of size constancy. In Thinking and Seeing: Visual Metacognition in Adults and Children; The MIT Press: Cambridge, MA, USA; London, UK, 2004; pp. 75–90. [Google Scholar]
- Granrud, C.E. Judging the size of a distant object: Strategy use by children and adults. In Visual Experience: Sensation, Cognition, and Constancy; Oxford University Press: Oxford, UK, 2012; pp. 13–34. [Google Scholar]
- Gori, M.; Giuliana, L.; Sandini, G.; Burr, D. Visual size perception and haptic calibration during development. Dev. Sci. 2012, 15, 854–862. [Google Scholar] [CrossRef] [PubMed]
- Chen, L. Topological structure in visual perception. Science 1982, 218, 699–700. [Google Scholar] [CrossRef] [PubMed]
- Winter, S.; Raubal, M.; Nothegger, C. Focalizing measures of salience for wayfinding. In Map—Based Mobile Services; Meng, L., Reichenbacher, T., Zipf, A., Eds.; Springer: Berlin/Heidelberg, Germnay, 2005; pp. 125–139. [Google Scholar]
- Olkkonen, M.; Brainard, D.H. Joint effects of illumination geometry and object shape in the perception of surface reflectance. I-Percept. 2011, 2, 1014–1034. [Google Scholar] [CrossRef] [PubMed]
- Kavšek, M.; Granrud, C.E. Children’s and adults’ size estimates at near and far distances: A test of the perceptual learning theory of size constancy development. I-Percept. 2012, 3, 459–466. [Google Scholar] [CrossRef] [PubMed]
- Tronick, E.; Hershenson, M. Size-distance perception in preschool children. J. Exp. Child Psychol. 1979, 27, 166–184. [Google Scholar] [CrossRef]
- Wu, W.-C.; Basdogan, C.; Srinivasan, M.A. Visual, haptic, and bimodal perception of size and stiffness in virtual environments. Proceedings of ASME Dynamic Systems and Control Division, Nashville, TN, USA, 14–19 November 1999; Volume 67, pp. 19–26. [Google Scholar]
- Haber, R.N.; Levin, C.A. The independence of size perception and distance perception. Percept. Psychophys. 2001, 63, 1140–1152. [Google Scholar] [CrossRef] [PubMed]
- Lee, Y.L.; Saunders, J.A. Symmetry facilitates shape constancy for smoothly curved 3d objects. J. Exp. Psychol. Hum. Percept. Perform. 2013, 39, 1193–1204. [Google Scholar] [CrossRef] [PubMed]
- Welchman, A.E.; Deubelius, A.; Conrad, V.; Bülthoff, H.H.; Kourtzi, Z. 3d shape perception from combined depth cues in human visual cortex. Nat. Neurosci. 2005, 8, 820–827. [Google Scholar] [CrossRef] [PubMed]
- Hubona, G.S.; Wheeler, P.N.; Shirah, G.W.; Brandt, M. The relative contributions of stereo, lighting, and background scenes in promoting 3d depth visualization. ACM Trans. Comput.-Hum. Interact. 1999, 6, 214–242. [Google Scholar] [CrossRef]
- Edler, D.; Bestgen, A.-K.; Kuchinke, L.; Dickmann, F. Grids in topographic maps reduce distortions in the recall of learned object locations. PLoS ONE 2014, 9, e98148. [Google Scholar] [CrossRef] [PubMed]
- Dolezalova, J.; Popelka, S. Scangraph: A novel scanpath comparison method using visualisation of graph cliques. J. Eye Mov. Res. 2016, 9, 1–13. [Google Scholar]
Figure 1.
Stimulus used for G1–G2 in Exp. 1.1, intended to investigate shape guidance. The participants were asked to find all the spheres. The stimulus for Exp. 1.2 was similar.
Figure 1.
Stimulus used for G1–G2 in Exp. 1.1, intended to investigate shape guidance. The participants were asked to find all the spheres. The stimulus for Exp. 1.2 was similar.

Figure 2.
Stimulus used for G1-G6 in Exp. 1.3, intended to investigate size guidance. The participants were asked to find all the larger cubes (A–C); these labels were not shown to the participants).
Figure 2.
Stimulus used for G1-G6 in Exp. 1.3, intended to investigate size guidance. The participants were asked to find all the larger cubes (A–C); these labels were not shown to the participants).

Figure 3.
(a) Six position regions for Exp. 2; (b) An example of how the objects were located within the six regions.
Figure 3.
(a) Six position regions for Exp. 2; (b) An example of how the objects were located within the six regions.

Figure 4.
(a) In Exp. 2.1, intended to investigate size constancy, Object F was expanded to 120% of its original size; (b) In Exp. 2.2, intended to investigate shape constancy, Object D was changed to a cone; (c) In Exp. 2.3, intended to investigate color constancy, the color saturation of Object D was decreased to 75% of its original value.


Figure 5.
Statistics and significance testing results of the guidance tasks (Exp. 1, mean values of all participants; * p < 0.05, ** p < 0.01, **** p = 0.000, NS = Not significant).
Figure 5.
Statistics and significance testing results of the guidance tasks (Exp. 1, mean values of all participants; * p < 0.05, ** p < 0.01, **** p = 0.000, NS = Not significant).

Figure 6.
Statistics of the indices calculated for Exp. 2 (constancy): (a) FT; (b) AFD; (c) VC and (d) AC.
Figure 6.
Statistics of the indices calculated for Exp. 2 (constancy): (a) FT; (b) AFD; (c) VC and (d) AC.


Table 1.
Experimental tasks.
| Attribute | Task | Number of Repetitions | |
|---|---|---|---|
| Exp. 1.1 | Shape Guidance | Find and click on all the spheres (G1–G2)/cones (G3–G4)/cubes (G5–G6). | 1 |
| Exp. 1.2 | Color Guidance | Find and click on all the red (G1–G2)/blue (G3–G4)/yellow (G5–G6) objects. | 1 |
| Exp. 1.3 | Size Guidance | Find and click on all the cubes (1 or many) that are larger than the others. | 1 |
| Exp. 2.1 | Size Constancy | Compare the sizes of A–F with that of X and tell the experimenter whether they are the same size as X. | 6 |
| Exp. 2.2 | Shape Constancy | Compare the shapes of A–F with that of X and tell the experimenter whether they are the same shape as X. | 6 |
| Exp. 2.3 | Color Constancy | Compare the colors of A–F with that of X and tell the experimenter whether they are the same color as X. | 6 |
Table 2.
Analysis indices and their interpretations.
| Experiment | Index Abbr. (Full Name, Unit) | Interpretation |
|---|---|---|
| Exp. 1 (Guidance) | FT (Finish time, s) | Time needed to complete the task |
| TtFF (Time to first fixation, s) | Time from the start of the task to when the subject fixated on the AOI group for the first time | |
| ACC (Average time needed for a correct click, s) | FT/the number of correctly judged objects | |
| VR (Visit ratio) | Visit duration for the AOI group/total visit duration | |
| AC (Accuracy) | Number of correct judgments/number of clicks | |
| Exp. 2 (Constancy) | FT (Finish time, s) | Time to complete the task |
| AFD (Average fixation duration, s) | Average of all durations of fixation on one AOI | |
| VC (Visit count, count) | Number of visits within an AOI | |
| AC (Accuracy) | Ratio of the number of correct judgments to the total number of judgments (with respect to positions) among all subjects |
Table 3.
AFD statistics and significance testing results for the constancy tasks (Exp. 2).
| Visual Variable | Position | A (Z(p)) | B (Z(p)) | C (Z(p)) | D (Z(p)) | E (Z(p)) |
|---|---|---|---|---|---|---|
| Size | B | −0.150 (0.880) | ||||
| C | −1.240 (0.215) | −1.903 (0.057) | ||||
| D | −0.627 (0.531) | −1.074 (0.283) | −0.339 (0.735) | |||
| E | −0.461 (0.645) | −0.442 (0.658) | −2.727 (0.006 *) | −1.452 (0.147) | ||
| F | −0.245 (0.806) | −0.706 (0.480) | −1.446 (0.148) | −0.686 (0.493) | −1.352 (0.176) | |
| Shape | B | −4.614 (0.000 **) | ||||
| C | −4.330 (0.000 **) | −0.729 (0.466) | ||||
| D | −1.952 (0.051) | −2.221 (0.026 *) | −1.887 (0.059) | |||
| E | −3.859 (0.000 **) | −1.260 (0.208) | −0.671 (0.502) | −1.292 (0.196) | ||
| F | −4.242 (0.000 **) | −1.089 (0.276) | −0.352 (0.725) | −1.684 (0.092) | −0.382 (0.702) | |
| Color | B | −1.719 (0.086) | ||||
| C | −2.207 (0.027 *) | −0.522 (0.602) | ||||
| D | −1.688 (0.091) | −0.513 (0.608) | −0.059 (0.953) | |||
| E | −2.518 (0.012 *) | −0.972 (0.331) | −0.445 (0.657) | −0.223 (0.824) | ||
| F | −1.487 (0.137) | −0.919 (0.358) | −1.527 (0.127) | −1.038 (0.299) | −2.116 (0.034 *) |
* p < 0.05, ** p < 0.01.
© 2017 by the authors. Licensee MDPI, Basel, Switzerland. This article is an open access article distributed under the terms and conditions of the Creative Commons Attribution (CC BY) license (http://creativecommons.org/licenses/by/4.0/).
Share and Cite
MDPI and ACS Style
Liu, B.; Dong, W.; Meng, L. Using Eye Tracking to Explore the Guidance and Constancy of Visual Variables in 3D Visualization. ISPRS Int. J. Geo-Inf. 2017, 6, 274. https://0-doi-org.brum.beds.ac.uk/10.3390/ijgi6090274
AMA Style
Liu B, Dong W, Meng L. Using Eye Tracking to Explore the Guidance and Constancy of Visual Variables in 3D Visualization. ISPRS International Journal of Geo-Information. 2017; 6(9):274. https://0-doi-org.brum.beds.ac.uk/10.3390/ijgi6090274
Chicago/Turabian StyleLiu, Bing, Weihua Dong, and Liqiu Meng. 2017. "Using Eye Tracking to Explore the Guidance and Constancy of Visual Variables in 3D Visualization" ISPRS International Journal of Geo-Information 6, no. 9: 274. https://0-doi-org.brum.beds.ac.uk/10.3390/ijgi6090274
Note that from the first issue of 2016, this journal uses article numbers instead of page numbers. See further details here.