Assessment of Sustainable Livelihood and Geographic Detection of Settlement Sites in Ethnically Contiguous Poverty-Stricken Areas in the Aba Prefecture, China


Abstract
:1. Introduction
2. Materials
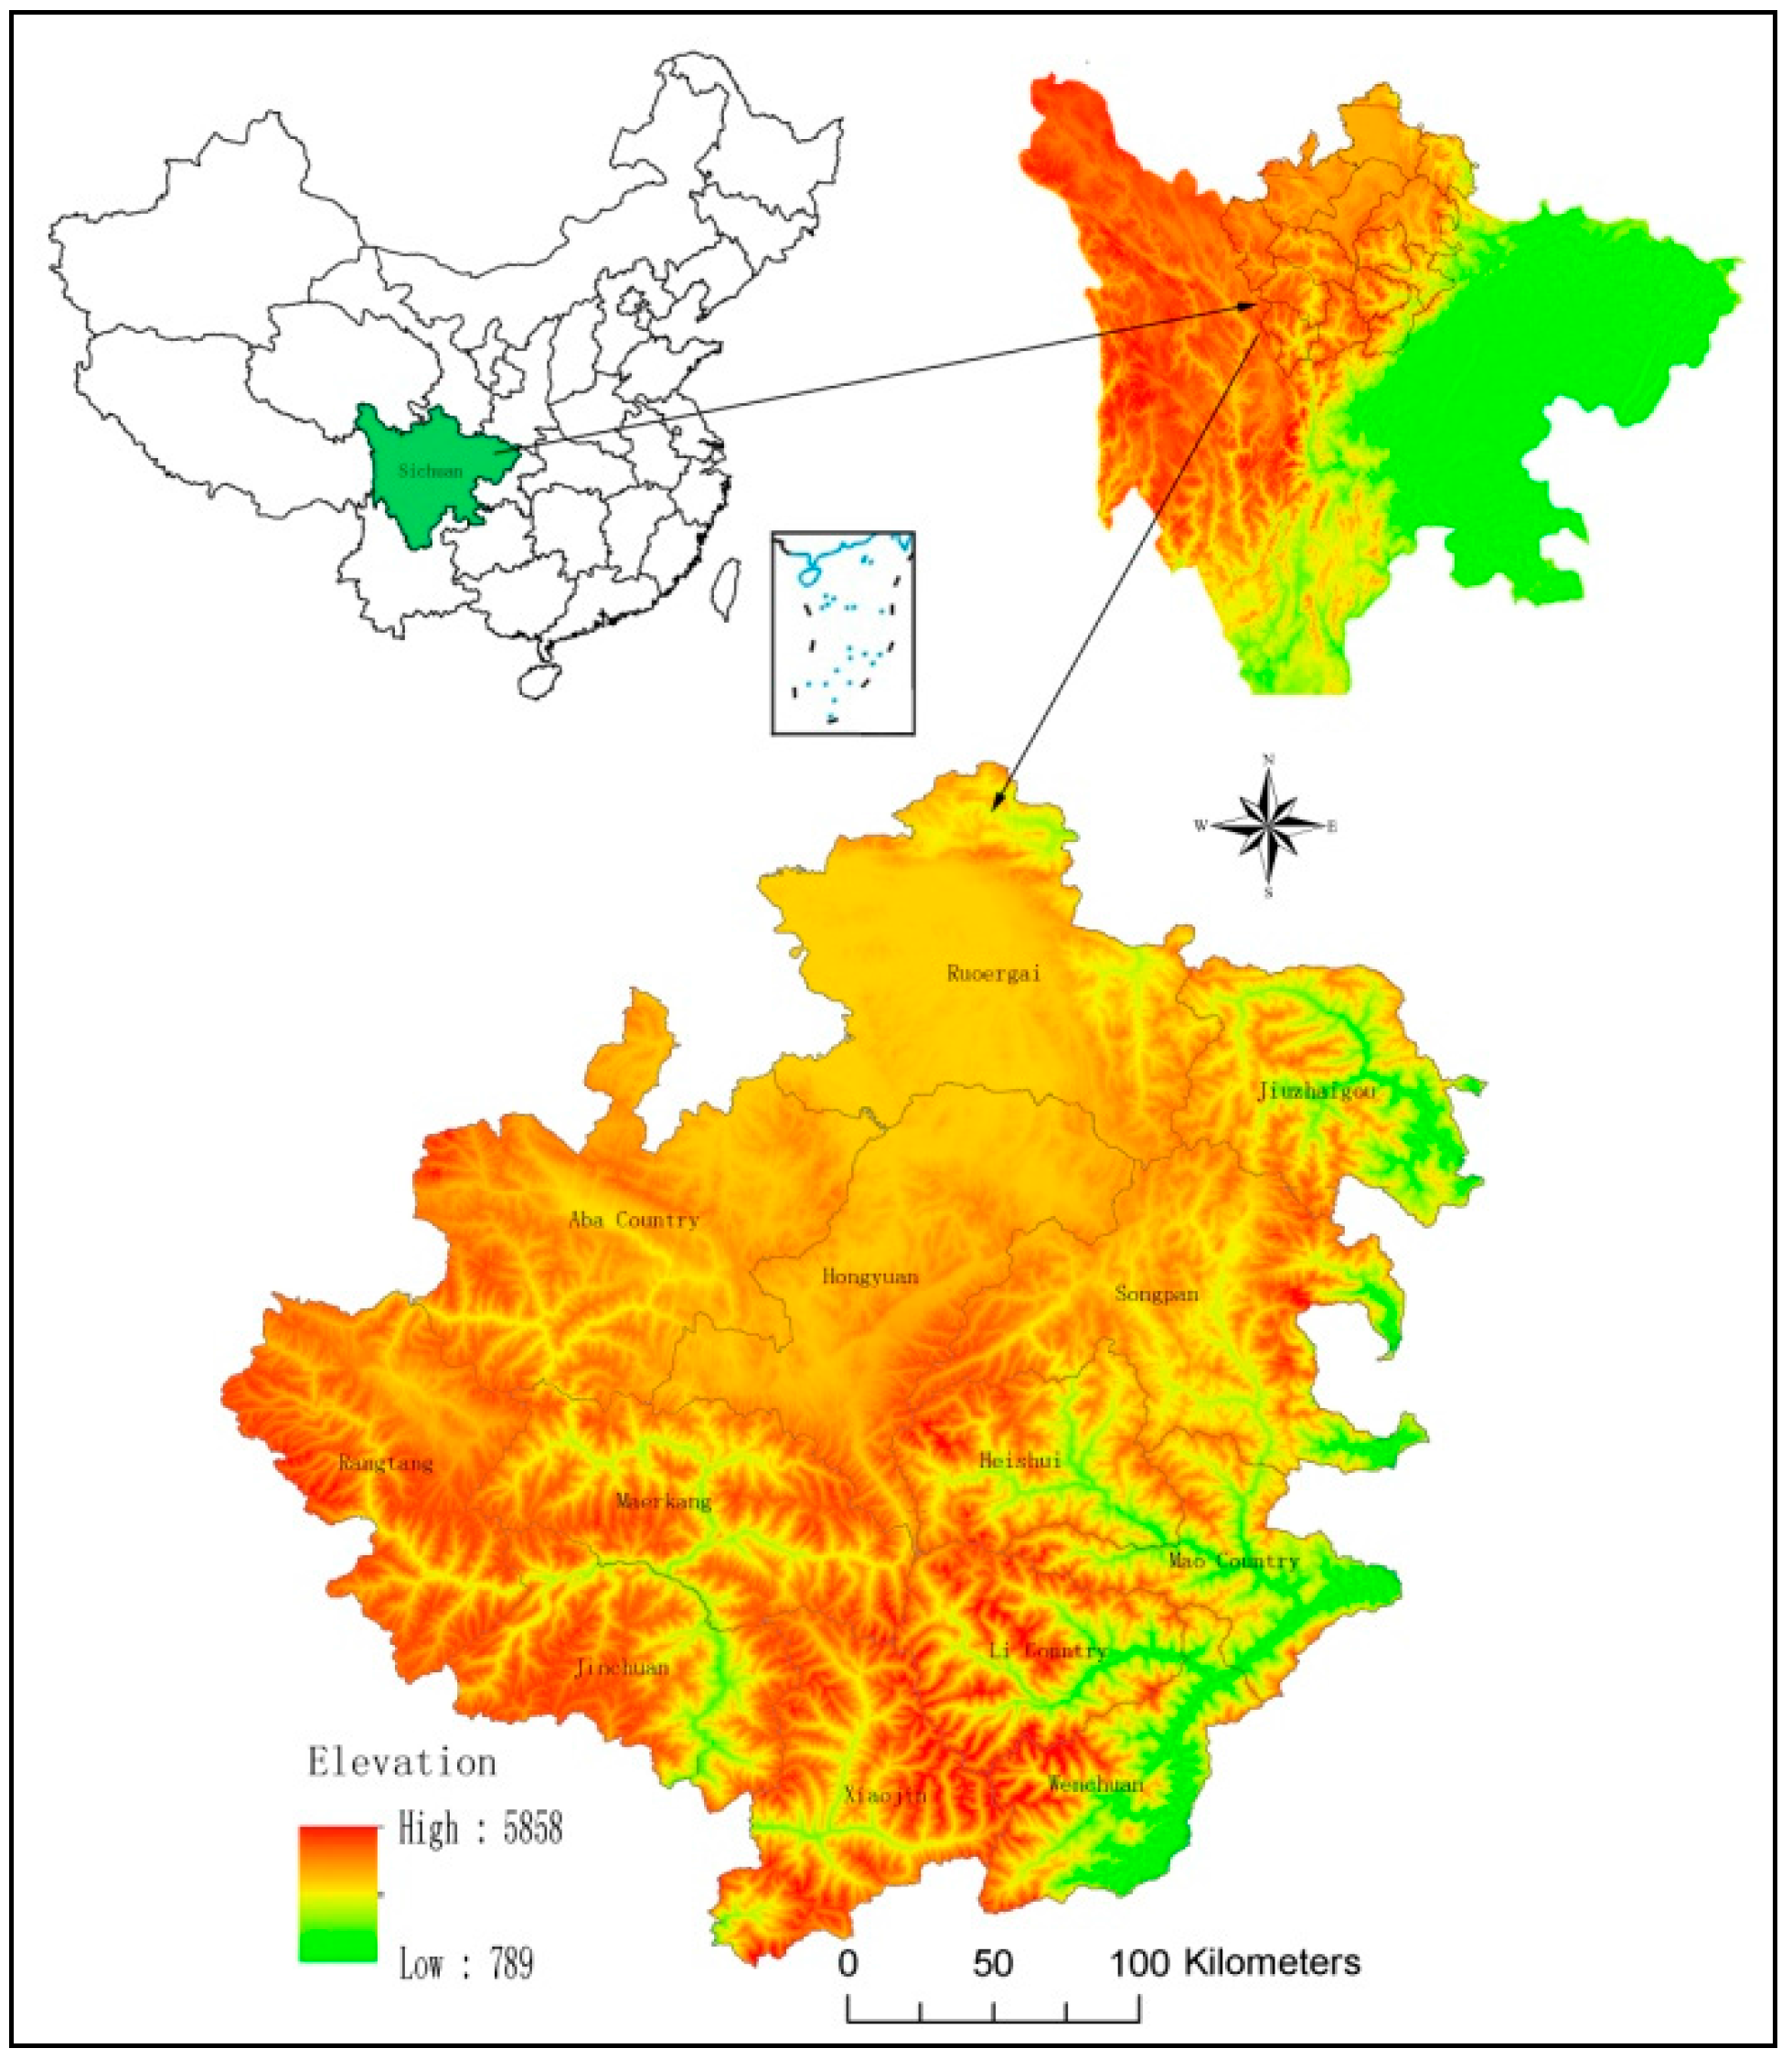
2.1. Study Area
2.2. Materials
3. Methods
3.1. Construction of Evolution Indices
3.2. Index Clarification
3.3. Calculation of Livelihood Capitals
3.4. Geographical Detector Method
4. Results
4.1. Evaluation of Livelihood Capitals
4.2. Analyses on a County Scale
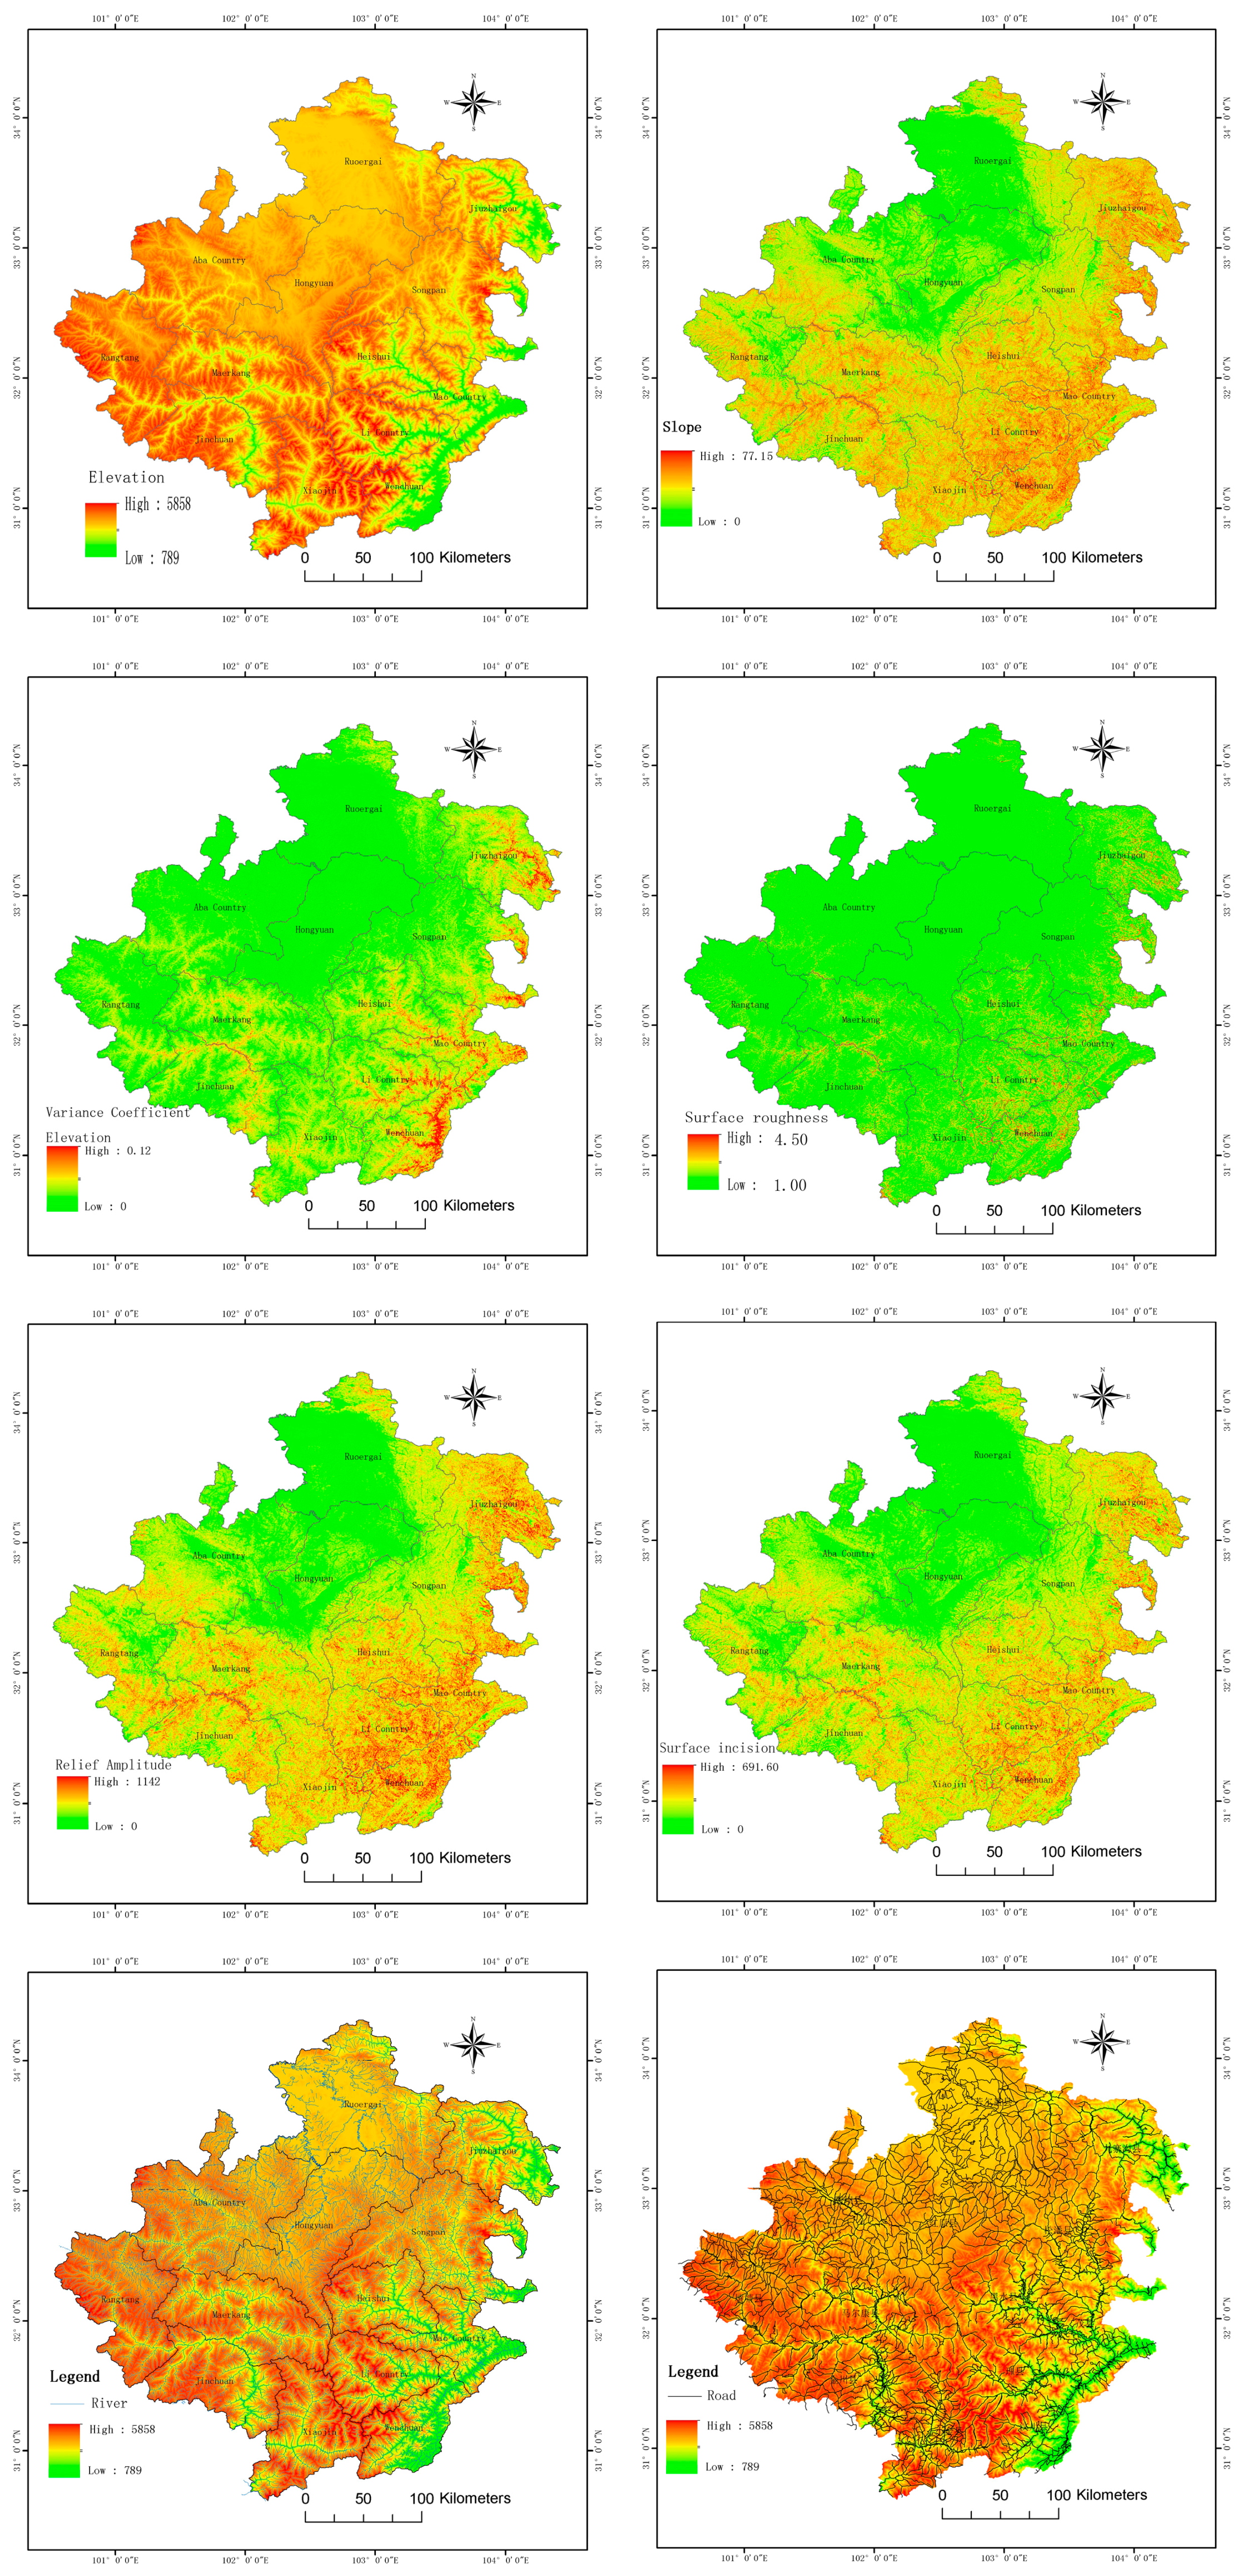
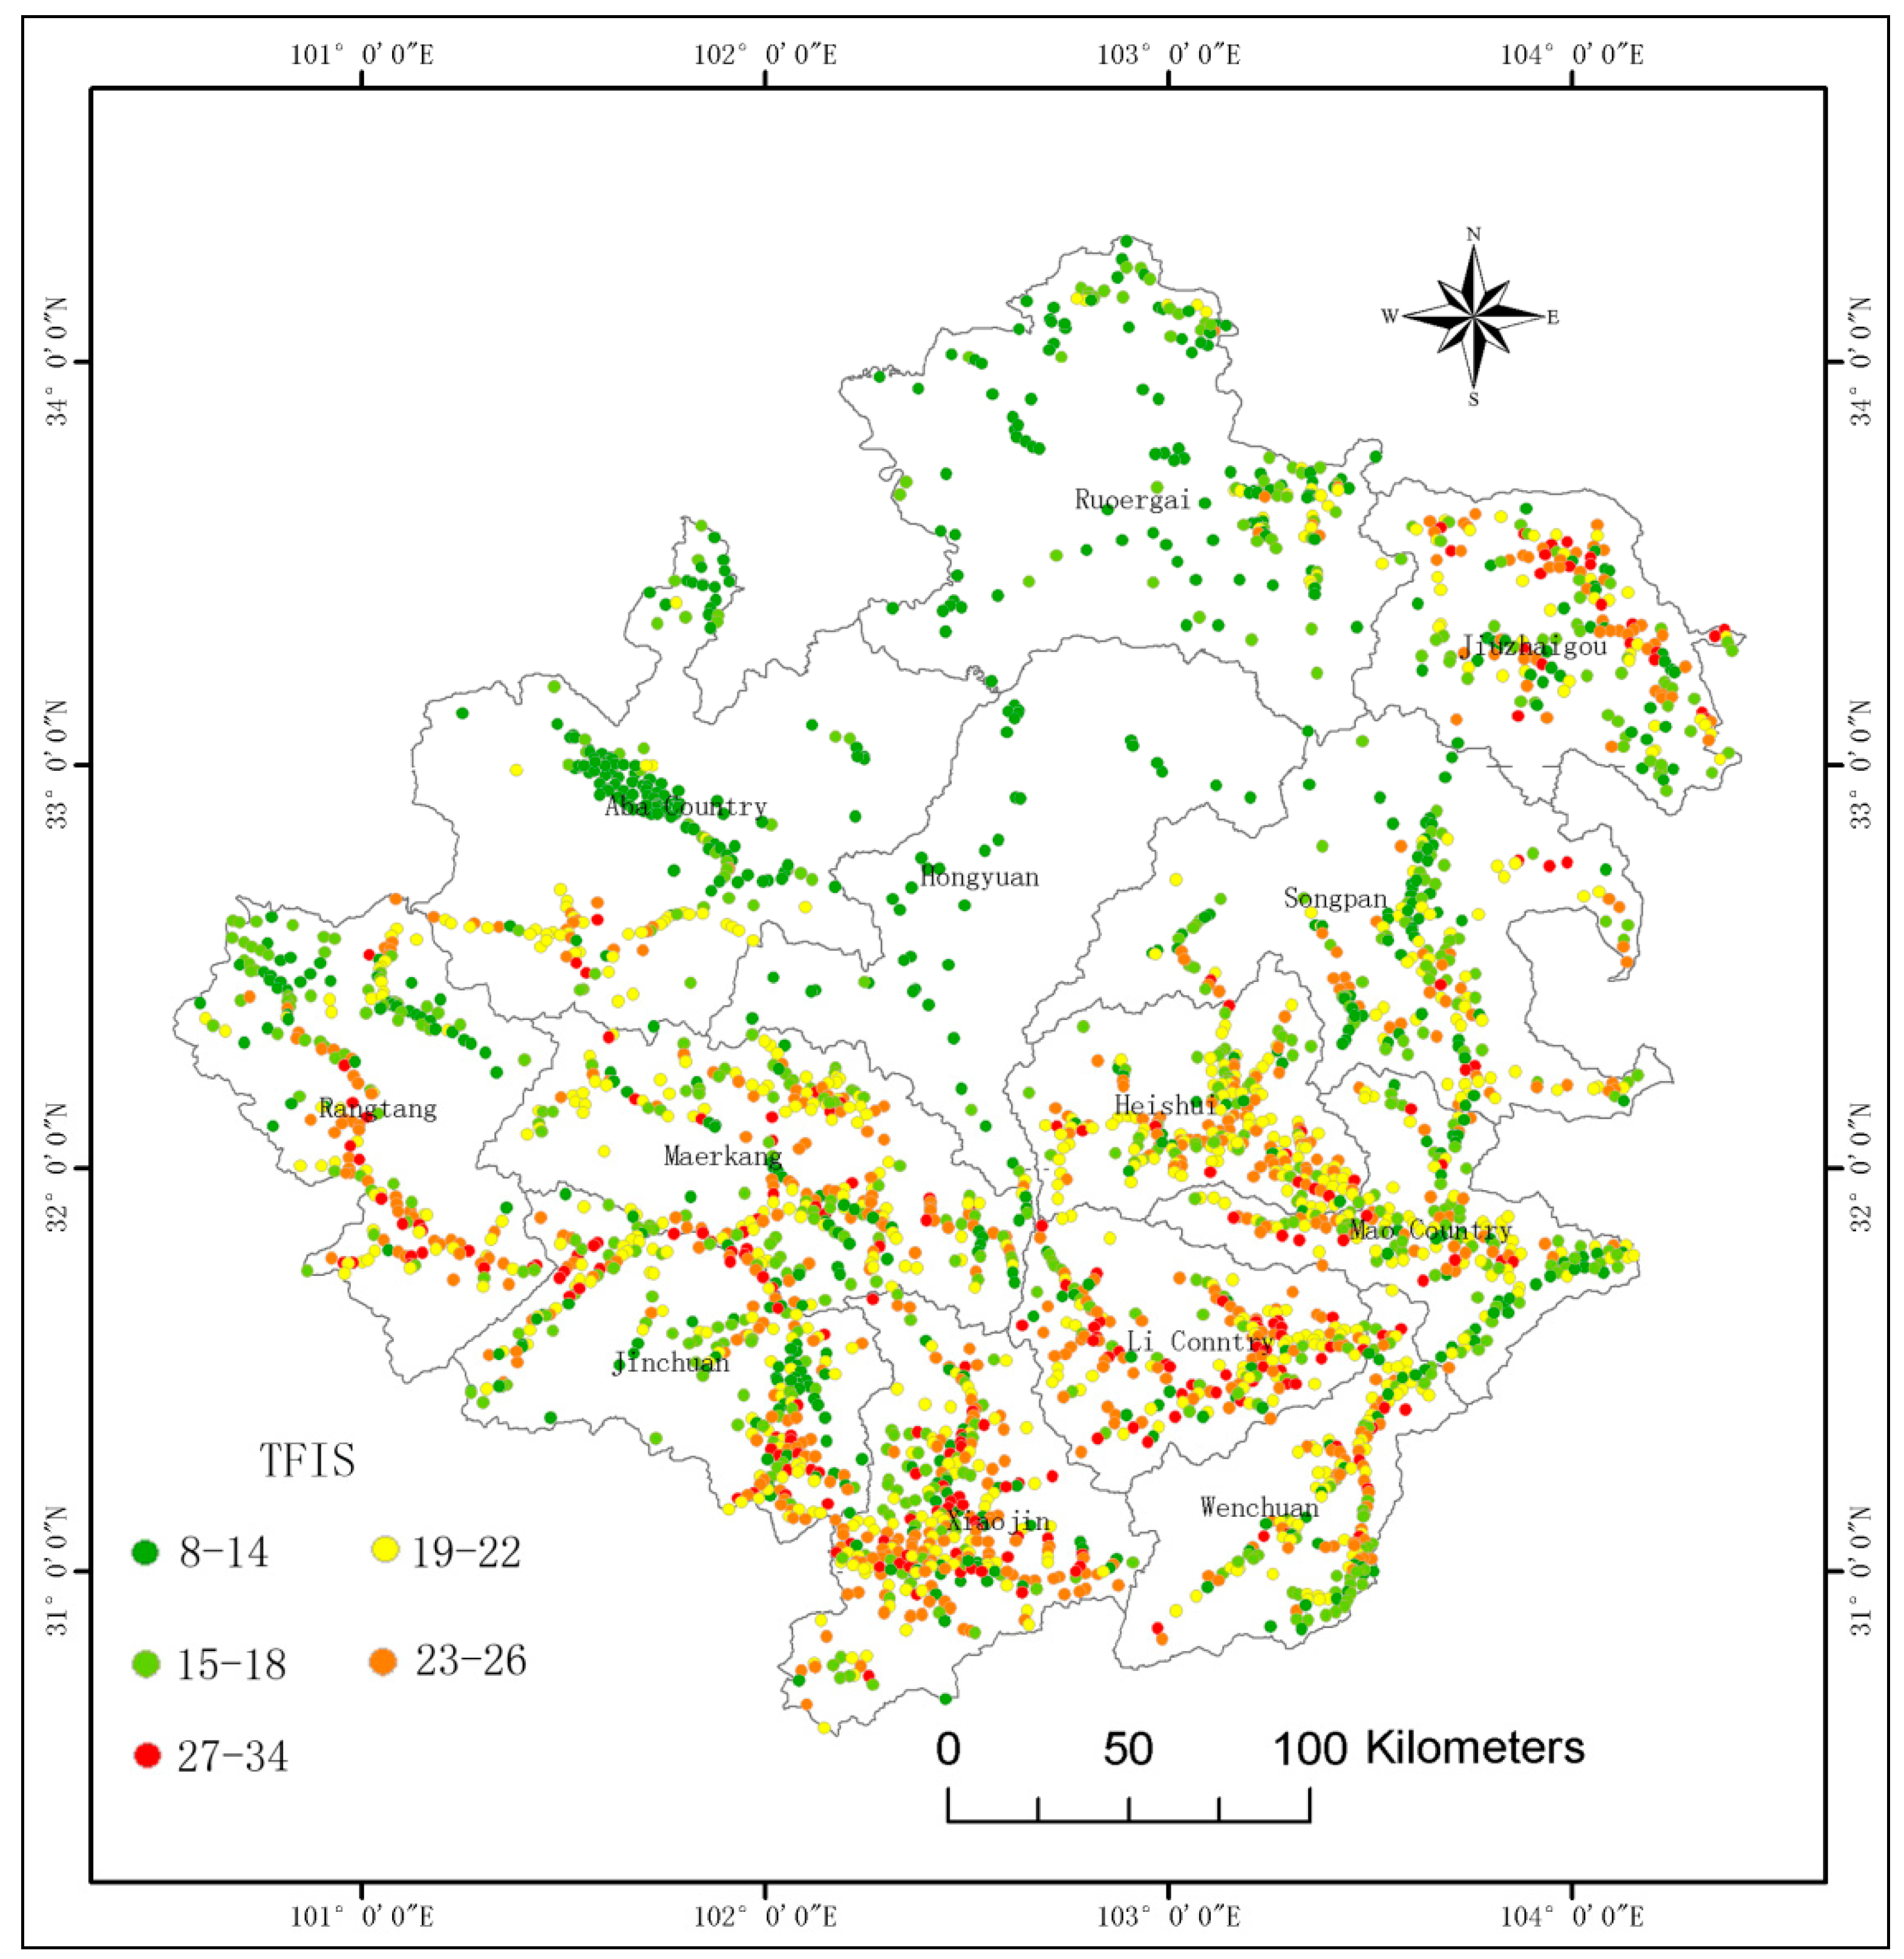
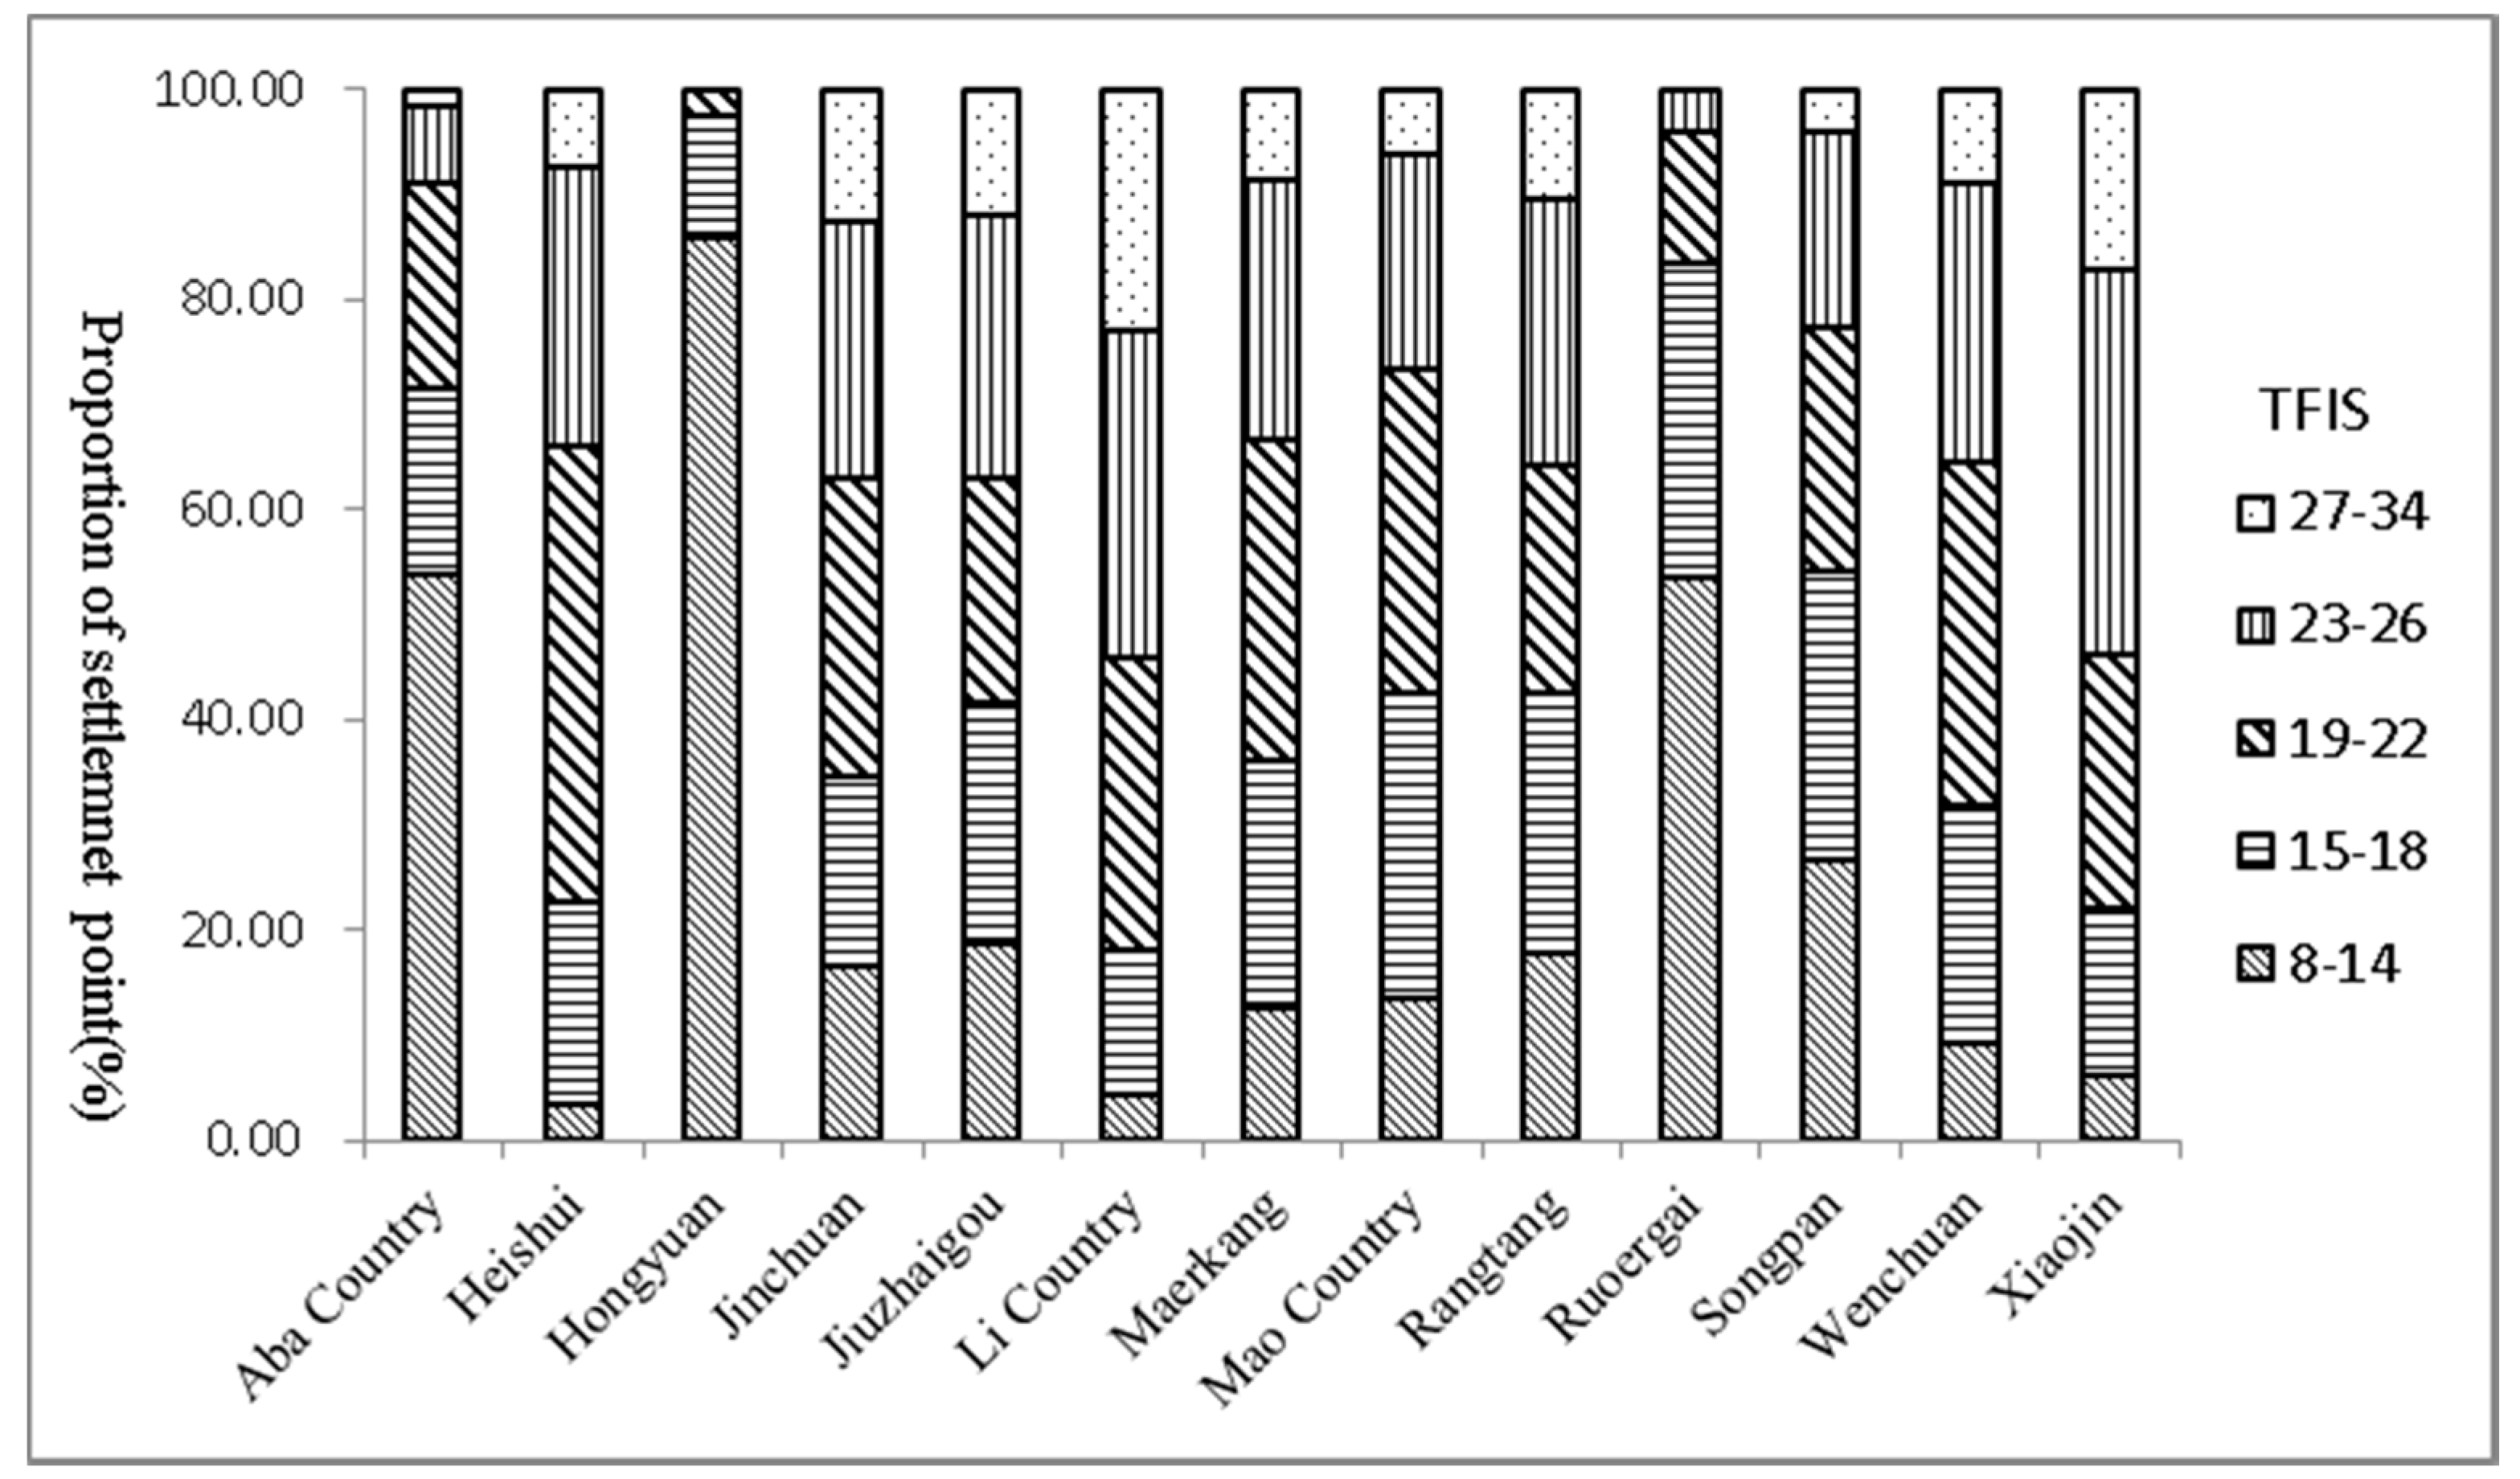
4.3. Topographic Factors Index of Settlement Sites
4.4. Development Analysis
5. Conclusions and Discussion
Supplementary Materials
Acknowledgments
Author Contributions
Conflicts of Interest
References
- Erenstein, O.; Hellin, J.; Chandna, P. Poverty mapping based on livelihood assets: A meso-level application in the Indo-Gangetic Plains, India. Appl. Geogr. 2010, 30, 112–125. [Google Scholar] [CrossRef]
- Ferreira, F.H.G. Poverty is multidimensional. But what are we going to do about it? J. Econ. Inequal. 2011, 9, 493–495. [Google Scholar] [CrossRef]
- Kemkes, R.J. The role of natural capital in sustaining livelihoods in remote mountainous regions: The case of Upper Svaneti, Republic of Georgia. Ecol. Econ. 2015, 117, 22–31. [Google Scholar] [CrossRef]
- Fang, Y.P.; Fan, J.; Shen, M.Y. Gradient effect on farmers’ income in the mountain areas and its implication for poverty alleviation strategies: Empirical analysis from the upper reach of Minjiang River, China. J. Mt. Sci. 2012, 9, 869–878. [Google Scholar] [CrossRef]
- Cao, M.T.; Xu, D.D.; Xie, F.T.; Liu, E.L.; Liu, S.Q. The influence factors analysis of households’ poverty vulnerability in southwest ethnic areas of China based on the hierarchical linear model: A case study of Liangshan Yi autonomous prefecture. Appl. Geogr. 2016, 66, 144–152. [Google Scholar] [CrossRef]
- Liu, S.Q.; Chen, G.J. Function of rural settlement complex ecosystem in mountain area: A case study of Raosi Village of Zuogong County, Tibet. Wuhan Univ. J. Nat. Sci. 2006, 11, 945–950. [Google Scholar]
- Zhang, J.Q.; Wu, Y.J.; Ge, Y. Eco-security assessments of poor areas based on gray correlation model: A case study in Enshi. Geogr. Res. 2014, 33, 1457–1466. [Google Scholar]
- Wang, C.C.; Zhang, Y.Q.; Yang, Y.S.; Yang, Q.C.; Kush, J.; Xu, Y.C.; Xu, L.L. Assessment of sustainable livelihoods of different farmers in hilly red soil erosion areas of southern China. Ecol. Indic. 2016, 64, 123–131. [Google Scholar] [CrossRef]
- Xu, D.D.; Zhang, J.F.; Rasul, G.; Liu, S.Q.; Xie, F.T.; Cao, M.T.; Liu, Y.L. Household livelihood strategies and dependence on agriculture in the mountainous settlements in the Three Gorges Reservoir Area, China. Sustainability 2015, 7, 4850–4869. [Google Scholar] [CrossRef]
- Rahut, D.B.; Ali, A.; Kassie, P.P.; Basnet, C. Rural livelihood diversification strategies in Nepal. Poverty Public Policy 2015, 6, 259–281. [Google Scholar] [CrossRef]
- Sandbrook, C.G. Local economic impact of different forms of nature-based tourism. Conserv. Lett. 2010, 3, 21–28. [Google Scholar] [CrossRef]
- Yang, M.; Hens, L.; Ou, X.; Wulf, R.D. Tourism: An alternative to development? Mt. Res. Dev. 2009, 29, 75–81. [Google Scholar] [CrossRef] [Green Version]
- Bhandari, P.B. Rural livelihood change? household capital, community resources and livelihood transition. J. Rural Stud. 2013, 32, 126–136. [Google Scholar] [CrossRef] [PubMed]
- Rigg, J. Land, farming, livelihoods, and poverty: Rethinking the links in the Rural South. World Dev. 2006, 34, 180–202. [Google Scholar] [CrossRef] [Green Version]
- Donohue, C.; Biggs, E. Monitoring socio-environmental change for sustainable development: Developing a multidimensional livelihoods index (MLI). Appl. Geogr. 2015, 62, 391–403. [Google Scholar] [CrossRef]
- Department for International Development. Sustainable Livelihoods Guidance Sheets; Department for International Development: London, UK, 1999.
- Ahmed, N.; Allison, E.H.; Muir, J.F. Using the sustainable livelihoods framework to identify constraints and opportunities to the development of freshwater prawn farming in southwest bangladesh. J. World Aquac. Soc. 2008, 39, 598–611. [Google Scholar] [CrossRef]
- King, B. Spatialising livelihoods: Resource access and livelihood spaces in South Africa. Trans. Inst. Br. Geogr. 2011, 36, 297–313. [Google Scholar] [CrossRef]
- Horsley, J.; Prout, S.; Tonts, M.; Ali, S.H. Sustainable livelihoods and indicators for regional development in mining economies. Extr. Ind. Soc. 2015, 2, 368–380. [Google Scholar] [CrossRef]
- Wang, C.; Huang, B.; Deng, C.; Wan, Q.; Zhang, L.; Fei, Z.H.; Li, H.Y. Rural settlement restructuring based on analysis of the peasant household symbiotic system at village level: A case study of Fengsi village in Chongqing, China. J. Rural Stud. 2016, 47, 485–495. [Google Scholar] [CrossRef]
- Geospatial Data Cloud. Computer network information center of the Chinese Academy of Sciences. 2015. Available online: http://www.gscloud.cn (accessed on 24 March 2015).
- Gautam, Y.; Andersen, P. Rural livelihood diversification and household well-being: Insights from humla, Nepal. J. Rural Stud. 2016, 44, 239–249. [Google Scholar] [CrossRef]
- Kristjanson, P.; Radeny, M.; Baltenweck, I.; Ogutu, J.; Notenbaert, A. Livelihood mapping and poverty correlates at a meso-level in kenya. Food Policy 2005, 30, 568–583. [Google Scholar] [CrossRef]
- Ellis, F. The determinants of rural livelihood diversification in developing countries. J. Agric. Econ. 2000, 51, 289–302. [Google Scholar] [CrossRef]
- Cuba, N.; Bebbington, A.; Rogan, J.; Millonesb, M. Extractive industries, livelihoods and natural resource competition: Mapping overlapping claims in peru and ghana. Appl. Geogr. 2014, 54, 250–261. [Google Scholar] [CrossRef]
- Gong, L.; Jin, C. Fuzzy comprehensive evaluation for carrying capacity of regional water resources. Water Resour. Manag. 2009, 23, 2505–2513. [Google Scholar] [CrossRef]
- State Forestry Administration. Indicators for the Evolution of Ecotourism in Nature Reserves (LY/T1863-2009); China Standards Press: Beijing, China, 2009.
- Delgado, A.; Romero, I. Environmental conflict analysis using an integrated grey clustering and entropy-weight method. Environ. Model. Softw. 2016, 77, 108–121. [Google Scholar] [CrossRef]
- Wang, J.F.; Li, H.X.; Christakos, G.; Liao, Y.L.; Zhang, T.; Gu, X.; Zheng, X.Y. Geographical detectors-based health risk assessment and its application in the neural tube defects study of the Heshun region, china. Int. J. Geogr. Inf. Sci. 2010, 24, 107–127. [Google Scholar] [CrossRef]
- Wang, J.F.; Hu, Y. Environmental health risk detection with Geo-detector. Environ. Model. Softw. 2012, 33, 114–115. [Google Scholar] [CrossRef]
- Luo, W.; Jasiewicz, J.; Stepinski, T.; Wang, J.F.; Xu, C.D.; Cang, X.Z. Spatial association between dissection density and environmental factors over the entire conterminous united states. Geophys. Res. Lett. 2016, 43, 692–700. [Google Scholar] [CrossRef]
- Yang, R.; Deng, L.Y.; Zuo, S.D.; Luo, Y.J.; Shao, G.F.; Wei, X.H.; Hua, L.Z.; Yang, Y.S. Geographical modeling of spatial interaction between human activity and forest connectivity in an urban landscape of southeast China. Landsc. Ecol. 2014, 29, 1741–1758. [Google Scholar]
- Fang, Y.P.; Fan, J.; Shen, M.Y.; Song, M.Q. Sensitivity of livelihood strategy to livelihood capital in mountain areas: Empirical analysis based on different settlements in the upper reaches of the Minjiang river, China. Ecol. Indic. 2014, 38, 225–235. [Google Scholar] [CrossRef]
- Denman, R. Guidelines for Community-Based Ecotourism Development; WWF-World Wide Fund for Nature: Gland, Switzerland, 2001. [Google Scholar]
- Batabyal, A.A. Accessibility, vulnerability, and resilience in a stochastic model of sustainable ecotourism. Transp. Res. Part D 2016, 43, 71–81. [Google Scholar] [CrossRef]
- Yuno, D.; Seongbo, K.; Jiyoon, K.; Gea-Jae, J. Wetland-based tourism in South korea: Who, when, and why. Wetl. Ecol. Manag. 2015, 23, 779–787. [Google Scholar]
- Liu, C.H.; Hong, C.Y.; Li, J.F. The determinants of ecotourism behavioral intentions. Soc. Sci. Electron. Publ. 2013, 7, 71–84. [Google Scholar]
- State Council of the People’s Republic of China. China Rural Poverty Alleviation and Development Program 2011–2020. 2011. Available online: http://www.gov.cn/gongbao/content/2011/content_2020905.htm (accessed on 26 March 2014).
- State Council of the People’s Republic of China. Outline of National Tourism and Leisure (2013–2020). 2013. Available online: http://www.gov.cn/zwgk/2013-02/18/content2333544.htm (accessed on 26 March 2014).
- State Council of the People’s Republic of China. Some Opinions on Promoting the Reform and Development of Tourism. 2014. Available online: http://www.gov.cn/zhengce/content/2014-08/21/content_8999.htm (accessed on 18 February 2015).
- Moran, C.J.; Franks, D.M.; Sonter, L.J. Using the multiples framework to connect the multiple capitals framework to connect indicators of regional cumulative impacts of mining and pastoralism in the Murray Darling Basin, Australia. Resour. Policy 2013, 38, 733–744. [Google Scholar] [CrossRef]


| Goal Layer | Criteria Layer | Indicator Layer | Reference Value | Basis |
|---|---|---|---|---|
| Livelihoods evaluation indexes A | Natural B1 | Coverage of forest (%) C11 | 35.75 | National average |
| Area rate of nature reserve (%) C12 | 12.89 | National average | ||
| Natural wetland protection rate (%) C13 | 6.00 | Aba ecological construction planning | ||
| Crop sown area of per capita (m2) C14 | 824.23 | National average | ||
| Human B2 | Population density (people/km2) C21 | 51.30 | National average | |
| Natural growth rate of population (%) C22 | 5.21 | National average | ||
| Proportion of Agriculture and animal husbandry (%) C23 | 45.23 | National average | ||
| Ratio of compulsory education %) C24 | 10.11 | National average | ||
| Teacher quantity per 10,000 people owning C25 | 97.30 | National average | ||
| Public health technical persons quantity per 10,000 people (%) C26 | 54.03 | National average | ||
| Per capita consumption (yuan) C27 | 14,491.00 | National average | ||
| Total consumption growth rate (%) C28 | 9.60 | National average | ||
| Social B3 | Per capita GDP (yuan) C31 | 46,531.20 | National average | |
| GDP growth rate (%) C32 | 7.40 | National average | ||
| Participation rate of rural cooperative medical system (%) C33 | 100.00 | Extrapolated ideal value | ||
| Participation rate of endowment insurance C34 | 61.58 | National average | ||
| Registered urban unemployment rate (%) C35 | 4.09 | National average | ||
| Ratio of minimum living guarantees (%) C36 | 5.49 | National average | ||
| Growth rate of tourism income (%) C37 | 15.40 | National average | ||
| Contribution rate of tourism revenue to GDP (%) C38 | 15.14 | National average | ||
| Tourist density C39 | 6.63 | Average of Sichuan Provence | ||
| Physical B4 | Urbanization rate (%) C41 | 50.00 | National average | |
| Fixed assets investment (a hundred million yuan) C42 | 60.59 | National average | ||
| Rate of the 2nd and 3rd industry (%) C43 | 90.00 | National average | ||
| Per capita food production (kg) C44 | 443.84 | National average | ||
| Per capita meat production (kg) C45 | 63.66 | National average | ||
| Traffic line density (%) C46 | 46.00 | National average | ||
| Financial B5 | Per capita loan (yuan) C51 | 59,700.00 | National average | |
| Per capita of resident deposit (yuan) C52 | 37,058.24 | National average | ||
| Per capita disposable income of urban residents (yuan) C53 | 28,844.00 | National average | ||
| Growth rate of per capita disposable income of urban residents (%) C54 | 9.00 | National average | ||
| Net income of farmers and herdsmen (yuan) C55 | 9892.00 | National average | ||
| Growth rate of net income of farmers and herdsmen (%) C56 | 11.20 | National average |
| Index | Goal | Weight | Criteria | Weight |
|---|---|---|---|---|
| Coverage of forest (%) C11 | Livelihoods A | 0.019 | Natural B1 | 0.159 |
| Area rate of nature reserve (%) C12 | 0.032 | 0.264 | ||
| Natural wetland protection rate (%) C13 | 0.059 | 0.485 | ||
| Crop sown area of per capita (m2) C14 | 0.011 | 0.091 | ||
| Population density (people/km2) C21 | 0.035 | Human B2 | 0.159 | |
| Natural growth rate of population (%) C22 | 0.024 | 0.106 | ||
| Proportion of agriculture and animal husbandry (%) C23 | 0.020 | 0.091 | ||
| Ratio of compulsory education (%) C24 | 0.028 | 0.125 | ||
| Teacher quantity per 10,000 people owning C25 | 0.013 | 0.061 | ||
| Public health technical persons quantity per 10,000 people (%) C26 | 0.041 | 0.187 | ||
| Per capita consumption (yuan) C27 | 0.038 | 0.169 | ||
| Total consumption growth rate (%) C28 | 0.023 | 0.102 | ||
| Per capita GDP (yuan) C31 | 0.026 | Social B3 | 0.081 | |
| GDP growth rate (%) C32 | 0.021 | 0.067 | ||
| Participation rate of rural cooperative medical system (%) C33 | 0.040 | 0.127 | ||
| Participation rate of endowment insurance C34 | 0.015 | 0.046 | ||
| Registered urban unemployment rate (%) C35 | 0.035 | 0.111 | ||
| Ratio of minimum living guarantees (%) C36 | 0.009 | 0.028 | ||
| Growth rate of tourism income (%) C37 | 0.050 | 0.158 | ||
| Contribution rate of tourism revenue to GDP (%) C38 | 0.075 | 0.235 | ||
| Tourist density C39 | 0.046 | 0.146 | ||
| Urbanization rate (%) C41 | 0.013 | Physical B4 | 0.081 | |
| Fixed assets investment (a hundred million yuan) C42 | 0.030 | 0.191 | ||
| Rate of the 2nd and 3rd industry (%) C43 | 0.023 | 0.147 | ||
| Per capita food production (kg) C44 | 0.025 | 0.161 | ||
| Per capita meat production (kg) C45 | 0.027 | 0.173 | ||
| Traffic line density (%) C46 | 0.039 | 0.246 | ||
| Per capita loan (yuan) C51 | 0.029 | Financial B5 | 0.158 | |
| Per capita of resident deposit (yuan) C52 | 0.036 | 0.198 | ||
| Per capita disposable income of urban residents (yuan) C53 | 0.033 | 0.182 | ||
| Growth rate of per capita disposable income of urban residents (%) C54 | 0.029 | 0.157 | ||
| Net income of farmers and herdsmen (yuan) C55 | 0.014 | 0.076 | ||
| Growth rate of net income of farmers and herdsmen (%) C56 | 0.042 | 0.228 |
| Indictor | Classification (natural breaks) | P | ||||
|---|---|---|---|---|---|---|
| First (1) Second (2) Third (3) Fourth (4) Fifth (5) | ||||||
| Elevation | ≤1638.00 | >1638.00~2436.00 | >2436.00~3036.00 | >3036.00~3585.00 | >3585.00~4543.00 | 0.02 |
| Slop | ≤10.34 | >10.34~19.66 | >19.66~27.74 | >27.74~36.18 | >36.18~56.95 | 0.70 |
| RA | ≤99.00 | >99.00~178.00 | >178.00~245.00 | >245.00~324.00 | >324.00~635.00 | 0.77 |
| SI | ≤43.36 | >43.36~82.96 | >82.96~122.36 | >122.36~167.60 | >167.60~377.36 | 0.76 |
| VCE | ≤0.012 | >0.012~0.021 | >0.021~0.031 | >0.031~0.049 | >0.049~0.104 | 0.51 |
| SR | ≤1.06 | >1.06~1.14 | >1.14~1.23 | >1.23~1.37 | >1.37~1.84 | 0.66 |
| DRD | ≤171.43 | >171.43~518.32 | >518.32~1134.61 | >1134.61~2113.26 | >2113.26~4133.40 | 0.06 |
| DR | ≤363.03 | >363.03~739.15 | >739.15~1305.47 | >1305.47~2736.25 | >2736.25~7064.42 | 0.09 |
| County | Livelihoods Index | Natural Capital Index | Human Capital Index | Social Capital Index | Physical Capital Index | Financial Capital Index |
|---|---|---|---|---|---|---|
| Ruoergai | 1.51 | 4.62 | 1.48 | 0.85 | 0.65 | 1.37 |
| Aba County | 1.09 | 2.18 | 0.80 | 1.49 | 0.33 | 0.66 |
| Rangtang | 0.58 | 1.93 | 0.71 | 0.11 | 0.37 | 0.51 |
| Jiuzhaigou | 1.88 | 1.76 | 1.31 | 3.56 | 0.54 | 0.89 |
| Hongyuan | 0.90 | 1.51 | 1.51 | 0.67 | 0.46 | 0.51 |
| Maerkang | 0.79 | 0.38 | 1.25 | 0.59 | 0.77 | 0.86 |
| Jinchuan | 0.56 | 0.48 | 0.35 | 0.64 | 0.69 | 0.61 |
| Songpan | 1.59 | 1.31 | 1.01 | 3.13 | 0.61 | 0.66 |
| Heishui | 1.62 | 1.40 | 0.89 | 3.33 | 0.51 | 0.63 |
| Li county | 1.41 | 1.37 | 0.64 | 2.79 | 0.52 | 0.74 |
| Xiaojin | 0.70 | 0.80 | 0.61 | 0.49 | 0.57 | 1.25 |
| Mao County | 0.76 | 0.29 | 0.64 | 1.09 | 0.72 | 0.67 |
| Wenchuan | 1.33 | 2.22 | 0.95 | 1.99 | 0.55 | 0.75 |
| Average | 1.13 | 1.56 | 0.93 | 1.59 | 0.56 | 0.78 |
| Comparison Items | Ecotourism | Sustainable Livelihoods |
|---|---|---|
| Background | Environmental damage caused by Mass tourism | Poverty of rural residents |
| Concerned benefit | The environment was protected and communities benefit from tourism activities | Maintain/strengthen the benefit of our own assets and capabilities under the precondition of not destroying the resources |
| Core stakeholder | community of tourism destination; tourist | Community residents |
| Main guidance | Government | Government |
| Main participant | Community residents | Community residents |
| Management method | democratic decision-making and decentralized management | Organization, leadership and hierarchy management |
© 2018 by the authors. Licensee MDPI, Basel, Switzerland. This article is an open access article distributed under the terms and conditions of the Creative Commons Attribution (CC BY) license (http://creativecommons.org/licenses/by/4.0/).
Share and Cite
Liu, Y.; Huang, C.; Wang, Q.; Luan, J.; Ding, M. Assessment of Sustainable Livelihood and Geographic Detection of Settlement Sites in Ethnically Contiguous Poverty-Stricken Areas in the Aba Prefecture, China. ISPRS Int. J. Geo-Inf. 2018, 7, 16. https://0-doi-org.brum.beds.ac.uk/10.3390/ijgi7010016
Liu Y, Huang C, Wang Q, Luan J, Ding M. Assessment of Sustainable Livelihood and Geographic Detection of Settlement Sites in Ethnically Contiguous Poverty-Stricken Areas in the Aba Prefecture, China. ISPRS International Journal of Geo-Information. 2018; 7(1):16. https://0-doi-org.brum.beds.ac.uk/10.3390/ijgi7010016
Chicago/Turabian StyleLiu, Yanguo, Chengmin Huang, Qing Wang, Junwei Luan, and Mingtao Ding. 2018. "Assessment of Sustainable Livelihood and Geographic Detection of Settlement Sites in Ethnically Contiguous Poverty-Stricken Areas in the Aba Prefecture, China" ISPRS International Journal of Geo-Information 7, no. 1: 16. https://0-doi-org.brum.beds.ac.uk/10.3390/ijgi7010016