Technical Note

Application of Geospatial Techniques for Groundwater Quality and Availability Assessment: A Case Study in Jaffna Peninsula, Sri Lanka

by
Kuddithamby Gunaalan
1,*,
Manjula Ranagalage
2,3,*,
M. H. J. P. Gunarathna
4,5,*,
M. K. N. Kumari
4,5,
Meththika Vithanage
6,
Tharmalingam Srivaratharasan
7,
Suntharalingam Saravanan
8 and
T.W.S. Warnasuriya
9
1
Department of Fisheries Science, Faculty of Science, University of Jaffna, Jaffna 40000, Sri Lanka
2
Graduate School of Life and Environmental Sciences, University of Tsukuba 1-1-1 Tennodai, Tsukuba 305-8572, Ibaraki, Japan
3
Department of Environmental Management, Faculty of Social Sciences and Humanities, Rajarata University of Sri Lanka, Mihintale 50300, Sri Lanka
4
United Graduate School of Agricultural Sciences, Kagoshima University, 1-21-24 Korimoto, Kagoshima-shi, Kagoshima 890-0065, Japan
5
Department of Agricultural Engineering and Soil Science, Faculty of Agriculture, Rajarata University of Sri Lanka, Anuradhapura 50000, Sri Lanka
6
Faculty of Applied Sciences, University of Sri Jayewardenepura, Nugegoda 10250, Sri Lanka
7
Faculty of Agriculture, University of Jaffna, Jaffna 40000, Sri Lanka
8
National Water Supply and Drainage Board, Regional Office, Jaffna 40000, Sri Lanka
9
Faculty of Fisheries & Ocean Science, Ocean University of Sri Lanka, Mahawela road, Tangalle 82200, Sri Lanka
*
Authors to whom correspondence should be addressed.
ISPRS Int. J. Geo-Inf. 2018, 7(1), 20; https://0-doi-org.brum.beds.ac.uk/10.3390/ijgi7010020
Submission received: 14 December 2017 / Revised: 29 December 2017 / Accepted: 6 January 2018 / Published: 12 January 2018

Abstract

:
Groundwater is one of the most important natural resources in the northern coastal belt of Sri Lanka, as there are no major water supply schemes or perennial rivers. Overexploitation, seawater intrusion and persistent pollution of this vital resource are threatening human health as well as ecosystems in the Jaffna Peninsula. Therefore, the main intent of the present paper is to apply geospatial techniques to assess the spatial variation of groundwater quality and availability for the sustainable management of groundwater in the coastal areas. The electrical conductivity (EC) and depth to water (DTW) of 41 wells were measured during the period from March to June 2014, which represents the dry period of the study area. Surface interpolation, gradient analysis, a local indicators of spatial autocorrelations (LISA) and statistical analysis were used to assess the quality and availability of groundwater. The results revealed that the drinking and irrigation water quality in the study area were poor and further deteriorated with the progression of the dry season. Good quality and availability of groundwater were observed in the western zone compared to other zones of the study area. A negative correlation was identified between depth to water and electrical conductivity in the western zone. Hence, relatively deep wells in the western zone of the study area can be used to utilize the groundwater for drinking, domestic and agricultural purposes. The outcomes of this study can be used to formulate policy decisions for sustainable management of groundwater resources in Jaffna Peninsula.

Graphical Abstract

1. Introduction

Groundwater plays a significant role in regions with high populations, irrigated agriculture, and insufficient surface water resources [1]. Accordingly, there are many consequences of groundwater over-development, predominantly reduction of the water table, overexploitation and quality deterioration in aquifers. This situation has been emerging as a critical issue in many countries in recent decades. In coastal regions, in particular, saline water intrusion into coastal aquifers has become a severe consequence due to unplanned groundwater exploitation [2]. Hence, it is essential to assess the variation of groundwater quality and availability to find out contamination risk zones in aquifers at a regional scale for sustainable management of groundwater resources [3].
Geographical information system (GIS) applications are important in mapping, monitoring, and modeling of groundwater resources, as data monitoring is conducted at a limited number of sites due to the high cost of installation and maintenance in terms of both money and time [4,5,6,7,8]. Although interpolation methods are widely used in GIS applications [9,10,11], stand-alone application of interpolation may not be enough to understand the spatial distribution of water quality and availability, especially for advanced uses such as for policy decisions and management plans. Gradient analysis is one of the most commonly used methods for assessing the spatial and temporal variation of environmental variables with the distance [12,13,14]. However, only a few attempts have been made to study the groundwater conditions using gradient analysis. The local indicators of spatial autocorrelations (LISA) method is used in the natural sciences to find out statistically qualifying spatial patterns [15,16]. The local Moran’s I statistic is used to identify the level of spatial autocorrelation based on a given geographical variable with respect to its neighbors [15,16], and it has been successfully implemented in many previous research projects related to environmental variables [16,17,18,19,20]. Further, LISA clusters support the identification of hotspots and cold spots [15].
Since, there are no major water supply schemes or perennial rivers in the Jaffna Peninsula in northern Sri Lanka, groundwater use has grown progressively, and acts as the only source of water. Subsequently, over-extraction of groundwater and deterioration in water quality have been observed, basically due to excess application of fertilizer, intensive agriculture, high water usage for domestic purposes due to increased population associated with resettlement and development projects in post-war period, lack of awareness of the community, and improper maintenance and operation of existing barrages [21,22]. A recent study of 44 wells clearly revealed that wells on the northwestern side of the peninsula were more saline than elsewhere on the island [22]. Monitoring studies have confirmed a significant imbalance between the draw-off and recharge rates [23], which is a significant problem in the shallow karstic aquifer on the Jaffna Peninsula. Hence, management of groundwater on a regional scale requires great care in order to ensure the sustainable use of groundwater resources, especially in the coastal belt. This study aimed to assess the spatial variation of groundwater quality and availability based on selected standards, and to conduct further analysis using geospatial techniques to obtain the necessary information required for sustainable groundwater management of Jaffna Peninsula. Furthermore, this study investigates the possibility of using GIS applications for proper management of groundwater resources in coastal zones.

2. Materials and Methods
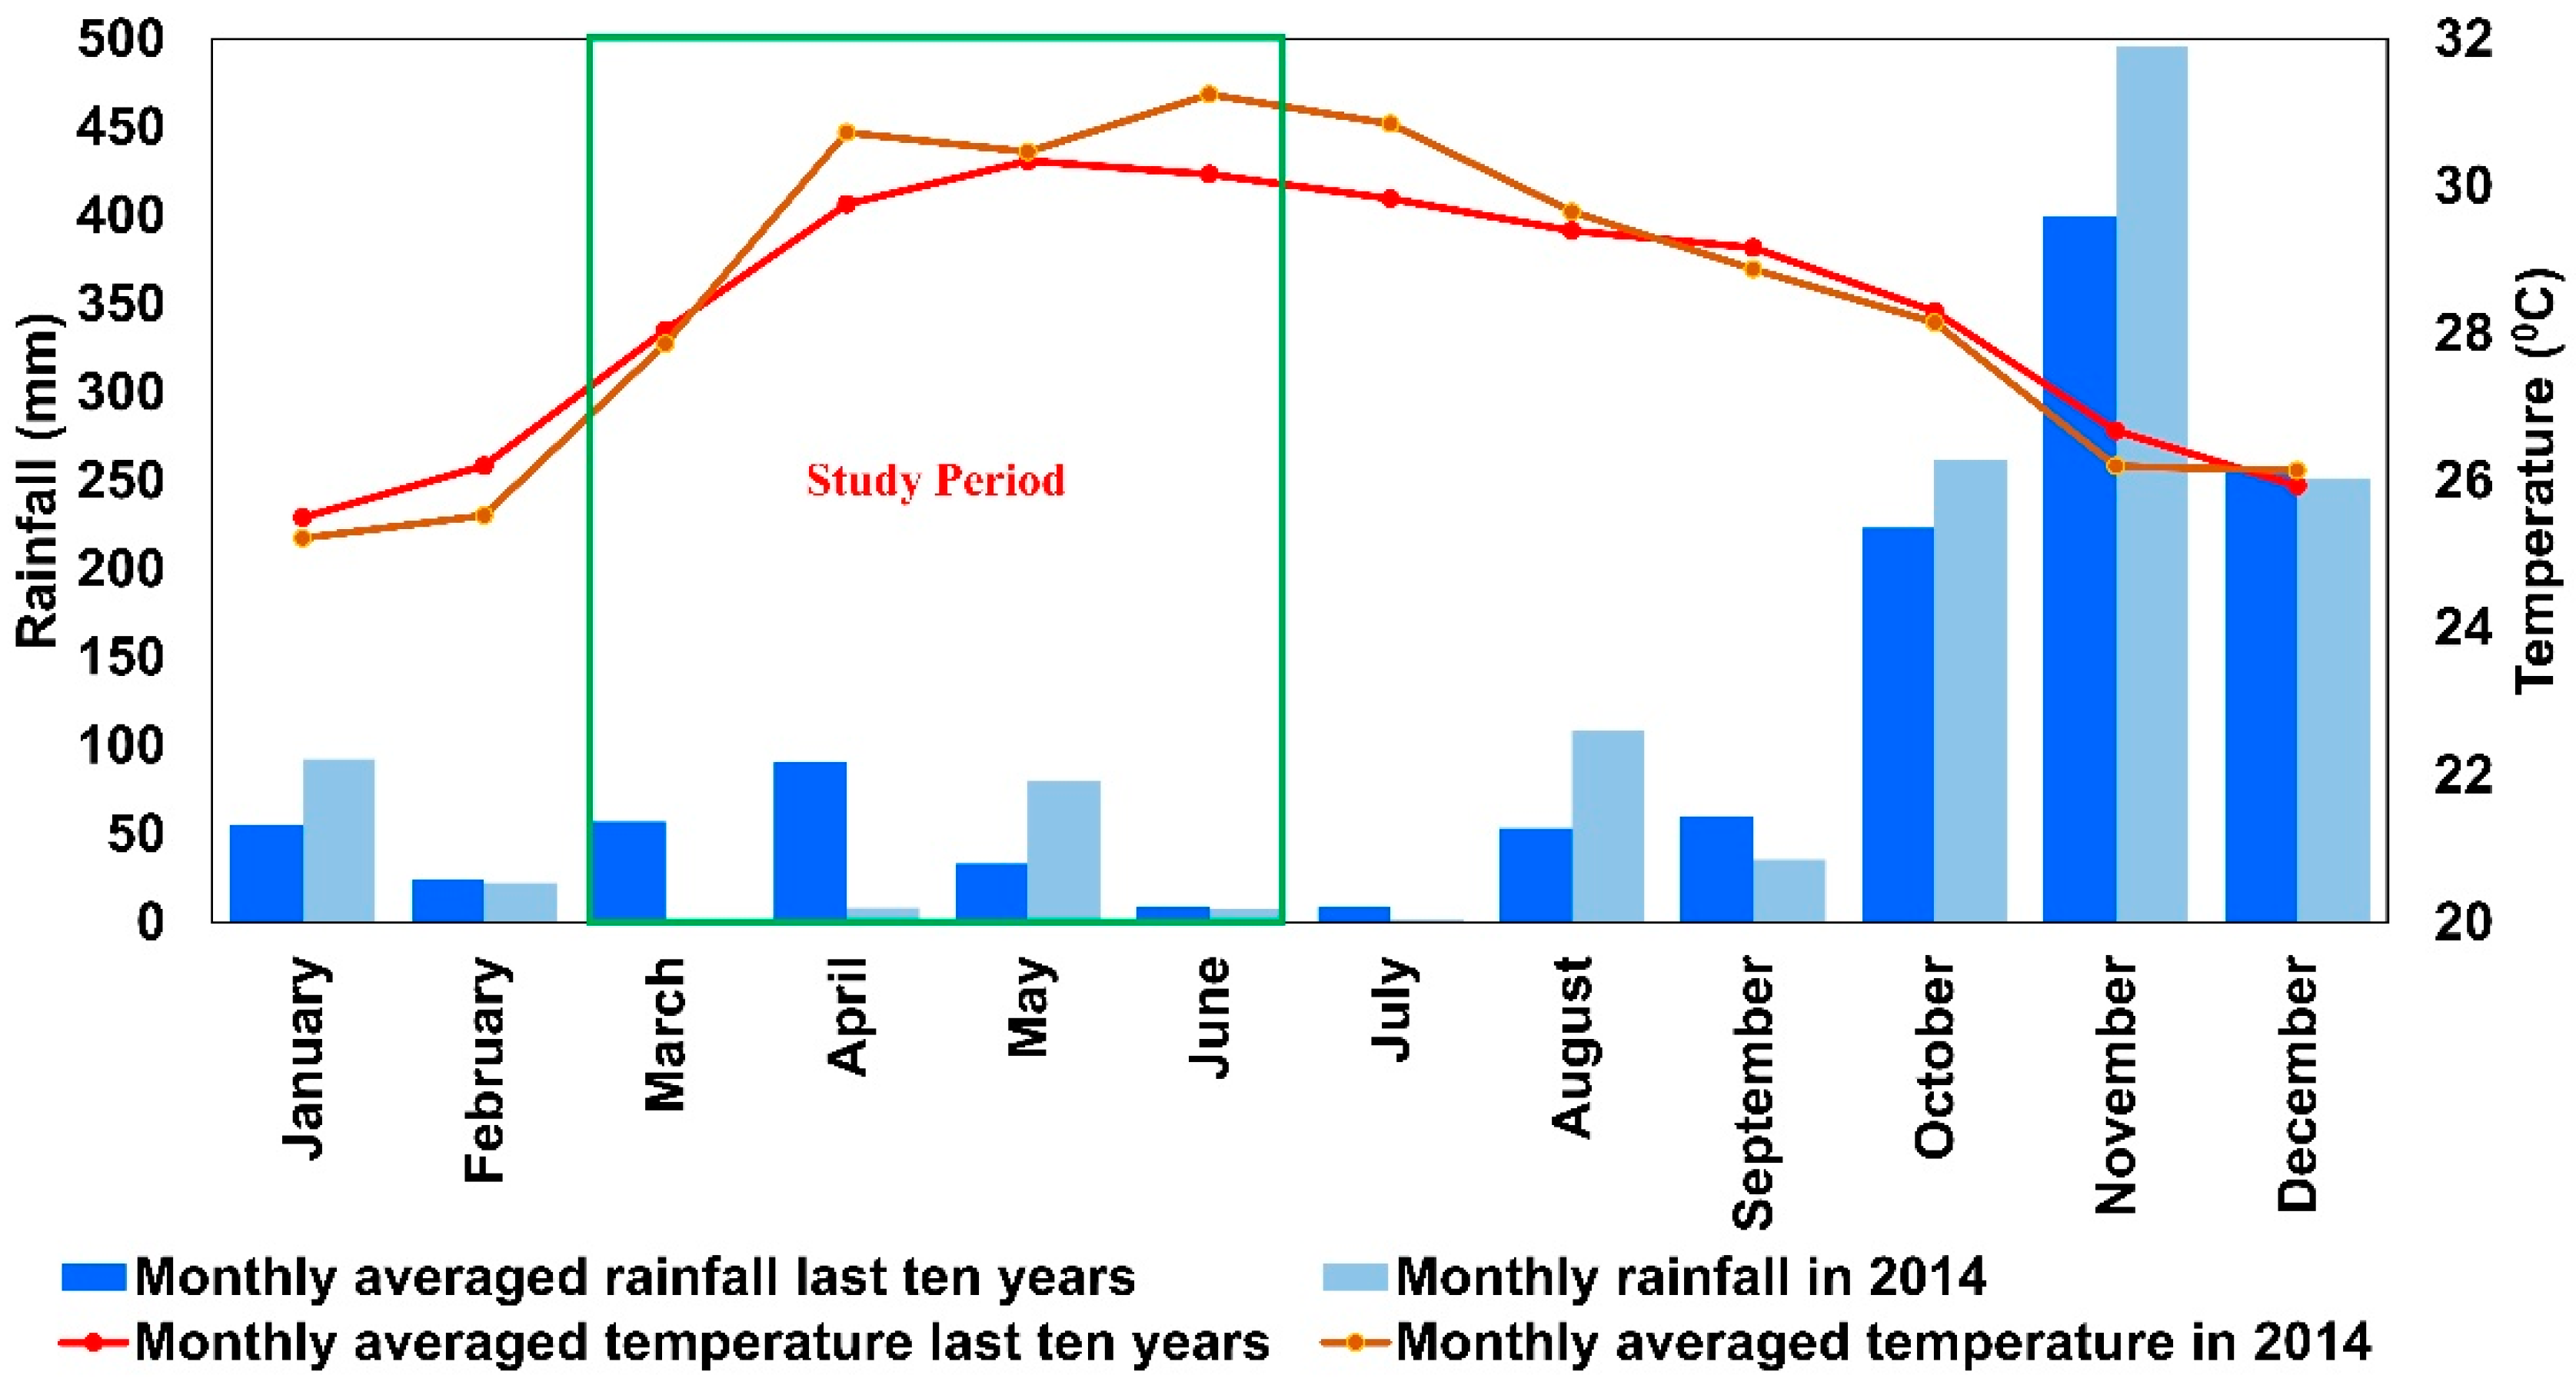
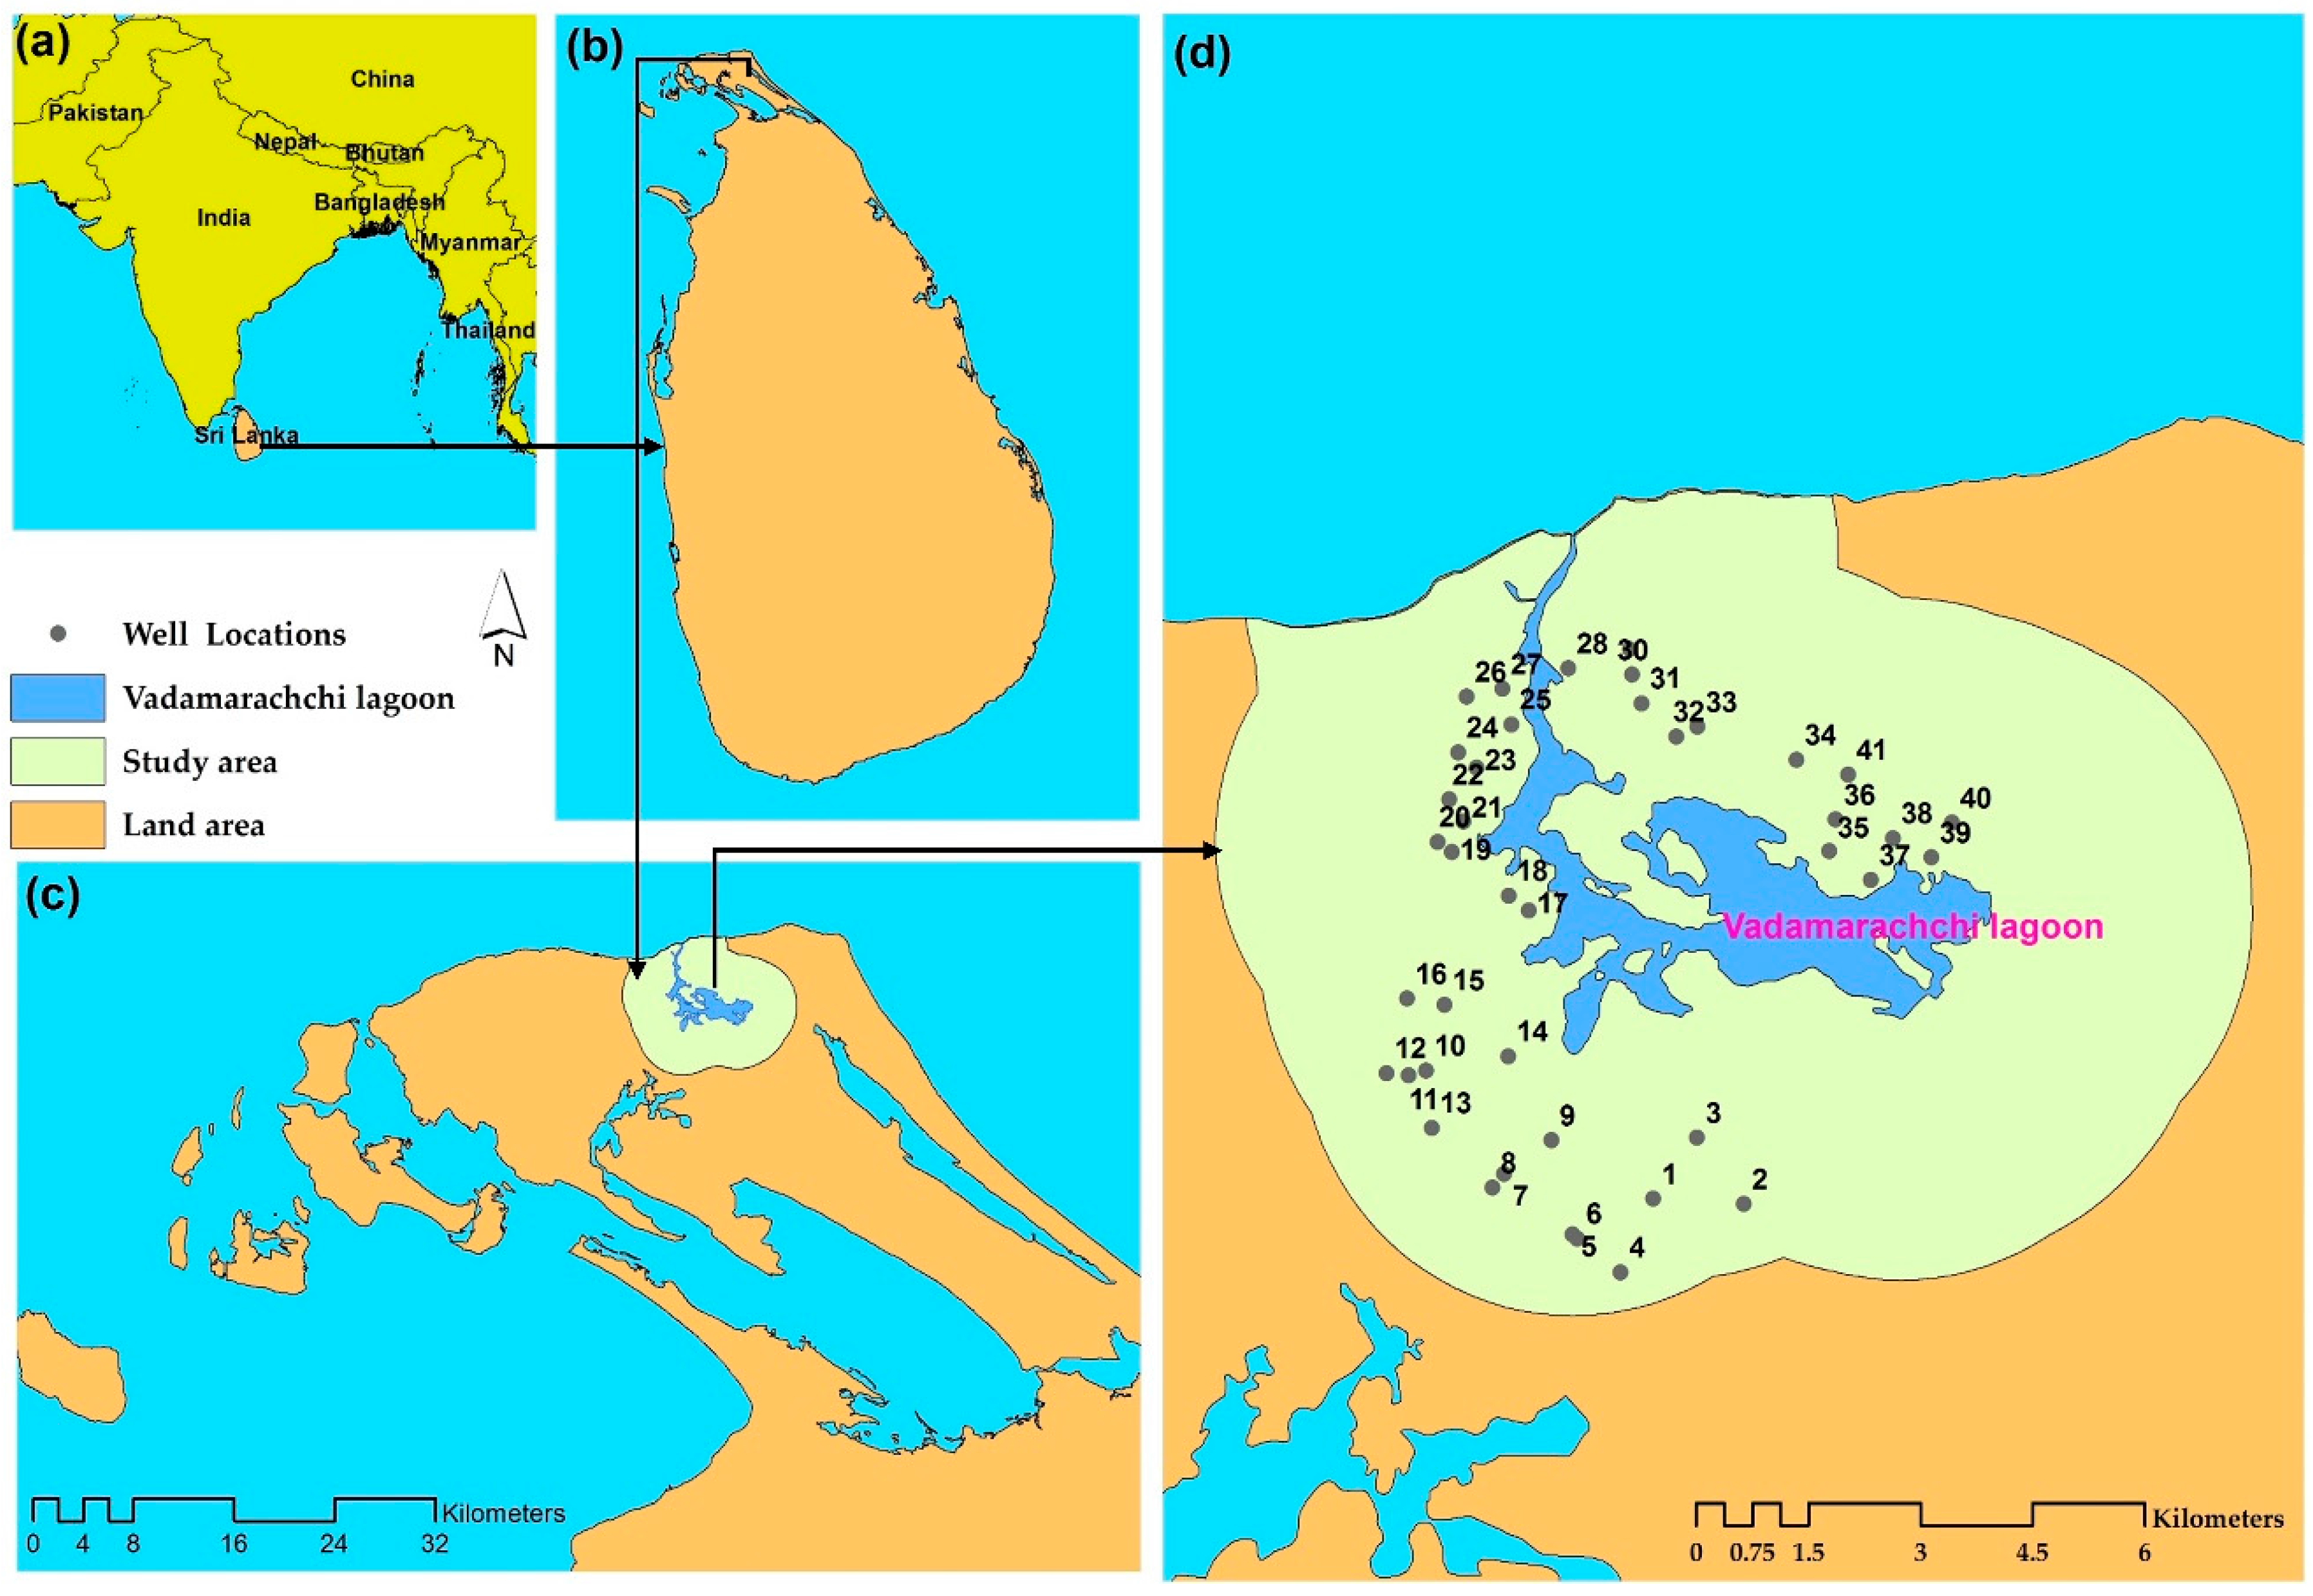
2.1. Study Area

The Jaffna Peninsula is situated between a longitude of 79°54′–80°2′ E and a latitude of 9°30′–9°50′ N. It is geographically bounded to the north and east by the Indian Ocean, and to the west by the Palk Strait, with the southern areas extending into the mainland of the country, covering about 1000 km2 of land with 160 km of coastline and no location being more than 10 km away from the coast [22].
Jaffna has the typical dry zone climate of Sri Lanka (hot and humid), characterized by an average rainfall of 1290 mm. The bulk of the rainfall is received during four rainy months from October to January, with little or no rainfall afterward [24]. Mean monthly rainfall and average temperature over the last ten years, as well as monthly rainfall and average monthly temperature in the year 2014, are presented in Figure 1.

Hydrogeological Setting of the Study Area

The entire Jaffna Peninsula consists of Miocene limestone formations. The shallow aquifer systems of the Peninsula combine with sandy and shallow karstic unconfined aquifers [25]. The study area consists of sandy aquifer with a limestone bed, i.e., bedded sandstone and limestone with a shale sequence. The soil media of the study area is clay loam with very low absorption and purification capacity. Therefore, groundwater can be easily polluted by point and non-point source pollutants, and can quickly spread very far due to the high permeability of the limestone aquifer. In addition, as a coastal aquifer, it has hydraulic continuity with marine water; therefore, excessive abstraction with a consequent lowering of the water table may induce seawater intrusion [26]. As a shallow unconfined aquifer, the quality and availability of the water are highly dependent on the infiltration of rainfall occurring during the monsoon periods, and on surface water resources, essentially in lagoons [25,26]. The aquifers in the Peninsula are recharged by two saltwater lagoons, called Vadamarachchi and Upparu, with an area of 87.1 km2 and 34.7 km2, respectively. Since Vadamarachchi lagoon plays a key role in the recharging of groundwater, the surrounding area within 3.5 km buffer zone from the Vadamarachchi lagoon was selected as the study location as one of the most vulnerable areas for groundwater contamination due to saltwater intrusion.

2.2. Collection of Water Samples for Quality and Quantity Assessment

Forty-one (41) sampling points (ordinary dug wells located in the shallow unconfined aquifer) were randomly selected along the study area (Figure 2) to assess the quality and availability of the groundwater in the Jaffna Peninsula. Of the selected wells, 36 wells were in operational condition, while five of them were abandoned. Among the wells in operational condition, 19 wells were used for agricultural purposes, while the remaining wells were used for domestic purposes. Water samples were collected once a month from March to June 2014, representing the dry season in the area. All sampling was done in morning sessions (before starting the pumping) at three different depths at the surface, middle and bottom of each well using a locally developed water sampler. The water sampler consists of a piston that can be controlled with a rope to collect water samples at the desired depths. Electrical conductivity (EC) was measured in situ using a CE470 (HACH) conductivity meter. Further, water availability measurements, such as total depth of the well and water levels during the sampling (depth to water, hereafter abbreviated as DTW), were also recorded using the depth meter. A global positioning system (GPS) device was used to record the geographical coordinates (WGS 1984) of the sampling points.

2.3. Water Quality and Availability Assessment

Even though the EC of the each well was assessed at the top, middle and bottom, no significant difference was observed between the three levels. Hence, average EC values were used for the GIS analyses. A number of previous studies have reported relatively accurate aerial distributions using the IDW method [10,11,27]. Therefore, the inverse distance weighted (IDW) method available in ArcGIS was used to create an aerial distribution of EC and DTW during the dry season. Interpolated surfaces of EC were used to demarcate the areas related to different water quality classes based on both Sri Lankan water quality standards [28] and Food and Agriculture Organization of the United Nations (FAO) irrigation water quality standards [29].
Since the information that can be acquired from interpolation analysis is limited, further analyses based on gradient analysis, cluster analysis and statistical analysis were performed.

2.4. Gradient Analysis

Gradient analysis was used to study the spatial pattern of EC and DTW variation in the study area. Multiple ring buffers around the lagoon were created at distances of 100 m, and subsequently, the mean EC and DTW values were extracted in each buffer zone and plotted across the gradient.
In gradient analysis, usually, multiple ring buffers are created along the distance from the center (point, line or shape) irrespective of the heterogeneity of the areas. Because of this, sometimes the conventional approach may not be able to provide useful information, especially when the boundary conditions are heterogeneous. Boundary condition-oriented subdivision of the study area prior to conducting the gradient analysis can give more reliable information for advanced uses, compared to the conventional approach.
Based on the adjacent land uses near the boundaries, we found that the north, east, south and west sides had nearby land uses that were distinct to each side. The north boundary of the study area is towards the sea, while both east and south boundaries are towards other lagoons. The west side boundary is towards the land. Since conventional gradient analysis had not provided any meaningful information, the study area was divided into four zones based on the adjacent land uses near the boundary, denoted as northern, eastern, southern and western zones. Thereafter, gradient analysis based on these subdivisions was carried out to study the spatial variation of EC and DTW. Subsequently, the mean EC and DTW values for each buffer zone of all four zones were extracted.

2.5. Local Indicators of Spatial Autocorrelations (LISA)

As a dimension of spatial relationships, the LISA allows the detection of clusters of geographic parameters under the assumption that a spatial pattern is a non-random distribution [15,17,30]. This study adopted a local Moran’s I to determine the location clusters of EC and DTW in the study area. 200 m × 200 m blocks were used to extract the mean EC and DTW values for March, April, May, and June. The mean values extracted using zonal statistics tool of ArcGIS were used to create LISA clusters and EC, and DTW clusters were obtained using ArcGIS software. Five types of clusters could be identified: (i) high value surrounded by high value (H-H) (hot clusters), (ii) low value surrounded by low value (L-L) (cold clusters), (iii) high value surrounded by low value (H-L), (iv) low value surrounded by high value (L-H), and (v) non-significance [16,17].
Local Moran’s I index, the most used index for checking the spatial autocorrelation of the variables [15,31], was calculated as follows.
I i = x i X ¯ S i 2 j = 1 , j i n w i , j ( x j X ¯ )
where x i is an atribute for the feature i, X ¯ is the mean of the correspoding attribute, w i j is the spatial weight between feature I and j, and
S i 2 = i = 1 , j i n ( x j X ¯ ) 2 n 1
With n equating to the number of feature. The Z I i score for the statistics are computed as:
Z I t = I t E [ I i ] V [ I i ]
E [ I i ] = i = 1 , j i n w i j n 1
V [ I i ] = E [ I i 2 ] E [ I i 2 ] 2
The Moran’s I values vary between −1.0 to +1.0, with values close to +1 indicating a highly positive spatial autocorrelation, and values close to −1 indicating a highly negative spatial autocorrelation. Values near to 0 indicate no spatial autocorrelation [15,16].

2.6. Statistical Analysis

Mean values of EC and DTW extracted from subdivisions based on gradient analysis were used in this analysis. Scatter plots were created, and the Pearson’s correlations of coefficients were obtained, in order to understand the relationship between the parameters. In addition to this, the p-value was calculated in order to check the statistical significance of correlations.

3. Results

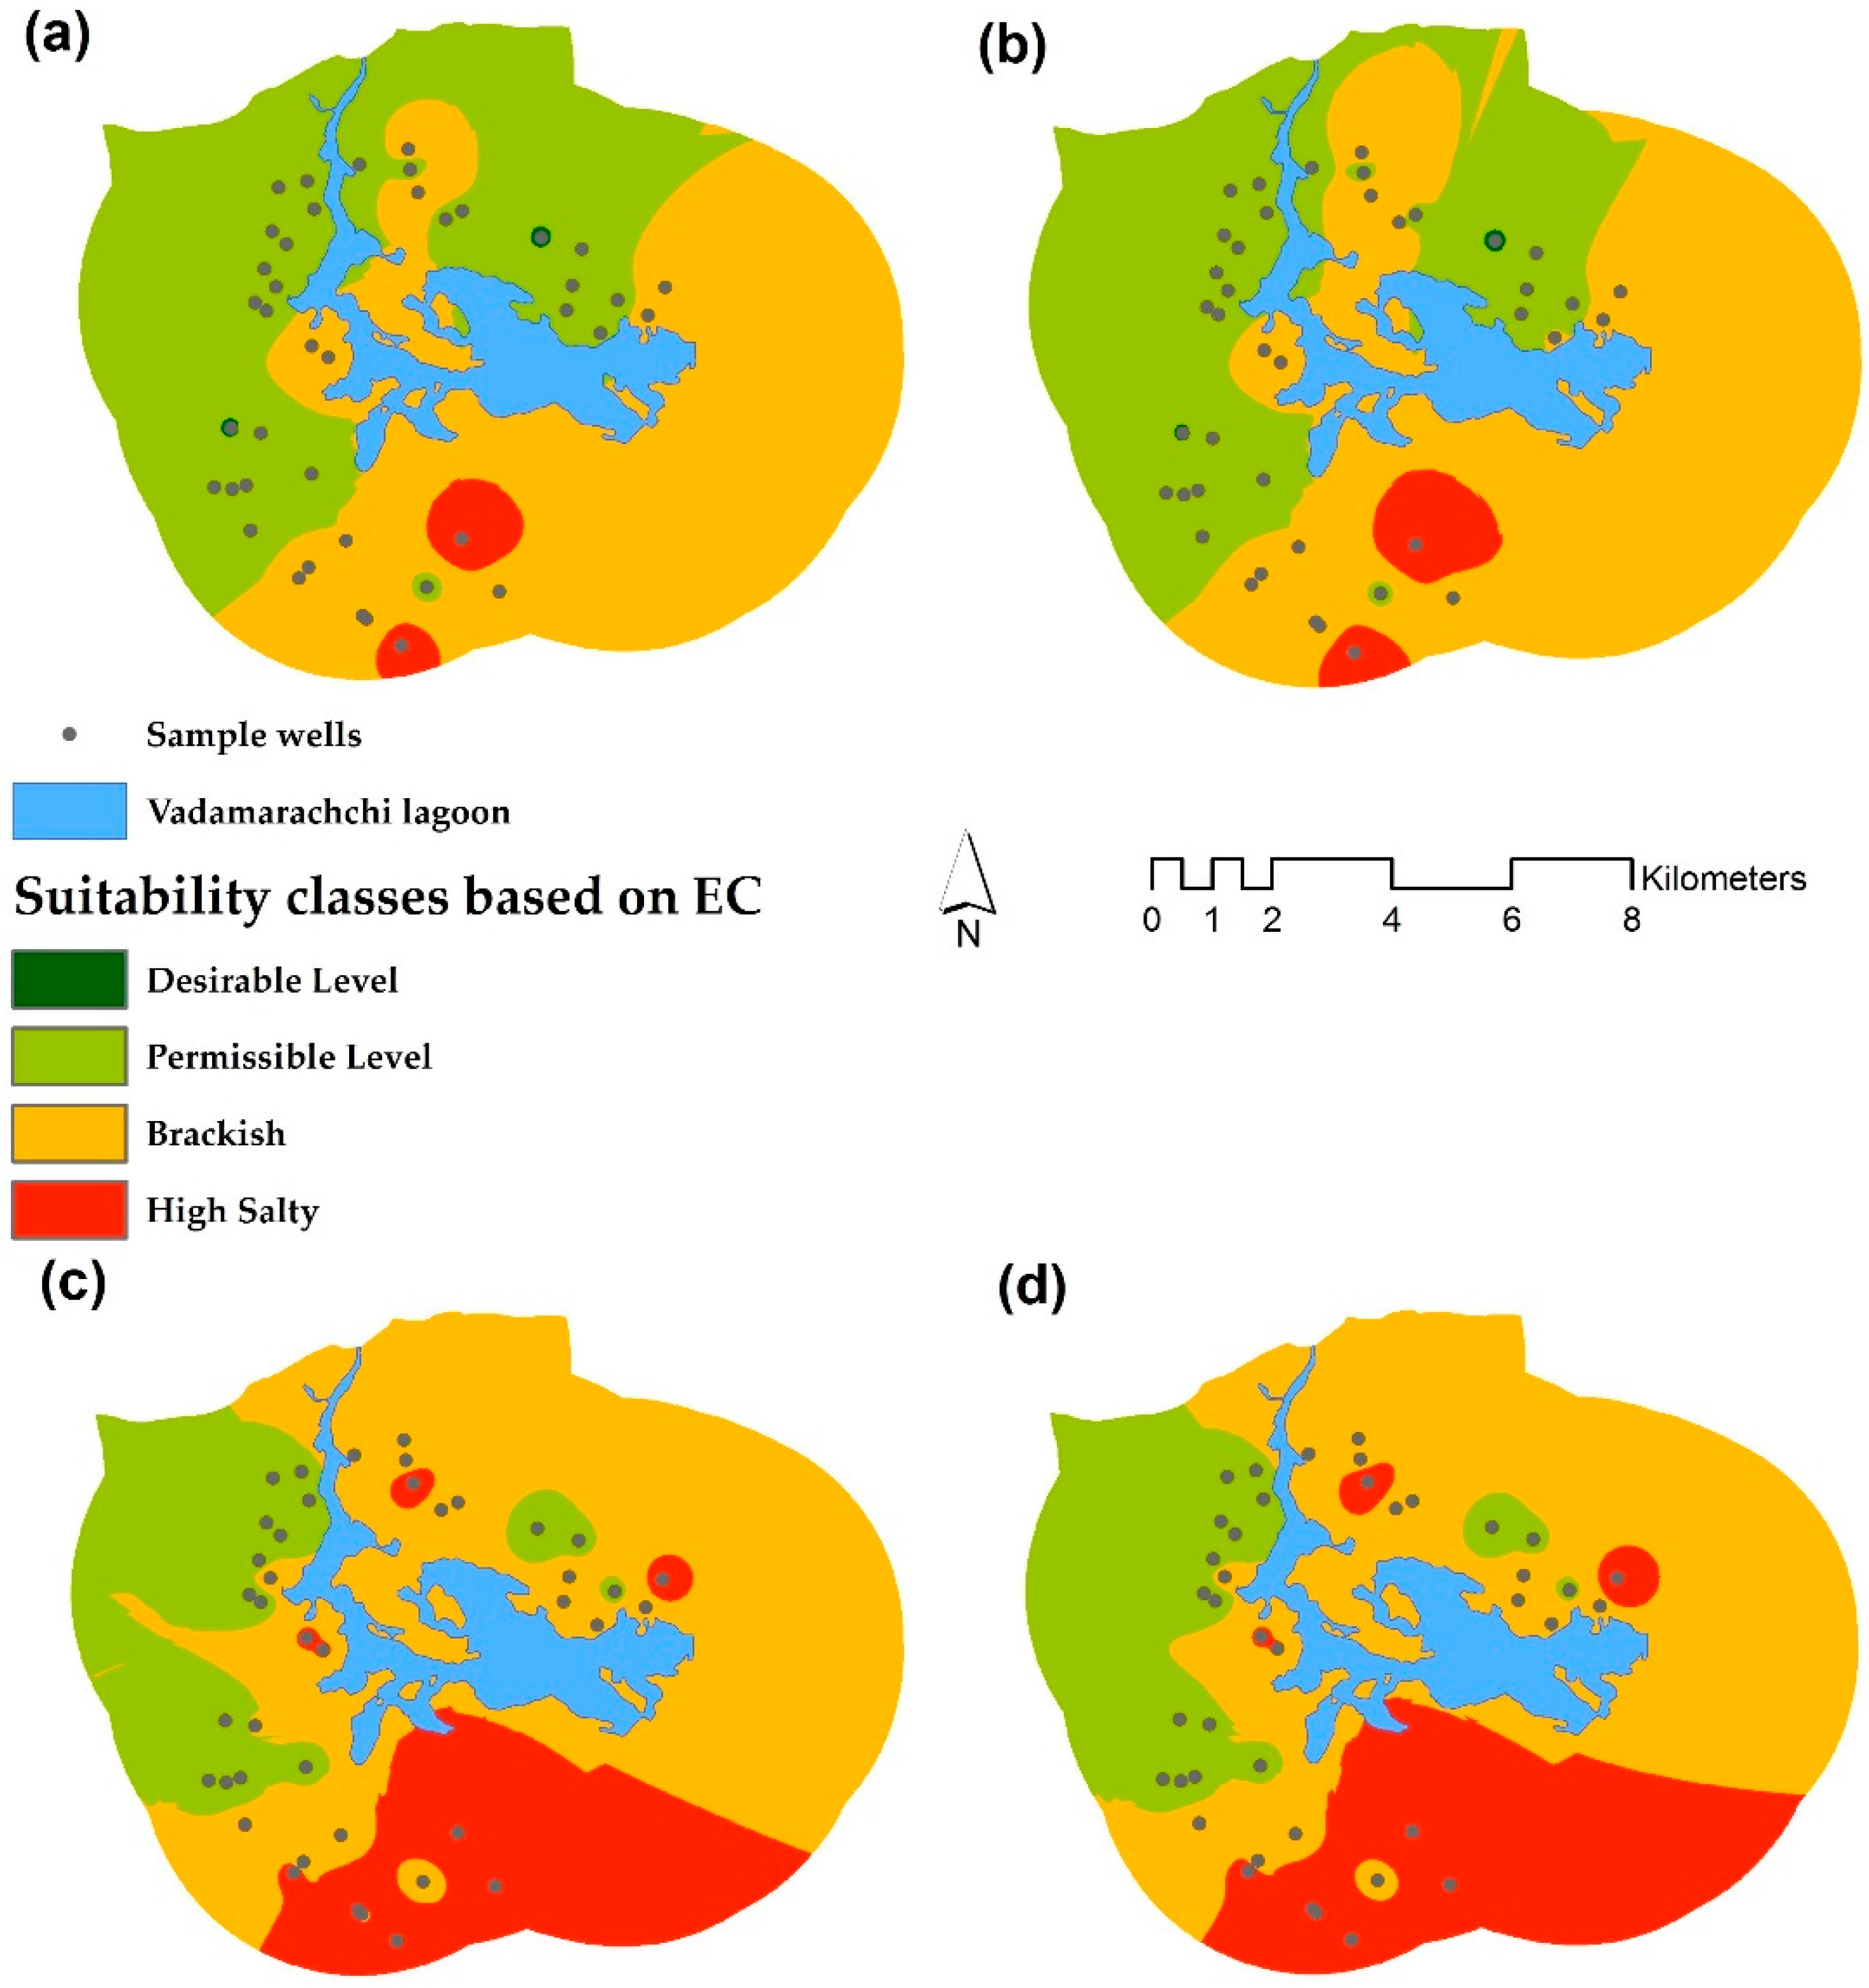
3.1. Water Quality for Drinking

Table 1 shows the suitability of drinking water quality based on EC, classified according to the guidelines in the Sri Lankan Standards (SLS) [28], along with probable areas with different water types in the study area. Figure 3 indicates the spatial distribution of drinking water quality during the study period. According to the SLS, there was no access to water of desirable quality for drinking during the dry season. At the beginning of the dry season, 45% of the land area showed the permissible level of drinking water quality. However, this decreased by up to 19% at the end of the dry season. The brackish area and the highly salty areas were increased from 53% and 2% to 58% and 23%, respectively, with the progression of the dry season. As shown in Figure 3, an increasing trend of the highly salty areas in the southern part of the study area was observed during the dry period.

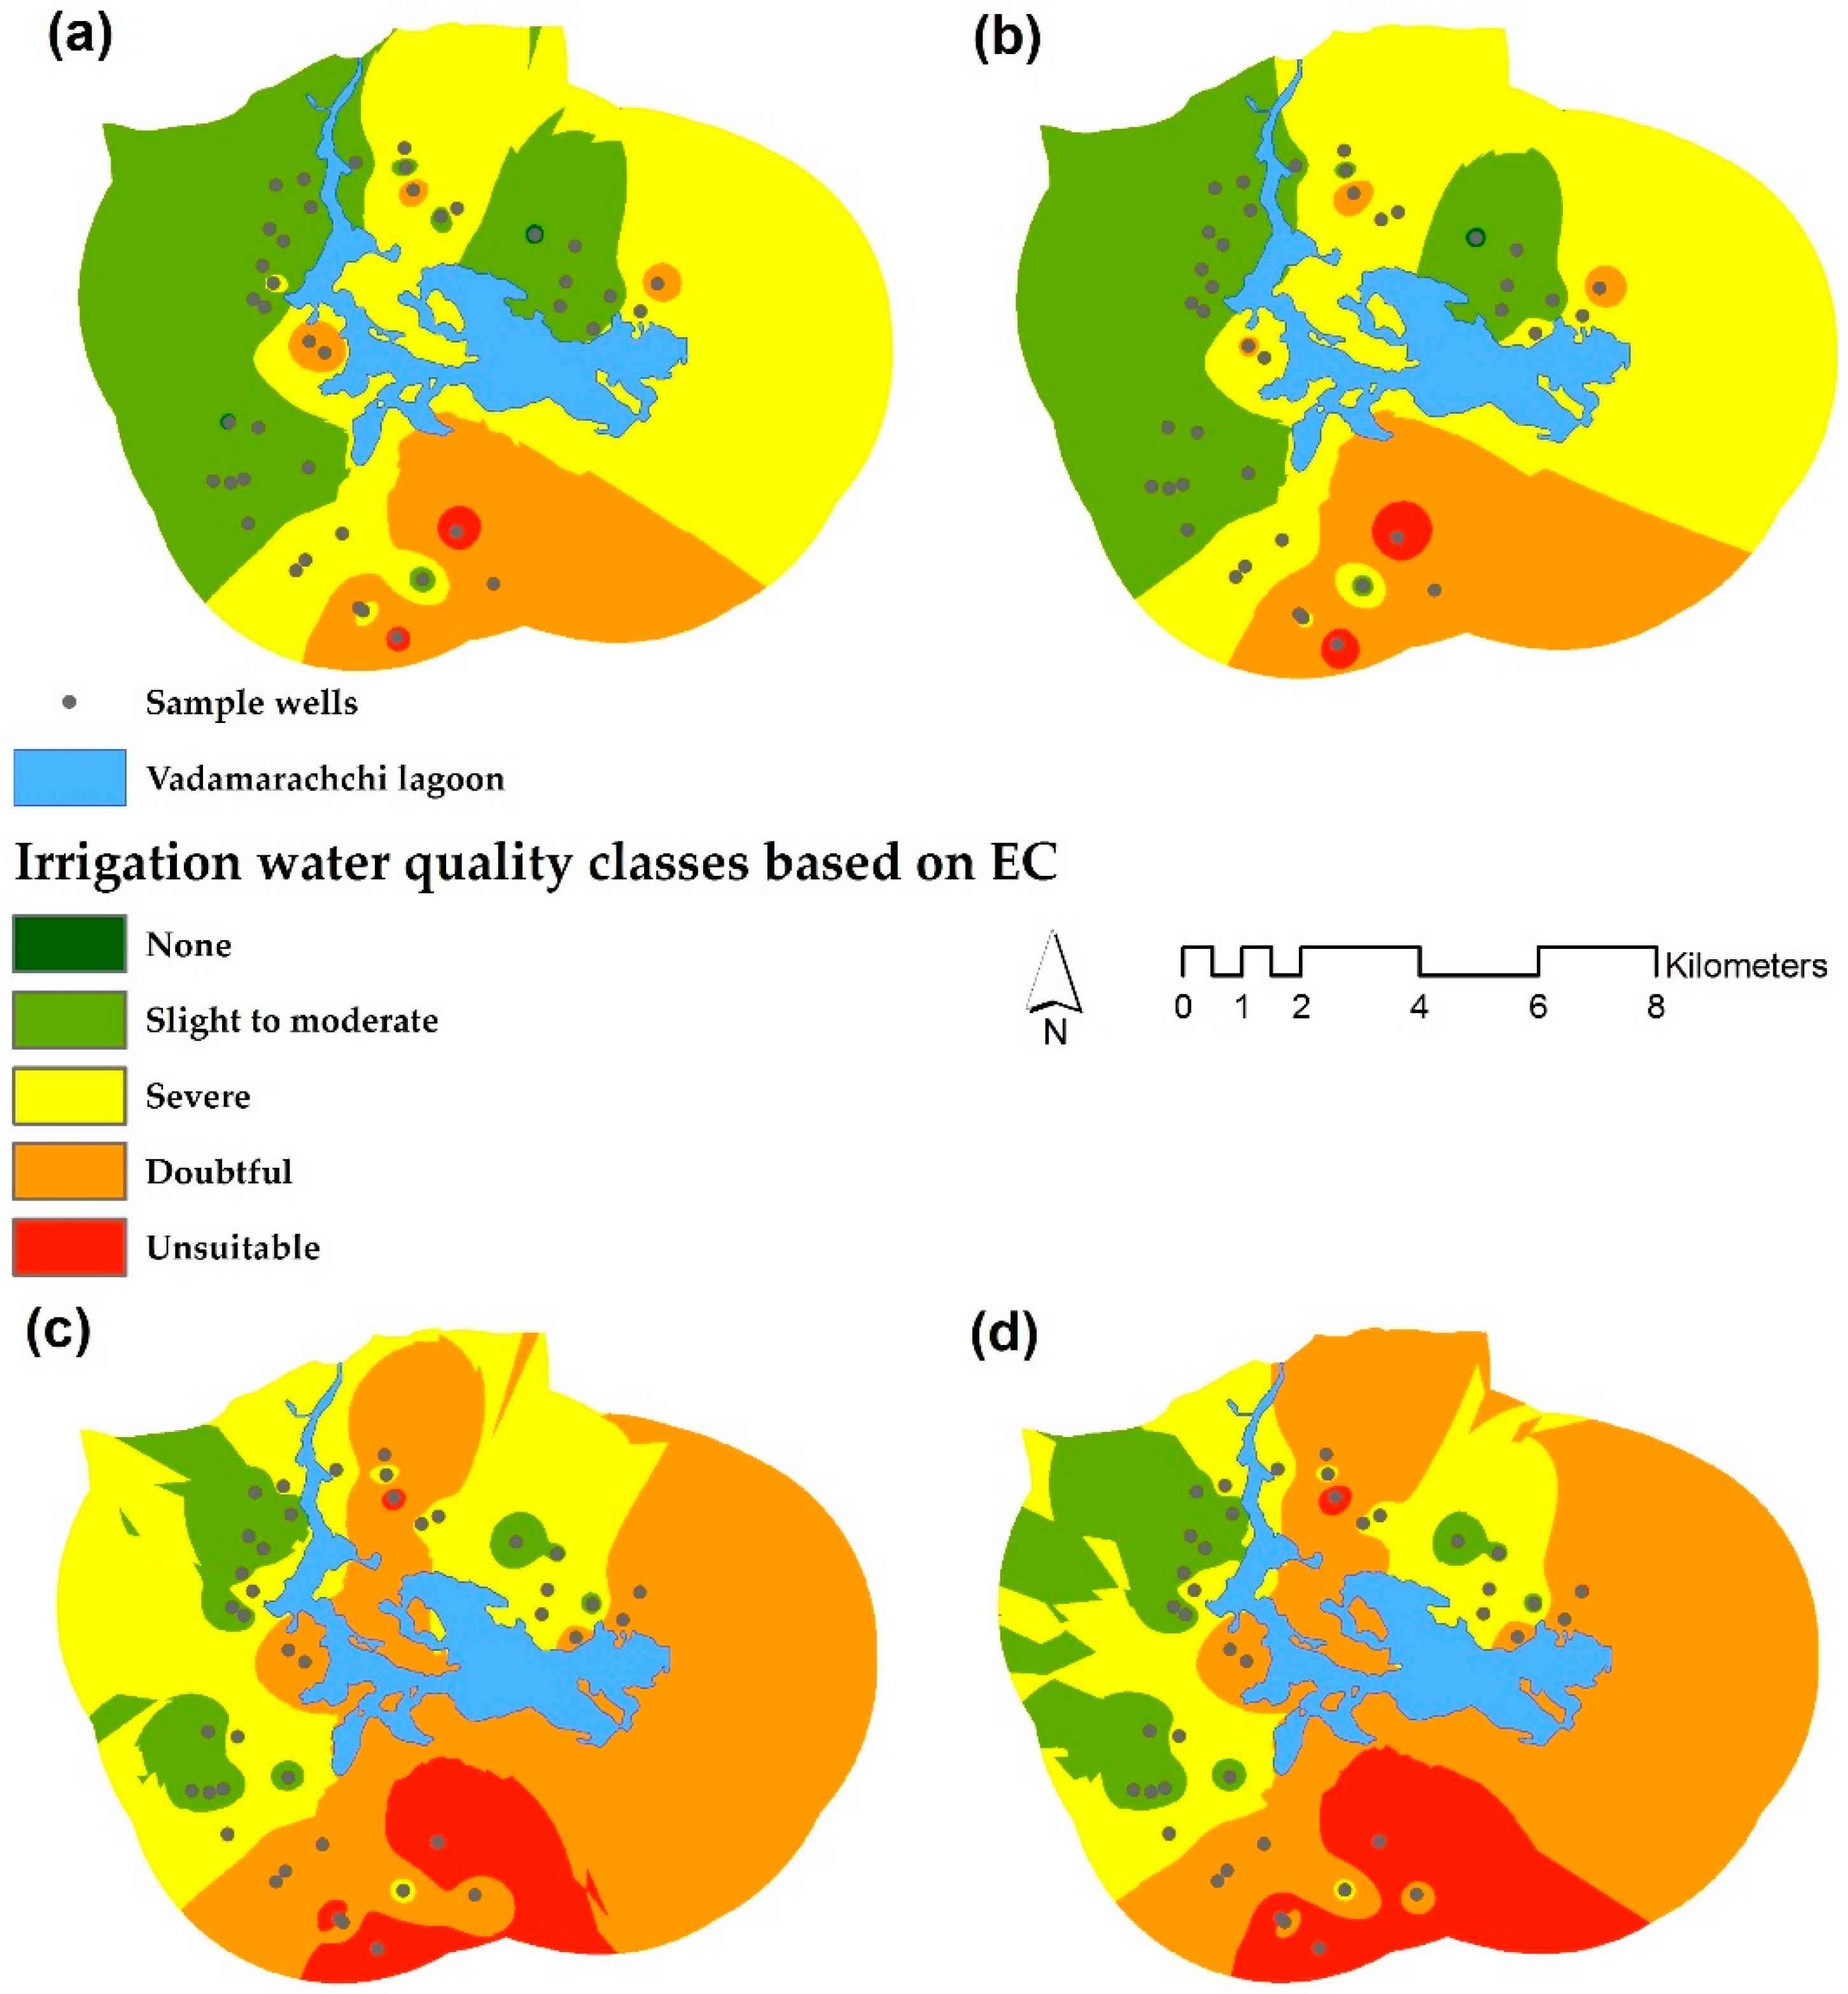
3.2. Water Quality for Irrigation

Irrigation water quality influences not only crop yield, but also the soil health. Table 2 shows the guidelines published by FAO [29], and it is possible to allot probable areas to different water types during the dry season. Figure 4 shows the spatial distribution of irrigation water quality based on FAO standards. At the beginning of the dry season, 33% of the area was categorized as having water with slight to moderate salinity, and this was reduced to 11% during the latter part of the dry season. Furthermore, at the beginning of the dry season, 51, 16 and 1% of areas were classified as being severely saline, or doubtful or unsuitable for irrigation, respectively. During the latter part, the situation was further aggravated, as salinity levels increased, and 54 and 12% of the groundwater was categorized as doubtful and unsuitable for irrigation, respectively.

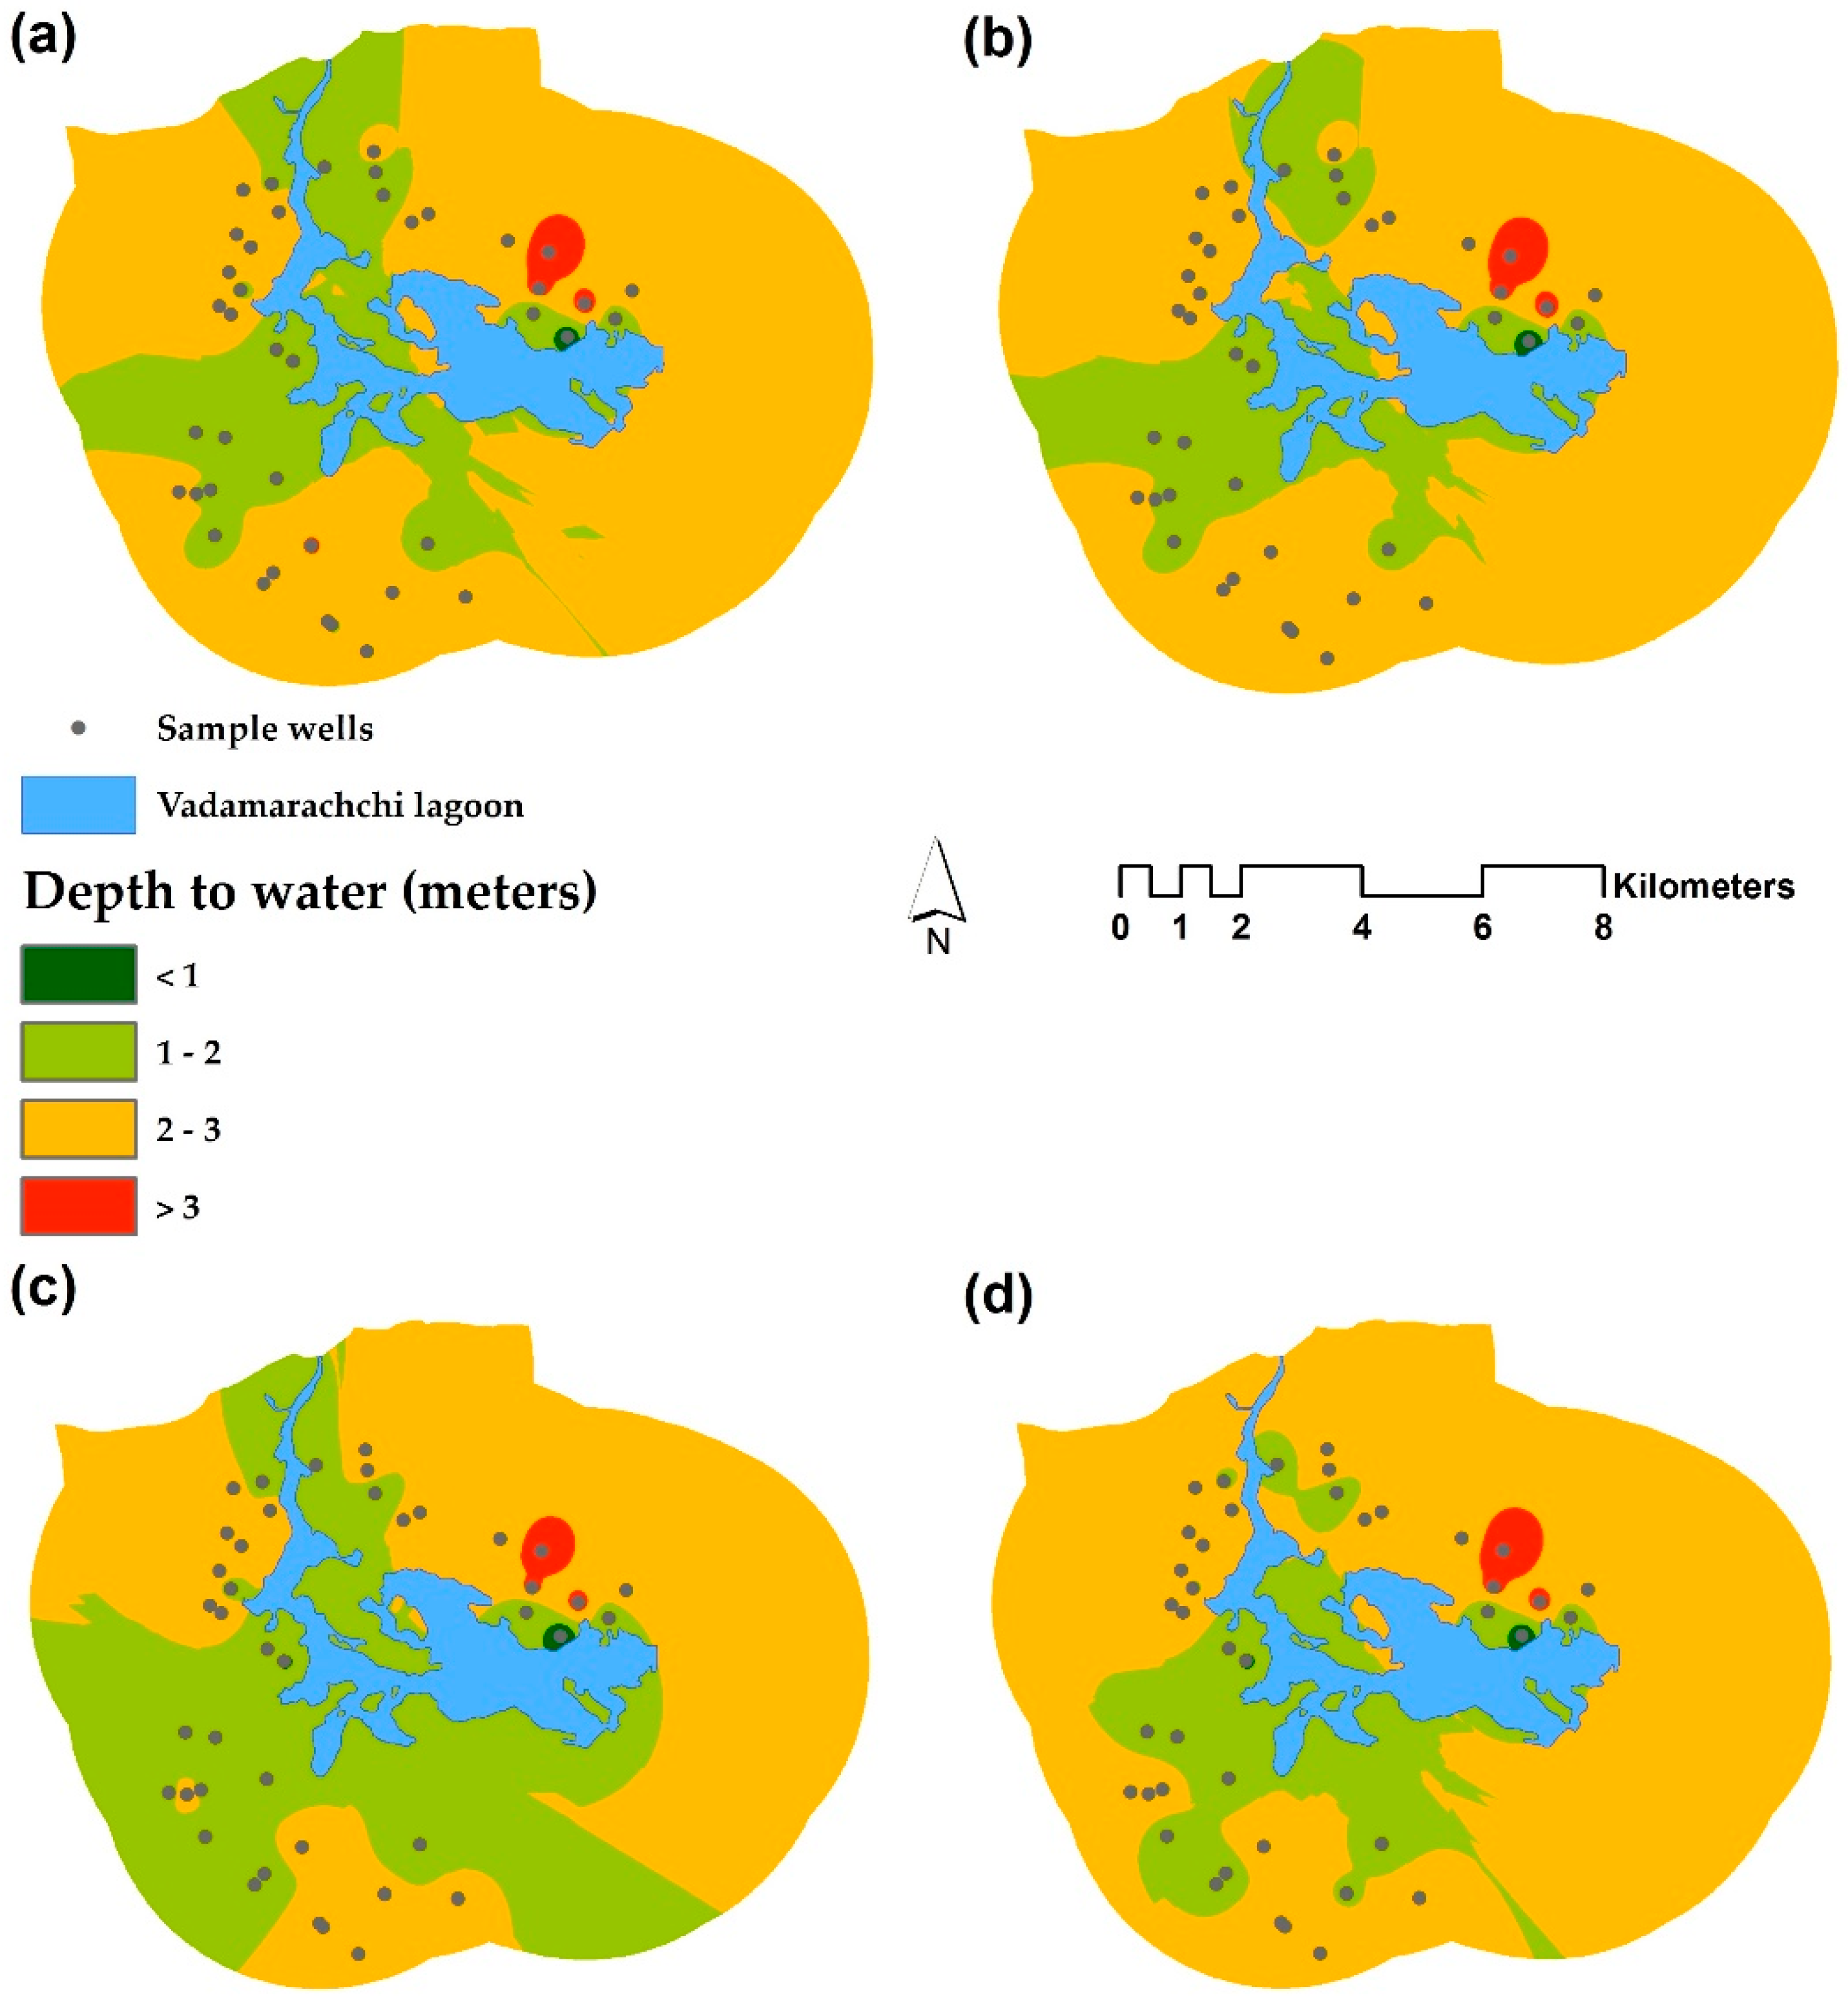
3.3. Groundwater Availability

As shown in Figure 5, shallow groundwater levels were observed in proximity to the lagoon. With the small amount of rainfall received during May, groundwater levels rose, especially in the south and southwestern parts of the study area. The southern part of the study area, sandwiched between two lagoons and undulating topography with some sinks, may encourage recharging of groundwater to lift the groundwater level up to some extent compared to the other areas. Variation of DTW during the study period was negligible in northern, eastern and western zones of the study area, as no significant rainfall events were recorded during the study period.

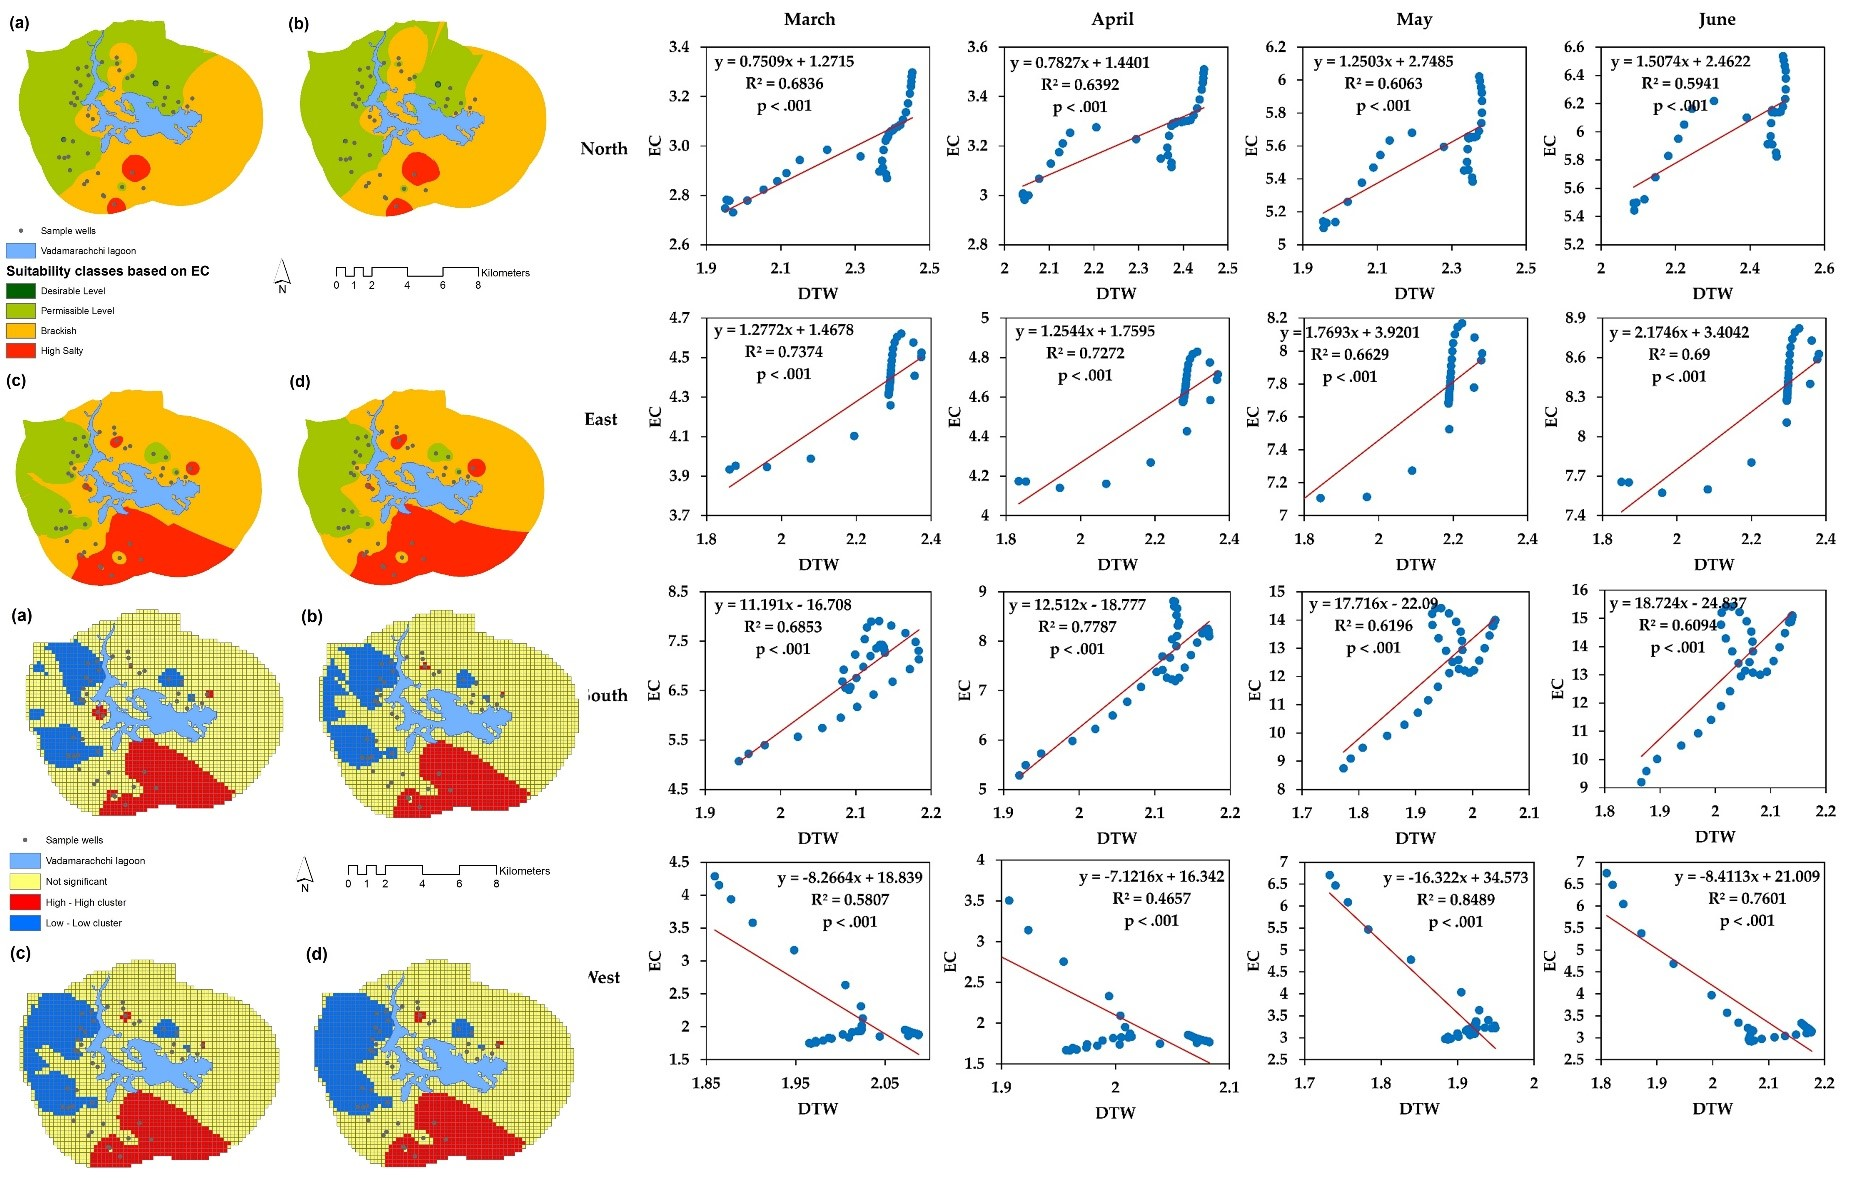
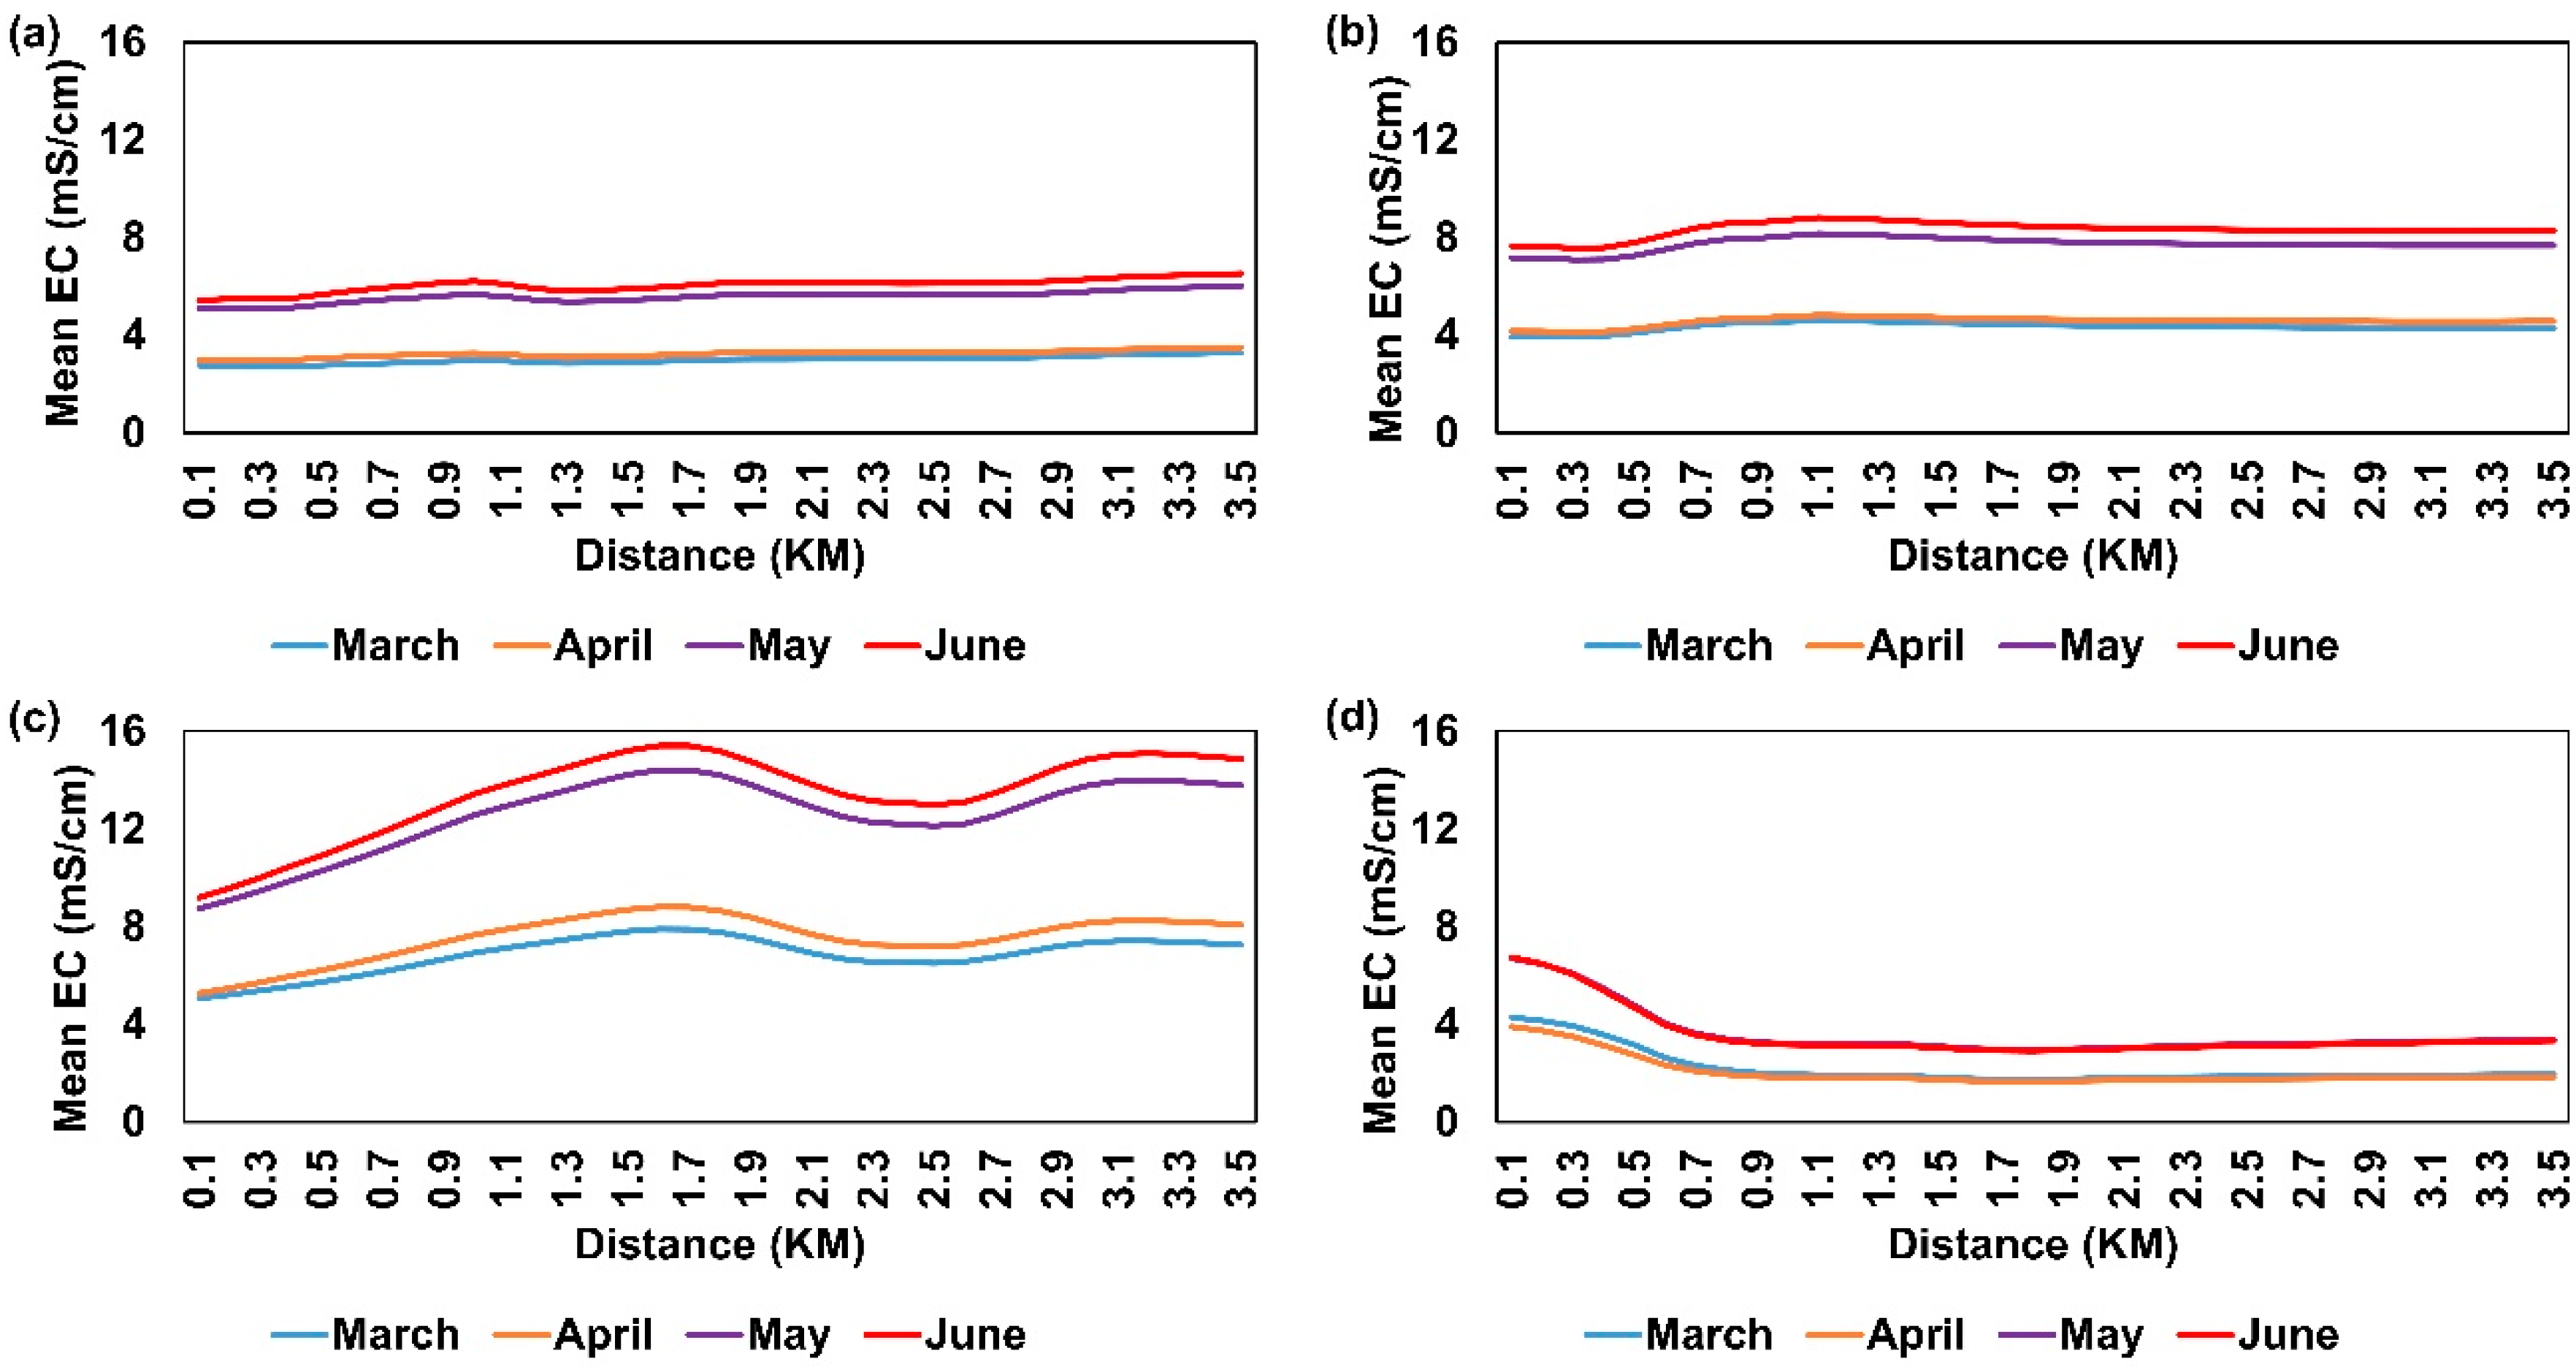
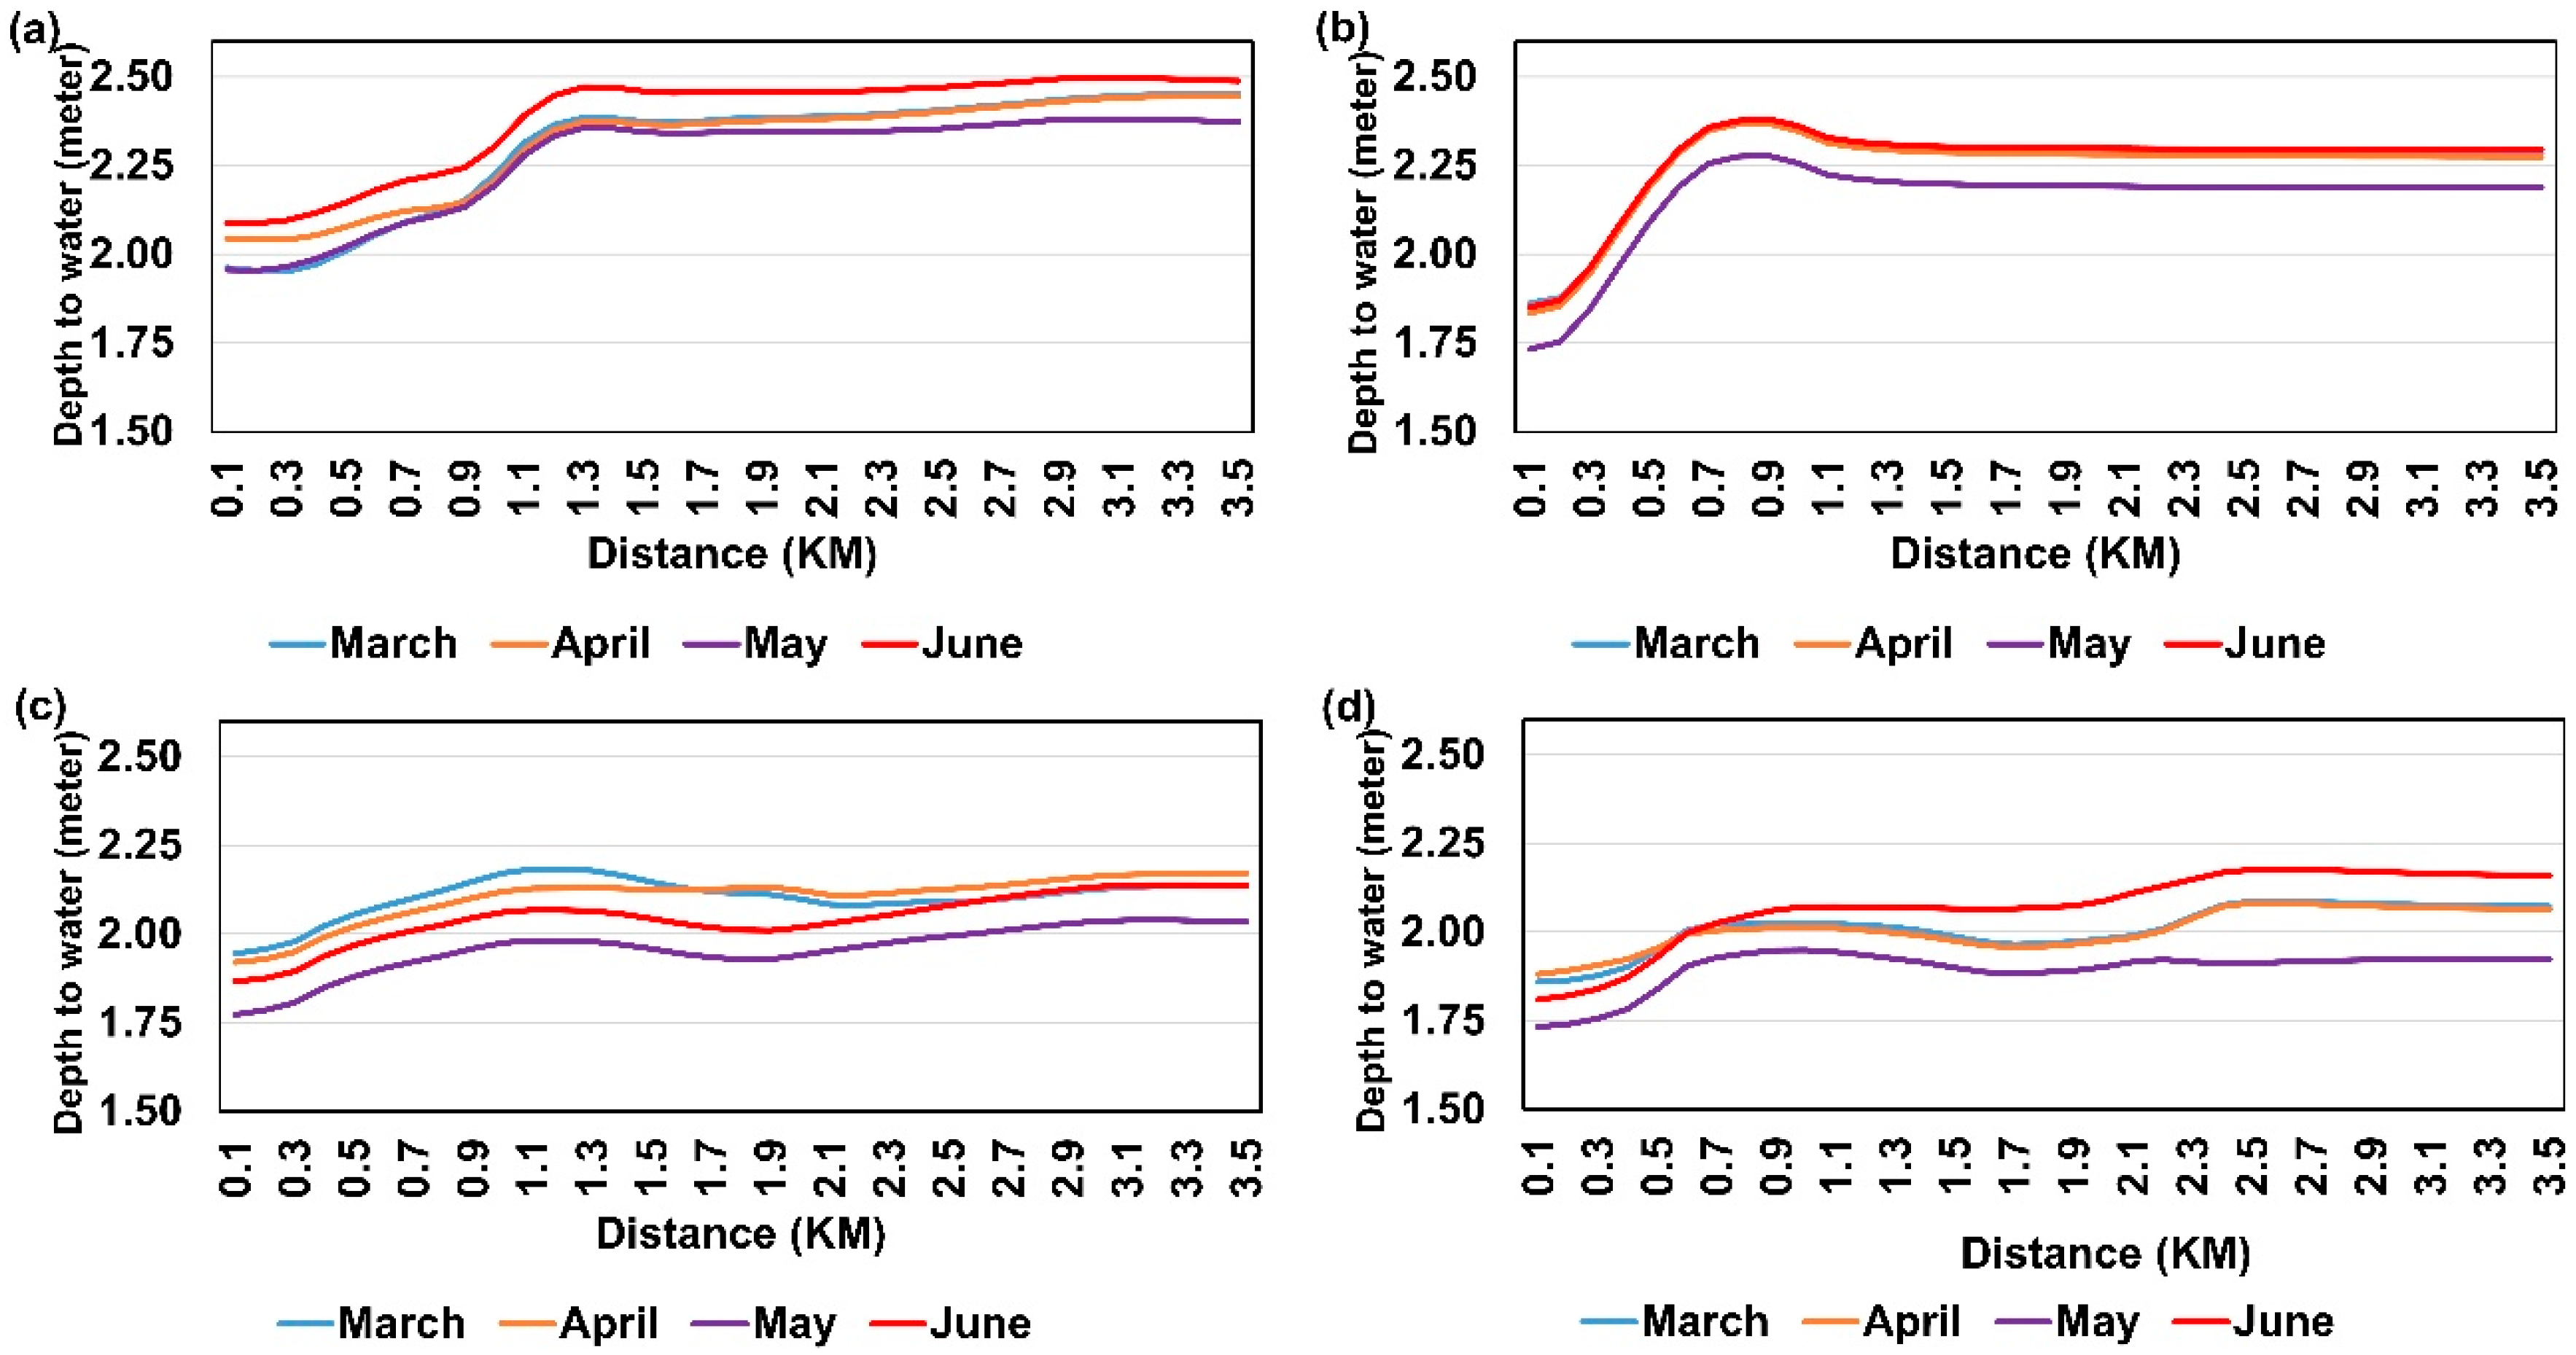
3.4. Gradient Analysis
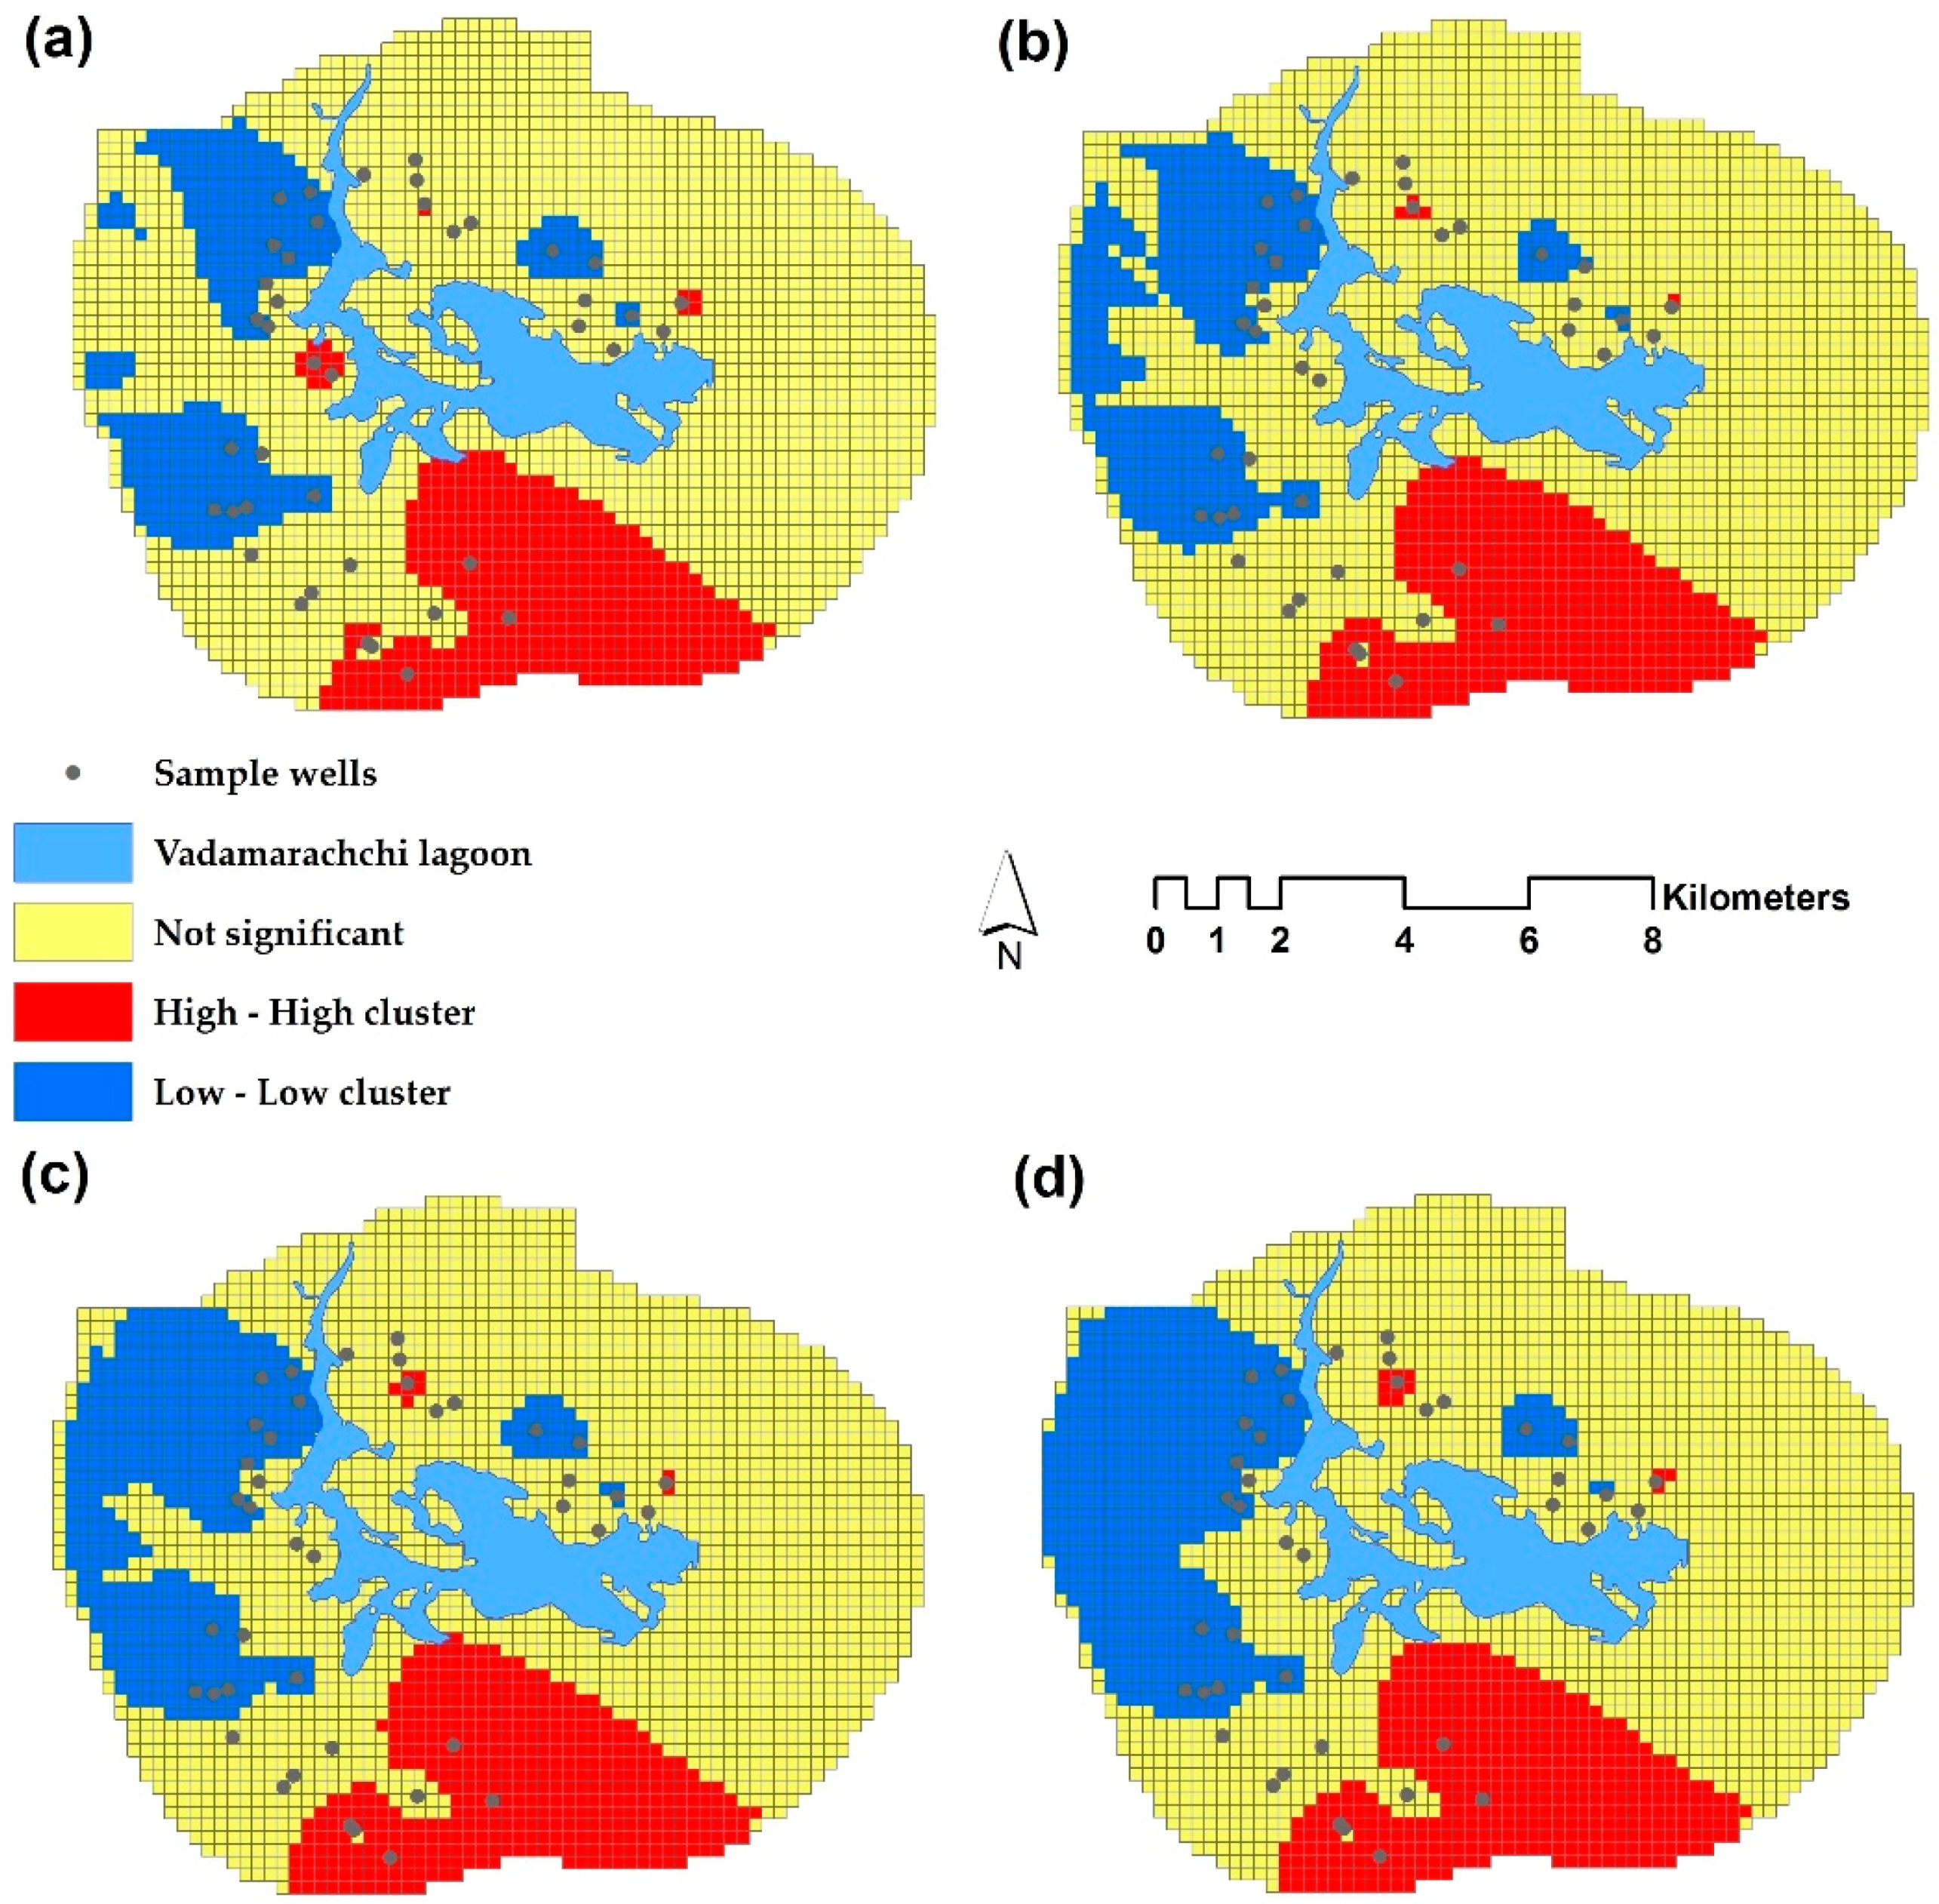
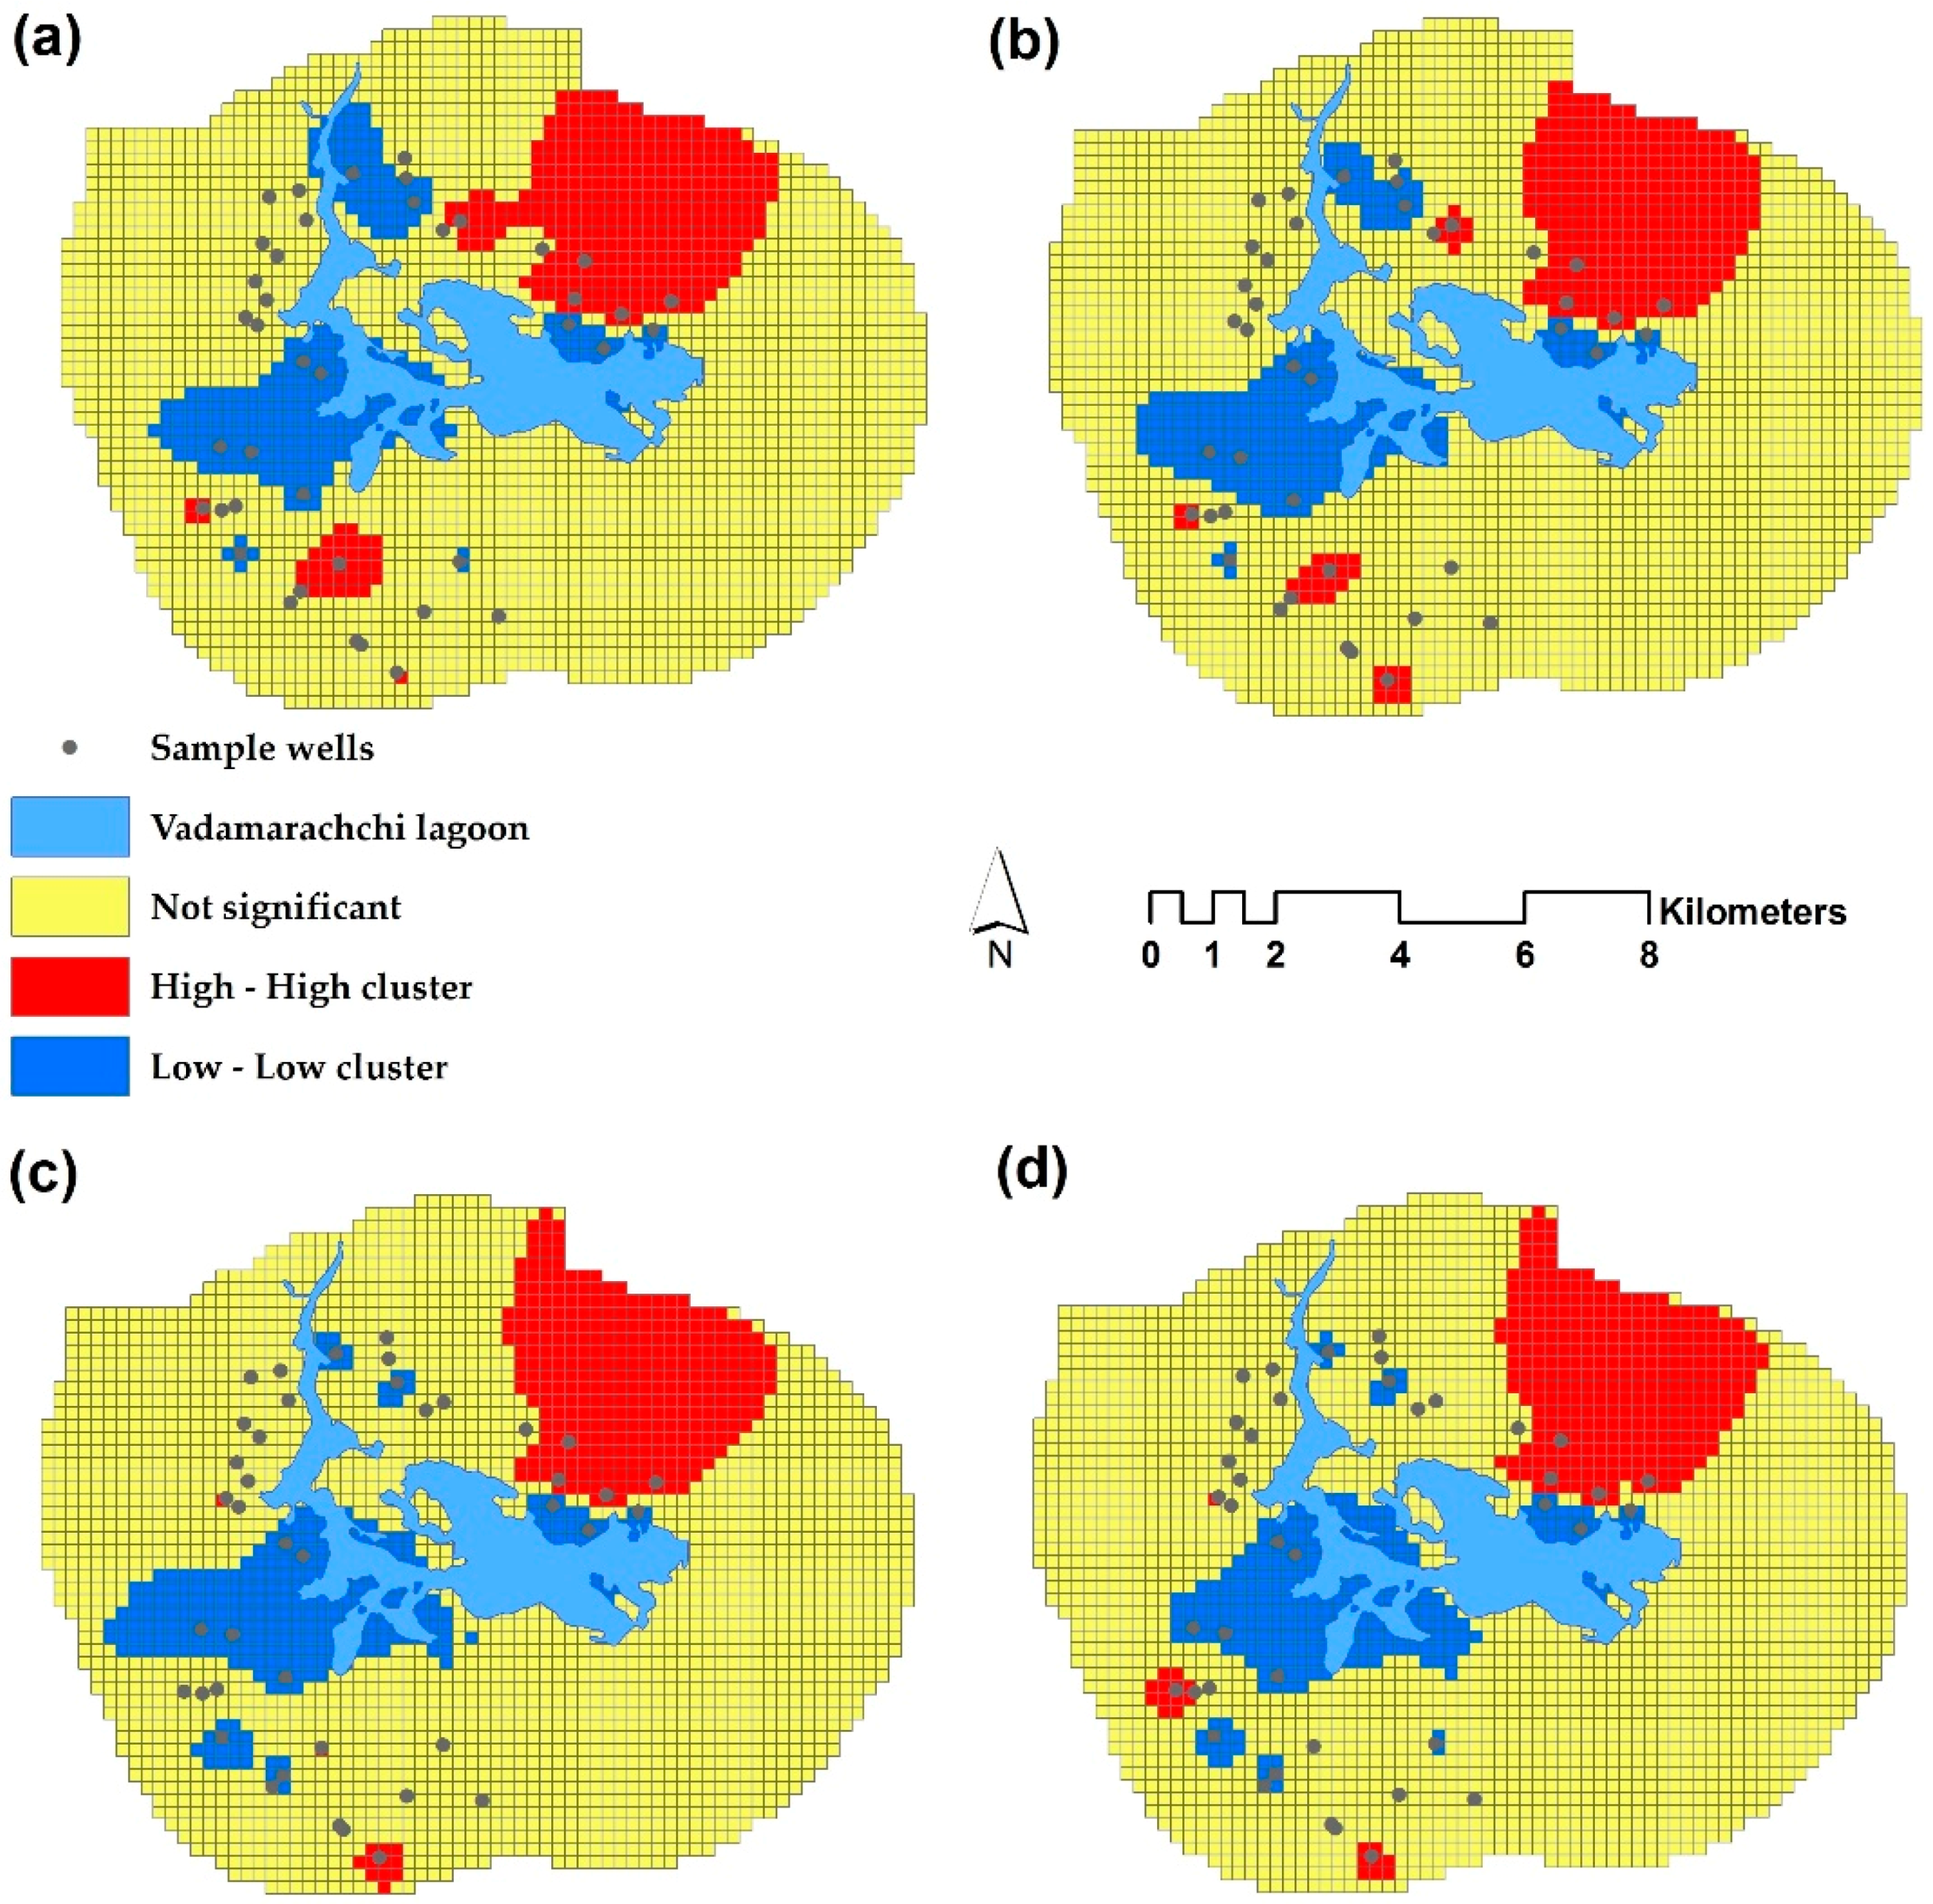
In all four zones, the salinity level increased during the latter part of the dry season compared to the beginning of the dry season due to the high evaporation rate observed, along with the high environmental temperature and wind speed during the southwest monsoon [24]. However, the lowest and highest salinity levels were observed in the western and southern zones, respectively. The western zone towards the land with a large spatial distribution of karstic aquifer [22] ensures low variation of salinity compared to the other zones. However, a change of 0.2 mS/cm was identified between the early and latter part of the dry season in the western zone. The results revealed that nearby areas of the lagoon had lower EC values in the northern, eastern, and southern zones of the study area (Figure 6). However, the western zone had higher EC values near the lagoon area, decreasing towards the boundary of the study area. In the southern zone, the mean EC value increased to 1.6 km from the lagoon, and then decreased again to 2.7 km, but it had a significant increasing trend again from 2.7 km. The main reason behind this growing tendency may be the impact of the nearby Upparu lagoon in the southern zone, which is highly contaminated by seawater [32].
As shown in Figure 7, the lowest DTW values were recorded near the lagoon in all zones, and gradually increased towards the boundary. Minor changes in mean DTW were observed in the southern and western zones. The highest mean DTW values were recorded in June, other tha in the southern zone.

3.5. LISA

The LISA maps were used to investigate the variation of spatial patterns of EC and DTW during the dry period. As shown in Figure 8, hot clusters (HH) were mainly positioned in the southern zone, and a similar pattern could be observed throughout the study period. Most of the LL clusters (cold clusters) were positioned in the western zone. Although a slight variation of hot clusters (increased by 0.3%) were identified during the study period, cold clusters increased by 6.1% with the progression of the dry period. Accordingly, with the progression of the dry period, EC levels of the southern zone increased rapidly compared to the other zones.
As can be seen in Figure 9, most of the DTW hot clusters were located in the northeastern part of the study area. The percentage of the area of hot clusters reduced slightly (0.7%) with the progression of the dry season. Most of the cold clusters were located near the center of the study area, and showed a slight increase of 0.3% over the dry season.
As shown in Figure 8 and Figure 9, most of the hot and cold clusters of EC and DTW did not follow the same pattern. Hence, we can assume that there was no spatial autocorrelation among the variables. This could be verified by the results of the Moran’s I values (March = −0.092, April = −0.037, May = −0.049, and June = −0.14). With the negative Moran’s I values near to zero, we were able to confirm that there was no spatial autocorrelation between EC and DTW.

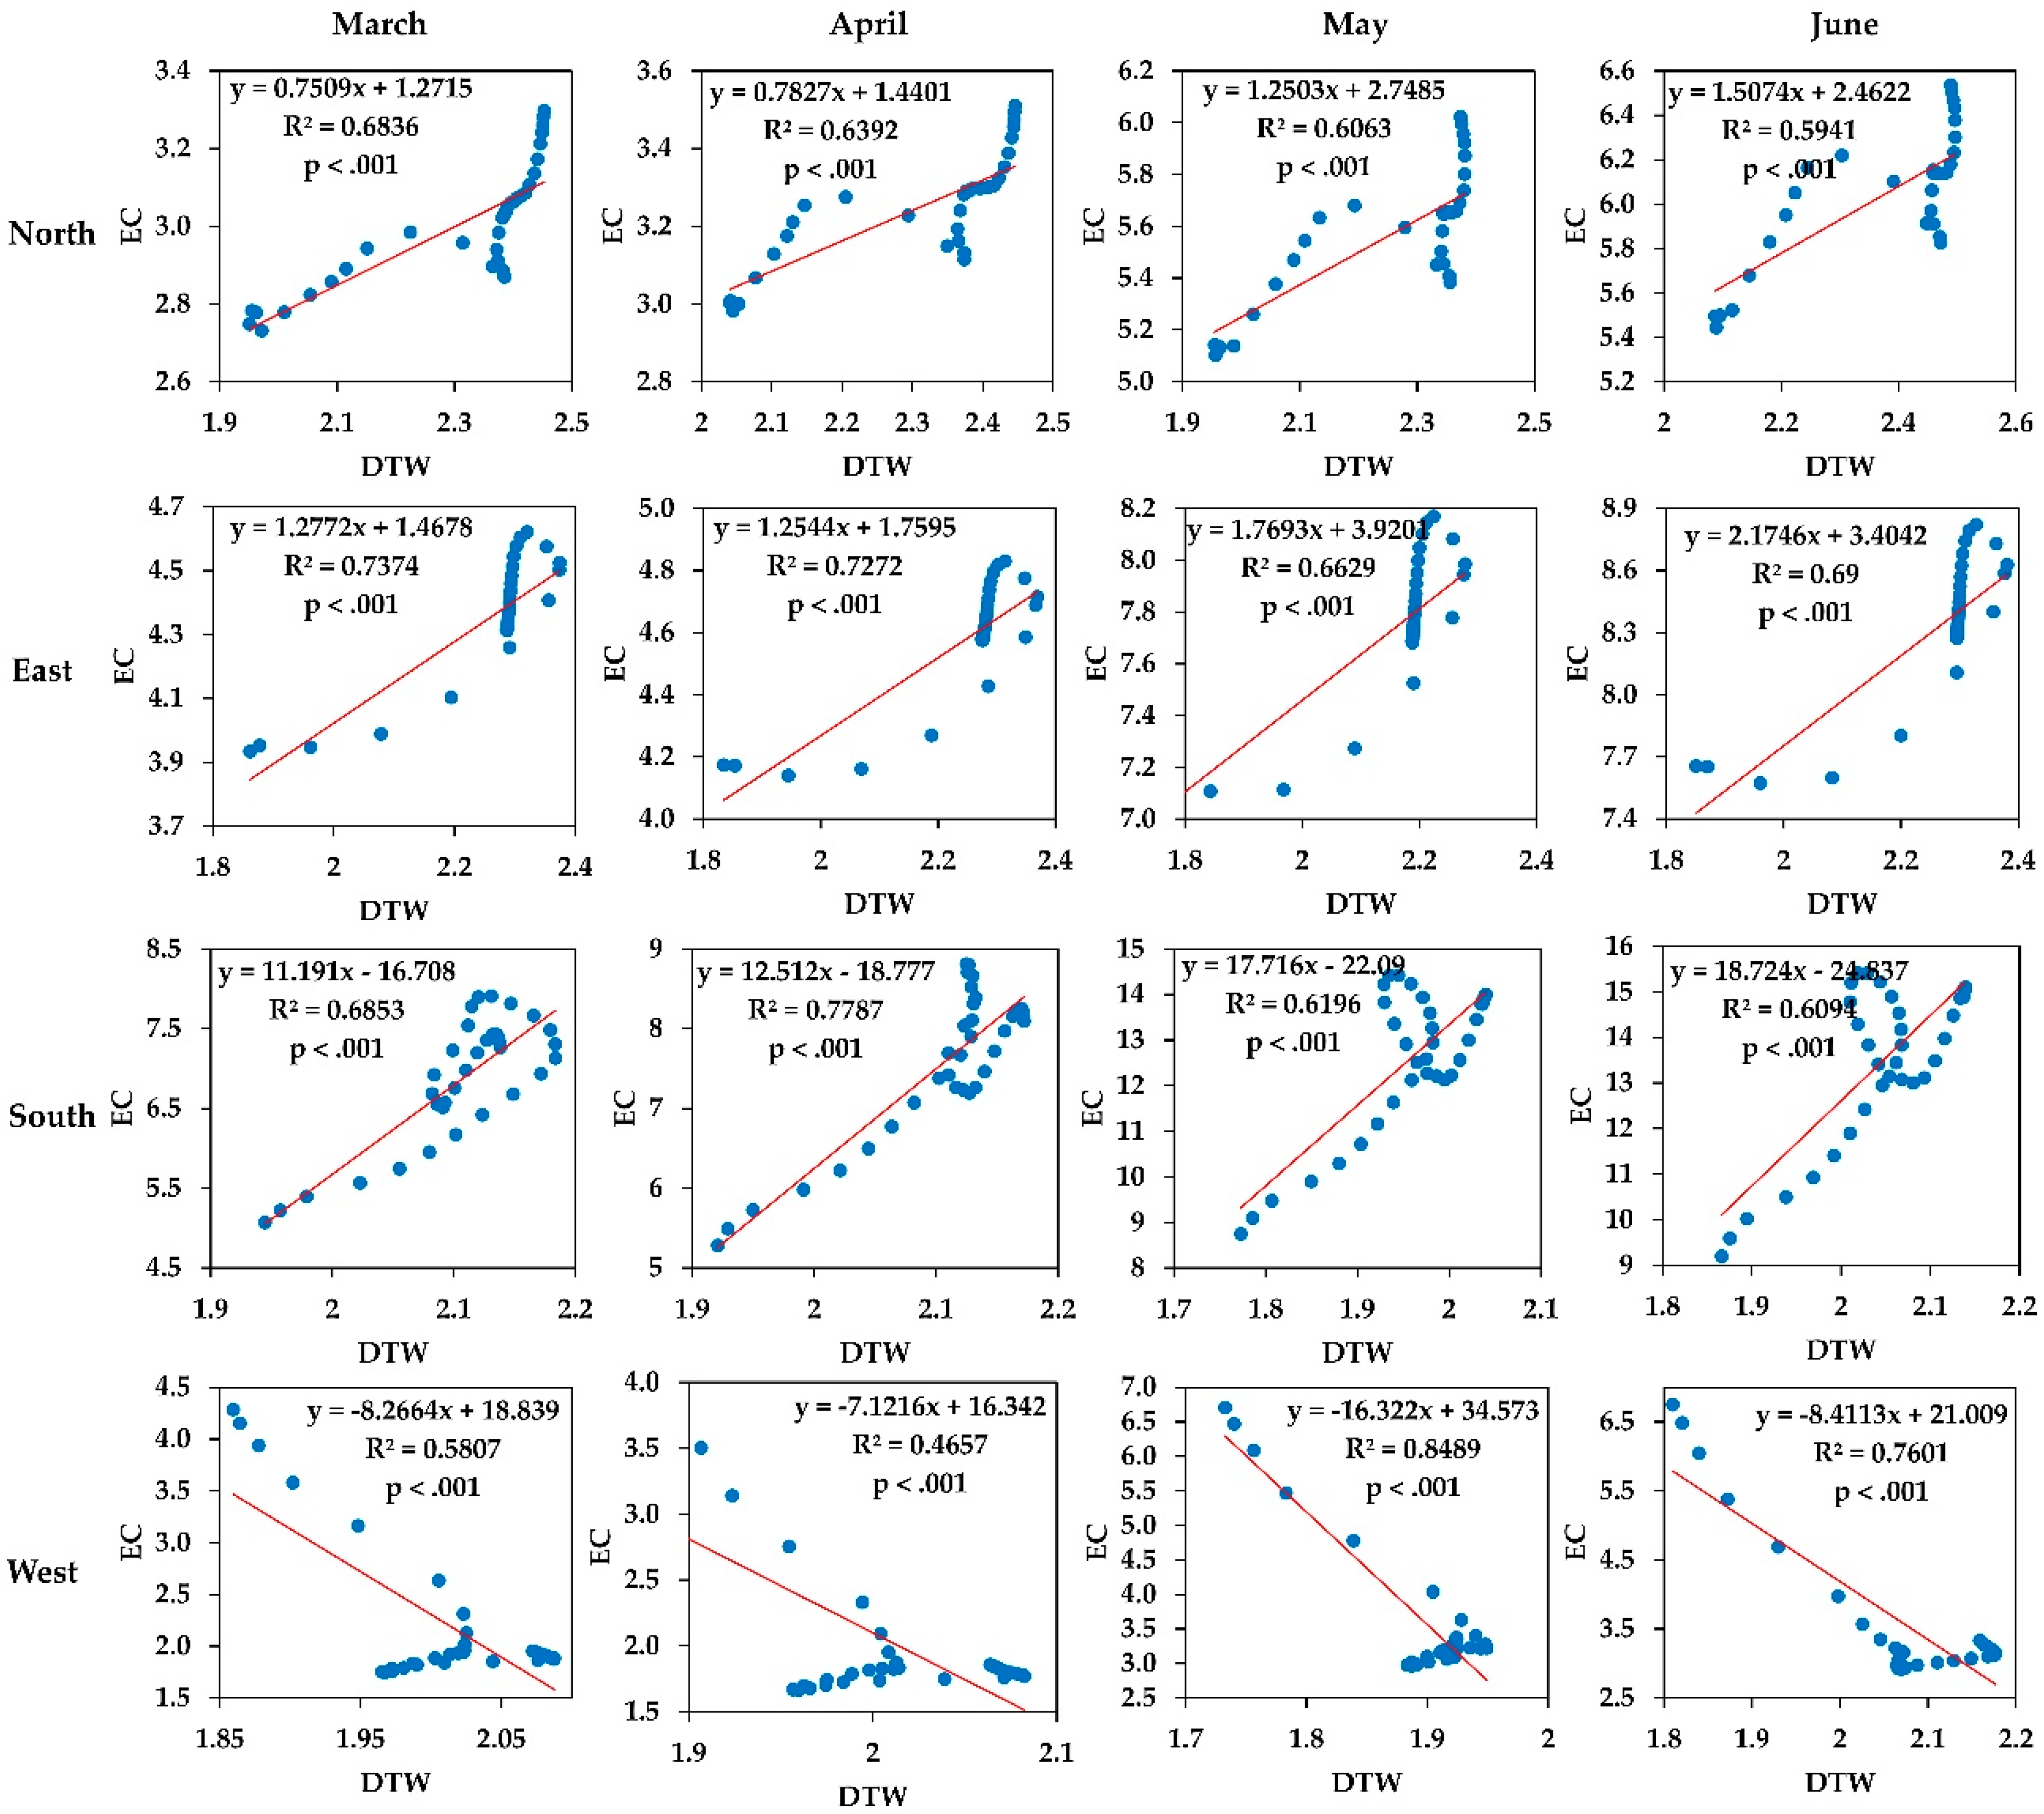
3.6. Statistical Analysis

As explained in Section 3.5, no spatial autocorrelation was observed between EC and DTW. Figure 10 shows the scatterplots between mean EC and DTW along the gradient from the lagoon. The regression analysis showed that the mean EC is positively correlated with DTW in the northern, eastern, and southern zones. The coefficient of determination (R2) values were high in the northern, eastern and southern zones. Moreover, mean EC was negatively correlated with DTW in the western zone. The relationships between EC and DTW in the four zones at the four time points were also statistically significant (p < 0.001). The main reason behind this negative relationship is the effect of the large extent of the unconfined karstic aquifer [22]. Hence, compared to the other three zones of the study area, the relatively deep wells located in the western zone can be utilized as groundwater resources.

4. Discussion

4.1. Groundwater Quality and Availability of the Jaffna Peninsula

During the post-war period, livelihood in the Jaffna peninsula changed dramatically. With the resettlement projects, significant increase in the population could be observed. The population housing census in 2012 reported that 84% of the population in the study area depended on groundwater, while the district percentage is 83%. The economy of the district is principally dependent on agriculture and fisheries, as the livelihood of nearly 65% of the population is connected with agriculture, and about 34.2% of the land has been commercially cultivated with high-value cash crops [22]. Agriculture in Jaffna mainly comprises upland crops that make intense use of groundwater, especially during the dry season. Hence, the poor quality and availability of irrigation water has a direct effect on the livelihood and development of the area. Therefore, careful management strategies are required for the sustainable management of this valuable resource.
Based on the results of the drinking water quality analysis, groundwater in a large extent of the study area was not suitable for drinking during the dry season, with only the western zone recording water of comparatively better quality (although this was only classified as permissible). A previous study reported that this area had comparatively low EC values (>0.75 mS/cm), even during the latter part of the dry season (July 2011), and the water was classified as desirable [22]. With the progression of the dry season, some areas were converted to brackish and highly salty waters. Higher variation of EC level with time in the southern zone also proves the contamination of wells with the brackish water. A study on water quality in the Jaffna Peninsula reported a similar pattern of spatial variation of EC, though the reported values were much smaller than the values we observed [33]. This implies the deterioration of water quality has taken place at an alarming rate in the study area. It was noticed that some of the selected wells (well 3, 4 and 5 in Figure 2) are already abandoned due to high salinity levels, indicating saltwater intrusion into the study area. Since accessibility to safe drinking water is a basic human need, urgent attention needs to be given to providing safe drinking water, and implementing an action plan to manage the aquifer is felt to be essential.
According to the FAO classifications, a major portion of the study area consists of unsuitable groundwater for agriculture. Even though most of the previous studies have reported that the groundwater is suitable for irrigation in the Jaffna Peninsula [22,33,34], the results of the present study showed that there is a risk when utilizing this water for irrigation. Over-extraction of groundwater to facilitate the passionate expansion of agriculture, development projects and resettlements that took place during the post-war period can be identified as the main reason for the deterioration in water quality.
According to the results of the water availability analysis, a high spatial and temporal variation of DTW was identified in the study area. The northeastern part of the study area could be identified as the most critical area for the availability of groundwater. The water availability has a direct effect on the water quality in the northern, western and southern zones of the study area. All the zones showed a substantial variation in groundwater level with the progression of the dry season. In a water balance study, a 0.27 m water deficit was recorded during the study period due to the over-extraction of the groundwater on the Jaffna Peninsula [22].
Therefore, attention is needed at the earliest possible juncture to manage both the quality and availability of groundwater, especially during the dry season, as it is the only source of drinking water for the majority of people in the area. Since there are no rules and regulations to control the high extraction of groundwater for intensive agriculture, promotion of artificial recharging is very important to managing the quality and quantity of the groundwater resources in the Jaffna Peninsula.

4.2. Implementation for Sustainable Groundwater Resource Management

Water quality and availability analysis showed that there is limited access to safe water for drinking and agriculture during the dry season in the study area. Based on the LISA cluster results, most of the EC hot clusters were located in the southern zone, and most of the EC cold clusters were located in the western zone of the area. Additionally, statistical analysis results reported that the EC has a positive correlation with DTW in the northern, eastern and southern zones, and a negative correlation in the western zone. Generally, relatively deep wells cannot be used in the northern, eastern and southern zones, although they can in the western zone of the study area. Furthermore, there is a high risk of the presence of saline water in the northern, eastern and southern zones compared to the western zone of the study area during the dry season. Therefore, it is important to consider these results, especially when formulating and implementing policy and management decisions related to a sustainable groundwater management plan on the Jaffna Peninsula. In terms of policy implications, prevailing rainwater harvesting policy should be implemented to provide safe domestic and agricultural water by harvesting rainwater on the Jaffna Peninsula. Additionally, artificial recharging of the groundwater using rainwater harvesting should also be promoted to strengthen the freshwater lens in the Peninsula. Safe digging heights should be mapped and carefully monitored to control the saltwater intrusion into the Peninsula.
In terms of management implications, the augmentation of groundwater recharge could be increased through surface ponds, which slow down the surface runoff and increase infiltration. The construction of seawater controlling bunds and salt barrages may help to reduce the level of seawater contamination of lagoons. Initially, these steps will help to reduce and control the salinity levels, retarding the possible sea water intrusion. Suitable agronomic practices should be adopted to reduce the soil salinity level and to achieve high yield under saline conditions. Additionally, construction of proper drainage systems during the rainy season could reduce the development of soil salinity. Introduction of a new drinking water supply scheme using groundwater resources located in the western zone might help to increase the accessibility of safe drinking water in other areas of the Peninsula.

4.3. Limitations and Future Research

Urgent attention is required to manage issues related to the quality and quantity of groundwater on the Jaffna Peninsula. Since artificial recharging of groundwater could be a solution for controlling groundwater issues, it is vital to study the possible groundwater recharging sites. However, this study is only focused on the dry season; immediate attention should be given to assessing the quality and availability of groundwater during the wet season, and to finding out the best places to implement artificial recharging projects on the Jaffna Peninsula.

5. Conclusions

Since stand-alone application of surface interpolation techniques of GIS are not sufficiently competent for providing the information necessary to formulate policy or make management decisions, it is recommended to integrate interpolation techniques with gradient, statistical, and cluster analysis to obtain better information for purposes of water resource management.
Boundary-oriented subdivision-based gradient and statistical analysis provide meaningful information compared to the conventional gradient/statistical analyses.
Since there is limited access to safe drinking and irrigation water on the Jaffna Peninsula during the dry season, immediate attention is required to satisfy the water demand of the area. The western zone could be identified as a potential zone for establishing water supply development projects, as it shows better quality and stability of water availability compared to the northern, eastern and southern zones of the study area. Policy and management implementations are required at the earliest possible moment to manage the sustainability of groundwater resources on the Jaffna Peninsula. The introduction of groundwater recharging techniques in the study area can be recommended, in order to minimize the saltwater intrusion and secure the water demand.

Acknowledgments

Authors are thankful to the Institute of Human Resource Advancement, University of Colombo, Sri Lanka. The comments and suggestions of the anonymous reviewers are gratefully acknowledged.

Author Contributions

The authors, K.G., M.R. and M.H.J.P.G., contributed equally in proposing the topic, spearheading the design, conducting data processing and analysis, and writing the manuscript. M.K.N.K. and M.V. helped in the design, research implementation and analysis, and the writing of the manuscript. T.S., S.S., and T.W.S.W. helped in the design and research implementation.

Conflicts of Interest

The authors declare no conflicts of interest.

References

  1. Shah, T.; Molden, D.; Sakthivadivel, R.; Seckler, D. The Global Groundwater Situation: Overview of Opportunities and Challenges; International Water Management Institute: Colombo, Sri Lanka, 2000; pp. 2–22. [Google Scholar]
  2. Thadchayini, T.; Thiruchelvam, S. An economic evaluation of drip irrigation project for banana cultivation in Jaffna district. In Water Resources Research in Sri Lanka, Proceedings of the Symposium of the Water Professionals Day, Peradeniya, Sri Lanka, 01 October 2005; Galagedara, L.G., Ed.; Postgraduate Institute of Agriculture: Peradeniya, Sri Lanka; pp. 111–126.
  3. Ducci, D. GIS techniques for mapping groundwater contamination risk. Nat. Hazards 1999, 20, 279–294. [Google Scholar] [CrossRef]
  4. Yan, W.; Li, J.; Bai, X. Comprehensive assessment and visualized monitoring of urban drinking water quality. Chemom. Intell. Lab. Syst. 2016, 155, 26–35. [Google Scholar] [CrossRef]
  5. Kholghi, M.; Hosseini, S.M. Comparison of groundwater level estimation using neuro-fuzzy and ordinary kriging. Environ. Model. Assess. 2009, 14, 729–737. [Google Scholar] [CrossRef]
  6. Shamsi, U.M. GIS Applications for Water, Wastewater and Stormwater Systems; CRC Press: Boca Raton, FL, USA, 2005. [Google Scholar]
  7. Yan, F.; Cao, S.; Liu, X.; Yang, K. Design of groundwater level monitoring network with ordinary kriging. J. Hydrodyn. Ser. B 2008, 20, 339–346. [Google Scholar]
  8. Gunarathna, M.H.J.P.; Nirmanee, K.G.S.; Kumari, M.K.N. Are geostatistical interpolation methods better than deterministic interpolation methods in mapping salinity of groundwater? Int. J. Res. Innov. Earth Sci. 2016, 3, 59–64. [Google Scholar]
  9. Gunarathna, M.H.J.P.; Nirmanee, K.G.S.; Kumari, M.K.N. Geostatistical analysis of spatial and seasonal variation of groundwater level: A comprehensive study in Malwathu Oya cascade-I, Anuradhapura, Sri Lanka. Int. Res. J. Environ. Sci. 2016, 5, 29–36. [Google Scholar]
  10. Corwin, D.L.; Lesch, S.M. Characterizing soil spatial variability with apparent soil electrical conductivity: I. Survey protocols. Comput. Electron. Agric. 2005, 46, 103–133. [Google Scholar] [CrossRef]
  11. Mir, A.; Piri, J.; Kisi, O. Spatial monitoring and zoning water quality of Sistan River in the wet and dry years using GIS and geostatistics. Comput. Electron. Agric. 2017, 135, 38–50. [Google Scholar] [CrossRef]
  12. Chen, X.; Zhou, W.; Pickett, S.; Li, W.; Han, L. Spatial-Temporal Variations of Water Quality and Its Relationship to Land Use and Land Cover in Beijing, China. Int. J. Environ. Res. Public Health 2016, 13, 449. [Google Scholar] [CrossRef] [PubMed]
  13. Ranagalage, M.; Estoque, R.C.; Murayama, Y. An Urban Heat Island Study of the Colombo Metropolitan Area, Sri Lanka, Based on Landsat Data. Int. J. Geo-Inf. 2017, 6, 189. [Google Scholar] [CrossRef]
  14. Subasinghe, S.; Estoque, R.C.; Murayama, Y. Spatiotemporal analysis of urban growth using GIS and remote sensing: A case study of the Colombo Metropolitan Area, Sri Lanka. Int. J. Geo-Inf. 2016, 5, 197. [Google Scholar] [CrossRef]
  15. Anselin, L. Local indicators of spatial association—LISA. Geogr. Anal. 1995, 27, 93–115. [Google Scholar] [CrossRef]
  16. Das Majumdar, D.; Biswas, A. Quantifying land surface temperature change from LISA clusters: An alternative approach to identifying urban land use transformation. Landsc. Urban Plan. 2016, 153, 51–65. [Google Scholar] [CrossRef]
  17. Guo, G.; Wu, Z.; Xiao, R.; Chen, Y.; Liu, X.; Zhang, X. Impacts of urban biophysical composition on land surface temperature in urban heat island clusters. Landsc. Urban Plan. 2015, 135, 1–10. [Google Scholar] [CrossRef]
  18. Su, W.; Zhang, X.; Wang, Z.; Su, X.; Huang, J.; Yang, S.; Liu, S. Analyzing disaster-forming environments and the spatial distribution of flood disasters and snow disasters that occurred in China from 1949 to 2000. Math. Comput. Model. 2011, 54, 1069–1078. [Google Scholar] [CrossRef]
  19. Nelson, T.A.; Boots, B. Detecting spatial hot spots in landscape ecology. Ecography 2008, 31, 556–566. [Google Scholar] [CrossRef]
  20. Eamer, J.B.R.; Walker, I.J. Quantifying spatial and temporal trends in beach-dune volumetric changes using spatial statistics. Geomorphology 2013, 191, 94–108. [Google Scholar] [CrossRef]
  21. Sivakumar, S.S. Reclamation of Land and Improve Water Productivity of Jaffna Peninsula of Northern Sri Lanka by Improving the Water Quality of the Lagoons. Int. J. Res. Publ. 2013, 2, 20–27. [Google Scholar]
  22. Mikunthan, T.; Vithanage, M.; Pathmarajah, S.; Arasalingam, S.; Ariyaratne, R.; Manthrithilake, H. Hydrogeochemical Characterization of Jaffna’s Aquifer Systems in Sri Lanka; International Water Management Institute: Colombo, Sri Lanka, 2013. [Google Scholar]
  23. Balendran, V.S. Salt Water Fresh Water Interface Studies in the Jaffna Peninsula; Report III; Geological Survey Department: Colombo, Sri Lanka, 1969.
  24. District Secretariat, Jaffna. Statistical Hand Book Jaffna Dsistrict; District Secretariat, Jaffna: Jaffna, Sri Lanka, 2016.
  25. Panabokke, C.; Panabokke, C.R.; Perera, A.P.G.R.L. Groundwater Resources of Sri Lanka; World Water Assessment Program: Colombo, Sri Lanka, 2005. [Google Scholar]
  26. Cooray, P.G. An Introduction to the Geology of Sri Lanka; National Museum of Srilanka: Colombo, Sri Lanka, 1984.
  27. Asadi, S.S.; Vuppala, P.; Reddy, M.A. Remote sensing and GIS techniques for evaluation of groundwater quality in municipal corporation of hyderabad (zone-V), India. Int. J. Environ. Res. Public Health 2007, 4, 45–52. [Google Scholar] [CrossRef] [PubMed]
  28. National Water Supply & Drainage Board. Specification for Potable Water Physical and Chemical Requiremen; Sri Lanka Standard 614: Part 1; National Water Supply & Drainage Board: Ratmalana, Sri Lanka, 1983.
  29. Ayres, R.S.; Westcot, D.W. Water Quality for Agriculture, FAO Irrigation and Drainage Paper No. 29; Food and Agriculture Organization of the United Nations: Rome, Italy, 1985. [Google Scholar]
  30. Anselin, L.; Syabri, I.; Kho, Y. GeoDa: An introduction to spatial data analysis. Geogr. Anal. 2006, 38, 5–22. [Google Scholar] [CrossRef]
  31. ESRI. How Cluster and Outlier Analysis (Anselin Local Moran’s I) Works. Available online: http://pro.arcgis.com/en/pro-app/tool-reference/spatial-statistics/h-how-cluster-and-outlier-analysis-anselin-local-m.htm (accessed on 16 August 2017).
  32. Balendran, S.; Udagedara, D.T.; Attanayake, A.N.B.; Kumara, C.I. Investigation of the Effectiveness of Salt Barrages in Jaffna Peninsula. In Proceedings of the 2012 Symposium Uva Wellassa University, Badulla, Sri Lanka, 22–23 November 2012; Volume 3. [Google Scholar]
  33. Hidayathulla, M.S.M.; Karunaratna, G.R.R. Assessment of Groundwater Quality in Shallow Aquifers in Jaffna Peninsula. Available online: http://www.gsslweb.org/home/files/109-113-hidayathulla-final.pdf (accessed on 11 January 2018).
  34. Joshua, W.D.; Thushyanthy, M.; Nanthagoban, N. Seasonal variation of water table and groundwater quality of the karst aquifer of the Jaffna Peninsula-Sri Lanka. J. Natl. Sci. Found. Sri Lanka 2013, 41, 3–12. [Google Scholar] [CrossRef]
Figure 1. Mean monthly rainfall and temperature for last ten years, and monthly rainfall and mean temperature of Jaffna in 2014 (Data source: Meteorological Department of Sri Lanka, 2015).
Ijgi 07 00020 g001
Figure 2. Location map of the study area (a) map of South Asia; (b) map of Sri Lanka; (c) location map of the Jaffna Peninsula; (d) location of Vadamarachchi lagoon and sampling well locations.
Ijgi 07 00020 g002
Figure 3. Distribution of drinking water suitability classes [28] based on electrical conductivity during the dry season: (a) March, (b) April, (c) May and (d) June.
Ijgi 07 00020 g003
Figure 4. Distribution of irrigation water quality classes based on electrical conductivity during the dry season: (a) March, (b) April, (c) May, and (d) June, based on Food and Agriculture Organization of the United Nations irrigation water quality guidelines [29].
Ijgi 07 00020 g004
Figure 5. Variation of depth to water: (a) March, (b) April, (c) May, and (d) June during the dry season.
Ijgi 07 00020 g005
Figure 6. Variation of electrical conductivity along the gradient of different zones in the study area: (a) northern zone, (b) eastern zone, (c) southern zone, and (d) western zone.
Ijgi 07 00020 g006
Figure 7. Variation of depth to water along the gradient of the study area: (a) northern zone, (b) eastern zone, (c) southern zone, and (d) western zone.
Ijgi 07 00020 g007
Figure 8. The spatial pattern of local indicators of spatial autocorrelations clusters of electrical conductivity during the dry season: (a) March, (b) April, (c) May, and (d) June.
Ijgi 07 00020 g008
Figure 9. The spatial pattern of local indicators of spatial autocorrelations clusters of depth to water during the dry season: (a) March, (b) April, (c) May, and (d) June.
Ijgi 07 00020 g009
Figure 10. Scatter plots between electrical conductivity and depth to water in March, April, May, and June.
Ijgi 07 00020 g010
Table 1. Classification of drinking water quality (based on Sri Lankan Standards).
Electrical Conductivity (mS/cm) *Classification *Area Percentage
March April May June
0–0.75Desirable Level0000
0.75–3.5Permissible Level45401819
3.5–10.0Brackish53566258
>10.0Highly Salty242023
* Source: Sri Lankan Standard on Drinking Water Quality (614) [29].
Table 2. Classification of groundwater for irrigation based on Food and Agriculture Organization of the United Nations irrigation water quality guidelines.
Electrical Conductivity (mS/cm)*Classification (Salinity Level)*Area Percentage
MarchAprilMayJune
<0.7None0000
0.7–3.0Slight to moderate3331811
3.0–6.0Severe50503123
6.0–14.0Doubtful16185354
>14.0Unsuitable11812

