A New Geographical Cluster View on Passenger Vehicle Purchasing in Chinese Cities

1
Northeast Institute of Geography and Agroecology, Chinese Academy of Sciences, Changchun 130102, China
2
Department of Geography and Geosciences, University of Louisville, Louisville, KY 40292, USA
3
Geosciences Program, Valdosta State University, Valdosta, GA 31698, USA
4
FAW-Volkswagen Automotive Company Ltd., Changchun 130013, China
*
Author to whom correspondence should be addressed.
ISPRS Int. J. Geo-Inf. 2018, 7(1), 9; https://0-doi-org.brum.beds.ac.uk/10.3390/ijgi7010009
Submission received: 24 October 2017
/
Revised: 13 December 2017
/
Accepted: 22 December 2017
/
Published: 1 January 2018
Abstract
:It is important to understand urban auto markets from a spatial perspective. Specifically, the question of how to simplify and visualize the relatedness of the complicated urban markets arises. Based on the concept of ‘product space’, this research explores the similarity between Chinese cities and identifies the city clusters using data of automobile sales in 2012. A city’s automobile market is shared by different manufacturers and the proximity between two cities is evaluated based on the similarity or relatedness in the structure of the two markets. The spatial structures of the ‘city clusters’ derived from the proximities of automobile markets among cities are mapped, examined, and interpreted. The analysis indicates that cities with higher proximity tend to be similar. According to the intercity proximity index, four geographical city-clusters are identified: the Southeast developed city-cluster, North China city-cluster, Northeast city-cluster, and West city-cluster. Cities in the same cluster tend to share many common characteristics while cities in different clusters exhibit obvious variances, especially in terms of economic status and dominant automakers.
1. Introduction
It is important to study the automobile markets in Chinese cities. Indeed, they have recently drawn great international attention. As the most populous developing country with the second largest economy in the world, China has been playing an increasingly important role in the global economy. China’s strong economic growth and lasting prosperity have led to an increasing demand for durable goods, among which are personal automobiles. After China became a World Trade Organisation (WTO) member, Chinese markets have become more open and automobile manufacturers all around the world have expanded automobile production and sales in China. Since 2009, China has become the largest automobile market in the world. As China’s economy continues to grow, the number of high-income urban households will increase greatly, and the infrastructure (such as high quality roads) will be improved significantly, which will likely increase household demand for automobile usage. Therefore, the automobile market is expected to maintain strong growth momentum. Automobile sales vary across cities because different cities have diverse purchasing capacity. Nowadays, as the market economy develops in China, all urban markets are full of competition from different automobile manufacturers, resulting in uneven market shares acquired by different automakers. It is important to understand the automotive markets in different cities from a spatial perspective and to classify the cities based on the relatedness of the markets among them. Meanwhile, China has a vast territory with substantial regional heterogeneity. Automobile sales and the factors impacting automobile markets vary greatly and are worthy of being explored from a regional perspective. Theoretically, if two cities have similar market structures, they are related to some degree because there are probably common or comparable determinants behind the formation of the automobile markets, such as similar economic status, demographical characteristics, purchasing propensities, and cultural backgrounds. Cities can be placed in the same class or group if their automobile markets are alike due to these cities sharing some common characteristics.
Based on the concepts of ‘proximity’ and ‘product space’ proposed by Hidalgo et al. in 2007 [1], this research examines the relatedness of automotive markets in different cities and the corresponding structure of city clusters based on the indexes of proximities of personal vehicle purchases, with 2012 data of automobile sales. Specifically, this paper intends to address the following questions: First, which cities can be grouped together based on the similarities of the market structure, and how should they be grouped? Second, what are the common characteristics and typical geographical features of the cities with similar automobile markets? Third, what are the differences in the market structures among different city-clusters, such as the respective shares for foreign, Sino-foreign joint and domestic automakers in different city clusters? Finally, what are the factors affecting the automobile sales and market structures in China? These questions are interrelated and the answers will offer a better understanding of the formation of spatial patterns of automobile sales, as well as the impacts of regional background on city-level automobile sales.
2. Background Literature
The automobile market has been studied widely, but past research has not focused so much on Asian markets. With the economic development of Asian countries, especially China, the Asian automobile markets are drawing more attention. Recently, some interesting findings have been published by studies on Asian automobile markets. Consumers from different countries displayed diverse cultural preferences. Thanasuta et al. [2] discovered that Thai consumers pay the highest value for German cars, while Japanese and American cars have about the same value. Korean and Malaysian cars are ranked last in price. Wang and Yang [3] revealed that both brand personality and the image of the origin country exert significant effects on vehicle purchase intention in China. A positive image of the origin country could enhance the brand personality’s positive impact on purchase intention, whereas a negative image could do just the opposite. Wang, Yang and Liu [4] also found that product-brand personality is more significant in affecting the purchase intention than company-brand personality. Deng and Ma [5] suggested that some large automobile manufacturers had set high markups, due to their strong market power in China’s automobile market. Declining markups along with a reduction in the markets controlled by major producers emerged in the late 1990’s. Haque et al. [6] argued that brand image and quality of foreign products carry significant positive influences on purchase intention of foreign products. Generally speaking, studies on the automobile markets in Asian countries, especially in China, are still limited. As incomes increase, the propensity to purchase vehicles increases as they become more affordable. Since China has become one of the largest automobile markets, more research in terms of automobile markets and the influencing factors should be conducted for a better understanding of urban and regional changes. However, most existing research on automobile purchasing in China [7,8,9,10,11] focused on the overall characteristics or prediction of sales of automobiles (or a particular type of car, such as green cars). Only limited research concerning the spatial distribution of overall automobile sales across Chinese cities, especially the spatial pattern of automobile markets composed of different automobile manufacturers, has been published due to the lack of relevant data [12].Regarding car sales, it is important to study the factors affecting car ownership and purchase preferences. Researchers in other countries have found that important factors for car ownership include individual and household income, employment status, household location, cultural background, car price, energy prices, access to public transportation, build environment, etc. [13,14,15,16]. Thus, more research is needed to explore such factors in China.
Methodologically, the inspiration for our research derives from the concept of ‘product space’ proposed by Hidalgo et al. [1], which corresponds to the network of relatedness between products based on the pattern of comparative advantage in world trade. The authors argued that different products are related to each other through a network of proximities, in which the nodes represent the products and the linkages between them represent pair-wise relationships among products. The proximity between two products are measured based on the probability of being exported by the same countries. Numerous studies have been inspired by their work. The concept of ‘product space’ has been empirically investigated and extended to new research fields. Many researchers focus on analyzing the linkage between the products in a country’s export basket and the evolution of the product space [17,18,19,20]. Furthermore, the ‘product space’ is also applied to the study of ‘scientific space’ [21] and ‘industry space’ which stems from almost identical ideas, but employs revised methods in computing the relatedness [22].
Although the notions of classification and cluster are discussed in the studies of ‘product space’, most refer to the product cluster or product classification, rather than geographical cluster or geographical agglomeration. Since products can be linked based on the probabilities of being exported by the same countries, countries with similar export baskets can also be considered related because they can be deemed as having a common export capacity. From this perspective, the research subject could be extended to geographical areas to examine their relatedness, both spatially and functionally. In fact, some researchers already strive to explore the relationship and relatedness between countries [23]. Analysis of areal relatedness at country level tends to be excessively macro that it may neglect many valuable details. Thus, it is more meaningful to conduct analysis at a finer spatial scale such as city-level and study the relatedness among cities based on certain products. Furthermore, the network of relatedness among cities could be used to identify the ‘city clusters’ in which the cities’ automobile markets are highly similar. This research tends to fill a void of existing literature, focusing on the spatial analysis of the proximity of automobile market structures across Chinese cities based on empirical purchasing data.
3. Methodology
3.1. Data and Research Area
It is well known that passenger cars are the most important type of automobiles and they are in highest demand by urban residents. In this study, we examined the sales/purchasing of passenger vehicles, which include three general styles: sedans, MPVs (multi-purpose vehicle) and SUVs (sport utility vehicle). The data of passenger vehicle sales were compiled from the Economic Advisory Center in the State Information Center (SIC). The only available data set is composed of the actual numbers of vehicles sold by each automaker in each of the 337 prefecture-level cities in mainland China in 2012. In China’s administrative system, a prefecture-level city ranks below a province and above a county. It usually contains a municipality with subordinate districts and several counties. Most provinces are composed of a certain number of prefecture-level cities. The four centrally-administered municipalities (Beijing, Tianjin, Shanghai and Chongqing) are practically treated as the prefecture-level cities in this study, although they are actually in the same administrative rank as provinces. No vehicle sales information is available for Taiwan, Hong Kong and Macao. According to this data set, total vehicle sales in Mainland China in 2012 reached 13.08 million, with 12.04 million vehicles produced in China (by both Sino-foreign joint automakers and Chinese automakers) and 1.04 million vehicles imported from overseas (produced by foreign-owned automakers). Other auxiliary data used in this research, such as Gross Domestic Product (GDP) and population studies, were collected from the China Statistical Yearbook for Regional Economy (2012).
Vehicle sales data in 2012 were analyzed at the automaker level. In China, the foreign automakers are not allowed to produce automobiles alone, but are encouraged to join with a domestic Chinese manufacturer to form a Sino-foreign venture to produce and sell automobiles. Along with the expansion of the Chinese automobile market in the past decade, nearly all of the major foreign automakers have chosen to join with a Chinese manufacturer (or two manufacturers) to launch Sino-foreign joint ventures in order to be allowed to produce and sell vehicles in China. It should be noted that because some of the foreign automakers joint ventured with two separate Chinese automobile manufactures, certain foreign brand vehicles are actually produced by two independent and competitive manufacturers in China. For instance, Toyota passenger vehicles are produced by both Guangzhou Toyota and First Automobile Works (FAW) Toyota, and are thus treated as two separate automakers in the study. The same is true for Volkswagen vehicles which are manufactured by both FAW Volkswagen and Shanghai Volkswagen.
The data contain 113 manufacturers that sold cars in China in 2012, comprising 47 foreign-owned automakers, 26 Sino-foreign joint automakers, and 40 Chinese automakers. We selected the top 60 passenger automakers according to their 2012 sales in China. Seventeen of them were Sino-foreign joint ventures, 18 were solely foreign-owned companies (imported), and 25 were Chinese manufacturers. Sales of passenger cars of the top 60 automakers accounted for 98.76% of the total sales in mainland China in 2012. Sales of the vehicle by automakers beyond the top 60 were quite small, usually fewer than 10,000 units in the whole country. Some of the makes were only sold in hundreds of units in a very limited number of cities. Excluding these minor automakers would help capture the big picture and understand the essential structure of China’s city-level passenger vehicle sales/purchasing, and facilitate the computation of the chief indices in this study. The top eight passenger vehicle makes in terms of sales were all made by Sino-foreign joint ventures, accounting for 66.68% of the total sales. Although foreign automakers are allowed to sell automobiles produced abroad in China’s market, the number of imported automobiles is much smaller than that of domestically produced vehicles. Due to higher prices and import taxes, they mainly target higher-income customers in China.
3.2. Revealed Comparative Advantage (RCA) and Proximity
When we examine the role of one manufacturer in a city’s automobile sales market, we want to see not only whether a manufacturer sells its vehicles in any amount, but also how substantial vehicle sales are in the city. Thus, we require that a manufacturer achieved Revealed Comparative Advantage (RCA) in a city. The concept of RCA is analogous to the index of Location Quotient (LQ) in geographical research. The RCAc,i in our study represents the comparative advantage of the manufacturer i (1, 2, 3, …, 60) ’s market share of automobile sales in city c (c = 1, 2, 3, …, 337), as compared with the market share in the whole national market. It is computed as follows:
where X(c,i) is the amount of automobile sales of manufacturer i in city c. RCAc,i > 1 means manufacturer i has a revealed comparative advantage in city c. In our view, the structural characteristics of a city’s automobile market are largely dominated by the manufacturers with achieved comparative advantage.
A structural table based on the RCAc,i was then built to define whether manufacturer i has a revealed comparative advantage in city c. The table is made up of Mc,i, where Mc,i = 1, if RCAc,i > 1, otherwise Mc,i = 0. For an automaker to have a revealed comparative advantage in a city, its automobiles must possess the right bundle of features to be substantially consumed in that city. If two cities have very similar market factors, this should result in a higher probability of an automaker having a comparative advantage in both. Formally, the proximity between cities c and c’ is the minimum of the pairwise conditional probabilities of an automaker that has an RCA in city c given that it has an RCA in city c’. In other words, the proximity between two cities is calculated based on the number of dominant automakers shared by both cities, relative to the number of dominant automakers in the city with the most dominant manufactures. Practically, Equation (2) measures the proximity of the two cities based on the similarity of both market structures.
where is the proximity between two cities; corresponds to the number of manufacturers that gain a revealed comparative advantage in both cities. The larger is the number of common automakers, the higher is the proximity of the two cities. A proximity of 1 suggests that the two cities are very similar in the market structure of automobile sales, consumer preferences, and other underlying demand factors. Generally, two cities are considered similar and in closer proximity when is larger than 0.7 [24].
By calculating the proximity between cities, the similarity or relatedness of the two cities can be examined, and the question of which cities are more similar based on their automobile market structures could be answered. The underlying reasons why these cities are related could be explored given the characteristics of the cities in tandem.
3.3. City Cluster Based on Proximity
One of the major objectives of this research is to examine the geographical pattern of cities with high similarities, such as whether they concentrate in certain regions or disperse in random. If they tend to concentrate, some clusters of cities are likely to be identified, and the characteristics of each cluster can be explored. In geographical studies, cluster analysis is usually used as a convenient method to group similar spatial units into clusters and recognize the spatial patterns following the construction of the similarity matrices. The classic clustering methods, such as hierarchical clustering and K-Means clustering, have been widely applied in studies of urban and regional pattern identification, neighborhood segregation, urban–rural classification, landscape planning, etc. [25,26,27,28,29,30,31,32,33]. However, because it is not easy to directly visualize the linkages among cities and observe the spatial patterns of the city clusters using the traditional clustering, we chose a new approach to identify the city clusters based on the highest proximities among the cities. Two basic rules were followed for a city to be included in a specific city-cluster. First, the city has no fewer than two links with proximity values equal to or higher than 0.7 connected with the other cities in the cluster. Second, each cluster should have more than 10 cities. Thus, each cluster could be considered a closed ‘network’ with each node having at least two high-proximity links with other nodes. Apparently, it is easier to capture the associations among the cities in a certain cluster and the geographical patterns at the same time using this method. Meanwhile, since a matrix based on the index of proximity among cities has already been built, it is feasible and meaningful to compare the clustering results in this work with the results from the traditional cluster analysis, such as the hierarchical cluster analysis. For example, it can be observed whether cities assigned to a certain cluster are also grouped into the same cluster using the traditional method and the degree of overlap might be able to measure the credibility of the results to some degree. There are 337 cities in our study, thus the number of entries in the proximity matrix is 56,616 (337 × 336/2). Because we are more concerned with the proximity of higher levels, only the top 10 proximity values of each city were visualized with lines to represent the relatedness among cities. A node at the centroid of each administrative prefectural area was used to represent each city. After deleting redundant lines (keeping a single line between each pair of cities), a total of 2802 lines representing the relative higher levels of proximity was portrayed, with no fewer than 10 lines connected with each city.
3.4. Discriminant Analysis
Linear discriminant analysis is the statistical technique often used to examine whether two or more groups can be distinguished from each other based on linear combinations of values of predictor variables. The linear combinations of predictor variables are known as discriminant functions, variates, or latent variables. This technique was employed in the study to convert predictor variables into latent or underlying dimensions to uncover which underlying dimensions and their corresponding variables contribute to the separation among different clusters of cities. Predictor variables include those representing each city’s economic development and incomes levels, composition of car sales, as well as geographical locations (dummy variables representing western, central, and northeastern China, respectively).
4. Results
4.1. The Statistics of Proximity
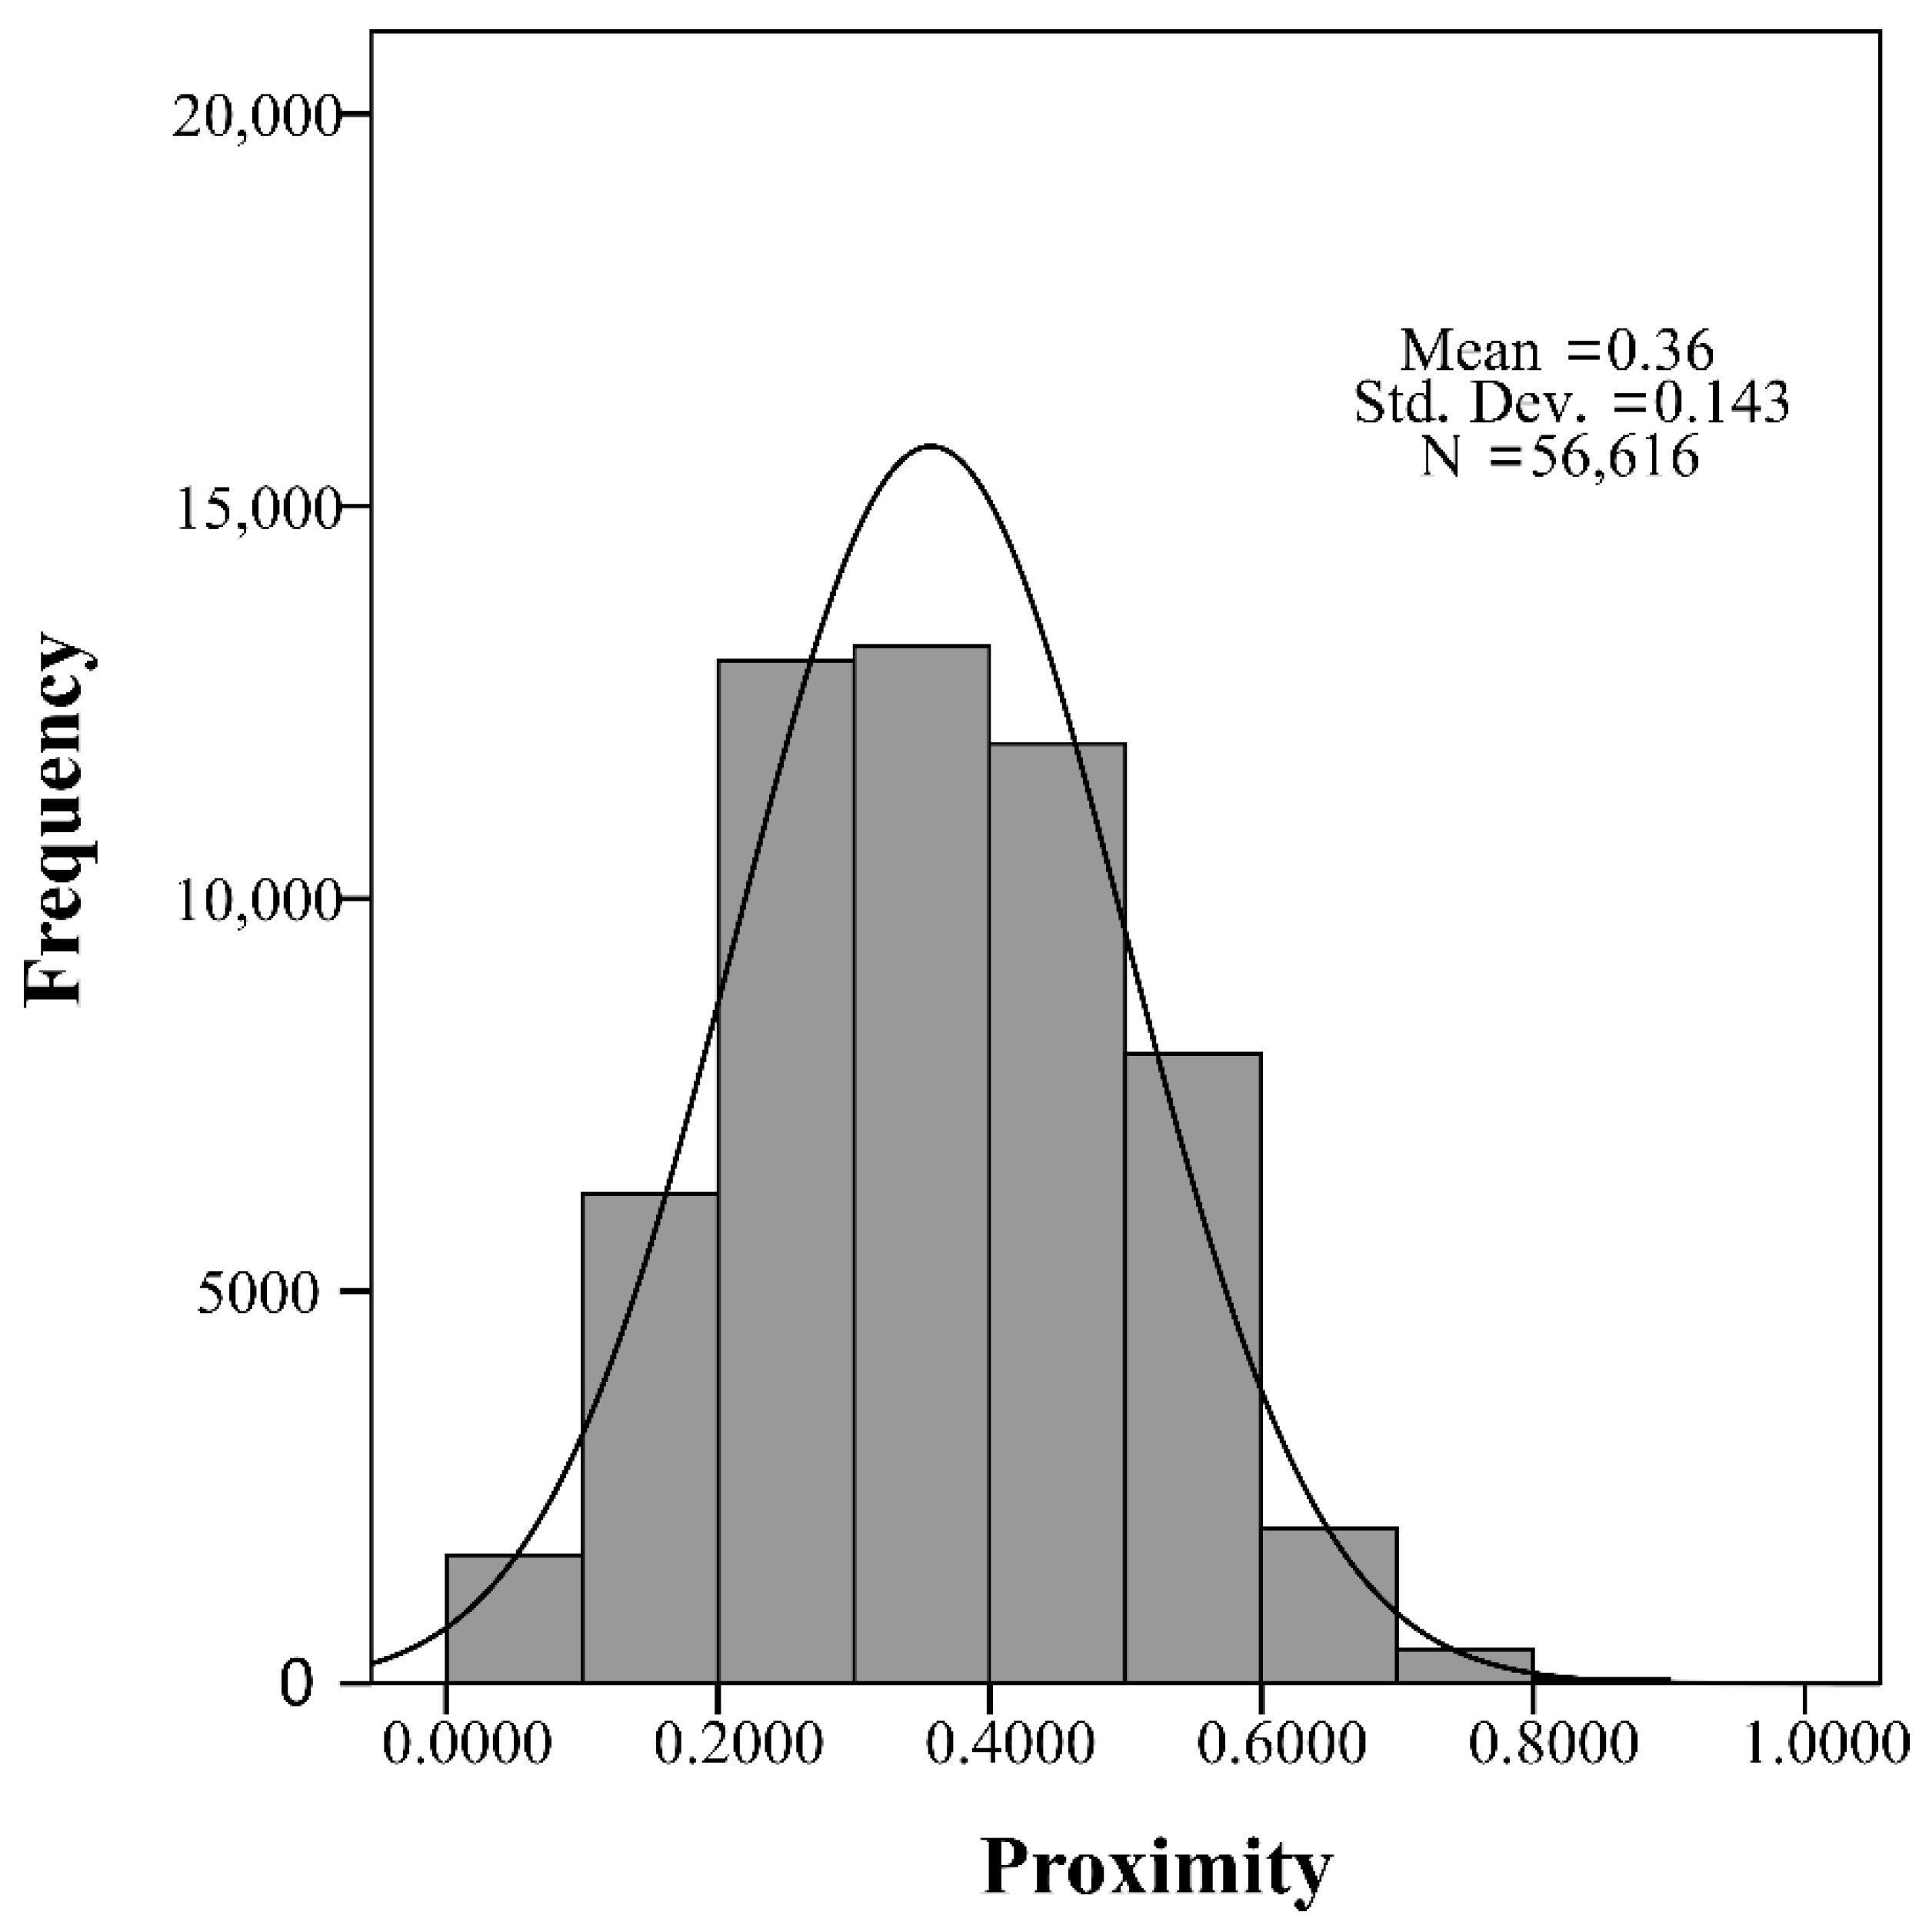
Descriptive statistics of all 56,616 computed proximities demonstrate that there is great variation in the values of proximity between cities, with a maximum of 0.926, a minimum of 0, and a standard deviation of 0.1424 around the mean of 0.358. This indicates that some cities are nearly identical, some are totally different, and most others are not alike in terms of the structure of their automobile markets. Figure 1 depicts the frequency distribution of proximity values using the histogram with a smooth curve in a nearly normal fashion.
Overall, most of the proximity values are relevantly low with more than 50% of proximity values lower than the average value (0.358) and only 2.31% of them larger than 0.65. This broad, heterogeneous distribution indicates that there are only a few strong links and many marginal links. Barely 1% of the total proximity values are equal to or more than 0.7, and they are the main focus of our study.
4.2. Proximity and Distance
Spatially, the proximity values among cities based on the similarity of automobile markets are related to the physical distances among them. After all, nearby cities tend to have similar cultural backgrounds or purchasing preferences and their markets are more likely to be penetrated by the same manufacturers around them. Figure 2 delineates the distribution of the 2802 links corresponding to the top 10 proximity values of each city. The frequencies of the links below 500 km (the average distance is 750.82 km) are relatively higher, with the largest number of links (over 400) falling within the distance between 100 km and 200 km. In general, the frequencies of links decrease with increased distances, excluding the distance interval between 0 and 100 km. It appears that the links or city pairs tend to have higher levels of market proximity as the distance between them decreases.
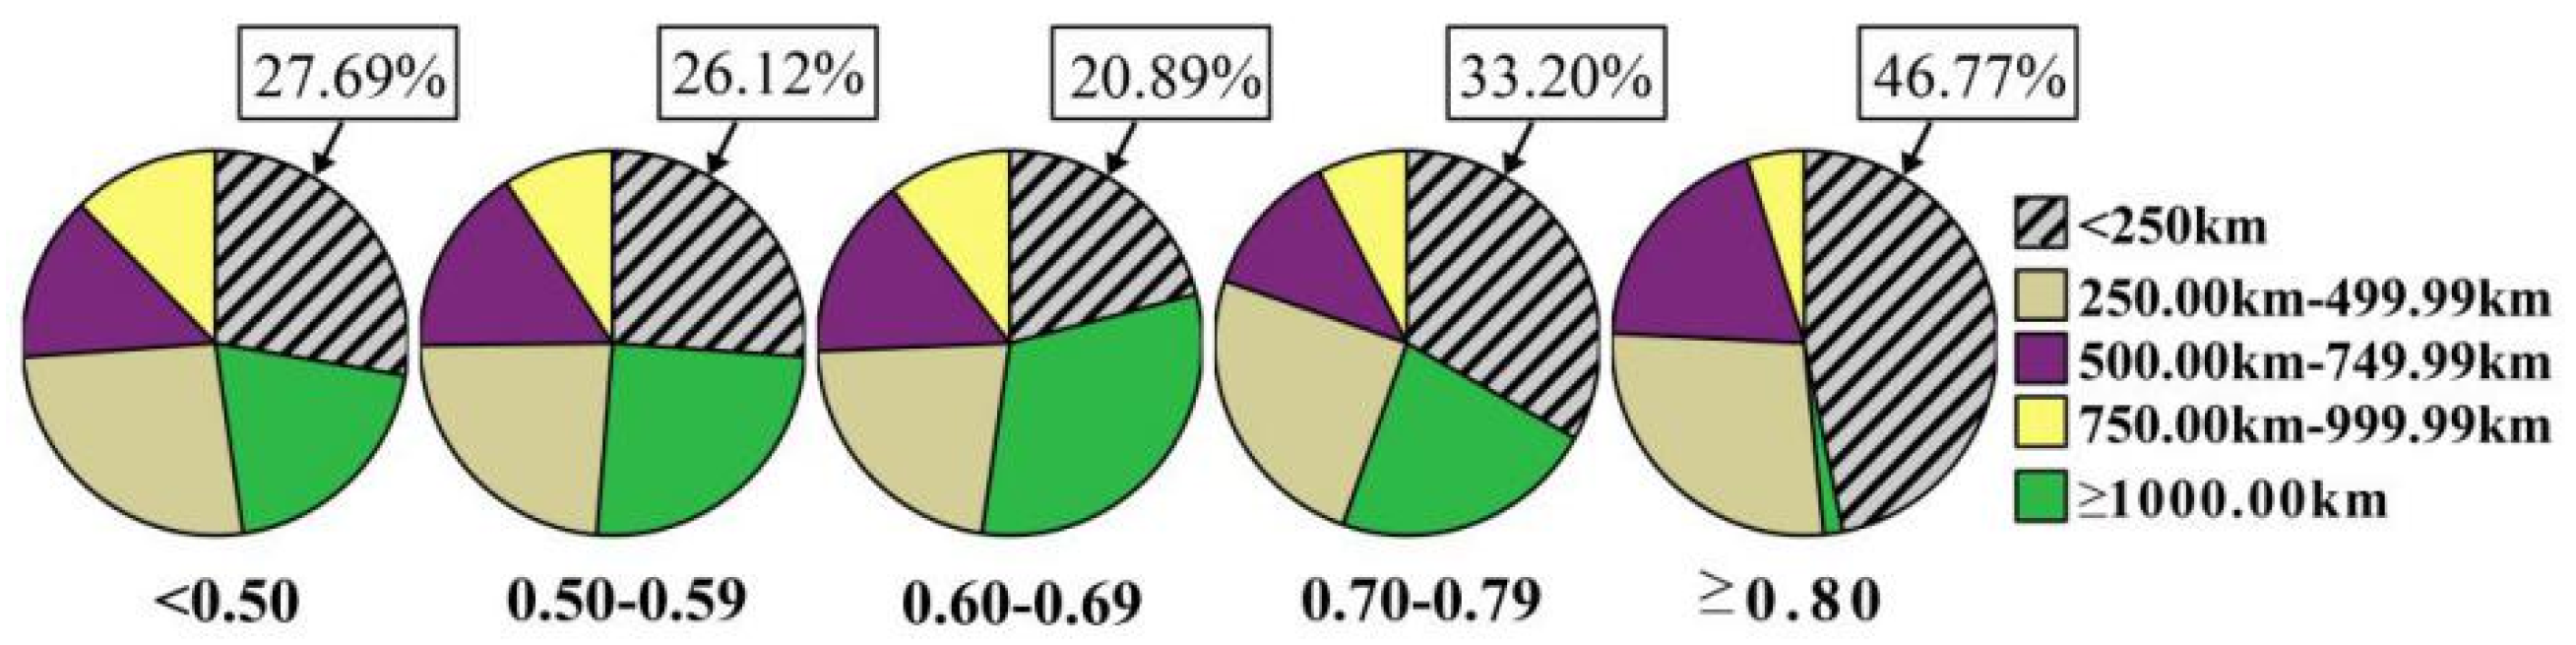
To further explore the relationship between the distance and the proximity values, the links were arranged into five groups based on proximity values, and a boxplot graph was produced. As Figure 3 shows, the distance varies dramatically even when the proximity values are more than 0.70 (considered high enough), but the average distance becomes smaller as the proximity increases. A panel of pie charts of lengths were made to show the proportions of different ranges of distance in each group (Figure 4). It reveals that links with higher proximity values are more likely to be with shorter distances. For instance, when the proximities are higher than 0.8, the proportion of distances shorter than 250 km reaches 46.77%, and the proportion of links with distances under the average (788 km) is also fairly high. Conversely, the proportion of links involving distances greater than 1000 km is minimal.
In short, if two cities possess higher proximity values, the distance between them is more likely to be shorter. Although we cannot directly conclude that distance alone is the most important factor in determining the proximity value between two cities, the geographical closeness could imply specific regional characteristics and probably certain similar underlying determinants in automobile demand, leading to higher proximity values.
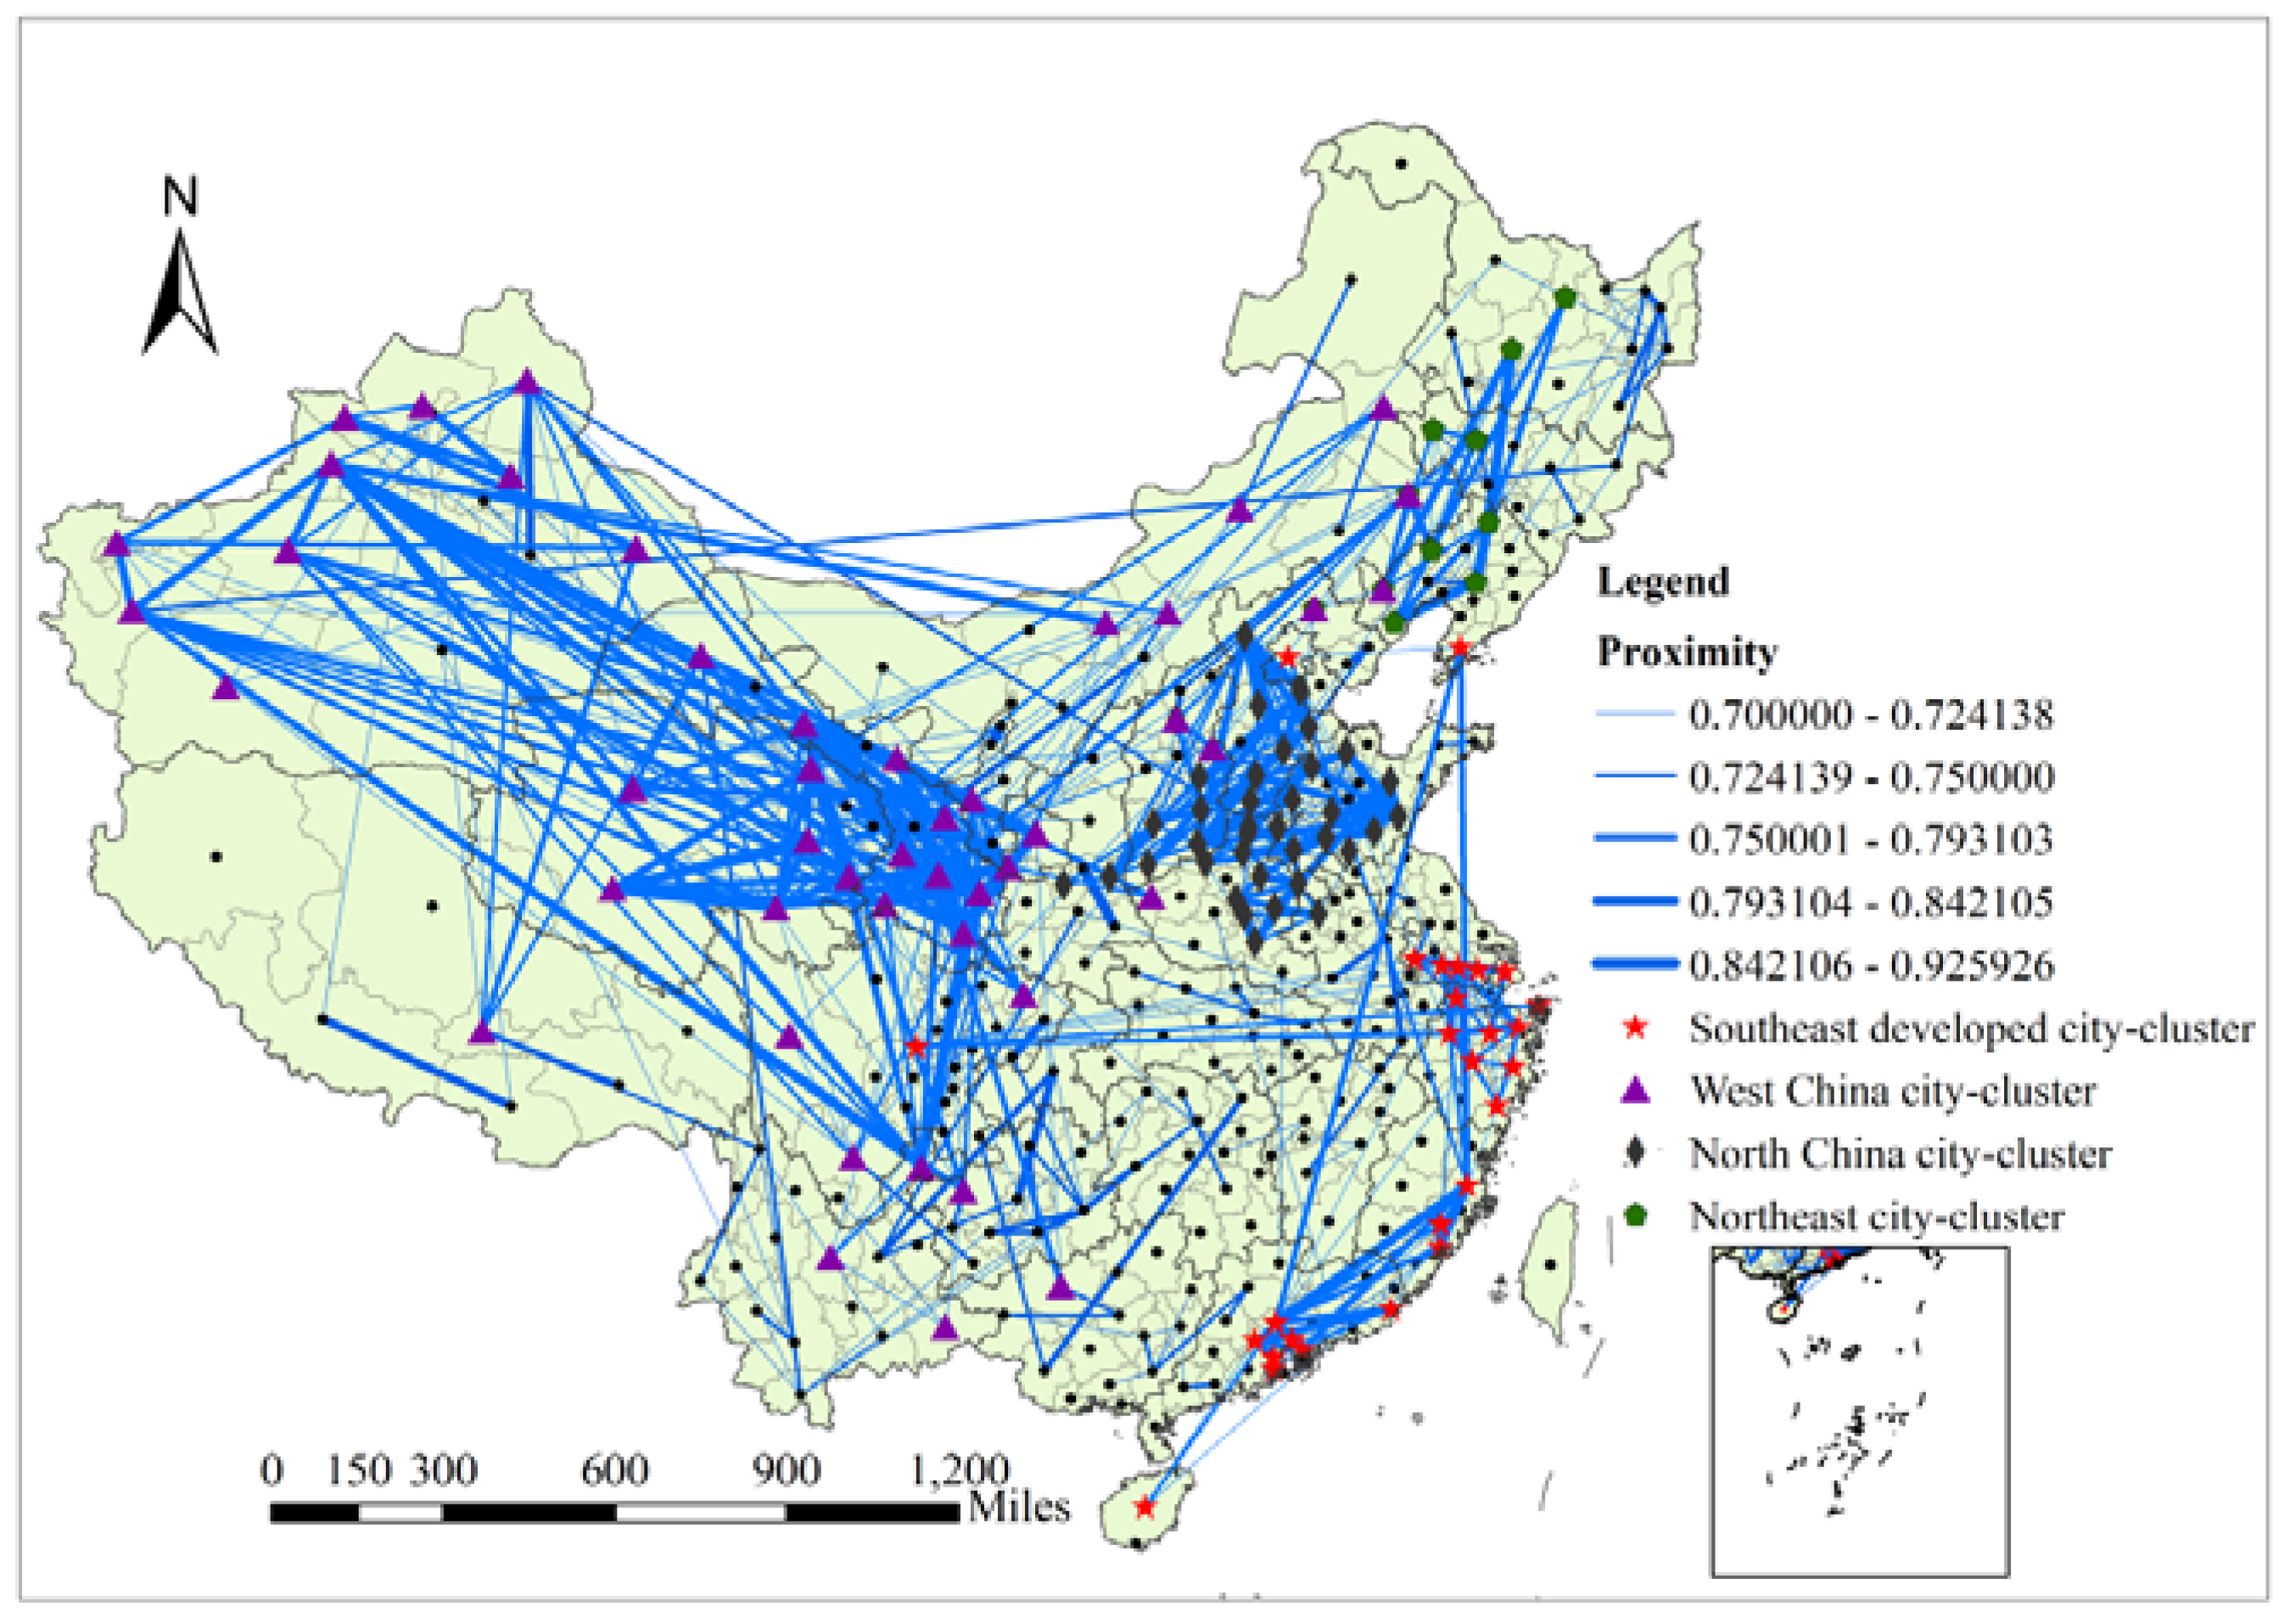
4.3. City Clusters Based on Higher Proximity Links
Based on derived proximity values among cities, a general and typical geographical pattern of Chinese cities in terms of the market relatedness was explored. Focusing on higher proximity levels, the top 10 proximities (links) for each city were investigated in detail. Because it is too overwhelming to map all the top 10 links, only those links with proximity values no less than 0.7 were displayed in Figure 5 to help detect geographical patterns. Not all cities have links with proximity values equal to or more than 0.7. The 232 cities with links no less than 0.7 account for 68.84% and the other 105 cities with proximity values lower than 0.7 account for 31.36% of the 337 cities. Cities having low proximity with other cities may have some unique local conditions and underlying factors in automobile purchasing, while higher proximity links are more likely to reveal the general structure. Using the method mentioned previously, four city-clusters were identified and named, as shown in Figure 5. The cities in the same cluster are similar in automobile market structures and these four city-clusters can capture the major spatial pattern in terms of the automobile market relatedness among cities in mainland China. To verify the statistical soundness of the above city classification, an agglomerative hierarchical clustering analysis was also conducted based on the proximity matrix for the same 122 cities within the four identified city-clusters using SPSS 16.0 software. The four-cluster result from the agglomerative hierarchical clustering analysis strongly resembles that reported in Figure 5, with the vast majority of the cities grouped into the same clusters and an overall matching rate of 97.5%. This indicates that the method used to identify the city clusters in this work is rational, reliable, and statistically sound. In order to delineate the general characteristics in each cluster, the four city-clusters are summarized as follows.
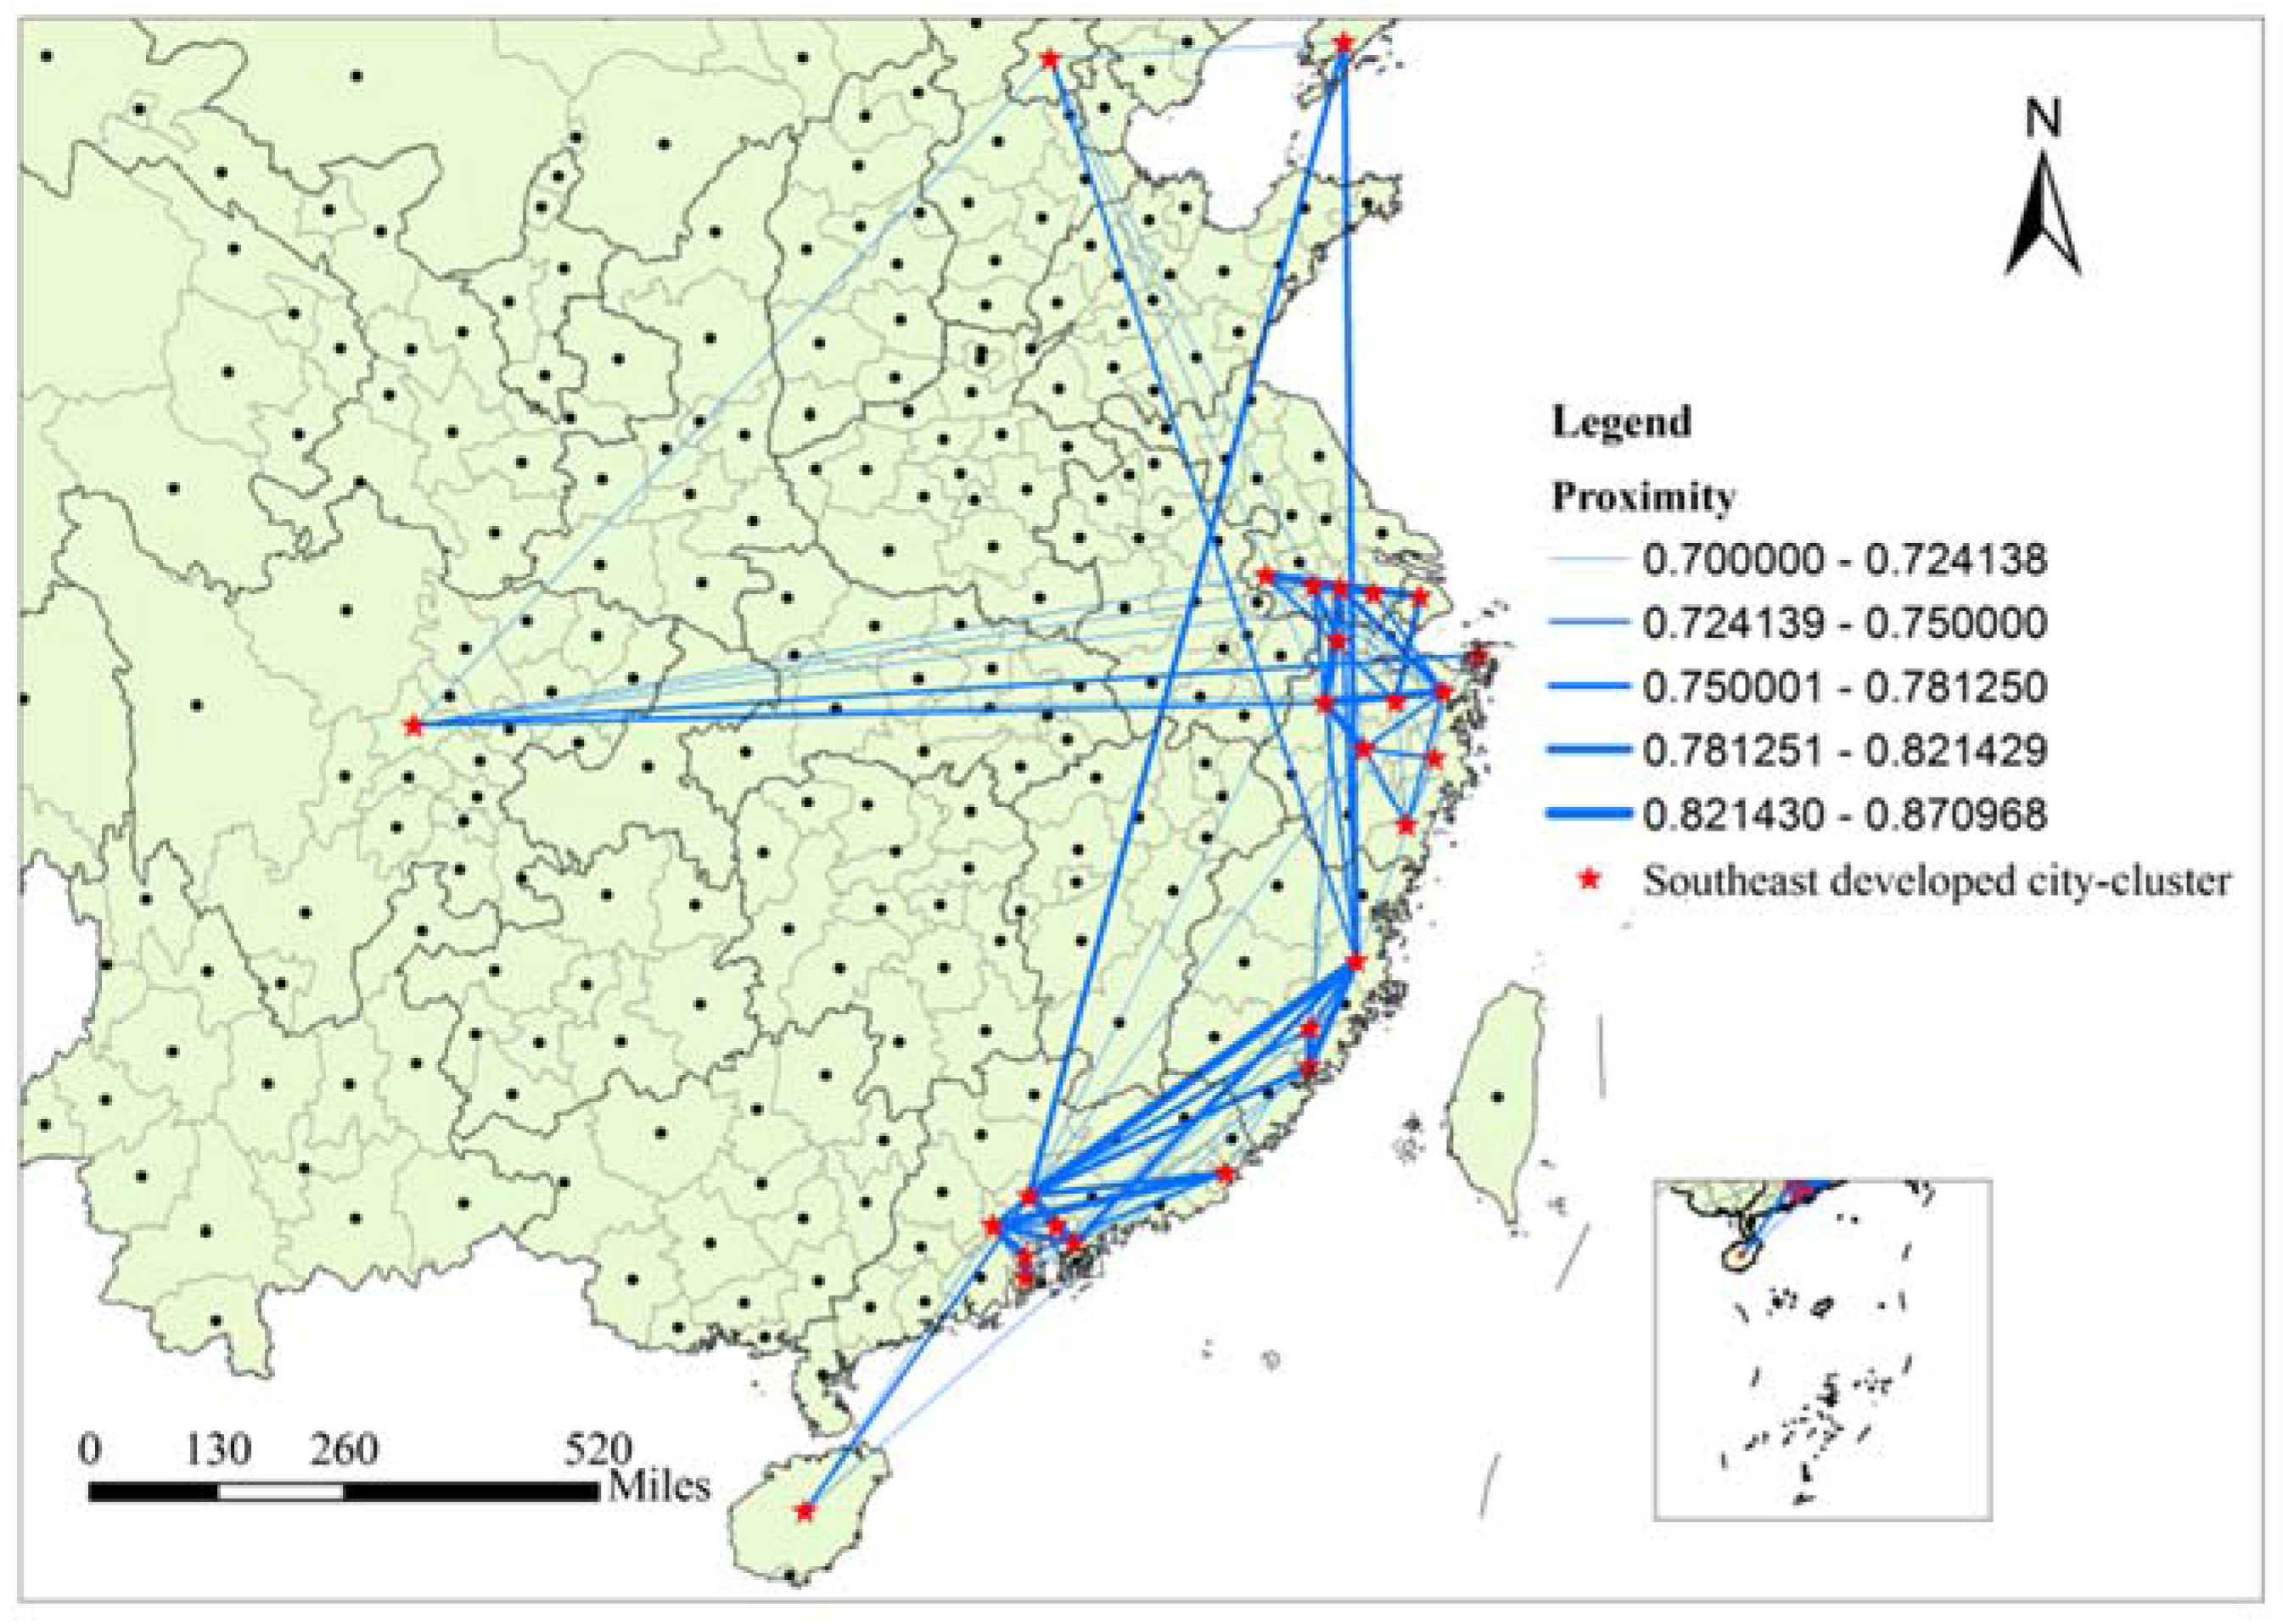
- (1)
- The Southeast developed city-cluster. As Figure 6 shows, there are 27 cities in this cluster, most of which are located in the provinces in the southeast coastal area of China, such as Shanghai, Jiangsu, Zhejiang, Fujian, and Guangdong. Meanwhile, several economically developed inland cities are also included in this group, such as Beijing and Chengdu. Virtually all of them are prominent and populous cities with highly developed economies, not only in relation to their own provinces but also to the whole country of China. All of the cities are playing a leading role in shaping China’s current and future economic landscape and city space.
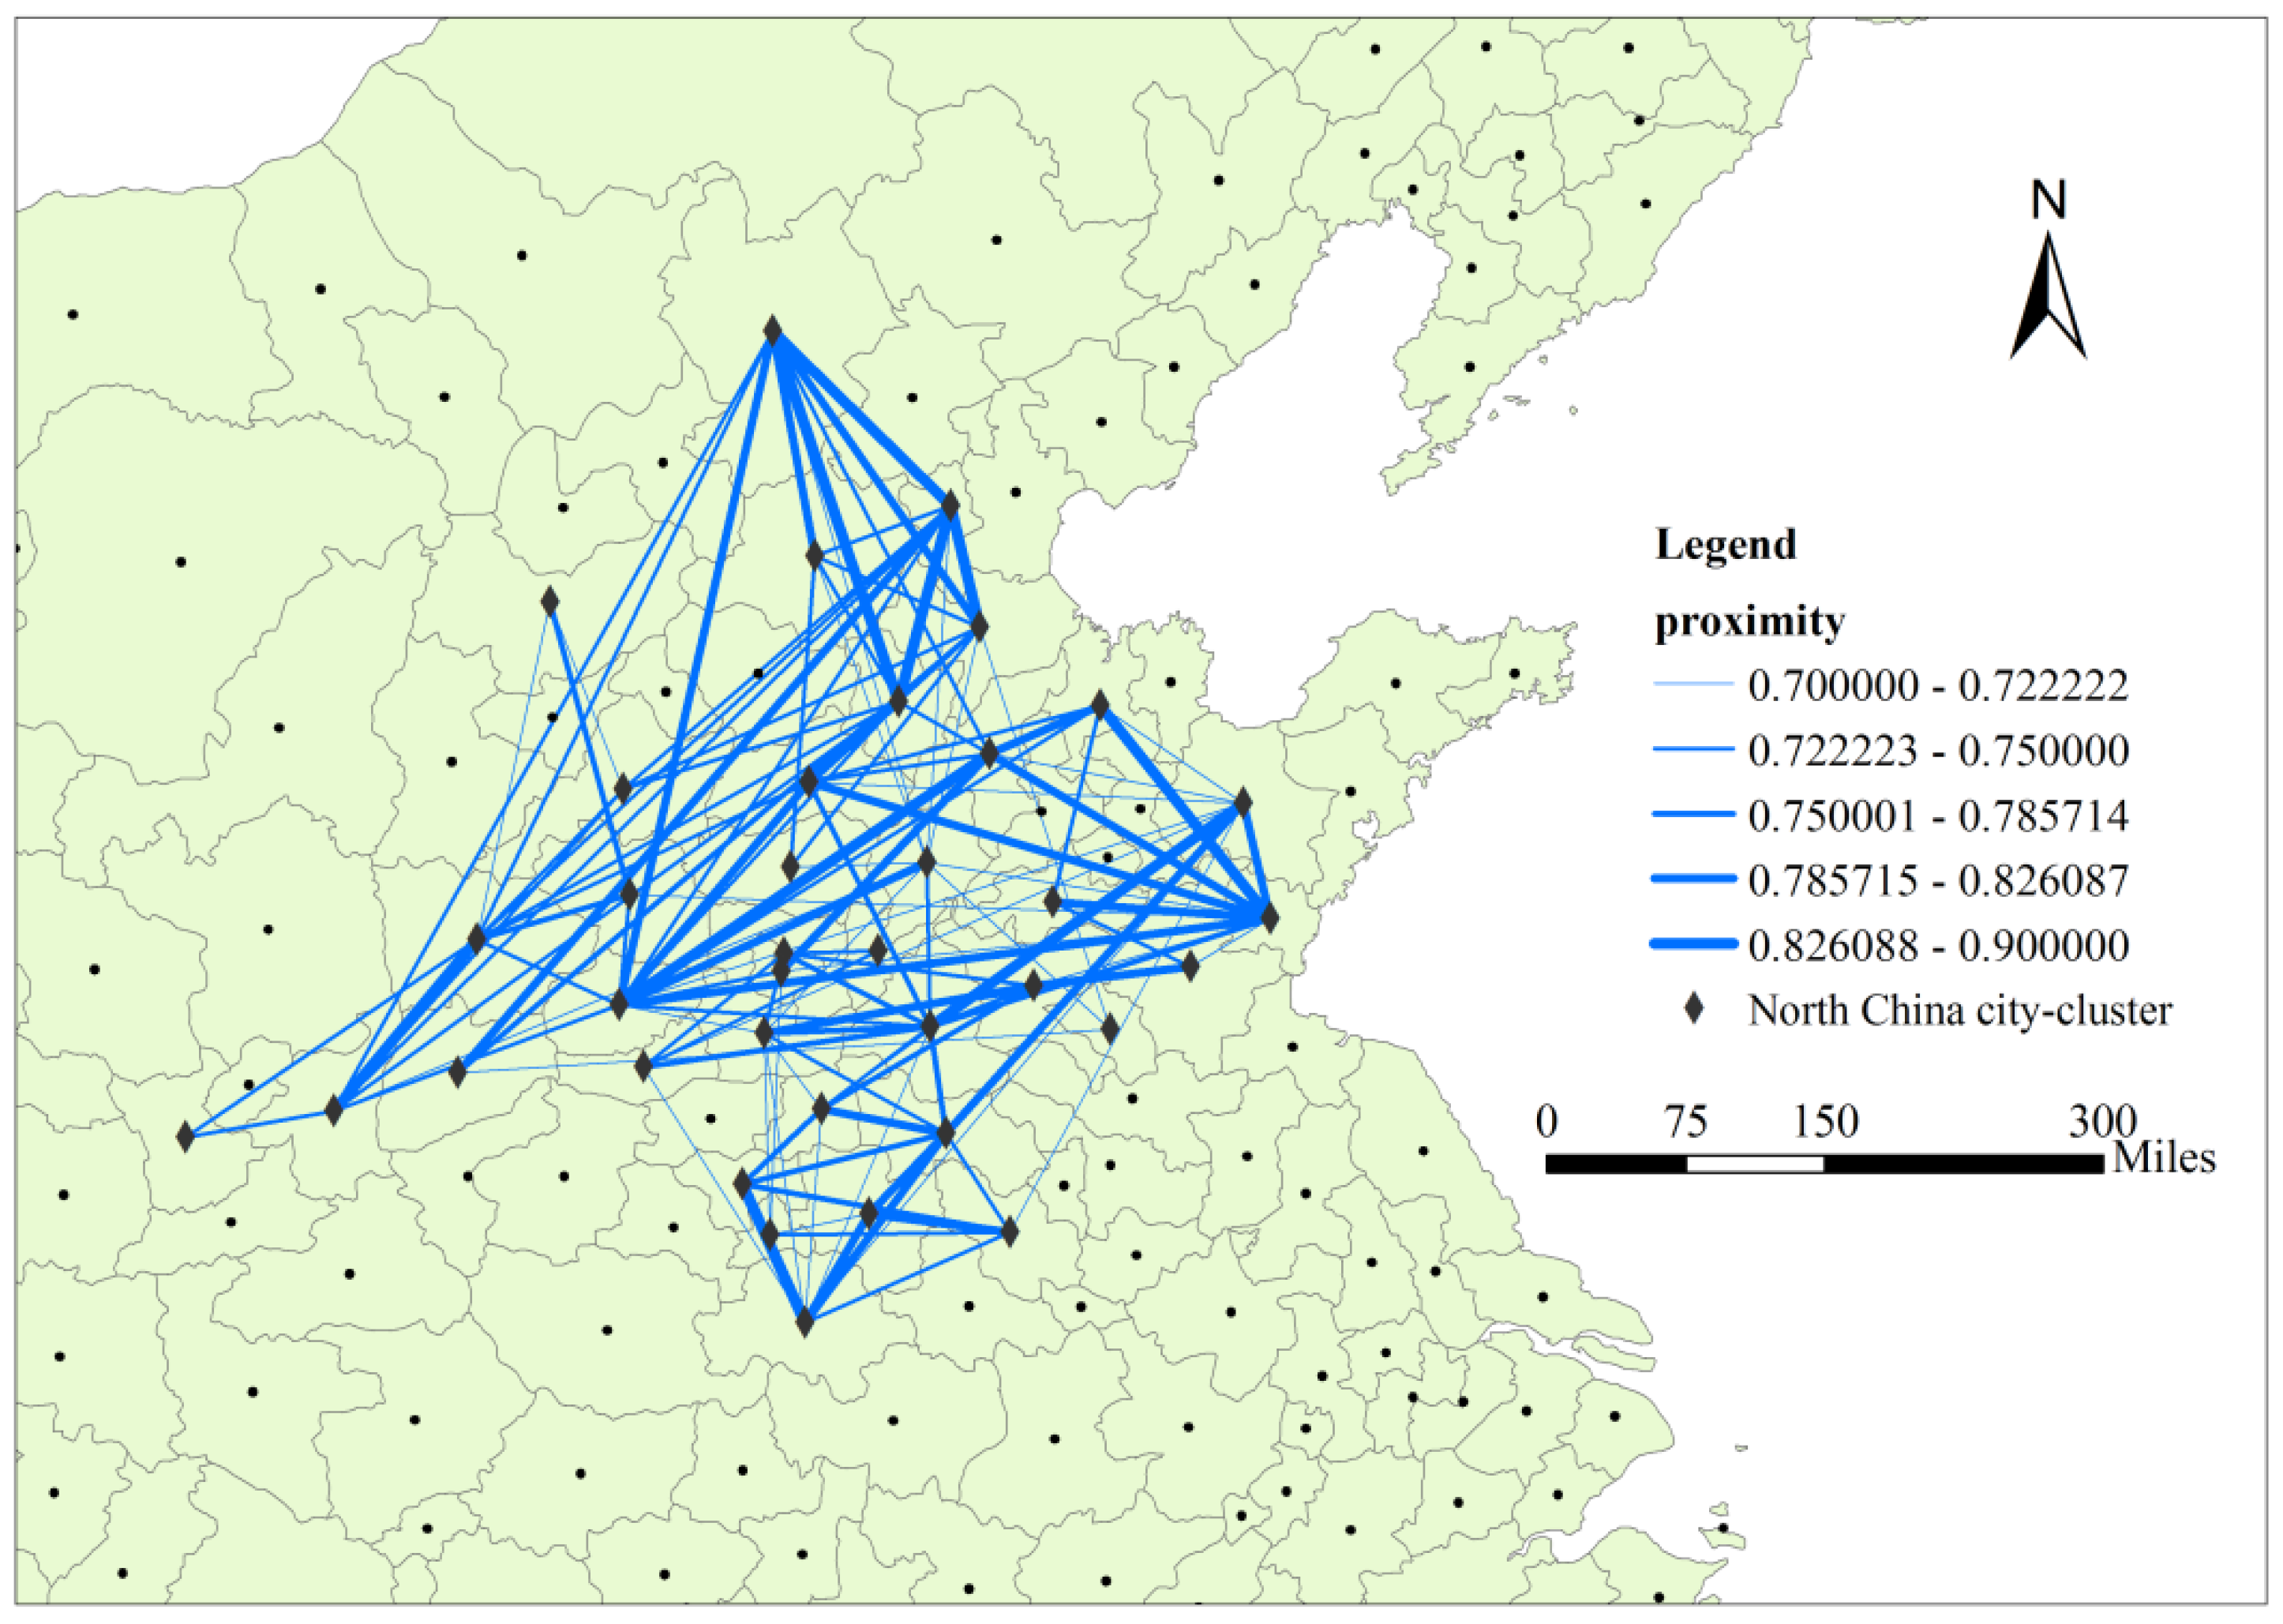
- (2)
- The North China city-cluster. A total of 37 cities are included in this group. In addition to higher market proximities among them, cities in this cluster demonstrate more geographical closeness and an apparent spatial agglomeration in the North China Plain and surroundings, such as Hebei, Henan, Shanxi, and Shandong (Figure 7). Some common features of these cities are that their economy and population levels are much smaller than those in the Southeast coast city-cluster, and most of them are in the second-tier and third-tier cities of their respective provinces.
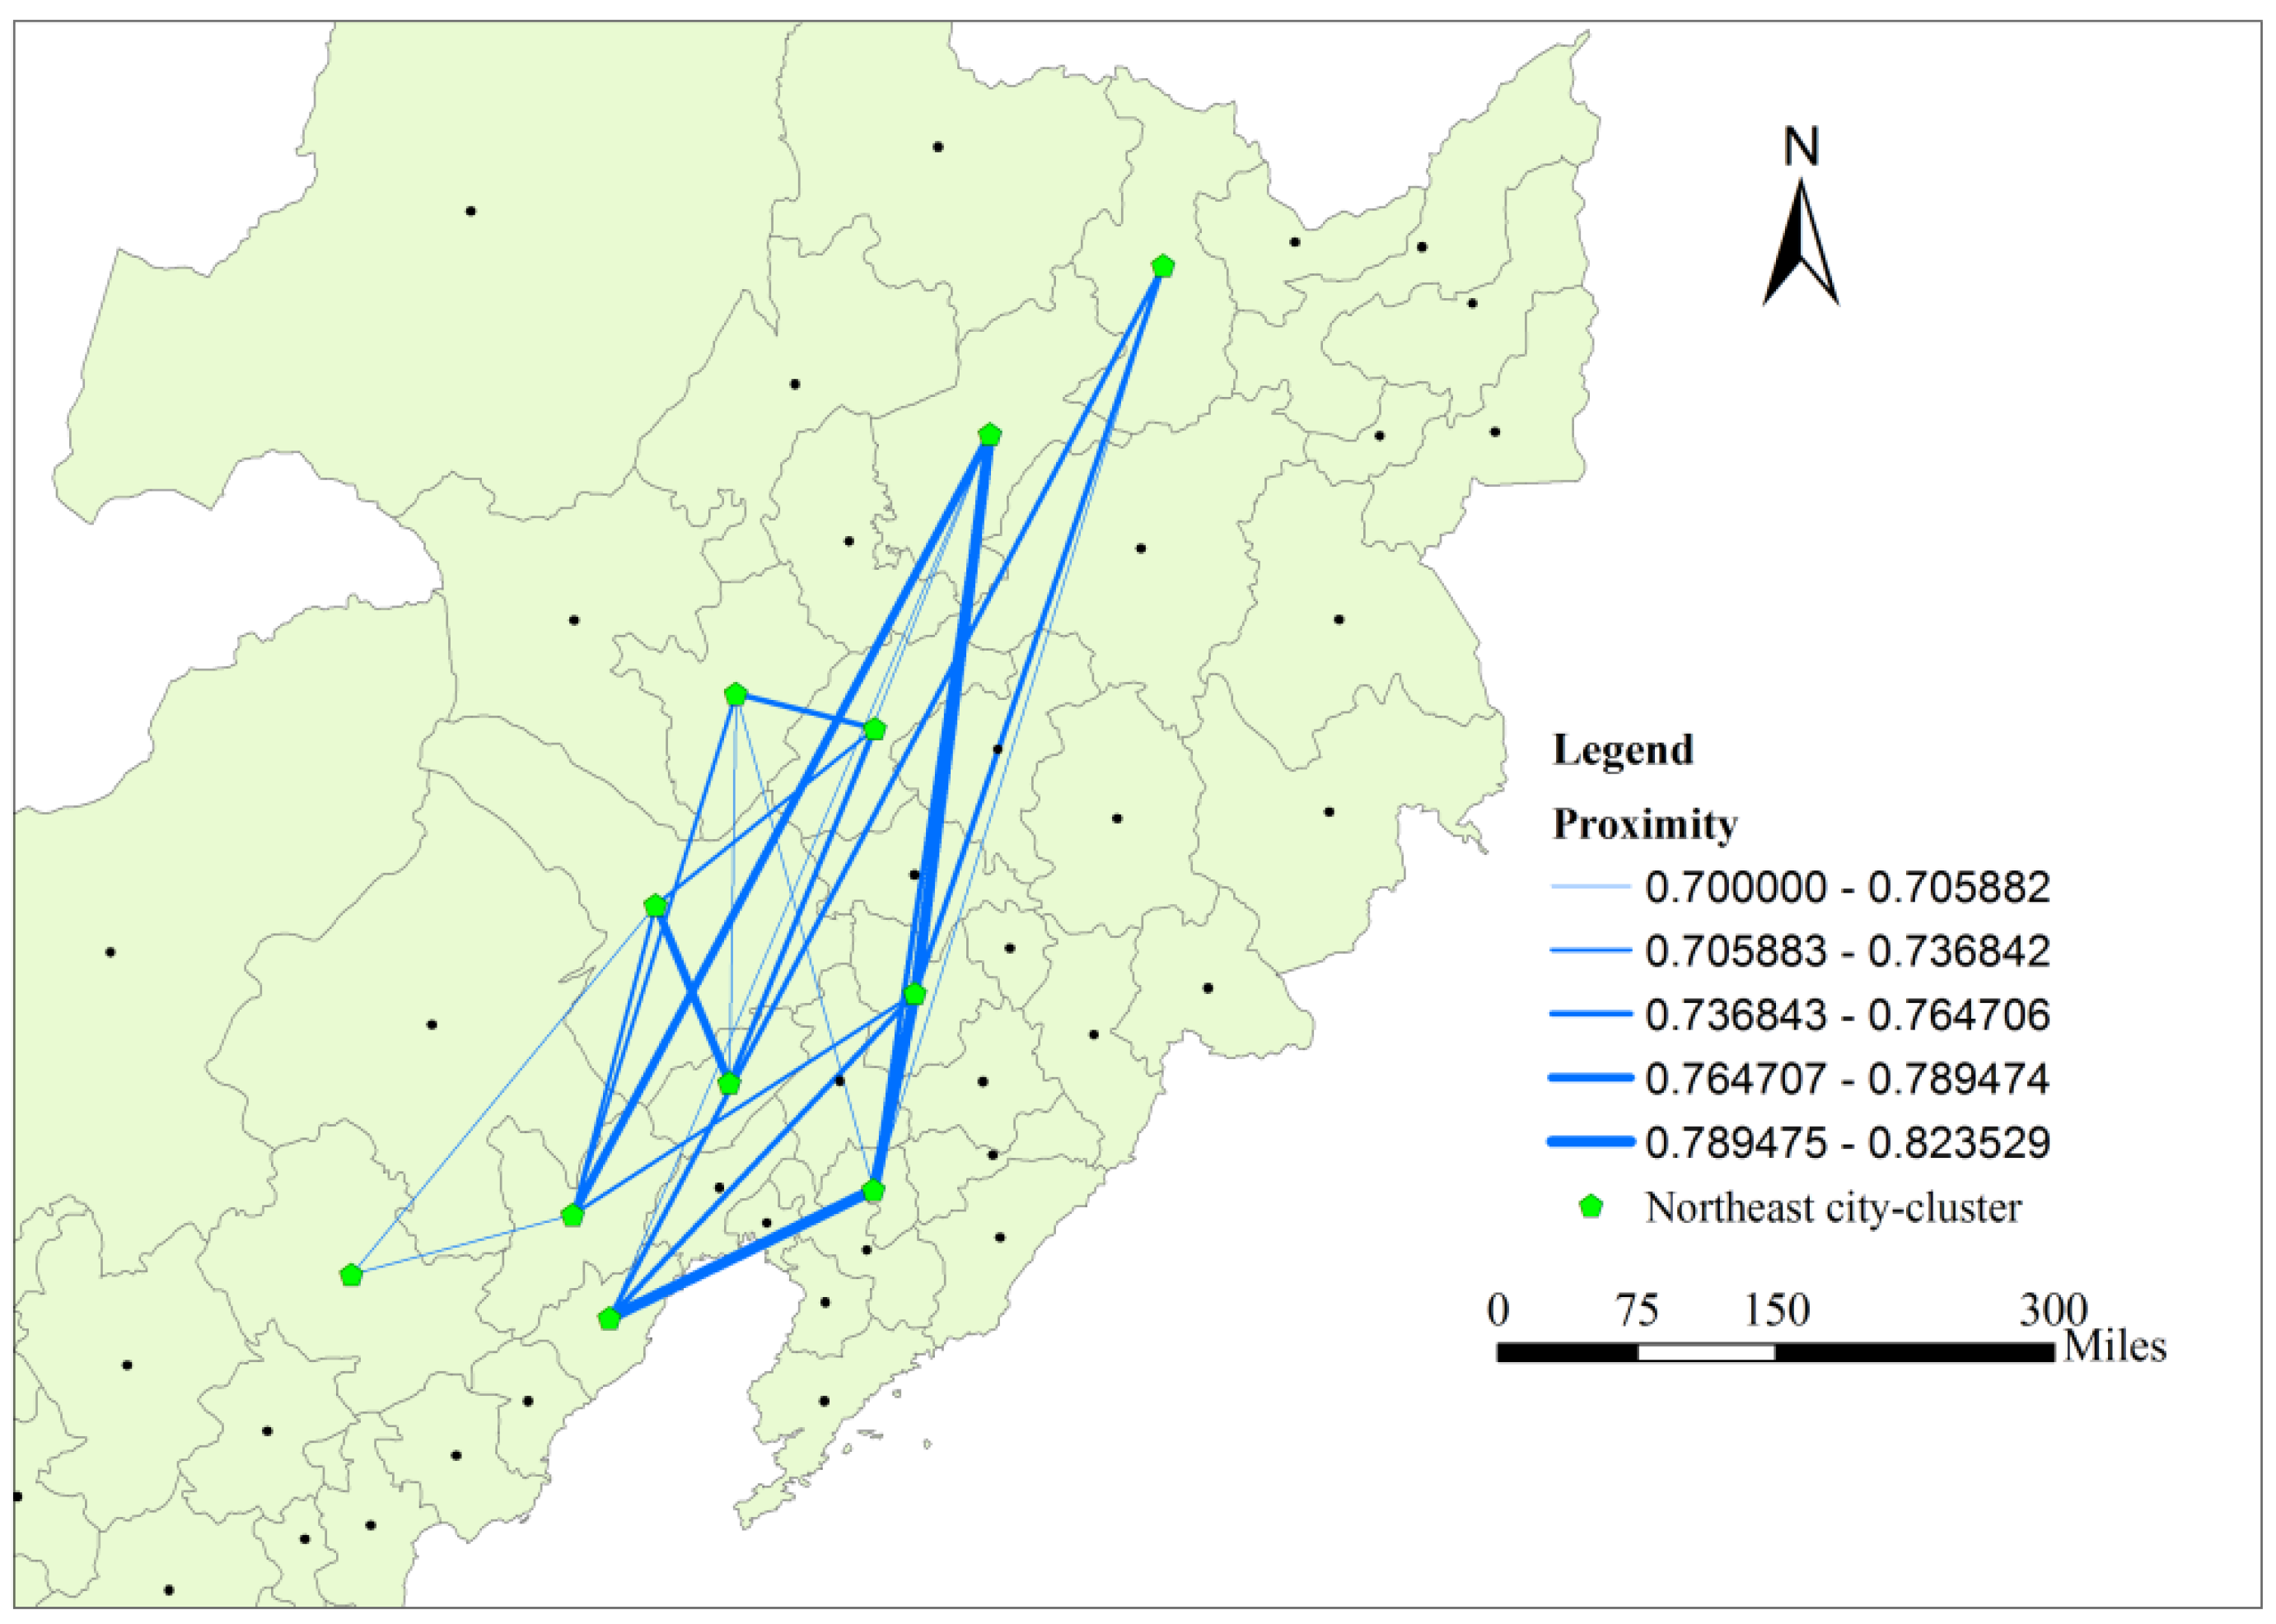
- (3)
- The Northeast city-cluster. Only 11 cities are included in this group, making its number the smallest among all the four clusters (Figure 8). These cities are mostly located in the middle and western parts of Northeast China, with relatively weak economies compared to cities in Southeast city-cluster and North China city-clusters. In fact, most of the more developed cities in Northeast China are excluded from the cluster.
- (4)
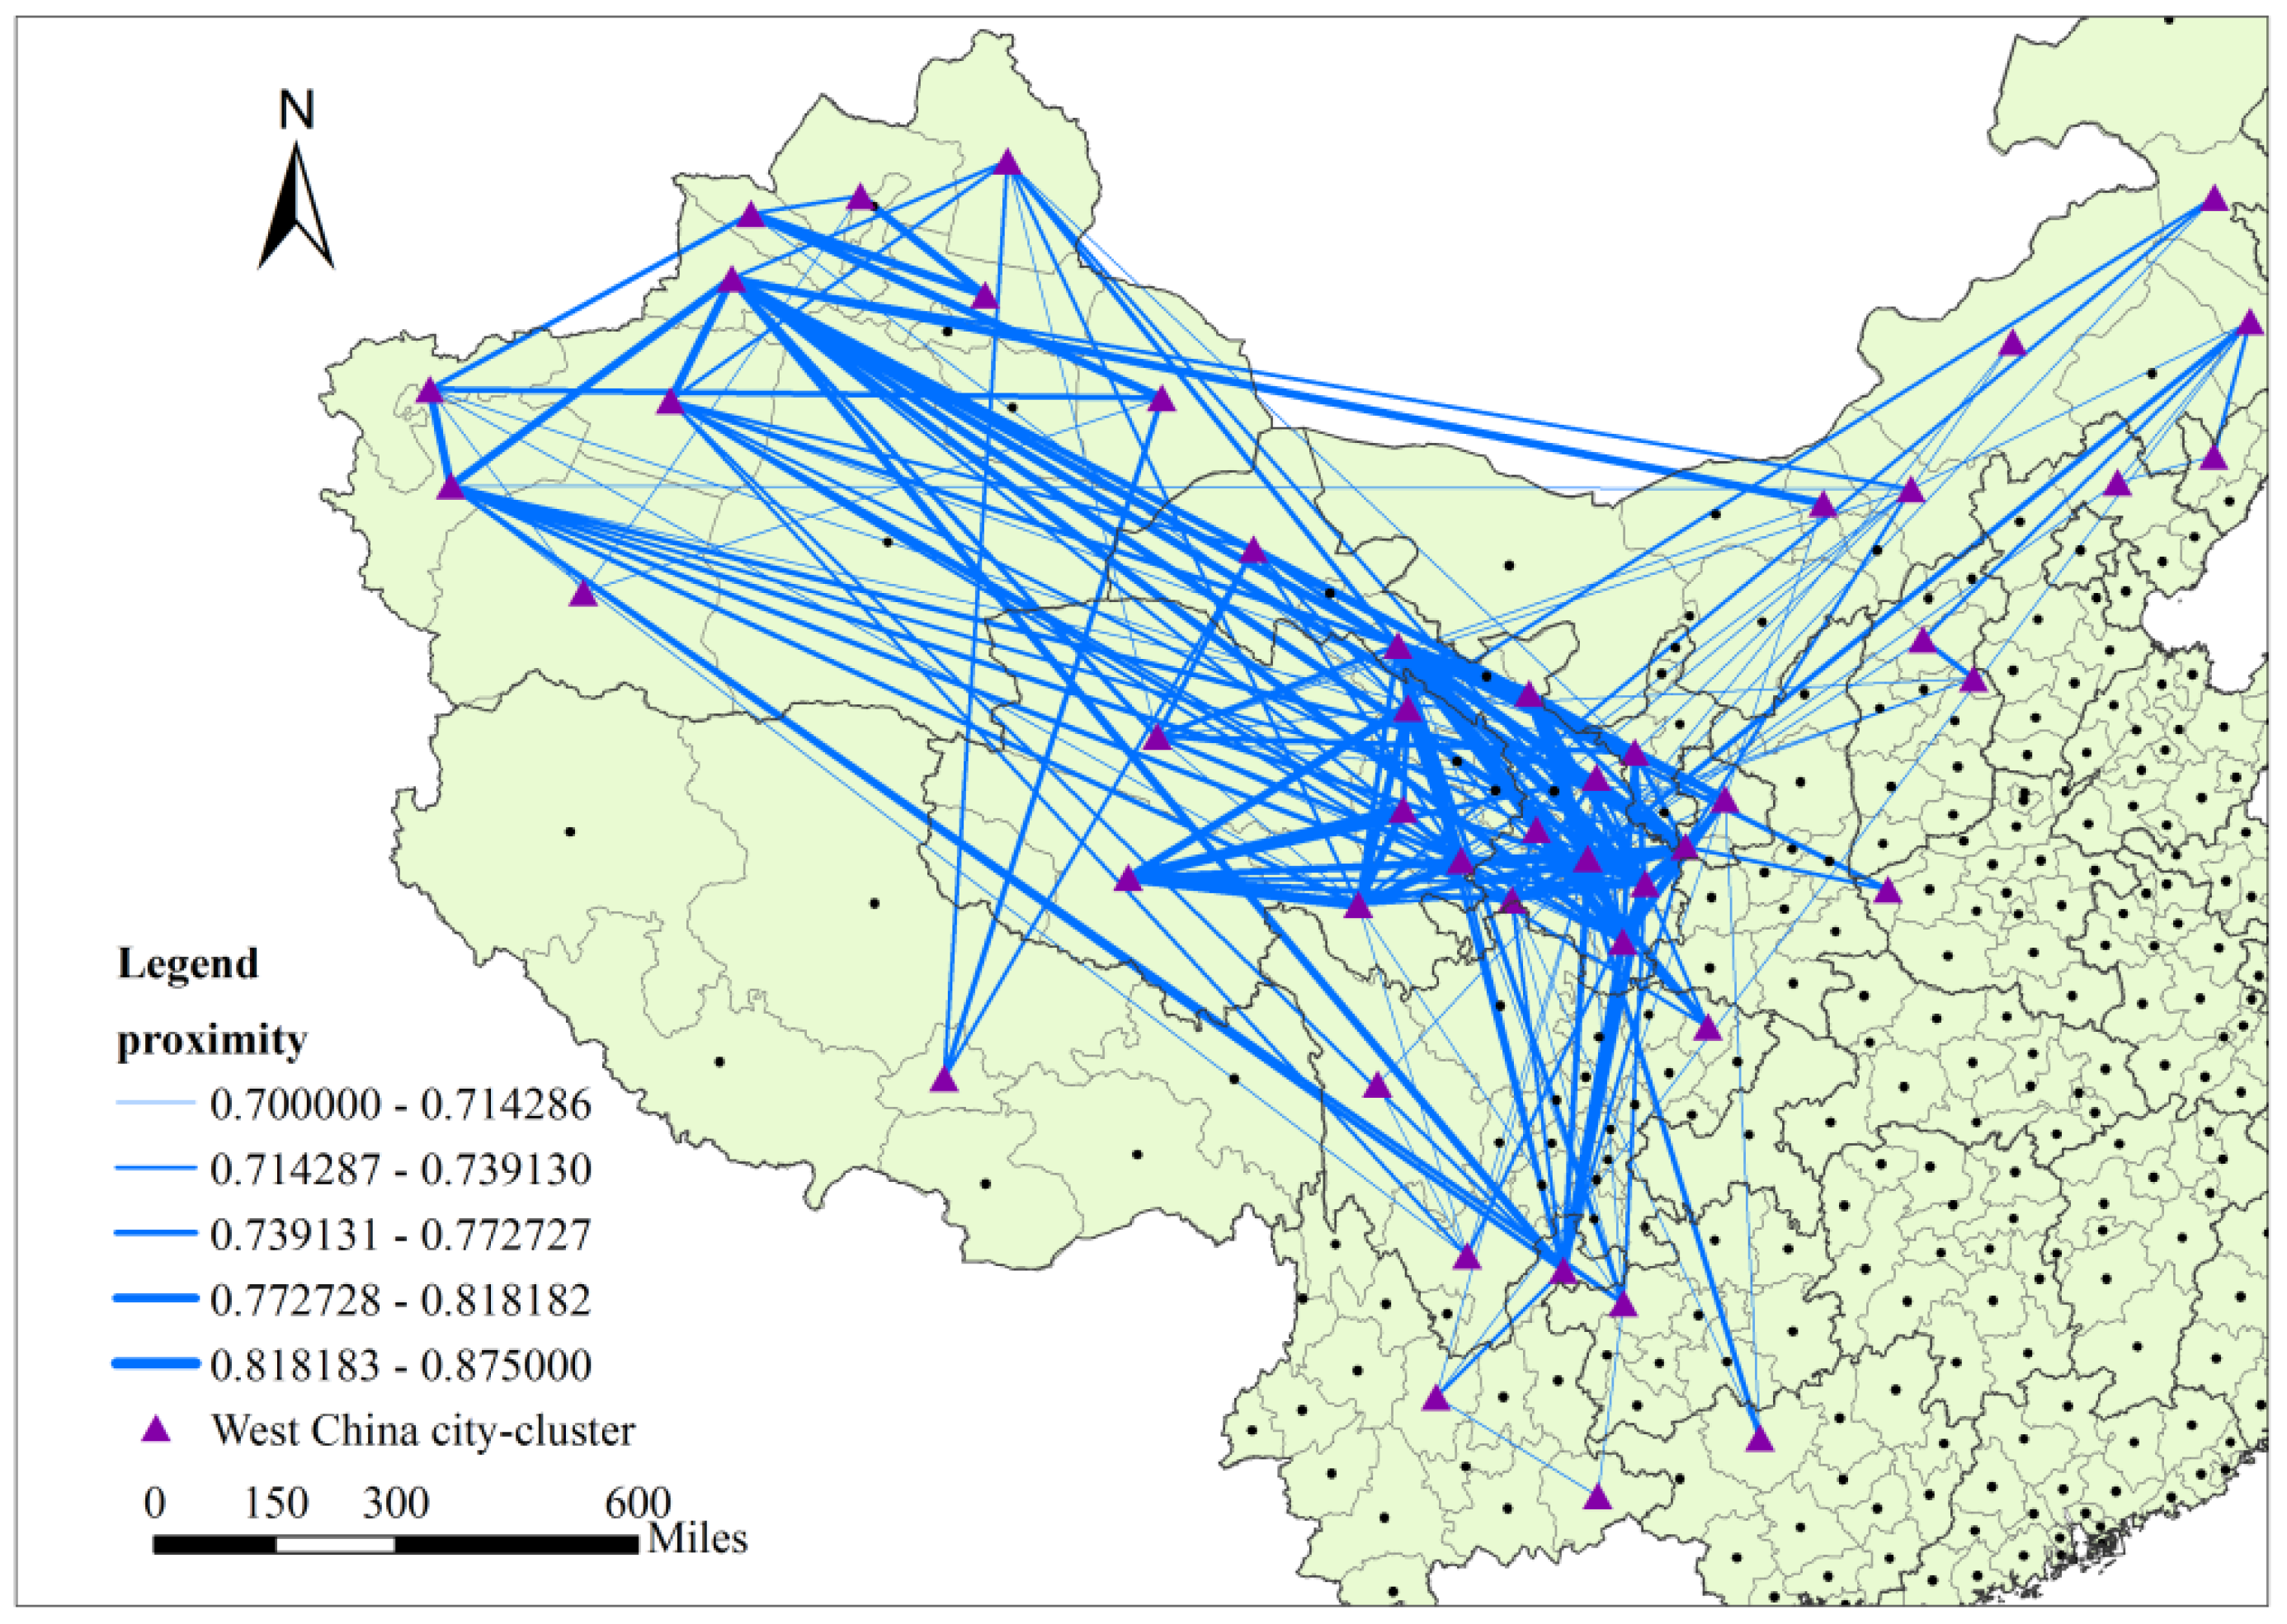
- The West China city-cluster. This cluster has the largest number of cities (47) and covers a broader geographical territory (Figure 9). It includes many major cities in west and southwest China and they are generally considered underdeveloped with the lowest development levels. The proximity values among these cities are commonly higher, especially in the provinces of Ningxia, Gansu, Qinghai, and Xinjiang. These cities share quite similar automobile market structures. Overall, cities in this group have a smaller urban economy and population.
4.4. Heterogeneity among City-Clusters
The means and coefficients of variation (CV) of major variables for all prefecture-level cities and for each of the four clusters are shown in Table 1, including the total car sales, population, GDP, per capita GDP, employed population, per capita disposable income of urban residents, as well as the proportion of foreign automakers, Sino-foreign joint ventures, and domestic automakers. The coefficient of variation (CV) was used to measure the degree of dispersion of each variable, independent of the variable’s measurement unit. Coefficients of variation of nearly all the variables are noticeably lower in each cluster than those for all the cities. The variables exhibit less variation within the cluster, indicating more homogeneity among cities in a cluster. Cities in the same cluster are likely to have similar consumer preference and purchasing capabilities, resulting in similar market structures measured by the index of proximity. The mean of each variable, except the proportion of car sales of domestic automakers, is the highest for the Southeast city-cluster. Both the average proportions of car sales of foreign automakers and Sino-foreign joint ventures are highest in the southeast cluster.
A high level of heterogeneity exists across four city-clusters in market structures. Table 1 also shows the statistics of the top 10 automakers that dominate city markets in each of the four clusters. The dominance of a manufacturer is measured by the percentage of cities that it gains revealed comparative advantage (RCA) out of all the cities in each city-cluster. Names of foreign automakers and domestic automakers are indicated by an asterisk (*) and a pound sign (#), respectively; the others are Sino-foreign joint ventures. In the Southeast developed city-cluster, the top 10 dominant manufacturers are all foreign-owned, with the exception of BMW Brilliance and Beijing-Benz which are high-end Sino-foreign joint ventures. In the other three city-clusters, as the socioeconomic status decreases, the top 10 dominant manufacturers change dramatically. The Sino-foreign joint ventures and Chinese manufacturers become the dominant brands. Chinese automakers, such as Geely, Chery, Great Wall, BYD, and Changan, become dominant, especially in the cities in the Northeast and West China city-clusters. For instance, the Geely automobile company is dominant in all the cities in the West China city-cluster and its biggest manufacturing base is located in Lanzhou in the middle of the cluster.
A linear discriminant analysis was performed to account for the heterogeneity among four clusters, with three statistically significant discriminant functions (variates) being calibrated. Table 2 presents the standardized discriminant function coefficients and Table 3 shows the centroid values (i.e., mean function scores) of each city-cluster on all three functions. Overall, the discriminant functions correctly classified 91.8% of the cities into one of the four city-clusters.
Two variables are strongly loaded onto Function 1, including per capita disposable income of urban residents and the proportion of car sales from foreign automakers. This function thus reflects the underlying dimension of “personal income” and corresponding purchasing preferences in automobile demand. Function 1 primarily distinguishes the Southeast developed city-cluster, with its high levels of personal income and sales of foreign-owned cars, from the other three clusters, particularly the West China city-cluster. This indicates that the similarity among cities within this group are mainly due to their common preference for these high-end cars and higher purchasing capability, despite the higher prices of these vehicles. In China, cars produced by foreign automakers and Sino-foreign joint automakers usually possess better performance and higher quality, hence higher prices, while the cars of domestic manufactures usually have the advantage of lower prices. Therefore, as urban residents’ economic status changes in different clusters, the proportion of car sales of different types of automakers changes accordingly. The lower economic status a cluster has (represented by lower per capita disposable income and purchasing capability), the lower proportion of car sales of foreign automakers and higher proportion of car sales of domestic automakers in the cluster, particularly in relatively underdeveloped regions such as western China. The distribution of higher-end and lower-end automobile markets in China is apparently related to the regional disparity in urban residents’ income level and purchasing capability.
The most important variable for Function 2 is the level of employment, along with per capita GDP and geographical location variables. The North China city-cluster is distinguished mostly from the Northeast city-cluster and the West China city-cluster by this function. The strong negative mean score of Function 2 for cities in the North China city-cluster is directly associated with the overall high employment and fine GDP levels. Many cities in this cluster are important industrial centers involving heavy industries, mining and energy industries, with significant amount of employment including those employed by state-owned enterprises. In addition, Changan automobile company, a domestic automaker with dominance in cities across North China, has a large manufacturing base in Baoding (Hebei province) located in the middle of this cluster. Function 2 is thus considered representing the underlying dimension of “industrial development”. The robust performance of these cities in this cluster in automobile sales, especially domestic automakers, echoes the general trend and relationship between demand for automobiles and overall economic development.
Function 3 is largely dominated by the dummy variable corresponding to northeastern China. It mainly discriminates the Northeast city-cluster from the rest of the clusters. The personal income level and other economic indicators are basically average for cities in this cluster. However, geographical and historical background makes this cluster quite distinguishable. The Northeast was one of the earliest regions to industrialize in China, and continued to be a major industrial base after the founding of the People’s Republic of China in 1949. Recent years, however, have seen the stagnation of Northeast China’s heavy-industry-based economy, as China’s economy continues to liberalize and privatize. The central government has initialized the Revitalizing the Northeast campaign to counter this problem. From the perspective of the automobile market, the FAW-Volkswagen Company has dominance in the cluster and produces cars in Changchun and Shenyang, which are very close to the cluster’s cities.
Other factors which are not directly revealed by statistical analyses but deemed to have an impact on regional clusters’ market structures could be associated with the fact that their products can meet special regional demands. For example, more consumers in Western China prefer buying SUVs because of the rugged topography and the relative lack of public transportation. The manufacturers, such as Ceely, Hawtai, Great Wall, and GAC-Changfeng with SUVs as their major products can sell more automobiles in western China. It is notable that foreign-owned manufacturers, such as Toyota, Hyundai and Mitsubishi also obtain noticeable dominance in the West China city-cluster, probably because their SUVs are in high demand in western China. Because the prices of these imported automobiles are usually higher, the fully foreign-owned manufacturers obtain dominance in smaller numbers of cities than their Chinese counterparts. However, in the North China city-cluster, consumers prefer energy-saving and inexpensive domestic automobiles because of flatter land and high-quality roads spread in the region.
Different levels of government in China have also played an important role in shaping the automobile market in different cities, by giving specific preferences towards certain manufacturers. Although the data regarding tax structures and automobile fees (registration) are not available in any Chinese statistical books or other sources, the influence on the automobile market from the government is significant and should be considered. For example, in order to promote the development of the automobile industry, local governments may not only provide preferential tax and registration convenience for the automakers, but may also regulate the brands and the models of cars in the process of government procurement. Besides, the providers for taxis in a city are also usually confined to some specific automakers by the rules of administrative agencies. In Jilin province, for instance, the vast majority of taxi vehicles in all nine prefecture-level cities are the Jetta model from FAW-Volkswagen, whose headquarters are located in Changchun, the capital city of Jilin province. Because the local government vehicles and taxis make up a considerable percentage of the market of a city, government preferences to some specific automakers also impact the market structure. If city governments in a region in the same province have the same automobile purchasing preference, they would very likely help foster similar city market structures.
5. Discussion
In sum, the emergence of city-clusters based on the proximity of market structures are closely related to China’s diverse regional backgrounds and characteristics. Cities in the same region tend to have similar automobile market structures, impacted by shared regional factors, such as demography, economy, politics, society, culture, and government regulations. Out of these factors, two leading themes can be highlighted as follows.
First, from the perspective of demand, economic factors play the central role in determining the demand of automobiles. The large automobile market derives from higher economic status and a better economy, suggesting that imported or higher-end Sino-foreign joint venture automobiles will be more popular in economically more developed regions. The opposite is also true. In addition, purchasing preference is influenced by regional geographical features and cultural background. For example, cities in western China prefer SUVs and some governments favor certain specific automobile brands. Furthermore, consumers prefer automobiles produced locally or close by, because they can usually acquire better after-sales service, such as faster and cheaper automobile maintenance, vehicle repair, and part replacement. Workers of the local manufacturers usually can get substantial discounts from their own companies, which encourages the workers to buy more automobiles of certain brands. This could impact the makeup of the regional automobile market.
Second, the location of an automaker affects its selling capability. Due to the geographical limits, the automakers tend to first penetrate the easier markets around them, due to their location advantages including brand awareness and cost saving. One of the reasons why the exclusively foreign-owned manufacturers obtain a greater market share in cities in the southeast coast area may also derive from the fact that there are more ports in this area to import automobiles and more convenient and effective logistics and distribution systems to guarantee that imported automobiles can be more readily supplied to the target markets.
However, there are a considerable number of cities located in Central China, including Hubei, Hunan and Jiangxi provinces which do not form city-clusters. This is probably due to this area being located in the middle of several important national automobile manufacturing bases, with overlapping manufacturers’ markets. There are currently six huge automobile manufacturing bases in China, including the Northeast area, the Yangtze Delta area, Shiyan-Wuhan in Hubei, Chongqing, the Zhujiang Delta area and the Beijing–Tianjin area. The competition among automakers in the cities in Central China is much more intense, leading to diverse market structures among cities, despite their geographical closeness.
The core method used in this study is an innovative application of the concept of ‘product space’ in geographical research. It is mainly reflected by the way we define and construct the proximity matrix among cities based on the RCA of automobile manufactures at the city level. In fact, a similarity matrix is often the first and crucial step to conduct a cluster analysis, as most existing literature attests. As an applied geographic study, we chose to pursue and identify city clusters through both visualizing links of proximities among cities and setting practical criteria or thresholds. We believe that comparing with classic cluster analysis, the approach used in this study presents some advantages. First, this approach focuses on the strongest proximities among cities and thus identifying the typical, representative and backbone geographical clustering pattern, while classic cluster analysis usually attempts to classify and group all the cities simultaneously and may make the spatial pattern of the city clusters hard to discern. Secondly, the underpinning and the result of city clustering from this study can be visualized directly in a map with proximities (links) between cities in each cluster distinctly outlined. This makes it easier to observe and examine the structure and general pattern of market relatedness among different cities. Besides, the definition of proximity as well as the practical threshold values for city clustering can be adjusted according to the specific product and the market in question, thus making this approach practically flexible in application. Although the proximity between cities and the spatial pattern of city clusters do not reflect the real connection among cities, it provides some inspiration to policy makers in the automobile industry and government. If an automaker has already obtained a stable market share in one city and aims to enter another city market, the proximity index between the two cities may provide an ideal tool to select the target city. On the other hand, if the government in a city hopes to exert some influence on the automobile markets, such as supporting the development of green cars, the successful policies of other cities in the same city cluster identified by the proximity indices might provide helpful foundations.
6. Conclusions
With China emerging as the largest automobile market in the world, comprehensive research of the Chinese automobile market structure is very important. This study, for the first time on this topic, visualizes and delineates the spatial pattern and characteristics of the automobile markets at the level of prefecture cities in mainland China using an innovative method. The complicated market structure of each city is simplified based on the notion of RCA. Proximities among cities in China are computed based on the RCA of each city to explore the similarities of city markets, resulting in some city-clusters being identified. The common characteristics of cities in each cluster and the differences among clusters are examined, and underlining factors are analyzed, based on a typical geographical research framework. Our study is also a creative and significant attempt to introduce the novel idea and method from other disciplines to the geographical study. Unlike other methods of previous research, the approach used in this study provides a simple, innovative way to visualize the similarity or relatedness of cities’ automobile markets. By observing the links of proximity in the map, the strongest links and clusters can be found and understood directly.
Overall, the following conclusions can be drawn. Most cities are different based on the proximities of their automobile markets, with no more than 1% of the total proximities between cities equal to or larger than 0.7.
Based on the top 10 proximities of each city and the distances among the cities, we conclude that higher proximity tends to appear at cities with shorter distance. In other words, if cities are similar to one another, it is more likely they are close in distance.
Four city-clusters across the country are identified, based on the rules that each city in a cluster must be connected with no less than two cities in the same cluster and with proximities equal or more than 0.7. They include the Southeast developed city-cluster, the North China city-cluster, the Northeast city-cluster and the West China city-cluster respectively. Cities in the same cluster display some common characteristics, such as socioeconomic status, location features, dominant automobile manufacturer brands, and potential development perspective, while these characteristics are obviously dissimilar among different city-clusters. The reason why cities in the same group display similar market structure is probably due to the fact they are impacted by similar factors, among which economic factors are the decisive ones. Developed cities, including cities in southeast coastal areas and some inland cities, have similar higher purchasing power and preferences for higher-end automobiles; thus, the manufacturers of higher quality, more comfortable, more expensive automobiles are more popular in these cities, including the exclusively foreign-owned enterprises or the higher-end Sino-foreign joint automakers. Moreover, the general regional market tendency is also related to other issues, such as regional physical characteristics, culture, and brand awareness of automakers. In addition, the locations of the manufacturers and government policy preference also impact the market structures.
To a large extent, the core finding of this research is that nearby cities tend to be more similar in their purchasing habits, coinciding with an old geographical rule, known as Tobler’s Law [34], which states that ’everything is related to everything else, but near things are more related to one another’. Besides, this study proposes a new approach to explore the most closely related neighbors based on the relatedness of automobile markets rather than all neighbors. The method to identify the clusters in this study is innovative, differing from other clustering approaches. Undeniably, the identification of the clusters and the discussion of the underlying mechanisms of formation of clusters need further statistical support. Conducting other clustering approaches and comparing different results based on proximity and similar matrices would be beneficial for this study. Moreover, a sensitivity analysis with different cut-off values for RCA could shed light on how robust our results would be. Further, a temporal analysis over a five- to ten-year window would be necessary to see if the patterns identified in this research are stable over time, and it could be a focus for further research.
Acknowledgments
This study was supported by the National Natural Science Foundation of China (Grant No. 41771161) and Strategic Planning Project from Institute of Northeast Geography and Agroecology (IGA), Chinese Academy of Sciences (Grant No. Y6H2091001-3)
Author Contributions
Wei Song and Daqian Liu conceived and designed the study; Daqian Liu and Xin Wen performed data analysis; Daqian Liu, Wei Song and Jia Lu analyzed the results and wrote the paper; Chunyan Xie provided key suggestions for the analysis and interpretation of the results. All authors have read and approved the final manuscript.
Conflicts of Interest
The authors declare no conflicts of interest.
References
- Hidalgo, C.A.; Klinger, B.; Barabási, A.-L.; Hausmann, R. The product space conditions the development of nations. Science 2007, 317, 482–487. [Google Scholar] [CrossRef] [PubMed]
- Thanasuta, K.; Patoomsuwan, T.; Chaimahawong, V.; Chiaravutthi, Y. Brand and country of origin valuations of automobiles. Asia Pac. J. Mark. Logist. 2009, 21, 355–375. [Google Scholar] [CrossRef]
- Wang, X.; Yang, Z. Does country-of-origin matter in the relationship between brand personality and purchase intention in emerging economies? Evidence from China’s auto industry. Int. Mark. Rev. 2008, 25, 458–474. [Google Scholar] [CrossRef]
- Wang, X.; Yang, Z.; Liu, N.R. The impacts of brand personality and congruity on purchase intention: Evidence from the Chinese mainland’s automobile market. J. Glob. Mark. 2009, 22, 199–215. [Google Scholar] [CrossRef]
- Deng, H.; Ma, A.C. Market structure and pricing strategy of China’s automobile industry. J. Ind. Econ. 2010, 58, 818–845. [Google Scholar] [CrossRef]
- Haque, A.; Anwar, N.; Yasmin, F.; Sarwar, A.; Ibrahim, Z.; Momen, A. Purchase intention of foreign products. SAGE Open 2015, 5. [Google Scholar] [CrossRef]
- Rits, V.; Kypreos, S.; Wokaun, A. Evaluating the diffusion of fuel-cell cars in the China markets. IATSS Res. 2004, 28, 34–46. [Google Scholar] [CrossRef]
- Qian, L.; Soopramanien, D. Using diffusion models to forecast market size in emerging markets with applications to the Chinese car market. J. Bus. Res. 2014, 67, 1226–1232. [Google Scholar] [CrossRef]
- Qian, L.; Soopramanien, D. Incorporating heterogeneity to forecast the demand of new products in emerging markets: Green cars in China. Technol. Forecast. Soc. 2015, 91, 33–46. [Google Scholar] [CrossRef]
- Huo, H.; Wang, M. Modeling future vehicle sales and stock in China. Energy Policy 2012, 43, 17–29. [Google Scholar] [CrossRef]
- Wan, Z.; Sperling, D.; Wang, Y. China’s electric car frustrations. Transp. Res. Part D 2015, 34, 116–121. [Google Scholar] [CrossRef]
- Liu, D.; Lo, K.; Song, W.; Xie, C. Spatial patterns of car sales and their socio-economic attributes in China. Chin. Geogr. Sci. 2017, 27, 684–696. [Google Scholar] [CrossRef]
- Cao, J.; Cao, X. The impacts of LRT, neighbourhood characteristics, and self-selection on auto ownership: Evidence from Minneapolis-St. Paul. Urban Stud. 2013, 51, 2068–2087. [Google Scholar] [CrossRef]
- Clark, B.; Chatterjee, K.; Melia, S. Changes in level of household car ownership: The role of life events and spatial context. Transportation 2016, 43, 565–599. [Google Scholar] [CrossRef]
- Oakil, A.T.M.; Manting, D.; Nijland, H. Determinants of car ownership among young households in the Netherlands: The role of urbanisation and demographic and economic characteristics. J. Transp. Geogr. 2016, 51, 229–235. [Google Scholar] [CrossRef]
- Weinberger, R.; Goetzke, F. Unpacking preference: How previous experience affects auto ownership in the United States. Urban Stud. 2010, 47, 2111–2128. [Google Scholar] [CrossRef]
- Hidalgo, C.A.; Hausmann, R. A network view of economic development. Dev. Altern. 2008, 12, 5–10. [Google Scholar]
- Felipe, J.; Kumar, U.; Abdon, A. How rich countries became rich and why poor countries remain poor: It’s the economic structure…duh! Jpn. World Econ. 2014, 29, 46–58. [Google Scholar] [CrossRef]
- Cruz, J.D.L.; Riker, D. Product Space Analysis of the Exports of Brazil; Working Paper No. 2012-06A; U.S. International Trade Commission Office of Economics: Washington, DC, USA, 2012. Available online: https://www.usitc.gov/publications/332/EC201206A.pdf (accessed on 27 February 2017).
- Kali, R.; Reyes, J.; McGee, J.; Shirrell, S. Growth networks. J. Dev. Econ. 2013, 101, 216–227. [Google Scholar] [CrossRef]
- Boschma, R.; Heimeriks, G.; Balland, P.-A. Scientific knowledge dynamics and relatedness in biotech cities. Res. Policy 2014, 43, 107–114. [Google Scholar] [CrossRef]
- Neffke, F.; Henning, M.; Boschma, R. How do regions diversify over time? Industry relatedness and the development of new growth paths in regions. Econ. Geogr. 2011, 87, 237–265. [Google Scholar] [CrossRef]
- Bahar, D.; Hausmann, R.; Hidalgo, C.A. Neighbors and the evolution of the comparative advantage of nations: Evidence of international knowledge diffusion? J. Int. Econ. 2014, 92, 111–123. [Google Scholar] [CrossRef]
- Piana, V. Proximity in Product Space and Diversification Strategies. Economic Web Institute. 2007. Available online: http://www.economicswebinstitute.org/essays/proximityproduct.htm (accessed on 27 February 2017).
- Klinger, T.; Kenworthy, J.R.; Lanzendorf, M. Dimensions of urban mobility cultures—A comparison of German cities. J. Transp. Geogr. 2013, 31, 18–29. [Google Scholar] [CrossRef]
- Charreire, H.; Weber, C.; Chaix, B.; Salze, P.; Casey, R.; Banos, A.; Badariotti, D.; Kesse-Guyot, E.; Hercberg, S.; Simon, C.; et al. Identifying built environmental patterns using cluster analysis and GIS: Relationships with walking, cycling and body mass index in French adults. Int. J. Behav. Nutr. Phys. 2012, 9, 59. [Google Scholar] [CrossRef] [PubMed] [Green Version]
- Longley, P.A.; Cheshire, J.A.; Mateos, P. Creating a regional geography of Britain through the spatial analysis of surnames. Geoforum 2011, 42, 506–516. [Google Scholar] [CrossRef]
- Guedes, A.S.; Jiménez, M.I.M. Spatial patterns of cultural tourism in Portugal. Tour. Manag. Perspect. 2015, 16, 107–115. [Google Scholar] [CrossRef]
- Wei, C.; Cabrera Barona, P.; Blaschke, T. A new look at public services inequality: The consistency of neighborhood context and citizens’ perception across multiple scales. ISPRS Int. J. Geo-Inf. 2017, 6, 200. [Google Scholar] [CrossRef]
- Zhou, D.; Xu, J.; Radke, J.; Mu, L. A spatial cluster method supported by GIS for urban-suburban-rural classification. Chin. Geogr. Sci. 2004, 14, 337–342. [Google Scholar] [CrossRef]
- Ribeiro, S.C.; Migliozzi, A.; Incerti, G.; Correia, T.P. Placing land cover pattern preferences on the map: Bridging methodological approaches of landscape preference surveys and spatial pattern analysis. Landsc. Urban Plan. 2013, 114, 53–68. [Google Scholar] [CrossRef]
- Von der Dunk, A.; Grêt-Regamey, A.; Dalang, T.; Hersperger, A.M. Defining a typology of peri-urban land-use conflicts—A case study from Switzerland. Landsc. Urban Plan. 2011, 101, 149–156. [Google Scholar] [CrossRef]
- Chen, N.; Akar, G. Effects of neighborhood types & socio-demographics on activity space. J. Transp. Geogr. 2016, 54, 112–121. [Google Scholar] [CrossRef]
- Tobler, W.R. A computer movie simulating urban growth in the Detroit region. Econ. Geogr. 1970, 46, 234–240. [Google Scholar] [CrossRef]
Figure 1.
Histograms of proximity.

Figure 2.
Histograms for the lengths of top 10 links of each city.
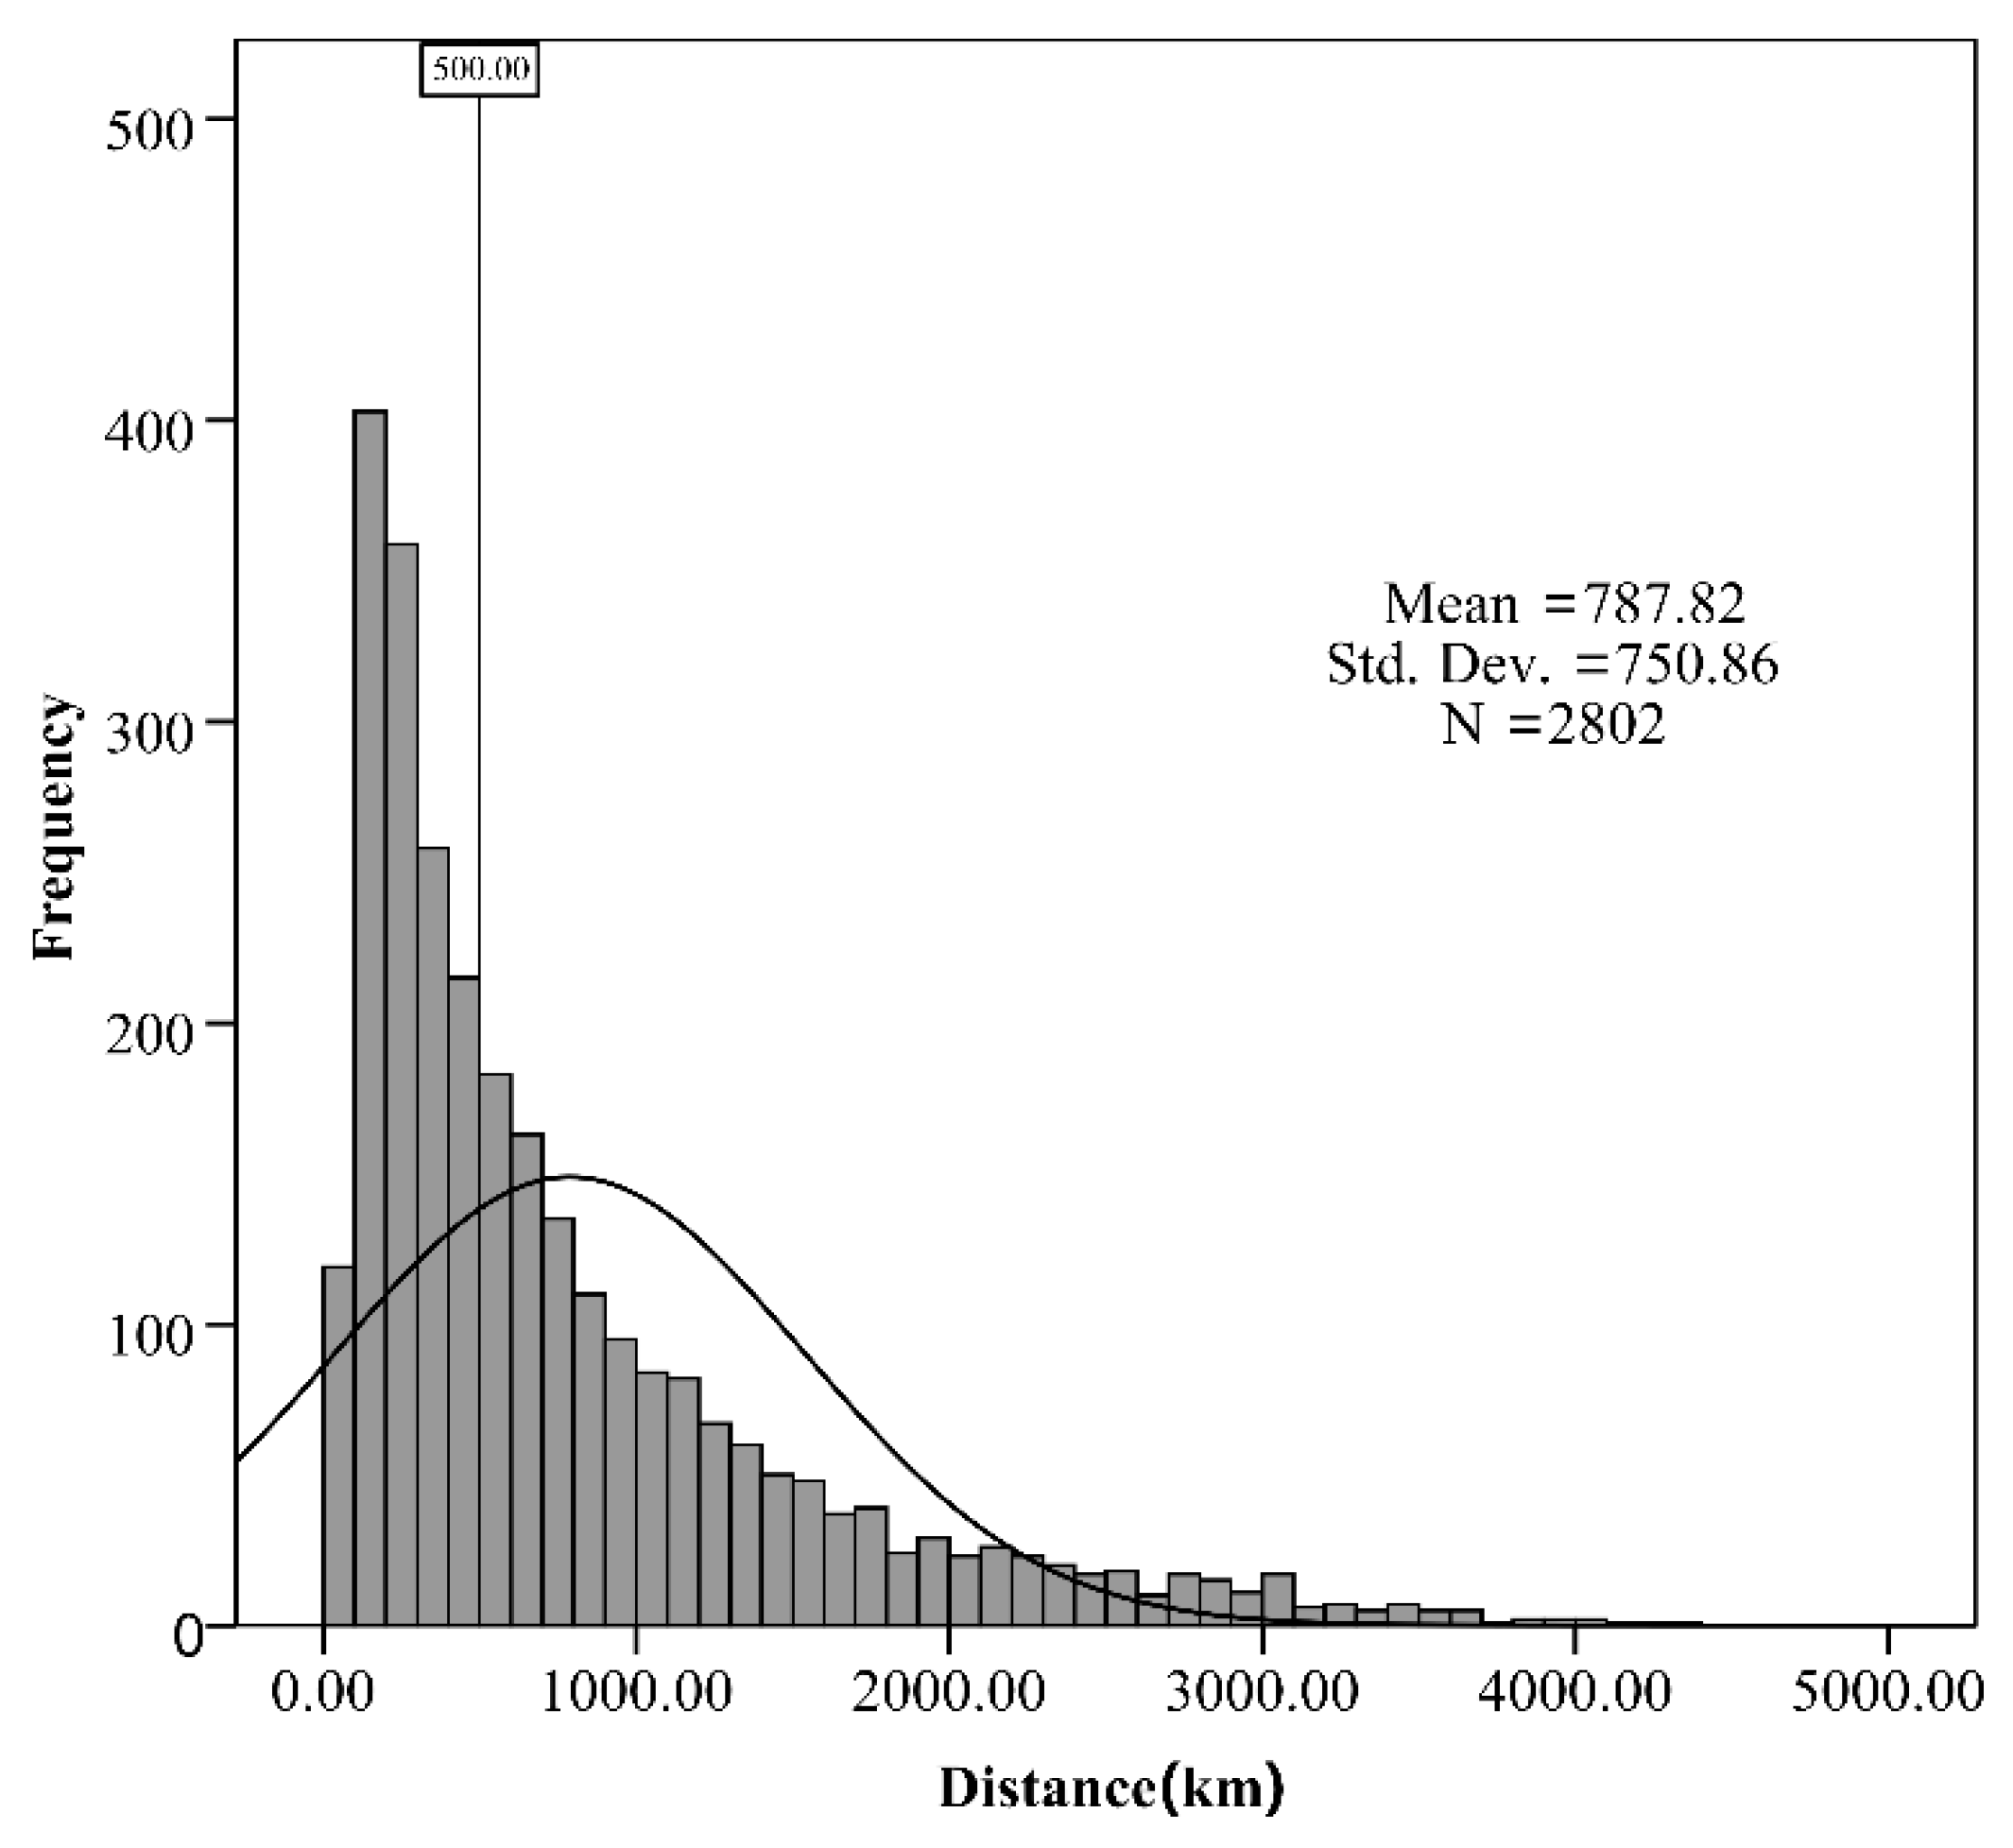
Figure 3.
Boxplot of distance and proximity.
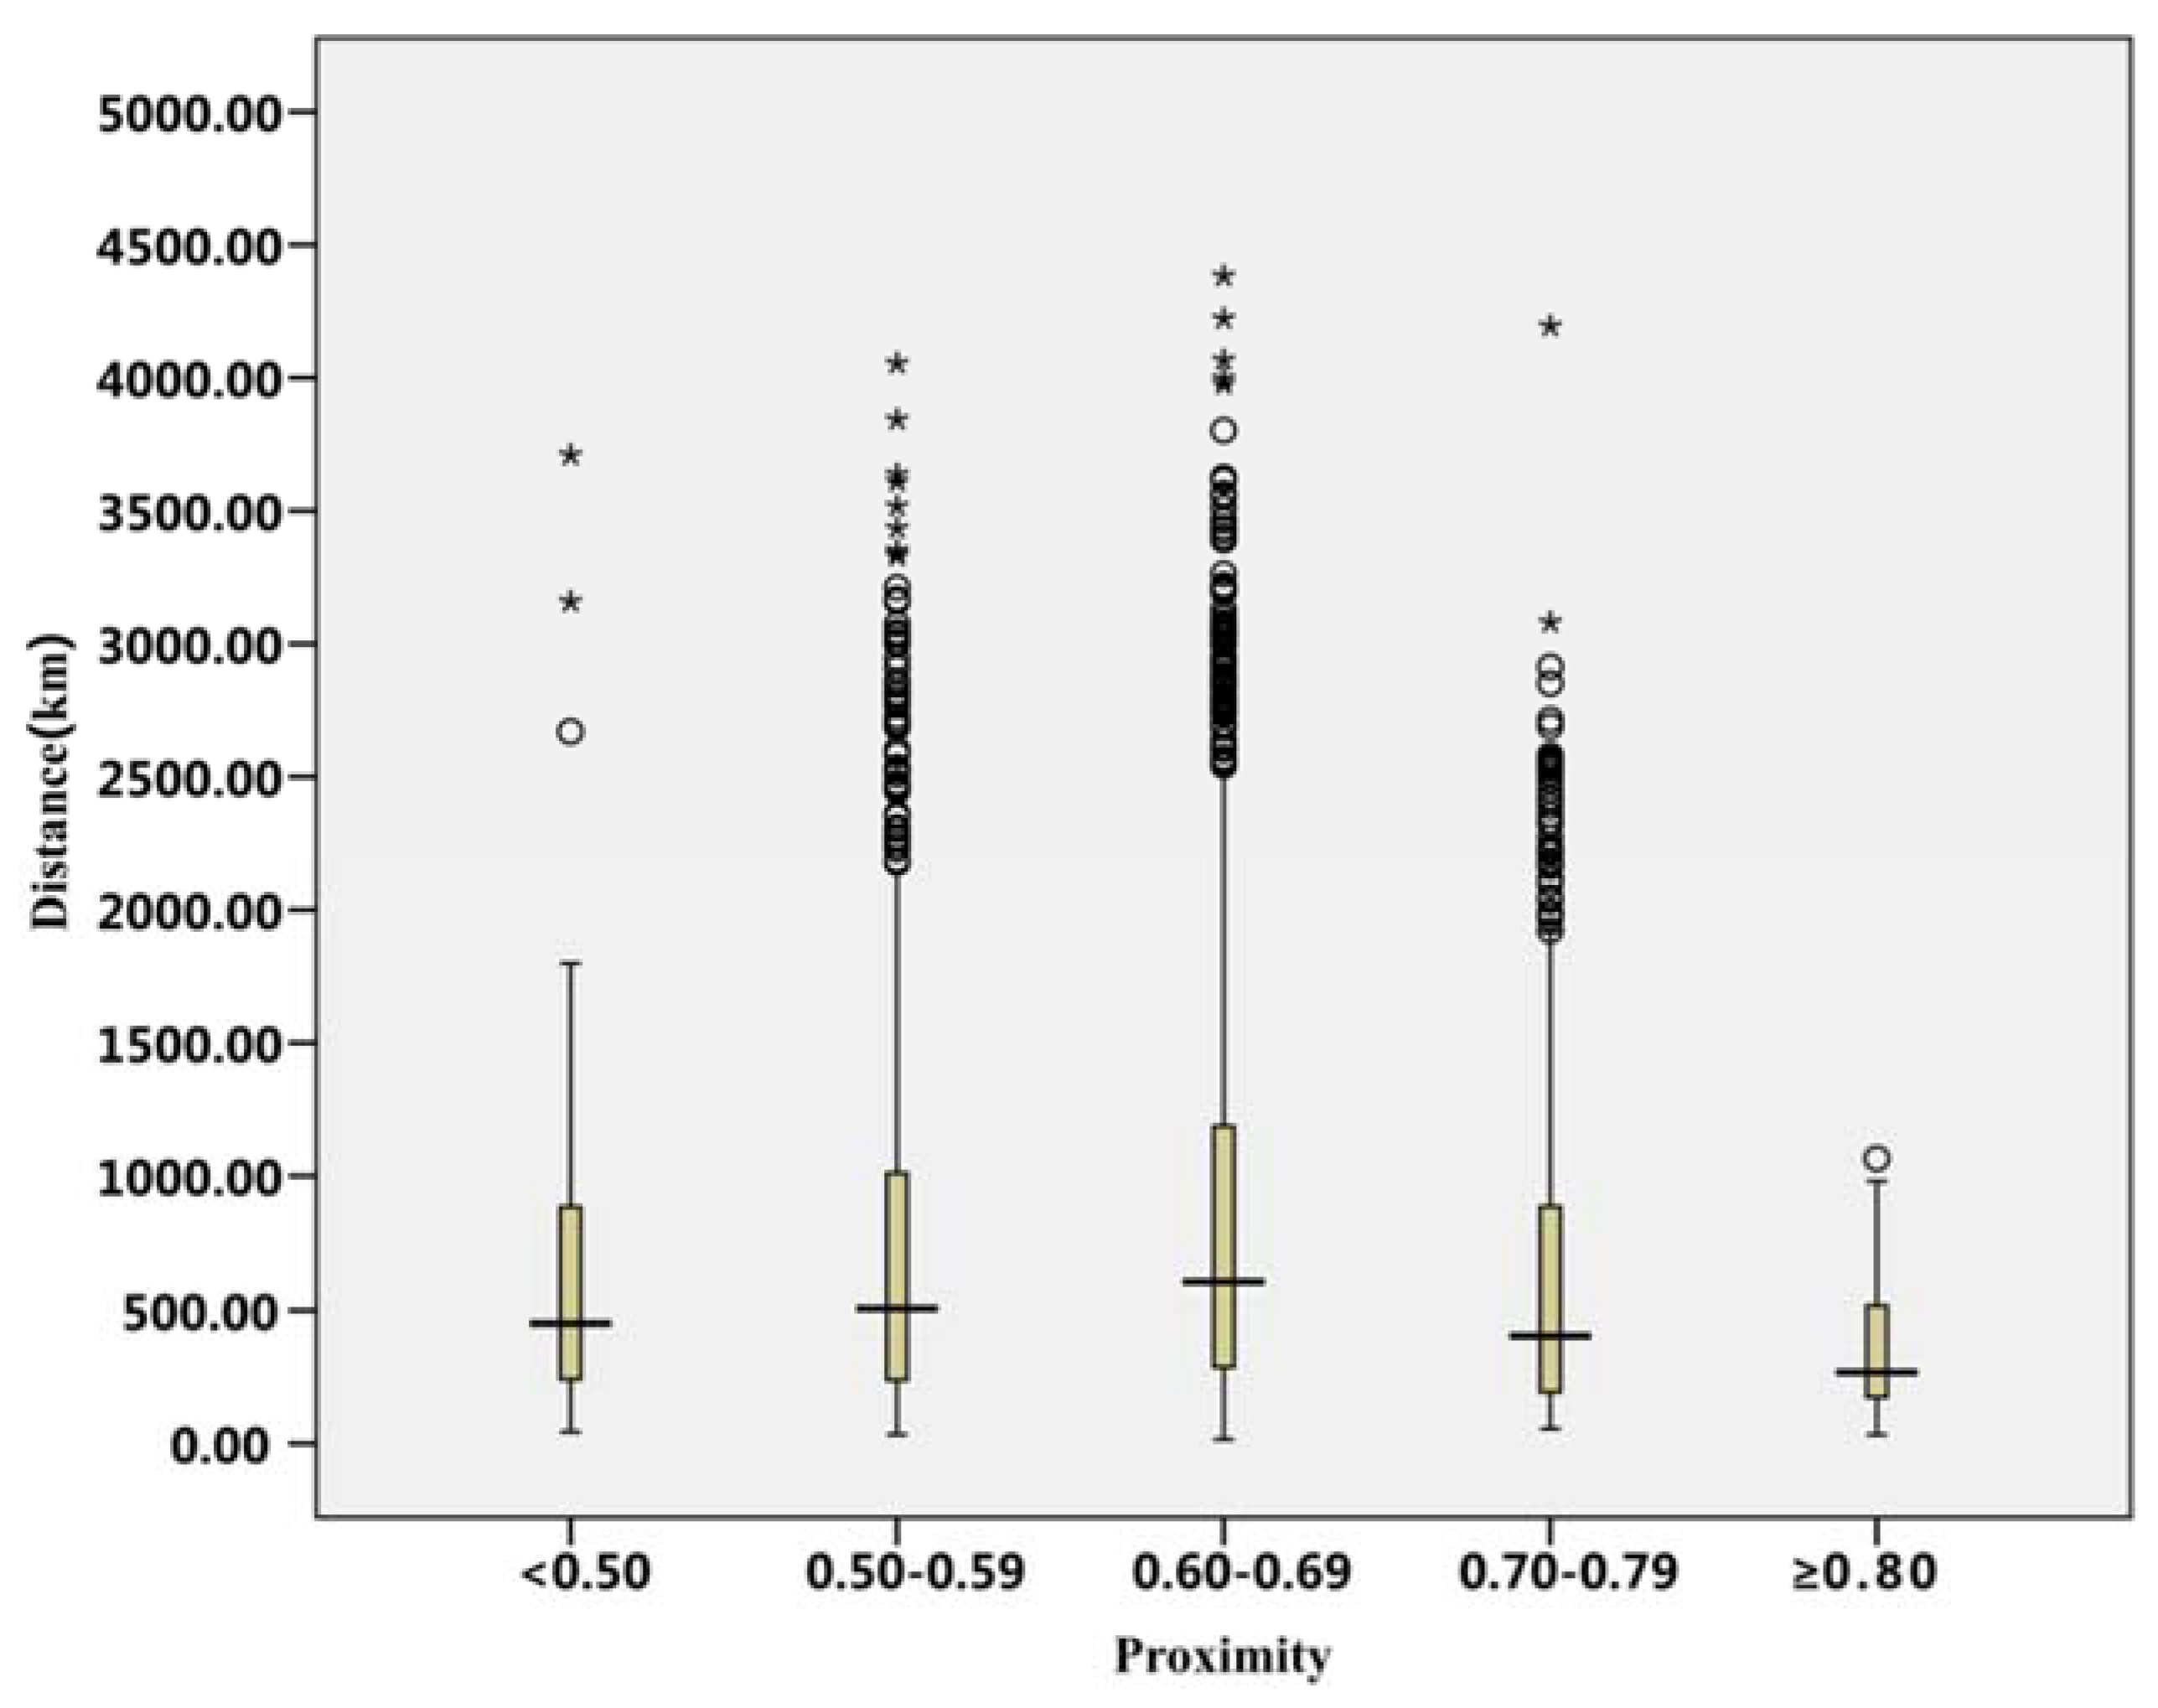
Figure 4.
Paneled pie charts of lengths of top 10 links.

Figure 5.
Four city-clusters based on the highest proximity values (≥0.7) in China.

Figure 6.
Southeast developed city-cluster.

Figure 7.
North China city-cluster.

Figure 8.
Northeast China city-cluster.

Figure 9.
West China city-cluster.


Table 1.
Mean and Coefficients of Variation (CV) of Variables.
| Variables | All the Prefecture Cities | Southeast City-Cluster | North China City-Cluster | Northeast City-Cluster | West China City-Cluster | |||||
|---|---|---|---|---|---|---|---|---|---|---|
| Mean | CV | Mean | CV | Mean | CV | Mean | CV | Mean | CV | |
| Total car sales | 38,798 | 147.95% | 145,039 | 77.58% | 47,424 | 62.39% | 19,019 | 36.50% | 11,465 | 75.54% |
| GDP (billion yuan) | 157.5 | 140.35% | 571.24 | 80.51% | 153.51 | 46.09% | 84.69 | 41.21% | 46.77 | 103.94% |
| Per capita GDP (yuan) | 36,902 | 68.59% | 73,189 | 31.90% | 29,019 | 30.66% | 31,017 | 34.84% | 25,835 | 82.16% |
| Population(million) | 3.96 | 81.91% | 7.746 | 65.67% | 5.483 | 42.06% | 2.830 | 38.31% | 2.062 | 67.90% |
| Employed population (million) | 2.32 | 81.84% | 4.68 | 56.31% | 3.32 | 46.08% | 1.46 | 39.69% | 1.14 | 77.71% |
| Per capita disposable income of urban residents (yuan) | 19,011 | 27.22% | 30,310 | 16.10% | 18,826 | 12.53% | 16,799 | 13.75% | 15,650 | 18.86% |
| Proportion of car sales of foreign automakers (%) | 5.76 | 50.89% | 11.79 | 16.68% | 2.79 | 29.29% | 4.17 | 20.42% | 4.16 | 36.23% |
| Proportion of car sales of Sino-foreign joint ventures (%) | 64.40 | 14.22% | 72.82 | 3.69% | 63.62 | 6.84% | 60.16 | 8.32% | 54.15 | 17.06% |
| Proportion of car sales of domestic automakers (%) | 29.84 | 33.40% | 15.39 | 16.35% | 33.59 | 13.93% | 35.67 | 15.60% | 41.69 | 22.90% |
| Top 10 Manufacturers with Dominance in each cluster | 1. BMW *; 2. Mercedes-Benz *; 3. BMW Brilliance; 4. Beijing-Benz; 5. Volkswagen *; 6. Audi *; 7. Lexus *; 8. Mini *; 9. Infiniti *; 10. Porsche * | 1. Changan #; 2. Changhe-Suzuki; 3. Chery #; 4. SGMW; 5. Geely #; 6. Beijing-Hyundai; 7. Great Wall #; 8. FAW-Haima; 9. BYD #; 10. DYK | 1. FAW-Volkswagen; 2. Chery #; 3. Tianjin-FAW; 4. Brilliance #; 5. Great Wall #; 6. BYD #; 7. Changan-Suzuki; 8. Toyota; 9. Beijing-Hyundai; 10. Geely # | 1. Geely #; 2. Hawtai #; 3. Great Wall #; 4. GAC-Changfeng #; 5. Lifan #; 6. Beijing-Hyundai; 7. Chery #; 8. Toyota; 9. Hyundai; 10. Mitsubishi | ||||||
Table 2.
Standardized Canonical Discriminant Function Coefficients.
| Variables | Function 1 | Function 2 | Function 3 |
|---|---|---|---|
| Per capita disposable income of urban residents | −0.374 | −0.030 | 0.054 |
| Employed population | 0.060 | −0.444 | −0.048 |
| Per capita GDP | 0.217 | −0.086 | −0.069 |
| Proportion of car sales of foreign automakers | −0.834 | 0.049 | −0.088 |
| West | 0.493 | 0.798 | −0.289 |
| Northeast | 0.164 | 0.426 | 0.871 |
| Middle | 0.338 | −0.073 | −0.184 |
Table 3.
Functions at Group Centroids.
| Group | Function 1 | Function 2 | Function 3 |
|---|---|---|---|
| Southeast | −5.248 | 0.226 | −0.201 |
| North China | 1.200 | −2.317 | −0.117 |
| Northeast | 0.933 | 0.963 | 4.143 |
| West China | 1.836 | 1.469 | −0.762 |
© 2018 by the authors. Licensee MDPI, Basel, Switzerland. This article is an open access article distributed under the terms and conditions of the Creative Commons Attribution (CC BY) license (http://creativecommons.org/licenses/by/4.0/).
Share and Cite
MDPI and ACS Style
Liu, D.; Song, W.; Lu, J.; Xie, C.; Wen, X. A New Geographical Cluster View on Passenger Vehicle Purchasing in Chinese Cities. ISPRS Int. J. Geo-Inf. 2018, 7, 9. https://0-doi-org.brum.beds.ac.uk/10.3390/ijgi7010009
AMA Style
Liu D, Song W, Lu J, Xie C, Wen X. A New Geographical Cluster View on Passenger Vehicle Purchasing in Chinese Cities. ISPRS International Journal of Geo-Information. 2018; 7(1):9. https://0-doi-org.brum.beds.ac.uk/10.3390/ijgi7010009
Chicago/Turabian StyleLiu, Daqian, Wei Song, Jia Lu, Chunyan Xie, and Xin Wen. 2018. "A New Geographical Cluster View on Passenger Vehicle Purchasing in Chinese Cities" ISPRS International Journal of Geo-Information 7, no. 1: 9. https://0-doi-org.brum.beds.ac.uk/10.3390/ijgi7010009
Note that from the first issue of 2016, this journal uses article numbers instead of page numbers. See further details here.