Mapping Frictions Inhibiting Bicycle Commuting


GEOTEC, Institute of New Imaging Technologies, Universitat Jaume I, 12071 Castellón de la Plana, Spain
*
Author to whom correspondence should be addressed.
†
Current address: Avda. Sos Baynat S/N, 12071 Castelló de la Plana, Spain.
‡
These authors contributed equally to this work.
ISPRS Int. J. Geo-Inf. 2018, 7(10), 396; https://0-doi-org.brum.beds.ac.uk/10.3390/ijgi7100396
Submission received: 16 July 2018
/
Revised: 11 September 2018
/
Accepted: 27 September 2018
/
Published: 3 October 2018
(This article belongs to the Special Issue Human-Centric Data Science for Urban Studies)
Abstract
:Urban cycling is a sustainable transport mode that many cities are promoting. However, few cities are taking advantage of geospatial technologies to represent and analyse cycling mobility based on the behavioural patterns and difficulties faced by cyclists. This study analyses a geospatial dataset crowdsourced by urban cyclists using an experimental, mobile geo-game. Fifty-seven participants recorded bicycle trips during one week periods in three cities. By aggregating them, we extracted not only the cyclists’ preferred streets but also the frictions faced during cycling. We successfully identified 284 places potentially having frictions: 71 in Münster, Germany; 70 in Castelló, Spain; and 143 in Valletta, Malta. At such places, participants recorded bicycle segments at lower speeds indicating a deviation from an ideal cycling scenario. We describe the potential frictions inhibiting bicycle commuting with regard to the distance to bicycle paths, surrounding infrastructure, and location in the urban area.
1. Introduction
Bicycling is an excellent complement to urban transport modes, and so many cities worldwide have created campaigns to encourage commuter cycling [1,2]. Mobility conditions, traffic, and pollution are forcing people to leave cars at home, and cities to provide and promote alternative modes of transport. However, most pro-cycling policies seem to follow a traditional top-down approach involving high-level city-driven campaigns, but do not focus on needs of individual cyclists [3,4,5].
Due to the high availability of mobile devices equipped with location-based technologies (such as sensors for global navigation systems), it is easier to collect cycling data and, therefore, understand spatial mobility patterns. These technologies are capable of identifying not only position and behavioural patterns but also the obstacles or frictions forcing cyclists to deviate from their desired routes or, worse, never begin commuting by bike. Equally as important as the geospatial technology capacities, researchers lack common definitions of the typical obstacles urban cyclists face. The impact of obstacles, or what we term “frictions”, on bicycle commuting has been largely unexplored in the research literature.
Cycling’s integration with mobile monitoring and performance enhancement devices is well established, in developed countries, but mainly for sporting purposes rather than for commuters. This motivated us to explore the analysis of urban cycling patterns from crowdsourced location information and to develop tools for fostering bottom-up and data-driven policies for promotion of urban cycling. This is seen as a modest contribution to cities’ efforts to become more open, green, smarter and aware of local urban dynamics.
This study aims to identify, map and analyse the frictions which potentially inhibit bicycle commuting, and the places where they can be found. Our goal was to programmatically identify and classify these frictions and, by doing so, support data-driven policy-making in favour of urban cycling. Identifying frictions inhibiting bicycle commuting could help in the prioritisation of new or improved cycling infrastructure (i.e., create, expand or relocate bicycle paths), the definition traffic calming areas, or the integration of public transport and bicycles.
We analysed crowdsourced bicycle trips in three different cycling environments, from an almost non-existent one in Valletta Malta to an evolving plan in Castelló Spain, and the internationally recognised pro-cycling environment in Münster Germany. The analysis started with the set of trip segments from these cities recorded using a mobile gamified application during the autumn of 2017. We classified such segments based on speed, into walking segments (less than 5 km/h) and cycling segments (between 10 and 50 km/h). Then, using a hexagonal grid overlay and comparing the proportion of walking and cycling segments in each cell, we identified 284 locations with potential frictions inhibiting bicycle commuting: 71 in Münster; 70 in Castelló; and 143 in Valletta. Finally, we classified and described the identified frictions based on the distances to trip origin, destination, and bicycle paths, as well as the location within the urban area, surrounding city infrastructure, and landmarks.
This article continues by reviewing related work, description of the crowdsourced datasets, and the methodology for the identification of frictions. Next, we describe the places with frictions inhibiting bicycle commuting, cycling patterns, and the use of bicycle paths. A final discussion covers four main topics: the concept of friction, grid-based analysis, sample size, and method replication, prior to concluding the paper with the study limitations, conclusions and recommendations.
2. Related Work
The analysis of cycling conditions is usually found in transport engineering or transport planning studies [1,6]. Transport analysis typically refers to optimising either the movement of people and goods or the resources impacted by such a task, for example, urban space, fuel, air quality, noise, among others [7]. City transport plans provided the primary diagnosis of cycling conditions at the three cities of the study and are the components of national and regional cycling statistics [8,9]. An example of how city transport plans feed broader studies is the analysis of “100 years of urban cycling policy, use, and practice in 14 European cities in 9 countries” [1], which summarised the role of bicycles, their relevance before the 1950s automobile revolution, and its rebirth during the last two decades. Multiple cycling studies have used the cities of Copenhagen [10] or Amsterdam [5] as a reference.
In general, transport planning has marginalised urban cycling, and authors such as Koglin and Rye [6] have highlighted the poor development of the theoretical basis for cycling planning in comparison with planning for motorised traffic. The cycling studies usually either compare people and places with a cross-sectional approach, or measure the conditions before and after urban interventions [2]. The results of such studies are usually too general and not site-specific; for example, they refer to the convenience of protected cycling facilities especially for women, children, seniors, and also for risk-averse cyclists on roads with motor vehicles [11]. Additionally, the studies and scientific reviews commonly refer to the need for more detailed cycling data [6].
Sustainable transport such as cycling promises to benefit cities and urban areas and provide alternatives to traditional transport modes due to fewer requirements for adoption and lower maintenance costs [11,12]. To comprehend mobility based on physical activity or active mobility researchers have synthesised indexes for the restrictions faced by pedestrians, lately called “walkability” indexes [13]. More recently, researchers expanded that idea to cycling by considering infrastructure, interaction with motorised vehicles, and cultural adoption across cities [14,15].
Safety, a broad category expressed as the potential for collision with motorised vehicles, risk of injury, perceived danger, risk, among other terms, is the common restriction or barrier inhibiting cycling presented across the literature. In addition to safety, researchers referred to other elements impeding access, causing discomfort or delays during cycling. For example, Fishman et al. [16] highlighted weather and topography while Flügel et al. [17] identified the number of stops or turns-off during a trip and the pavement quality. The constant trade-off between effort and benefits of cycling also helped to define frictions, especially when having disconnected cycling infrastructure [18], road crossings or intersections [19]. However, the spatial location of such barriers within the city is not present or is coarsely analysed in cycling research.
Cycling research has also benefited from the relationship with walking, its popularity and convenience for increasing physical activity [20,21] as well as from the extensive analysis of its medical implications [21]. For our research, we used existing measurements for walking speed, “ranged from 4.58 km/h (127.2 cm/s) for women in their seventies to 5.26 km/h (146.2 cm/s) for men in their forties” [22], and cycling speed “ranged between 12 and 20 km/hour” [23] which strongly depends on the urban conditions.
There are multiple alternatives to promote urban cycling in cities, going from traditional means of communication to technology-based strategies using mobile or web applications. Despite the lack of research dealing with the use of mobile applications to promote urban cycling [24], other related studies have dealt with technology-based engagement. Several experiences with gamification, a well-known practice of using game elements to enhance a service with affordances for gameful experiences in non-gaming contexts [25,26], and the related products—location-based games or geo-games—have used technology to encourage behavioural change including promoting physical activity [27,28,29,30].
There is a growing market of cycling applications for mobile phones which adopted gamification techniques to encourage increased physical activity as well as to crowdsource cycling data collection. Such an approach seemed more effective at attracting new users willing to generate cycling data than other web-based tools like OpenCycleMap, the cycling version of OpenStreetMap [31,32]. Some of these applications emphasise social interaction and cycling performance, such as Strava [33] or Endomondo [34], while others directly focus on crowdsourced data collection such as Wikiloc [35]. Location-based services are a key component of current cycling applications which allowed researchers to explore visualisation and analysis of cycling data mostly with the tools used for analysing motorised transportation [36,37,38].
For the geospatial analysis of bicycle trips, many researchers used map-matching, a popular technique which aggregates and simplifies trajectories using a spatial object as a reference to collapse and link trip lines to the closest street axis [39]. Three types of map-matching procedures have been defined: generic, topological and statistical. There are various examples of map-matching applied to the analysis of cycling such as the work of Snizek et al. [40] aggregating bicycle trip sketches from 890 participants with the location of positive and negative experiences, the simplification of bicycle trip trajectories recorded by GPS [41,42], or the definition of cycling boundaries from bicycle trips [43]. Other studies have sought to extend the idea of map matching using grids to not only integrate additional variables but specifically to provide higher spatial resolution for phenomena happening at spots within the streets [44] or in open areas outside of the street network.
The interest in geospatial features of bicycle trips is not exclusive to researchers. Citizens often are interested in discovering preferred cycling routes. Some mobile applications offer cycling activity heat-maps [45] as the de facto visualisation. The Strava Global Heatmap [46] and the Polar global Activity Map [47] are popular examples of the of heat-map visualization. Nevertheless, creation of novel interactive maps are not usually the core of cycling applications; instead, they usually adopt mainstream services such as Mapbox, Google or Apple Maps [32,40,48].
Unfortunately, cycling application developers and cities are not linked. Very little cycling and transport information is offered for policy makers and transport analysts [49,50,51,52]. The considerable potential for cycling data-driven policy-making fed by human sensors and mobile phone information [53,54,55] is hampered by the lack of precise information.
3. Study Area
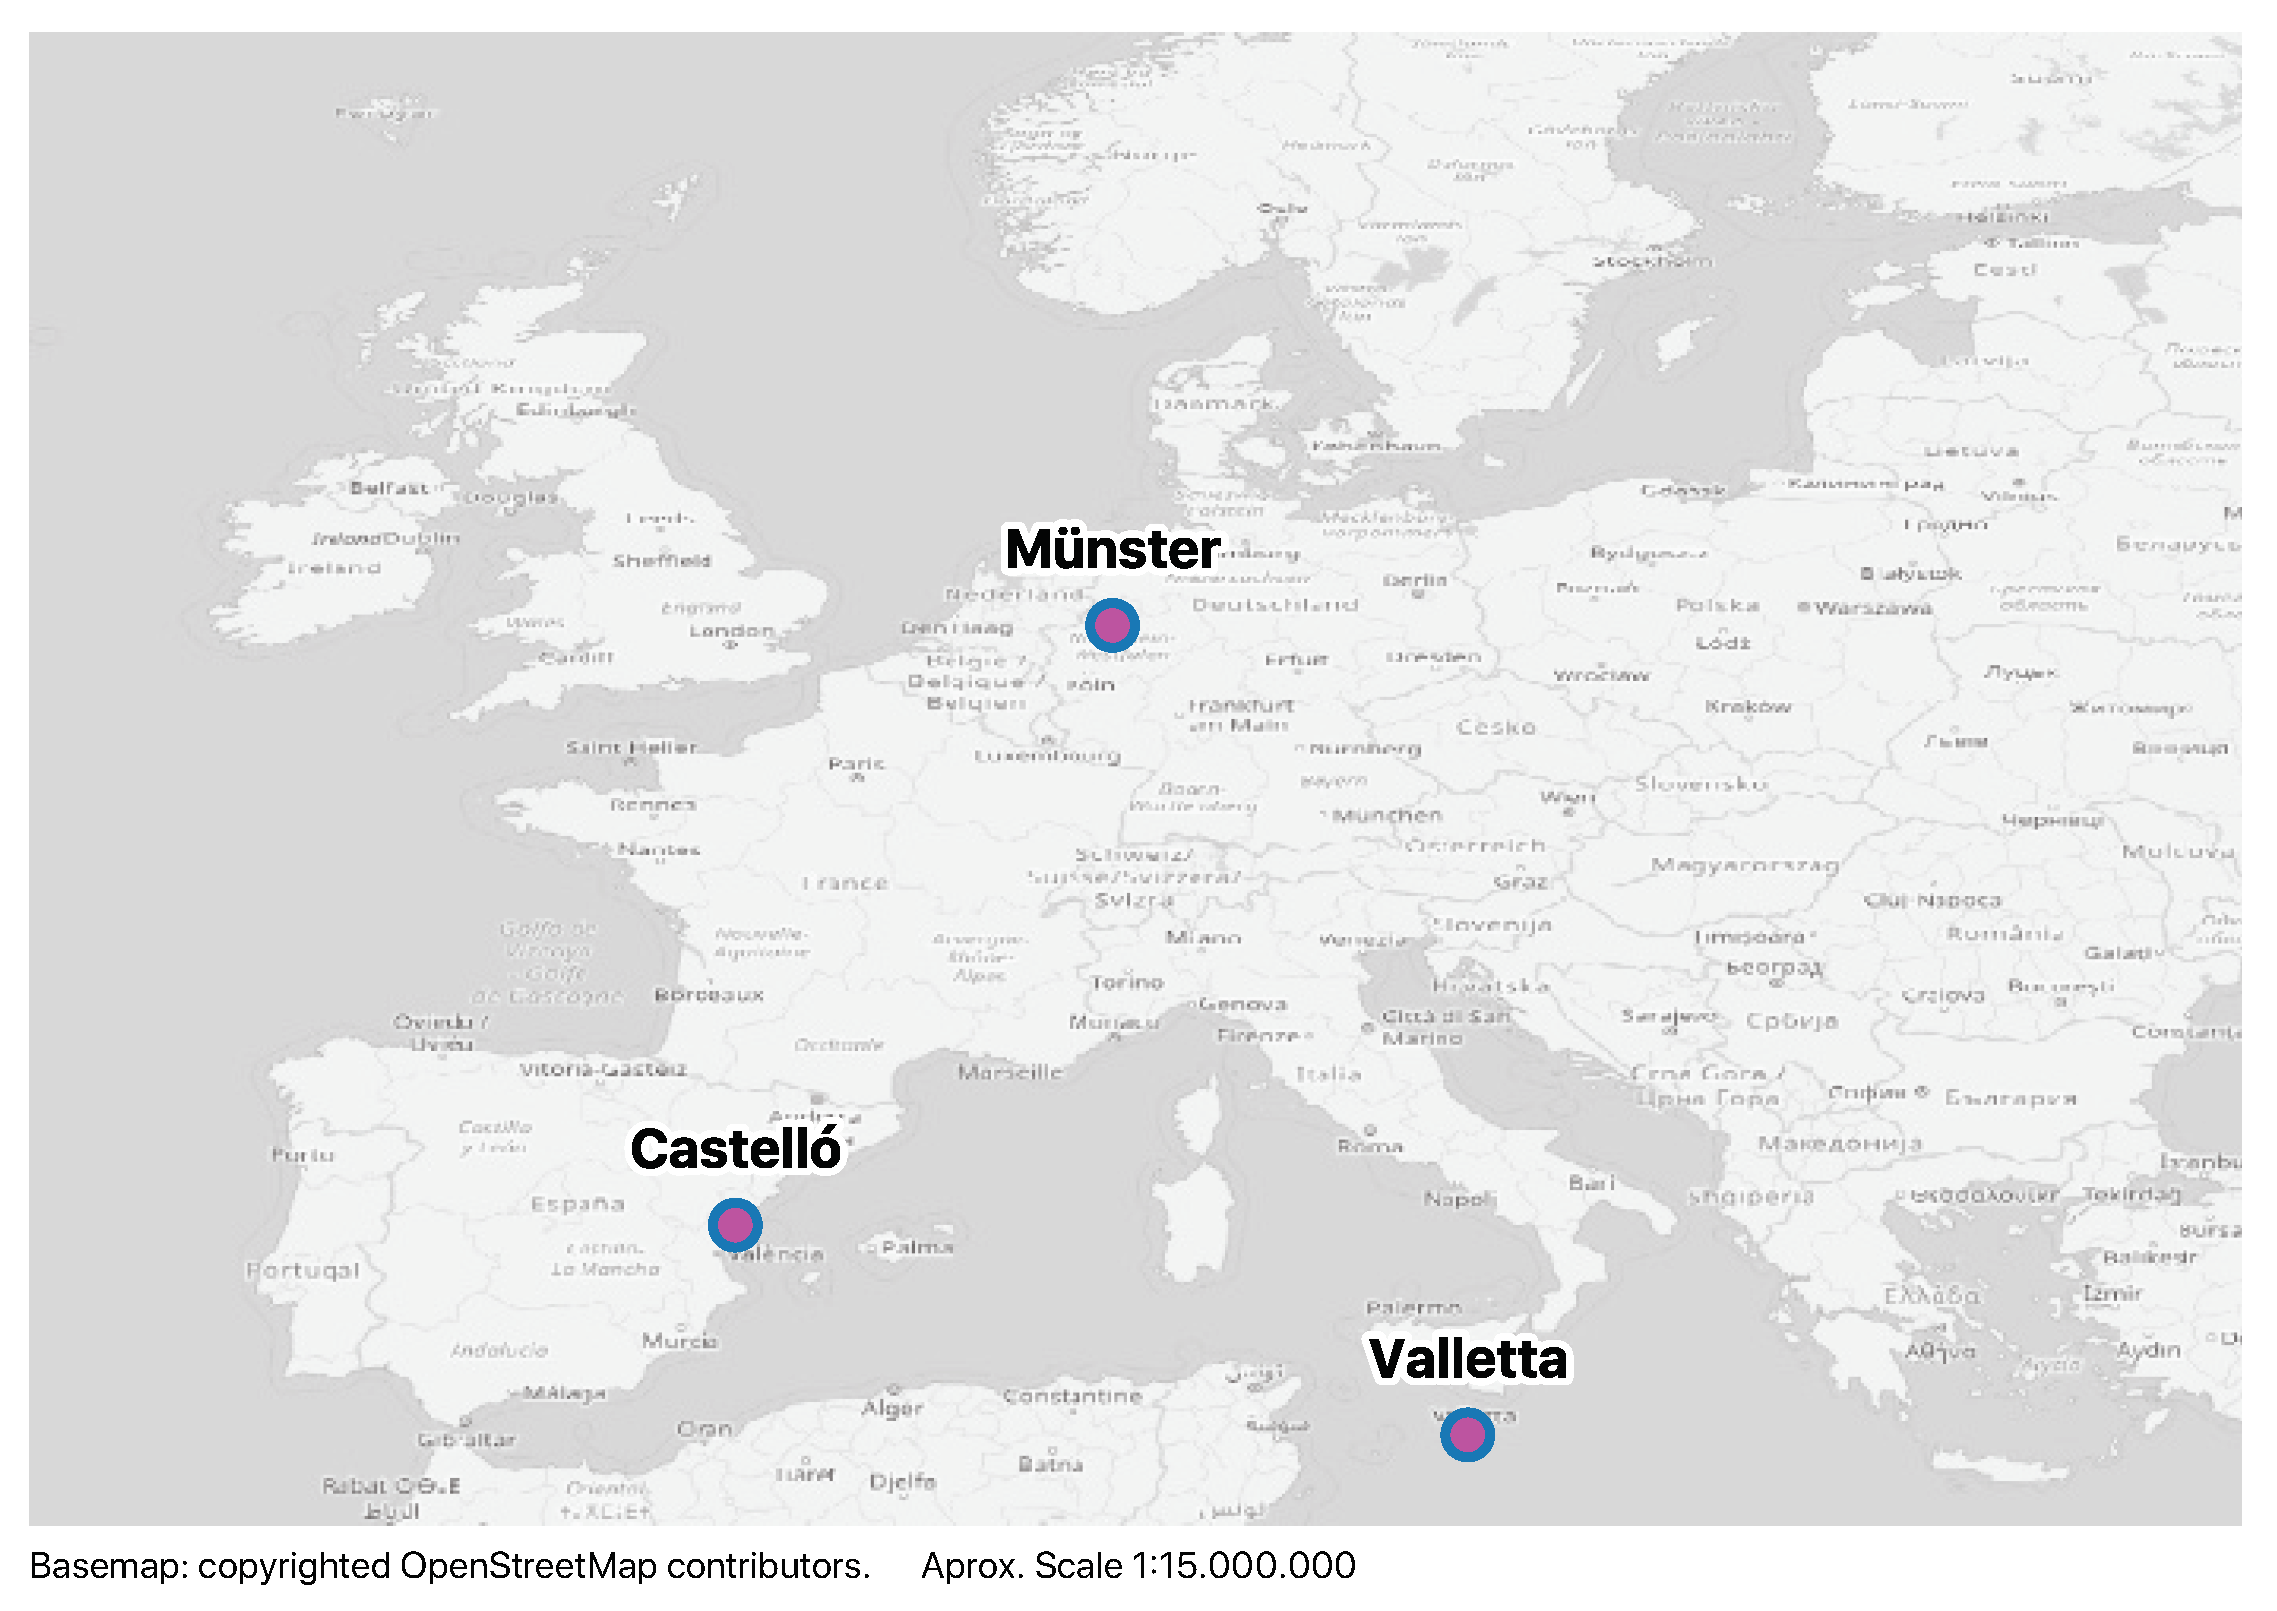
We ran our study in three European cities: Münster in Germany, Castelló in Spain, and Valletta in Malta (see Figure 1). The city of Münster is located in the North Rhine-Westphalia region, northwest Germany, and has 300,000 inhabitants. It is mostly flat, and with an extended and high-quality network of dedicated bicycle lanes, such that 39% of the trips in Münster are made by bicycle [56]. The city of Castelló is part of the Valencian Community on the Mediterranean coast of Spain, with 180,000 inhabitants. It is mostly flat and has a network of bicycle lanes that covers the main corridors of the city and connects with the surroundings. About 2% of the daily trips in Castelló are made by bicycle, and this tendency grew during the last years [57].
The city of Valletta and the surrounding urban area of Malta is a network of small cities within the Mediterranean island with multiple bays and low hills. It has more than 400,000 inhabitants, and almost no cycling infrastructure apart from dedicated bus lanes shared with cyclists; less than 1% of the trips in Malta are by bicycle [58].
4. Methodology
This section describes the three activities of the study: the participants’ recruitment in three European cities during the summer–autumn of 2017; the data compilation and the experimental dataset; and the analytical methods of the study. Our multidisciplinary research dealt with the analysis of bicycle trips from the perspectives of location-based services, bicycle commuting and spatial analysis.
4.1. Participant Recruitment
For the experiment, we recruited 20 participants each from the cities of Castelló in Spain, Münster in Germany, and Valletta in Malta. The call included printed posters, flyers, messages on social media and emails to local cycling advocacy groups. Participants were required to be Android phone users as well as to meet the researchers to install the application, receive the instructions for the experiment, and provide feedback after one week of use. Participants were told to install the Cyclist Geo-C mobile application, record each bicycle trip and describe it with up to three tags upon arrival following their normal daily routine [59]. Each participant received a nominal 10 reward after finishing the tasks.
Using the Cyclist Geo-C application, a location-based mobile application or geo-game, participants tracked their bicycle trips and described them using tags. The geo-game provided participants feedback through collaboration-based and competition-based virtual rewards. The interface showed the proportion of trips and tags recorded as a percentage of the city’s total, and the participants’ position on a leaderboard based on the number of trips and tags. The application supports four languages: English, European Spanish, German and Catalan.
Fifty-seven participants (19 in Münster, 20 in Castelló, and 16 in Valletta) successfully finished the experiment during the summer–autumn 2017 season: in Münster from 18 September to 6 October, in Castelló from 16 October to 3 November, and in the urban area of Malta from 9 to 30 November. Participants were aged between 15 and 58 years old (mean 33.4, median 32.5), they were mainly single (23 single and 12 in a relationship but not living together), and included 24 female participants (42%). Table 1 shows participants’ profiles in greater detail.
4.2. Data
Participants recorded bicycle trips during at least one week using the Cyclist Geo-C mobile application. They generated four different datasets: Location, with the sequence of coordinates and timestamps of each participant; Measurements, with the sequence of distance and speed estimated by Google Fit [60] which we discarded due to bad quality and mistiming of the estimation; and Tag, with a set of up to three tags describing each cycling experience. The detailed description of the datasets [61] is available in Appendix A.
From the raw data, we built the experimental dataset composed of three subsets. First, we created a point dataset called “origin_destination” which contained the point geometries where each trip started and ended with attributes for latitude, longitude, altitude, and precision coordinates. Each point also had the timestamp which indicates the time when the user started or ended the trip.
We also created a line dataset called “trip_segments” which contained the geometries of the straight lines connecting two locations of the participant. Each segment started from an initial point “pi” recorded at a time “ti” and ended at the next point recorded by the user “pf” at time “tf”. The time difference between “ti” and “tf” was at most five minutes while the length of the segment was at most one kilometre. Each segment also had the participant and trip identifier, and the segment’s sequence number within the trip.
For each of the trip segments, we calculated the distance and speed using the recorded coordinates and timestamps from "pi" and "pf" points (see Equation (1)). Then, we classified the segments according to the calculated distance as: “walking segment” when the calculated speed was less than 5 km/h [22]; “cycling segment” when the calculated speed was between 5 and 50 km/h [23]; or “non-cycling segment” when the calculated speed was more than 50 km/h:
We created a second line dataset called “trips” which contained the geometries of each of the trip paths. A trip was a line (also called polyline by GIS users) defined by the ordered sequence of trip segments. It started from origin point “pi” of the trip’s first segment and ended at the destination point “pf” of the trip’s last segment. Each trip also had the participant’s identification, trip’s identification, the number of segments, start and end times.
In addition to the experimental dataset recorded by participants, our analysis used a secondary dataset to define a comparable framework for the three cities. The secondary dataset consisted of the existing bicycle paths in the cities of Münster and Castelló as well as the planned bicycle paths around Valletta. For the city of Münster, the source of the bicycle paths was the OpenStreetMap [31] (we downloaded the line elements with the tags “bicycle = yes” and “cycleway = yes”). For the city of Castelló, we obtained the bicycle paths from the city transport authority [57], including the city of Valletta, we created a digital version of the national bicycle network plan [58].
For the urban boundaries, we used data from OECD functional urban areas—FUA [62] and urban morphological zones—UMZ [63]. These last two datasets served to compare the three urban areas of the study and the existing or planned bicycle lanes. The experimental and secondary datasets were stored using the open a GIS-compatible file format GeoJSON [64].
4.3. Methods
This study used a hexagonal grid of 30 m cell side to analyse and summarise the bicycle trips, identify frictions, and support the numerical and geospatial visualisation of the results. The hexagonal grid offered a higher spatial resolution and adapted better to the irregular street configurations than a square grid [65]. In addition, the grid offered advantages concerning similar techniques such as map-matching when it comes to the representation of small elements and the independence from a transport network. For example, our analysis included bicycle trips crossing open or pedestrian spaces which would not be considered by map-matching to the network. We built individual grids per city using the local coordinate system to ensure a uniform grid size. Then, we merged the individual networks into a single layer. The final layer, as well as the experimental datasets, were processed with the WGS84 reference system to ensure reproducibility with future analysis.
Once we had the unified grid, we calculated a set of variables for each cell, described in Table 2. The values at each cell came after selecting the points or lines intersecting each grid cell using the GIS function “st_intersects”. The values became attributes of the existing grid layer.
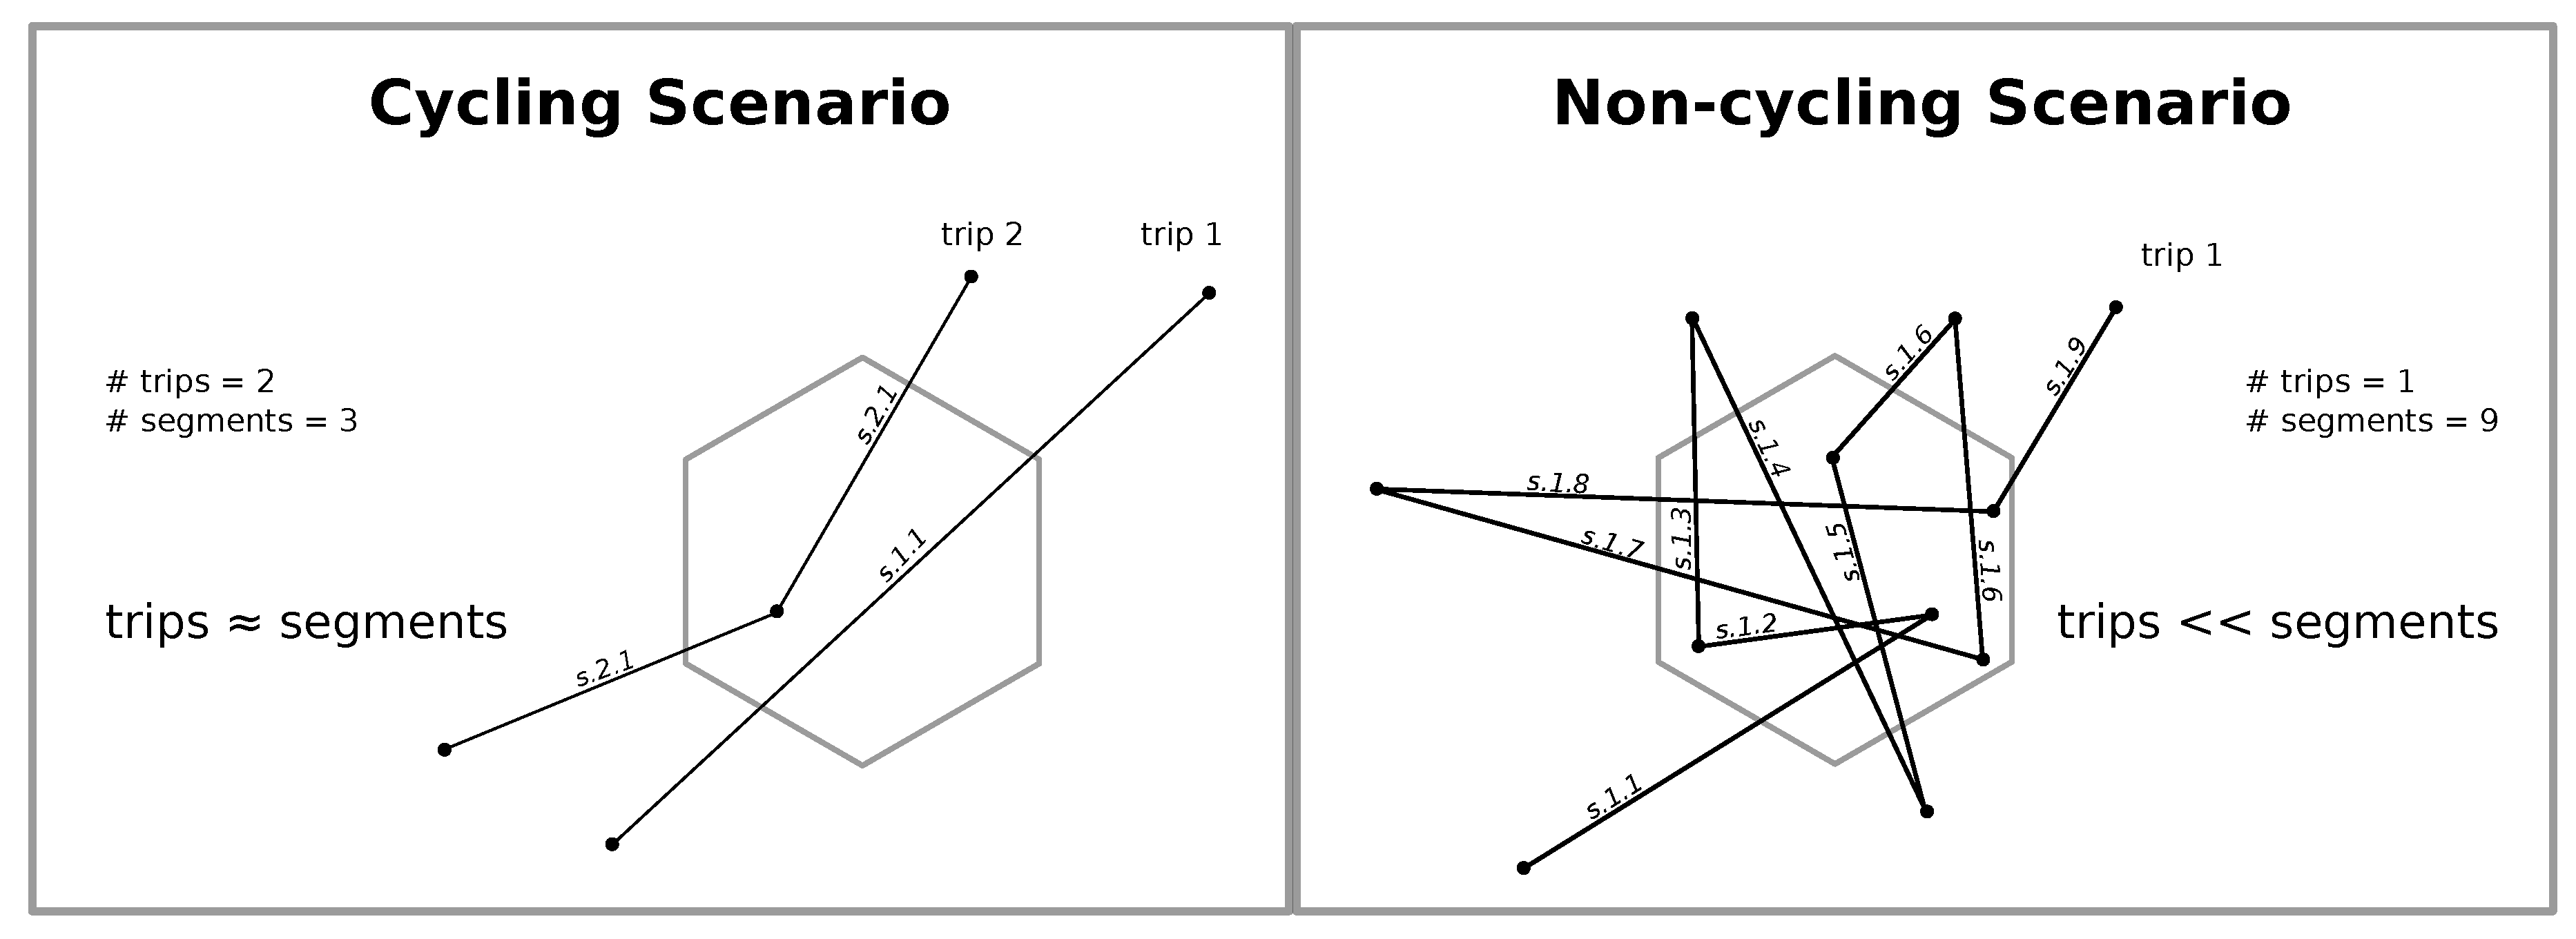
To define the frictions that inhibit bicycle commuting, we considered the scenario in which a cyclist faced an obstacle or a circumstance that forced her to either slow down, walk the bike or stop cycling. In such a case, the cyclist cannot maintain a constant cycling speed during the trip [66]. Based on that, we inferred how such scenario would be reflected at an individual grid cell since the application recorded participants’ location every 2 to 10 s and we calculated the speed of each segment applying Equation (1). First, we considered that a participant was theoretically cycling uniformly at speed between 5 and 50 km/h [23] who would likely record from one to three points at a grid cell which corresponds to one, two or three segments (see Figure 2 left).
Second, we considered a second participant was theoretically walking at speed lower than 5 km/h [22] or stopped who would likely record much more points at either the same grid cell or the adjacent cells (see Figure 2 right). Contrasting the behaviour of the two previous participants, we observed that participants cycling would record fewer segments than participants walking or stopped. Similar to the detection of movement suspension patterns described by Orellana [67], we used the number of cycling and walking segments to identify frictions inhibiting bicycle commuting.
Based on the previous considerations, we defined “Friction intensity” as the proportion of the walking segments recorded at a grid cell compared to the cycling segments recorded at the same grid cell as a percentage (see Equation (2)):
After calculating the variables and the friction intensity, we proceeded to analyse the trip details. There we checked “when" the participants recorded trips, on which day of the week and at what hour of the day. In addition, we analysed “how" participants cycled and calculated the average cycling speed and the cycled distance. Then, we found “where" participants cycled and counted the number of trips in and out of the UMZ. Additionally, we estimated the distance from each segment to the closest bicycle path, assuming that segments recorded at a distance shorter than 30 m were recorded in a bicycle path. We used distance as a criterion to determine where a participant cycled and, in particular, where they used a bicycle path during the experiment.
We identified the frictions inhibiting bicycle commuting following an iterative procedure to define three levels. As first level frictions, we selected the grid cells intersecting at least one walking segment. As second level frictions, we chose the first level frictions located farther than one hundred metres from a trip origin or destination. The areas surrounding trip origins or destinations would probably have more walking segments due to the lower speeds when starting or ending a bicycle trip.
For the third level frictions, we applied two steps. First, we selected the second level frictions in which walking segments were between one half or two times the number of cycling segments. This produced friction intensity values between 50% and 200% and would correspond to grid cells where participants not only cycled but also stopped or walked the bicycle. Second, we grouped the adjacent grid cells having a friction intensity between 50% and 200% and merged them into a single area to provide insights into the extent of the identified frictions.
We proceeded to explore the geospatial visualisation of the bicycle trips, frictions inhibiting bicycle commuting, and the use of the cycling infrastructure. We compared the visualisation outcomes of our approach with the Strava heat map and the raw trip lines. We found the general categories of places in which the identified frictions appeared and the urban elements that potentially produced such friction. Lastly, we visualised the bicycle paths used and not used by participants during the experiment.
5. Results
Our experimentation obtained 1605 trips composed by 62,968 segments from which only 40% were cycling segments. Most of the trips were recorded in Münster, but participants from both Castelló and Valletta recorded almost twice the number of segments than in Münster. Therefore, we calculated the cycled distance only considering the cycling segments, which decreased the average trip length but better reflect the cycled distance. In Castelló participants cycled 550 km, whereas, in Münster and in Valletta, participants cycled about 300 km. Table 3 shows the general characteristics of the trips recorded, and the higher rate of cycling segments recorded in Castelló, where one-half of the recorded segments were cycling segments, while, in Valletta and Münster, these rates were lower.
The recorded trips came mainly from urban commuters due to fact the recorded location was mostly inside the urban area, during working days/hours, and at low cycling speed. The participants from Münster and Valletta recorded the majority of segments within the urban area (89.17% and 93.94%), whereas participants from Castelló cycled differently on weekdays or weekends. On weekdays, more than one half of the cycling distance was recorded inside the urban area (65.09%), while, on weekends, participants cycled mostly out of the urban area (59.64% out of the urban area). We noticed different behaviour in participants from Castelló due to a combination of more sports cycling in the countryside than in the other two cities and a different spatial configuration of Castelló’s UMZ. Although the UMZs came from the same source, Castelló’s UMZ had more dispersed and separated urban areas than Münster and Valletta which had an aggregated UMZ enclosing the small surrounding towns.
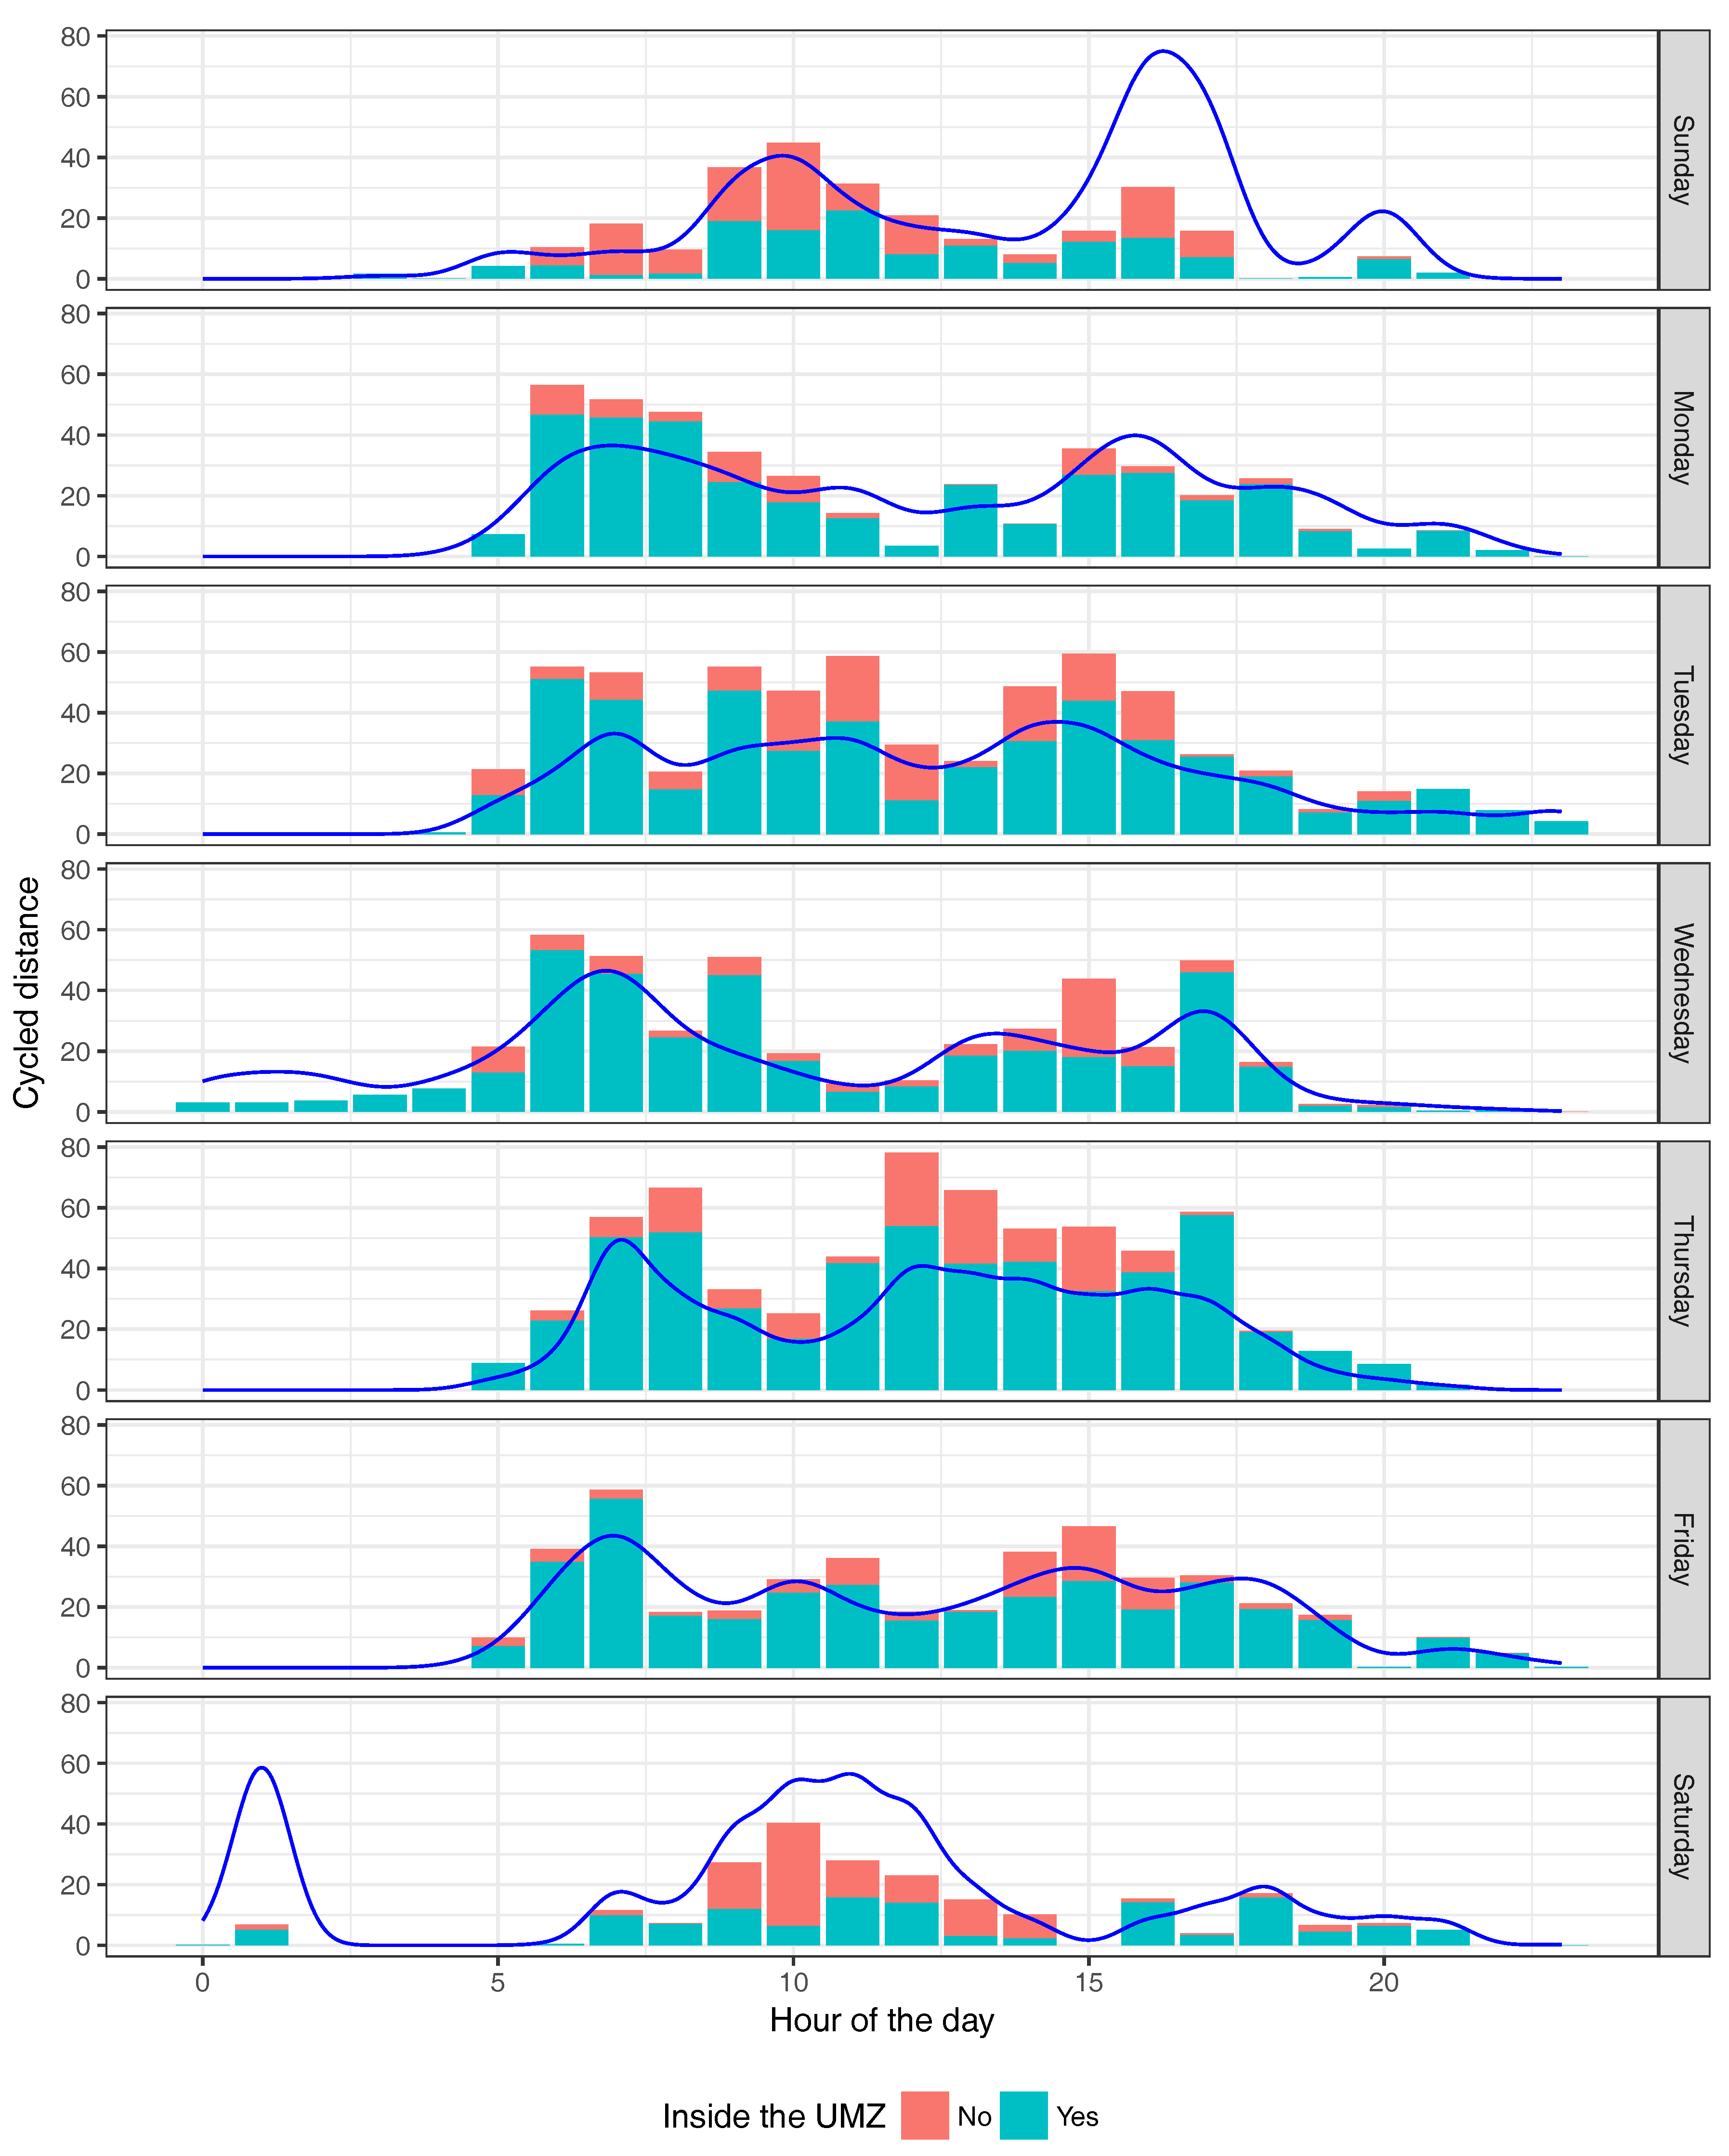
Overall, participants cycled more during weekdays and working hours. Figure 3 shows the cycled distance during the experiment per day of the week and hour of the day as well as the location in or out of the UMZ. Moreover, participants cycling had a bimodal distribution of the cycling distance on workdays [68] and a slightly higher concentration of trips outside the UMZ on weekends.
Participants’ average cycling speed was close to 15 km/h, typical for urban cycling and matched to our theoretical and methodological considerations. We found participants from Valletta with the lowest cycling speed among the three cities, 14.6 km/h on average, while Castelló and Münster had a higher cycling speed, 15.0 km/h and 14.8 km/h. The hourly distribution of cycling segments presented in Figure 4 shows the trips usually starting after 6:00 a.m. in the morning, some early trips in Münster and a participant from Valletta who recorded non-cycling segments all night long. Participants from Castelló recorded more trips between 4:00 p.m. and 6:00 p.m. while participants from Münster and Valletta recorded trips earlier in the morning or later in the afternoon. Apart from the differences between the local commuting times, we saw a periodic concentration of trips during the day in Münster, which could mean a more structured cycling scheduling.
5.1. Frictions Inhibiting Bicycle Commuting
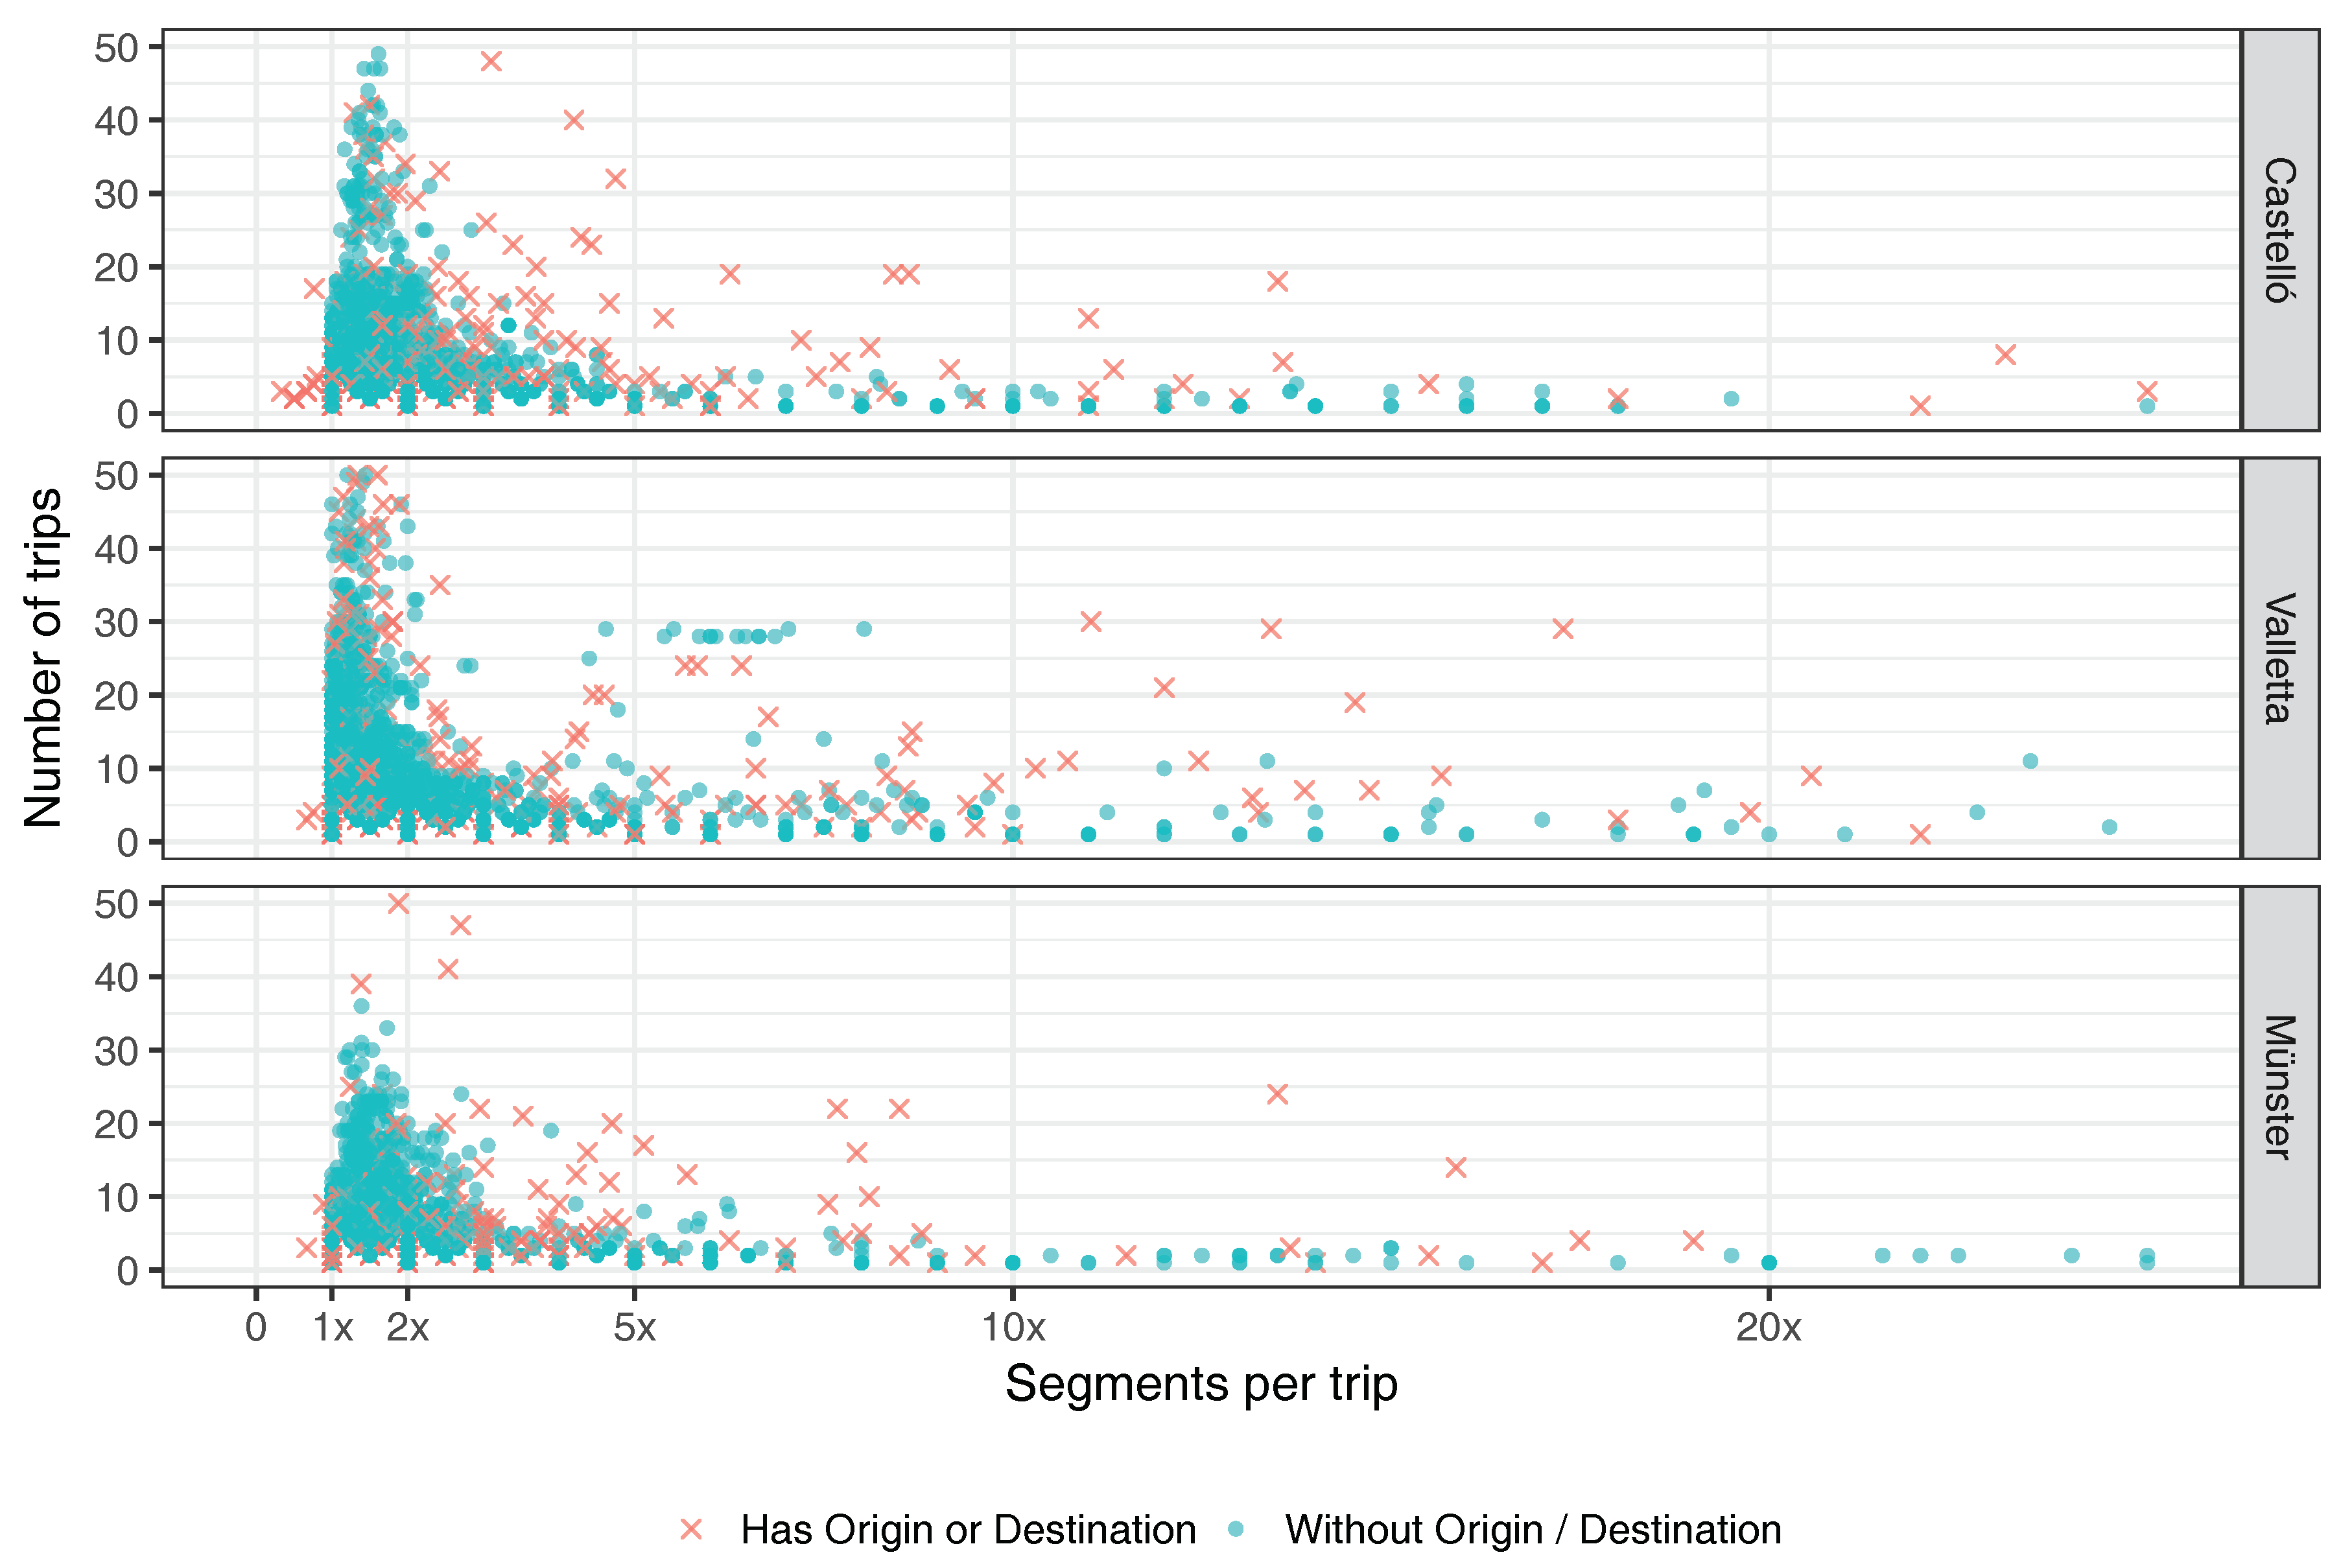
From our methodological approach in Section 4, we aimed to locate the areas where participants cycled or walked. The grid cells crossed by participants usually had between one and fifty trips with nearly one hundred segments which meant about two or three segments per trip. When considering trips’ origins and destinations, the grid cells with at least an origin or destination point usually had up to ten segments. Therefore, we found our participants recording more segments while starting or finishing a trip.
Beforehand, we knew that when a participant stayed at the same location or moved slowly, the GPS sensor kept recording multiple locations and therefore adding trip segments [66]. Based on that fact, we defined the first level frictions. Figure 5 shows grid cells where participants usually recorded from one to three segments per trip. However, there are cells with more than ten segments per trip, especially if they had either origin or destination points. The second level frictions, therefore, excluded the grid cells with either origin or destination points, seen as red crosses along the x-axis in Figure 5. We found more grid cells with a high number of segments per trip in Valletta than in Castelló or Munster.
To capture information about frictions’ extension and intensity, we aggregated the adjacent grid cells with similar friction intensity to define the third level frictions. We found almost half of the third level frictions in Valletta, 143 frictions, and the rest equally distributed in Münster and Castelló, 71 and 70 frictions. We compared the frictions’ intensity and size to visualise the distribution of more significant areas and the most intense cycling inhibition. Figure 6 shows four quadrants defined by the size of the grid areas and friction intensity, and the top two quadrants called our attention due to the higher friction intensity produced by more walking segments.
The grid areas at the top right quadrant (33 grid areas—GA) were bigger, with higher intensity and mostly present in Valletta (24 GA out of the 33). The grid areas at the top left quadrant (107 GA) were smaller but with high intensity. There were grid areas with high friction intensity at the three cities but in different proportions. Münster (35 GA with high fiction intensity—HFI), they were mostly at intersections controlled by traffic lights; in Castelló (29 GA with HFI), they were mostly at intersections, roundabouts and the pedestrianised downtown; and in Valletta (76 GA with HFI), they were mostly across streets with steep slopes, street intersections and grade separations. Our results combined the programmatically functions and a visual examination for describing the cycling environment producing frictions.
5.2. Spatial Distribution of Frictions
We covered each city study area with the hexagonal grid as a way to spatially aggregate or bin the number of trips. By doing so, we extended our results beyond traditional maps of cyclists’ preferred/non-preferred streets and focused on places inhibiting cyclists movement, especially those with a higher friction intensity shown in Figure 6. Our approach combined the conventional cycling representation of bicycle trips (see Figure 7 left), with the iterative definition of frictions. We selected the areas where participants not only walked but also where the walking segments were much more compared to cycling segments to define the third level frictions (see Figure 7 centre and right).
Extending the traditional visualisation of bicycle trips adds a new instrument to evaluate cycling conditions. The different perspectives seen in Figure 7 show not only the cyclists’ preferred streets but also the places where such activity was probably constrained. The frictions in Figure 7 centre and right indicate places where participants not only cycled but also decreased their speed or stopped during their trips. Level three frictions excluded the grid cells having either origin or destination to ignore areas where participants walked to start or end a trip.
We compared the third level friction across the three cities regarding the size of the grid areas and friction intensity (see Figure 6). However, the use of geospatial analysis allowed us to compare the spatial distribution of frictions as well as the infrastructure and environmental conditions potentially constraining cycling. While in Valletta frictions were associated with the steep slopes faced by participants, the different cycling environments in Münster or Castelló produced other kinds of distribution.
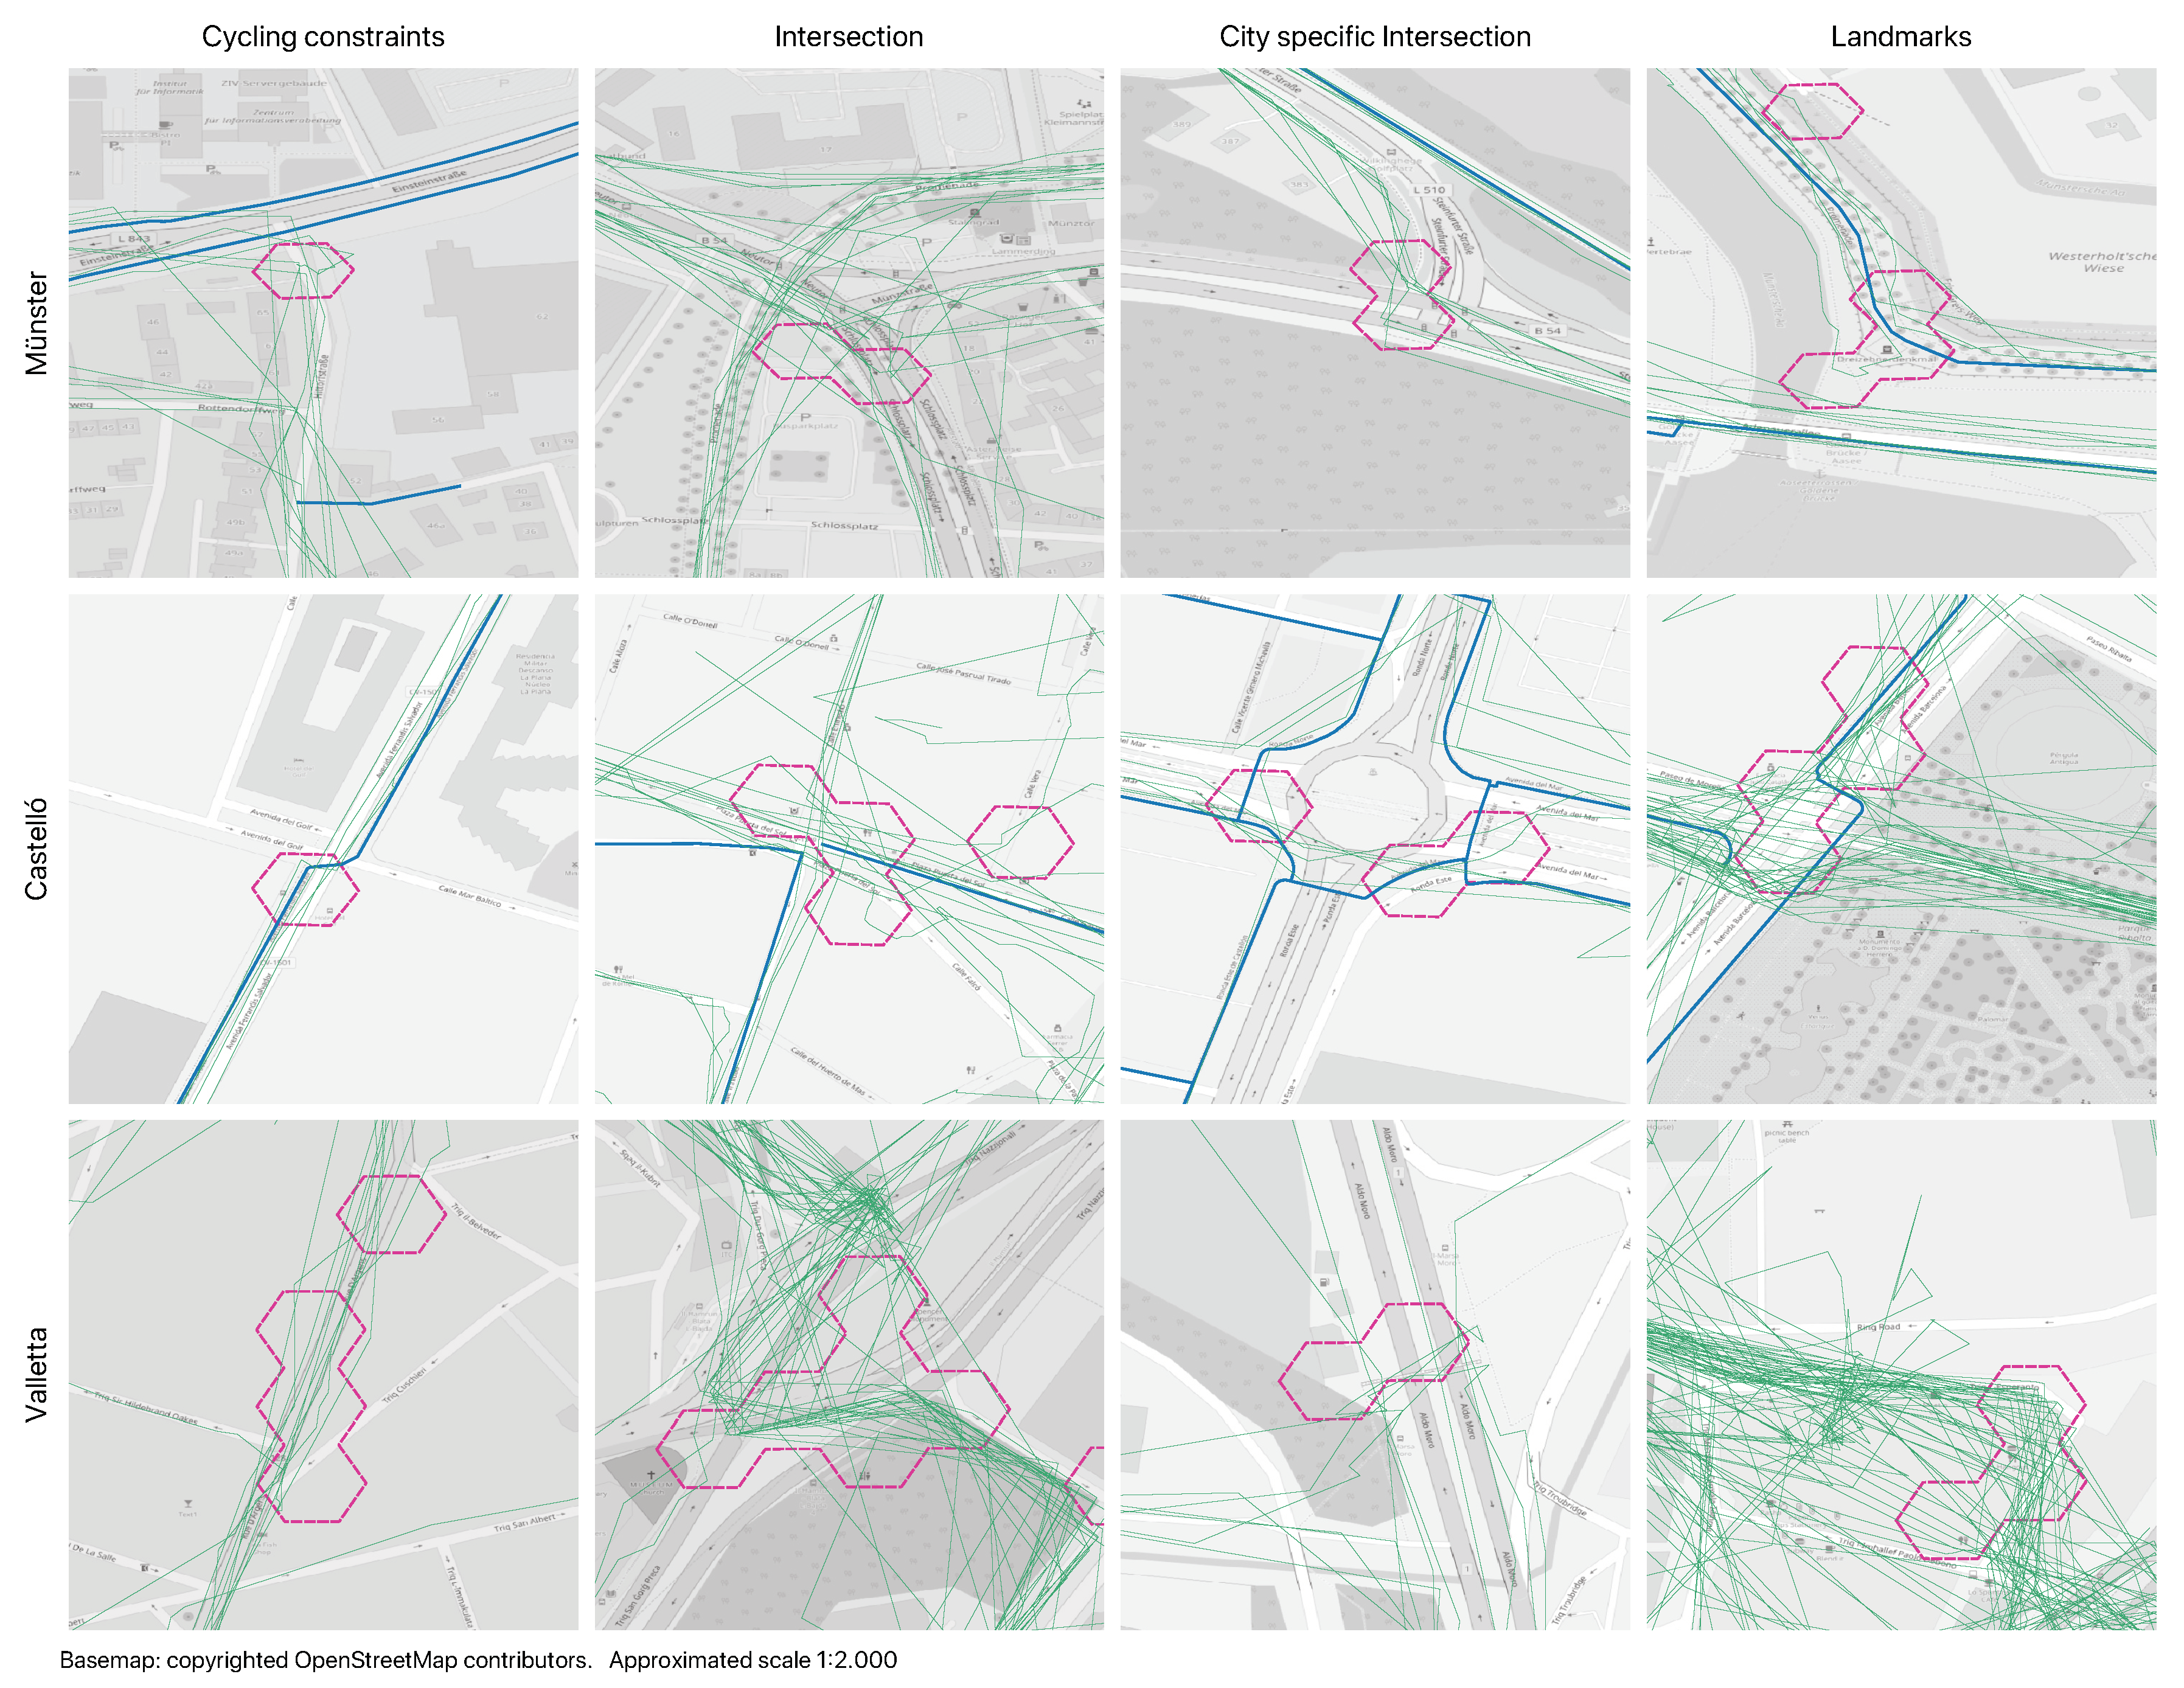
We linked the third level frictions with a series of four typical scenarios: particular cycling constraints, street intersections, city-specific intersections, and landmarks. Figure 8 shows a selection of third-level frictions as red polygons, the recorded trips using green lines, the bicycle paths in blue, and the surrounding map to understand the elements producing the calculated friction intensity. In Münster, we found frictions at places where participants moved from a dedicated bicycle path to a local street usually at a closed turn, at the intersections with highways, or at some crowded areas surrounding the city lake.
In Castelló, we found frictions at bicycle paths with cumbersome turns, roundabouts, or at the main city park entrance which served as a junction between the city centre and the avenue leading to the train station and university campus. In Valletta, we found frictions usually at streets with steep slopes surrounding the university campus, at huge grade separations such as the underpass leading to the university, and at some landmarks around the seashore promenade.
5.3. The Role of Bicycle Paths in Facilitating Bicycle Commuting
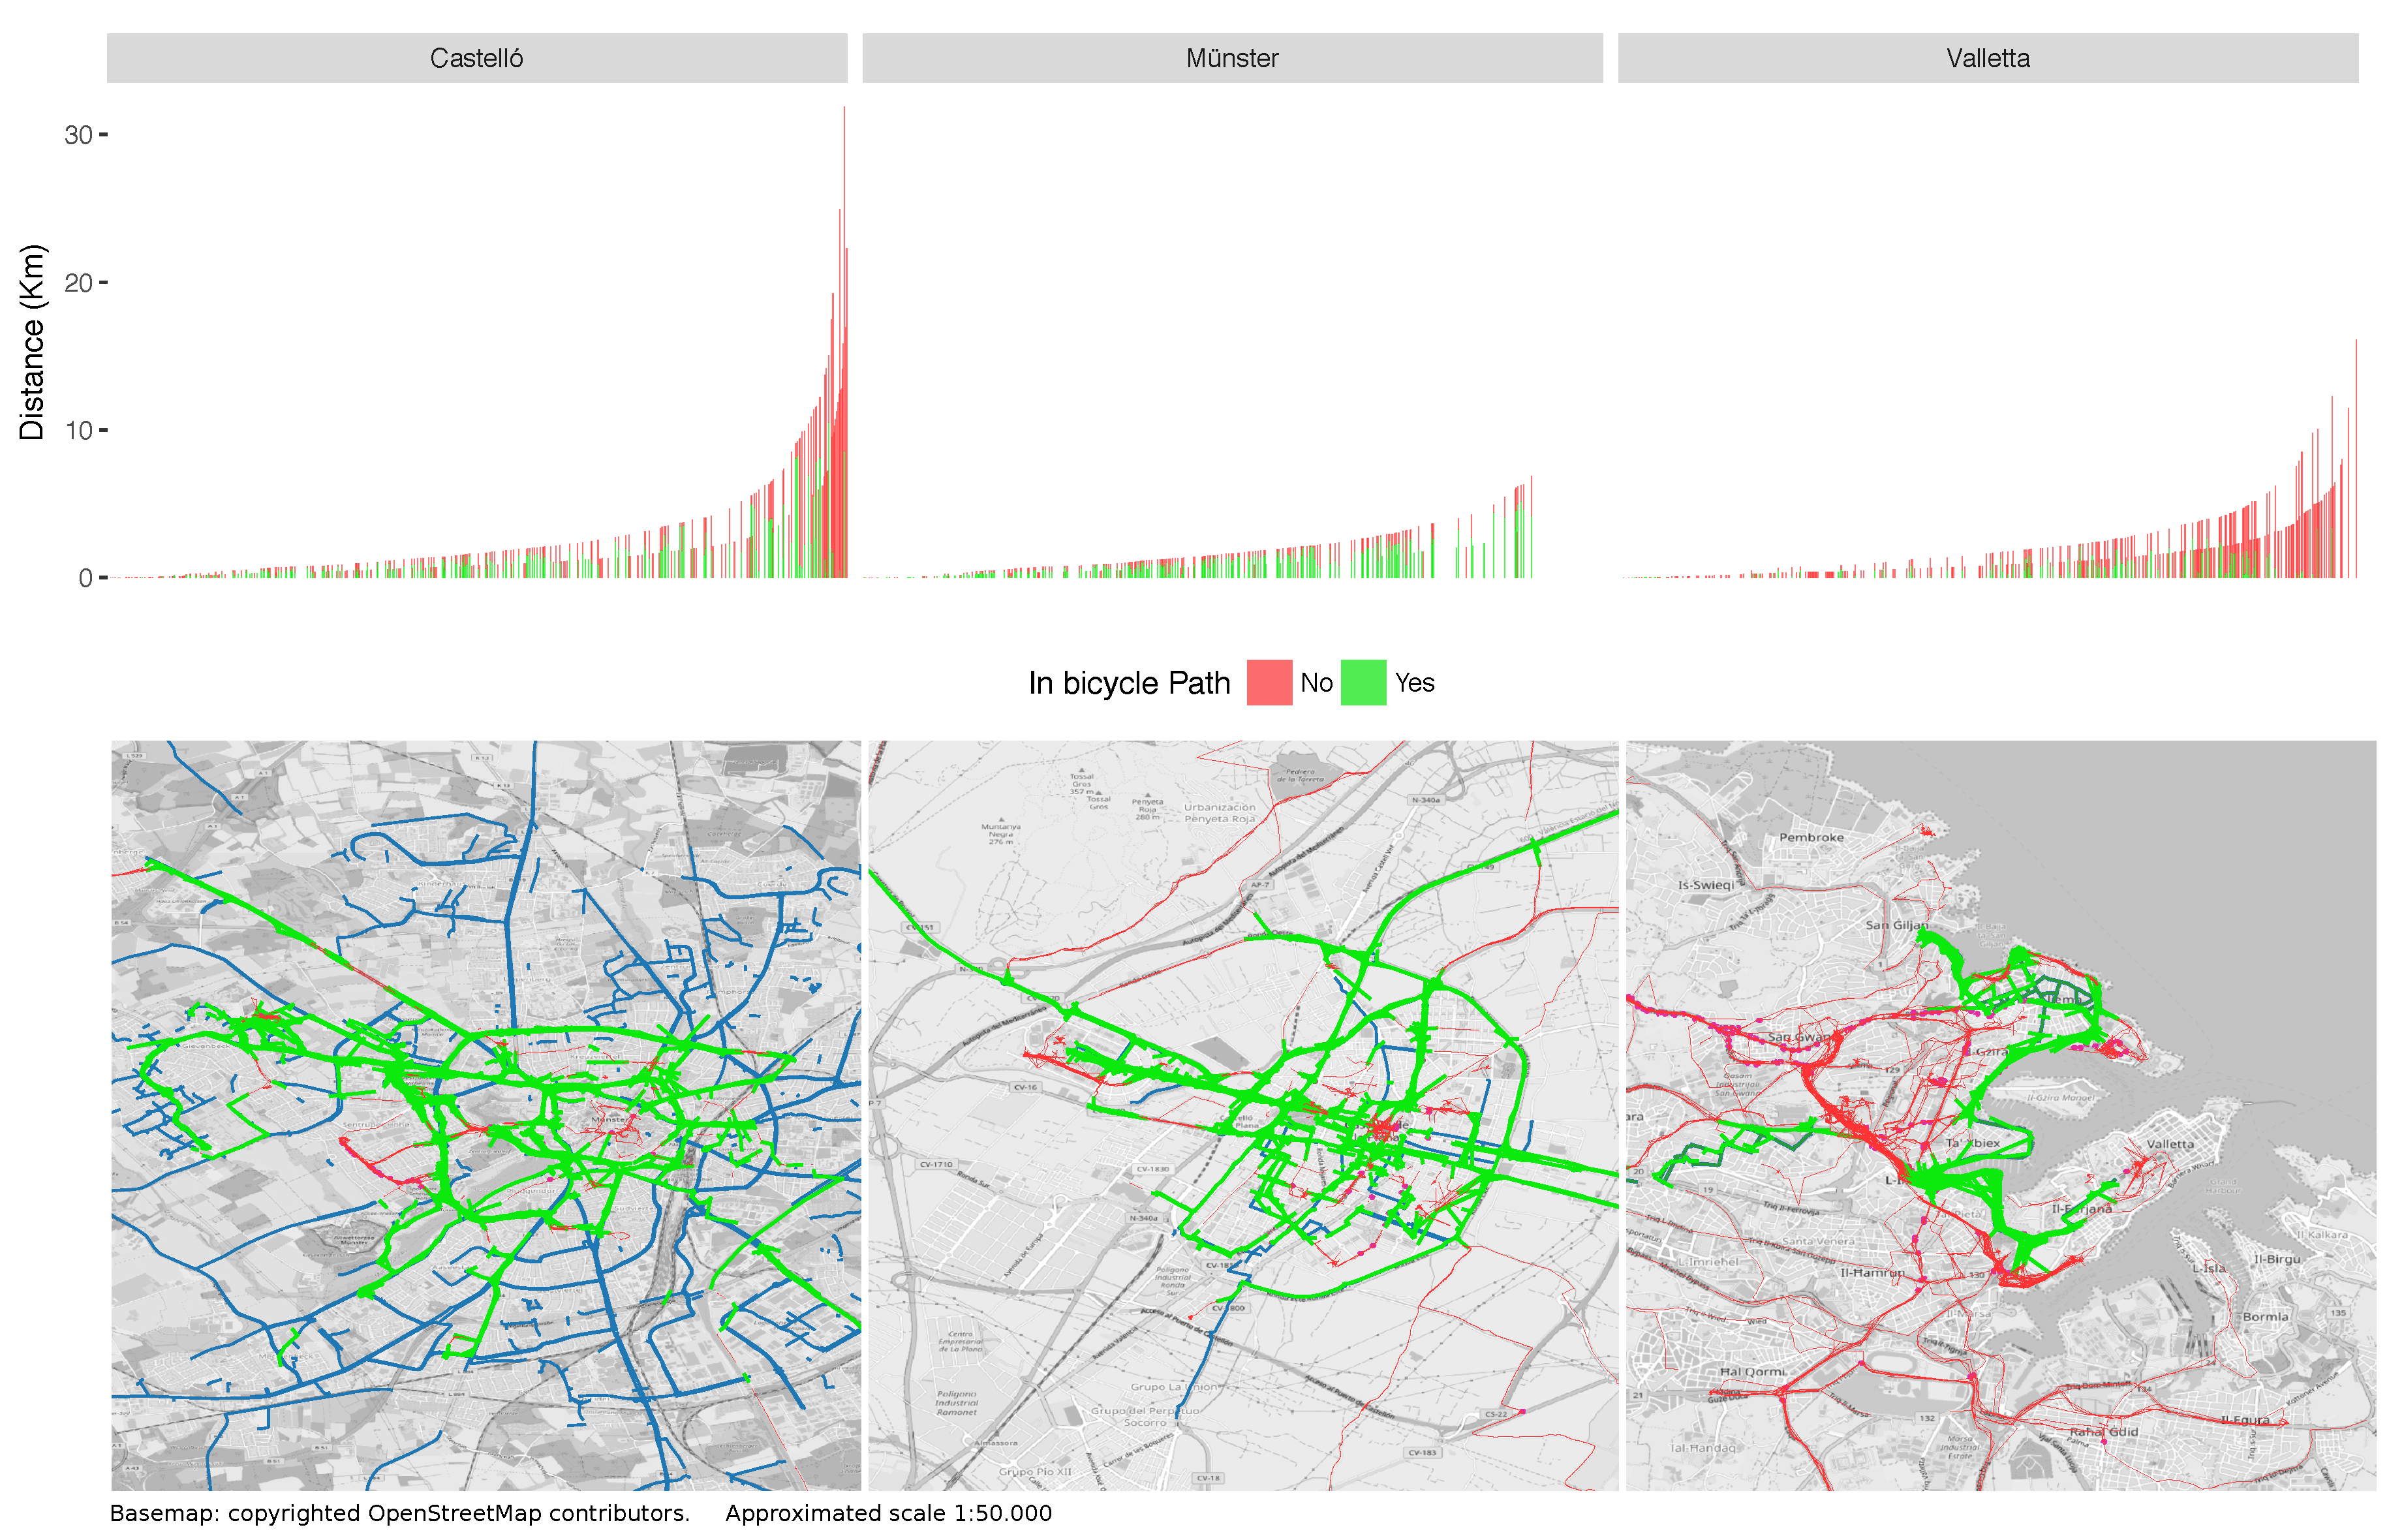
Although we found participants from Münster using more bicycle paths per trip than participants from Castelló, the participants recorded trips in more than one-half of bicycle paths in Castelló. In Münster, participants recorded 235.5 km in bicycle paths which represented 76.8% of the cycled distance. In Castelló, participants recorded a slightly longer distance of 265.9 km which only represented 47.8% of the cycled distance. Apart from being a contradiction, the trips presented in Figure 9 on the one hand as trajectories in the bottom map and on the other as vertical bars in the top chart, show two different cycling scenarios. First, a scenario with more commuting trips using the city’s high-quality cycling network in Münster. Second, a scenario with lower coverage of bicycle paths in Castelló but longer trips to either connect urban areas or to practice sports cycling.
The case of Valletta radically differs from the other cities. In addition to the absence of bicycle paths, we found some cycling along the streets planned for bicycle paths in the future. Participants only recorded 95.7 km which represented just 28.8% of the cycled distance. In this case, the numbers and representation of Figure 9 right only aim to serve as a reference point for future studies.
Most of the cycling related literature and numerous urban planners portray bicycle paths as enablers of urban cycling. Therefore, we tried to provide tools to evaluate the differences in cycling patterns produced by such paths. We counted the trips recorded at each bicycle path and mapped them to see the bicycle paths used during the experiment. Figure 9 shows the bicycle paths in blue, in green the paths with at least one trip recorded during the experiment, and in red the segments recorded off a bicycle path. Most of the cycling segments recorded off a bicycle path were at city centres, generally quiet or pedestrianised areas in Münster and Castelló. In Valletta, the majority of trips were off the planned bicycle network and some at the surrounding streets which are not part of the future network plan.
We also analysed the cycled distance in bicycle paths per day of the week, seen in Figure 10. Participants from Münster cycled mostly on bicycle paths and during work days. Participants from Castelló did not have a clear pattern beyond the low number of trips recorded on Saturdays. Participants from Valletta cycled mostly during work days and rarely used the streets planned for building bicycle paths.
Cycling speed is a proxy for the convenience of bicycle paths. Therefore, we compared the average cycling speed of segments recorded on and off bicycle paths. Figure 11 shows a box-plot graph with the average cycling speed. In Münster, there was a slightly higher cycling speed on bicycle paths while in Castelló there was a lower speed off the bicycle paths. Such a difference could come from participants from Castelló cycling more for sports purposes and out of the urban areas. Although we did not find statistically significant differences and could not conclude on the convenience of bicycle paths, the comparison of cycling speeds deserves additional analysis and demands field-work validation.
6. Discussion
Our research considered four main topics: the concept of friction, the grid-based methodology, the representativity of our sample size, and the method replication. Our study’s contributions include the definition of “frictions” inhibiting bicycle commuting, the use of a hexagonal grid to aggregate cycling information, and the between-groups experimental design. In addition, we dealt with the implications of focusing on urban cycling, considerations to build a replicable method and limitations of having a small sample size. Finally, we contrasted our research outcomes with the existing studies on urban cycling and examined the future work in the field.
The first achievement of this study was identifying a combination of geospatial technologies which served to track urban cyclist location and to identify 1605 bicycle trips and 284 friction cases potentially inhibiting bicycle commuting. Our methodology analysed crowdsourced cycling data, notwithstanding the small sample size, with a feasible and reusable methodology to analyse cycling patterns based on GPS tracks. For doing so, we built the cyclists’ trajectories from data collected through mobile phones, and then we identified the frictions by analysing the deviation of those trajectories from an ideal cycling scenario.
Despite the interest of transport experts in understanding urban cycling, we found no literature dealing with the use of geospatial technologies to identify spatial and temporal elements of constraints to bicycle commuting. The concept of friction is not not yet definitively agreed upon, and, therefore, not easy to translate into algorithms which lead to its identification. Our attempt to have a standard definition which supported the comparison of cycling patterns between three European cities would serve to analyse the local cycling environments.
Our approach aimed to provide a geographic perspective on cycling beyond the mere geometrical representation based on lines, and frictions served for such a purpose. Therefore, we compared the crowdsourced trips against an ideal cycling scenario, time and distance constraints to calculate the deviations. In practice, our procedure had three iterative levels to identify and describe frictions. The two additional levels increased consistency by considering the number of walking segments, origins, destinations, and the friction intensity ratio. We optimised data processing and visualisation by adopting a grid-based methodology which spatially located frictions from low-speed segments complemented with a visual interpretation of elements potentially constraining cycling.
The advantages of the grid-based approach went beyond visualisation, and it enabled mixed geographical and numerical comparisons within cities. Consequently, we used it to calculate the number of trips, walking and cycling segments, trip origins and destinations as well as the friction intensity and the location within the urban area. The grid-based analysis expanded and complemented the traditional methods of line overlapping, heat maps or map-matching used for cycling analysis. The spatial definition and the multiple variables calculated using the grid supported the visualisation cycling areas and revealed hidden patterns from non-cycling segments. Figure 7 shows the single grid layer supporting three different views while Figure 5 and Figure 6 show the grid values out of the geographic domain. Cycling analysts do not combine geographic and numeric visualisation very often, most of the transport and cycling studies focusing on one of the two alternatives [69].
Cycling as a mode of transport produces interesting and complex mobility patterns. Our methodology aimed to compare and complement current mobility studies, adding in this case the daily and hourly distribution of bicycle trips presented in Figure 10. Despite the different methodological approach, our insights into participants’ commuter behaviour are not only comparable but also more detailed than conventional transport studies.
Having a small sample size in our study limited the interpretation of our results, but, at the same time, offered a community-specific perspective. The results did not reflect the cycling dynamics at the city level, only the behaviour of 20 participants cycling during two weeks at each city. However, our focus on identifying frictions inhibiting bicycle commuting, the recruitment of urban cyclists, and the geographical limits of urban areas would offer a well-defined method to analyse the cycling environment useful for policy-makers. The friction intensity is an objective estimator of the city areas potentially constraining cycling. In addition, our methodology served to identify the frictions faced by participants during cycling and provided a replicable method for other cities which requires complementary validation fieldwork.
Our method’s reproducibility rests on an openly published customised mobile application, recruitment of bicycle commuters, a crowdsourced dataset of bicycle trips, and the set of software components to analyse the cycling environment and identify the places with low-cycling speed. Any city can use or modify the mentioned elements, deploy a crowdsourcing campaign and identify the frictions existing in its urban area.
The study also quantified and analysed the influence of bicycle paths as enablers of bicycle commuting. We spatially linked the segments with its closest bicycle path, identified the segments used during the experiment, and calculated cycling distance and speed in and out the bicycle paths. In Münster, participants did not use about 65% of the bicycle paths; in Castelló, it was about 30%. In Valletta, participants did not record any trip on 50% of the streets planned to build bicycle paths. With a fixed and reduced number of participants at each city, we observed how difficult is to reach all the bicycle paths, especially in Münster and its well-distributed network. Moreover, we calculated the difference in cycling speeds on and off the bicycle paths in Münster and Castelló, but we did not find a significant difference.
Our methodology successfully addressed some of the difficulties of reproducible research in geoinformation sciences [70]. We made the set of functions used in the study available in an open repository (see Appendix B), written in popular programming languages in the data analysis field. In addition, we deliberately used open source GIS tools and open data formats to restrict neither future analysis nor a particular software component. Finally, we compiled the tools and datasets and made them part of the Open City Toolkit [71,72], see Appendix B.
Apart from the planned research outcomes, the study opened up the alternatives for future cycling-related research. We found the need to improve data cleaning when it comes to datasets collected with mobile phones and GPS. Data cleaning should complement a better definition of bicycle trips when it comes to spatial features such as origin, destination, and intermediate stops. There are also alternatives to analyse particular features of trips such as bearing angle, effective cycled distance or the connection with different transport modes. Although our research scope did not consider the trajectory analysis, our dataset is useful for testing and validating geostatistical analysis which continually gains in popularity but lack valid data for validation.
Due to the reduced amount of urban cycling data, our outcomes could be also welcomed in emerging and popular fields such as machine-learning, parallel processing, or artificial intelligence. Moreover, considering the limitations of the majority of cities to successfully implement such tools, our study could serve to simplify the technical evaluation of data analysis tools or to design analysis products for bicycle commuting.
7. Conclusions
The study successfully identified 284 places with potential frictions inhibiting bicycle commuting: 71 in Münster, Germany; 70 in Castelló, Spain; and 143 in Valletta, Malta. Participants at those places recorded bicycle trips, and we found the segments recorded at low speeds which indicated a deviation from an ideal cycling scenario. We selected and merged the grid cells with friction intensity between 50% and 200% to define the third level frictions. We, therefore, described the frictions based on the surrounding infrastructure, and the location within the urban area.
Our contribution includes a crowdsourced dataset of bicycle trips from three European cities and analysis tools to identify the frictions inhibiting bicycle commuting. The use case presented in this paper contributes to the current trend of analysing bicycle commuting and serves as a reference for cities willing to evaluate its cycling environment. However, due to the limited number of participants, our results reflect only the participants’ behaviour and cannot be generalised to a city level. With a broader sample size, our method could be used to produce results that represent better the cycling conditions at a city level.
Despite the generic definition of frictions used for this study, it supported our methodology and the reproducibility of the experiment. Future work should consider validation fieldwork or co-validation from participants. The experimental setup is suitable for analysing crowdsourced datasets coming from mobile phones and to describe the frictions inhibiting bicycle commuting. The use of a grid-based analysis and a common framework for the urban areas guaranteed the comparison between cities. Finally, it expanded the traditional analysis of individual bicycle trips by spatially aggregating them into units out of the streets such as open spaces or pedestrian areas.
Author Contributions
Conceptualisation and literature review, D.P. and M.G.; methodology design, D.P.; software, D.P.; investigation, D.P.; writing—original draft preparation, D.P.; writing—review and editing, D.P and M.G.
Funding
This research was funded by the European Union through the GEO-C project (H2020-MSCA-ITN-2014, Grant Agreement Number 642332. The monetary reward for participants was funded by the Association of Geographic Information Laboratories of Europe—AGILE. The research stay at University of Malta for participants recruitment in Valletta was founded by the European Union through the COST Action CA15212.
Acknowledgments
The authors of this document gratefully acknowledge funding from the European Union through the GEO-C project http://www.geo-c.eu/); from the Citizen Science COST Action CA15212 www.cs-eu.net; and from the AGILE bursaries for Early Stage Researchers https://agile-online.org. The authors also acknowledge the fruitful discussion and valuable input for this research provided by Carlos Granell, Universitat Jaume I, and Auriol Degbelo, University of Münster. The experiment has been satisfactorily granted by the Committee of Ethics at Universitat Jaume I with the reference number 04/2018 and the Committee of Ethics at the Institute for Geoinformatics, University of Münster.
Conflicts of Interest
The authors declare no conflict of interest. The founding sponsors had no role in the design of the study; in the collection, analyses, or interpretation of data; in the writing of the manuscript, and in the decision to publish the results.
Abbreviations
The following abbreviations are used in this manuscript:
| LBS | Location-Based Services |
| FUA | Functional Urban Areas |
| GPS | Global Positioning System |
| GA | Grid Area |
| HFI | High Fiction Intensity |
| OCT | Open City Toolkit |
| OECD | Organisation for Economic Co-operation and Development |
| UMZ | Urban Morphological Zones |
| WGS84 | World Geodetic Reference System |
Appendix A
This appendix describes the data structure of the input data used for the study. Files are open and available as a ZENODO dataset “Bicycle trips collected using Cyclists Geo-C geo-game” at https://zenodo.org/record/1421305.

Table A1.
Description of the datasets used for the study.
| File | Field | Description |
|---|---|---|
| Cyclist_Location.csv | Device | Code identifying the user/device recording the location |
| Latitude | Location latitude in decimal degrees | |
| Longitude | Location longitude in decimal degrees | |
| Altitude | Location altitude in metres | |
| Precision | Location precision or accuracy of the location reported by the device | |
| time_gps | Recording time in format: ’YYYY-MM-DDThh:mm:ss.sssZ’ | |
| Cyclist_Measurement.csv | Device | Code identifying the user/device recording the measurement |
| Time_device | Recording time in format: ’YYYY-MM-DDThh:mm:ss.sssZ’ | |
| Measurement | Kind of measurement recorded: last recorded distance, distance from the trip start, last recorded speed. The kind of measurement defines the measurement units: metres (m) or metres per second (ms) | |
| value | Measurement value | |
| Cyclist_Trip.csv | Device | Code identifying the user/device recording the trip |
| Trip_count | Number identifying the trip | |
| Start_point.0 | Start point longitude | |
| Start_point.1 | Start point latitude | |
| End_latitude | End point latitude | |
| End_longitude | End point longitude | |
| Trip_start | Time when the trip started in format: ’YYYY-MM-DDThh:mm:ss.sssZ’ | |
| Trip_stop | Time when the trip ended in format: ’YYYY-MM-DDThh:mm:ss.sssZ’ | |
| Cyclist_Tag.csv | Device | Code identifying the user/device recording the tag |
| Trip_count | Number identifying the trip number associated with the tag | |
| Tag_count | Number identifying the tag | |
| Text | Raw tag text |
Appendix B
Complementary material and information about the Open City Toolkit is available online at http://geo-c.eu/opencitytoolkit.
The source code of the Cyclist Geo-C mobile App is available online at: https://github.com/GeoTecINIT/Mag-ike.
The dataset and the functions used for the study are available online at: https://github.com/GeoTecINIT/CyclingPathAnalysis.
References
- Oldenziel, R.; Emanuel, M.; de la Bruheze, A.A.A.; Veraart, F. Cycling Cities: The European Experience; Foundation for the History of Technology and Rachel Carson Center for Environment and Society: Eindhoven, The Netherlands, 2015; p. 256. [Google Scholar]
- Handy, S.; van Wee, B.; Kroesen, M. Promoting Cycling for Transport: Research Needs and Challenges. Transp. Rev. 2014, 34, 4–24. [Google Scholar] [CrossRef]
- Grant-Muller, S.; Gal-Tzur, A.; Minkov, E.; Kuflik, T.; Nocera, S.; Shoo, I. Transport Policy: Social Media and User-Generated Content in a Changing Information Paradigm. In Social Media for Government Services; Nepal, S., Paris, C., Georgakopoulos, D., Eds.; Springer: Cham, Switzerland, 2015; pp. 325–361. [Google Scholar]
- Garrard, J. Evaluating cycling promotion interventions. In Cycling Futures; Burton, R., Ed.; University of Adelaide Press: Adelaide, Australia, 2015; pp. 429–452. [Google Scholar]
- Pucher, J.; Buehler, R. Making Cycling Irresistible: Lessons from The Netherlands, Denmark and Germany. Transp. Rev. 2008, 28, 495–528. [Google Scholar] [CrossRef]
- Koglin, T.; Rye, T. The marginalisation of bicycling in Modernist urban transport planning. J. Transp. Health 2014, 1, 214–222. [Google Scholar] [CrossRef] [Green Version]
- Rodrigue, J.P.; Comtois, C.; Slack, B. The Geography of Transport Systems; Routledge: London, UK, 2013. [Google Scholar]
- Jacobsen, P. Safety in numbers: More walkers and bicyclists, safe walking and biking. Inj. Prev. 2003, 9, 205–209. [Google Scholar] [CrossRef] [PubMed]
- Küster, F.; Blondel, B. Calculating the economic benefits of cycling in EU-27. Eur. Cycl. Fed. 2013, 1–18. [Google Scholar]
- Nielsen, T.A.S.; Skov-Petersen, H.; Agervig Carstensen, T. Urban planning practices for bikeable cities—The case of Copenhagen. Urban Res. Pract. 2013, 6, 110–115. [Google Scholar] [CrossRef]
- Pucher, J.; Buehler, R. Cycling towards a more sustainable transport future. Transp. Rev. 2017, 37, 1–6. [Google Scholar] [CrossRef]
- Cohen-Blankshtain, G.; Rotem-Mindali, O. Key research themes on ICT and sustainable urban mobility. Int. J. Sustain. Transp. 2016, 10, 9–17. [Google Scholar] [CrossRef]
- Leslie, E.; Coffee, N.; Frank, L.; Owen, N.; Bauman, A.; Hugo, G. Walkability of local communities: Using geographic information systems to objectively assess relevant environmental attributes. Health Place 2007, 13, 111–122. [Google Scholar] [CrossRef] [PubMed]
- Roughton, C.; van Hengel, D.; Duncan, A.; Weigand, L.; Birk, M. CREATING WALKABLE + BIKEABLE COMMUNITIES: A User Guide to Developing Pedestrian and Bicycle Master Plans; Technical Report; Initiative for Bicycle and Pedestrian Innovation Center for Transportation Studies, Portland State University: Portland, OR, USA, 2012. [Google Scholar]
- Pooley, C.G.; Jones, T.; Horton, D.; Jopson, A.; Mullen, C.; Chisholm, A.; Constantine, S. Understanding Walking and Cycling: Summary of Key Findings And Recommendations; Technical Report; Lancaster Environment Centre, Lancaster University: Lancaster, UK, 2011. [Google Scholar]
- Fishman, E.; Washington, S.; Haworth, N. Barriers and facilitators to public bicycle scheme use: A qualitative approach. Transp. Res. Part F Traffic Psychol. Behav. 2012, 15, 686–698. [Google Scholar] [CrossRef] [Green Version]
- Flügel, S.; Ramjerdi, F.; Veisten, K.; Killi, M.; Elvik, R. Valuation of Cycling Facilities with and without Controlling for Casualty Risk. Int. J. Sustain. Transp. 2015, 9, 364–376. [Google Scholar] [CrossRef]
- Fyhri, A.; Heinen, E.; Fearnley, N.; Sundfør, H.B. A push to cycling—Exploring the e-bike’s role in overcoming barriers to bicycle use with a survey and an intervention study. Int. J. Sustain. Transp. 2017, 11, 681–695. [Google Scholar] [CrossRef]
- Hopkins, D.; Mandic, S. Perceptions of cycling among high school students and their parents. Int. J. Sustain. Transp. 2017, 11, 342–356. [Google Scholar] [CrossRef]
- Bleser, G.; Steffen, D.; Reiss, A.; Weber, M.; Hendeby, G.; Fradet, L. Personalized Physical Activity Monitoring Using Wearable Sensors. In Smart Health. Lecture Notes in Computer Science; Springer: Cham, Switzerland, 2015; Volume 8700, pp. 99–124. [Google Scholar]
- op den Akker, H.; Jones, V.M.; Hermens, H.J. Tailoring real-time physical activity coaching systems: A literature survey and model. User Model. User-Adapt. Interact. 2014, 24, 351–392. [Google Scholar] [CrossRef]
- Gong, L.; Sato, H.; Yamamoto, T.; Miwa, T.; Morikawa, T. Identification of activity stop locations in GPS trajectories by density-based clustering method combined with support vector machines. J. Mod. Transp. 2015, 23, 202–213. [Google Scholar] [CrossRef] [Green Version]
- Bigazzi, A.Y. Determination of active travel speed for minimum air pollution inhalation. Int. J. Sustain. Transp. 2017, 11, 221–229. [Google Scholar] [CrossRef]
- Pajarito, D.; Gould, M. Smart Mobility, the Role of Mobile Games. In Lecture Notes in Computer Science; Springer: Cham, Switzerland, 2017; pp. 44–59. [Google Scholar]
- Deterding, S.; Dixon, D.; Khaled, R.; Nacke, L. From game design elements to gamefulness. In Proceedings of the 15th MindTrek ’11 International Academic MindTrek Conference on Envisioning Future Media Environments, Tampere, Finland, 28–30 September 2011; ACM Press: New York, NY, USA, 2011; p. 9. [Google Scholar]
- Huotari, K.; Hamari, J. Defining gamification. In Proceedings of the 16th MindTrek ’12 International Academic MindTrek Conference on Media of the Future, Tampere, Finland, 3–5 October 2012; ACM Press: New York, NY, USA, 2012; p. 17. [Google Scholar]
- Rissel, C. Health benefits of cycling. In Cycling Futures; Bonham, J., Johnson, M., Eds.; The University of Adelaide Press: Adelaide, Australia, 2015; Chapter 3; pp. 43–62. [Google Scholar]
- Schlieder, C.; Kiefer, P.; Matyas, S. Geogames: Designing Location-Based Games from Classic Board Games. IEEE Intell. Syst. 2006, 21, 40–46. [Google Scholar] [CrossRef]
- Coombes, E.; Jones, A. Gamification of active travel to school: A pilot evaluation of the Beat the Street physical activity intervention. Health Place 2016, 39, 62–69. [Google Scholar] [CrossRef] [PubMed] [Green Version]
- Ahlqvist, O.; Schlieder, C. Introducing Geogames and Geoplay: Characterizing an Emerging Research Field. In Geogames and Geoplay; Springer: Cham, Switzerland, 2018; pp. 1–18. [Google Scholar]
- OpenStreetMap contributors. OpenStreetMap, Planet Dump. Available online: https://www.openstreetmap.org (accessed on 6 June 2016).
- Haklay, M.; Weber, P. OpenStreetMap: User-Generated Street Maps. IEEE Pervasive Comput. 2008, 7, 12–18. [Google Scholar] [CrossRef] [Green Version]
- Strava Inc. Strava. Available online: https://www.strava.com (accessed on 6 June 2016).
- Under Armour Inc. Endomondo. Available online: https://www.endomondo.com (accessed on 11 November 2016).
- Wikiloc Outdoor S.L. Wikiloc. Available online: https://www.wikiloc.com (accessed on 18 May 2016).
- Claudel, M.; Nagel, T.; Ratti, C. From Origins to Destinations: The Past, Present and Future of Visualizing Flow Maps. Built Environ. 2016, 42, 338–355. [Google Scholar] [CrossRef]
- Meier, S. Visualizing Large Spatial Time Series Data on Mobile Devices: Combining the HeatTile System with a Progressive Loading Approach. In Cartography—Maps Connecting the World; Springer: Cham, Switzerland, 2015; pp. 161–173. [Google Scholar]
- Adrienko, N.; Adrienko, G. Spatial generalization and aggregation of massive movement data. IEEE Trans. Vis. Comput. Gr. 2011, 17, 205–219. [Google Scholar] [CrossRef] [PubMed]
- Marchal, F.; Hackney, J.; Axhausen, K.W. Speed and Location Observations from Global Positioning System Efficient Map Matching of Large Global Positioning System Data Sets Tests on Speed-Monitoring Experiment in Zürich. In Transportation Research Record: Journal of the Transportation Research Board; Transportation Research Board of the National Academies: Washington, DC, USA, 2005. [Google Scholar]
- Snizek, B.; Sick Nielsen, T.A.; Skov-Petersen, H. Mapping bicyclists’ experiences in Copenhagen. J. Transp. Geogr. 2013, 30, 227–233. [Google Scholar] [CrossRef]
- Sultan, J.; Ben-Haim, G.; Haunert, J.H.; Dalyot, S. Extracting spatial patterns in bicycle routes from crowdsourced data. Trans. GIS 2017, 21, 1321–1340. [Google Scholar] [CrossRef]
- Berger, M.; Platzer, M. Field Evaluation of the Smartphone-based Travel Behaviour Data Collection App “SmartMo”. Transp. Res. Procedia 2015, 11, 263–279. [Google Scholar] [CrossRef]
- Tang, J.; Song, Y.; Miller, H.J.; Zhou, X. Estimating the most likely space–time paths, dwell times and path uncertainties from vehicle trajectory data: A time geographic method. Transp. Res. Part C Emerg. Technol. 2016, 66, 176–194. [Google Scholar] [CrossRef] [Green Version]
- Larsen, J.; Patterson, Z.; El-Geneidy, A. Build It. But Where? The Use of Geographic Information Systems in Identifying Locations for New Cycling Infrastructure. Int. J. Sustain. Transp. 2013, 7, 299–317. [Google Scholar] [CrossRef]
- Sainio, J.; Westerholm, J.; Oksanen, J. Generating Heat Maps of Popular Routes Online from Massive Mobile Sports Tracking Application Data in Milliseconds While Respecting Privacy. ISPRS Int. J. Geo-Inf. 2015, 4, 1813–1826. [Google Scholar] [CrossRef] [Green Version]
- Strava Inc. Global Heatmap. Available online: https://strava.com/heatmap (accessed on 20 January 2017).
- Polar Electro. Polar Explore Map; Polar Electro: Kempele, Finland, 2018. [Google Scholar]
- Nelson, T.A.; Denouden, T.; Jestico, B.; Laberee, K.; Winters, M. BikeMaps.org: A Global Tool for Collision and Near Miss Mapping. Front. Public Health 2015, 3, 53. [Google Scholar] [CrossRef] [PubMed]
- Dameri, R.P.; Benevolo, C. ICT Intensity in Smart Mobility Initiatives. In Smart City Implementation; Springer: Cham, Switzerland, 2017; pp. 85–108. [Google Scholar]
- Burke, J.; Estrin, D.; Hansen, M.; Parker, A.; Ramanathan, N.; Reddy, S.; Srivastava, M.B. Participatory Sensing; UCLA, Center for Embedded Network Sensing: Los Angeles, CA, USA, 2006. [Google Scholar]
- Zeile, P.; Resch, B.; Loidl, M.; Petutschnig, A.; Dörrzapf, L. Urban Emotions and Cycling Experience—Enriching traffic planning for cyclists with human sensor data. J. Geog. Inf. Sci. GI_Forum 2016, 1, 204–216. [Google Scholar] [CrossRef]
- Pucher, J.; Dill, J.; Handy, S. Infrastructure, programs, and policies to increase bicycling: An international review. Prev. Med. 2010, 50, 106–125. [Google Scholar] [CrossRef] [PubMed]
- Halko, S.; Kientz, J.A. Personality and Persuasive Technology: An Exploratory Study on Health-Promoting Mobile Applications. In Lecture Notes in Computer Science; Springer: Berlin/Heidelberg, Germany, 2010; Volume 6137, pp. 150–161. [Google Scholar]
- Barratt, P. Healthy competition: A qualitative study investigating persuasive technologies and the gamification of cycling. Health Place 2017, 46, 328–336. [Google Scholar] [CrossRef] [PubMed]
- Wojan, T.R.; Hamrick, K.S. Can Walking or Biking to Work Really Make a Difference? Compact Development, Observed Commuter Choice and Body Mass Index. PLoS ONE 2015, 10, e0130903. [Google Scholar] [CrossRef] [PubMed]
- Münster Stadt. Bicyles in Münster; Münster Stadt: Münster, Germany, 2017. [Google Scholar]
- Ayuntament de Castelló. Plan Director de la Bicicleta de Castellón; Technical Report; Ayuntament de Castelló, Castellón de la Plana: Castellón, Spain, 2016.
- Land Transport Authority. Land Transport Master Plan; Land Transport Authority: Singapore, 2013.
- Pajarito, D.; Degbelo, A.; Gould, M. Collaboration or Competition: The Impact of Incentive Types on Urban Cycling. Int. J. Sus. Transp. 2018. Unpublished Manuscript Submitted for Publication. [Google Scholar]
- Google Inc. Google Fit; Google Inc.: Mountain View, CA, USA, 2017. [Google Scholar]
- Pajarito, D.; Gould, M. Bicycle Trips Collected Using Cyclists Geo-C Geo-Game. Available online: https://zenodo.org/record/1421305 (accessed on 25 September 2018).
- OECD. Functional Urban Areas by Country; OECD: Paris, France, 2017. [Google Scholar]
- European Environment Agency. Urban Morphological Zones; European Environment Agency: Copenhagen, Denmark, 2006. [Google Scholar]
- Butler, H.; Daly, M.; Doyle, A.; Gillies, S.; Schaub, T.; Schmidt, C. The GeoJSON Format Specification; Rapport Technique: Rimouski, QC, Canada, 2016. [Google Scholar]
- Birch, C.P.; Oom, S.P.; Beecham, J.A. Rectangular and hexagonal grids used for observation, experiment and simulation in ecology. Ecol. Model. 2007, 206, 347–359. [Google Scholar] [CrossRef]
- Orellana, D.; Wachowicz, M. Exploring Patterns of Movement Suspension in Pedestrian Mobility. Geogr. Anal. 2011, 43, 241–260. [Google Scholar] [CrossRef] [PubMed]
- Orellana, D. Exploring Pedestrian Movement Patterns. Ph.D. Thesis, Wageningen University, Wageningen, The Netherlands, 2012. [Google Scholar]
- St-Louis, E.; Manaugh, K.; Van Lierop, D.; El-Geneidy, A. The happy commuter: A comparison of commuter satisfaction across modes. Transp. Res. Part F Traffic Psychol. Behav. 2014, 26, 160–170. [Google Scholar] [CrossRef]
- Tolley, R.; Turton, B.J. Transport Systems, Policy and Planning: A Geographical Approach; Routledge: London, UK, 2014; p. 420. [Google Scholar]
- Nüst, D.; Granell, C.; Hofer, B.; Konkol, M.; Ostermann, F.O.; Sileryte, R.; Cerutti, V. Reproducible research and GIScience: An evaluation using AGILE conference papers. PeerJ 2018, 6, e5072. [Google Scholar] [CrossRef] [PubMed]
- Degbelo, A.; Bhattacharya, D.; Granell, C.; Trilles, S. Toolkits for smarter cities: A brief assessment. In Lecture Notes in Computer Science (Including Subseries Lecture Notes in Artificial Intelligence and Lecture Notes in Bioinformatics); García, C.R., Caballero-Gil, P., Burmester, M., Quesada-Arencibia, A., Eds.; Springer: Cham, Switzerland, 2016; Volume 10070, pp. 431–436. [Google Scholar]
- Degbelo, A.; Granell, C.; Trilles, S.; Bhattacharya, D.; Casteleyn, S.; Kray, C. Opening up Smart Cities: Citizen-Centric Challenges and Opportunities from GIScience. ISPRS Int. J. Geo-Inf. 2016, 5, 16. [Google Scholar] [CrossRef] [Green Version]
Figure 1.
Study area.

Figure 2.
Trip and trips segments at a grid cell, two scenarios.

Figure 3.
Hourly distribution of cycled distance per day of the week.

Figure 4.
Cycling segments and speed distribution during the day.

Figure 5.
Trips and segments per trip in the three cities.

Figure 6.
Aggregated third level frictions intensity and size.

Figure 7.
Bicycle trips, first and third level frictions.

Figure 8.
Four typical scenarios for third level frictions.

Figure 9.
Cycled distance using bicycle paths.

Figure 10.
Cycled distance, proportion per trip.
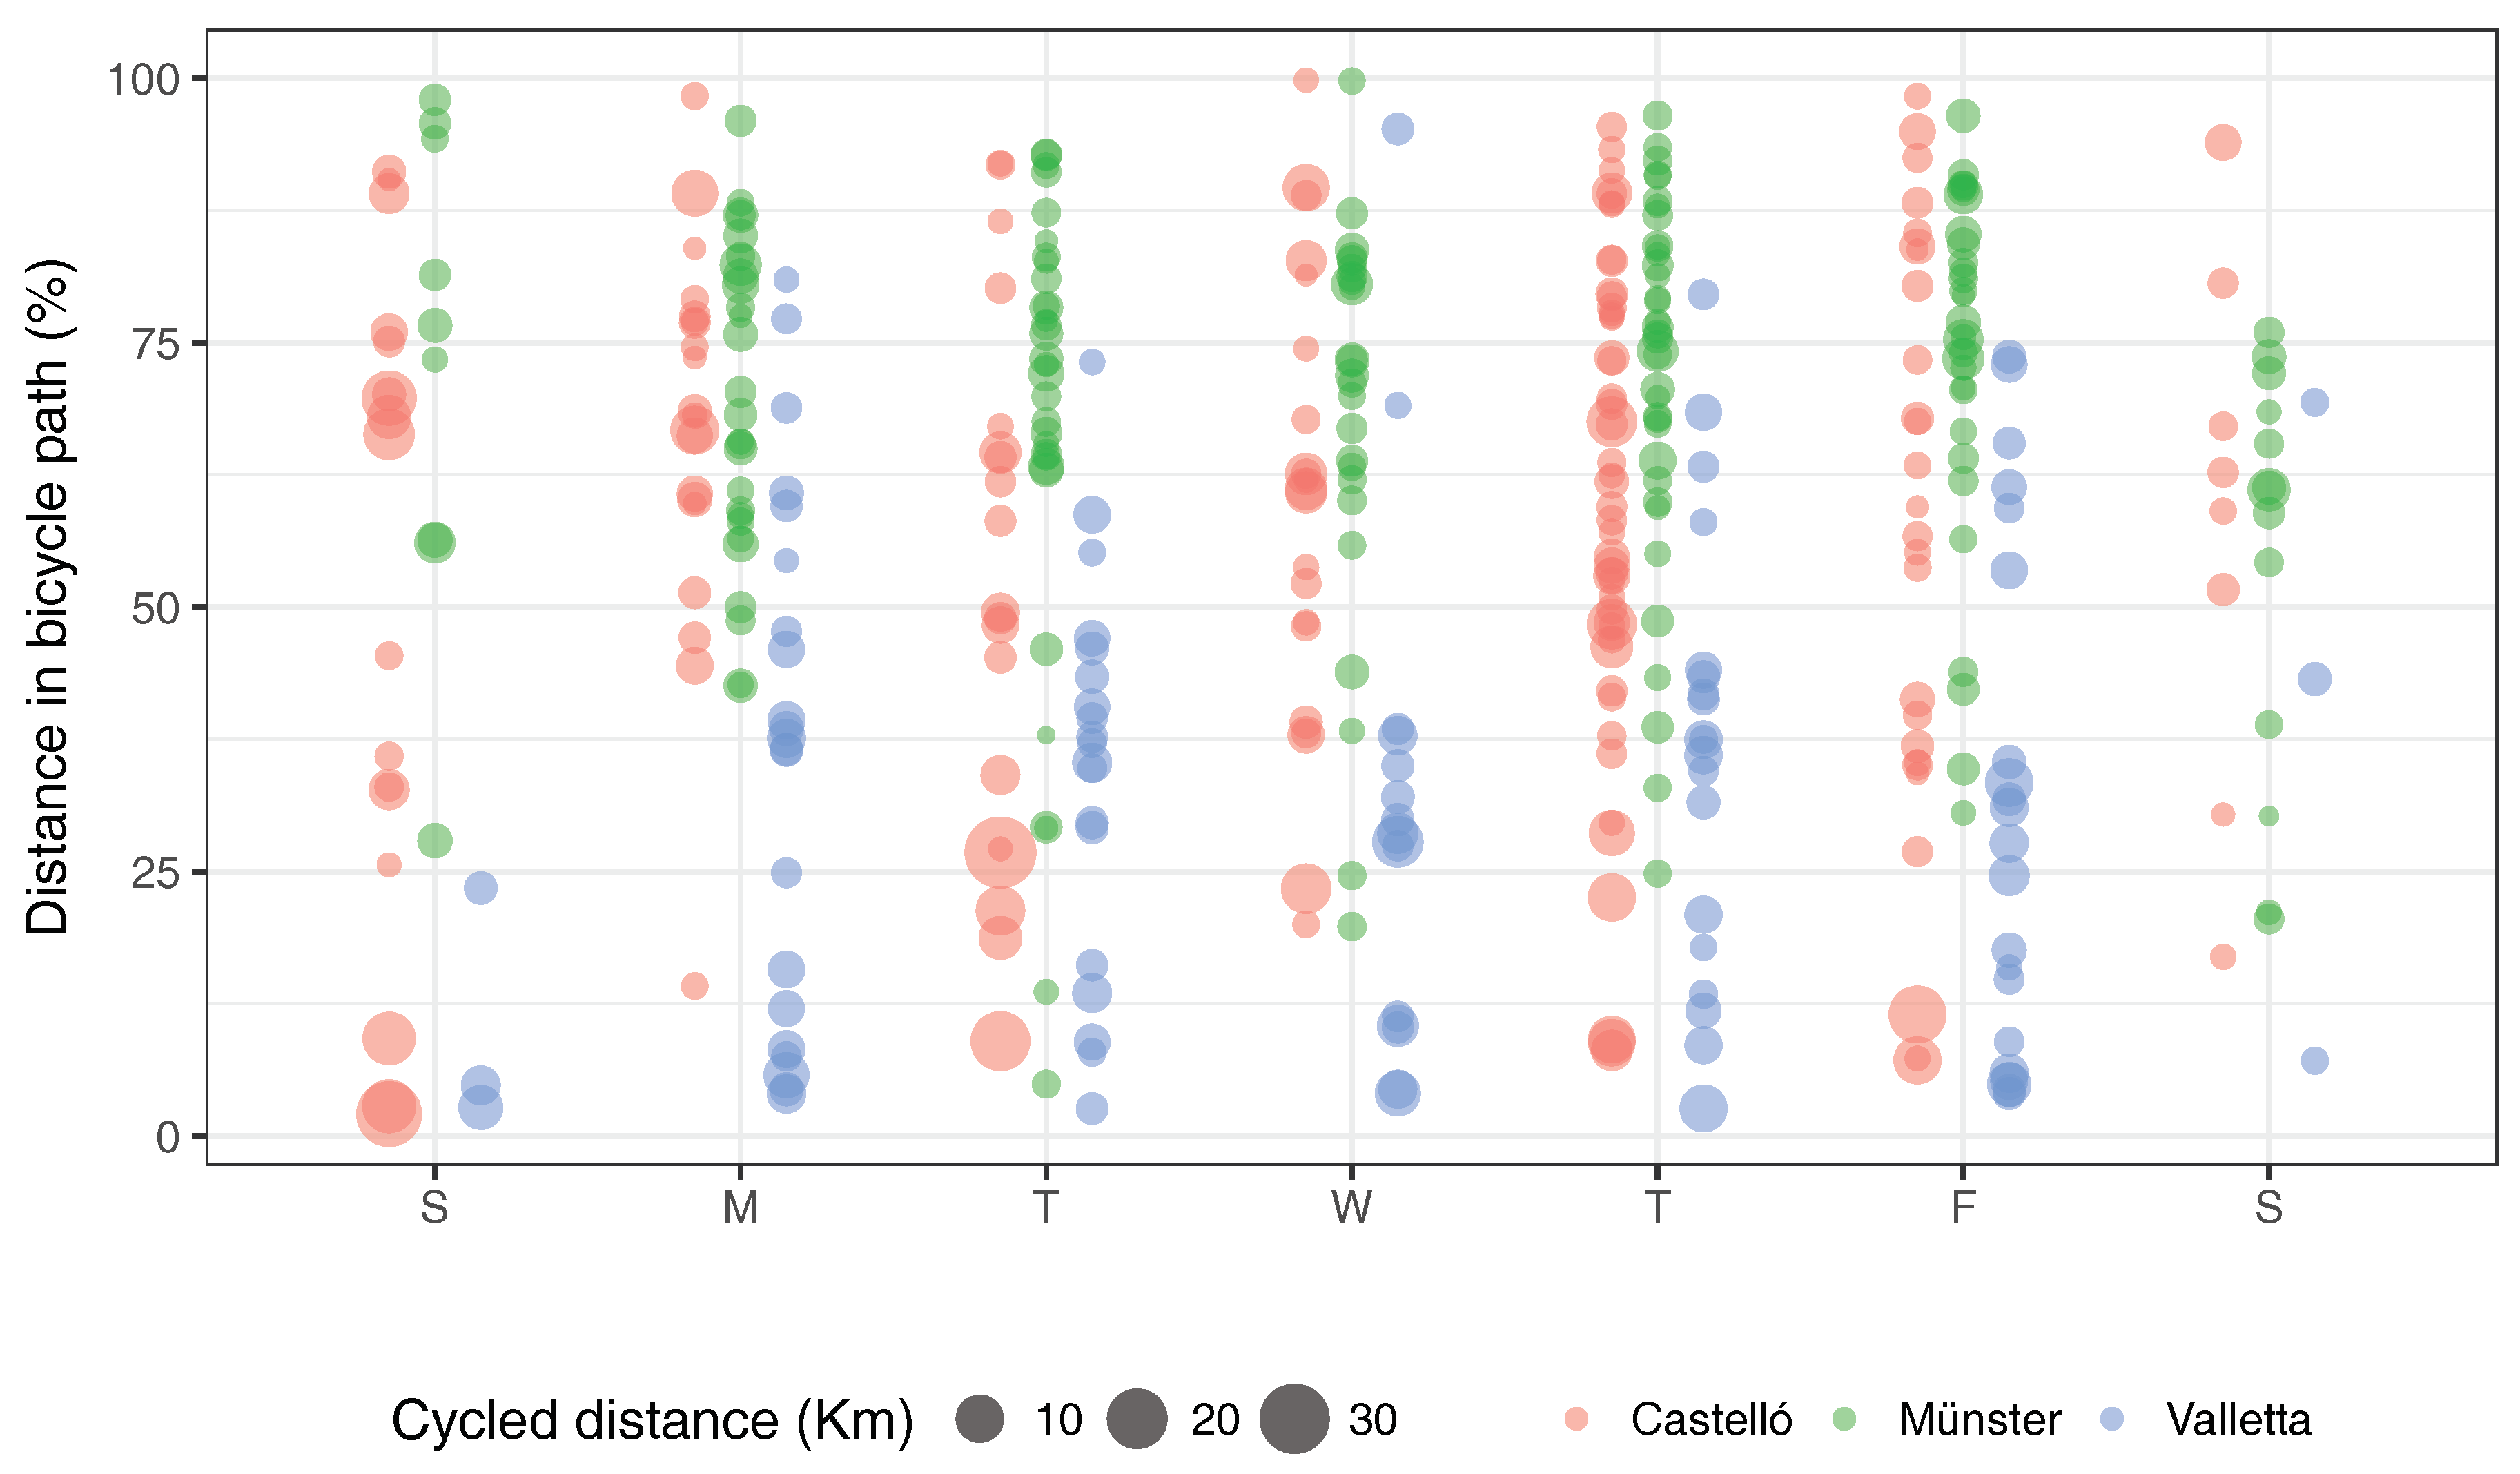
Figure 11.
Average cycling speed and bicycle paths.
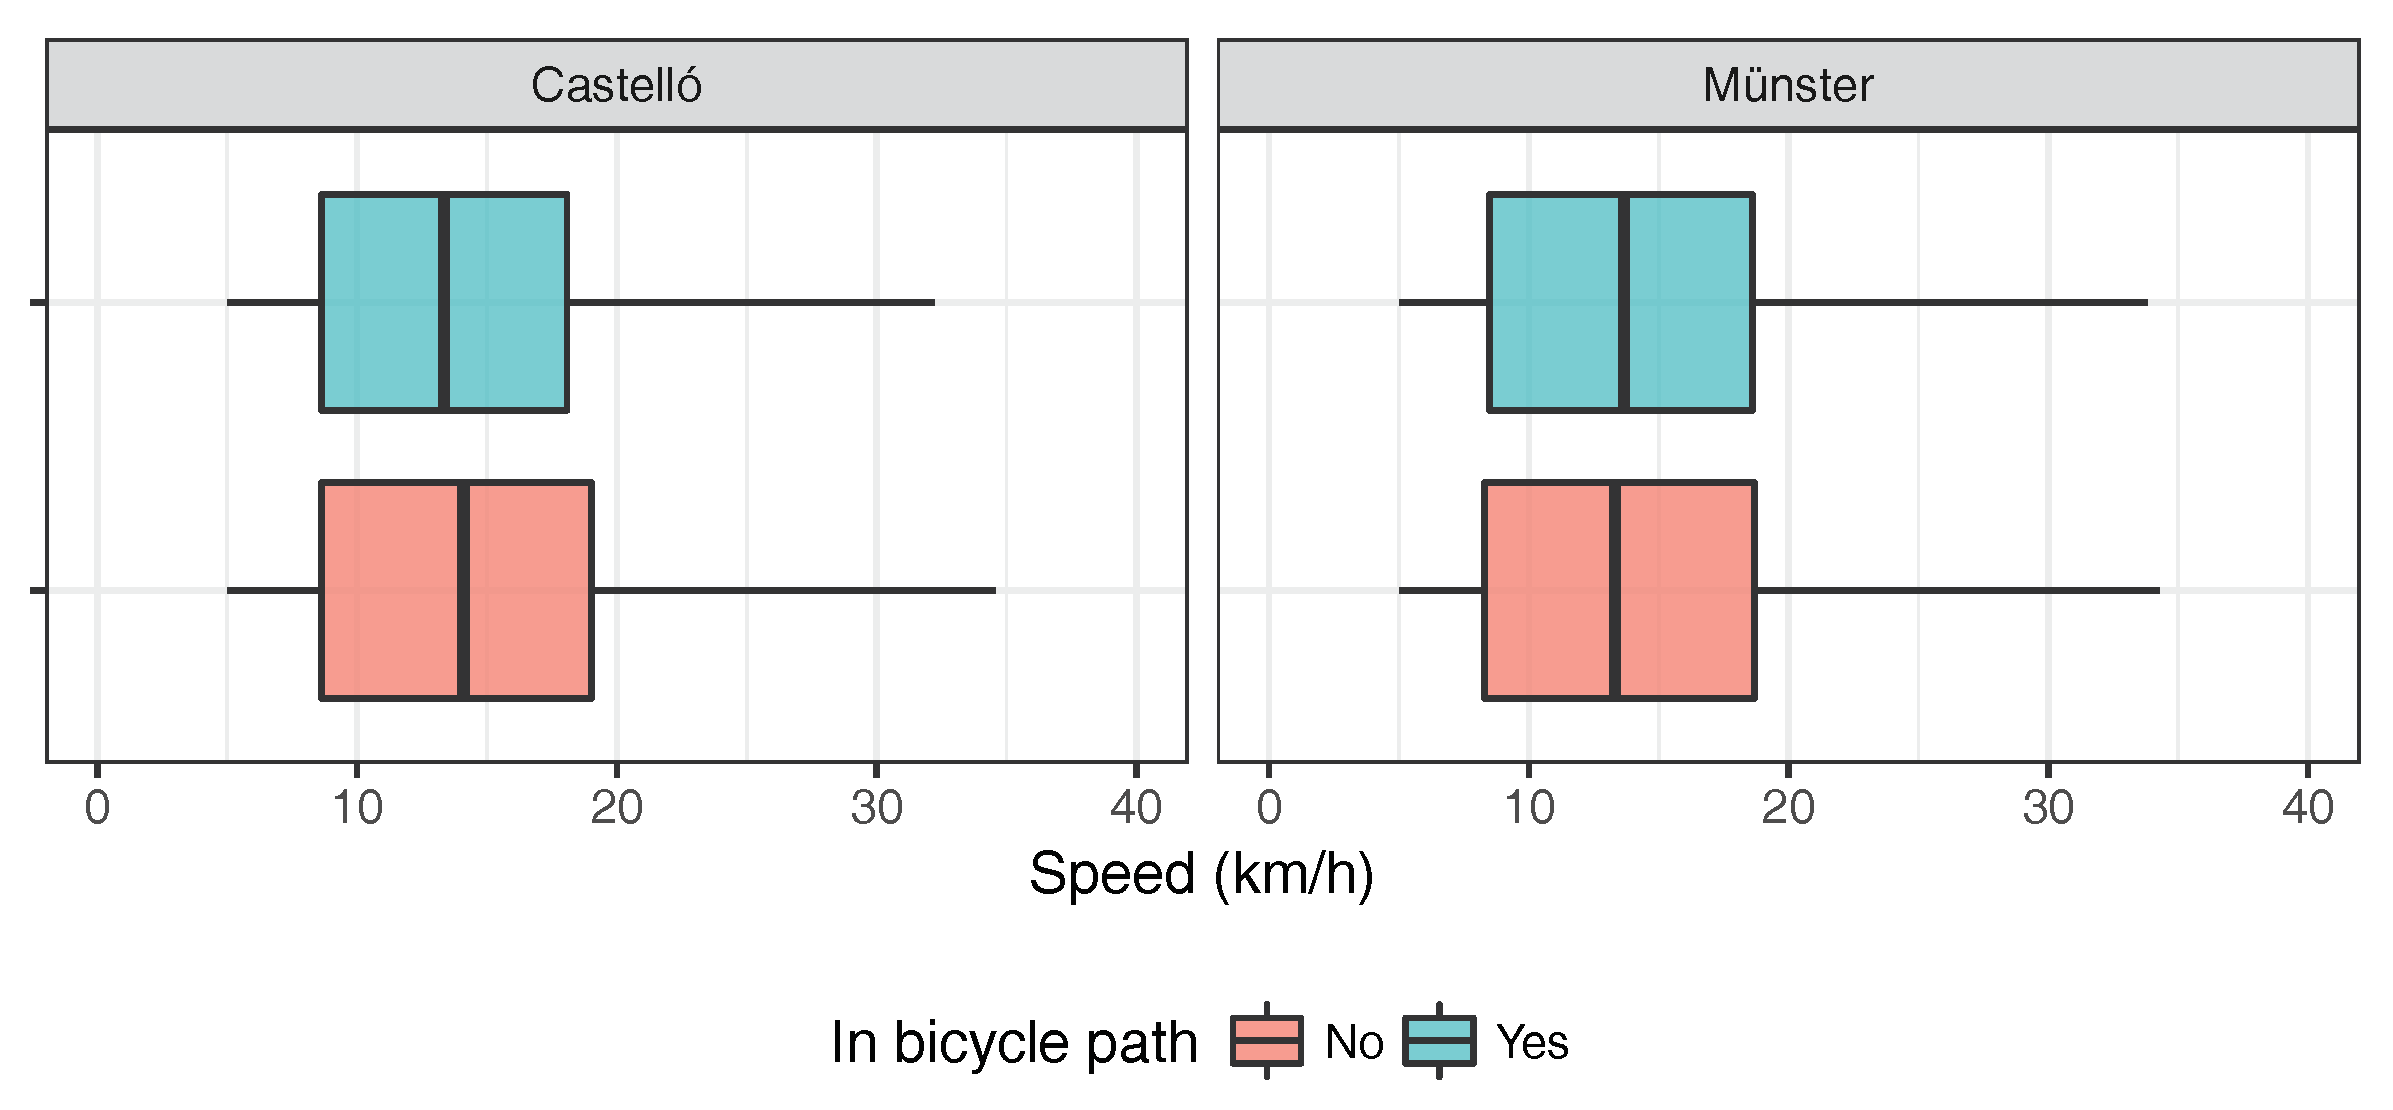
Table 1.
Demographic information of participants.
| Münster (Germany) | Castelló (Spain) | Valletta (Malta) | Total | ||
|---|---|---|---|---|---|
| Male | 11 | 12 | 11 | 35 | |
| Female | 9 | 8 | 6 | 24 | |
| Age | Min. | 23.0 | 15.0 | 20.0 | 15.0 |
| Median | 32.0 | 36.5 | 28.0 | 32.5 | |
| Mean | 31.6 | 36.4 | 32.1 | 33.4 | |
| Max. | 38.0 | 46.0 | 58.0 | 58.0 | |
| Marital Status | Single | 6 | 9 | 8 | 23 |
| Not living together | 6 | 3 | 3 | 12 | |
| Living together | 2 | 2 | 2 | 6 | |
| Married | 6 | 6 | 4 | 16 | |
Table 2.
Variables calculated during the study.
| Variable | Description |
|---|---|
| n_trips | Number of trips crossing by or intersecting a grid cell. |
| n_segments | Number of segments crossing by or intersecting a grid cell. |
| n_cycling_segments | Number of cycling segments crossing by or intersecting a grid cell used to estimate the friction intensity. |
| n_walking_segments | Number of walking segments crossing by or intersecting a grid cell used to estimate the friction intensity. |
| n_origin | Number of trip origin points contained by a grid cell. It defined if the grid cell was considered or not a friction. |
| n_destination | Number of trip destination points contained by a grid cell. It defined if the grid cell was considered or not a friction. |
| in_umz | 1 when the grid cell is inside the UMZ, 0 when is outside. It determined whether the grid cell as in or out the urban area of a city. |
| in_fua | 1 when the grid cell is inside the FUA, 0 when is outside. It determined whether the grid cell was in or out the study area. |
Table 3.
Distribution of bicycle trips and segments recorded during the experiment.
| Cycled Distance | Trips | Segments | Cycling Segments | |
|---|---|---|---|---|
| Münster | 306.6 km | 632 | 14.725 | 39.61% |
| Castelló | 556.3 km | 513 | 25.678 | 54.12% |
| Valletta | 331.7 km | 460 | 22.565 | 23.96% |
| Total | 1.878 km | 1.605 | 62.968 | 39.92% |
© 2018 by the authors. Licensee MDPI, Basel, Switzerland. This article is an open access article distributed under the terms and conditions of the Creative Commons Attribution (CC BY) license (http://creativecommons.org/licenses/by/4.0/).
Share and Cite
MDPI and ACS Style
Pajarito, D.; Gould, M. Mapping Frictions Inhibiting Bicycle Commuting. ISPRS Int. J. Geo-Inf. 2018, 7, 396. https://0-doi-org.brum.beds.ac.uk/10.3390/ijgi7100396
AMA Style
Pajarito D, Gould M. Mapping Frictions Inhibiting Bicycle Commuting. ISPRS International Journal of Geo-Information. 2018; 7(10):396. https://0-doi-org.brum.beds.ac.uk/10.3390/ijgi7100396
Chicago/Turabian StylePajarito, Diego, and Michael Gould. 2018. "Mapping Frictions Inhibiting Bicycle Commuting" ISPRS International Journal of Geo-Information 7, no. 10: 396. https://0-doi-org.brum.beds.ac.uk/10.3390/ijgi7100396
Note that from the first issue of 2016, this journal uses article numbers instead of page numbers. See further details here.