Article

Analyzing OpenStreetMap Road Data and Characterizing the Behavior of Contributors in Ankara, Turkey

Department of Geomatic Engineering, Faculty of Civil Engineering, Yildiz Technical University, Davutpasa Campus, 34220 Esenler, Istanbul, Turkey
*
Author to whom correspondence should be addressed.
ISPRS Int. J. Geo-Inf. 2018, 7(10), 400; https://0-doi-org.brum.beds.ac.uk/10.3390/ijgi7100400
Submission received: 31 July 2018 / Revised: 18 September 2018 / Accepted: 4 October 2018 / Published: 6 October 2018
(This article belongs to the Special Issue Human-Centric Data Science for Urban Studies)

Abstract

:
The usage of OpenStreetMap (OSM), one of the resources offered by Volunteered Geographic Information (VGI), has rapidly increased since it was first established in 2004. In line with this increased usage, a number of studies have been conducted to analyze the accuracy and quality of OSM data, but many of them have constraints on evaluating the profiles of contributors. In this paper, OSM road data have been analyzed with the aim of characterizing the behavior of OSM contributors. The study area, Ankara, the capital city of Turkey, was evaluated with several network analysis methods, such as completeness, degree of centrality, betweenness, closeness, PageRank, and a proposed method measuring the activation of contributors in a bounded area from 2007–2017. An evaluation of the results was also discussed in this paper by taking into account the following indicators for each year: number of nodes, ways, contributors, mean lengths, and sinuosity values of roads. The results show that the experience levels of the contributors determine the contribution type. Essentially, more experience makes for more detailed contributions.

1. Introduction

For several decades, the task of mapping had been executed by trained staff in state organizations [1]. In the early days, military interests dominated mapping activities; however, with the advancement of Web 2.0 technology, this responsibility shifted more to laymen, mostly volunteers and non-experts [2,3]. One prominent example is the OpenStreetMap (OSM) project, an impressive Volunteered Geographic Information (VGI) resource, which was established in 2004 to allow contributors to engage in the common goal of producing and editing spatial data in a joint, collaborative effort. Some surveys have been conducted to determine the proficiency of OSM contributors, but they have pointed out that more than half of the contributors were not Geographic Information System (GIS) amateurs, which does not completely support the transition to using laymen [4,5].
Evaluating VGI data before using it for its intended purpose is crucial for determining the quality of data collected or produced [6]. The assessment of the VGI network data is generally carried out from the same perspective as that for spatial networks. As detailed below, a number of studies have been conducted to examine the statistical evolution of road networks, which are a type of spatial network. Buhl et al. [7] analyzed the topological patterns of a large number of different settlements using the approach of complex networks. Crucitti et al. [8] compared over-samples of different urban centers to analyze five different measures of centrality and the differences between self-organized and planned cities. Jiang [9] derived a topological pattern of urban road networks using a large sample of 40 US cities and found that 80% of streets have fewer degrees than average and 20% of streets have higher degrees than average. Barthélemy and Flammini [10] proposed a simple model of network evolution based on local optimization combined with ideas previously proposed in studies of leaf pattern formation. The authors found that the evolution of many different transportation networks indeed follows a simple universal mechanism. Masucci et al. [11] examined the street network of London both in its primary and dual representations. Erath et al. [12] examined the evolution of the Swiss road system and railway network from 1950–2000. Ferber et al. [13] developed an empirical transit system model for major world cities including Sydney and Paris with varying station sizes on public transport networks. Soh et al. [14] analyzed the travel routes of the public rail and bus transportation systems in Singapore from a complex weighted network perspective. Masucci et al. [15] examined a unique dataset based on the street patterns of London metropolitan areas at nine time instants represented as nine map series spanning over 224 years (1786–2010). Strano et al. [16] analyzed almost 200 years of the evolution of the road network in a large area located north of Milan, Italy to be governed by two elementary processes, referred to as densification and exploration. They defined densification and exploration as “corresponding to an increase in the local density of roads around existing urban centers” and “whereby new roads trigger the spatial evolution of the urbanization front,” respectively. Their study shows that the rise of urbanization is reflected in the growth of road networks and occurs at differing speeds at different times, such as the significantly rapid increase that occurred between 1933 and 1994.
With the advancement of Web 2.0 technology, street network analysis, which is a specific field of VGI, has been realized on OSM. OSM studies cover a broad range, such as quality assessment [17], data analysis, types of usage, the accuracy of contributed data, and the effectiveness of contributors. Many studies, as outlined below, show how OSM research has focused on the quality of the data and the evolution of road networks. Haklay [18] focused on the analysis of OSM data quality by comparing it with Ordnance Survey datasets. The author found that OSM data accuracy was around 6 m, and there was approximately an 80% overlap between the two datasets. Girres and Touya [19] examined the quality of French OSM data and extended the work of Haklay [18] to France. They analyzed the results with a larger set of spatial data quality assessment elements (i.e., geometric, attribute, semantic and temporal accuracy, logical consistency, completeness, lineage, and usage) and different methods of quality control. Neis et al. [20] analyzed the quality of OSM road network evolution in different regions of Germany from 2007–2011. They specified that OSM even exceeds the information provided by the proprietary dataset by 27% when taking into account the whole German OSM road network, including small walkways and pedestrian paths. Corcoran et al. [21] analyzed the evolution of three OSM road networks in Ireland and assessed the results according to densification and exploration processes. Zhao et al. [1] presented the results of the evolution of OSM road networks between 2009–2012 in Beijing, China, from four aspects (general, geometric, topological, and centrality). They mentioned that (1) mapping direction moves from outskirts to downtown; (2) mapping behaviors are mainly constrained by the underlying structure of road networks; (3) volunteers tend to contribute roads with short length or straight roads, while few of them contribute long ones or curved ones. Zhang and Malczewski [22] evaluated the extrinsic quality of the Canadian OSM road networks and compared it to several spatial data assessment elements (completeness, positional accuracy, attribute accuracy, semantic accuracy, and lineage). They found that urban networks received more participation than rural.
The number of registered users in the OSM project is increasing daily and various studies that focus on the participants are represented in the literature [23,24,25,26,27]. In the evolution of OSM urban road networks, some studies took into account the activations of the contributors, rather than the number of users in the period, as a way to characterize their behaviors. The direct extraction of information about the members of the OSM, such as a list of all users or registration information, is not possible [23]. Neis and Zipf [23] analyzed the behavior of OSM contributors from full history OSM files. They used some temporal information about the activation of contributors. They mentioned that 17% of contributors had at least one contribution in 2011. Moreover, their study clarified the number of contributors per country. Developing countries had 27% of registered contributors in Europe in 2011. Although many different studies have been conducted on OSM road networks, developing countries, like Turkey, have not investigated how the contributions of OSM users have impacted current developments in the entire system. Therefore, the objective of this study is to measure the activation of contributors by using several network analysis methods, such as completeness, the degree of centrality, betweenness, closeness, and PageRank; in addition, it will take into account factors like the number of nodes, ways, contributors, mean lengths, and sinuosity values.
The remainder of the paper consists of the following sections: (2) describing the study area, the structure of OSM road data, and several network analysis methods; (3) evaluating the behavior of contributors and the data; (4) concluding with some discussions. The quality and accuracy of OSM road data is out of the scope of this study.

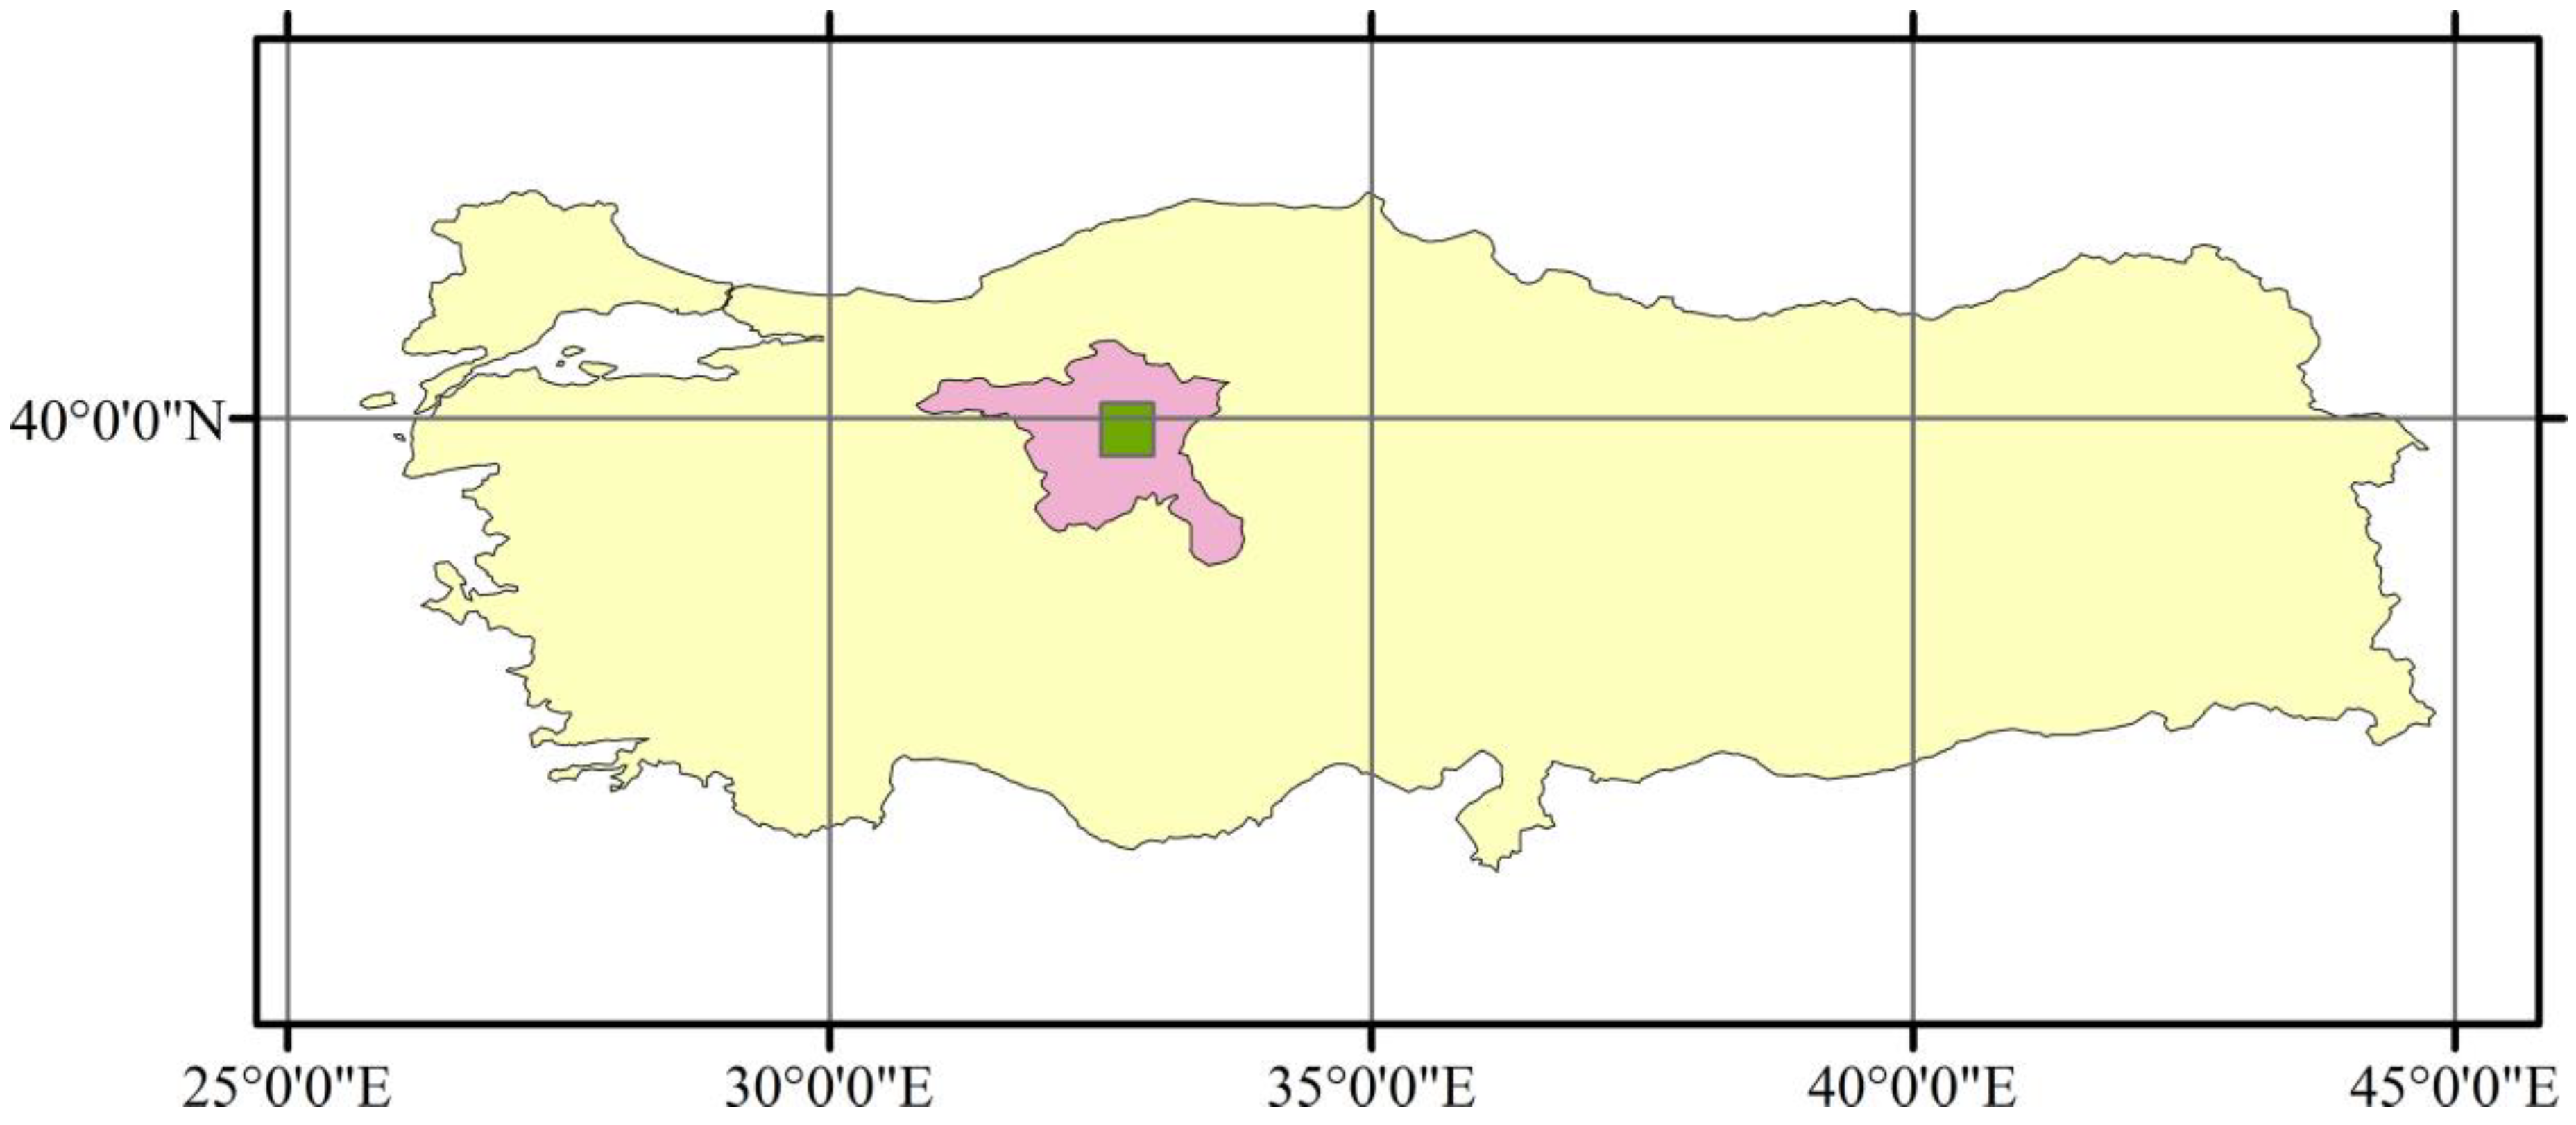
2. Study Description

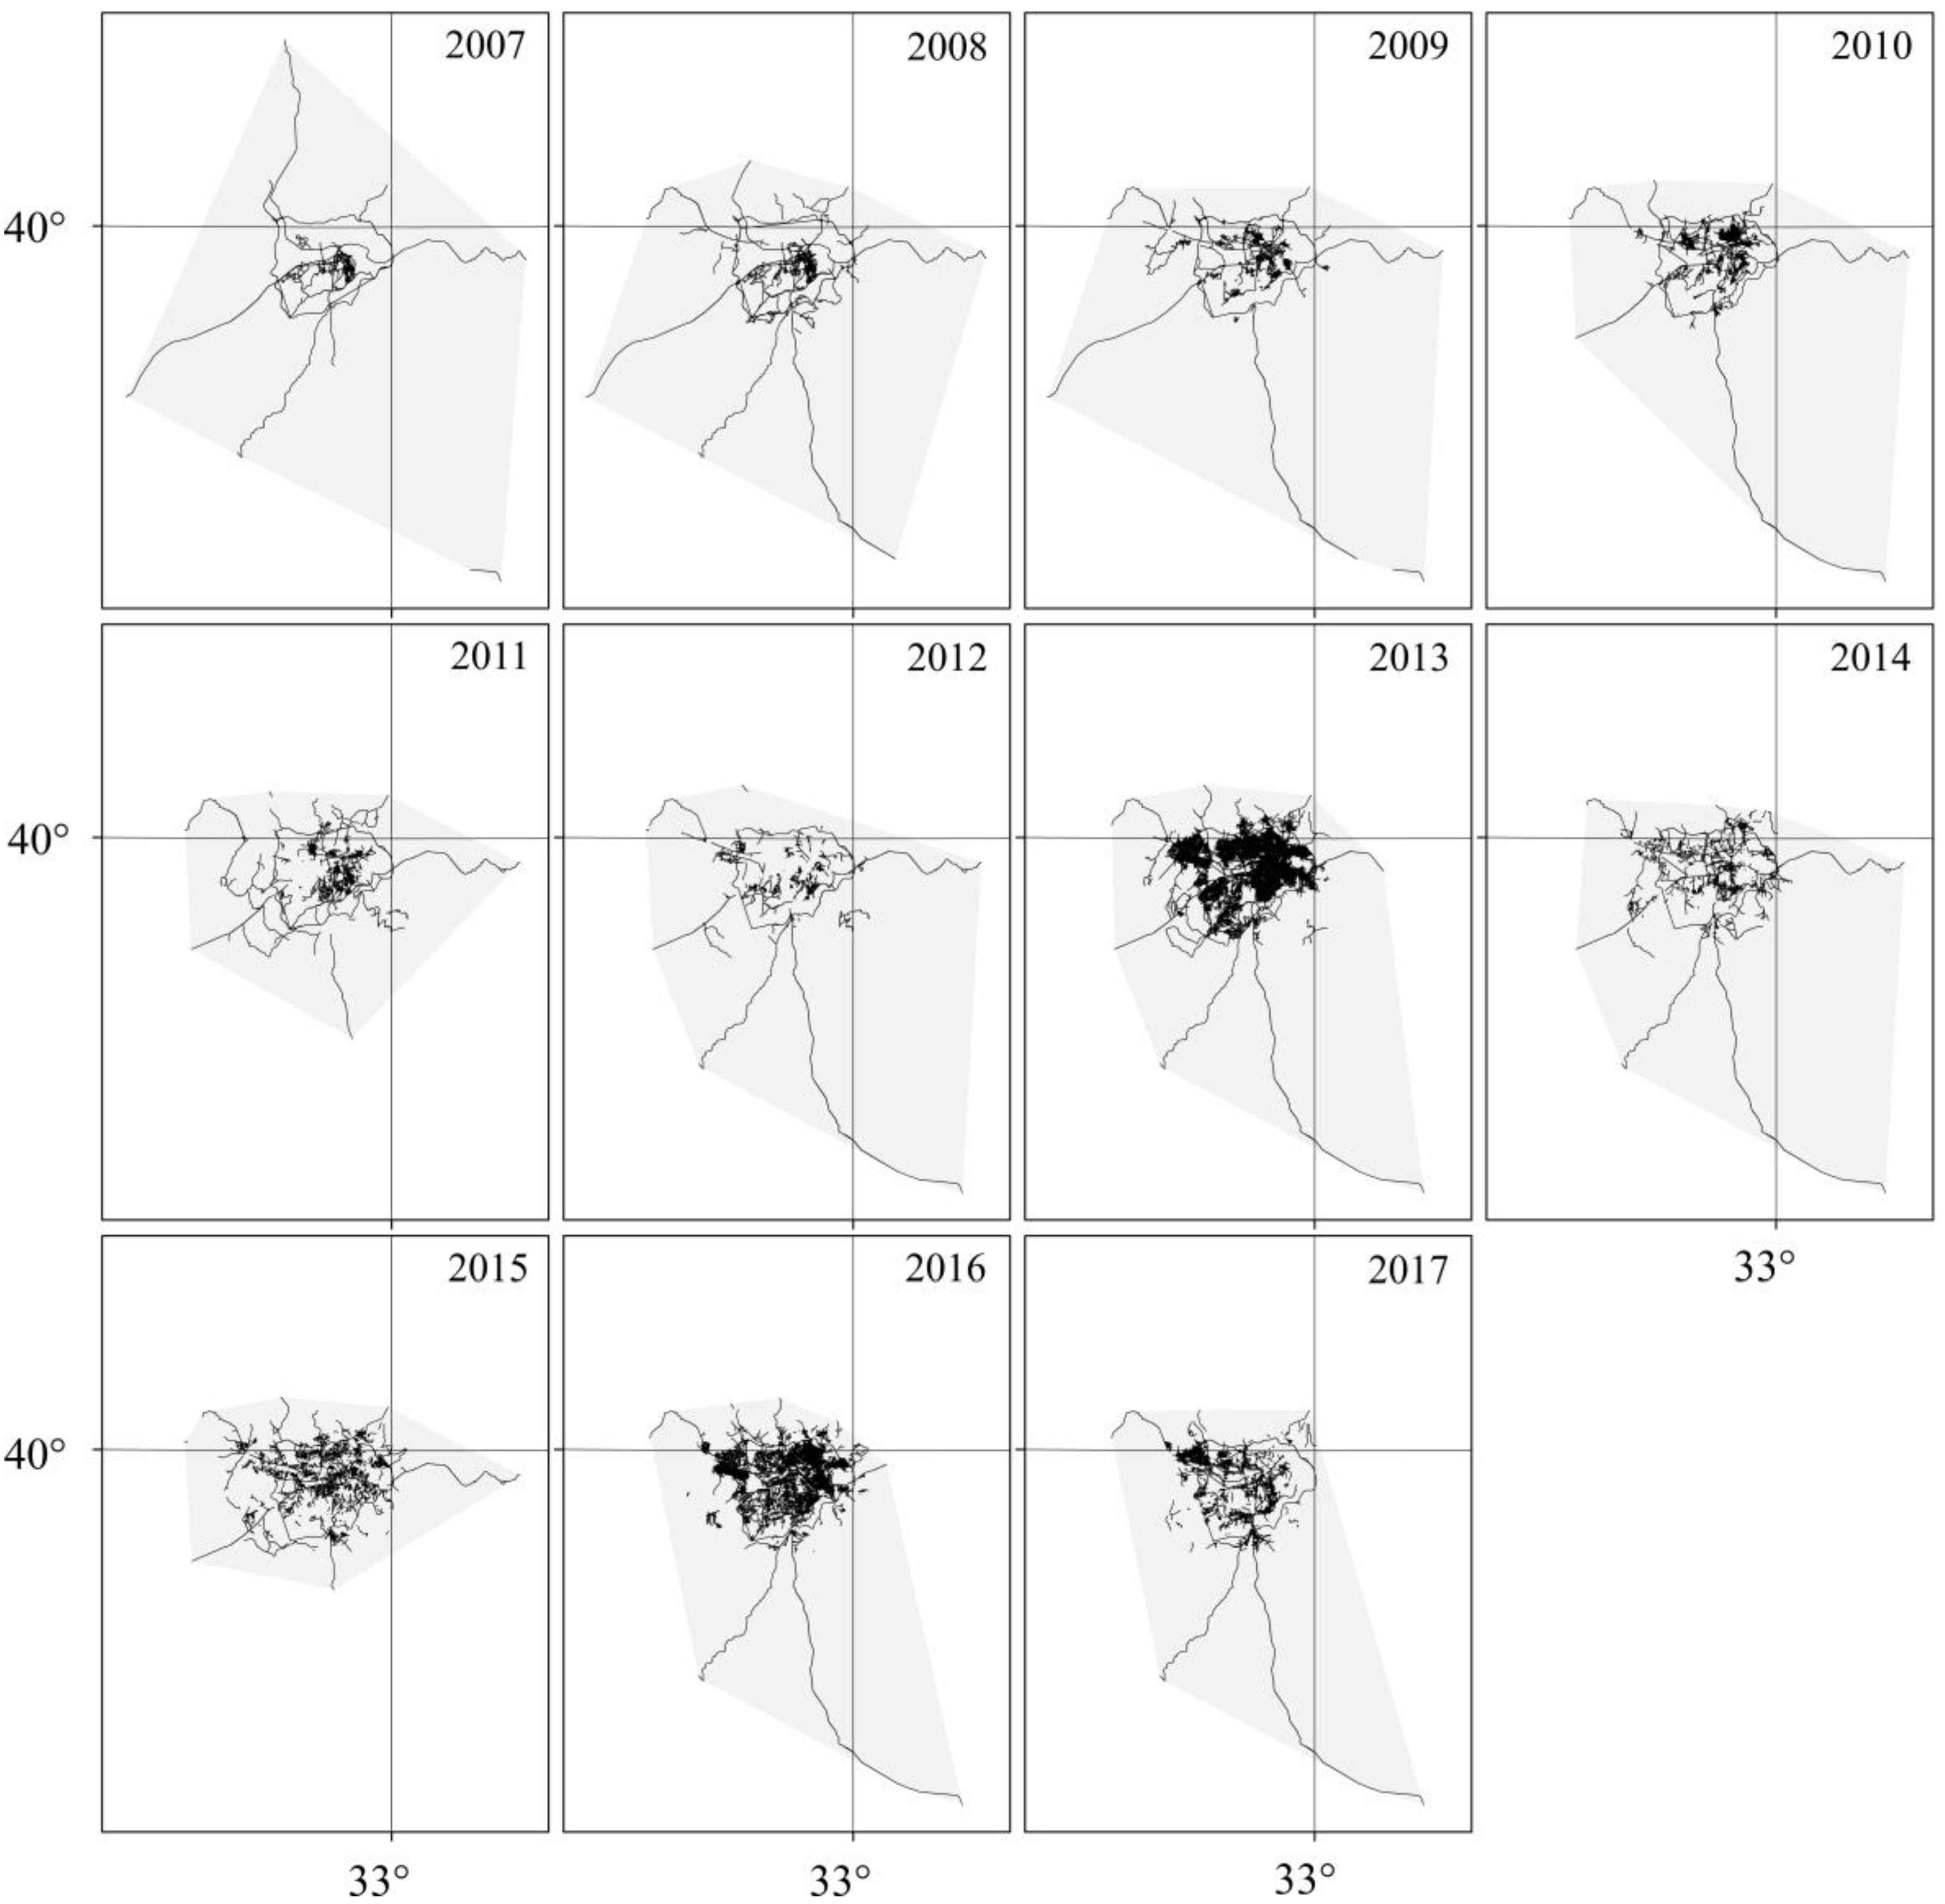
2.1. The Study Area and OSM Road Data Structure

This research has been conducted using the OSM road data of Ankara, the capital city of Turkey (Figure 1). The city has a growing population that increased from 4.5 million in 2007 to 5.4 million in 2017 [28]. This means urbanization has also expanded during this period. The study area covered 40 km × 35 km in the center of Ankara.
The OSM data structure is composed of two basic elements to assess spatial data: geometry and attributes. The attributes are described with tags on any geometry. Tags provide information to the user about the particular element to which they are attached. They contain two free format text items, such as key-value pairs. The geometry consists of three elements: nodes, ways, and relations. The node geometry basically represents a specific point on the Earth’s surface. The way geometry consists of the lines connecting two or more nodes. The relation geometry logically defines geographic relationships between geometry and tags with respect to their order.
Graph theory is considered an important way to study road network analysis. G = (V, E) is a kind of network structure consisting of vertices (V) and edges (E), which are unordered pairs of V. In the literature, there are two types of graphs, primary and dual, to represent urban road networks. In a primary approach, road intersections and cul-de-sacs are considered to be vertices, and streets, which are connected vertices, are assumed to be edges [29]. In a dual approach, streets are nodes, and road intersections are edges [30]. We used the primary approach to analyze road networks in this study, because of the global fundamental standards for geospatial dataset construction and diffusion [29].
In this paper, some terms are used with suffixes to avoid confusion. The term “road” defines OSM raw ways, and the term “road-tp” is used hereafter to define the lines transformed into lines of a topologic road network. Also, the term “node” defines OSM raw nodes, and the term “node-tp” is used hereafter to define the points that topologically represent the connection of road-tp (i.e., junction, crossroad, etc.).

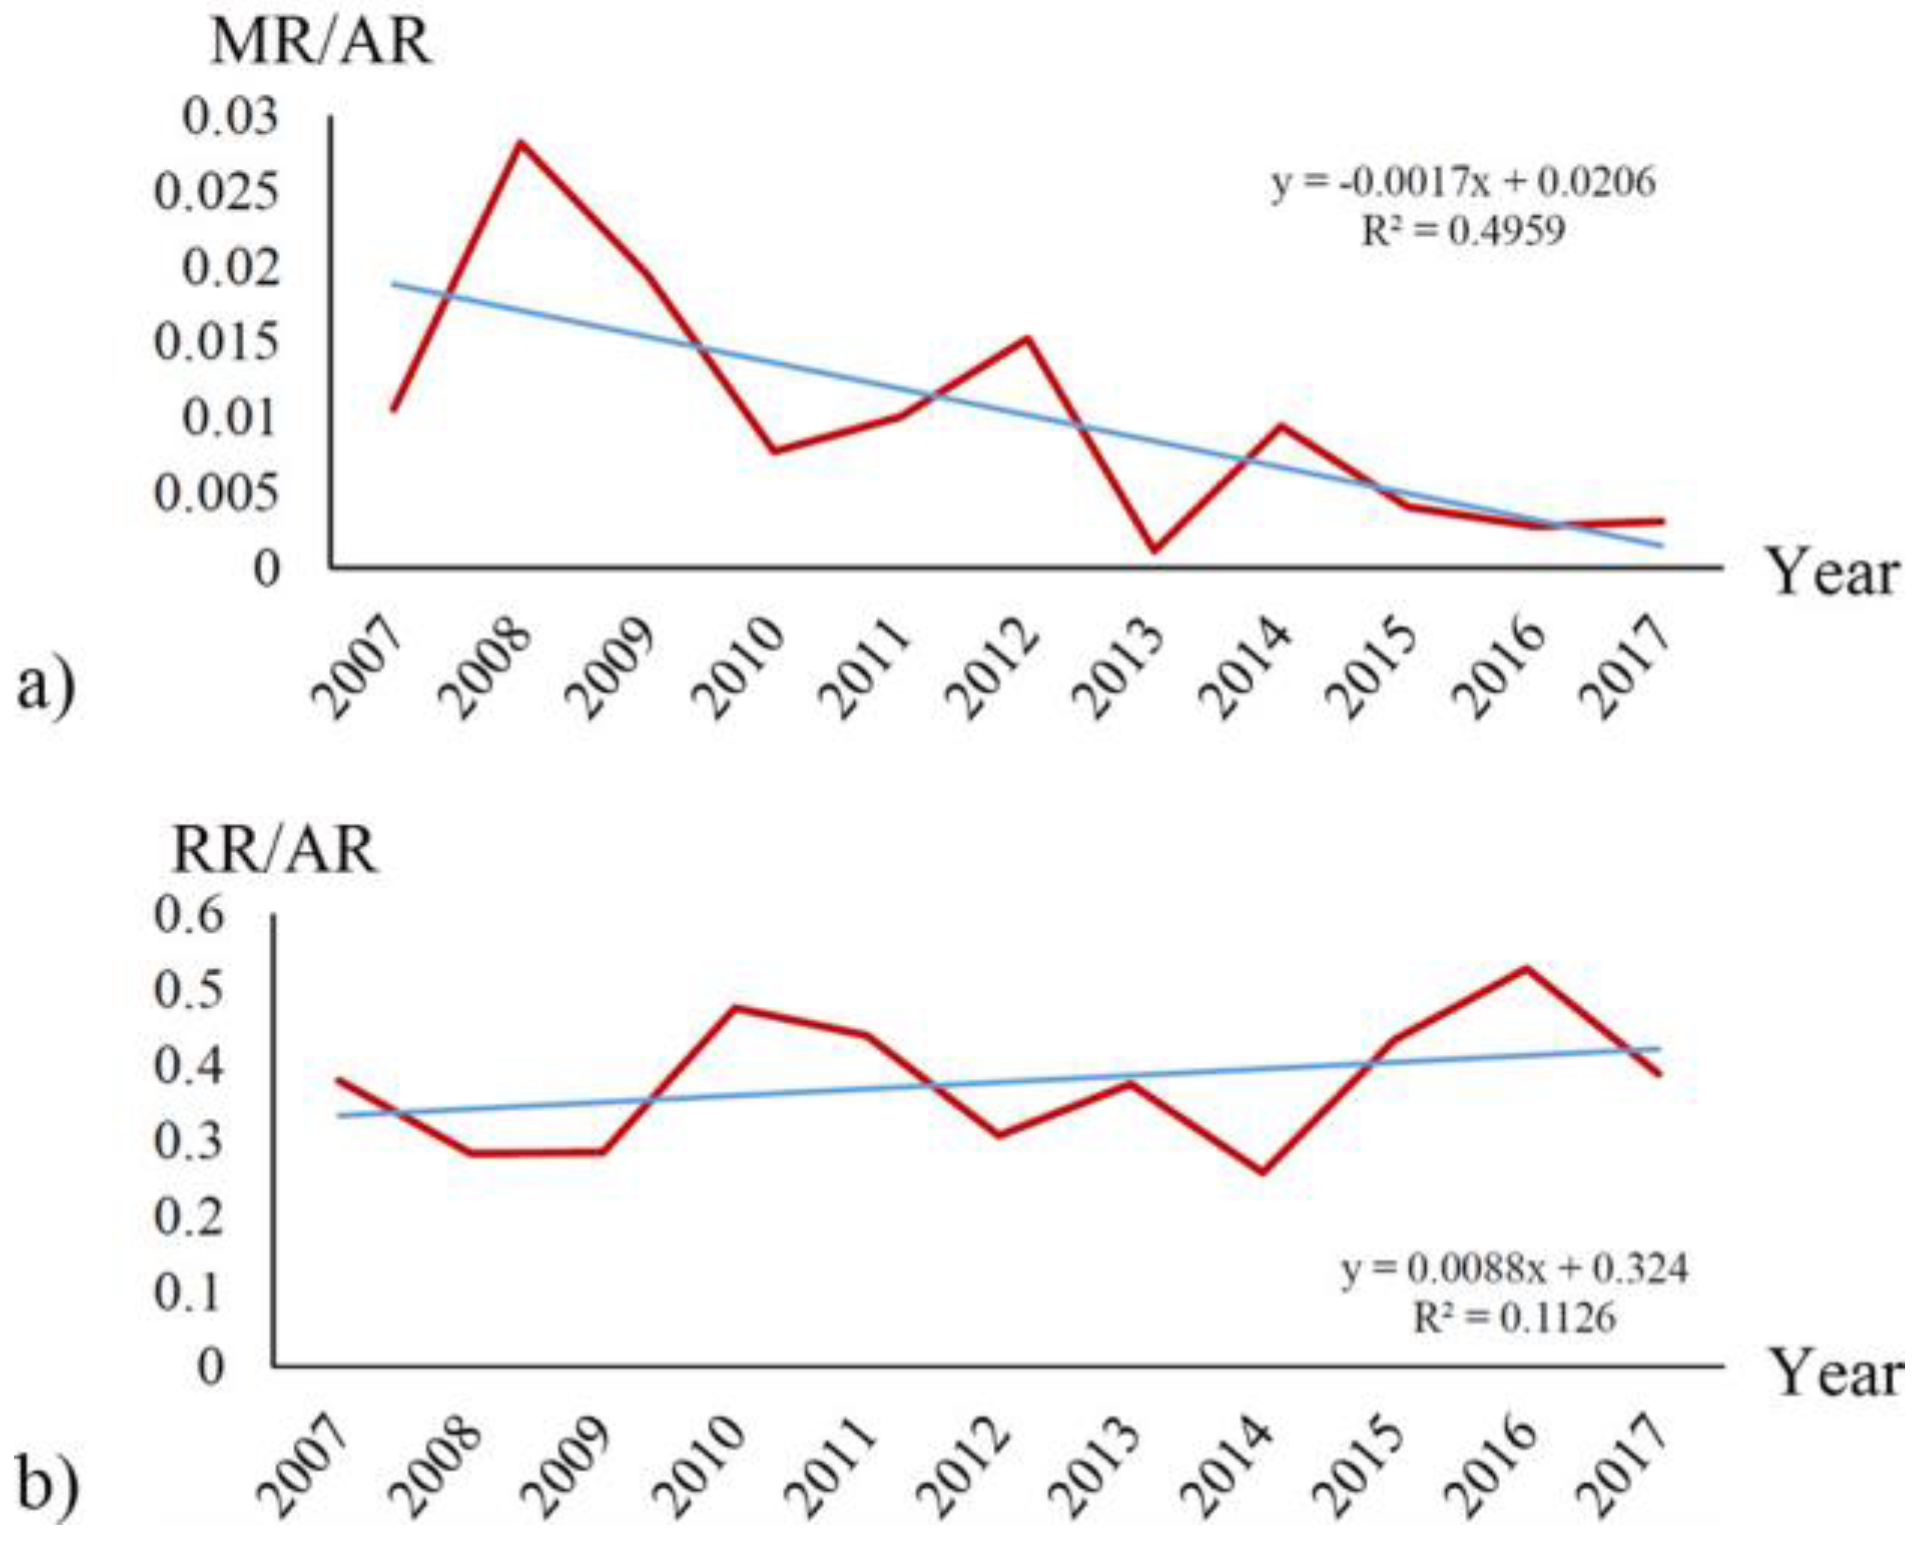
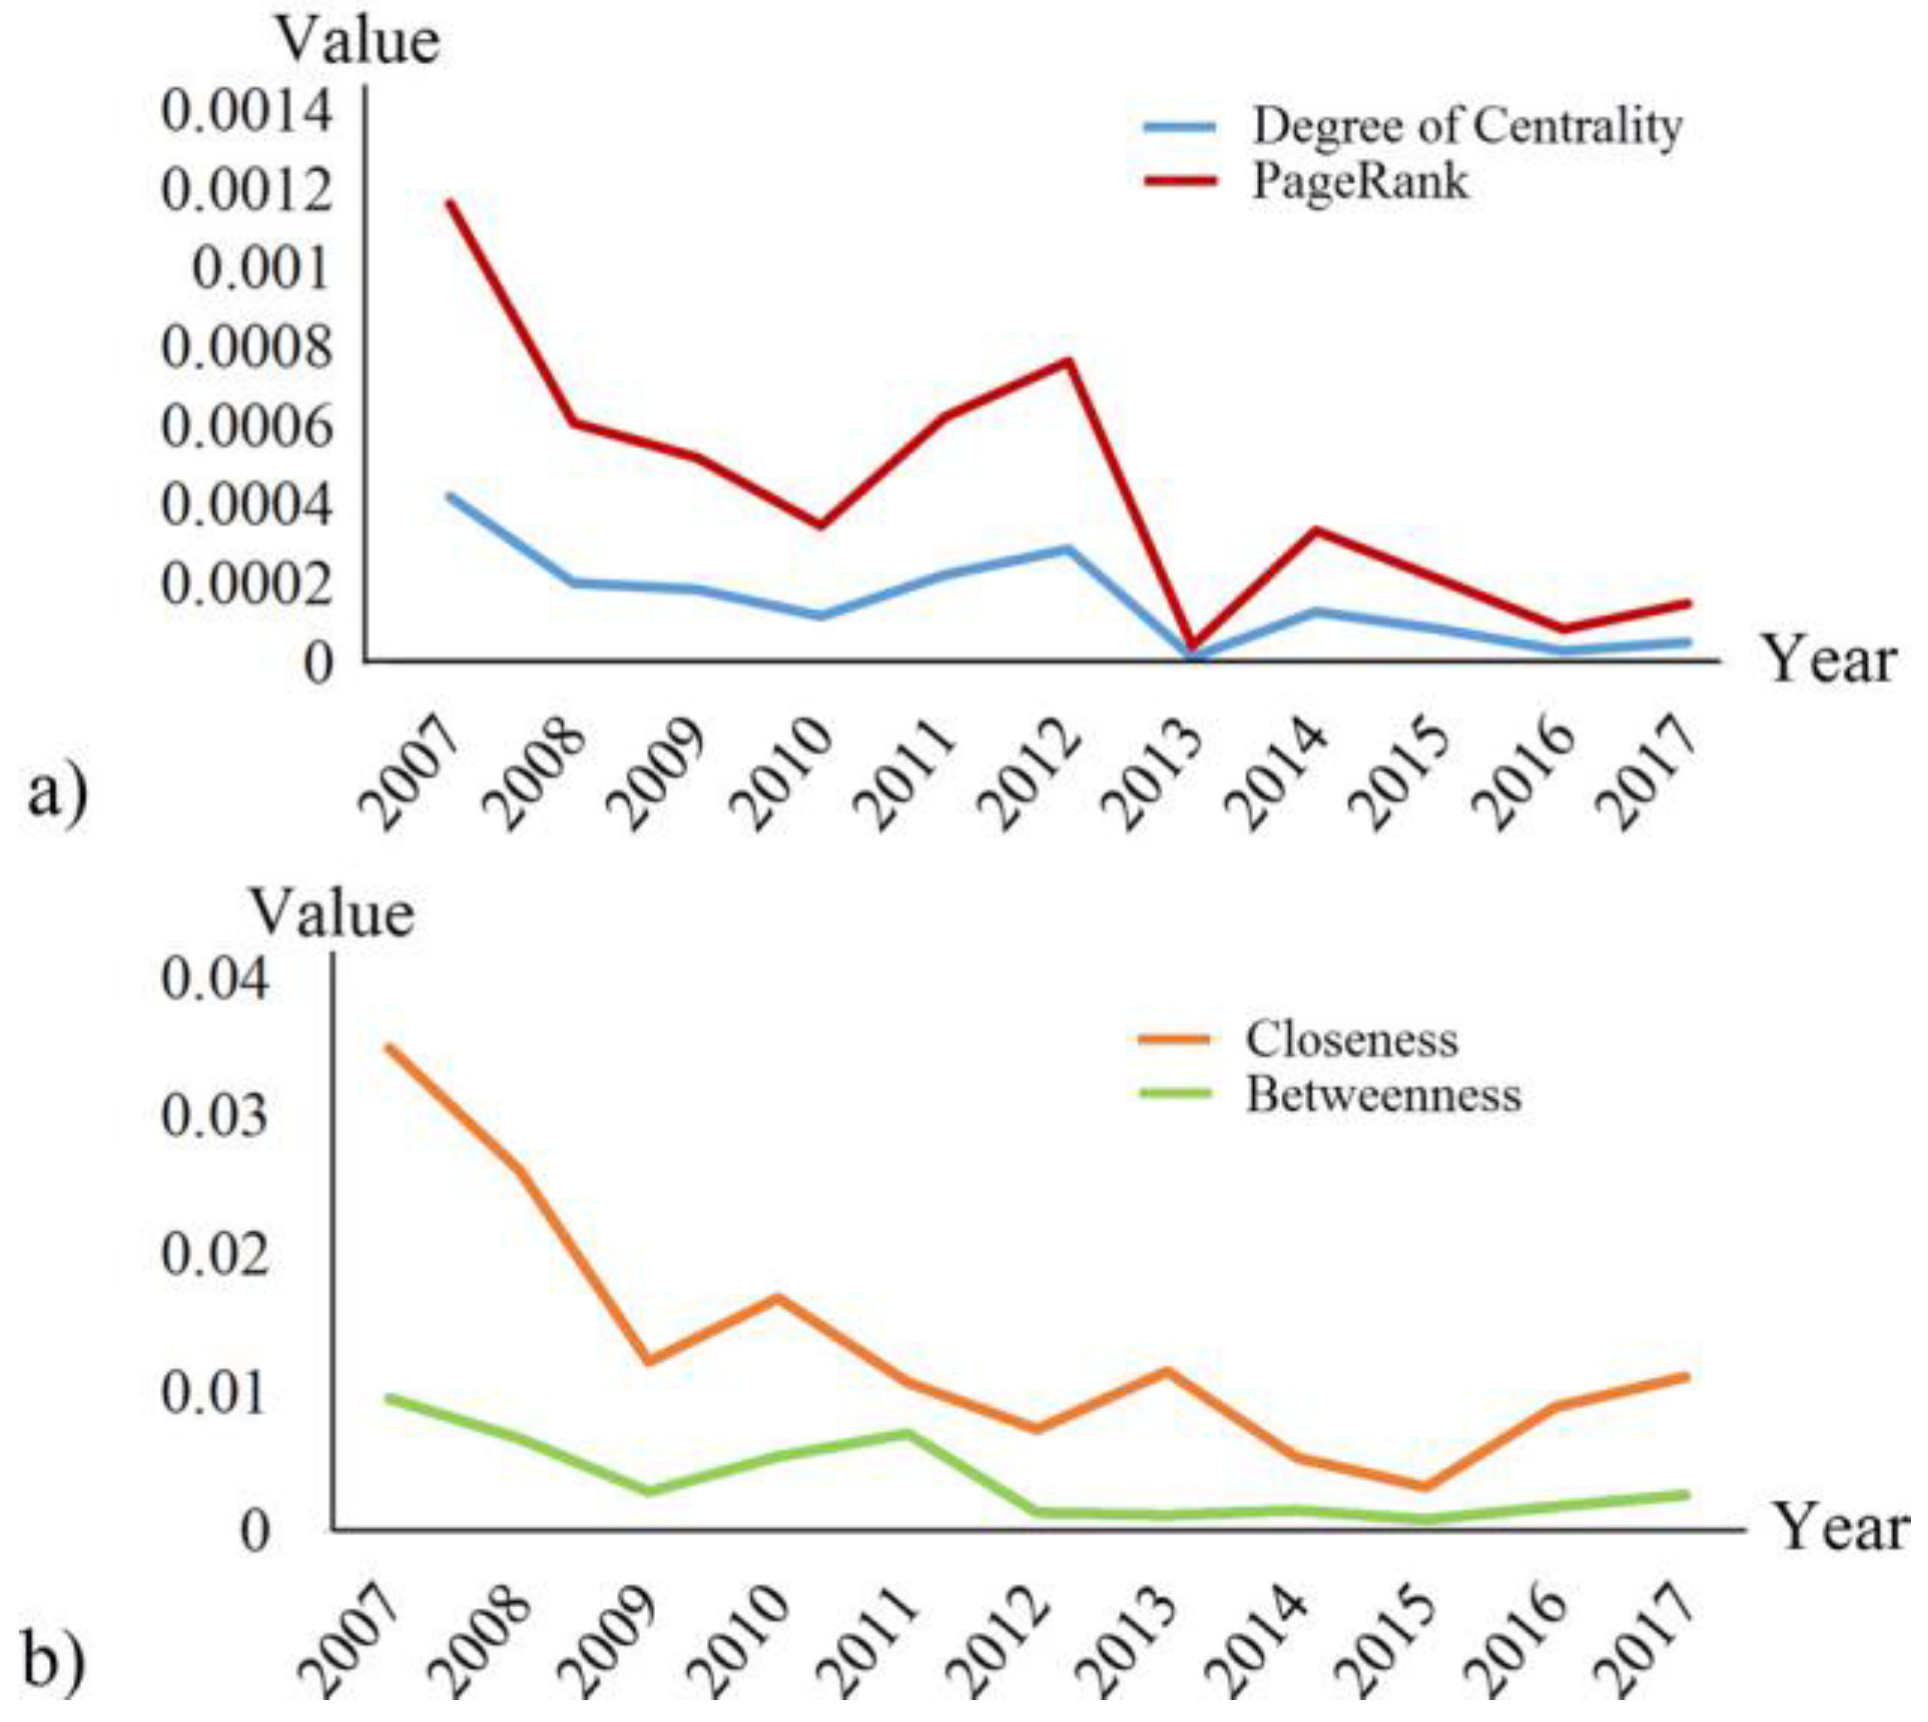
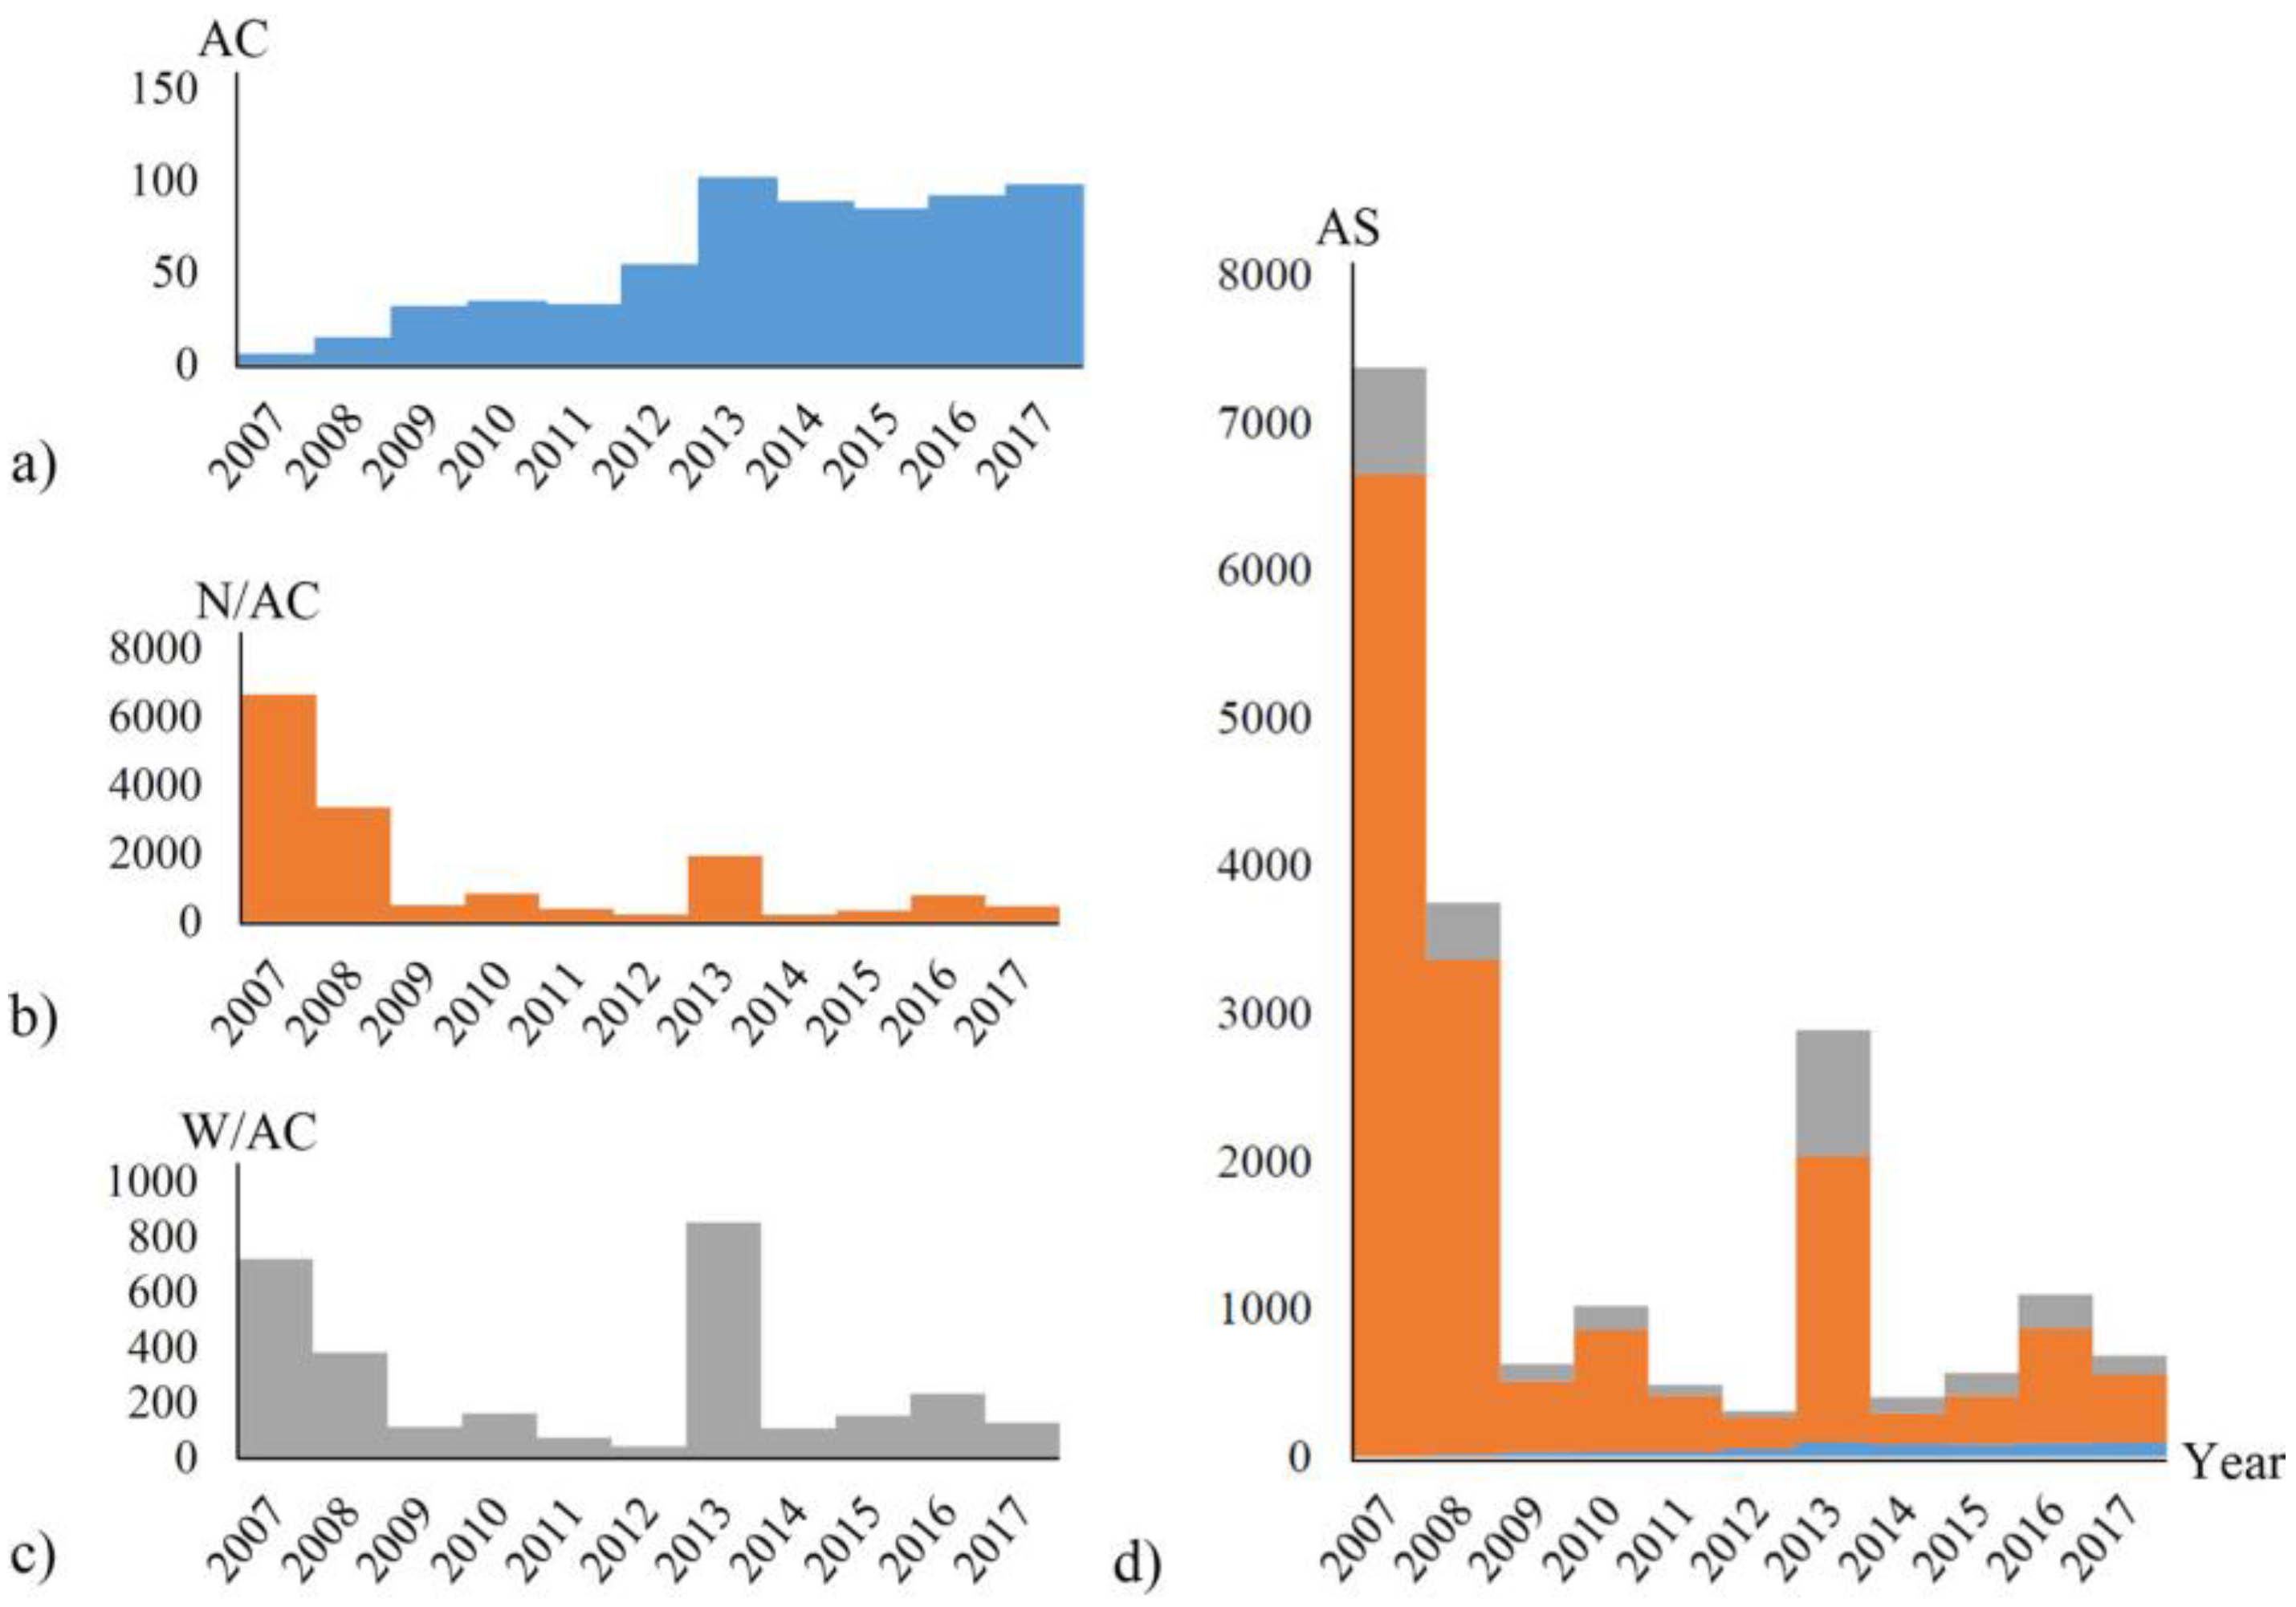
2.2. Evaluation Methods

Temporal Completeness: Completeness is used to measure a lack of reference data [18]. However, since quality and accuracy assessments are out of scope for this paper, the completeness formula was used to measure a lack of data with respect to the following year to temporarily understand the evolution of the data. In other words, temporal completeness was determined to assume the data from the following year as a reference. It was calculated for a specified time as:
T e m p o r a l   C o m p l e t e n e s s = L i A / L i + 1 A = L i L i + 1 ,
where L, A, and i represent the total length of road objects, the coverage area of the centrum, and a specified time, respectively. The size of the coverage area was a constant 40   km × 35   km = 1400   km 2 .
Centrality measures: Centrality is associated with various factors that affect the lives and behavior of humans in their cities and communities [8]. The notion of centrality first applied by Bavelas [31] revolved around the communication between small groups of people and the relationship between structural sociology and influence/power [32]. For instance, any person in the community can have an important role in her/his social environment, which makes her/him more central than the others. This is also true for the nodes that trigger the development of road networks. Centrality measures quantify that some nodes in a network are more significant than others and they determine how centrality values are distributed among all nodes. Various centrality measures, such as degree, betweenness, closeness, straightness, PageRank, load, Katz, and eigenvector, can be used for different purposes. In this study, degree, betweenness, closeness, and PageRank centrality measures of each node-tp were calculated according to certain periods in order to examine the behavior of contributors.
The degree of centrality: This is based on the idea that important nodes have a higher degree of ties than other nodes in the graph. The degree of a node was measured by the number of edges related to the node (i.e., the number of neighbors connected to the node) [29]. The degree centrality C i D e g of each node-tp i was defined as [33]:
C i D e g = d i N 1 ,
where d i is the degree of node-tp i (the number of nodes-tp adjacent to node-tp i ), and N is the number of nodes-tp in the graph.
Closeness: This is the degree of proximity of a node directly or indirectly to other nodes. The closeness centrality of a node i was calculated using the reciprocal of the sum of the shortest path distances from i to all other nodes [33]. It also reflected how quickly a node could connect to other nodes in the network.
C i C l s = N 1 v = 1 N 1 d ( v , i ) ,  
where d ( v , i ) is the shortest path distance between starter node v and node i .
Betweenness: This is the degree to which a node is found among all other nodes in the network. It shows how a node is connected to nodes that are not directly related to each other [34]. Any node with a high degree of betweenness is acting as an important bridge in the network.
C i B t w n = s , t V σ ( s , t | v ) σ ( s , t ) ,  
where v is the set of nodes-tp, σ ( s , t ) is the number of shortest ( s , t ) paths, and σ ( s , t | v ) is the number of those paths passing through some node-tp v other than s , t . If s = t , σ ( s , t ) = 1 , and if v s , t , σ ( s , t | v ) = 0 [35].
PageRank: This is a method that associates the importance of a node with its location in the network compared to other nodes to which it is linked. This method was previously designed as an algorithm to rank the importance of web pages. Okomato et al. [36] and de Sousa and Kropatsch [37] calculated PageRank centrality with the following equation:
  C P r = 1 d n × 1 + d A C P r ,  
where C P r = ( r ( i 1 ) ,   r ( i 2 ) , ,   r ( i n ) ) T is the PageRank vector, r ( i n ) is the PageRank value of node-tp i n , n is the total number of nodes-tp, d takes the damping value = 0.85, and A is an adjacency matrix between nodes-tp [1].
Activation density: Neis et al. [20] calculated a simplified number of participants per km2 in each administrative area. In this study, new or updated road data contributed by volunteers is assumed to be an activation. A contributor who carried out at least one activation is labelled as an active contributor. The activation density is the ratio of the number of active contributors per km2. The area used in this calculation represents the activation area. Each area size was determined as the convex hull bounding new or updated road data in each year (grey polygons in Figure 2).
  A D = A C A A ,  
where AD is the activation density, AC is the number of active contributors and AA is the activation area.
Sinuosity: The sinuosity defines the curvature of a line [38] and is calculated with the equation:
  S i n u o s i t y i = d i l i ,  
where l is the length of road-tp i, and d is the straight distance between the start and end points of road-tp i. In this study, the mean of weighted sinuosity values was preferred, instead of mean sinuosity values, since a longer road-tp affects the mean value the same as a shorter road-tp. For instance, a motorway with a high sinuosity index may have an equal effect on the calculation of mean sinuosity value as a high sinuosity indexed semi-roundabout; however, using a weighted sinuosity makes a longer road-tp more effective.

3. Evaluation of OSM Road Data and Results

OSM road data was evaluated based on temporal completeness, the degree of centrality, betweenness, closeness, and PageRank from 2007–2017. A proposed method measuring the activation of contributors in an actively bounded area was also used to characterize the behavior of OSM contributors. OSM road data was retrieved year by year using the osmium tool [39]. All linestring objects having a “Highway” tag were used (highway=*); however, duplication of identical roads were eliminated before the assessment started. The experiment was carried out using the NetworkX python package [40]. The road networks contributed by volunteers by year are shown in Figure 2. OSM road data evolution in Ankara is not parallel with the mapping in Beijing [1], since the mapping direction is not certain (such as from outskirts to downtown or vice versa).
OSM contributors mapped 10 times more road segments in 2013 than in 2010 (Table 1). The number of roads affects the total length of road data. From 2015–2017, it increased, but less. However, the mean length of road data in 2013 compared to that of 2007–2012 and 2014 decreased by less than half. Moreover, the mean lengths of roads from 2015–2017 approximate the values of those from 2013 (Figure 3a). The results show that in the earlier stages of the OSM project, the contributors mapped longer roads, like motorways. After 2014, however, they started to draw highly detailed roads, like residential roads (Figure 4). Downtrend and uptrend lines represent motorway and residential road rates in all roads mapped by contributors, as depicted in Figure 4a,b, respectively. Also, temporal completeness of road data had deep and peak points in 2012 and 2013, respectively (Figure 3b). This means that in 2013, OSM users made their best efforts until that time to contribute road data.
During early OSM contributions, the volunteers contributed the roads-tp that had higher values of each centrality measure (Figure 5). In 2012 and 2014, the degree of centrality and PageRank had two peaks and, in 2013, each had a deep point as shown in Figure 5a. This means that more important roads-tp were contributed in the peaks and less were contributed in the deep points. There were also the same peak and deep points in the motorway contributions in related time periods. The motorways were not only important roads for urban areas, but were also explicitly simple to draw. In 2010 and 2013, closeness had two peaks, meaning that the roads-tp contributed in these years had quicker connections among the nodes-tp (Figure 5b). In 2011, betweenness had a peak, meaning that the roads-tp could act as important bridges in the network (Figure 5b). The most remarkable point appeared in 2013 when both the degree of centrality and PageRank had deep values (less important) and, vice versa, closeness had a peak value (quicker). This situation might be commented as the connection quickness of roads-tp does not guarantee the importance of centrality.
While experience is not a quantifiable measurement, some calculations based on the activities of contributors were used to make some predictions. For example, the number of active OSM contributors and the size of the drawing areas where they were active can be used for this purpose. In addition, the selection criteria of the road data, which were drawn or integrated into the system, made it easy to make inferences about the experiences of contributors. There were explicit differences between the wide roads (motorways) and narrow roads (residential). While motorways can be seen and drawn easily on small and medium scale satellite images because of their width, residential roads can be seen and drawn only on more detailed large scale images or by using the Global Positioning System. In this study, the experience levels of OSM contributors were examined by using these criteria. Wide/narrow (width) or long/short (length) variations of roads could determine the drawing preferences. Some calculations were conducted to detect the preferences. Activation density measures the density of active contributors in the activation (drawing) area. This makes it easy to decide when the roads were contributed to intensely. The contributors mapped road data in larger areas with less numbers of active contributors during early periods of the OSM project than latter periods (Figure 6, Figure 7). In the beginning, they probably used the online drawing interface for the first time, and so their preferences were determined to be longer and explicit roads. The activation area in 2007 had the largest value and, as stated in the upper temporal completeness results, the volunteers preferred to contribute mainly long roads, like motorways, at that time (Figure 4a, Figure 6, Figure 7). However, after 2014, the area had smaller values and the volunteers started to contribute highly detailed roads, like residential roads (Figure 4b, Figure 6, Figure 7). This indicates that there was a relation between activations and level of detail. Since it was assumed that the experience of contributors rises every year with the accumulation of contributions, more experienced volunteers preferred to contribute highly detailed roads and less experienced volunteers preferred the less detailed roads. Figure 8 presents the distribution of the ratio of residential roads to all roads and activation density year by year. They both result in similar linear trends, excluding a few segments. This supports the idea that the experience of OSM contributors has a positive effect on the level of detail of road contributions.
The distributions of mean and weighted mean sinuosity values are shown in Figure 9. The results show that the roads-tp with higher sinuosity values were added earlier in 2007–2008. As an assumption, relatively more experienced contributors preferred the lower sinuosity indexed roads-tp, like residential roads in the inner city. This observation was parallel with the results of the study from Beijing [1]. Most of the OSM users contributed relatively straight and short roads (residential) in both Ankara and Beijing. In 2012, the mean of weighted sinuosity, the degree of centrality, and PageRank graphs peaked to indicate that the high sinuosity indexed roads-tp contributed at this time were more important.

4. Conclusions

Analyzing and categorizing the behavior of volunteer contributors is a challenging issue because the OSM has only been established for fourteen years. The study presented in this paper has searched for ways to characterize the behavior of OSM contributors. Based on the statistical results of this research, the authors have inferred that the experience levels of contributors determine the contribution type and level of road detail. While more experienced volunteers preferred to contribute roads with more detail and lower sinuosity, like residential streets of the inner city, less experienced volunteers preferred to contribute roads with less detail and higher sinuosity, like motorways. Moreover, the higher sinuosity indexed roads-tp might be considered more important since the degree of centrality and PageRank values were also higher. However, closeness centrality results also show that the importance of the centrality of roads does not completely reflect the connection quickness. The future work resulting from this study will focus on the assessment of accuracy and quality with regard to the experience levels of OSM contributors.

Author Contributions

Data curation, K.Ş; Formal analysis, M.H., B.K. and K.Ş.; Methodology, M.H. and B.K.; Software, K.Ş.; Supervision, M.H.; Visualization, M.H., B.K. and K.Ş.; Writing–original draft, M.H.; Writing–review and editing, M.H., B.K. and K.Ş.

Funding

This research received no external funding.

Conflicts of Interest

The authors declare no conflict of interest.

References

  1. Zhao, P.; Jia, T.; Qin, K.; Shan, J.; Jiao, C. Statistical analysis on the evolution of OpenStreetMap road networks in Beijing. Phys. A 2015, 420, 59–72. [Google Scholar] [CrossRef]
  2. Goodchild, M.F. Citizens as sensors: The world of volunteered geography. GeoJournal 2007, 69, 211–221. [Google Scholar] [CrossRef]
  3. Heipke, C. Crowdsourcing geospatial data. ISPRS J. Photogramm. Remote Sens. 2010, 65, 550–557. [Google Scholar] [CrossRef]
  4. Neis, P.; Zielstra, D. Recent developments and future trends in volunteered geographic information research: The case of OpenStreetMap. Future Internet 2014, 6, 76–106. [Google Scholar] [CrossRef] [Green Version]
  5. Budhathoki, N. Participants’ Motivations to Contribute Geographic Information in an Online Community. Ph.D. Thesis, University of Illinois, Urbana-Champaign, Urbana, IL, USA, 2010. [Google Scholar]
  6. Degrossi, L.C.; Albuquerque, J.P.; Rocha, R.S.; Zipf, A. A taxonomy of quality assessment methods for volunteered and crowdsourced geographic information. Trans. GIS 2018, 22, 542–560. [Google Scholar] [CrossRef] [PubMed]
  7. Buhl, J.; Gautrais, J.; Reeves, N.; Solé, R.V.; Valverde, S.; Kuntz, P.; Theraulaz, G. Topological patterns in street networks of self-organized urban settlements. Eur. Phys. J. B 2006, 49, 513–522. [Google Scholar] [CrossRef]
  8. Crucitti, P.; Latora, V.; Porta, S. Centrality in networks of urban streets. Chaos 2006, 16, 015113. [Google Scholar] [CrossRef] [PubMed]
  9. Jiang, B. A topological pattern of urban street networks: Universality and peculiarity. Phys. A 2007, 384, 647–655. [Google Scholar] [CrossRef] [Green Version]
  10. Barthélemy, M.; Flammini, A. Modeling urban street patterns. Phys. Rev. Lett. 2008, 100, 138702. [Google Scholar] [CrossRef]
  11. Masucci, A.P.; Smith, D.; Crooks, A.; Batty, M. Random planar graphs and the London street network. Eur. Phys. J. B 2009, 71, 259–271. [Google Scholar] [CrossRef] [Green Version]
  12. Erath, A.; Löchl, M.; Axhausen, K.W. Graph-theoretical analysis of the Swiss road and railway networks over time. NETS 2009, 9, 379–400. [Google Scholar] [CrossRef]
  13. von Ferber, C.; Holovatch, T.; Holovatch, Y.; Palchykov, V. Modeling metropolis public transport. In Traffic and Granular Flow’07; Appert-Rolland, C., Chevoir, F., Gondret, P., Lassarre, S., Lebacque, J.P., Schreckenberg, M., Eds.; Springer: Berlin/Heidelberg, Germany, 2009; pp. 709–719. ISBN 978-3-540-77073-2. [Google Scholar]
  14. Soh, H.; Lim, S.; Zhang, T.; Fu, X.; Lee, G.K.K.; Hung, T.G.G.; Di, P.; Prakasam, S.; Wong, L. Weighted complex network analysis of travel routes on the Singapore public transportation system. Phys. A 2010, 389, 5852–5863. [Google Scholar] [CrossRef]
  15. Masucci, A.P.; Stanilov, K.; Batty, M. Limited urban growth: London’s street network dynamics since the 18th century. PLoS ONE 2010, 8, e69469. [Google Scholar] [CrossRef] [PubMed]
  16. Strano, E.; Nicosia, V.; Latora, V.; Porta, S.; Barthélemy, M. Elementary processes governing the evolution of road networks. Sci. Rep. 2012, 2, 296. [Google Scholar] [CrossRef] [PubMed] [Green Version]
  17. Senaratne, H.; Mobasheri, A.; Ali, A.L.; Capineri, C.; Haklay, M. A review of volunteered geographic information quality assessment methods. Int. J. Geogr. Inf. Sci. 2017, 31, 139–167. [Google Scholar] [CrossRef]
  18. Haklay, M. How good is volunteered geographical information? A comparative study of OpenStreetMap and Ordnance Survey datasets. Environ. Plan. B 2010, 37, 682–703. [Google Scholar] [CrossRef]
  19. Girres, J.F.; Touya, G. Quality assessment of the French OpenStreetMap dataset. Trans. GIS 2010, 14, 435–459. [Google Scholar] [CrossRef]
  20. Neis, P.; Zielstra, D.; Zipf, A. The street network evolution of crowdsourced maps: OpenStreetMap in Germany 2007–2011. Future Internet 2012, 4, 1–21. [Google Scholar] [CrossRef]
  21. Corcoran, P.; Mooney, P.; Bertolotto, M. Analysing the growth of OpenStreetMap networks. Spa. Stat. 2013, 3, 21–32. [Google Scholar] [CrossRef] [Green Version]
  22. Zhang, H.; Malczewski, J. Accuracy evaluation of the Canadian OpenStreetMap road networks. Int. J. Geospat. Environ. Res. 2018, 5. [Google Scholar] [CrossRef]
  23. Neis, P.; Zipf, A. Analyzing the contributor activity of a volunteered geographic information project — The case of OpenStreetMap. ISPRS Int. J. Geo-Inf 2012, 1, 146–165. [Google Scholar] [CrossRef]
  24. Rehrl, K.; Gröechenig, S.; Hochmair, H.; Leitinger, S.; Steinmann, R.; Wagner, A. A conceptual model for analyzing contribution patterns in the context of VGI. In Progress in location-based services; Krisp, J., Ed.; Springer: Berlin/Heidelberg, Germany, 2013; pp. 373–388. ISBN 978-3-642-34203-5. [Google Scholar]
  25. Steinmann, R.; Gröchenig, S.; Rehrl, K.; Brunauer, R. Contribution profiles of voluntary mappers in OpenStreetMap. In Proceedings of the Action and Interaction in Volunteered Geographic Information (ACTIVITY) Workshop, Leuven, Belgium, 14–17 May 2013; pp. 1–6. [Google Scholar]
  26. Arsanjani, J.J.; Mooney, P.; Helbich, M.; Zipf, A. An exploration of future patterns of the contributions to OpenStreetMap and development of a contribution index. Trans. GIS 2015, 19, 896–914. [Google Scholar] [CrossRef]
  27. Bégin, D.; Devillers, R.; Roche, S. Contributors’ enrollment in collaborative online communities: The case of OpenStreetMap. Geo-Spat. Inf. Sci. 2017, 20, 282–295. [Google Scholar] [CrossRef]
  28. Turkish Statistical Institute. Available online: http://www.tuik.gov.tr/UstMenu.do?metod=temelist (accessed on 20 July 2018).
  29. Porta, S.; Crucitti, P.; Latora, V. The network analysis of urban streets: A primal approach. Environ. Plann. B Plann. Des. 2006, 33, 705–725. [Google Scholar] [CrossRef]
  30. Porta, S.; Crucitti, P.; Latora, V. The network analysis of urban streets: A dual approach. Phys. A 2006, 369, 853–866. [Google Scholar] [CrossRef] [Green Version]
  31. Bavelas, A. A mathematical model for group structures. Appl. Anthropol. 1948, 7, 16–30. [Google Scholar] [CrossRef]
  32. Porta, S.; Crucitti, P.; Latora, V. Multiple centrality assessment in Parma: A network analysis of paths and open spaces. Urban Des. Int. 2008, 13, 41–50. [Google Scholar] [CrossRef] [Green Version]
  33. Freeman, L.C. Centrality in social networks conceptual clarification. Soc. Networks 1979, 1, 215–239. [Google Scholar] [CrossRef]
  34. Al, U.; Sezen, U.; Soydal, I. The evaluation of scientific publications of Turkey using social network analysis method. [Originally in Turkish: Türkiye’nin bilimsel yayınlarının sosyal ağ analizi yöntemiyle değerlendirilmesi]. Hacet. Uni. Edeb. Fak. Derg. 2012, 29, 53–71. [Google Scholar]
  35. Brandes, U. On variants of shortest-path betweenness centrality and their generic computation. Soc. Networks 2008, 30, 136–145. [Google Scholar] [CrossRef] [Green Version]
  36. Okamoto, K.; Chen, W.; Li, X.Y. Ranking of closeness centrality for large-scale social networks. In International Workshop on Frontiers in Algorithmics; Preparata, F.P., Wu, X., Yin, J., Eds.; Springer: Berlin/Heidelberg, Germany, 2008; pp. 186–195. ISBN 978-3-540-69310-9. [Google Scholar]
  37. De Sousa, S.; Kropatsch, W.G. Graph-based point drift: Graph centrality on the registration of point-sets. Pattern Recognit. 2015, 48, 368–379. [Google Scholar] [CrossRef]
  38. Mueller, J.E. An introduction to the hydraulic and topographic sinuosity indexes. Ann. Assoc. Am. Geogr. 1968, 58, 371–385. [Google Scholar] [CrossRef]
  39. Osmium Tool-osmcode. Available online: https://osmcode.org/osmium-tool/ (accessed on 11 September 2018).
  40. NetworkX python package. Available online: https://networkx.github.io/ (accessed on 11 September 2018).
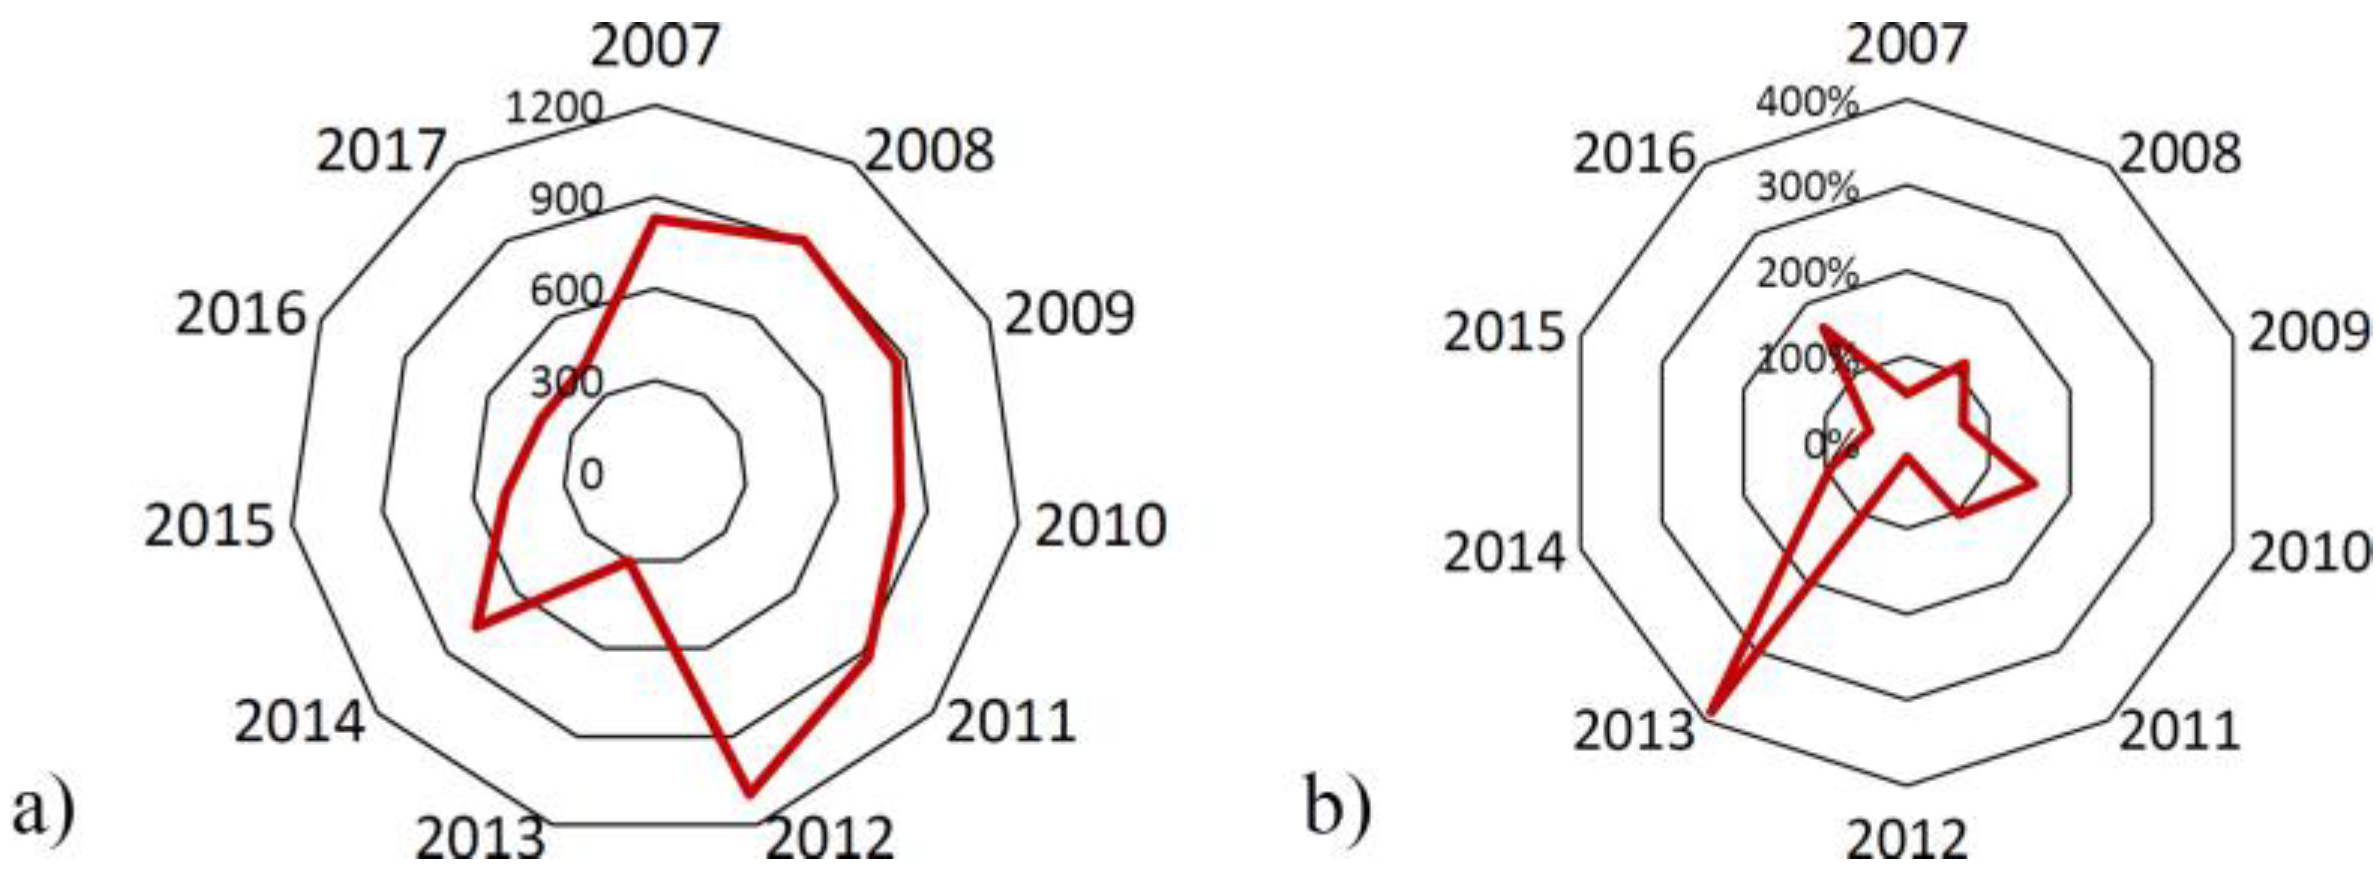
Figure 1. Location map of the study area: Turkey (yellow), Ankara (pink) and study area (green).
Ijgi 07 00400 g001
Figure 2. OpenStreetMap (OSM) road networks from 2007 to 2017.
Ijgi 07 00400 g002
Figure 3. Distribution of the mean lengths (m) (a) and temporal completeness (b).
Ijgi 07 00400 g003
Figure 4. The ratio of motorway roads (MR) (a) and residential roads (RR) (b) to all roads (AR): downtrend and uptrend lines (blue).
Ijgi 07 00400 g004
Figure 5. Distributions of degree of centrality (blue), PageRank (red) (a), closeness (orange) and betweenness (green) (b).
Ijgi 07 00400 g005
Figure 6. The number of active contributors (AC) (a), the ratio of new-updated nodes (N) to AC (b) and new-updated ways (W) to AC (c) and all stacked (AS) (d).
Ijgi 07 00400 g006
Figure 7. Area size (km2) of AC (blue) and activation density (AD) (red).
Ijgi 07 00400 g007
Figure 8. Distribution of the ratio of RR to AR (blue), and AD (red).
Ijgi 07 00400 g008
Figure 9. Mean sinuosity values (blue) and weighted mean sinuosity values (red).
Ijgi 07 00400 g009
Table 1. The statistics of road data.
20072008200920102011201220132014201520162017
Number of roads17062766251938902195177637910383464161699010070
Length of new roads (km)1413.72486.62185.53146.82026.21947.9114722955.63164.46979.34223.6
Mean length (m)828.7899.0867.6808.9923.11096.8302.6770.9493.2410.8419.4
  L A 1.0101.7761.5612.2481.4471.3918.1942.1112.2604.9853.017
Temporal completeness (%)5711469155104173889345165-

