Three-Dimensional Rule-Based City Modelling to Support Urban Redevelopment Process


1
Department of Infrastructure Engineering, The University of Melbourne, Parkville, VIC 3010, Australia
2
Centre for Spatial Data Infrastructures and Land Administration, Department of Infrastructure Engineering, The University of Melbourne, Parkville, VIC 3010, Australia
*
Authors to whom correspondence should be addressed.
ISPRS Int. J. Geo-Inf. 2018, 7(10), 413; https://0-doi-org.brum.beds.ac.uk/10.3390/ijgi7100413
Submission received: 29 August 2018
/
Revised: 2 October 2018
/
Accepted: 12 October 2018
/
Published: 18 October 2018
(This article belongs to the Special Issue Productive, Livable and Accessible Cities—The Role of 3D City Models)
Abstract
:Multi-dimensional representation of urban settings has received a great deal of attention among urban planners, policy makers, and urban scholars. This is due to the fact that cities grow vertically and new urbanism strategies encourage higher density and compact city development. Advancements in computer technology and multi-dimensional geospatial data integration, analysis and visualisation play a pivotal role in supporting urban planning and design. However, due to the complexity of the models and technical requirements of the multi-dimensional city models, planners are yet to fully exploit such technologies in their activities. This paper proposes a workflow to support non-experts in using three-dimensional city modelling tools to carry out planning control amendments and assess their implications. The paper focuses on using a parametric three-dimensional (3D) city model to enable planners to measure the physical (e.g., building height, shadow, setback) and functional (e.g., mix of land uses) impacts of new planning controls. The workflow is then implemented in an inner suburb of Metropolitan Melbourne, where urban intensification strategies require the planners to carry out radical changes in regulations. This study demonstrates the power of the proposed 3D visualisation tool for urban planners at taking two-dimensional (2D) Geographic Information System (GIS) procedural modelling to construct a 3D model.
1. Introduction
Urban intensification and compact city development strategies are generally implemented in metropolitan areas worldwide as a response to rapid population growth [1]. Urban planners and policy makers encourage higher building and population densities through urban redevelopment as part of the compact city process. In order to better understand the implications of urban redevelopment, planners need robust tools to predict and measure the impact of planning scenarios. However, despite advancements in computer and geospatial technologies, they are limited to classic data and modelling tools for designing, impact assessment and decision making [2].
Historically, it has been difficult for urban planners to imagine the application of planning schemes and the controls in designated urban redevelopment areas. Further to this, statutory planners are spending a considerable amount of time determining whether development proposals in complex urban areas meet the minimum requirements according to design regulations. Consequently, it is important that planners have the right toolset to both plan future changes and assess existing conditions.
In Australia, where compact city development has become the main planning strategy [2], urban planners rely on two-dimensional (2D) land information to envision a proposed building or assess the impact of changing development regulations. Recent advancements in three-dimensional (3D) geospatial technologies are promising to improve the decision making through evaluation of the potential impact of development proposals, visualising urban design outcomes and allowing users to interpret them from multiple viewpoints. 3D visualisations can improve the mental image of planning controls for planners and stakeholders. For instance, these technologies enable people to assess the effect of buildings on the surroundings (such as view lines) and provide a mechanism for assessment of proposed developments submitted in 3D. Multi-dimensional GIS visualisations also carry analytical components and as such will allow communities to have more effective conversations regarding future developments [3,4].
3D analytics and visualisation were explored by scholars in different urban planning and urban design studies such as walkability analysis [5], building shadow detection and impacts [6,7], and planning for flood prone areas [8]. Kytta et al. (2013) [3] evaluated the role of 3D visualisation in public participation for a sensitive inner city urban redevelopment process in the Helsinki metropolitan area. Their study identified the benefits of 3D visualisation on communicating with stakeholders and assisting with dispute resolution. Sabri et al. (2016) [9] proposed the use of 3D analytics and visualisation in a virtual geographic environment (VGE) for combining the measurement of physical (e.g., building material, colour, façade) and social construction (e.g., diverse range of household types) of urban areas. Other studies have highlighted the benefit of 3D models enabling the decision makers to identify issues related to zoning and other planning regulations [10].
While it was identified that 3D models have been helpful in carrying on planning tasks, planners were reluctant to use 3D tools because of the complexity with regard to data integration and the ability to easily model an environment [11]. One of the major limitations in developing 3D models is that they require special skills. It is also important to consider the broad planning task requirements providing planners with appropriate tools to assist them in decision-making. This study aims to develop a geodatabase structure and process for urban planners to use 2D GIS information to model and visualise the built form 3D envelope. The 3D model will be based on the applicable planning controls, focusing particularly on procedural modelling tools and Computer Graphic Architecture (CGA) shape grammar language. The study uses an urban planning scheme in Victoria, Australia, where implementing compact city strategies requires planners to conduct radical changes in development controls. The study focuses on improving workflow for tools that have already being used by planners to assess small scale development outcomes.
In the next section, this paper continues with a review of the state-of-the-art in the use of 3D city models in urban planning. In Section 3 the paper presents the methodology in which a workflow is proposed. The same section explains in detail the methods of data integration, and the GIS layer preparation for planning control rules. Section 4 presents the results in two urban corridors of an inner suburb of Metropolitan Melbourne. The implications of these results and major findings are discussed in Section 5 and finally the concluding remarks with an identification of limitations and potential future work are presented in Section 6.
2. 3D City Models in Urban Planning
Over the last three or two decades, as a result of urbanisation, urban entities including buildings and infrastructures become more complex. This complexity has led to the adoption of more robust technologies such as the use of 3D graphics to envisage the current and future impacts of urban developments. Furthermore, through the advancement of 3D geospatial data and technologies, more capabilities were provided to urban planners. This section presents a number of examples of the use of 3D city models in the process of urban planning. Then, the challenges and issues related to the use of the 3D city models for non-technical users will be elaborated. The section will finally identify the gap which exists in addressing the challenges of using 3D city models in the urban planning process.
In the urban planning process, 3D city models have been used in three major aspects: (a) public participation and citizen engagement in planning activities; (b) strategic urban planning; and (c) statutory planning [12,13]. In planning literature, citizen participation in urban development and redevelopment projects is considered as one of the key success factors [14]. Over the last decade, the proliferation of digital technology has facilitated public participation through digital platforms and web technologies, which enable citizens to understand the impact of planning and decision making on their built environment [15]. Web-based 3D visualisation and impact assessment tools are particularly important for urban densification and redevelopment processes [16,17]. In many cases, increasing urban density and infill development strategies have been objected by local residents. Kytta et al. (2013) [3], indicated that using a web-based 3D GIS platform is useful to understand the residents’ perception on planning implications in a sensitive urban redevelopment process. Public participation is particularly important in strategic planning tasks. Furthermore, Métral et al. (2007) [18] proposed a semantic enrichment and integration of different urban data sources (e.g., master plan, local plan, and other spatial data) using ontology and visualise in a 3D platform, which is adaptable to users’ viewpoints. As an example, the visualisation of a “Noise Pollution” theme can be different for an urban researcher, residents, or a politician.
Strategic urban planning refers to a holistic view of the future model of cities. Strategic urban planners identify the current shortcomings and future requirements of cities and provide policies and tools to achieve the desirable socio-economic and spatial structure in the city [19]. Using information technology and 3D geospatial data and visualisation potentially enables a data-driven and evidence-based strategic planning [12]. 3D city models developed in commonly-used applications such as Google Earth enabled for interactive building development scenario evaluation with public engagement in a planning process [20].
Another application of 3D city models in strategic planning is temporal detection of urban form changes [21], which can be attributed to the population changes as well [22]. Multi-dimensional urban modellings and analytics are instrumental in developing strategies for compact city and vertical urban development assessment [9,23]. Trubka and Gleckin (2016) [24] used different housing typologies in a library developed for a web-based 3D scenario building and visualisation platform to generate infill residential development report in the precinct level.
From the environmental planning perspective, 3D models have been used for measuring urban heat islands [25], urban and building energy modelling [26], and thermal comfort analysis [27]. For instance, Pullar et al. (2001) [28] developed a Visual impact assessment (VIA) tool using 3D models, which can be used for design of urban landscape. Furthermore, Nichol et al. (2005) [29] used 3D Virtual Reality models to assess the quality of city environment for planning purposes. In addition, a number of open-source and free 3D design and visualisation tools are developed for urban environment planning, modelling and simulations [30,31]. In the continuum of urban planning process, the outcomes of strategic urban planning can be used to develop tools and regulations for statutory urban planning.
Statutory planners have two major tasks: (a) amending the planning controls based on new urban strategies; and (b) conducting new development appraisals on the basis of strategies, regulations, and the city characters (e.g., building heights, vegetation, façade, and other city amenities). The role of 3D city models in statutory planning activities such as shadow effect, sky view factor and set back analyses are investigated in the literature [7,32]. Brasebin et al. (2018) [32] developed an algorithm in SimPLU3D (https://simplu3d.github.io/) to support both building designers and statutory planners in evaluating the compatibility of buildings with regulations such as setback, building height to road width ratio, and building footprint ratio. The focus of SimPLU3D is to optimise the city configurations based on planning rules. This tool is proposed as an improvement for more complex planning rules and further measurements of urban land uses. In another study, Brasebin et al. (2016) [33] used Object Constraints Language (OCL) to gain understanding as to whether the new proposed building configuration follows the planning control rules.
Planning scheme amendments require parametric and procedural modelling capabilities [34]. Vanegas et al. (2012) [35] proposed a game-based approach in procedural modelling for those who have no knowledge of regulations. This approach benefits both planners and residents, who would like to envision different scenarios. While some studies considered enabling non-experts in developing and visualising urban models [36,37,38], one of the major issues is the complexity of tools and technical skill requirements in developing such models. To date, there have been limited studies on how to support non-technical users in planning control amendment tasks and evaluating their implications.
Residents are heavily involved in both the strategic and statutory planning tasks. For instance, in Australia, in Victoria state’s planning scheme it is mandatory to develop strategies, and make planning amendments through the community participation in a certain timeframe [39]. As such, the role of 3D visualisation and interactive scenario evaluation based on planning rules is very crucial. While the current developments and studies have indicated the usefulness and easy-to-use capabilities of 3D city design aspects, most of them remained in the conceptual level and less real-world applications are reported in the literature. Moreover, despite the fact that literature has indicated the importance of parametric and rule-based 3D city models in the urban planning process [10,32], these methods are yet to be implemented in the Australian context. The next section proposes a workflow for a planning control amendment in the Victoria Planning Scheme.
3. Materials and Methods
In the Victoria Planning Scheme, the controls that influence the built form are:
- Street, side and rear setbacks
- Building height
- Site Coverage
- Daylight to existing windows and north facing windows
- Overshadowing open space
- Overlooking
This study focuses on the three key controls of the street, side and rear setbacks, and building height.
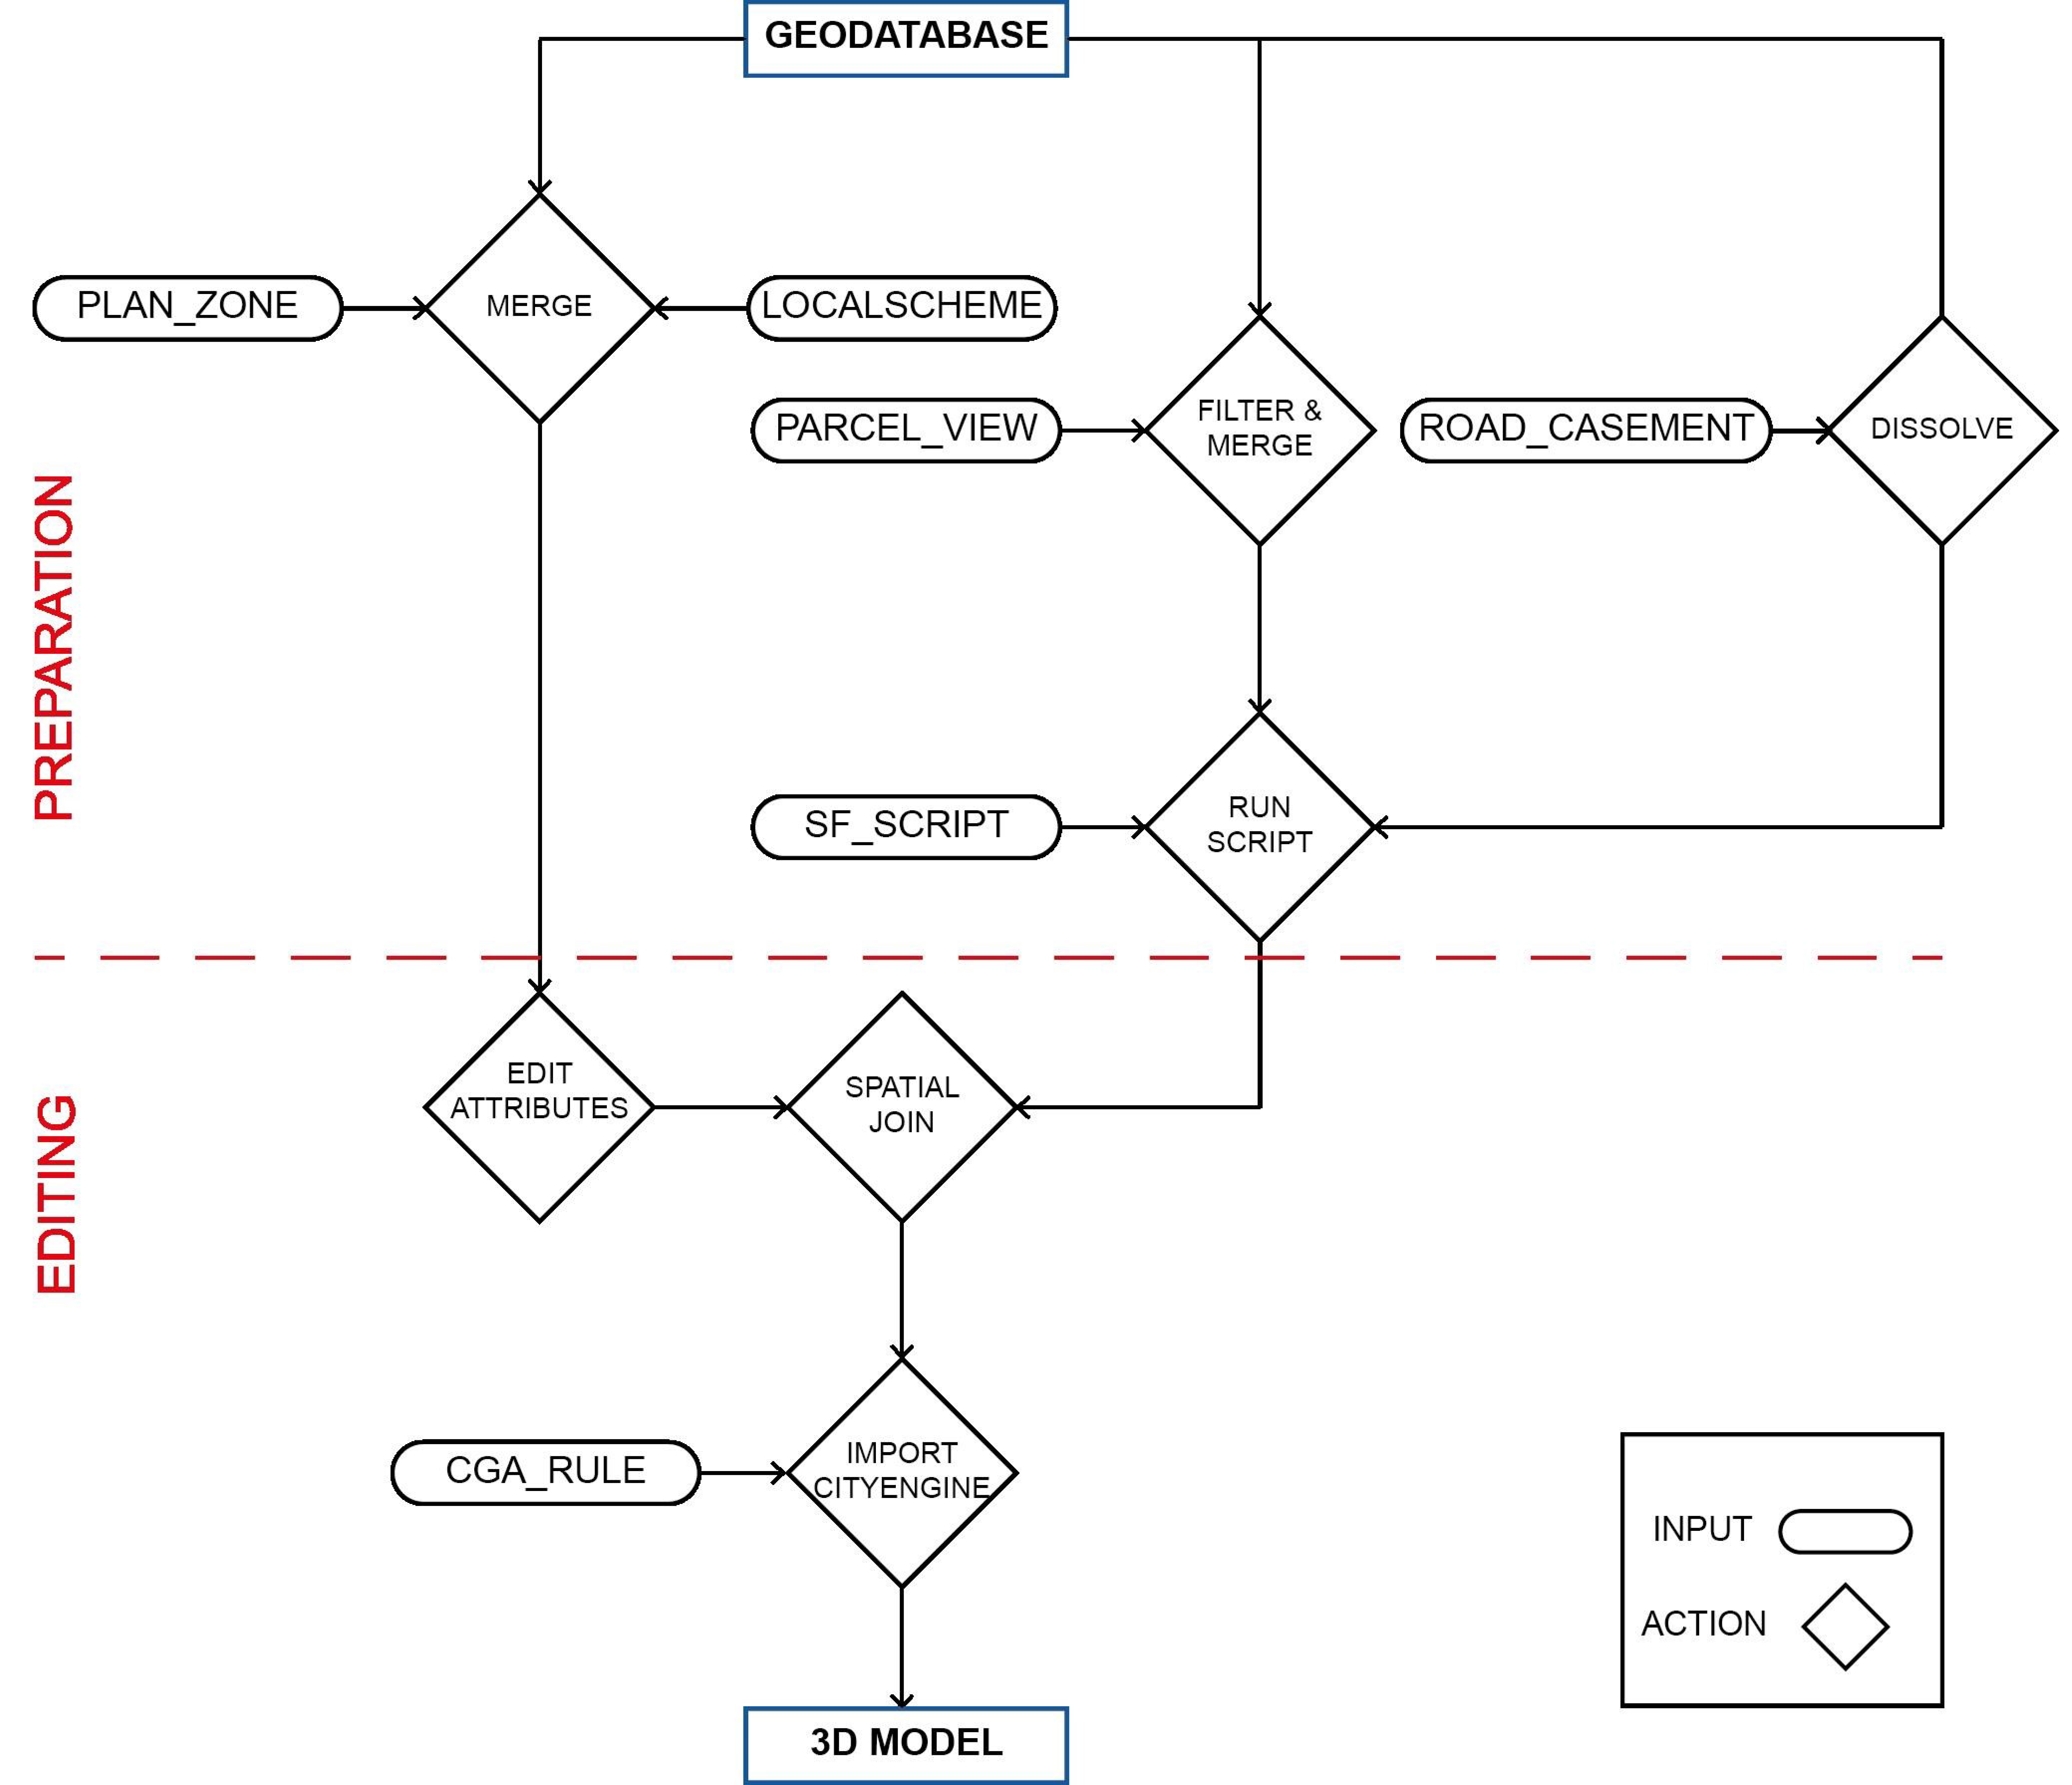
The developed workflow is split into two parts to provide the mechanism for the amendment of the controls without the need to complete the entire process. Figure 1 presents the two part workflow; the first part is data preparation steps, which will only need to be conducted if there is an update of the cadastral layer by the custodian. The second part of the workflow includes only the actions that need to be used to change the polygon extents, controls and the plan zone. In addition, the CGA rule file includes the provision for parameters to be changed and this can be done within the user interface.
The Geodatabase structure is outlined in Figure 2. Further to this, the ‘Parcel_Layer’ used in ESRI CityEngine (https://www.esri.com/en-us/arcgis/products/esri-cityengine/overview) is shown in Figure 3 with its field structure broken down. The following subsections present in detail the process undertaken to develop the 3D model.
3.1. GIS Layer Preparation
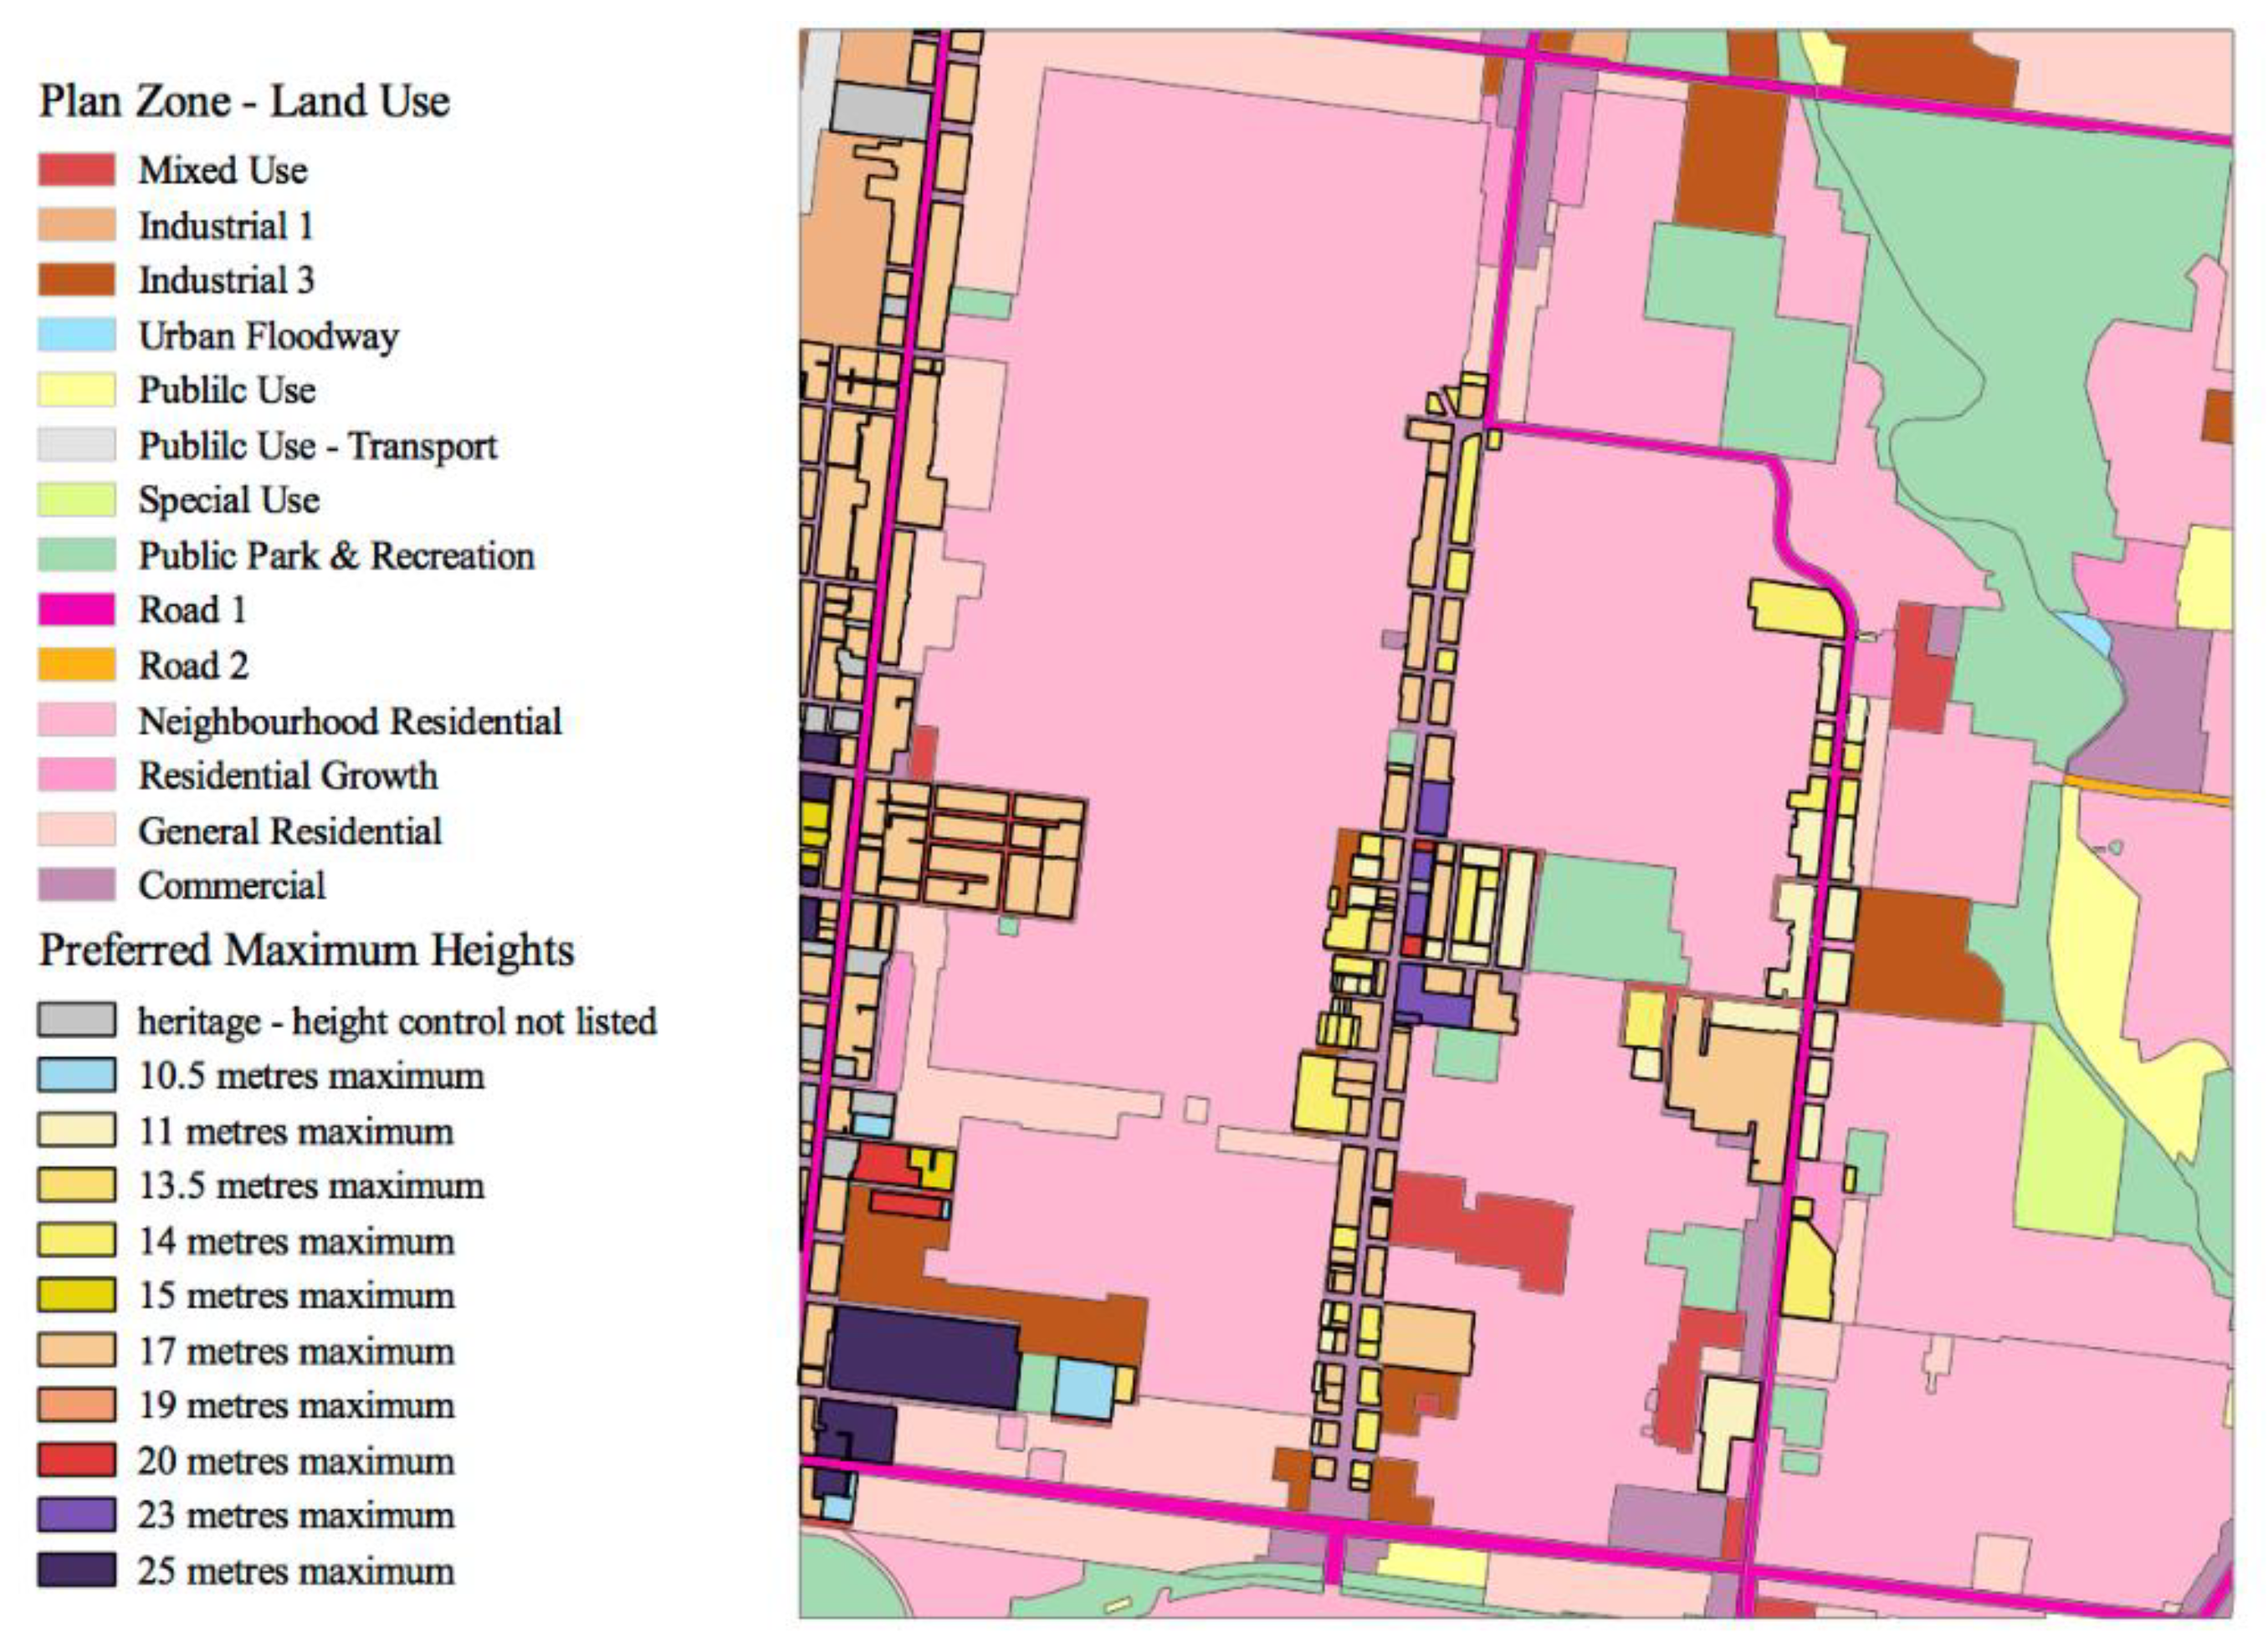
To undertake procedural modelling, a study area of over 300 ha in the Moreland City Council, an inner suburb in Metropolitan Melbourne, was selected. The Moreland Planning Scheme Design Development Overlays were reviewed and building controls were found, digitised in GIS, attributed with values, and included in the geodatabase under ‘localScheme’ (see Figure 2). The structure of the geodatabase was tested and the appropriate feature class according to CGA rule files was designed. To construct the 3D model, the Vicmap planning dataset (https://www.data.vic.gov.au/data/dataset/vicmap-planning) was retrieved from open data repository of the State of Victoria. This data contained the land use zone and overlay controls for all Victorian planning schemes. The land use zoning was merged with the study area’s planning scheme (see Figure 4) and also attributed with the control values.
It was found that multiple types of land uses (and therefore controls) may cover parcels and this had to be accounted for when transferring the controls to the parcel layer. Therefore, the centroid of the parcel was used as the location for the spatial join to attribute the parcel layer with the relevant controls. The planning zone layer may not align with parcel boundaries due to differences in transformations or an update in the cadastral layer that has not yet been reflected through a modification to the planning zone layer.
3.2. Rule File Preparation
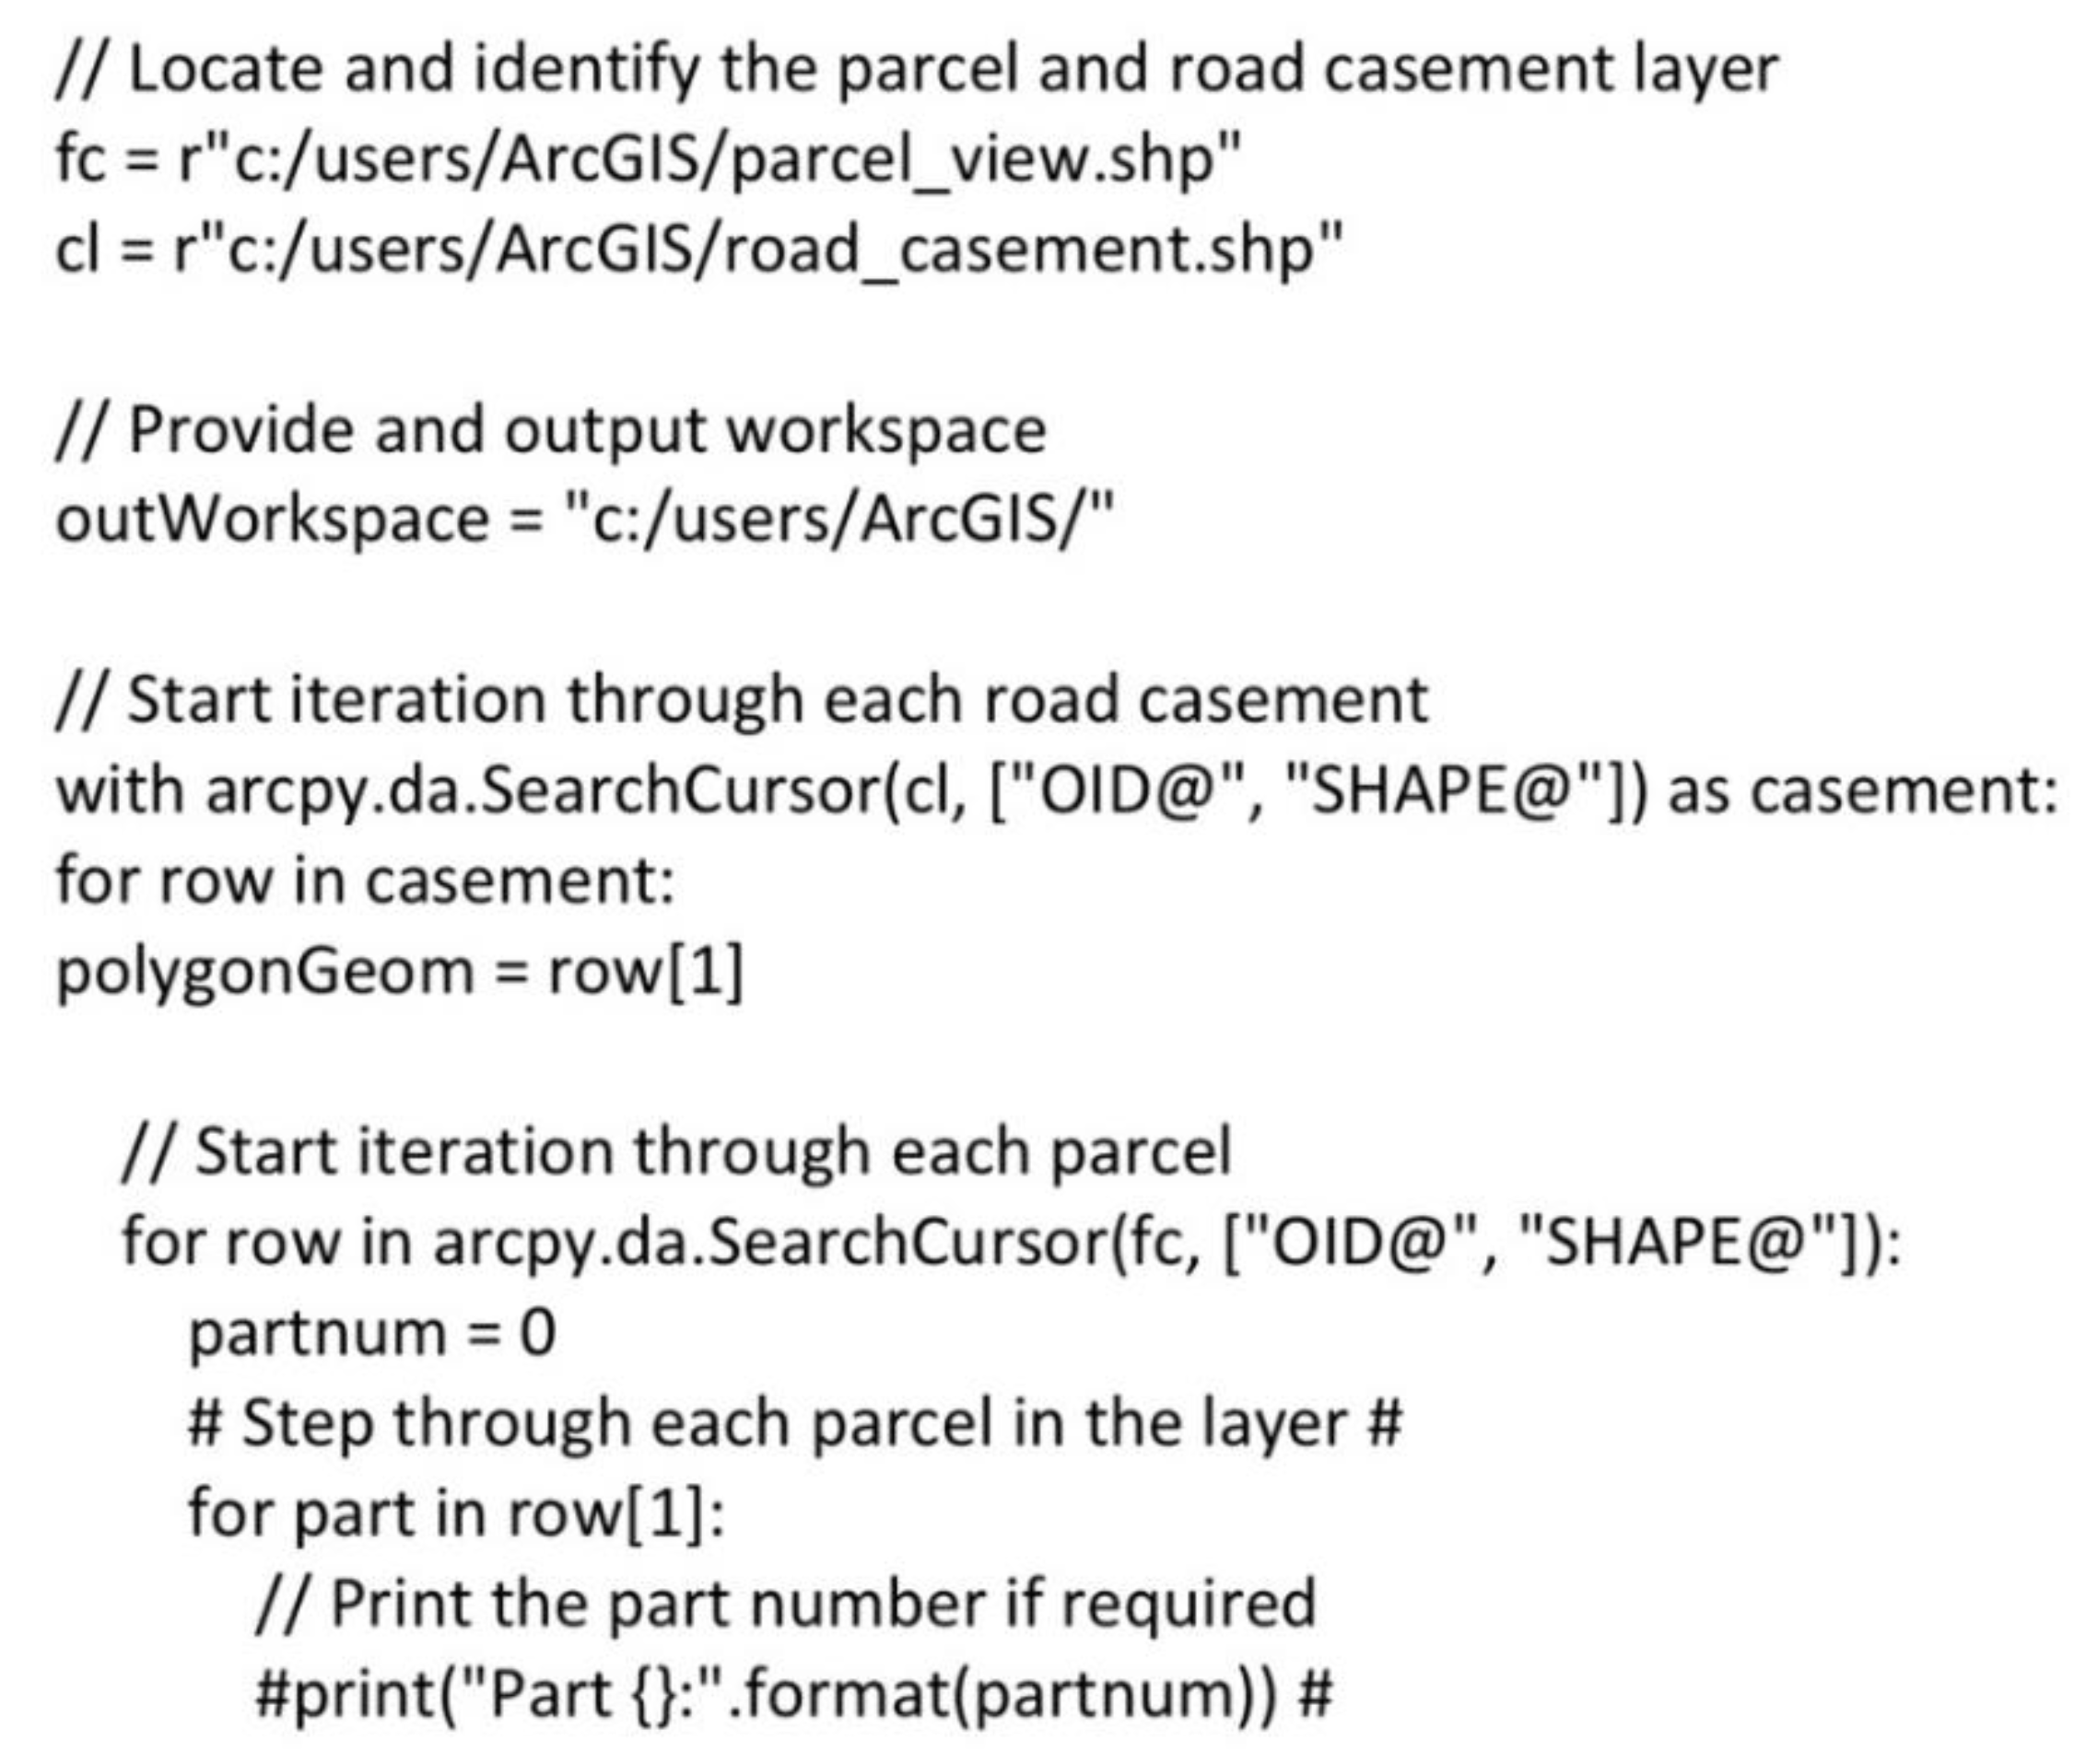
The newly created parcels with a planning control layer in the geodatabase were imported into ESRI CityEngine (https://www.esri.com/en-us/arcgis/products/esri-cityengine/overview) and the CGA rule file was planned and scripted. Figure 5 shows an excerpt of CGA rule script. The CGA rule file was broken down into individual functions to be able to interpret the attributes of each polygon and extrude as per the building height. Further to the setbacks at the front, rear and sides could be read and visualised. To provide consistency, the same colours used in the planning scheme were entered into the original feature layers. These colours were interpreted by the CGA rule file and applied to the visualisation. Importantly, different parameters were configured to enable the user to change the heights and setbacks. However, the limits that are state-wide were hard-coded within the script to avoid these being changed by the user. Finally, a block within the activity centre was given two land uses and colour coded accordingly to determine if the planning scheme could also be represented in three dimensions.
3.3. Merging Development Control Layers
Figure 4 reveals the 2D ‘schemeControl’ layer that was the result of the merging ‘plan_zone’ with the ‘localScheme’ layer. This produced an exhaustive layer ensuring that the entire study area is covered and the required development controls are incorporated into the model.
3.4. Procedural Modelling
The street frontage problem has limited large scale procedural modelling as software packages are often unable to determine the street edge of a parcel. Without this, the controls applicable to the frontage cannot be applied. The Street Frontage Script developed and, when used in the study area, successfully located the edge that acts as the street frontage. There were 6356 consolidated parcels with 43,079 vertices and the script reordered the vertices in a clockwise order from the vertex, first touching the road casement. Figure 6a indicates the origin vertex prior to modification and Figure 6b reveals the location of the origin following implantation of the script.
4. Results
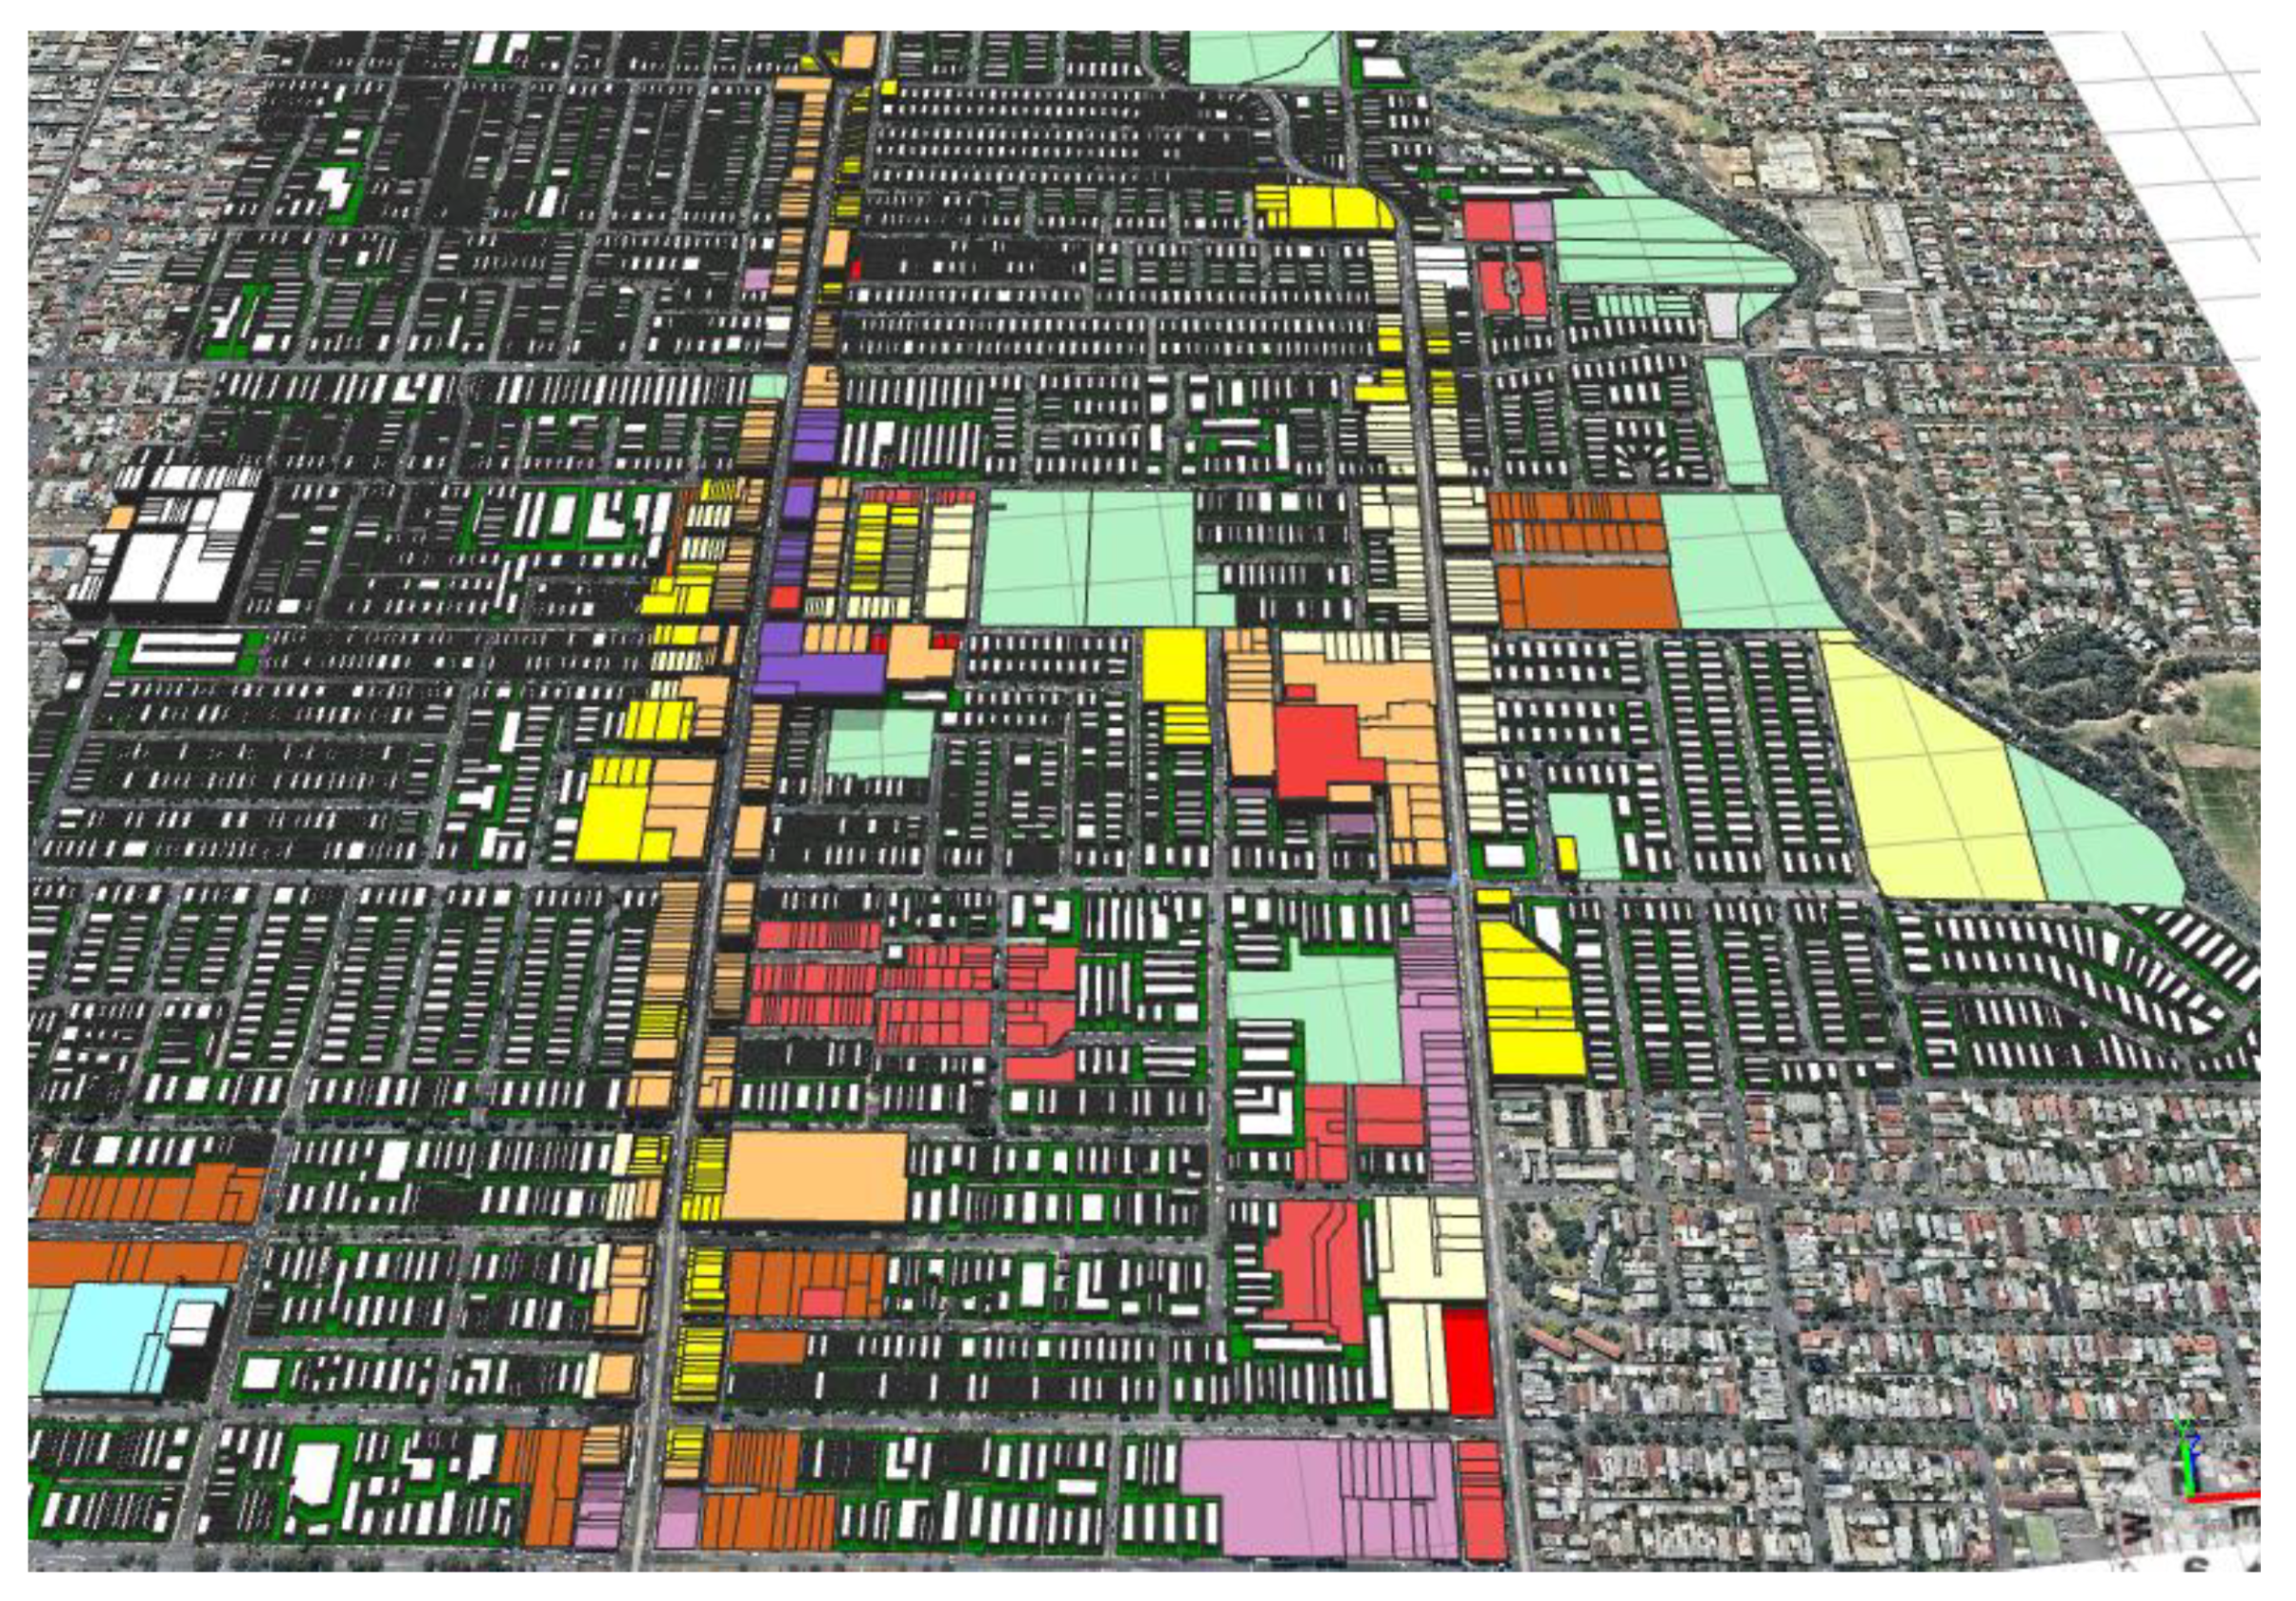
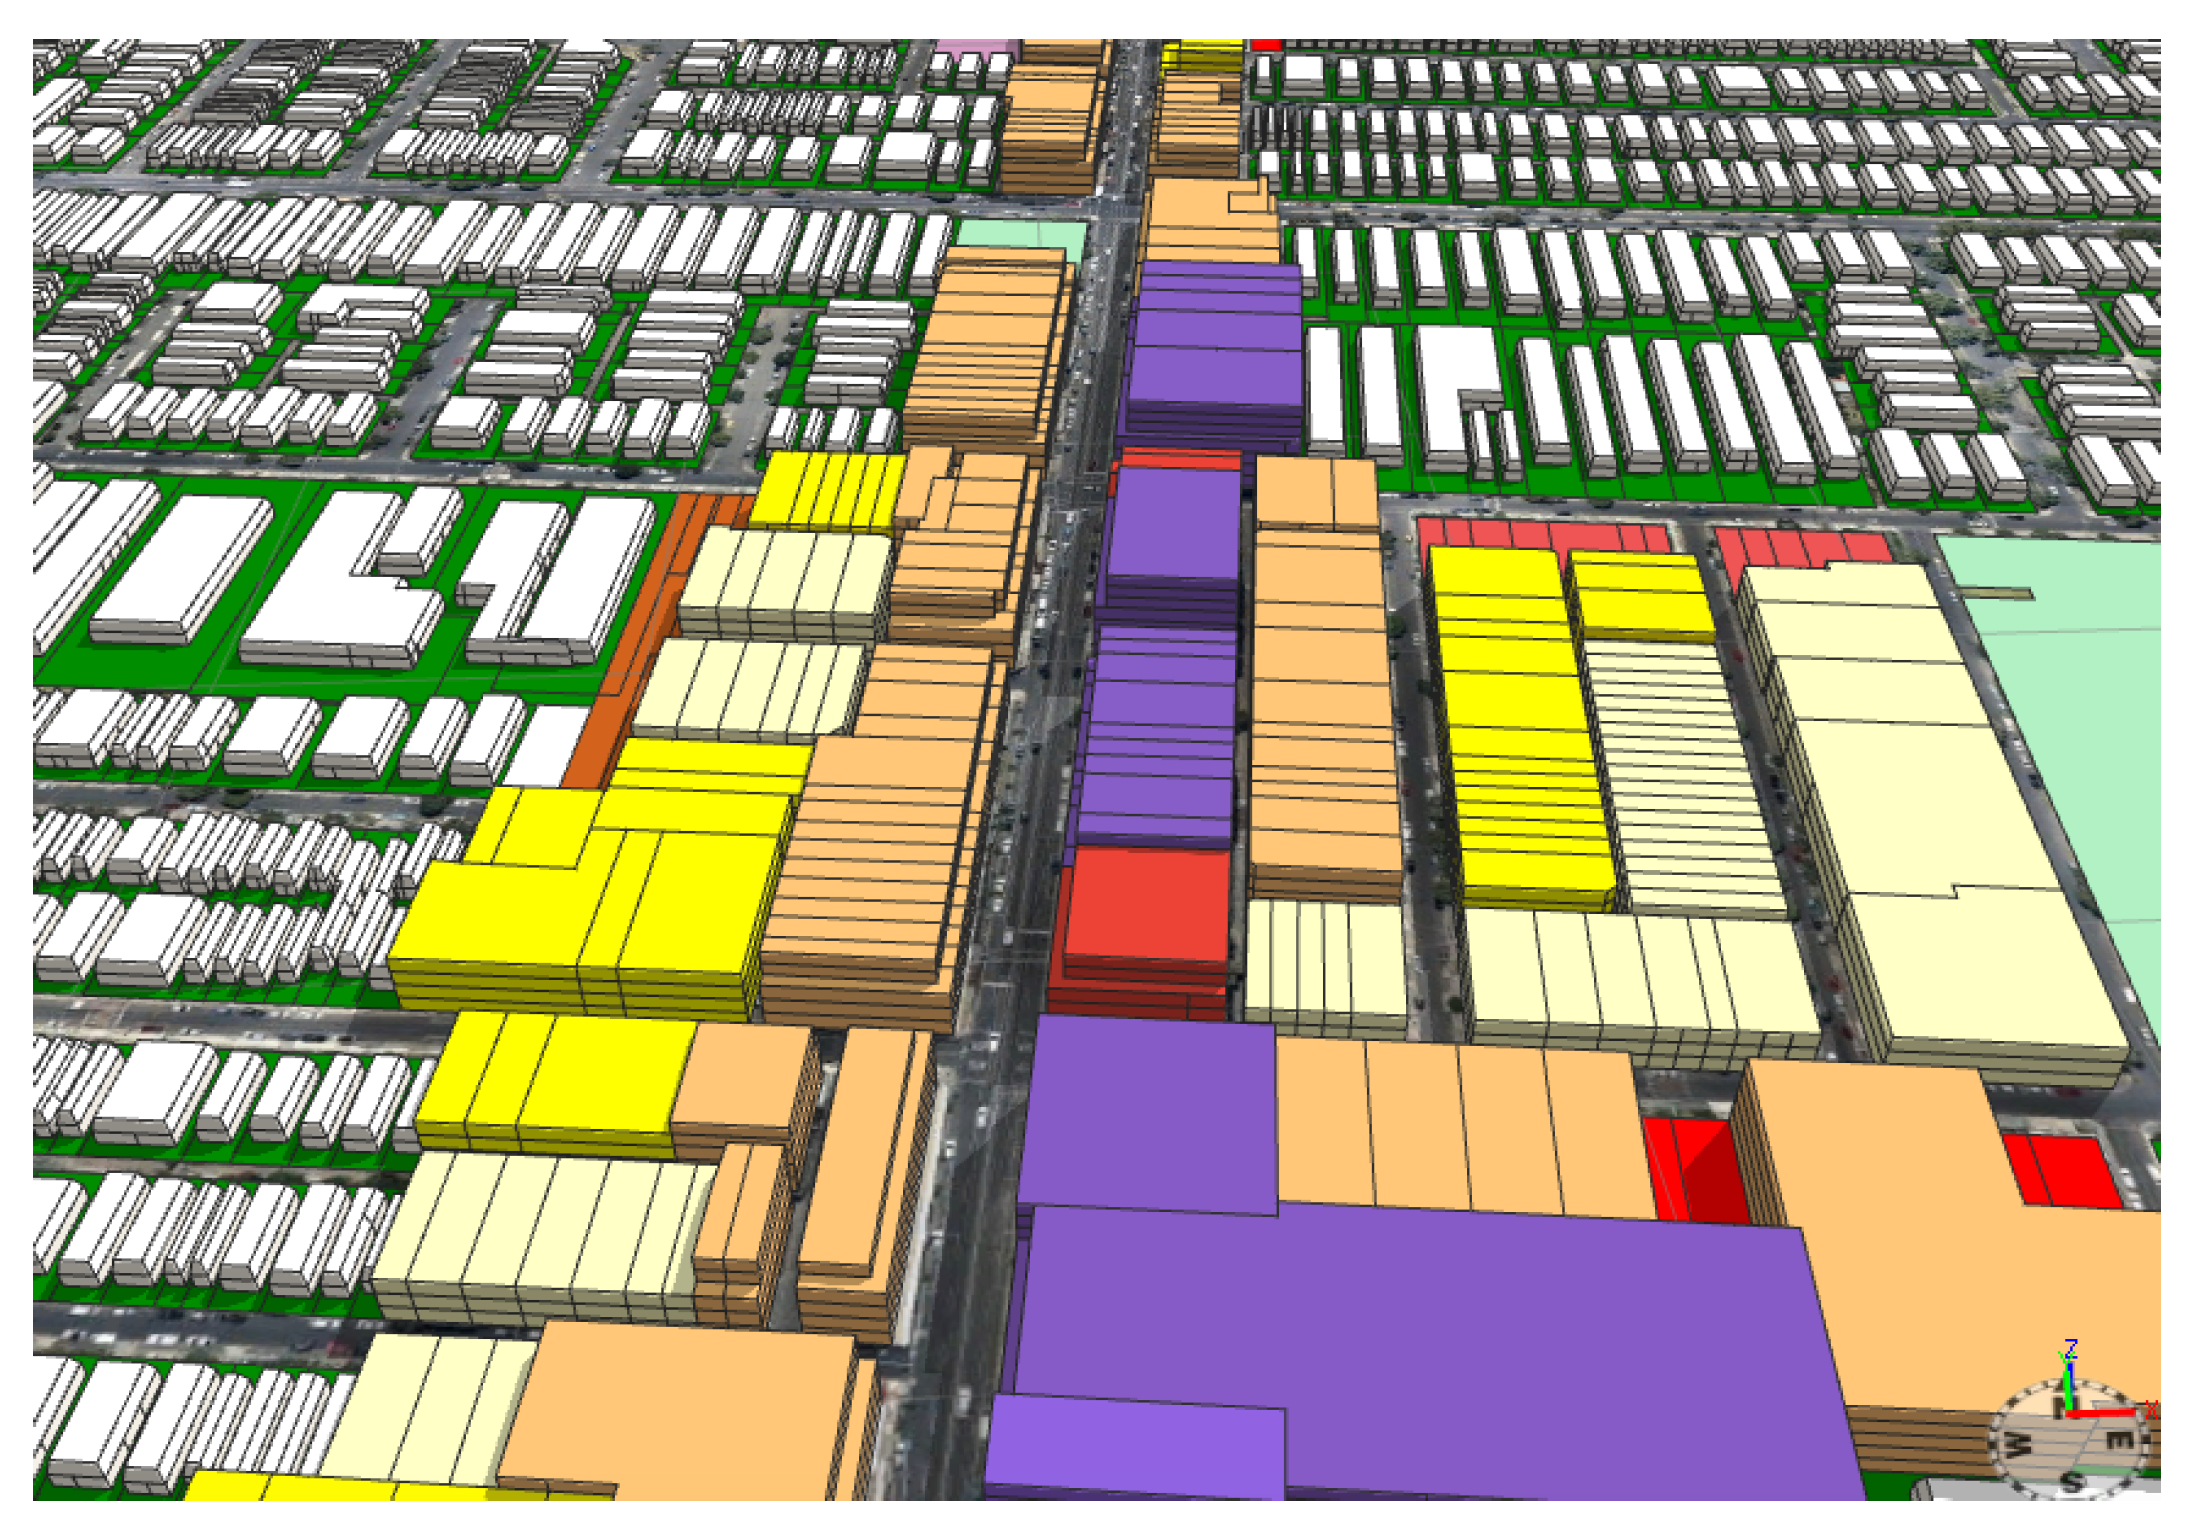
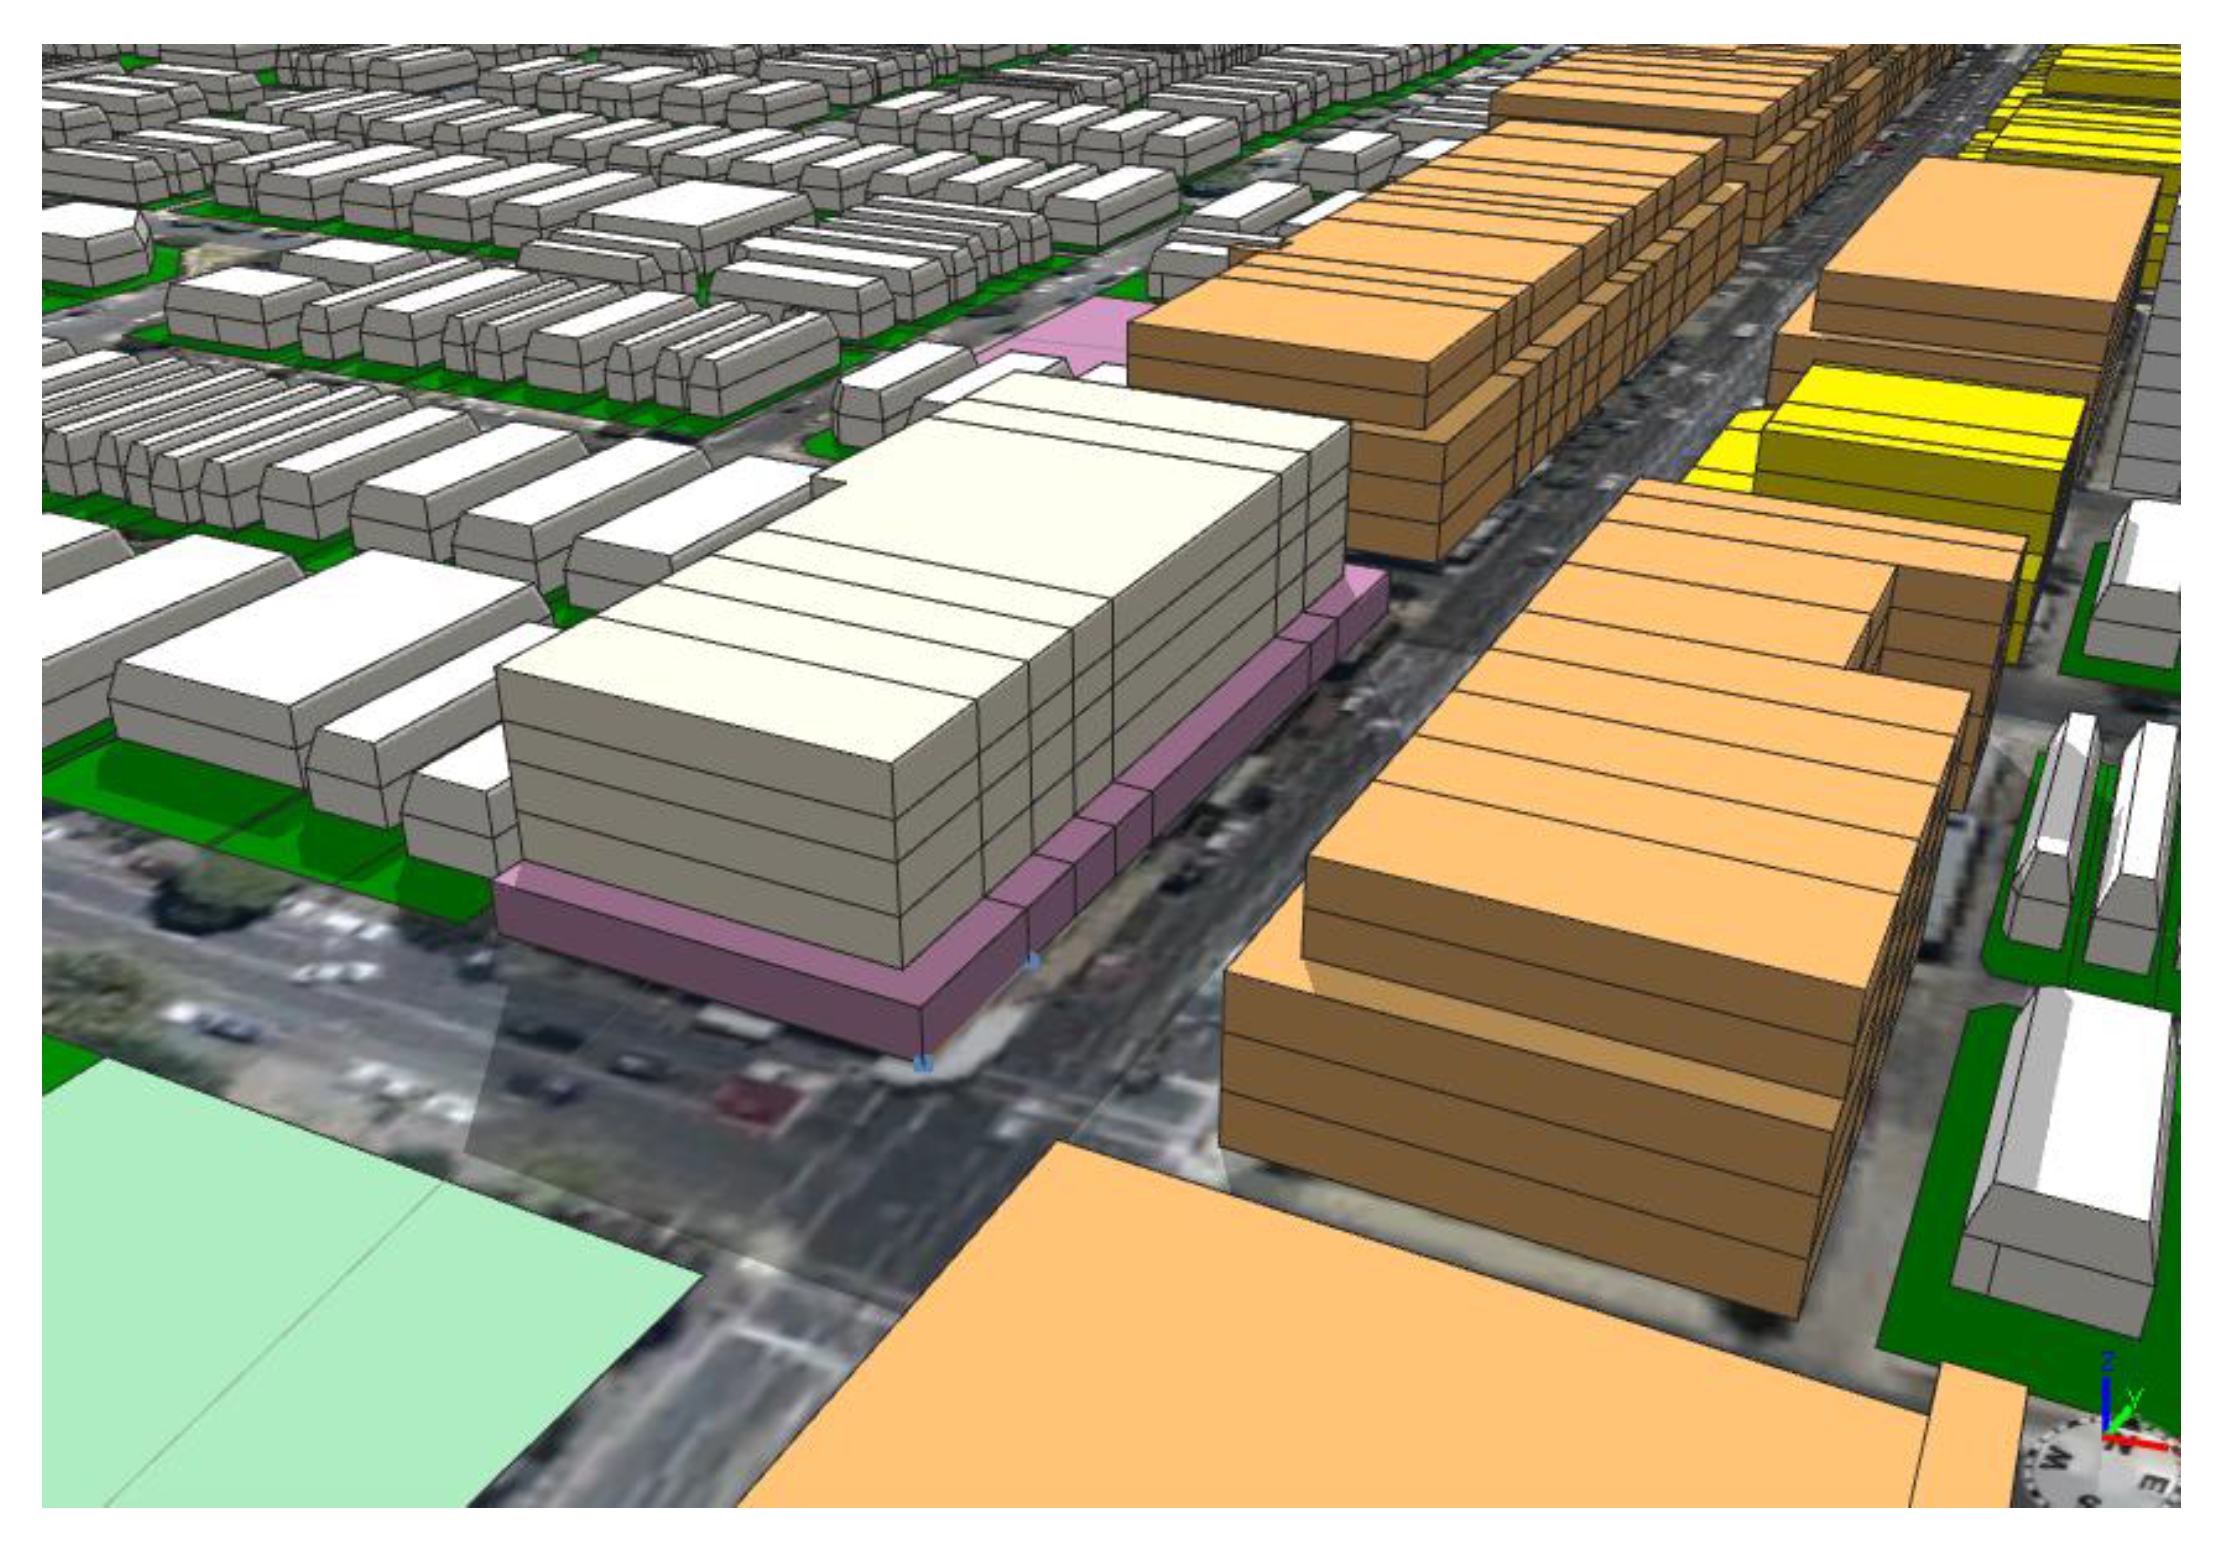
Using the developed tool, the 3D visualisation of the development controls as per the Moreland planning scheme for Nicholson Street and Lygon Street are demonstrated in Figure 7. The modelling results clearly indicate the controls that were added from the local planning scheme to the planning zones. These areas are notably higher in density and have a visual impact on the surrounding landscape. The correct street frontages have also resulted in the setbacks and upper setbacks being applied to the appropriate edge. This is highlighted in Figure 8, which provides further detail of the design controls.
Figure 7 also demonstrates the capability of the CGA rule file to be modified to visualise two different land uses. In this case, commercial use was assigned to the ground floor, while residential was limited to the upper levels.
Matching the coordinate reference system of the parcels with the CityEngine scene successfully demonstrates the effect of shadowing on the adjacent buildings and land uses. Figure 8 and Figure 9 each had a different month and time of day applied to demonstrate the change in shadowing across the study area.
During the development of the workflow and model, it became apparent that the ‘Road_Casement’ layer needed to be from the same updated date as the ‘Parcel_View’ polygon. It was found that this was due to differences occurring in the positioning between dates, depending on the transformations or an update of a local polygon. Furthermore, using the centroid location to pickup the attributes was chosen for their usability, as the application of a proportional sum analysis would add another step to the workflow. However, if the user would like to use the proportional sum instead, then the application can be efficiently conducted in any GIS software package such as ArcGIS or QGIS (https://www.qgis.org/en/site/) by taking a percentage of the intersection and nominating the greater percentage as the land use (and therefore associated controls).
5. Discussion
Several studies have shown that 3D city models are instrumental in planning tasks including participatory, strategic, and statutory planning. This study sets out with the aim of improving the workflow of tools for statutory planning activities through developing a geodatabase structure and process to use 2D GIS information to model and visualise the 3D built form. The study proposed a workflow for planning scheme amendment, which can be implemented in the rule based procedural modelling tools.
A number of recent studies indicated the role of rule-based 3D visualisation for planning and design [37,38]. Accordingly, the 3D visualisation tool in this study accurately modelled the height and setback controls applicable in the study area of Moreland. The 2D GIS layer, workflow and CGA rule file were successfully read by CityEngine, demonstrating the power of the proposed 3D visualisation tool to take 2D GIS procedural modelling and construct a 3D model. This workflow improved the current procedural modellings [36,37] and addressed the challenge which arose in Section 2, which was the need for specialist skills or knowledge in 3D visualisation models [11].
Since the tool uses 2D GIS data prior to 3D extrusion, the additional advantage of the developed tool is further realised through the added ability to conduct distance, area, and location analysis using other GIS systems. This capability prevents constant rendering of 3D models, which saves time and effort for a new development appraisal task for statutory planners. Consequently, the developed visualisation tool can provide strategic planners with a more efficient means of testing their vision by allowing for multiple large scale iterations, without the need to edit each individual block. This allows the planners to run different scenarios and communicate with citizens through participatory urban planning. The developed tool does not aim to visualise as-built development but instead provides the built form envelope according to the design controls.
The tool uses information and data made readily available to the public (open data) and therefore users are not restricted by the need to purchase information [12]. In the traditional form, the third dimension is expressed using texts and the greater variation in controls lead to more textual rather than visual presentation, which increases the complexity. Reducing these complexities by having the built form in 3D may assist the role of a statutory planner during the application process.
Furthermore, the 3D visualisation tool has been developed to use readily available parcel information and plan zone layers, which further enhance its versatility and robustness as a 3D visualisation tool. The methodology is applicable to areas of all shapes and sizes as the visualisation is driven by the controls in Figure 2. This allows other municipalities to apply the applicable local controls to derive the 3D model. Figure 7, Figure 8 and Figure 9 provide an indication of the level of detail which can be obtained by statutory planners using basic 2D GIS knowledge in planning scheme amendments. The findings in this study help us to understand the critical role of 3D city models and procedural modelling in supporting planners for a data-driven and evidence-based planning process.
6. Conclusions
This study has shown that the procedural 3D city modelling tool can be used to analyse and visualise the planning scheme at 3D level. Using the 2D GIS layer, the procedural modelling can extrude the visualisation on a large scale without the need to do modelling on a site-by-site basis. This improves the time taken to develop the visualisation of a design development overlay. The implication of this is in planning amendments evaluation that can be conducted in 3D visualisation environment. Large scale procedural modelling will also provide comparability of planning strategies such as urban intensification in two precincts as they have been developed under the same rule file. The building footprints attributes can have the same feature class structure developed with a similar CGA rule file to extrude the polygons and implement the building’s structure. Also, Gross Floor Area calculations may be added to provide the statistical component of the 3D modelling.
Some anomalies in street frontage script occurred when the parcel boundary had two edges, which were touching two separate roads. This is more common for corner blocks, but also ones that back onto another road. The script may be extended to include the breakdown of road casement by its class code and assign the edge touching the higher class code as the street frontage. To address corner blocks, the shorter touching edge may be assigned.
The Smart Cities Plan identified that regulatory and policy reforms will need to find ways to reduce development assessment processing time and inconsistencies. It also noted that the planning and zoning rules need to be subjected to public interest tests to ensure that the benefits of restrictions to the community outweigh the costs. The 3D visualisation of the planning controls in this study assisted in reducing ambiguity amongst stakeholders. A reduction in ambiguity has the potential to reduce disputes, saving time and costs for the state and development industry, as well as providing assurance for the community.
3D visualisations can now be readily shared online through ESRI CityEngine web scenes and users can navigate through the area. Further investigation has also found that current research outlines the ability for information-rich 3D modelling to assist in complex area analysis without recognising that even what is regarded as simple 3D modelling is not widely used by planners. Budget and time constraints together with a reluctance of planners to use 3D models limit the use of 3D visualisations in urban planning. The development of a new 3D layered planning scheme may drive further research to the implementation of land use zoning along the vertical axis. The 3D model in the study was extended to test whether a single parcel could include a commercial and residential zone. The implications of this could be that regulations regarding mixed-use development may be better understood and managed.
Considerably more work will need to be done to validate the geometrical 3D objects for accurate measurement of building height and setbacks. In addition, there are several residential development codes and standards in Victoria Planning Scheme that need indoor visualisation and measurements. For instance, the current 3D tools need to be improved to enable planners in assessing the overlooking and day light to new windows standards. Furthermore, given that the current workflow is developed for a commercial software package, using open source tools and standards enabling the statutory planners for 3D development assessment remains a fruitful area for future work.
Author Contributions
Conceptualisation, T.A., S.S. and M.K.; Data curation, T.A.; Methodology, T.A.; Supervision, S.S. and M.K.; Validation, S.S. and M.K.; Visualisation, T.A.; Writing—original draft, T.A. and S.S.; Writing—review & editing, S.S. and M.K.
Funding
This research received no external funding
Conflicts of Interest
The authors declare no conflict of interest.
References
- Burton, E.; Jenks, M.; Williams, K. The Compact City: A Sustainable Urban Form, 2nd ed.; Taylor & Francis: London, UK, 2005; ISBN 0-419-21300-7. [Google Scholar]
- Sabri, S.; Rajabifard, A.; Ho, S.; Amirebrahimi, S.; Bishop, I. Leveraging VGI Integrated with 3D Spatial Technology to Support Urban Intensification in Melbourne, Australia. Urban Plan. 2016, 1, 32. [Google Scholar] [CrossRef] [Green Version]
- Kyttä, M.; Broberg, A.; Tzoulas, T.; Snabb, K. Towards contextually sensitive urban densification: Location-based softGIS knowledge revealing perceived residential environmental quality. Landsc. Urban Plan. 2013, 113, 30–46. [Google Scholar] [CrossRef]
- Ahmed, A.; Sabri, S. Integrating GeoDesign and Conventional Spatial Analysis Methods in Evaluating Compact City Development. In Proceedings of the International Conference on Sustainable Urban Design for Livable Cities (SUDLiC), Kuala Lumpur, Malaysia, 11–12 November 2014; pp. 276–286. [Google Scholar]
- Yin, L. Street level urban design qualities for walkability: Combining 2D and 3D GIS measures. Comput. Environ. Urban Syst. 2017, 64, 288–296. [Google Scholar] [CrossRef]
- Alam, N.; Coors, V.; Zlatanova, S. Detecting shadow for direct radiation using CityGML models for photovoltaic potentiality analysis. In Urban and Regional Data Management, UDMS Annual 2013, Proceedings of the Urban Data Management Society Symposium, London, UK, 29–31 May 2013; Taylor & Francis: London, UK, 2013; pp. 191–196. [Google Scholar]
- Rafiee, A.; Dias, E.; Fruijtier, S.; Scholten, H. From BIM to Geo-analysis: View Coverage and Shadow Analysis by BIM/GIS Integration. Procedia Environ. Sci. 2014, 22, 397–402. [Google Scholar] [CrossRef]
- Amirebrahimi, S.; Rajabifard, A.; Mendis, P.; Ngo, T.; Sabri, S. A Planning Decision Support Tool for Evaluation and 3D Visualisation of Building Risk in Flood Prone Areas. In Proceedings of the FIG Working Week 2016: Recover from Disaster, Christchurch, New Zealand, 2–6 May 2016. [Google Scholar]
- Sabri, S.; Ho, S.; Rajabifard, A. Implementing the “20-minjute neighbourhood”: Leveraging New Spatial Data and Technologies to Support Planning for a Sustainable Metropolitan Melbourne. In Healthy Future Cities; Sun, S.H., Wenqi, L., Eds.; China Architecture and Building Press: Melbourne, Australia, 2018; pp. 502–517. ISBN 978-7-112-20762-6. [Google Scholar]
- Luo, Y.; He, J.; He, Y. A rule-based city modeling method for supporting district protective planning. Sustain. Cities Soc. 2017, 28, 277–286. [Google Scholar] [CrossRef]
- Ahmed, F.C.; Sekar, S.P. Using Three-Dimensional Volumetric Analysis in Everyday Urban Planning Processes. Appl. Spat. Anal. Policy 2015, 8, 393–408. [Google Scholar] [CrossRef]
- Sabri, S.; Pettit, C.J.; Kalantari, M.; Rajabifard, A.; White, M.; Lade, O.; Ngo, T. What are Essential requirements in Planning for Future Cities using Open Data Infrastructures and 3D Data Models? In Proceedings of the 14th Computers in Urban Planning and Urban Management (CUPUM2015), Boston, MA, USA, 7–10 July 2015; pp. 314-1–314-17. [Google Scholar]
- Biljecki, F.; Stoter, J.; Ledoux, H.; Zlatanova, S.; Çöltekin, A. Applications of 3D City Models: State of the Art Review. ISPRS Int. J. Geo-Inf. 2015, 4, 2842–2889. [Google Scholar] [CrossRef] [Green Version]
- Evans-Cowley, J.; Hollander, J. The New Generation of Public Participation: Internet-based Participation Tools. Plan. Pract. Res. 2010, 25, 397–408. [Google Scholar] [CrossRef]
- Bugs, G.; Granell, C.; Fonts, O.; Huerta, J.; Painho, M. An assessment of Public Participation GIS and Web 2.0 technologies in urban planning practice in Canela, Brazil. Cities 2010, 27, 172–181. [Google Scholar] [CrossRef]
- Trubka, R.; Glackin, S.; Lade, O.; Pettit, C. A web-based 3D visualisation and assessment system for urban precinct scenario modelling. ISPRS J. Photogramm. Remote Sens. 2015. [Google Scholar] [CrossRef]
- Wu, H.; He, Z.; Gong, J. A virtual globe-based 3D visualization and interactive framework for public participation in urban planning processes. Comput. Environ. Urban Syst. 2010, 34, 291–298. [Google Scholar] [CrossRef]
- Métral, C.; Falquet, G.; Vonlanthen, M. An Ontology-Based Model for Urban Planning Communication; Springer: Berlin/Heidelberg, Germany, 2007; pp. 61–72. [Google Scholar]
- De Graaf, R.S.; Dewulf, G.P.M.R. Applying the lessons of strategic urban planning learned in the developing world to the Netherlands: A case study of three industrial area development projects. Habitat Int. 2010, 34, 471–477. [Google Scholar] [CrossRef]
- Isikdag, U.; Zlatanova, S. Interactive Modelling of Buildings in Google Earth: A 3D Tool for Urban Planning; Springer: Berlin/Heidelberg, Germany, 2010; pp. 52–70. [Google Scholar]
- Kaňuk, J.; Gallay, M.; Hofierka, J. Generating time series of virtual 3-D city models using a retrospective approach. Landsc. Urban Plan. 2015, 139, 40–53. [Google Scholar] [CrossRef]
- Sanyal, J.; Roychowdhury, K. Tracking the relationship between changing skyline and population growth of an Indian megacity using earth observation technology. Geocarto Int. 2017, 32, 1421–1435. [Google Scholar] [CrossRef]
- Stevens, D.; Dragicevic, S.; Rothley, K. iCity: A GIS-CA modelling tool for urban planning and decision making. Environ. Model. Softw. 2007, 22, 761–773. [Google Scholar] [CrossRef]
- Trubka, R.; Glackin, S. Modelling housing typologies for urban redevelopment scenario planning. Comput. Environ. Urban Syst. 2016, 57, 199–211. [Google Scholar] [CrossRef]
- Lim, T.K.; Ignatius, M.; Miguel, M.; Wong, N.H.; Juang, H.-M.H. Multi-scale urban system modeling for sustainable planning and design. Energy Build. 2017, 157, 78–91. [Google Scholar] [CrossRef]
- Benner, J.; Geiger, A.; Häfele Ing Joachim Benner, K.-H. Virtual 3D City Model Support for Energy Demand Simulations on City Level-The CityGML Energy Extension. In REAL CORP 2016, Proceedings of the 21st International Conference on Urban Planning, Regional Development and Information Society, Hamburg, Germany, 22–24 June 2016; Schrenk, M., Ed.; CORP: Schwechat, Austria, 2016; pp. 777–786. [Google Scholar]
- Berger, M.; Cristie, V. CFD Post-procesing in Unity3D. Procedia Comput. Sci. 2015, 51, 2913–2922. [Google Scholar] [CrossRef]
- Pullar, D.V.; Tidey, M.E. Coupling 3D visualisation to qualitative assessment of built environment designs. Landsc. Urban Plan. 2001, 55, 29–40. [Google Scholar] [CrossRef]
- Nichol, J.; Wong, M.S. Modeling urban environmental quality in a tropical city. Landsc. Urban Plan. 2005, 73, 49–58. [Google Scholar] [CrossRef]
- Chen, Y.; Shooraj, E.; Rajabifard, A.; Sabri, S. From IFC to 3D Tiles: An Integrated Open-Source Solution for Visualising BIMs on Cesium. ISPRS Int. J. Geo-Inf. 2018, 7, 393. [Google Scholar] [CrossRef]
- Southall, R.; Biljecki, F. The VI-Suite: A set of environmental analysis tools with geospatial data applications. Open Geospat. Data Softw. Stand. 2017, 2, 23. [Google Scholar] [CrossRef]
- Brasebin, M.; Perret, J.; Mustière, S.; Weber, C. 3D urban data to assess local urban regulation influence. Comput. Environ. Urban Syst. 2018, 68, 37–52. [Google Scholar] [CrossRef]
- Brasebin, M.; Perret, J.; Mustière, S.; Weber, C.; Brasebin, M.; Perret, J.; Mustière, S.; Weber, C. A Generic Model to Exploit Urban Regulation Knowledge. ISPRS Int. J. Geo-Inf. 2016, 5, 14. [Google Scholar] [CrossRef]
- Parish, Y.I.H.; Müller, P. Procedural Modeling of Cities. In Proceedings of the ACM SIGGRAPH 2001, Los Angeles, CA, USA, 12–17 August 2001. [Google Scholar]
- Vanegas, C.A.; Garcia-Dorado, I.; Aliaga, D.G.; Benes, B.; Waddell, P. Inverse design of urban procedural models. ACM Trans. Graph. 2012, 31. [Google Scholar] [CrossRef]
- Nishida, G.; Garcia-Dorado, I.; Aliaga, D.G.; Benes, B.; Bousseau, A. Interactive Sketching of Urban Procedural Models. ACM Trans. Graph. 2016, 35, 1–11. [Google Scholar] [CrossRef]
- Luo, Y.; He, J. The Role of Rule-Based Procedural Modeling in Urban Planning. In Proceedings of the 16th International Conference on Computing in Civil and Building Engineering, Osaka, Japan, 6–8 July 2016; pp. 160–198. [Google Scholar]
- Koziatek, O.; Dragićević, S. iCity 3D: A geosimualtion method and tool for three-dimensional modeling of vertical urban development. Landsc. Urban Plan. 2017, 167, 356–367. [Google Scholar] [CrossRef]
- State Government of Victoria, Victoria Planning Provisions. Available online: http://planning-schemes.delwp.vic.gov.au/schemes/vpps (accessed on 18 June 2018).
Figure 1.
The workflow to produce 3D models from 2D plans.

Figure 2.
Proposed spatial database (geodatabase in this case) structure.

Figure 3.
Proposed Parcel_Layer structure.

Figure 4.
Merging ‘Plan_Zone’ with ‘LocalScheme’ from Figure 1 to create ‘SchemeControls’.
Figure 4.
Merging ‘Plan_Zone’ with ‘LocalScheme’ from Figure 1 to create ‘SchemeControls’.

Figure 5.
An excerpt of Computer Graphic Architecture (CGA) rule script for Planning Rules.

Figure 6.
Origin vertex of the parcel view layer: (a) prior to application of Street Frontage Script; (b) post application of Street Frontage Script.
Figure 6.
Origin vertex of the parcel view layer: (a) prior to application of Street Frontage Script; (b) post application of Street Frontage Script.

Figure 7.
3D model of the Nicholson Street and Lygon Street development controls as per the planning scheme controls in Figure 5.
Figure 7.
3D model of the Nicholson Street and Lygon Street development controls as per the planning scheme controls in Figure 5.

Figure 8.
Closer inspection of Lygon Street (Shadowing time set at 10:00 a.m. in March).

Figure 9.
Test of planning zones along the vertical axis (Shadowing time set at 2:00 p.m. in August). The commercial zone is seen in purple on the ground floor.
Figure 9.
Test of planning zones along the vertical axis (Shadowing time set at 2:00 p.m. in August). The commercial zone is seen in purple on the ground floor.

© 2018 by the authors. Licensee MDPI, Basel, Switzerland. This article is an open access article distributed under the terms and conditions of the Creative Commons Attribution (CC BY) license (http://creativecommons.org/licenses/by/4.0/).
Share and Cite
MDPI and ACS Style
Agius, T.; Sabri, S.; Kalantari, M. Three-Dimensional Rule-Based City Modelling to Support Urban Redevelopment Process. ISPRS Int. J. Geo-Inf. 2018, 7, 413. https://0-doi-org.brum.beds.ac.uk/10.3390/ijgi7100413
AMA Style
Agius T, Sabri S, Kalantari M. Three-Dimensional Rule-Based City Modelling to Support Urban Redevelopment Process. ISPRS International Journal of Geo-Information. 2018; 7(10):413. https://0-doi-org.brum.beds.ac.uk/10.3390/ijgi7100413
Chicago/Turabian StyleAgius, Tyler, Soheil Sabri, and Mohsen Kalantari. 2018. "Three-Dimensional Rule-Based City Modelling to Support Urban Redevelopment Process" ISPRS International Journal of Geo-Information 7, no. 10: 413. https://0-doi-org.brum.beds.ac.uk/10.3390/ijgi7100413
Note that from the first issue of 2016, this journal uses article numbers instead of page numbers. See further details here.