Next Issue
Volume 7, December
Previous Issue
Volume 7, October


ISPRS Int. J. Geo-Inf., Volume 7, Issue 11 (November 2018) – 39 articles

Cover Story (view full-size image): 
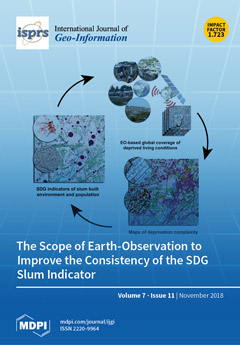
The increase in deprived living conditions in many cities of the Global South contradicts efforts to make them inclusive, safe, resilient, and sustainable places. Global statistics on the “proportion of urban population living in slums, informal settlements, or inadequate housing” (SDG indicator 11.1.1) are highly uncertain due to measurement and reporting problems. In addition, the data cannot be localized to effectively support upgrading. Using examples from across the globe, we show the scope of earth observation-based mapping of deprived living conditions and related population estimations in support of providing consistent information for the SDG indicator 11.1.1, and address uncertainties and geo-ethics. View this paper.
  • Issues are regarded as officially published after their release is announced to the table of contents alert mailing list.
  • You may sign up for e-mail alerts to receive table of contents of newly released issues.
  • PDF is the official format for papers published in both, html and pdf forms. To view the papers in pdf format, click on the "PDF Full-text" link, and use the free Adobe Reader to open them.
Order results
Result details
Select all
Export citation of selected articles as:
26 pages, 6900 KiB  
Article
Place versus Space: From Points, Lines and Polygons in GIS to Place-Based Representations Reflecting Language and Culture
by Thomas Blaschke, Helena Merschdorf, Pablo Cabrera-Barona, Song Gao, Emmanuel Papadakis and Anna Kovacs-Györi
ISPRS Int. J. Geo-Inf. 2018, 7(11), 452; https://0-doi-org.brum.beds.ac.uk/10.3390/ijgi7110452 - 19 Nov 2018
Cited by 32 | Viewed by 10840
Abstract
Around the globe, Geographic Information Systems (GISs) are well established in the daily workflow of authorities, businesses and non-profit organisations. GIS can effectively handle spatial entities and offer sophisticated analysis and modelling functions to deal with space. Only a small fraction of the [...] Read more.
Around the globe, Geographic Information Systems (GISs) are well established in the daily workflow of authorities, businesses and non-profit organisations. GIS can effectively handle spatial entities and offer sophisticated analysis and modelling functions to deal with space. Only a small fraction of the literature in Geographic Information Science—or GIScience in short—has advanced the development of place, addressing entities with an ambiguous boundary and relying more on the human or social attributes of a location rather than on crisp geographic boundaries. While the GIScience developments support the establishment of the digital humanities, GISs were never designed to handle subjective or vague data. We, an international group of authors, juxtapose place and space in English language and in several other languages and discuss potential consequences for Geoinformatics and GIScience. In particular, we address the question of whether linguistic and cultural settings play a role in the perception of place. We report on some facts revealed by this multi-language and multi-cultural dialogue, and what particular aspects of place we were able to discern regarding the few languages addressed. Full article
(This article belongs to the Special Issue Place-Based Research in GIScience and Geoinformatics)
Show Figures

Figure 1

14 pages, 14802 KiB  
Article
Direct Impacts of Climate Change and Indirect Impacts of Non-Climate Change on Land Surface Phenology Variation across Northern China
by Zhaohui Luo, Qingmei Song, Tao Wang, Huanmu Zeng, Tao He, Hengjun Zhang and Wenchen Wu
ISPRS Int. J. Geo-Inf. 2018, 7(11), 451; https://0-doi-org.brum.beds.ac.uk/10.3390/ijgi7110451 - 19 Nov 2018
Cited by 8 | Viewed by 3395
Abstract
Land surface phenology (LSP) is a sensitive indicator of climate change. Understanding the variation in LSP under various impacts can improve our knowledge on ecosystem dynamics and biosphere-atmosphere interactions. Over recent decades, LSP derived from remote sensing data and climate change-related variation of [...] Read more.
Land surface phenology (LSP) is a sensitive indicator of climate change. Understanding the variation in LSP under various impacts can improve our knowledge on ecosystem dynamics and biosphere-atmosphere interactions. Over recent decades, LSP derived from remote sensing data and climate change-related variation of LSP have been widely reported at the regional and global scales. However, the smoothing methods of the vegetation index (i.e., NDVI) are diverse, and discrepancies among methods may result in different results. Additionally, LSP is affected by climate change and non-climate change simultaneously. However, few studies have focused on the isolated impacts of climate change and the impacts of non-climate change on LSP variation. In this study, four methods were applied to reconstruct the MODIS enhanced vegetation index (EVI) dataset to choose the best smoothing result to estimate LSP. Subsequently, the variation in the start of season (SOS) and end of season (EOS) under isolated impacts of climate change were analyzed. Furthermore, the indirect effects of isolated impacts of non-climate change were conducted based on the differences between the combined impact (the impacts of both climate change and non-climate change) and isolated impacts of climate change. Our results indicated that the Savitzky-Golay method is the best method of the four for smoothing EVI in Northern China. Additionally, SOS displayed an advanced trend under the impacts of both climate change and non-climate change (hereafter called the combined impact), isolated impacts of climate change, and isolated impacts of non-climate change, with mean values of −0.26, −0.07, and −0.17 days per year, respectively. Moreover, the trend of SOS continued after 2000, but the magnitudes of changes in SOS after 2000 were lower than those that were estimated over the last two decades of the twentieth century (previous studies). EOS showed a delayed trend under the combined impact and isolated impacts of non-climate change, with mean values of 0.41 and 0.43 days per year, respectively. However, EOS advanced with a mean value of −0.16 days per year under the isolated impacts of climate change. Furthermore, the absolute mean values of SOS and EOS trends under the isolated impacts of non-climate change were larger than that of the isolated impacts of climate change, indicating that the effect of non-climate change on LSP variation was larger than that of climate change. With regard to the relative contribution of climatic factors to the variation in SOS and EOS, the proportion of solar radiation was the largest for both SOS and EOS, followed by precipitation and temperature. Full article
Show Figures

Figure 1

23 pages, 10554 KiB  
Article
Real-Time Efficient Exploration in Unknown Dynamic Environments Using MAVs
by Haytham Mohamed, Adel Moussa, Mohamed Elhabiby and Naser El-Sheimy
ISPRS Int. J. Geo-Inf. 2018, 7(11), 450; https://0-doi-org.brum.beds.ac.uk/10.3390/ijgi7110450 - 18 Nov 2018
Viewed by 2679
Abstract
Micro aerial vehicles (MAVs) have been acknowledged as an influential technology for indoor search and rescue operations. The time constraint is a crucial factor in most search and rescue operations. The employed MAVs in indoor environments are characterized by short endurance flight time [...] Read more.
Micro aerial vehicles (MAVs) have been acknowledged as an influential technology for indoor search and rescue operations. The time constraint is a crucial factor in most search and rescue operations. The employed MAVs in indoor environments are characterized by short endurance flight time and limited payload weights. Hence, adding more batteries to extend the flight time is practically not feasible. Typically, most of the indoor missions’ environments might not be accessed and remain unknown. Working in such environments requires effective exploration and information gathering to save time and maximize the coverage area. Furthermore, due to the dynamism of such environments, choosing the least risky trajectory is an important task. This paper proposes a real-time active exploration technique which is capable of efficiently generating paths that minimize the vehicle’s risk and maximize the coverage area. Furthermore, it accomplishes real-time monitoring of sudden changes in the estimated map, due to the dynamic objects, by reevaluating at real-time the destination and trajectory to minimize the risk on the chosen path and simultaneously preserving the maximization of the coverage area. Ultimately, recording the implemented trajectory of the vehicle also assists in time-saving as the vehicle depends on this trajectory during the exit process. The performance of the technique is studied under static and dynamic environments and is also compared with different algorithms. Full article
(This article belongs to the Special Issue Applications and Potential of UAV Photogrammetric Survey)
Show Figures

Figure 1

13 pages, 6705 KiB  
Article
Estimation of Hourly Link Population and Flow Directions from Mobile CDR
by Ko Ko Lwin, Yoshihide Sekimoto and Wataru Takeuchi
ISPRS Int. J. Geo-Inf. 2018, 7(11), 449; https://0-doi-org.brum.beds.ac.uk/10.3390/ijgi7110449 - 17 Nov 2018
Cited by 12 | Viewed by 4430
Abstract
The rise in big data applications in urban planning and transport management is now widening and becoming a part of local government decision-making processes. Understanding people flow inside the city helps urban and transport planners build a healthy and lively city. Many flow [...] Read more.
The rise in big data applications in urban planning and transport management is now widening and becoming a part of local government decision-making processes. Understanding people flow inside the city helps urban and transport planners build a healthy and lively city. Many flow maps are based on origin-and-destination points with crossing lines, which reduce the map’s readability and overall appearance. Today, with the emergence of geolocation-enabled handheld devices with wireless communication and networking capabilities, human mobility and the resulting events can be captured and stored as text-based geospatial big data. In this paper, we used one-week mobile-call-detail records (CDR) and a GIS road network model to estimate hourly link population and flow directions, based on mobile-call activities of origin–destination pairs with a shortest-path analysis for the whole city. Moreover, to gain the actual population size from the number of mobile-call users, we introduced a home-based magnification factor (h-MF) by integrating with the national census. Therefore, the final output link data have both magnitude (actual population) and flow direction at one-hour intervals between 06:00 and 21:00. The hourly link population and flow direction dataset are intended to optimize bus routes, solve traffic congestion problems, and enhance disaster and emergency preparedness. Full article
Show Figures

Graphical abstract

16 pages, 2593 KiB  
Article
Toward Model-Generated Household Listing in Low- and Middle-Income Countries Using Deep Learning
by Robert Chew, Kasey Jones, Jennifer Unangst, James Cajka, Justine Allpress, Safaa Amer and Karol Krotki
ISPRS Int. J. Geo-Inf. 2018, 7(11), 448; https://0-doi-org.brum.beds.ac.uk/10.3390/ijgi7110448 - 16 Nov 2018
Cited by 8 | Viewed by 3856
Abstract
While governments, researchers, and NGOs are exploring ways to leverage big data sources for sustainable development, household surveys are still a critical source of information for dozens of the 232 indicators for the Sustainable Development Goals (SDGs) in low- and middle-income countries (LMICs). [...] Read more.
While governments, researchers, and NGOs are exploring ways to leverage big data sources for sustainable development, household surveys are still a critical source of information for dozens of the 232 indicators for the Sustainable Development Goals (SDGs) in low- and middle-income countries (LMICs). Though some countries’ statistical agencies maintain databases of persons or households for sampling, conducting household surveys in LMICs is complicated due to incomplete, outdated, or inaccurate sampling frames. As a means to develop or update household listings in LMICs, this paper explores the use of machine learning models to detect and enumerate building structures directly from satellite imagery in the Kaduna state of Nigeria. Specifically, an object detection model was used to identify and locate buildings in satellite images. In the test set, the model attained a mean average precision (mAP) of 0.48 for detecting structures, with relatively higher values in areas with lower building density (mAP = 0.65). Furthermore, when model predictions were compared against recent household listings from fieldwork in Nigeria, the predictions showed high correlation with household coverage (Pearson = 0.70; Spearman = 0.81). With the need to produce comparable, scalable SDG indicators, this case study explores the feasibility and challenges of using object detection models to help develop timely enumerated household lists in LMICs. Full article
(This article belongs to the Special Issue Geo-Information and the Sustainable Development Goals (SDGs))
Show Figures

Figure 1

22 pages, 7952 KiB  
Article
Modelling, Validation and Quantification of Climate and Other Sensitivities of Building Energy Model on 3D City Models
by Syed Monjur Murshed, Solène Picard and Andreas Koch
ISPRS Int. J. Geo-Inf. 2018, 7(11), 447; https://0-doi-org.brum.beds.ac.uk/10.3390/ijgi7110447 - 15 Nov 2018
Cited by 11 | Viewed by 4467
Abstract
New planning tools are required to depict the complete building stock in a city and investigate detailed measures on reaching local and global targets to improve energy efficiency and reduce greenhouse gas emissions. To pursue this objective, ISO (the International Organization for Standardization) [...] Read more.
New planning tools are required to depict the complete building stock in a city and investigate detailed measures on reaching local and global targets to improve energy efficiency and reduce greenhouse gas emissions. To pursue this objective, ISO (the International Organization for Standardization) 13790:2008 monthly heating and cooling energy calculation method is implemented using geometric information from 3D city models (e.g., CityGML format) in an open source software architecture. A model is developed and applied in several urban districts with different number of 3D buildings in various cities. The model is validated with the simulation software TRNSYS. We also perform a sensitivity analysis to quantify the impact of climate change and other physical and behavioral factors on modelling results. The proposed approach can help to perform city or district-wide analysis of the building energy needs and prepare different renovation plans to support decision-making, which finally will enhance the livability of a city and the quality of life of the citizens. Full article
Show Figures

Figure 1

18 pages, 2070 KiB  
Article
Building a Framework of Usability Patterns for Web Applications in Spatial Data Infrastructures
by Christin Henzen
ISPRS Int. J. Geo-Inf. 2018, 7(11), 446; https://0-doi-org.brum.beds.ac.uk/10.3390/ijgi7110446 - 15 Nov 2018
Cited by 3 | Viewed by 3665
Abstract
Web applications in spatial data infrastructures (SDIs) should provide robust and user-friendly user interfaces for geoinformation (GI) discovery, analysis, and usage. Poor usability, e.g., caused by unsuitable information presentation or inappropriate (non) availability of functions, can result in inefficient or faulty usage and [...] Read more.
Web applications in spatial data infrastructures (SDIs) should provide robust and user-friendly user interfaces for geoinformation (GI) discovery, analysis, and usage. Poor usability, e.g., caused by unsuitable information presentation or inappropriate (non) availability of functions, can result in inefficient or faulty usage and can increase the acceptance of the application and provided geoinformation. Until now, a number of usability problems in GI web applications were identified; however, methods to summarize these problems, to provide (software-independent) solutions for them, and to find pairs of problems and related solutions hardly exist. We propose an adapted usability pattern concept for web applications in SDIs to map and categorize usability problems and best practice solutions and we enable a GI context-specific creation and discovery of these problems and solutions. The concept includes developed pattern types, relationships, and rules on how to use the relationships for the different pattern types. Full article
Show Figures

Figure 1

16 pages, 4334 KiB  
Article
Species-Level Vegetation Mapping in a Himalayan Treeline Ecotone Using Unmanned Aerial System (UAS) Imagery
by Niti B. Mishra, Kumar P. Mainali, Bharat B. Shrestha, Jackson Radenz and Debendra Karki
ISPRS Int. J. Geo-Inf. 2018, 7(11), 445; https://0-doi-org.brum.beds.ac.uk/10.3390/ijgi7110445 - 14 Nov 2018
Cited by 28 | Viewed by 5175
Abstract
Understanding ecological patterns and response to climate change requires unbiased data on species distribution. This can be challenging, especially in biodiverse but extreme environments like the Himalaya. This study presents the results of the first ever application of Unmanned Aerial Systems (UAS) imagery [...] Read more.
Understanding ecological patterns and response to climate change requires unbiased data on species distribution. This can be challenging, especially in biodiverse but extreme environments like the Himalaya. This study presents the results of the first ever application of Unmanned Aerial Systems (UAS) imagery for species-level mapping of vegetation in the Himalaya following a hierarchical Geographic Object Based Image Analysis (GEOBIA) method. The first level of classification separated green vegetated objects from the rest with overall accuracy of 95%. At the second level, seven cover types were identified (including four woody vegetation species). For this, the suitability of various spectral, shape and textural features were tested for classifying them using an ensemble decision tree algorithm. Spectral features alone yielded ~70% accuracy (kappa 0.66) whereas adding textural and shape features marginally improved the accuracy (73%) but at the cost of a substantial increase in processing time. Contrast in plant morphological traits was the key to distinguishing nearby stands as different species. Hence, broad-leaved versus fine needle leaved vegetation were mapped more accurately than structurally similar classes such as Rhododendron anthopogon versus non-photosynthetic vegetation. Results highlight the potential and limitations of the suggested UAS-GEOBIA approach for detailed mapping of plant communities and suggests future research directions. Full article
Show Figures

Graphical abstract

22 pages, 16957 KiB  
Article
Multi-Criteria Decision Making (MCDM) Model for Seismic Vulnerability Assessment (SVA) of Urban Residential Buildings
by Mohsen Alizadeh, Mazlan Hashim, Esmaeil Alizadeh, Himan Shahabi, Mohammad Reza Karami, Amin Beiranvand Pour, Biswajeet Pradhan and Hassan Zabihi
ISPRS Int. J. Geo-Inf. 2018, 7(11), 444; https://0-doi-org.brum.beds.ac.uk/10.3390/ijgi7110444 - 14 Nov 2018
Cited by 46 | Viewed by 7942
Abstract
Earthquakes are among the most catastrophic natural geo-hazards worldwide and endanger numerous lives annually. Therefore, it is vital to evaluate seismic vulnerability beforehand to decrease future fatalities. The aim of this research is to assess the seismic vulnerability of residential houses in an [...] Read more.
Earthquakes are among the most catastrophic natural geo-hazards worldwide and endanger numerous lives annually. Therefore, it is vital to evaluate seismic vulnerability beforehand to decrease future fatalities. The aim of this research is to assess the seismic vulnerability of residential houses in an urban region on the basis of the Multi-Criteria Decision Making (MCDM) model, including the analytic hierarchy process (AHP) and geographical information system (GIS). Tabriz city located adjacent to the North Tabriz Fault (NTF) in North-West Iran was selected as a case study. The NTF is one of the major seismogenic faults in the north-western part of Iran. First, several parameters such as distance to fault, percent of slope, and geology layers were used to develop a geotechnical map. In addition, the structural construction materials, building materials, size of building blocks, quality of buildings and buildings-floors were used as key factors impacting on the building’s structural vulnerability in residential areas. Subsequently, the AHP technique was adopted to measure the priority ranking, criteria weight (layers), and alternatives (classes) of every criterion through pair-wise comparison at all levels. Lastly, the layers of geotechnical and spatial structures were superimposed to design the seismic vulnerability map of buildings in the residential area of Tabriz city. The results showed that South and Southeast areas of Tabriz city exhibit low to moderate vulnerability, while some regions of the north-eastern area are under severe vulnerability conditions. In conclusion, the suggested approach offers a practical and effective evaluation of Seismic Vulnerability Assessment (SVA) and provides valuable information that could assist urban planners during mitigation and preparatory phases of less examined areas in many other regions around the world. Full article
(This article belongs to the Special Issue Natural Hazards and Geospatial Information)
Show Figures

Graphical abstract

15 pages, 12105 KiB  
Article
Effective Identification of Terrain Positions from Gridded DEM Data Using Multimodal Classification Integration
by Ling Jiang, Dequan Ling, Mingwei Zhao, Chun Wang, Qiuhua Liang and Kai Liu
ISPRS Int. J. Geo-Inf. 2018, 7(11), 443; https://0-doi-org.brum.beds.ac.uk/10.3390/ijgi7110443 - 14 Nov 2018
Cited by 15 | Viewed by 4928
Abstract
Terrain positions are widely used to describe the Earth’s topographic features and play an important role in the studies of landform evolution, soil erosion and hydrological modeling. This work develops a new multimodal classification system with enhanced classification performance by integrating different approaches [...] Read more.
Terrain positions are widely used to describe the Earth’s topographic features and play an important role in the studies of landform evolution, soil erosion and hydrological modeling. This work develops a new multimodal classification system with enhanced classification performance by integrating different approaches for terrain position identification. The adopted classification approaches include local terrain attribute (LA)-based and regional terrain attribute (RA)-based, rule-based and supervised, and pixel-based and object-oriented methods. Firstly, a double-level definition scheme is presented for terrain positions. Then, utilizing a hierarchical framework, a multimodal approach is developed by integrating different classification techniques. Finally, an assessment method is established to evaluate the new classification system from different aspects. The experimental results, obtained at a Loess Plateau region in northern China on a 5 m digital elevation model (DEM), show reasonably positional relationship, and larger inter-class and smaller intra-class variances. This indicates that identified terrain positions are consistent with the actual topography from both overall and local perspectives, and have relatively good integrity and rationality. This study demonstrates that the current multimodal classification system, developed by taking advantage of various classification methods, can reflect the geographic meanings and topographic features of terrain positions from different levels. Full article
Show Figures

Graphical abstract

28 pages, 27783 KiB  
Article
Complying with Privacy Legislation: From Legal Text to Implementation of Privacy-Aware Location-Based Services
by Mehrnaz Ataei, Auriol Degbelo, Christian Kray and Vitor Santos
ISPRS Int. J. Geo-Inf. 2018, 7(11), 442; https://0-doi-org.brum.beds.ac.uk/10.3390/ijgi7110442 - 13 Nov 2018
Cited by 9 | Viewed by 4146
Abstract
An individual’s location data is very sensitive geoinformation. While its disclosure is necessary, e.g., to provide location-based services (LBS), it also facilitates deep insights into the lives of LBS users as well as various attacks on these users. Location privacy threats can be [...] Read more.
An individual’s location data is very sensitive geoinformation. While its disclosure is necessary, e.g., to provide location-based services (LBS), it also facilitates deep insights into the lives of LBS users as well as various attacks on these users. Location privacy threats can be mitigated through privacy regulations such as the General Data Protection Regulation (GDPR), which was introduced recently and harmonises data privacy laws across Europe. While the GDPR is meant to protect users’ privacy, the main problem is that it does not provide explicit guidelines for designers and developers about how to build systems that comply with it. In order to bridge this gap, we systematically analysed the legal text, carried out expert interviews, and ran a nine-week-long take-home study with four developers. We particularly focused on user-facing issues, as these have received little attention compared to technical issues. Our main contributions are a list of aspects from the legal text of the GDPR that can be tackled at the user interface level and a set of guidelines on how to realise this. Our results can help service providers, designers and developers of applications dealing with location information from human users to comply with the GDPR. Full article
(This article belongs to the Special Issue Recent Trends in Location Based Services and Science)
Show Figures

Figure 1

27 pages, 22984 KiB  
Article
Change Detection in Coral Reef Environment Using High-Resolution Images: Comparison of Object-Based and Pixel-Based Paradigms
by Zhenjin Zhou, Lei Ma, Tengyu Fu, Ge Zhang, Mengru Yao and Manchun Li
ISPRS Int. J. Geo-Inf. 2018, 7(11), 441; https://0-doi-org.brum.beds.ac.uk/10.3390/ijgi7110441 - 12 Nov 2018
Cited by 24 | Viewed by 5321
Abstract
Despite increases in the spatial resolution of satellite imagery prompting interest in object-based image analysis, few studies have used object-based methods for monitoring changes in coral reefs. This study proposes a high accuracy object-based change detection (OBCD) method intended for coral reef environment, [...] Read more.
Despite increases in the spatial resolution of satellite imagery prompting interest in object-based image analysis, few studies have used object-based methods for monitoring changes in coral reefs. This study proposes a high accuracy object-based change detection (OBCD) method intended for coral reef environment, which uses QuickBird and WorldView-2 images. The proposed methodological framework includes image fusion, multi-temporal image segmentation, image differencing, random forests models, and object-area-based accuracy assessment. For validation, we applied the method to images of four coral reef study sites in the South China Sea. We compared the proposed OBCD method with a conventional pixel-based change detection (PBCD) method by implementing both methods under the same conditions. The average overall accuracy of OBCD exceeded 90%, which was approximately 20% higher than PBCD. The OBCD method was free from salt-and-pepper effects and was less prone to images misregistration in terms of change detection accuracy and mapping results. The object-area-based accuracy assessment reached a higher overall accuracy and per-class accuracy than the object-number-based and pixel-number-based accuracy assessment. Full article
(This article belongs to the Special Issue GEOBIA in a Changing World)
Show Figures

Figure 1

15 pages, 7419 KiB  
Article
Low-Power LoRa Signal-Based Outdoor Positioning Using Fingerprint Algorithm
by Wongeun Choi, Yoon-Seop Chang, Yeonuk Jung and Junkeun Song
ISPRS Int. J. Geo-Inf. 2018, 7(11), 440; https://0-doi-org.brum.beds.ac.uk/10.3390/ijgi7110440 - 09 Nov 2018
Cited by 55 | Viewed by 7356
Abstract
Positioning is an essential element in most Internet of Things (IoT) applications. Global Positioning System (GPS) chips have high cost and power consumption, making it unsuitable for long-range (LoRa) and low-power IoT devices. Alternatively, low-power wide-area (LPWA) signals can be used for simultaneous [...] Read more.
Positioning is an essential element in most Internet of Things (IoT) applications. Global Positioning System (GPS) chips have high cost and power consumption, making it unsuitable for long-range (LoRa) and low-power IoT devices. Alternatively, low-power wide-area (LPWA) signals can be used for simultaneous positioning and communication. We summarize previous studies related to LoRa signal-based positioning systems, including those addressing proximity, a path loss model, time difference of arrival (TDoA), and fingerprint positioning methods. We propose a LoRa signal-based positioning method that uses a fingerprint algorithm instead of a received signal strength indicator (RSSI) proximity or TDoA method. The main objective of this study was to evaluate the accuracy and usability of the fingerprint algorithm for large areas in the real world. We estimated the locations using probabilistic means based on three different algorithms that use interpolated fingerprint RSSI maps. The average accuracy of the three proposed algorithms in our experiments was 28.8 m. Our method also reduced the battery consumption significantly compared with that of existing GPS-based positioning methods. Full article
(This article belongs to the Special Issue Geospatial Applications of the Internet of Things (IoT))
Show Figures

Figure 1

15 pages, 8183 KiB  
Article
Automatic Parametrization of Urban Areas Using ALS Data: The Case Study of Santiago de Compostela
by Mario Soilán, Belén Riveiro, Patricia Liñares and Andrea Pérez-Rivas
ISPRS Int. J. Geo-Inf. 2018, 7(11), 439; https://0-doi-org.brum.beds.ac.uk/10.3390/ijgi7110439 - 09 Nov 2018
Cited by 5 | Viewed by 3054
Abstract
Nowadays, gathering accurate and meaningful information about the urban environment with the maximum efficiency in terms of cost and time has become more relevant for city administrations, as this information is essential if the sustainability or the resilience of the urban structure has [...] Read more.
Nowadays, gathering accurate and meaningful information about the urban environment with the maximum efficiency in terms of cost and time has become more relevant for city administrations, as this information is essential if the sustainability or the resilience of the urban structure has to be improved. This work presents a methodology for the automatic parametrization and characterization of different urban typologies, for the specific case study of Santiago de Compostela (Spain), using data from Aerial Laser Scanners (ALS). This methodology consists of a number of sequential processes of point cloud data, using exclusively their geometric coordinates. Three of the main elements of the urban structure are assessed in this work: intersections, building blocks, and streets. Different geometric and contextual metrics are automatically extracted for each of the elements, defining the urban typology of the studied area. The accuracy of the measurements is validated against a manual reference, obtaining average errors of less than 3%, proving that the input data is valid for this assessment. Full article
Show Figures

Figure 1

29 pages, 16129 KiB  
Article
Landslide Susceptibility Mapping Using Logistic Regression Analysis along the Jinsha River and Its Tributaries Close to Derong and Deqin County, Southwestern China
by Xiaohui Sun, Jianping Chen, Yiding Bao, Xudong Han, Jiewei Zhan and Wei Peng
ISPRS Int. J. Geo-Inf. 2018, 7(11), 438; https://0-doi-org.brum.beds.ac.uk/10.3390/ijgi7110438 - 08 Nov 2018
Cited by 68 | Viewed by 6765
Abstract
The objective of this study was to identify the areas that are most susceptible to landslide occurrence, and to find the key factors associated with landslides along Jinsha River and its tributaries close to Derong and Deqin County. Thirteen influencing factors, including (a) [...] Read more.
The objective of this study was to identify the areas that are most susceptible to landslide occurrence, and to find the key factors associated with landslides along Jinsha River and its tributaries close to Derong and Deqin County. Thirteen influencing factors, including (a) lithology, (b) slope angle, (c) slope aspect, (d) TWI, (e) curvature, (f) SPI, (g) STI, (h) topographic relief, (i) rainfall, (j) vegetation, (k) NDVI, (l) distance-to-river, (m) and distance-to-fault, were selected as the landslide conditioning factors in landslide susceptibility mapping. These factors were mainly obtained from the field survey, digital elevation model (DEM), and Landsat 4–5 imagery using ArcGIS software. A total of 40 landslides were identified in the study area from field survey and aerial photos’ interpretation. First, the frequency ratio (FR) method was used to clarify the relationship between the landslide occurrence and the influencing factors. Then, the principal component analysis (PCA) was used to eliminate multiple collinearities between the 13 influencing factors and to reduce the dimension of the influencing factors. Subsequently, the factors that were reselected using the PCA were introduced into the logistic regression analysis to produce the landslide susceptibility map. Finally, the receiver operating characteristic (ROC) curve was used to evaluate the accuracy of the logistic regression analysis model. The landslide susceptibility map was divided into the following five classes: very low, low, moderate, high, and very high. The results showed that the ratios of the areas of the five susceptibility classes were 23.14%, 22.49%, 18.00%, 19.08%, and 17.28%, respectively. And the prediction accuracy of the model was 83.4%. The results were also compared with the FR method (79.9%) and the AHP method (76.9%), which meant that the susceptibility model was reasonable. Finally, the key factors of the landslide occurrence were determined based on the above results. Consequently, this study could serve as an effective guide for further land use planning and for the implementation of development. Full article
(This article belongs to the Special Issue Natural Hazards and Geospatial Information)
Show Figures

Figure 1

21 pages, 2296 KiB  
Article
The Elephant in the Room: Informality in Tanzania’s Rural Waterscape
by Jesper Katomero and Yola Georgiadou
ISPRS Int. J. Geo-Inf. 2018, 7(11), 437; https://0-doi-org.brum.beds.ac.uk/10.3390/ijgi7110437 - 08 Nov 2018
Cited by 4 | Viewed by 5900
Abstract
Informality is pervasive in Tanzania’s rural waterscape, but not acknowledged by development partners (donors and beneficiaries), despite persistent warnings by development scholars. Informality is thus the proverbial elephant in the room. In this paper, we examine a case of superior rural water access [...] Read more.
Informality is pervasive in Tanzania’s rural waterscape, but not acknowledged by development partners (donors and beneficiaries), despite persistent warnings by development scholars. Informality is thus the proverbial elephant in the room. In this paper, we examine a case of superior rural water access in two geographical locales—Hai and Siha districts—in Tanzania, where actors not only acknowledge, but actively harness informality to provide access to water to rural populations. We employ concepts from organization and institutional theory to show that when informal programs and related informal sanctions/rewards complement their formal counterparts, chances for achieving the Sustainable Development Goals (SDG) target 6.1 ‘By 2030, achieve universal and equitable access to safe and affordable drinking water for all’ are significantly increased. Full article
(This article belongs to the Special Issue Geo-Information and the Sustainable Development Goals (SDGs))
Show Figures

Figure 1

19 pages, 4986 KiB  
Article
Crisis Maps—Observed Shortcomings and Recommendations for Improvement
by Ana Kuveždić Divjak and Miljenko Lapaine
ISPRS Int. J. Geo-Inf. 2018, 7(11), 436; https://0-doi-org.brum.beds.ac.uk/10.3390/ijgi7110436 - 07 Nov 2018
Cited by 10 | Viewed by 3760
Abstract
Cartographic communication through crisis maps takes place in a unique environment characterised by the immediate risks of considerable loss and stress. Many such maps are designed by practitioners with limited resources, pressured for time, and who often fail to pay the necessary attention [...] Read more.
Cartographic communication through crisis maps takes place in a unique environment characterised by the immediate risks of considerable loss and stress. Many such maps are designed by practitioners with limited resources, pressured for time, and who often fail to pay the necessary attention to map graphics. This can reduce map clarity and make orientation to and understanding of essential crisis information difficult. To identify the most frequent shortcomings that may compromise the interpretation of depicted objects, phenomena presented, and actions required, we assessed the map graphics of 106 maps specifically designed for communication and action in crises. The results showed that they were often visually overloaded. Crisis data were not conveyed by appropriate cartographic representations, and due to the inappropriate use of visual variables, the associative and selective properties of cartographic symbols were overlooked, and their ordered and quantitative features ignored. The use of colour was often not adapted to conventional visual language, and colour symbolism was not always taken into account. The cartographic symbols used were often incomprehensible, illegible, ambiguous, and unclassified, and they lacked symbolism and hierarchical organisation. The article aims to address these problems by proposing guidelines which do not require much time or expertise, but which would ensure that cartographically correct crisis maps are well designed. Objects, phenomena or actions specific to crisis management would be indicated using appropriate map graphics and their importance highlighted, so as to make interpretation easier for all participants in a crisis event, and so facilitate crisis communication and response. Full article
Show Figures

Graphical abstract

12 pages, 8017 KiB  
Article
Spatial Distribution Estimates of the Urban Population Using DSM and DEM Data in China
by Junlin Zhang, Wei Xu, Lianjie Qin and Yugang Tian
ISPRS Int. J. Geo-Inf. 2018, 7(11), 435; https://0-doi-org.brum.beds.ac.uk/10.3390/ijgi7110435 - 07 Nov 2018
Cited by 9 | Viewed by 3645
Abstract
Spatial distribution and population density are important parameters in studies on urban development, resource allocation, emergency management, and risk analysis. High-resolution height data can be used to estimate the total or spatial pattern of the urban population for small study areas, e.g., the [...] Read more.
Spatial distribution and population density are important parameters in studies on urban development, resource allocation, emergency management, and risk analysis. High-resolution height data can be used to estimate the total or spatial pattern of the urban population for small study areas, e.g., the downtown area of a city or a community. However, there has been no case of population estimation for large areas. This paper tries to estimate the urban population of prefectural cities in China using building height data. Building height in urban population settlement (Mdiffs) was first extracted using the digital surface model (DSM), digital elevation model (DEM), and land use data. Then, the relationships between the census-based urban population density (CPD) and the Mdiffs density (MDD) for different regions were regressed. Using these results, the urban population for prefectural cities of China was finally estimated. The results showed that a good linear correlation was found between Mdiffs and the census data in each type of region, as all the adjusted R2 values were above 0.9 and all the models passed the significance test (95% confidence level). The ratio of the estimated population to the census population (PER) was between 0.7 and 1.3 for 76% of the cities in China. This is the first attempt to estimate the urban population using building height data for prefectural cities in China. This method produced reasonable results and can be effectively used for spatial distribution estimates of the urban population in large scale areas. Full article
Show Figures

Graphical abstract

18 pages, 2458 KiB  
Article
An Automatic Recognition and Positioning Method for Point Source Targets on Satellite Images
by Kai Li, Yongsheng Zhang, Zhenchao Zhang and Ying Yu
ISPRS Int. J. Geo-Inf. 2018, 7(11), 434; https://0-doi-org.brum.beds.ac.uk/10.3390/ijgi7110434 - 07 Nov 2018
Cited by 2 | Viewed by 2642
Abstract
Currently, the geometric and radiometric calibration of on-board satellite sensors utilizes different ground targets using some form of manual intervention. Point source targets provide high precision geometric and radiometric information and have the potential to become a new tool for joint geometric and [...] Read more.
Currently, the geometric and radiometric calibration of on-board satellite sensors utilizes different ground targets using some form of manual intervention. Point source targets provide high precision geometric and radiometric information and have the potential to become a new tool for joint geometric and radiometric calibration. In this paper, an automatic recognition and positioning method for point source target images is proposed. First, the template matching method was used to effectively reduce nonpoint source target image pixels in the satellite imagery. The point source target images were then identified using particular feature parameters. Using the template matching method, the weighted centroid method, and the Gaussian fitting method, the positions of the centroid of the point source target images were calculated. The maximum position detection error obtained using the three methods was 0.07 pixels, which is comparably better than artificial targets currently in use. The experimental results show point source targets provide high precision geometric information, which can become a suitable alternative for automatic joint geometric and radiometric calibration of spaceborne optical sensors. Full article
Show Figures

Figure 1

35 pages, 6541 KiB  
Article
Impaired Water Hazard Zones: Mapping Intersecting Environmental Health Vulnerabilities and Polluter Disproportionality
by Raoul S. Liévanos
ISPRS Int. J. Geo-Inf. 2018, 7(11), 433; https://0-doi-org.brum.beds.ac.uk/10.3390/ijgi7110433 - 06 Nov 2018
Cited by 8 | Viewed by 6217
Abstract
This study advanced a rigorous spatial analysis of surface water-related environmental health vulnerabilities in the California Bay-Delta region, USA, from 2000 to 2006. It constructed a novel hazard indicator—“impaired water hazard zones’’—from regulatory estimates of extensive non-point-source (NPS) and point-source surface water pollution, [...] Read more.
This study advanced a rigorous spatial analysis of surface water-related environmental health vulnerabilities in the California Bay-Delta region, USA, from 2000 to 2006. It constructed a novel hazard indicator—“impaired water hazard zones’’—from regulatory estimates of extensive non-point-source (NPS) and point-source surface water pollution, per section 303(d) of the U.S. Clean Water Act. Bivariate and global logistic regression (GLR) analyses examined how established predictors of surface water health-hazard exposure vulnerability explain census block groups’ proximity to impaired water hazard zones in the Bay-Delta. GLR results indicate the spatial concentration of Black disadvantage, isolated Latinx disadvantage, low median housing values, proximate industrial water pollution levels, and proximity to the Chevron oil refinery—a disproportionate, “super emitter”, in the Bay-Delta—significantly predicted block group proximity to impaired water hazard zones. A geographically weighted logistic regression (GWLR) specification improved model fit and uncovered spatial heterogeneity in the predictors of block group proximity to impaired water hazard zones. The modal GWLR results in Oakland, California, show how major polluters beyond the Chevron refinery impair the local environment, and how isolated Latinx disadvantage was the lone positively significant population vulnerability factor. The article concludes with a discussion of its scholarly and practical implications. Full article
(This article belongs to the Special Issue Geoprocessing in Public and Environmental Health)
Show Figures

Figure 1

26 pages, 12449 KiB  
Article
Winter Is Coming: A Socio-Environmental Monitoring and Spatiotemporal Modelling Approach for Better Understanding a Respiratory Disease
by Lukas Marek, Malcolm Campbell, Michael Epton, Simon Kingham and Malina Storer
ISPRS Int. J. Geo-Inf. 2018, 7(11), 432; https://0-doi-org.brum.beds.ac.uk/10.3390/ijgi7110432 - 06 Nov 2018
Cited by 5 | Viewed by 3990
Abstract
Chronic Obstructive Pulmonary Disease is a progressive lung disease affecting the respiratory function of every sixth New Zealander and over 300 million people worldwide. In this paper, we explored how the combination of social, demographical and environmental conditions (represented by increased winter air [...] Read more.
Chronic Obstructive Pulmonary Disease is a progressive lung disease affecting the respiratory function of every sixth New Zealander and over 300 million people worldwide. In this paper, we explored how the combination of social, demographical and environmental conditions (represented by increased winter air pollution) affected hospital admissions due to COPD in an urban area of Christchurch (NZ). We juxtaposed the hospitalisation data with dynamic air pollution data and census data to investigate the spatiotemporal patterns of hospital admissions. Spatial analysis identified high-risk health hot spots both overall and season specific, exhibiting higher rates in winter months not solely due to air pollution, but rather as a result of its combination with other factors that initiate deterioration of breathing, increasing impairments and lead to the hospitalisation of COPD patients. From this we found that socioeconomic deprivation and air pollution, followed by the age and ethnicity structure contribute the most to the increased winter hospital admissions. This research shows the continued importance of including both individual (composition) and area level (composition) factors when examining and analysing disease patterns. Full article
(This article belongs to the Special Issue Geoprocessing in Public and Environmental Health)
Show Figures

Figure 1

21 pages, 8188 KiB  
Article
Intact Planar Abstraction of Buildings via Global Normal Refinement from Noisy Oblique Photogrammetric Point Clouds
by Qing Zhu, Feng Wang, Han Hu, Yulin Ding, Jiali Xie, Weixi Wang and Ruofei Zhong
ISPRS Int. J. Geo-Inf. 2018, 7(11), 431; https://0-doi-org.brum.beds.ac.uk/10.3390/ijgi7110431 - 06 Nov 2018
Cited by 5 | Viewed by 3136
Abstract
Oblique photogrammetric point clouds are currently one of the major data sources for the three-dimensional level-of-detail reconstruction of buildings. However, they are severely noise-laden and pose serious problems for the effective and automatic surface extraction of buildings. In addition, conventional methods generally use [...] Read more.
Oblique photogrammetric point clouds are currently one of the major data sources for the three-dimensional level-of-detail reconstruction of buildings. However, they are severely noise-laden and pose serious problems for the effective and automatic surface extraction of buildings. In addition, conventional methods generally use normal vectors estimated in a local neighborhood, which are liable to be affected by noise, leading to inferior results in successive building reconstruction. In this paper, we propose an intact planar abstraction method for buildings, which explicitly handles noise by integrating information in a larger context through global optimization. The information propagates hierarchically from a local to global scale through the following steps: first, based on voxel cloud connectivity segmentation, single points are clustered into supervoxels that are enforced to not cross the surface boundary; second, each supervoxel is expanded to nearby supervoxels through the maximal support region, which strictly enforces planarity; third, the relationships established by the maximal support regions are injected into a global optimization, which reorients the local normal vectors to be more consistent in a larger context; finally, the intact planar surfaces are obtained by region growing using robust normal and point connectivity in the established spatial relations. Experiments on the photogrammetric point clouds obtained from oblique images showed that the proposed method is effective in reducing the influence of noise and retrieving almost all of the major planar structures of the examined buildings. Full article
Show Figures

Figure 1

13 pages, 9800 KiB  
Article
Use of a Multilayer Perceptron to Automate Terrain Assessment for the Needs of the Armed Forces
by Krzysztof Pokonieczny
ISPRS Int. J. Geo-Inf. 2018, 7(11), 430; https://0-doi-org.brum.beds.ac.uk/10.3390/ijgi7110430 - 06 Nov 2018
Cited by 8 | Viewed by 3960
Abstract
The classification of terrain in terms of passability plays a significant role in the process of military terrain assessment. It involves classifying selected terrain to specific classes (GO, SLOW-GO, NO-GO). In this article, the problem of terrain classification to the respective category of [...] Read more.
The classification of terrain in terms of passability plays a significant role in the process of military terrain assessment. It involves classifying selected terrain to specific classes (GO, SLOW-GO, NO-GO). In this article, the problem of terrain classification to the respective category of passability was solved by applying artificial neural networks (multilayer perceptron) to generate a continuous Index of Passability (IOP). The neural networks defined this factor for primary fields in two sizes (1000 × 1000 m and 100 × 100 m) based on the land cover elements obtained from Vector Smart Map (VMap) Level 2 and Shuttle Radar Topography Mission (SRTM). The work used a feedforward neural network consisting of three layers. The paper presents a comprehensive analysis of the reliability of the neural network parameters, taking into account the number of neurons, learning algorithm, activation functions and input data configuration. The studies and tests carried out have shown that a well-trained neural network can automate the process of terrain classification in terms of passability conditions. Full article
Show Figures

Figure 1

19 pages, 3115 KiB  
Article
Importance of Remotely-Sensed Vegetation Variables for Predicting the Spatial Distribution of African Citrus Triozid (Trioza erytreae) in Kenya
by Kyalo Richard, Elfatih M. Abdel-Rahman, Samira A. Mohamed, Sunday Ekesi, Christian Borgemeister and Tobias Landmann
ISPRS Int. J. Geo-Inf. 2018, 7(11), 429; https://0-doi-org.brum.beds.ac.uk/10.3390/ijgi7110429 - 03 Nov 2018
Cited by 25 | Viewed by 4967
Abstract
Citrus is considered one of the most important fruit crops globally due to its contribution to food and nutritional security. However, the production of citrus has recently been in decline due to many biological, environmental, and socio-economic constraints. Amongst the biological ones, pests [...] Read more.
Citrus is considered one of the most important fruit crops globally due to its contribution to food and nutritional security. However, the production of citrus has recently been in decline due to many biological, environmental, and socio-economic constraints. Amongst the biological ones, pests and diseases play a major role in threatening citrus quantity and quality. The most damaging disease in Kenya, is the African citrus greening disease (ACGD) or Huanglongbing (HLB) which is transmitted by the African citrus triozid (ACT), Trioza erytreae. HLB in Kenya is reported to have had the greatest impact on citrus production in the highlands, causing yield losses of 25% to 100%. This study aimed at predicting the occurrence of ACT using an ecological habitat suitability modeling approach. Specifically, we tested the contribution of vegetation phenological variables derived from remotely-sensed (RS) data combined with bio-climatic and topographical variables (BCL) to accurately predict the distribution of ACT in citrus-growing areas in Kenya. A MaxEnt (maximum entropy) suitability modeling approach was used on ACT presence-only data. Forty-seven (47) ACT observations were collected while 23 BCL and 12 RS covariates were used as predictor variables in the MaxEnt modeling. The BCL variables were extracted from the WorldClim data set, while the RS variables were predicted from vegetation phenological time-series data (spanning the years 2014–2016) and annually-summed land surface temperature (LST) metrics (2014–2016). We developed two MaxEnt models; one including both the BCL and the RS variables (BCL-RS) and another with only the BCL variables. Further, we tested the relationship between ACT habitat suitability and the surrounding land use/land cover (LULC) proportions using a random forest regression model. The results showed that the combined BCL-RS model predicted the distribution and habitat suitability for ACT better than the BCL-only model. The overall accuracy for the BCL-RS model result was 92% (true skills statistic: TSS = 0.83), whereas the BCL-only model had an accuracy of 85% (TSS = 0.57). Also, the results revealed that the proportion of shrub cover surrounding citrus orchards positively influenced the suitability probability of the ACT. These results provide a resourceful tool for precise, timely, and site-specific implementation of ACGD control strategies. Full article
Show Figures

Figure 1

28 pages, 15767 KiB  
Review
The Scope of Earth-Observation to Improve the Consistency of the SDG Slum Indicator
by Monika Kuffer, Jiong Wang, Michael Nagenborg, Karin Pfeffer, Divyani Kohli, Richard Sliuzas and Claudio Persello
ISPRS Int. J. Geo-Inf. 2018, 7(11), 428; https://0-doi-org.brum.beds.ac.uk/10.3390/ijgi7110428 - 01 Nov 2018
Cited by 57 | Viewed by 9030
Abstract
The continuous increase in deprived living conditions in many cities of the Global South contradicts efforts to make cities inclusive, safe, resilient, and sustainable places. Using examples of Asian, African, and Latin American cities, this study shows the scope and limits of earth [...] Read more.
The continuous increase in deprived living conditions in many cities of the Global South contradicts efforts to make cities inclusive, safe, resilient, and sustainable places. Using examples of Asian, African, and Latin American cities, this study shows the scope and limits of earth observation (EO)-based mapping of deprived living conditions in support of providing consistent global information for the SDG indicator 11.1.1 “proportion of urban population living in slums, informal settlements or inadequate housing”. At the technical level, we compare several EO-based methods and imagery for mapping deprived living conditions, discussing their ability to map such areas including differences in terms of accuracy and performance at the city scale. At the operational level, we compare available municipal maps showing identified deprived areas with the spatial extent of morphological mapped areas of deprived living conditions (using EO) at the city scale, discussing the reasons for inconsistencies between municipal and EO-based maps. We provide an outlook on how EO-based mapping of deprived living conditions could contribute to a global spatial information base to support targeting of deprived living conditions in support of the SDG Goal 11.1.1 indicator, when uncertainties and ethical considerations on data provision are well addressed. Full article
(This article belongs to the Special Issue Geo-Information and the Sustainable Development Goals (SDGs))
Show Figures

Graphical abstract

15 pages, 3106 KiB  
Article
Effect of Size, Shape and Map Background in Cartographic Visualization: Experimental Study on Czech and Chinese Populations
by Zdeněk Stachoň, Čeněk Šašinka, Jiří Čeněk, Stephan Angsüsser, Petr Kubíček, Zbyněk Štěrba and Martina Bilíková
ISPRS Int. J. Geo-Inf. 2018, 7(11), 427; https://0-doi-org.brum.beds.ac.uk/10.3390/ijgi7110427 - 01 Nov 2018
Cited by 16 | Viewed by 4848
Abstract
This paper deals with the issue of the perceptual aspects of selected graphic variables (specifically shape and size) and map background in cartographic visualization. The continued experimental study is based on previous findings and the presupposed cross-cultural universality of shape and size as [...] Read more.
This paper deals with the issue of the perceptual aspects of selected graphic variables (specifically shape and size) and map background in cartographic visualization. The continued experimental study is based on previous findings and the presupposed cross-cultural universality of shape and size as a graphic variable. The results bring a new perspective on the usage of shape, size and presence/absence of background as graphic variables, as well as a comparison to previous studies. The results suggest that all examined variables influence the speed of processing. Respondents (Czech and Chinese, N = 69) identified target stimuli faster without a map background, with larger stimuli, and with triangular and circular shapes. Czech respondents were universally faster than Chinese respondents. The implications of our research were discussed, and further directions were outlined. Full article
Show Figures

Figure 1

19 pages, 26247 KiB  
Article
Application of Open-Source Software in Community Heritage Resources Management
by Jihn-Fa Jan
ISPRS Int. J. Geo-Inf. 2018, 7(11), 426; https://0-doi-org.brum.beds.ac.uk/10.3390/ijgi7110426 - 31 Oct 2018
Cited by 4 | Viewed by 5912
Abstract
In this paper, we present a case study of community heritage resources investigation and management, which was a collaborative project conducted by researchers and participants from rural communities. Geotagged photos were obtained using smart phones, and 360-degree panoramas were acquired using a robotic [...] Read more.
In this paper, we present a case study of community heritage resources investigation and management, which was a collaborative project conducted by researchers and participants from rural communities. Geotagged photos were obtained using smart phones, and 360-degree panoramas were acquired using a robotic camera system. These images were then uploaded to a web-based GIS (WebGIS) developed using Arches-Heritage Inventory Package (HIP), an open-source geospatial software system for cultural heritage inventory and management. By providing various tools for resources annotation, data exploration, mapping, geovisualization, and spatial analysis, the WebGIS not only serves as a platform for heritage resources database management, but also empowers the community residents to acquire, share, interpret, and analyze the data. The results show that this type of collaborative working model between researcher and community can promote public awareness of the importance of heritage conservation and achieve the research goal more effectively and efficiently. Full article
(This article belongs to the Special Issue Data Acquisition and Processing in Cultural Heritage)
Show Figures

Graphical abstract

15 pages, 5922 KiB  
Article
Street Centralities and Land Use Intensities Based on Points of Interest (POI) in Shenzhen, China
by Shuai Wang, Gang Xu and Qingsheng Guo
ISPRS Int. J. Geo-Inf. 2018, 7(11), 425; https://0-doi-org.brum.beds.ac.uk/10.3390/ijgi7110425 - 31 Oct 2018
Cited by 26 | Viewed by 6085
Abstract
Urban land use and transportation are closely associated. Previous studies have investigated the spatial interrelationship between street centralities and land use intensities using land cover data, thus neglecting the social functions of urban land. Taking the city of Shenzhen, China, as a case [...] Read more.
Urban land use and transportation are closely associated. Previous studies have investigated the spatial interrelationship between street centralities and land use intensities using land cover data, thus neglecting the social functions of urban land. Taking the city of Shenzhen, China, as a case study, we used reclassified points of interest (POI) data to represent commercial, public service, and residential land, and then investigated the varying interrelationships between the street centralities and different types of urban land use intensities. We calculated three global centralities (“closeness”, “betweenness”, and “straightness”) as well as local centralities (1-km, 2-km, 3-km, and 5-km searching radiuses), which were transformed into raster frameworks using kernel density estimation (KDE) for correlation analysis. Global closeness and straightness are high in the urban core area, and roads with high global betweenness outline the skeleton of the street network. The spatial patterns of the local centralities are distinguished from the global centralities, reflecting local location advantages. High intensities of commercial and public service land are concentrated in the urban core, while residential land is relatively scattered. The bivariate correlation analysis implies that commercial and public service land are more dependent on centralities than residential land. Closeness and straightness have stronger abilities in measuring the location advantages than betweenness. The centralities and intensities are more positively correlated on a larger scale (census block). These findings of the spatial patterns and interrelationships of the centralities and intensities have major implications for urban land use and transportation planning. Full article
Show Figures

Figure 1

26 pages, 15439 KiB  
Article
Assessment of Segmentation Parameters for Object-Based Land Cover Classification Using Color-Infrared Imagery
by Ozgun Akcay, Emin Ozgur Avsar, Melis Inalpulat, Levent Genc and Ahmet Cam
ISPRS Int. J. Geo-Inf. 2018, 7(11), 424; https://0-doi-org.brum.beds.ac.uk/10.3390/ijgi7110424 - 31 Oct 2018
Cited by 12 | Viewed by 4857
Abstract
Using object-based image analysis (OBIA) techniques for land use-land cover classification (LULC) has become an area of interest due to the availability of high-resolution data and segmentation methods. Multi-resolution segmentation in particular, statistically seen as the most used algorithm, is able to produce [...] Read more.
Using object-based image analysis (OBIA) techniques for land use-land cover classification (LULC) has become an area of interest due to the availability of high-resolution data and segmentation methods. Multi-resolution segmentation in particular, statistically seen as the most used algorithm, is able to produce non-identical segmentations depending on the required parameters. The total effect of segmentation parameters on the classification accuracy of high-resolution imagery is still an open question, though some studies were implemented to define the optimum segmentation parameters. However, recent studies have not properly considered the parameters and their consequences on LULC accuracy. The main objective of this study is to assess OBIA segmentation and classification accuracy according to the segmentation parameters using different overlap ratios during image object sampling for a predetermined scale. With this aim, we analyzed and compared (a) high-resolution color-infrared aerial images of a newly-developed urban area including different land use types; (b) combinations of multi-resolution segmentation with different shape, color, compactness, bands, and band-weights; and (c) accuracies of classifications based on varied segmentations. The results of various parameters in the study showed an explicit correlation between segmentation accuracies and classification accuracies. The effect of changes in segmentation parameters using different sample selection methods for five main LULC types was studied. Specifically, moderate shape and compactness values provided more consistency than lower and higher values; also, band weighting demonstrated substantial results due to the chosen bands. Differences in the variable importance of the classifications and changes in LULC maps were also explained. Full article
Show Figures

Graphical abstract

18 pages, 6298 KiB  
Article
A Task-Oriented Knowledge Base for Geospatial Problem-Solving
by Can Zhuang, Zhong Xie, Kai Ma, Mingqiang Guo and Liang Wu
ISPRS Int. J. Geo-Inf. 2018, 7(11), 423; https://0-doi-org.brum.beds.ac.uk/10.3390/ijgi7110423 - 31 Oct 2018
Cited by 6 | Viewed by 4531
Abstract
In recent years, the rapid development of cloud computing and web technologies has led to a significant advancement to chain geospatial information services (GI services) in order to solve complex geospatial problems. However, the construction of a problem-solving workflow requires considerable expertise for [...] Read more.
In recent years, the rapid development of cloud computing and web technologies has led to a significant advancement to chain geospatial information services (GI services) in order to solve complex geospatial problems. However, the construction of a problem-solving workflow requires considerable expertise for end-users. Currently, few studies design a knowledge base to capture and share geospatial problem-solving knowledge. This paper abstracts a geospatial problem as a task that can be further decomposed into multiple subtasks. The task distinguishes three distinct granularities: Geooperator, Atomic Task, and Composite Task. A task model is presented to define the outline of problem solution at a conceptual level that closely reflects the processes for problem-solving. A task-oriented knowledge base that leverages an ontology-based approach is built to capture and share task knowledge. This knowledge base provides the potential for reusing task knowledge when faced with a similar problem. Conclusively, the details of implementation are described through using a meteorological early-warning analysis as an example. Full article
(This article belongs to the Special Issue Big Data Computing for Geospatial Applications)
Show Figures

Figure 1

Previous Issue
Next Issue
Back to TopTop