Article

Effect of Size, Shape and Map Background in Cartographic Visualization: Experimental Study on Czech and Chinese Populations

1
Department of Geography, Faculty of Science, Masaryk University, 61137 Brno, Czech Republic
2
Division of Information and Library Studies and HUME Lab, Faculty of Arts, Masaryk University, 60200 Brno, Czech Republic
3
Department of Social Studies, Faculty of Regional Development and International Studies, Mendel University in Brno, 61300 Brno, Czech Republic
4
Department of Geographic Information Science and Cartography, School of Resource and Environmental Science, Wuhan University, Wuhan 430079, China
*
Author to whom correspondence should be addressed.
ISPRS Int. J. Geo-Inf. 2018, 7(11), 427; https://0-doi-org.brum.beds.ac.uk/10.3390/ijgi7110427
Submission received: 19 September 2018 / Revised: 22 October 2018 / Accepted: 27 October 2018 / Published: 1 November 2018

Abstract

:
This paper deals with the issue of the perceptual aspects of selected graphic variables (specifically shape and size) and map background in cartographic visualization. The continued experimental study is based on previous findings and the presupposed cross-cultural universality of shape and size as a graphic variable. The results bring a new perspective on the usage of shape, size and presence/absence of background as graphic variables, as well as a comparison to previous studies. The results suggest that all examined variables influence the speed of processing. Respondents (Czech and Chinese, N = 69) identified target stimuli faster without a map background, with larger stimuli, and with triangular and circular shapes. Czech respondents were universally faster than Chinese respondents. The implications of our research were discussed, and further directions were outlined.

1. Introduction

Research on methods of cartographic visualization has a long tradition and implications for many fields of human activity, including crisis and disaster visualizations [1,2]. The issue of graphic variables defined by Jacques Bertin [3] is mentioned in many scientific cartographic publications. Most of the works on graphic variables focus on Bertin’s work and try to expand on his conclusions, which are considered generally valid in cartography. Many scientific works focus on this theory [4,5,6,7,8,9,10,11,12,13], and some papers try to extend the usage of the principles defined [14,15,16,17], but only a small part of published research focuses on verifying his theories (see further). For example, in his presentation at the International Cartographic Conference in 2017, Alan MacEachren mentioned that Bertin’s work is “…often uncritically accepted” and highlighted the few uses of multivariate data/graphics [18]. Another example is the work by Christophe and Hoarau [19], where the influence of aesthetics is emphasized, whereas aesthetics in cartographic visualization is missing from Bertin’s concept.
Bertin [3] postulated that map elements are a specific graphics system: a set of six basic variables mapping each character, of which variable characteristics are dedicated more to the graphic system, describing their features, characters and relationships. Bertin defined the basic variables as follows (see also Figure 1):
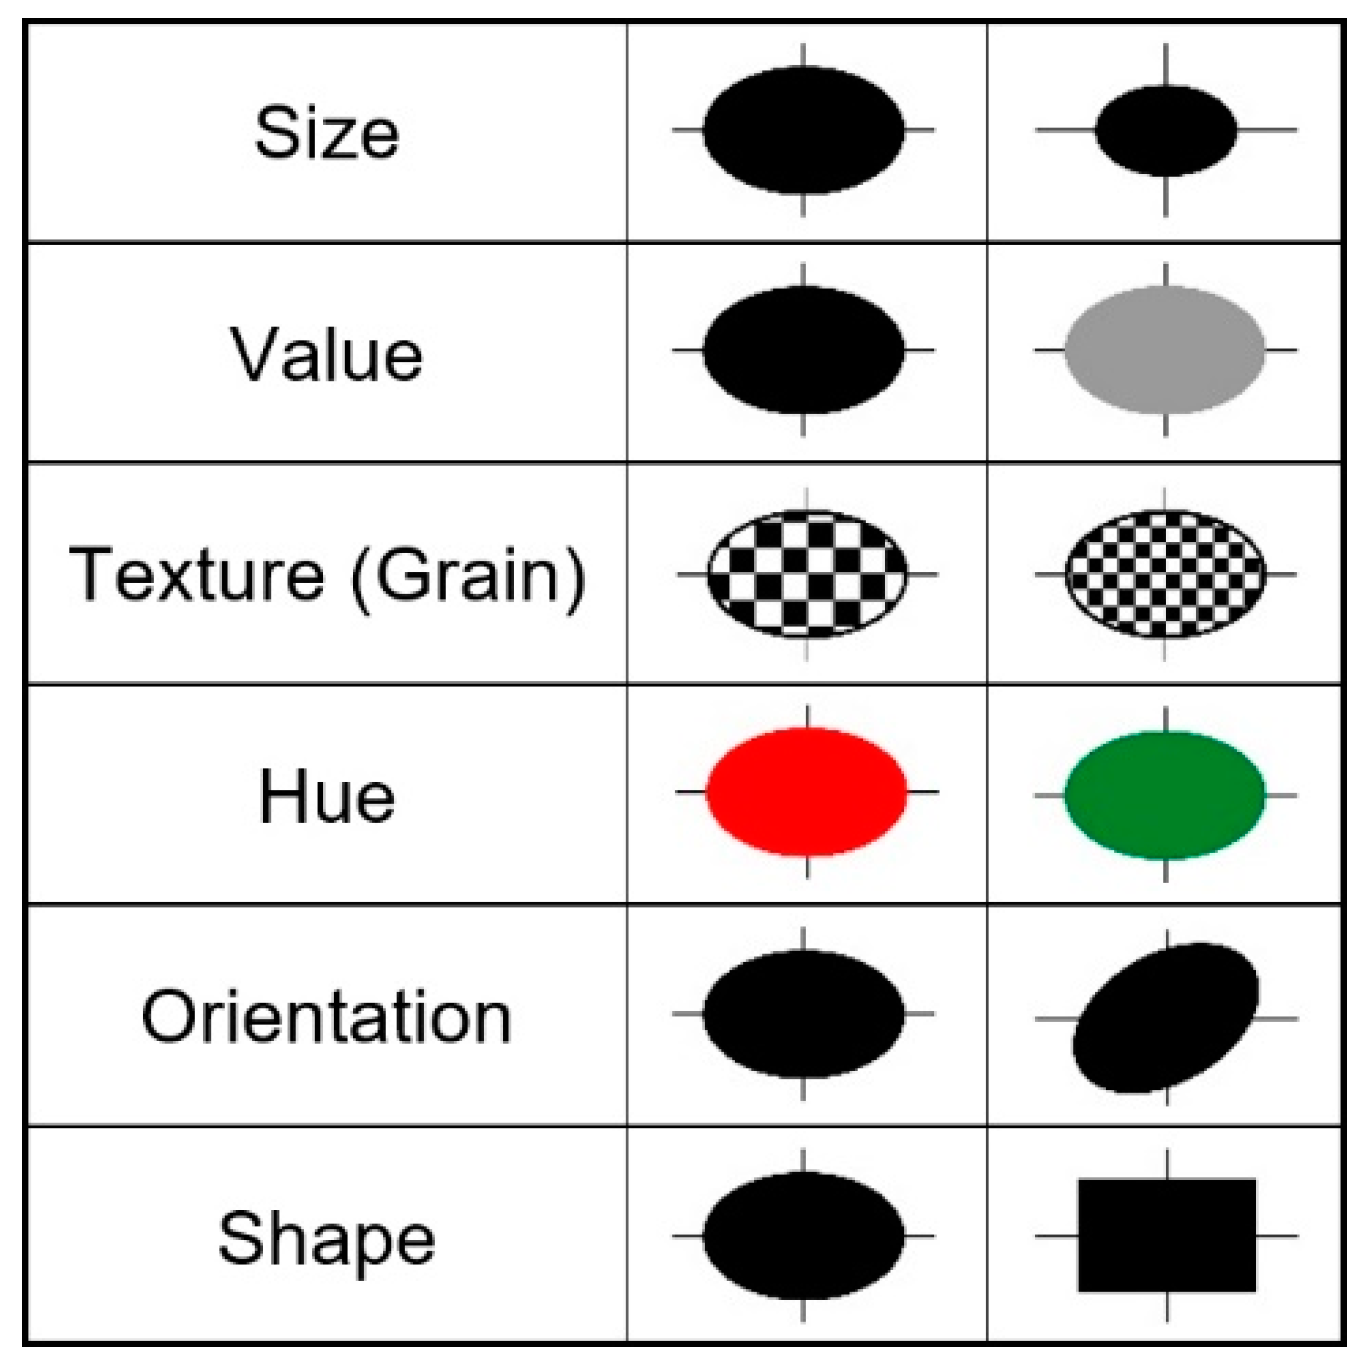
  • Size (taille): variation in the area size covered by a sign at a constant shape
  • Value (valeur): variation in the ratio of the total amount of black and white in the perceived color of a given area
  • Texture (grain): variation in the amount of discernable uniform marks per unit area at a constant value (there should be no variation in value, which is often ignored in the literature about Bertin’s variables)
  • Hue (couleur): wavelength variation within the visible part of the electromagnetic spectrum between two areas at a constant value
  • Orientation (orientation): angular difference between several arrays of parallel signs
  • Shape (forme): variation in the outline character (form) of a sign at a constant size
These variables can be used to express quantitative and qualitative characteristics while also representing an aesthetic function. Bertin assigned five basic characteristics to the six basic variables: association, qualitative difference, selection, arrangement, and proportionality. Features and variables make up a total of 63 combinations available for map symbol creation. For a detailed description of graphic variables, see [10,21,22]. MacEachren [18] also mentioned that the main challenge currently is to focus on pre-cognitive perception rather than the further stages of cognitive processing.
Based on the above-mentioned theoretical issues, we researched using methodological approaches inspired by psychology and focused on verifying the perceptual aspects of selected graphic variables (specifically shape and size) in cartography and the cross-cultural universality of selected graphic variables.

2. Perception

A psychophysics movement in psychology was inspired by methods of natural sciences and concerned with the relationship between physical stimuli and the perception they produce was established. It introduced, among others, the key concept of sensory threshold as respectively differential and absolute sensitivity [23]. Later, at the start of twentieth century, the perceptual organization was first studied by a Gestalt psychologist, who investigated the principles of how elementary sensation is grouped into more complex structures and how figure-ground segregation proceeds [24].
Gestalt laws are also applied in cartographic visualization [8,25]. The basic assumptions and principles of the Gestalt school are still accepted in the scientific community [26], although the influence of top-down processes was later incorporated into this theoretical approach, which formally stressed only a bottom-up direction [27]. The work of Ulric Neisser [28] led to a cognitive turn in psychology. He highlighted the role of attention and anticipation in perception and stressed the importance of past experience. Based on this, it can be assumed that different individual experiences including socio-cultural context may cause differences in visual perception. Visual perception is determined by neurophysiological aspects (e.g., “the oblique effect” describes the decrease in performance when users deal with oblique shapes compared to cardinally (vertical and horizontal) oriented figures [29,30]), as well as by environmental (cultural) factors shaping the human experience.
It may be possible to use the findings from psychological research as guidelines for cartographers during map creation. However, in our opinion, several limitations do not allow for the direct application of findings from psychological studies. Psychological experiments do not fit the criteria of representative research design and an ecological approach [31,32]. Stimulus material in psychological experiments is usually very simplified to ensure the high internal validity of conducted studies and is also abstract without meaning. By contrast, maps are complex visual representations that always communicate meanings. Both factors lead to a lack of external validity in the results and limit their use in the field of cognitive cartography.

3. Research on Graphic Variables in Cartography

As previously mentioned, much research on graphic variables has been done in the field of cognitive cartography. A detailed description is provided, for example, by Montello [33].
Some of the foremost research focusing on the practical verification of graphic variables was done by Czech cartographer, Antonín Koláčný, in the 1960s on school atlases [34]. A crucial part of the extensive, empirical research dealt with differential thresholds, which are the smallest variation in the height of various shapes of map features sufficient to be noticeable. Table 1 shows the final summary of recommended differential thresholds for each specific shape [34]. Figure 2 shows the minimum size of certain shapes at a reading distance of 40 cm. Figure 3 displays the influence of the quantity of signs on the map on the user speed.
In their 2011 article titled “The influence of Jacques Bertin”, Deeb et al. [35] examined the applicability of Bertin’s variables for the purposes of labelling. In this particular study, testing was performed on two types of map users (laymen and professionals), who expressed certain preferences. In the conclusion, additional research is recommended on user groups matched by other criteria, such as age, culture, education or gender.
Although Bertin’s theory is well known and widely used in the field of cartography and geoinformatics, a certain amount of research tacitly rejects his entire theory of visual variables. Garlandini and Fabrikant [36] mentioned that Bertin unfortunately did not use any citation of published researches from the field of psychology that could possibly support the designed system. Reimer claims, in his 2011 article titled “Squaring the Circle? Bivariate Color Maps and Jacques Bertin’s Concept of ‘Disassociation’” [37], that Bertin’s concept of associativity and disassociativity of relevant visual variables is mostly ignored or misinterpreted, especially in the English-speaking world. Anglo-American tradition follows an evolutionary path that is heavily influenced by computer technology and the representation of color in a color space, while continental European tradition is influenced more by heuristics, which uses cartographic best practices. The differences mentioned brought us to the additional focus on the influence of different cultural backgrounds on the perception of certain graphic variables.

4. Cross-Cultural Research and Cartography

Cross-cultural research is still a neglected area in cartography. As Rundstrom [38] described, it started in the 1970s and 1980s [17,39,40,41] and since then, has mainly dealt with historical and indigenous cartographies. Cultural aspects are only occasionally the focus of studies concerning mainstream contemporary mapping procedures and their products. Cross-cultural aspects are taken into consideration even more rarely. As a consequence, we often need to rely on the results obtained from related fields, such as cross-cultural user interface design or more general subjects such as cross-cultural psychology, to get a better understanding of how cultures might influence maps and mapping.
Not surprisingly, it is difficult to find any cross-cultural research on the application of graphic variables in maps. In a comparative study on Swiss and Chinese regional planning maps [42], the use of extended variables, such as transparency, color gradient or shading (in both countries), is mentioned but not further discussed. In a recent study by Stachoň et al. [43], Czech and Chinese students had to identify differently shaped figural symbols in a map reading task. Main differences between the two used symbol sets were the degree of schematization and the presence or absence of a figure background with outline. Results showed that the Czech participants identified symbols from both sets faster than the Chinese participants, but this difference was only significant for the less schematized (more iconic) symbols without backgrounds/outlines. As such, an identification task is more analytic in nature, and this result could be interpreted as a consequence of the more analytic cognitive style of Czech participants. However, the also conducted framed-line test resulted in a different picture. There, the Czech students performed significantly worse than the Chinese students in the absolute task, which indicates a more holistic cognitive style of Czech participants. Such contradictory results show the need for further research.
One starting point for our study was the comparison of point symbol sizes used in printed German and Chinese city maps (published from 2000 to 2009) with recommended minimum size dimensions [44]. In this study, striking average size differences were documented. Based on the longest side measurement, more than 90% of the German point symbols were larger than the recommended minimum size dimensions, while this held true only for a third of the Chinese point symbols. This raised the question whether minimum size recommendations are universally valid and what the reason for this result could be. Among the potential answers discussed in that paper, the most interesting answers are briefly summarized below.
One factor considered was the influence of Chinese script. It consists of several thousand symbols with varying complexities. Consequently, Chinese students must invest a lot of time in learning the written form of their language. However, this effort also brings some additional benefits. Referring to several studies [45,46,47,48,49,50], Choong and Salvendy concluded that “Chinese tend to have superior visual form discrimination abilities.” [51] (p. 420). However, this does not automatically lead to an increased ability to discriminate very small signs or shape details. In other words, it is not clear whether Chinese possess a culturally induced increased visual acuity as a consequence of their script learning efforts (a kind of “trained eyesight”).
Another study discussed here [52] determined the minimum legible sizes of Chinese characters with different complexities and the readability of strings four characters long. Its results document a higher influence from character string familiarity than from legibility according to the minimum legible sizes found. This is supported by a recent study [53] that discovered evidence for a “holistic neural representation of Chinese characters” (p. 32), which is also in line with the characterization of cognitive styles, analytic and holistic thinking [54] (p. 293). Even if parts of a symbol are illegible, the character can still be read based on its overall impression. As a consequence, it seems less likely that increased visual acuity evolves from learning the Chinese script, and yet a certain training effect on eyesight cannot be ruled out.
This view is supported by two other cultural dimensions (sometimes called cultural variables): communication orientation and uncertainty avoidance. The first, described by Nisbett [55] (pp. 60–61), differentiates between a Western transmitter and an Asian receiver orientation. In transmitter-oriented cultures, it is the transmitter who is mainly responsible for a successful communication, i.e., a message is understood as intended, while in receiver-oriented cultures, the responsible person is the receiver. A transmitter orientation is more likely adopted by cultures that usually try to avoid uncertainty and therefore will not accept symbols that are very small, and hard to identify. Cultures scoring high on Hofstede’s “uncertainty avoidance” [56] (p. 336) dimension usually tend to “shun ambiguous situations” [57] (p. 197). As expected, countries like Germany (score: 65; all scores are from [57] (pp. 192–194, Table 6.1)) and the Czech Republic (score: 74) score considerably higher than China (score: 30). We can therefore argue that while it is important for Germans or Czechs to discriminate all parts of a symbol without undue difficulty, it is enough for Chinese to identify a symbol as a whole, i.e., being able to match it with its counterpart in the key. Acceptable minimum symbol dimensions would then be considerably lower for Chinese than for Germans or Czechs.
Besides small size and readability issues, another difference might exist between Chinese and European point symbols regarding preferences for basic geometric shapes. Angsüsser [20] found more frequent use of circles and squares and near absence of triangles as point symbols in Chinese city maps compared to German city maps. On the other hand, diamonds were sometimes found in the Chinese sample while being absent in the German sample. As this shape has an important significance in China’s everyday life (e.g., as an ornament or background for Chinese characters), we can assume that the three main geometric shapes in China are circles, squares, and diamonds, whereas in Germany and the so-called Western world, the circle, square, and triangle dominate.

5. Materials and Methods

5.1. Experiment

The general objective of the study was to observe the differences in how map symbols of various shapes and sizes were perceived and the influence of different map backgrounds and cultural backgrounds. The experiments were based on the theories [3,8] and experiments [34] described in the first section. From the previous research, we hypothesized:
At the general level:
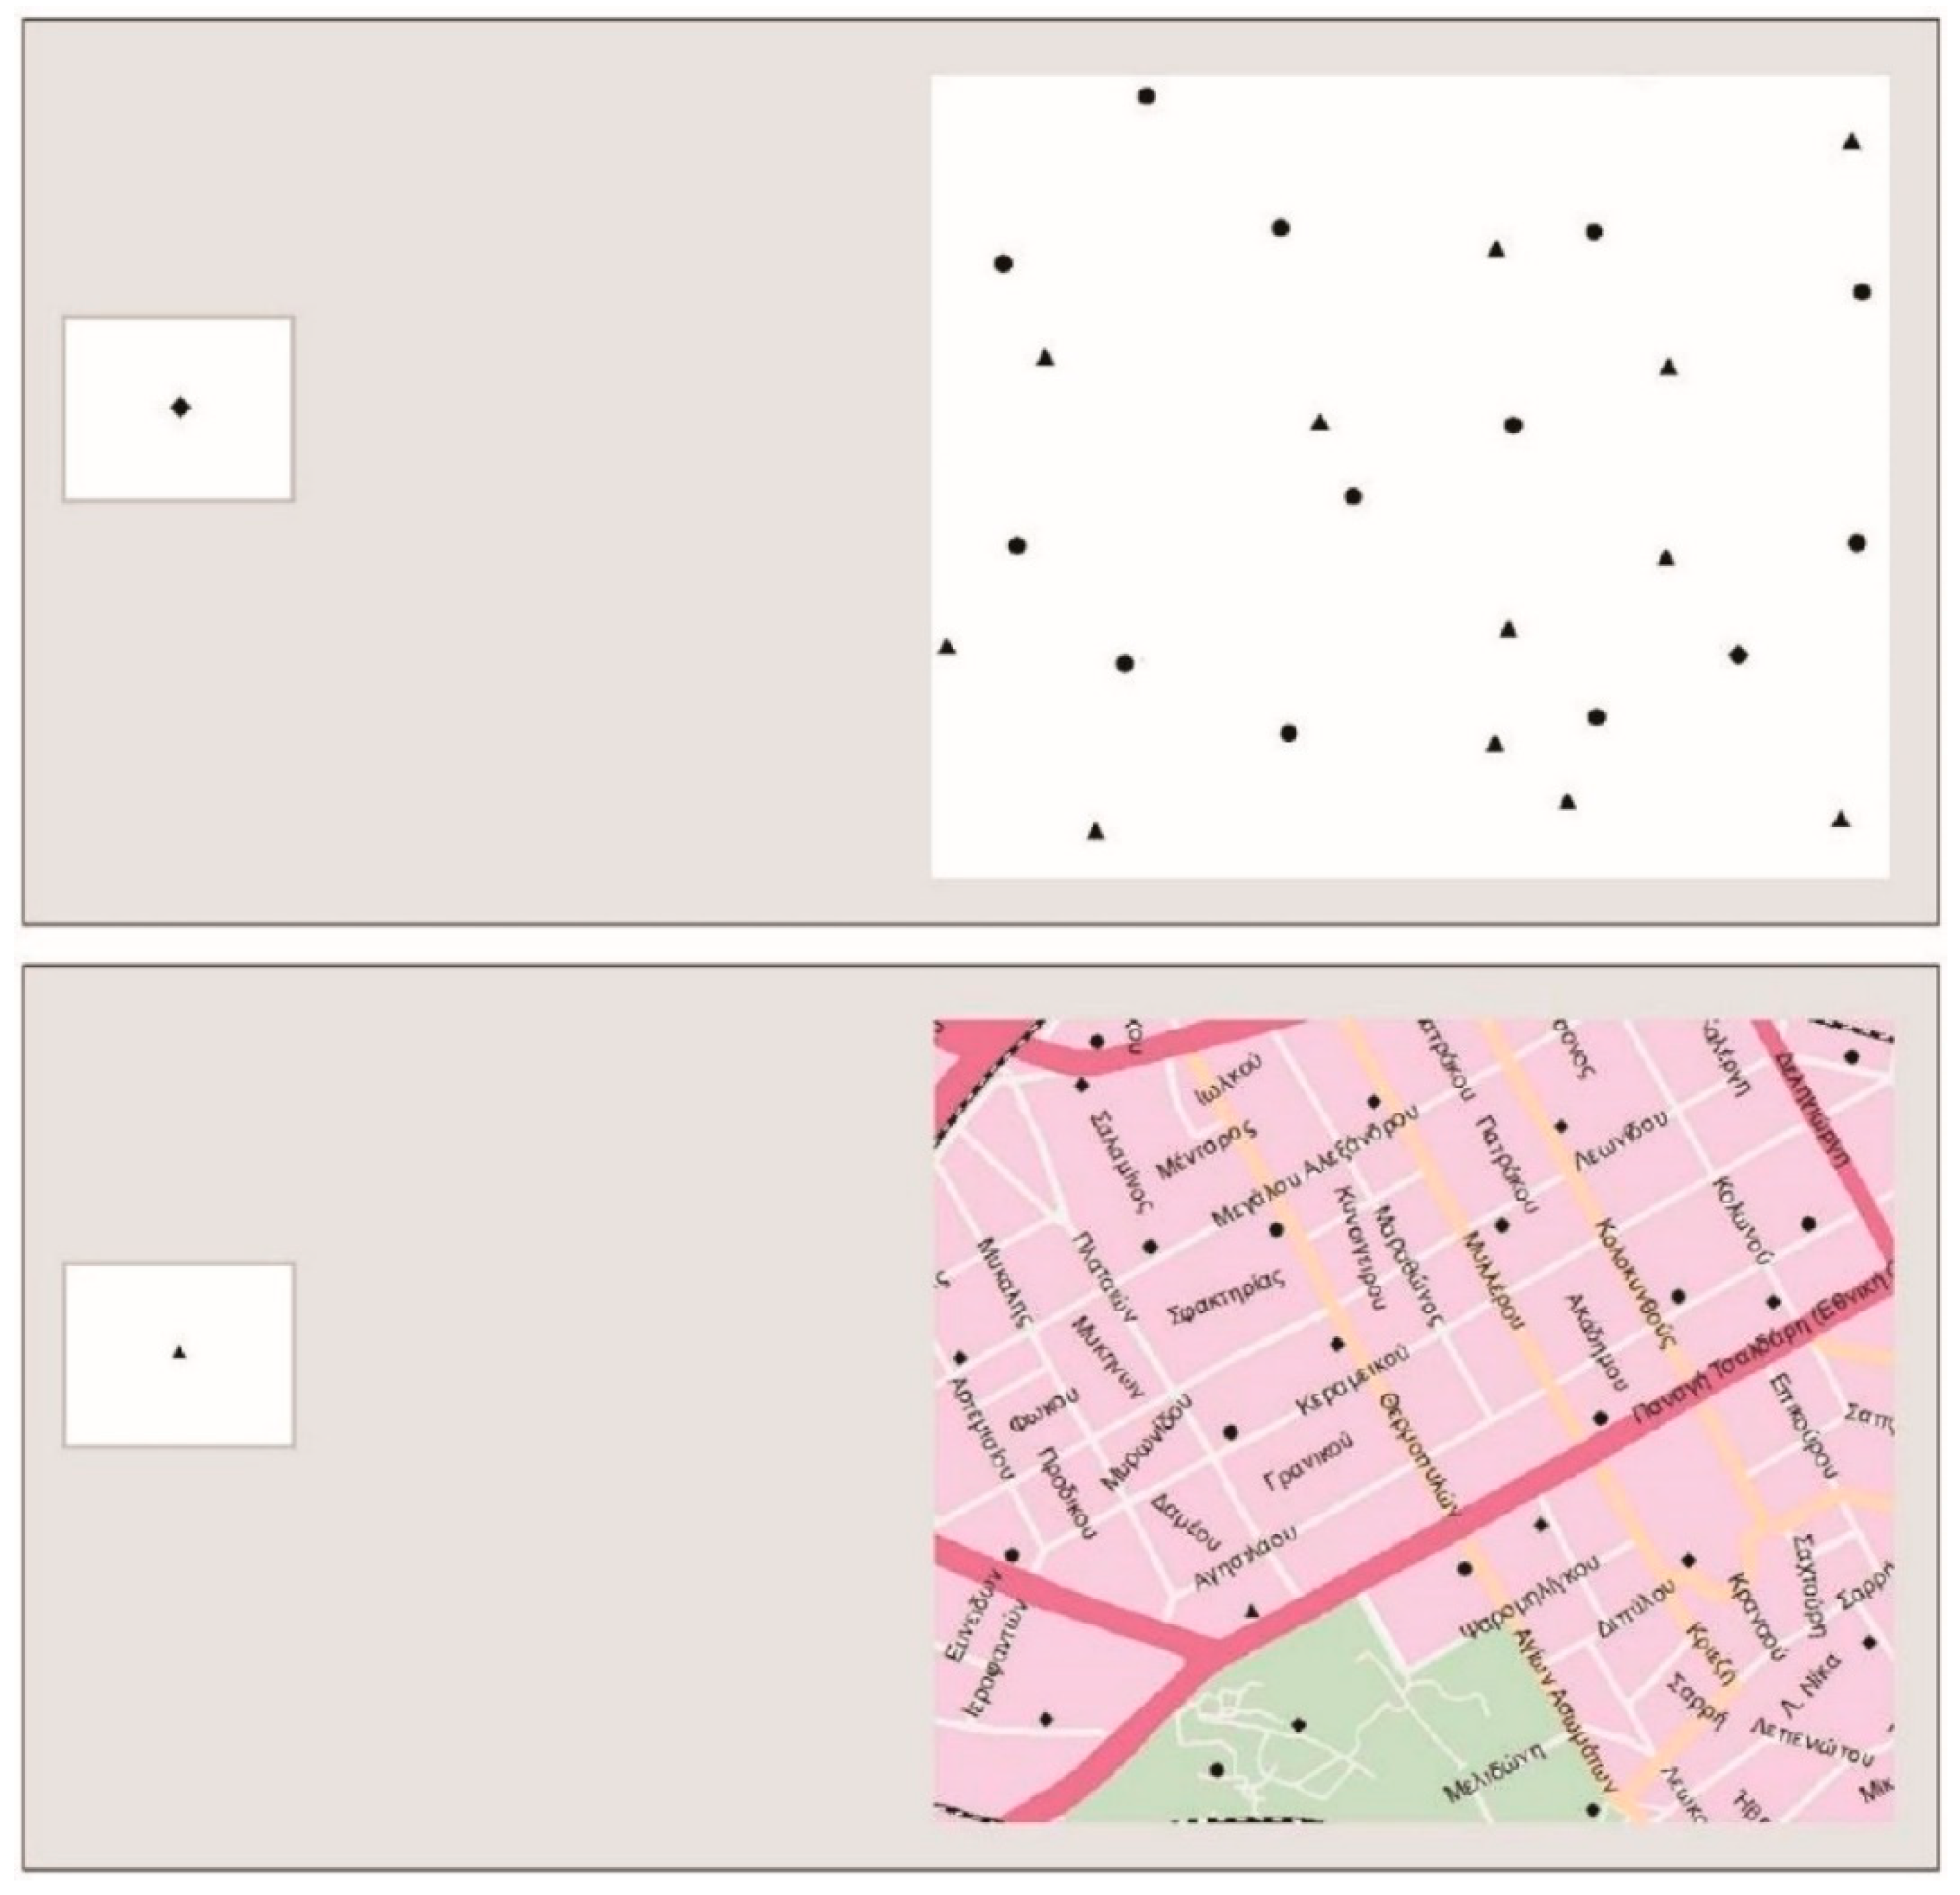
  • Greater complexity of the map background significantly decreases the speed of processing map stimuli during the search task.
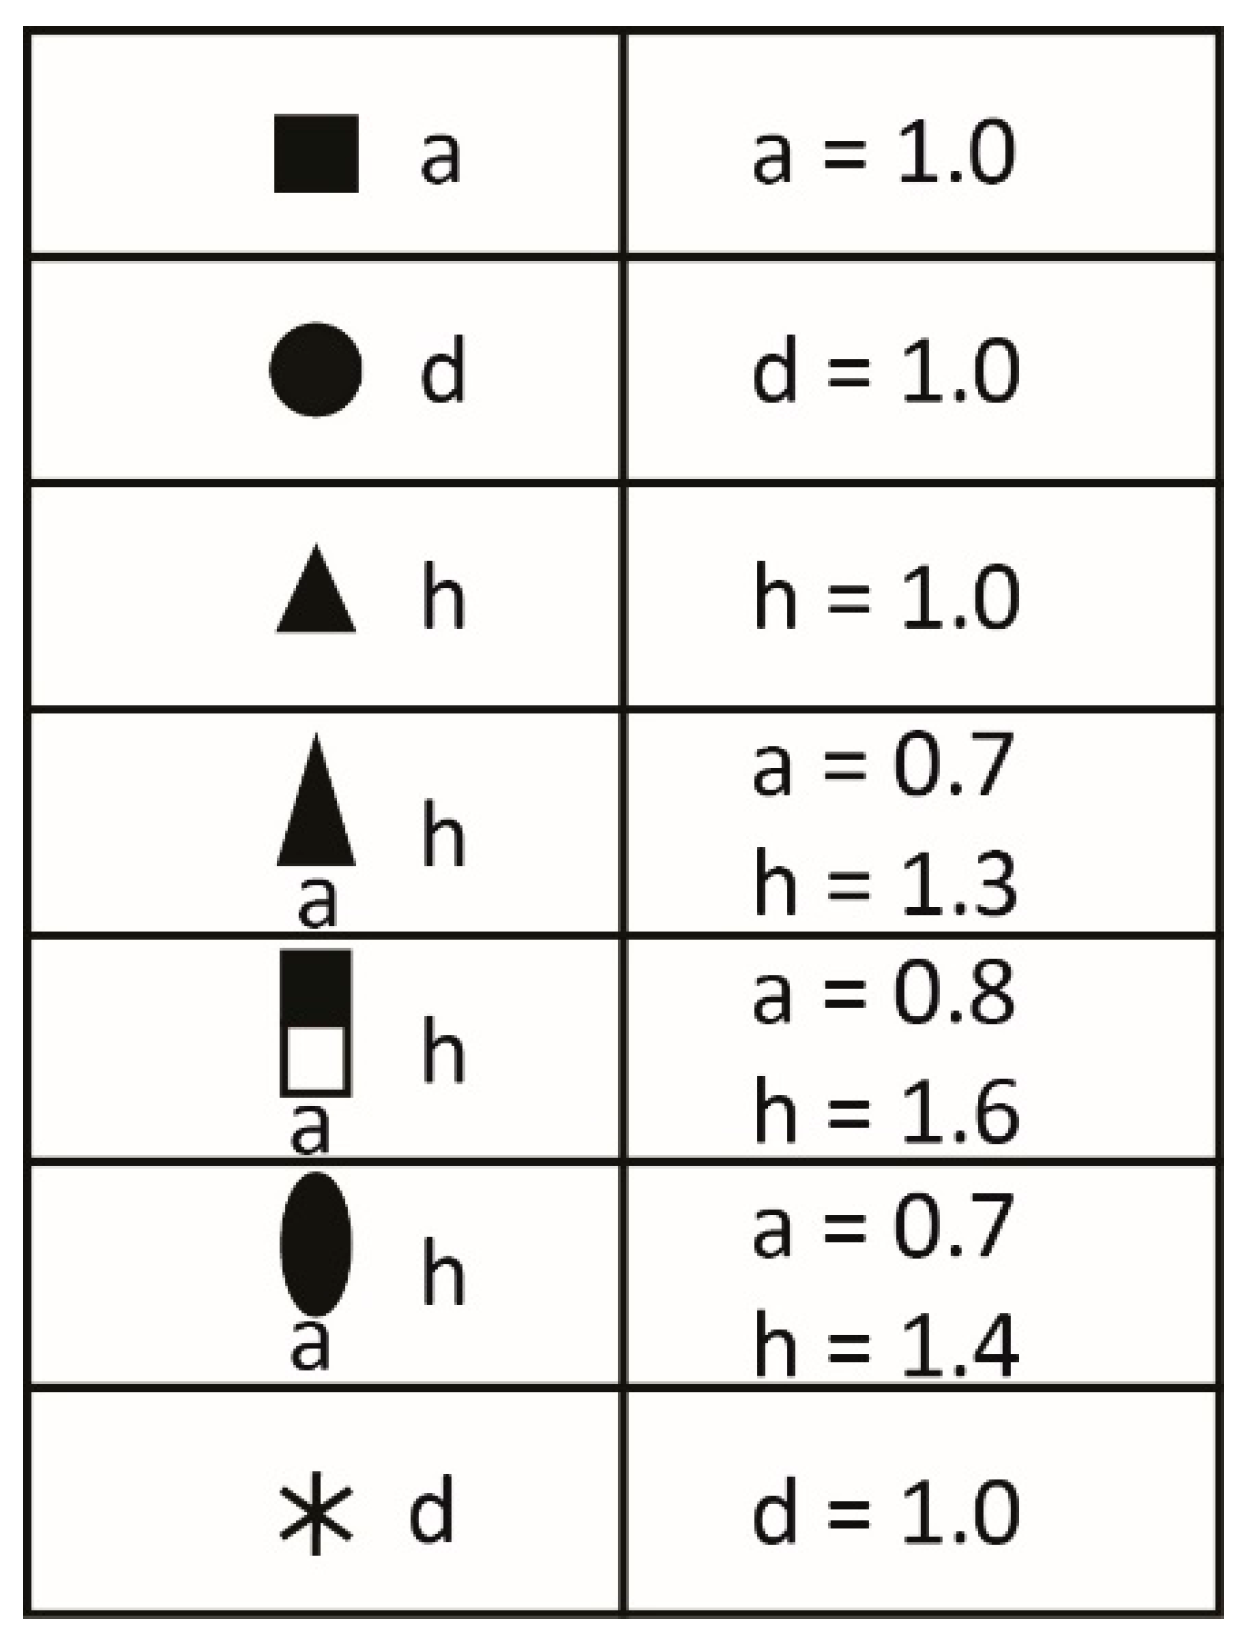
  • Increasing size significantly increases the speed of processing map stimuli during the search task.
  • The shape of the point symbol does not significantly influence the speed of processing map stimuli during the search task.
At the cultural level:
  • Chinese are faster than Czechs in search tasks performed with small map stimuli.

5.2. Stimuli

The test consisted of two parts, each using a different type of visual stimuli. Both types of stimuli differed in the presence or absence of a background map. While the stimuli in the first part of the test were free of any background map and contained only point map symbols, the visual stimuli in the second part also contained a background map (Figure 4 as an example).
The point symbols used, which were identical for each of the presented tasks, were simple geometric symbols in black color: a circle, a triangle, and a diamond (square rotated by 45 degrees). The use of three different shapes should have provided enough elementary shape diversity, generally typical for a cartographic visualization, which may have also helped increase the ecological validity of the experiment. Each task contained 25 point symbols that were randomly placed in the map field, one symbol being the attractor and the other 24 symbols being distractors, i.e., symbols with a shape different from the attractor (12+12 symbols of both remaining shapes). Eight sizes were used for each symbol, each differing in size by 1 pixel (from 6 pixels to 13 pixels). The absolute dimensions calculated from the pixel size of used 22 inch monitors varied from 1.68 mm to 3.64 mm. The first three categories (6, 7, and 8 pixels) close to the limits defined by Koláčný (Figure 2) were considered as small, two middle categories (9, and 10 pixels) as medium size and the last three categories (11, 12, and 13 pixels) as large. The sizes of the symbols were designed to accommodate 24 tasks and combined both parts of the test. Tasks in the first part did not include any background. Tasks in the second part of the test included a background map covering a randomly chosen area with different proportions of built-up and un-built areas. For the 24 tasks with map backgrounds, 24 different map sections were used, identical for both cultural groups. For these purposes, we used OpenStreetMap data (of a Greek city) that were visualized to be distinct from the most commonly used web map portals of either cultural group (i.e., Google maps and Mapy.cz for the Czech group; Baidu maps for the Chinese group).

5.3. Participants

To analyze the speed of detection of selected graphic variables in a cartographic visualization, we gathered data from two groups (Czech and Chinese) of participants (69 participants in total) in our study. The first group, located in Brno in the Czech Republic, consisted of 33 participants (57.5% males). All the participants were Czech citizens and cartography and GIScience students at Masaryk University (2nd and 3rd year of bachelor’s degree) in the Czech Republic. The second group consisted of 36 participants (41.6% males). Participants of the second group were Chinese students of GIS (3rd year of bachelor’s degree) from the University of Wuhan in China. The mean age of all participants was 21.3 years (SD = 1.2 years). The mean age of the Czech group was 21.6 years (SD = 1.4 years) and the mean age of the Chinese participants was 21 years (SD = 0.80 year). Based on the information given by the participants, they all had normal or corrected-to-normal vision. All participants took part in the experiment voluntarily and were told that the better half of each group would be rewarded with a small gift (which was identical for both groups).
The minimum sample size was calculated using G*Power 3 [58] for repeated measure ANOVA with within–between interactions (medium effect size f = 0.25, p = 0.80, α = 0.05, number of groups = 2, number of measurements = 3, and estimated correlation between measurements = 0.3). The required total sample size was estimated to the minimum of 38 participants. From this perspective, the number of tested participants was sufficient to provide the adequate test power.

5.4. Procedure

The test started with a short questionnaire requesting basic personal information (age, sex, nationality, education, etc.). The two parts of the map reading test were then presented to respondents. Both parts consisted of 24 stimuli. Altogether, the test presented 48 stimuli (Figure 5).
Each respondent conducted the entire test via the interactive web-based application Hypothesis, which was designed to aid in creating and administering effective visual perception and cognitive tests. For more information about the application, see Šašinka et al. [59] and Popelka et al. [60]. Both Czech and Chinese participants conducted the test using this application. We attempted to create the same ambient conditions for testing, such as similar lighting conditions and the same number of participants tested at one time (usually 15 participants). Nevertheless, we could not absolutely exclude other factors that may have influenced the results. The most challenging task was to provide the same stability for the internet connection at both locations. This was the reason for excluding several Chinese participants from further analysis. Additionally, several participants in China did not complete the test and were therefore removed from further analysis.

6. Results

Data analysis was performed using IBM SPSS Statistics 22 statistical software. Prior to data analysis, an outlier analysis was performed on the reaction times for each of the 48 items. Based on outlying reaction times (values below Q1-1.5 IQR or above Q3+1.5 IQR), 169 data points were deleted from the data matrix. The number of deleted values in each item varied between 0 and 10; the mean number of deleted values per item was 3.5.
As mentioned above, the size of the point symbols in the test items varied (eight size levels). We calculated the average time required to identify the items that contained the three smallest and the three largest point symbols. The items that contained the two medium-sized point symbols were eliminated from further analysis. We analyzed the mean reaction times for each type of stimuli (background—no background, and map background; size of point symbol—large, and small; shape of point symbol—circle, triangle, and diamond). We also calculated the overall mean reaction time for each participant and performed a stepwise linear regression with backward elimination, including gender and nationality as explanatory variables and overall mean reaction time as a dependent variable. We did not include age in the model because of its low variance. Gender was not a significant predictor of overall reaction time. A significant regression equation (F(1, 67) = 18.59, p < 0.001, R2 = 0.35) was found for nationality as a predictor of point symbol detection speed. Descriptions for stimuli with and without map backgrounds, combined point symbol size and shape, and shape are in Figure 6 and Figure 7 and Table 2 respectively.
The results show that reaction times were generally higher for items with a topographic background (M = 4.24 s, SD = 0.79 s) compared to items with no background (M = 3.95 s, SD = 0.79 s). The results were consistent across the subsamples. Czech participants were faster in both conditions (Czechs: no background, M = 3.44 s, SD = 0.60 s; with a topographic background M = 3.84 s, SD = 0.59 s; Chinese: no background, M = 4.41 s, SD = 0.66 s; with a topographic background, M = 4.61 s, SD = 0.79 s; see Figure 6).
Reaction times were generally higher for items with small point symbols (M = 4.74 s) compared to items with large point symbols (M = 3.83 s). The results were consistent across subsamples. Czech participants were faster in both conditions.
Diamonds had the highest mean detection times (M = 5.35 s) in the entire sample. The mean detection time for circles (M = 3.64 s) was slightly higher than for triangles (M = 3.30 s). The patterns of detection speed for diamonds, circles, and triangles were consistent across nationalities.
To test the above-mentioned hypotheses, we subjected the mean reaction times to a series of repeated measurements ANOVA, with nationality as a between-subjects factor (nationality—Czech vs. Chinese) and one within-subjects factor (background—no background vs. topographic background; symbol size—small vs. large; symbol shape—circle vs. diamonds or vs. triangles, etc.). Because of the number of groups (2), post hoc tests were not performed.
As predicted, we found that respondents detected symbols on a blank background (M = 3.95 s) significantly faster than symbols on a topographic background (M = 4.24 s), F(1,67) = 20.86, p < 0.001, ηp2 = 0.24. We also found a significant between-subject effect in the Czech respondents, who were faster than the Chinese, F(1,67) = 34.93, p < 0.001, ηp2 = 0.34. The effect of interaction between the background type and nationality was not significant.
Furthermore, we found an expected significant relationship between the speed of detection of small and large point symbols. Large point symbols (M = 3.83 s) were detected universally faster than small point symbols (M = 4.74 s), F(1,67) = 130.24, p < 0.001, ηp2 = 0.66. Again, Czech respondents detected the symbols faster than the Chinese, F(1,67) = 38.10, p < 0.001, ηp2 = 0.36. The effect of interaction between symbol size and nationality was not significant.
Finally, we tested for the potential effects of symbol shape on the detection speed. The detection of triangles was significantly faster in both background conditions (M = 3.30 s), followed by circles (M = 3.64 s), and then diamonds (M = 5.35 s), F(1.5,100.8) = 300.1, p < 0.001, ηp2 = 0.82 (Greenhouse-Geisser correction was applied due to the violations of sphericity). Czech respondents were significantly faster in detecting all point symbol shapes, F(1,67) = 34.93, p < 0.001, ηp2 = 0.34. The effect of interaction between symbol shape and nationality was not significant.

7. Discussion and Conclusions

The results of the study show significant differences in the speed of perception of the investigated graphic variables (size and shape) of basic geometric figures presented with and without map backgrounds. Consistent with the first hypothesis (see Section 5.1), we found that the effect of a topographic background on user performance significantly increased the time spent on the task. This finding corresponds to the findings of Koláčný [34] in that reading speed significantly decreases with increasing graphic density of the map (Figure 3).
In terms of point symbol size (second hypothesis), we concluded that increasing symbol size brings a positive effect on lessening the time required to complete a task. Significant differences were observed between the small (6–8 pixels) and large point symbols (11–13 pixels). As the small symbols were close in size to the smallest possible symbol sizes identified by Koláčný [34], we concluded that smaller sizes have only limited usability for application in cartographic visualization.
Furthermore, based on the results, we claimed that certain shapes (third hypothesis) do not provide the same degree of comprehension, and therefore the shape itself affects the way how it is perceived. This conclusion sheds new light on the results published in Koláčný [34], Garlandini and Fabrikant [36] and others. This effect is demonstrated by statistically significant differences between circles/triangles and diamonds. The significantly poorer results with diamonds may have possibly been caused by the oblique effect mentioned by [29,30]. This finding is applicable in several ways. For example, when maps are used in time-critical situations like human and natural disasters, certain symbol shapes should be omitted or used only for the less important parts of the map content. A brief, worldwide analysis of map legends used for emergency management was conducted earlier by Dymon [61] and recently by Leitner [62]. Seven out of the nine analyzed map legends for emergency management purposes used diamonds for important map content (e.g., incidents, hazards, and units). According to our results, this might slow down the process of decision-making.
Another issue requiring discussion is the consistent differences in the speed of detecting target point symbols between the Czech and Chinese participants. The fact that Czech participants were universally faster in all conditions (our hypothesis was disproved) could be explained in several ways, such as the presence of a method bias [63], differences in motivation, different instructions (with regard to the task-solving speed), differential familiarity with this type of task, sample bias, or the presence of an interviewer effect.
Alternatively, it could be explained by genuine differences in the performance or perceptual style (e.g., attention to the field or field dependence; [54]). In this case, we would expect at least the presence of the main effect in no background vs. with background conditions according to the holistic vs. analytic attention paradigms. To be able to unequivocally interpret the differences in performance of both groups as the existence of genuine differences in the cognitive style during point symbol detection, more than two cultural groups would have to be compared in future research, with more variable research samples used, and more individual (e.g., perceived social class) and group level (such as affluence or religion) variables gathered and included in the statistical model.
The weaker performance of the Chinese participants sheds new light on the discussion about the very small point symbols often used in Chinese city maps [44] (see Section 4). Our results do not support the “trained eyesight” thesis assuming an increased visual acuity of Chinese people. More likely, cultural factors like the discussed communication orientation and uncertainty avoidance, among others, might play an important role. However, this research is still in an early stage and many potential influencing factors have not yet been tested.
We are aware that there are several limitations of this study. At first, even if the number of the participants is sufficient (see Section 5.3), there is still the issue of the specific user groups used for the study. As most of the participants were relatively young university students, it is debatable if the results are valid universally or only for a particular user group. Secondly, the majority of the participants have a background in geography or related fields which might also have influenced the results.
The presented study follows the research line focused on the cross-cultural differences in map perception. This paper ties up with the recently published study by Stachoň et al. [43] in some respects. We have also conducted an identification task on Czech/Chinese populations, but focused on different characteristics of point symbols, i.e., three geometric shapes varied by size instead of several pictorial symbols varied by degree of schematization. Despite these differences, the Czech participants were faster than the Chinese participants in both studies. A possible reason for these results might be differences in cognitive styles of the two tested groups. However, the framed-line test conducted by Stachoň et al. [43] did not support this hypothesis. In the research presented here, no test assessing cognitive style was included. Although the participating student groups were somewhat similar (age, education, etc.), we do not have valid information about our groups’ cognitive styles. If we assume the same cognitive style prevalence found in [43], i.e., Czechs are more holistic than Chinese, this again would contradict our assumption that such identification tasks are completed faster by participants with a more analytic cognitive style. However, the presence of a topographic background would slow down holistic thinkers more, and indeed the Czech participants showed a stronger, although not significant, decrease in the detection speed than the Chinese participants (but Czechs were still faster than Chinese; see Figure 6). These contradictory results again show the need for a deeper scientific investigation, not only focusing on the cross-cultural differences but also on the role of cognitive styles in such tasks.
The obtained results support and extend the previous findings and also bring new directions for future research. Interesting topics are, for example, the comparison of more complex shapes routinely used in cartographic symbolization or the perception of cartographic information by people with different ages, education or profession levels. We are also planning an extension of the experimental sample to include worldwide participants for a better understanding of the identified differences.

Author Contributions

Conceptualization: S.A. and Z.Š.; methodology: S.A., Z.S. and Č.Š.; software: Z.S. and Č.Š; validation: Z.S.; formal analysis: J.Č. and Z.S.; investigation: S.A., Z.S. and Č.Š.; resources: S.A. and Z.S.; data curation: J.Č., Z.S. and Č.Š.; writing of the original draft preparation: S.A., J.Č., Z.S. and Č.Š.; writing of review and editing: S.A., J.Č., P.K., Z.S. and Č.Š.; visualization: Z.Š. and M.B.; supervision: S.A. and Z.S.; project administration: S.A. and Z.S.; funding acquisition: S.A., Z.S., Č.Š. and P.K.

Funding

This research was funded by Masaryk University, Czech Republic, Grant No. MUNI/M/0846/2015, “Influence of cartographic visualization methods on the success of solving practical and educational spatial tasks”, by the grant of the Ministry of Education, Youth and Sports of the Czech Republic, Grant No. LTACH-17002, “Dynamic mapping methods oriented to risk and disaster management in the era of big data” and by the State Key Laboratory for Information Engineering in Surveying, Mapping and Remote Sensing, Wuhan University, China, Project No. 904090405, “Special Research Fund”. The APC was funded by Masaryk University, Brno, Czech Republic and Wuhan University, Wuhan, PR China.

Acknowledgments

The authors would like to thank the following collaborators: Teng Fei (technical coordinator, technical implementation), Xu Wang-Angsüsser (translations, test evaluation), Yi Lu (test evaluation, test preparation and supervision), Guang Hu (technical implementation), and at the Laboratory Center (responsible for the computer lab): Qinming Zhan (head), Xiuqin Lyu, Yongqiong Liu. The authors would also like to thank all students who participated in this study.

Conflicts of Interest

The authors declare no conflicts of interest.

References

  1. Bandrova, T.; Konečný, M.; Zlatanova, S. Disaster management in practice—Concerning 5th ICC&GIS flood and evacuation of 92 participants. In Proceedings of the 6th International Conference on Cartography & GIS, Albena, Bulgaria, 13–17 June 2016; Bandrova, T., Konečný, M., Eds.; Bulgarian Cartographic Association: Sofia, Bulgaria, 2016; Volume 2, pp. 770–780. Available online: http://iccgis2016.cartography-gis.com/iccgis2016/wp-content/uploads/2016/08/ICCGIS2016_PROCEEDINGS-HQ.pdf (accessed on 7 September 2018).
  2. Black, J.; Arrowsmith, C.; Black, M.; Cartwright, W. Comparison of Techniques for Visualising Fire Behaviour. Trans. GIS 2007, 11, 621–635. [Google Scholar] [CrossRef]
  3. Bertin, J. Graphische Semiologie: Diagramme, Netze, Karten; Translated from the 2nd French Edition (1973); Walter de Gruyter: Berlin, Germany, 1974; ISBN 3-11-003660-6. [Google Scholar]
  4. Caivano, J.L. Visual texture as a semiotic system. Semiotica 1990, 80, 239–252. [Google Scholar] [CrossRef]
  5. Carpendale, M.S.T. Considering Visual Variables as a Basis for Information Visualization, Research Report 2001-693-16; University of Calgary: Calgary, AB, Canada, 2003; Available online: http://innovis.cpsc.ucalgary.ca/innovis/uploads/Publications/Publications/Carpendale-VisualVariablesInformationVisualization.2003.pdf (accessed on 9 September 2018).
  6. Halík, Ł. The analysis of visual variables for use in the cartographic design of point symbols for mobile Augmented Reality applications. Geod. Cartogr. 2012, 61, 19–30. [Google Scholar] [CrossRef] [Green Version]
  7. Keates, J.S. Cartographic Design and Production, 1st ed.; Longman Group: London, UK, 1973; ISBN 0-582-48283-6. [Google Scholar]
  8. MacEachren, A.M. How Maps Work: Representation, Visualization, and Design, 1st ed.; Guilford Press: New York, NY, USA, 1995; ISBN 0-89862-589-0. [Google Scholar]
  9. Morrison, J.L. A theoretical framework for cartographic generalization with the emphasis on the process of symbolization. Int. Yearb. Cartogr. 1974, 14, 115–127. [Google Scholar]
  10. Roth, R. Visual variables. In International Encyclopedia of Geography: People, the Earth, Environment and Technology; Wiley: New York, NY, USA, 2017. [Google Scholar]
  11. Spiess, E. Eigenschaften von Kombinationen graphischer Variablen. In Grundsatzfragen der Kartographie, 1st ed.; Arnberger, E., Ed.; Österreichische Geographische Gesellschaft: Vienna, Austria, 1970; pp. 280–293. [Google Scholar]
  12. Swienty, O.; Zhang, M.; Reichenbacher, T.; Meng, L. Establishing a neurocognition-based taxonomy of graphical variables for attention-guiding geovisualisation. In Proceedings of the SPIE-Geoinformatics 2007: Cartographic Theory and Models, Nanjing, China, 3 August 2007; Li, M., Wang, J., Eds.; Volume 6751, pp. 1–13. [Google Scholar]
  13. Tyner, J.A. Principles of Map Design, 1st ed.; Guilford Press: New York, NY, USA, 2010; ISBN 978-1-60623-544-7. [Google Scholar]
  14. Burian, J.; Brychtová, A.; Vávra, A.; Hladišová, B. Analytical Material for Planning in Olomouc, Czech Republic. J. Maps 2016, 12, 649–654. [Google Scholar] [CrossRef]
  15. Kessler, F.C.; Slocum, T.A. Analysis of thematic maps published in two geographical journals in the twentieth century. Ann. Assoc. Am. Geogr. 2011, 101, 292–317. [Google Scholar] [CrossRef]
  16. White, T.M.; Slocum, T.A.; McDermott, D. Trends and Issues in the Use of Quantitative Color Schemes in Refereed Journals. Ann. Am. Assoc. Geogr. 2017, 107, 829–848. [Google Scholar] [CrossRef]
  17. Wood, D. Now and then: Comparisons of ordinary Americans’ symbol conventions with those of past cartographers. Prologue 1977, 9, 151–161. Available online: https://babel.hathitrust.org/cgi/pt?id=mdp.39015014516770;view=1up;seq=183 (accessed on 9 September 2018).
  18. MacEachren, A.M. (Re)Considering Bertin in the Age of Big Data and Visual Analytics. Presented at the 28th International Cartographic Conference, Washington DC, USA, 2–7 July 2017. [Google Scholar]
  19. Christophe, S.; Hoarau, C. Expressive Map Design Based on Pop Art: Revisit of Semiology of Graphics? Cartogr. Perspect. 2012, 73, 61–74. Available online: https://www.researchgate.net/publication/257935475_Expressive_Map_Design_Based_on_Pop_Art_Revisit_of_Semiology_of_Graphics (accessed on 9 September 2018). [CrossRef]
  20. Angsüsser, S. Kartenicons im Interkulturellen Vergleich. Kartosemiotische Untersuchung Anhand Gedruckter Deutscher Und Chinesischer Stadtpläne. Ph.D. Thesis, Technische Universität München, München, Germany, 2011. Available online: http://mediatum.ub.tum.de/doc/1084383/1084383.pdf (accessed on 9 September 2018).
  21. Robinson, A.H.; Morrison, J.L.; Muehrcke, P.C.; Kimerling, A.J.; Guptill, S.C. Elements of Cartography, 6th ed.; John Wiley & Sons: New York, NY, USA, 1995; ISBN 0-471-55579-7. [Google Scholar]
  22. Slocum, T.A.; McMaster, R.B.; Kessler, F.C.; Howard, H.H. Thematic Cartography and Geovisualization, 3rd ed.; Pearson/Prentice Hall: Upper Saddle River, NJ, USA, 2009; ISBN 978-0-13-229834-6. [Google Scholar]
  23. Gescheider, G. Psychophysics: The Fundamentals, 3rd ed.; Lawrence Erlbaum Associates: Mahwah, NJ, USA, 1997; ISBN 0-8058-2281-X. [Google Scholar]
  24. Pinna, B. New Gestalt Principles of Perceptual Organization: An Extension from Grouping to Shape and Meaning. Gestalt Theory 2010, 32, 11–78. Available online: https://pdfs.semanticscholar.org/f54b/87e262bae5daeeab0cc5a17a36318af4537c.pdf (accessed on 9 September 2018).
  25. Carvalho, G.A.; Moura, A.C.M. Applying Gestalt Theories and Graphical Semiology as Visual Reading Systems Supporting Thematic Cartography. In Proceedings of the 24th International Cartographic Conference, Santiago, Chile, 15–21 November 2009; Available online: http://icaci.org/files/documents/ICC_proceedings/ICC2009/html/refer/20_4.pdf (accessed on 9 September 2018).
  26. Wagemans, J.; Elder, J.H.; Kubovy, M.; Palmer, S.E.; Peterson, M.A.; Singh, M.; von der Heydt, R. A century of Gestalt psychology in visual perception: I. Perceptual grouping and figure-ground organization. Psychol. Bull. 2012, 138, 1172–1217. [Google Scholar] [CrossRef] [PubMed]
  27. Beck, D.M.; Palmer, S.E. Top-down influences on perceptual grouping. J. Exp. Psychol. Hum. 2002, 28, 1071–1084. [Google Scholar] [CrossRef]
  28. Neisser, U. Cognitive Psychology, 1st ed.; Appleton-Century-Crofts: New York, NY, USA, 1967; ISBN 978-0131396678. [Google Scholar]
  29. Cavanagh, P.; Arguin, M.; Treisman, A. Effect of surface medium on visual search for orientation and size features. J. Exp. Psychol. Hum. 1990, 16, 479–491. [Google Scholar] [CrossRef]
  30. Treisman, A.; Gormican, S. Feature analysis in early vision: evidence from search asymmetries. Psychol. Rev. 1988, 95, 15–48. [Google Scholar] [CrossRef] [PubMed]
  31. Brunswik, E. Representative design and probabilistic theory in a functional psychology. Psychol. Rev. 1955, 62, 193–217. [Google Scholar] [CrossRef] [PubMed]
  32. Dhami, M.K.; Hertwig, R.; Hoffrage, U. The Role of Representative Design in an Ecological Approach to Cognition. Psychol. Bull. 2004, 130, 959–988. [Google Scholar] [CrossRef] [PubMed]
  33. Montello, D.R. Cognitive Map-Design Research in the Twentieth Century: Theoretical and Empirical Approaches. Cartogr. Geogr. Inf. Sci. 2002, 29, 283–304. [Google Scholar] [CrossRef]
  34. Koláčný, A. Utilitární kartografie, cesta k optimální účinnosti kartografické informace. Geod. Kartogr. Obz. 1969, 15, 301–308. [Google Scholar]
  35. Deeb, R.; De Maeyer, P.; Ooms, K. The influence of Jacques Bertin. In Proceedings of the 25th International Cartographic Conference, Paris, France, 3–8 July 2011; Available online: http://icaci.org/files/documents/ICC_proceedings/ICC2011/Oral%20Presentations%20PDF/B1-Graphical%20Semiology,%20visual%20variables/CO-081.pdf (accessed on 9 September 2018).
  36. Garlandini, S.; Fabrikant, S.I. Evaluating the Effectiveness and Efficiency of Visual Variables for Geographic Information Visualization. In Proceedings of the International Conference on Spatial Information Theory 2009, Aber Wrac’h, France, 21–25 September 2009; Volume 5756, pp. 195–211. [Google Scholar]
  37. Reimer, A. Squaring the Circle? Bivariate Colour maps and Jacques Bertin’s concept of ‘Disassociation’. In Proceedings of the 25th International Cartographic Conference, Paris, France, 3–8 July 2011; Available online: http://icaci.org/files/documents/ICC_proceedings/ICC2011/Oral%20Presentations%20PDF/A4-Jacques%20Bertin%20and%20graphic%20semiology%202/CO-054.pdf (accessed on 9 September 2018).
  38. Rundstrom, R.A. Introduction. Cartographica 1993, 30, 32–37. [Google Scholar]
  39. Harley, J.B.; Blakemore, M.J. Cultural Meaning: The Iconography of Maps. Cartographica 1980, 17, 76–86. [Google Scholar]
  40. Wood, D. Cultured symbols: Thoughts on the cultural context of cartographic symbols. Cartographica 1984, 21, 9–37. [Google Scholar] [CrossRef]
  41. Wood, D.; Fels, J. Designs on Signs/Myth and Meaning in Maps. Cartographica 1986, 23, 54–103. [Google Scholar] [CrossRef]
  42. Tang, X.; Hurni, L. Regional Spatial Planning Maps: A Sino-Swiss Comparison of Cartographic Visualization Methodologies. In Proceedings of the 24th International Cartographic Conference, Santiago, Chile, 15–21 November 2009; Available online: https://icaci.org/files/documents/ICC_proceedings/ICC2009/html/nonref/22_2.pdf (accessed on 9 September 2018).
  43. Stachoň, Z.; Šašinka, Č.; Čeněk, J.; Štěrba, Z.; Angsuesser, S.; Fabrikant, S.I.; Štampach, R.; Morong, K. Cross-cultural differences in figure–ground perception of cartographic stimuli. Cartogr. Geogr. Inf. Sci. 2018. [Google Scholar] [CrossRef]
  44. Angsüsser, S. Possible Reasons for Size Differences Between Point Symbols in German and Chinese City Maps. In Proceedings of the 5th International Conference on Cartography & GIS, Riviera, Bulgaria, 15–20 June 2014; Bandrova, T., Konecny, M., Eds.; Bulgarian Cartographic Association: Sofia, Bulgaria, 2014; Volume 1, pp. 268–277. Available online: https://cartography-gis.com/docsbca/5ICCandGIS_Proceedings.pdf (accessed on 9 September 2018).
  45. Carlson, E.R. Generality of order of concept attainment. Psychol. Rep. 1962, 10, 375–380. [Google Scholar] [CrossRef]
  46. Leifer, A. Ethnic Patterns in Cognitive Tasks. Ph.D. Thesis, Yeshiva University, New York, NY, USA, 1972. [Google Scholar]
  47. Lesser, G.S.; Fifer, G.; Clark, D.H. Mental abilities of children from different social class and cultural groups. Monogr Soc. Res. Child Dev. 1965, 30, 1–115. [Google Scholar] [CrossRef] [PubMed]
  48. Lynn, R.; Pagliari, C.; Chan, J. Intelligence in Hong Kong measured for Spearman’s g and the visuospatial and verbal primaries. Intelligence 1988, 12, 423–433. [Google Scholar] [CrossRef]
  49. Lynn, R. Intelligence in China. Soc. Behav. Personal. 1991, 19, 1–4. [Google Scholar] [CrossRef]
  50. Jensen, A.R.; Whang, P.A. Speed of accessing arithmetic facts in long-term memory: a comparison of Chinese-American and Anglo-American children. Contemp. Educ. Psychol. 1994, 19, 1–12. [Google Scholar] [CrossRef]
  51. Choong, Y.; Salvendy, G. Design of Icons for Use by Chinese in Mainland China. Interact. Comput. 1998, 9, 417–430. [Google Scholar] [CrossRef]
  52. Hsu, S.-H.; Huang, K.-C. Effects of minimal legible size characters on Chinese word recognition. Visible Lang. 2001, 35, 178–191. Available online: https://s3-us-west-2.amazonaws.com/visiblelanguage/pdf/35.2/effects-of-minimal-legible-size-characters-on-chinese-word-recognition.pdf (accessed on 9 September 2018).
  53. Mo, C.; Yu, M.; Seger, C.; Mo, L. Holistic neural coding of Chinese character forms in bilateral ventral visual system. Brain Lang. 2015, 141, 28–34. [Google Scholar] [CrossRef] [PubMed]
  54. Nisbett, R.E.; Peng, K.; Choi, I.; Norenzayan, A. Culture and systems of Thought: Holistic Versus Analytic Cognition. Psychol. Rev. 2001, 108, 291–310. [Google Scholar] [CrossRef] [PubMed]
  55. Nisbett, R.E. The Geography of Thought. How Asians and Westerners Think Differently … and Why, 1st ed.; The Free Press: New York, NY, USA, 2003; ISBN 0-7432-1646-6. [Google Scholar]
  56. Hofstede, G. Dimensions of national cultures in fifty countries and three regions. In Expiscations in Cross-Cultural Psychology, 1st ed.; Deregowski, J.B., Dziurawiec, S., Annis, R.C., Eds.; Swets and Zeitlinger: Lisse, The Netherlands, 1983; pp. 335–355. [Google Scholar]
  57. Hofstede, G.; Hofstede, G.J.; Minkov, M. Cultures and Organizations—Software of the Mind. Intercultural Cooperation and Its Importance for Survival, 3rd ed.; McGraw-Hill: New York, NY, USA, 2010; ISBN 978-0071664189. [Google Scholar]
  58. Faul, F.; Erdfelder, E.; Lang, A.-G.; Buchner, A. G*Power 3: A flexible statistical power analysis program for the social, behavioral, and biomedical sciences. Behav. Res. Methods 2007, 39, 175–191. [Google Scholar] [CrossRef] [PubMed] [Green Version]
  59. Šašinka, Č.; Morong, K.; Stachoň, Z. The Hypothesis Platform: An Online Tool for Experimental Research into Work with Maps and Behavior in Electronic Environments. ISPRS Int. Geo-Inf. 2017, 6, 407. [Google Scholar] [CrossRef]
  60. Popelka, S.; Stachoň, Z.; Šašinka, Č.; Doležalová, J. Eyetribe Tracker Data Accuracy Evaluation and Its Interconnection with Hypothesis Software for Cartographic Purposes. Comput. Intell. Neurosci. 2016, 2016, 9172506. [Google Scholar] [CrossRef] [PubMed]
  61. Dymon, U. An analysis of emergency map symbology. Int. J. Emerg. Manag. 2003, 1, 227–237. [Google Scholar] [CrossRef]
  62. Leitner, F. Analýza Využitelnosti Geoinformací ze Zdrojů Typu Big data v Procesech Krizového Řízení. Ph.D. Thesis, Masaryk University, Brno, Czech Republic, 2018. Available online: https://is.muni.cz/th/pxb9l/BP_Leitner_qllmmeem.pdf (accessed on 9 September 2018).
  63. Van de Vijver, F.; Tanzer, N.K. Bias and equivalence in cross-cultural assessment: an overview. Eur. Rev. Appl. Psychol. 2004, 54, 119–135. [Google Scholar] [CrossRef] [Green Version]
Figure 1. Bertin’s six basic variables ([3]; depiction adapted from [20]).
Ijgi 07 00427 g001
Figure 2. Minimum size (mm) at a reading distance of 40 cm (adapted from [34]).
Ijgi 07 00427 g002
Figure 3. Map reading speed (adapted from [34]).
Ijgi 07 00427 g003
Figure 4. Differences in the stimuli used with and without a map background (task instruction: find the shape shown at the left side of the screen).
Ijgi 07 00427 g004
Figure 5. Schema of the procedure used for testing.
Ijgi 07 00427 g005
Figure 6. Comparison of mean detection times with background and without background (in seconds, N = 69).
Ijgi 07 00427 g006
Figure 7. Mean detection times regarding point symbol shape (in seconds, N = 69).
Ijgi 07 00427 g007
Table 1. Difference threshold for each shape [34].
ShapeThreshold (%)
Square Ijgi 07 00427 i0018
Circle Ijgi 07 00427 i00212
Rectangle Ijgi 07 00427 i00312
Equilateral triangle Ijgi 07 00427 i0048
Isosceles triangle Ijgi 07 00427 i00515
Table 2. Mean detection times regarding point symbol size (in seconds, N = 69).
Symbol SizeGroupAll Shapes: Mean Time (SD) Circle: Mean Time (SD)Diamond: Mean Time (SD)Triangle: Mean Time (SD)
SmallChinese5.24 (0.93)4.88 (0.99)7.06 (1.73)3.75 (0.52)
Czech4.19 (0.72)3.75 (0.77)5.85 (1.57)3.12 (0.62)
Total4.74 (0.98)4.34 (1.05)6.48 (1.75)3.45 (0.65)
LargeChinese4.25 (0.60)3.81 (0.58)5.51 (0.96)3.75 (0.66)
Czech3.37 (0.59)3.01 (0.49)4.15 (1.16)3.03 (0.65)
Total3.83 (0.74)3.43 (0.67)4.67 (1.17)3.40 (0.75)

