Use of a Multilayer Perceptron to Automate Terrain Assessment for the Needs of the Armed Forces


Faculty of Civil Engineering and Geodesy, Military University of Technology, 00-908 Warsaw, Poland
ISPRS Int. J. Geo-Inf. 2018, 7(11), 430; https://0-doi-org.brum.beds.ac.uk/10.3390/ijgi7110430
Submission received: 7 October 2018
/
Revised: 28 October 2018
/
Accepted: 4 November 2018
/
Published: 6 November 2018
Abstract
:The classification of terrain in terms of passability plays a significant role in the process of military terrain assessment. It involves classifying selected terrain to specific classes (GO, SLOW-GO, NO-GO). In this article, the problem of terrain classification to the respective category of passability was solved by applying artificial neural networks (multilayer perceptron) to generate a continuous Index of Passability (IOP). The neural networks defined this factor for primary fields in two sizes (1000 × 1000 m and 100 × 100 m) based on the land cover elements obtained from Vector Smart Map (VMap) Level 2 and Shuttle Radar Topography Mission (SRTM). The work used a feedforward neural network consisting of three layers. The paper presents a comprehensive analysis of the reliability of the neural network parameters, taking into account the number of neurons, learning algorithm, activation functions and input data configuration. The studies and tests carried out have shown that a well-trained neural network can automate the process of terrain classification in terms of passability conditions.
1. Introduction
Land formation and cover are key factors that influence the conduct of military operations [1,2,3]. The use of advantageous knowledge related to passability conditions often has a decisive influence on the success of a military campaign.
Today, in the armies of NATO member states, passability analysis is based on unified standardization documents [4,5]. According to the elements of land cover, terrain is divided into three classes of passability: GO, SLOW-GO and NO-GO TERRAIN [6]. In accordance with the applicable standards [4,7], the analysis of passability should be done manually as an overlay on a topographical map. This mostly involves an experienced officer marking impassable areas. This method not only requires huge experience and skill, but is also time consuming. For these reasons the present study investigates the use of Artificial Neural Networks (ANN) for automating the passability map construction process, to significantly improve and accelerate the entire process of terrain assessment. Accordingly, the purpose of this article was to present a terrain classification methodology for military purposes, based on artificial neural networks. The proposed methodology used the Index of Passability (IOP) designation, which is a coefficient reflecting the degree of limitation of vehicular speed by land cover elements. In this study, this index was determined on a continuous scale, from 0 (impassable terrain) to 1 (easily passable terrain).
The passability analysis process can be automated through the use of the Geographic Information System (GIS) and specialised topographical databases. Research in this area [8] has shown the influence of geographical factors on cross-country passage. The possibility of vehicle movement in a forested area, taking into consideration such factors as the height of trees and the distance between them, has been studied previously [9]. In another study [10] the authors tried to determine the passability coefficient using an original mathematical model that took into account the type of soil and weather conditions, in addition to land cover. In similar studies [11] the ArcGIS modeller was used to automatically generate Cross Country Movement (CCM) overlays. A very interesting and noteworthy study [12], from the point of view of the CCM approach previously presented, describes the possibility of traversing snow-covered Arctic areas using various vehicles. From the point of view of passability, studies exploring the ability to overcome land obstacles by knocking them down are also important. One example of this [13] shows an interesting attempt to design an algorithm to allow an unmanned vehicle to move through various terrain obstacles. Assumptions similar to those discussed in this article were presented [14], where the author described algorithms that determined passability for a square primary field. As a result, a passability map was designed showing those areas where maximum travel velocity could be achieved.
The problem of terrain classification may be solved by the application of artificial neural networks. There are many studies that classify images from satellite imagery. Studies have been carried out [15] where the authors chose satellite images from the Landsat satellite, and obtained a classification accuracy 24 to 36% better than achievable with conventional methods. Other authors [16] have used various computational intelligence methods (including a multilayer perceptron) to develop an algorithm that aggregated raster data to distinguish geographic objects (the case study considered a built-up area). The results of testing show that each of the methods yield different results, and is better suited to particular cases. Another study presented an example of the use of Kohonen artificial neural networks to integrate satellite images with LIDAR (Light Detection and Ranging) data in order to identify the elements of land cover [17]. The use of this kind of neural network has been used to develop CCM maps [18]. An interesting implementation of artificial neural networks in a popular spatial information system [19] was used to develop a toolkit for the ArcGIS software, which enables the teaching and deploying of ANN to perform Digital Terrain Model (DTM) generation tasks.
2. Methodology
2.1. Study Area
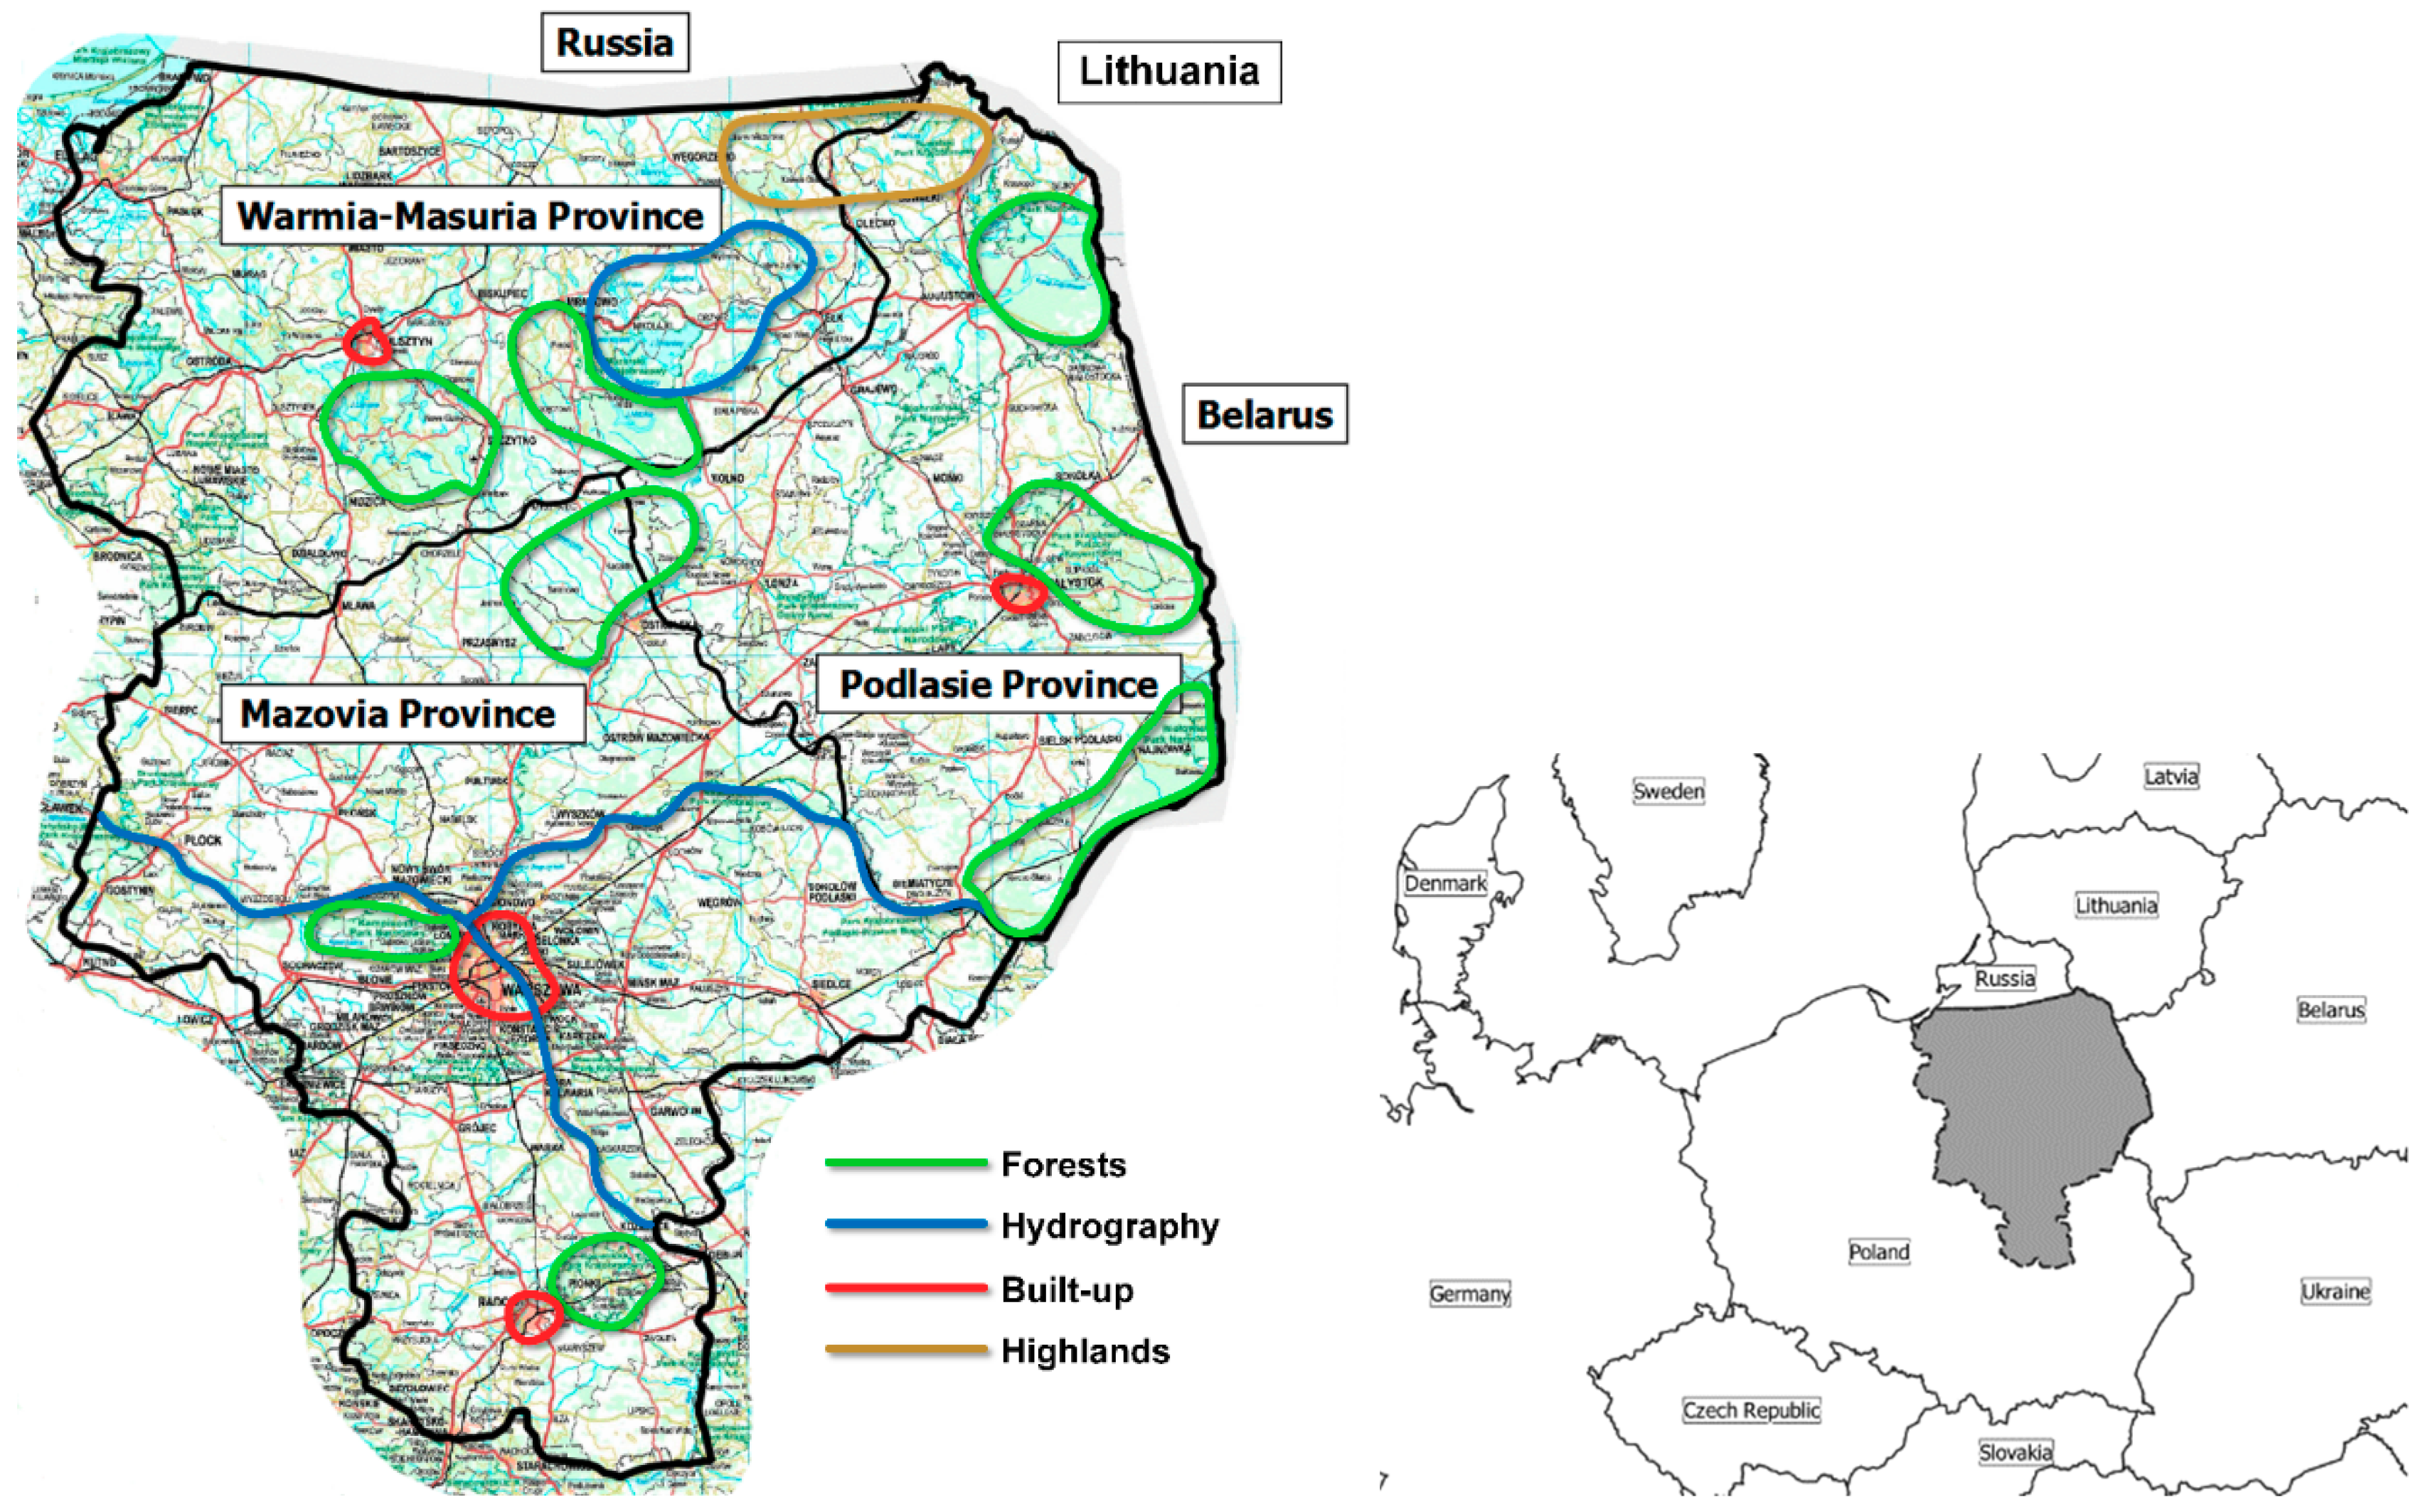
The area used for the tests comprised three provinces located in the north-eastern part of Poland—Mazovia, Warmia-Masuria and Podlasie. The selection of this area was dictated by a variety of terrain features that affect passability (Figure 1). Additionally, this region remains an area of operational interest for both the Polish Armed Forces and NATO [20]. The area occupies approximately 81,000 km2 and encompasses the largest water reservoirs in Poland (the Great Masurian Lakes), two large watercourses (the Vistula and the Bug rivers), as well as vast areas of forests (27% of the analyzed area). In its northern part, there are both large terrain level variations (up to 10 degrees) and extensive plains (such as the Łowicz-Błonie Plain). It also includes the Warsaw Agglomeration and two provincial capitals (Białystok and Olsztyn). The density of the road network is variable and depends on the degree of land use. A digital model of the land slopes was generated using terrain formation data derived from the Shuttle Radar Topography Mission Level 1 (SRTM L1) [21].
2.2. Source Data
This study used a topographic object database, where the data described the shapes of objects, including attributes (e.g., width or name of road). Depending on the spatial characteristics of this data, it could be described by closed polygons, broken lines, and singular points.
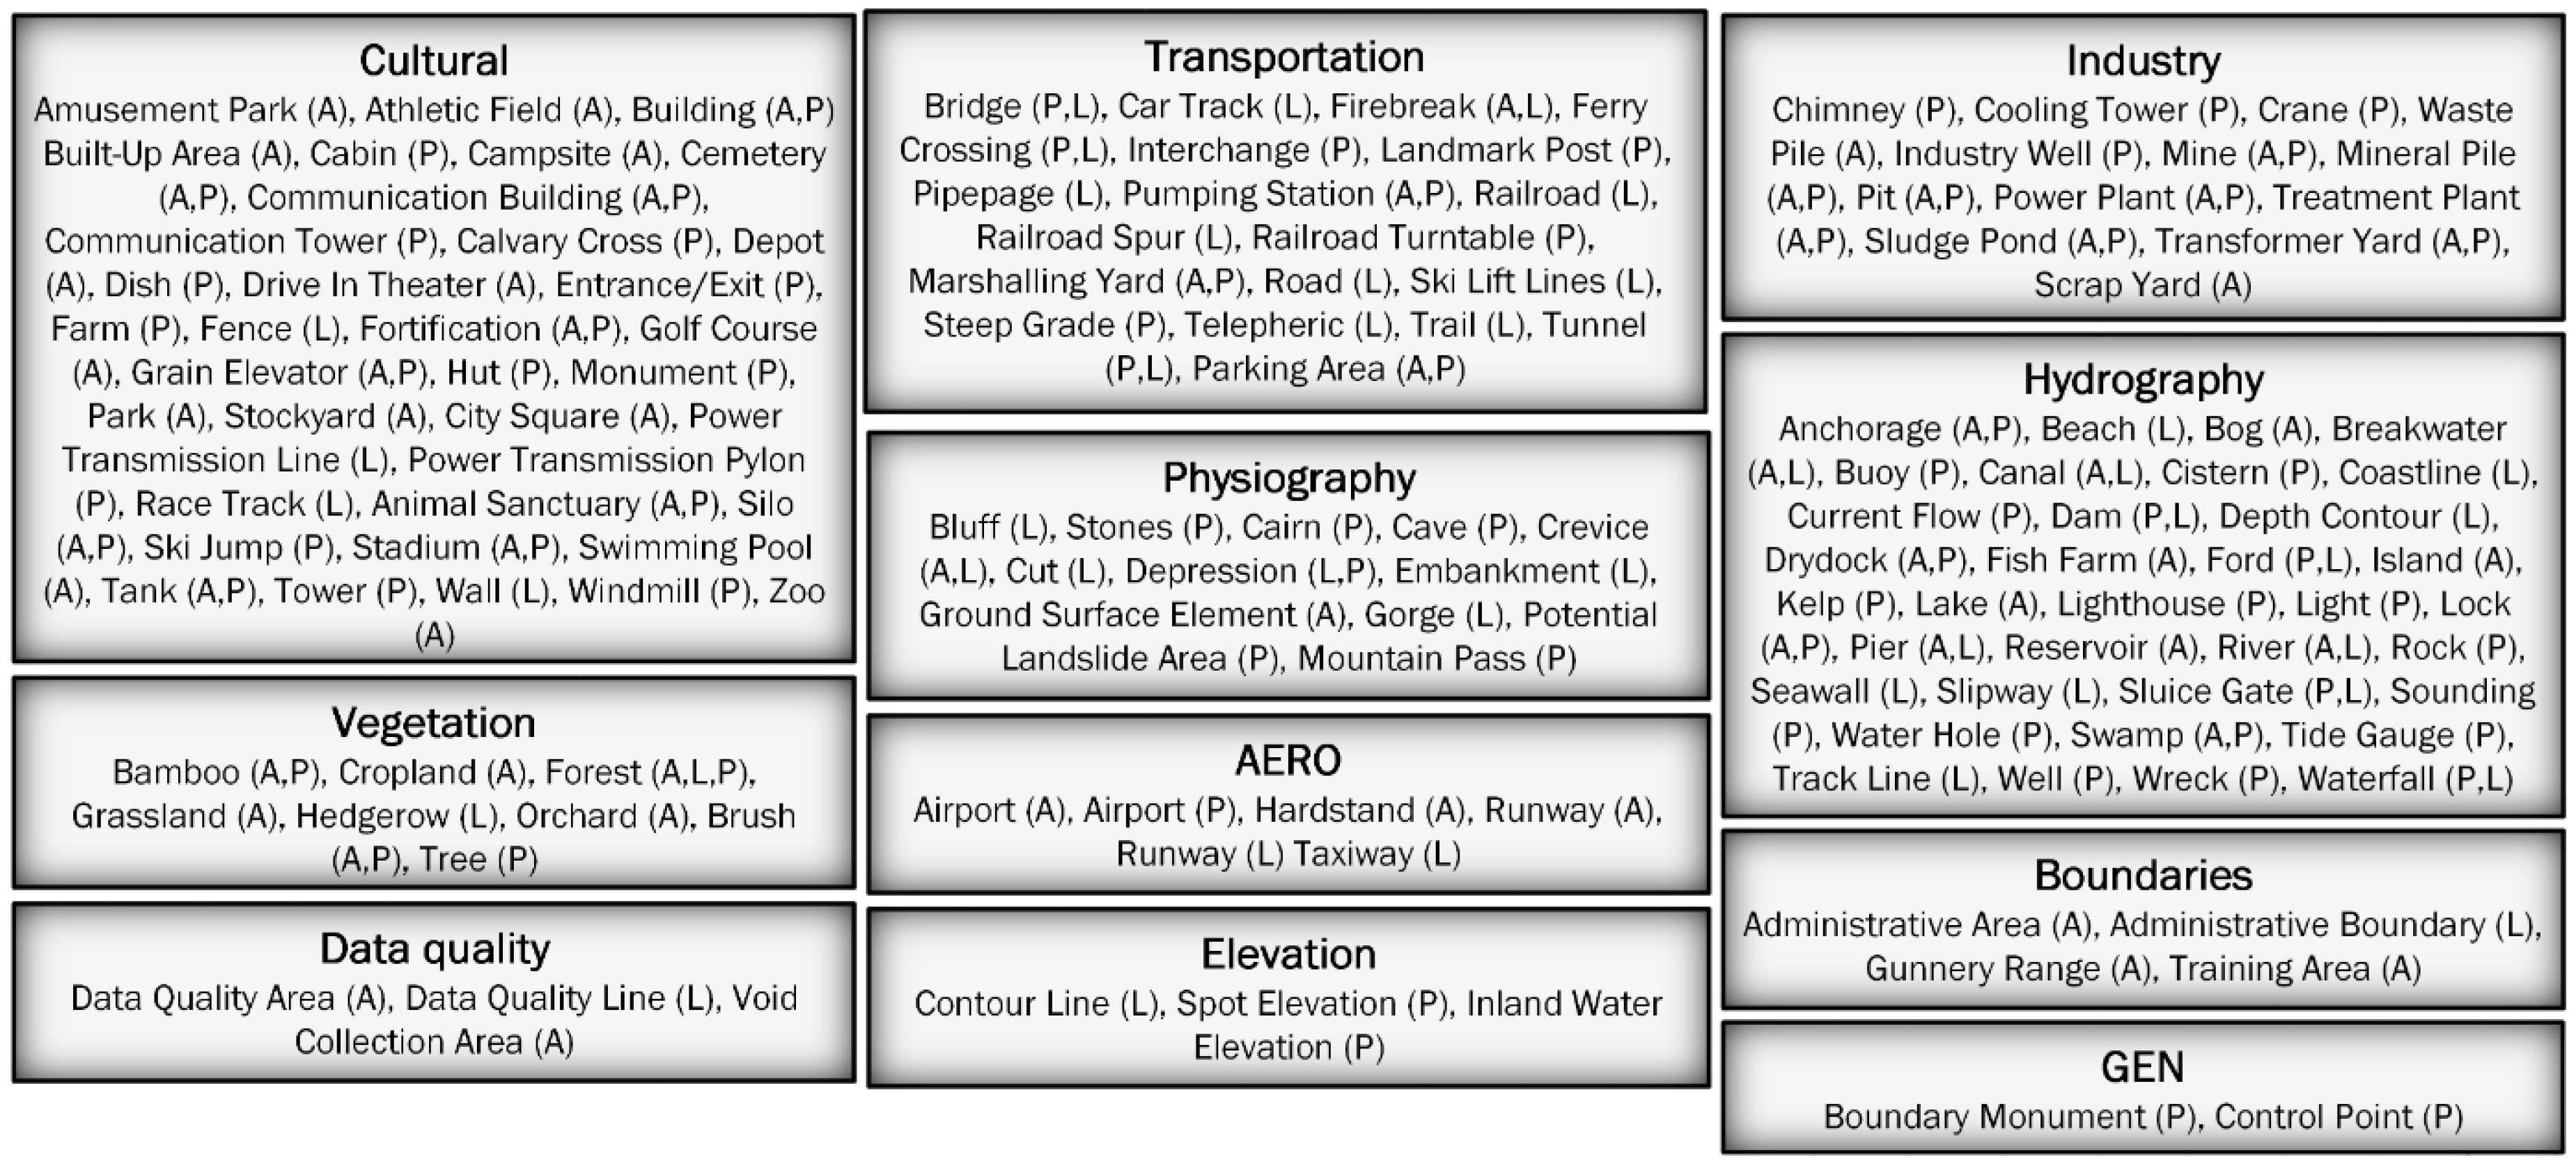
The generated land passability maps were developed mainly for military purposes; therefore, the Vector Smart Map (VMap) Level 2 standardized, military vector spatial database was used [22]. In terms of detail, it is equivalent to a 1:50,000 scale topographic map. The horizontal accuracy of the objects location for this data base is approximately 50–100 m. The conceptual model included 253 feature classes (Figure 2); however, the area of interest only required 110 feature classes. This is a standard product used by NATO armed forces, whose data organization is very precisely defined in the Digital Geographic Information Exchange Standard (DIGEST) standardization agreement [23].
2.3. Input Data
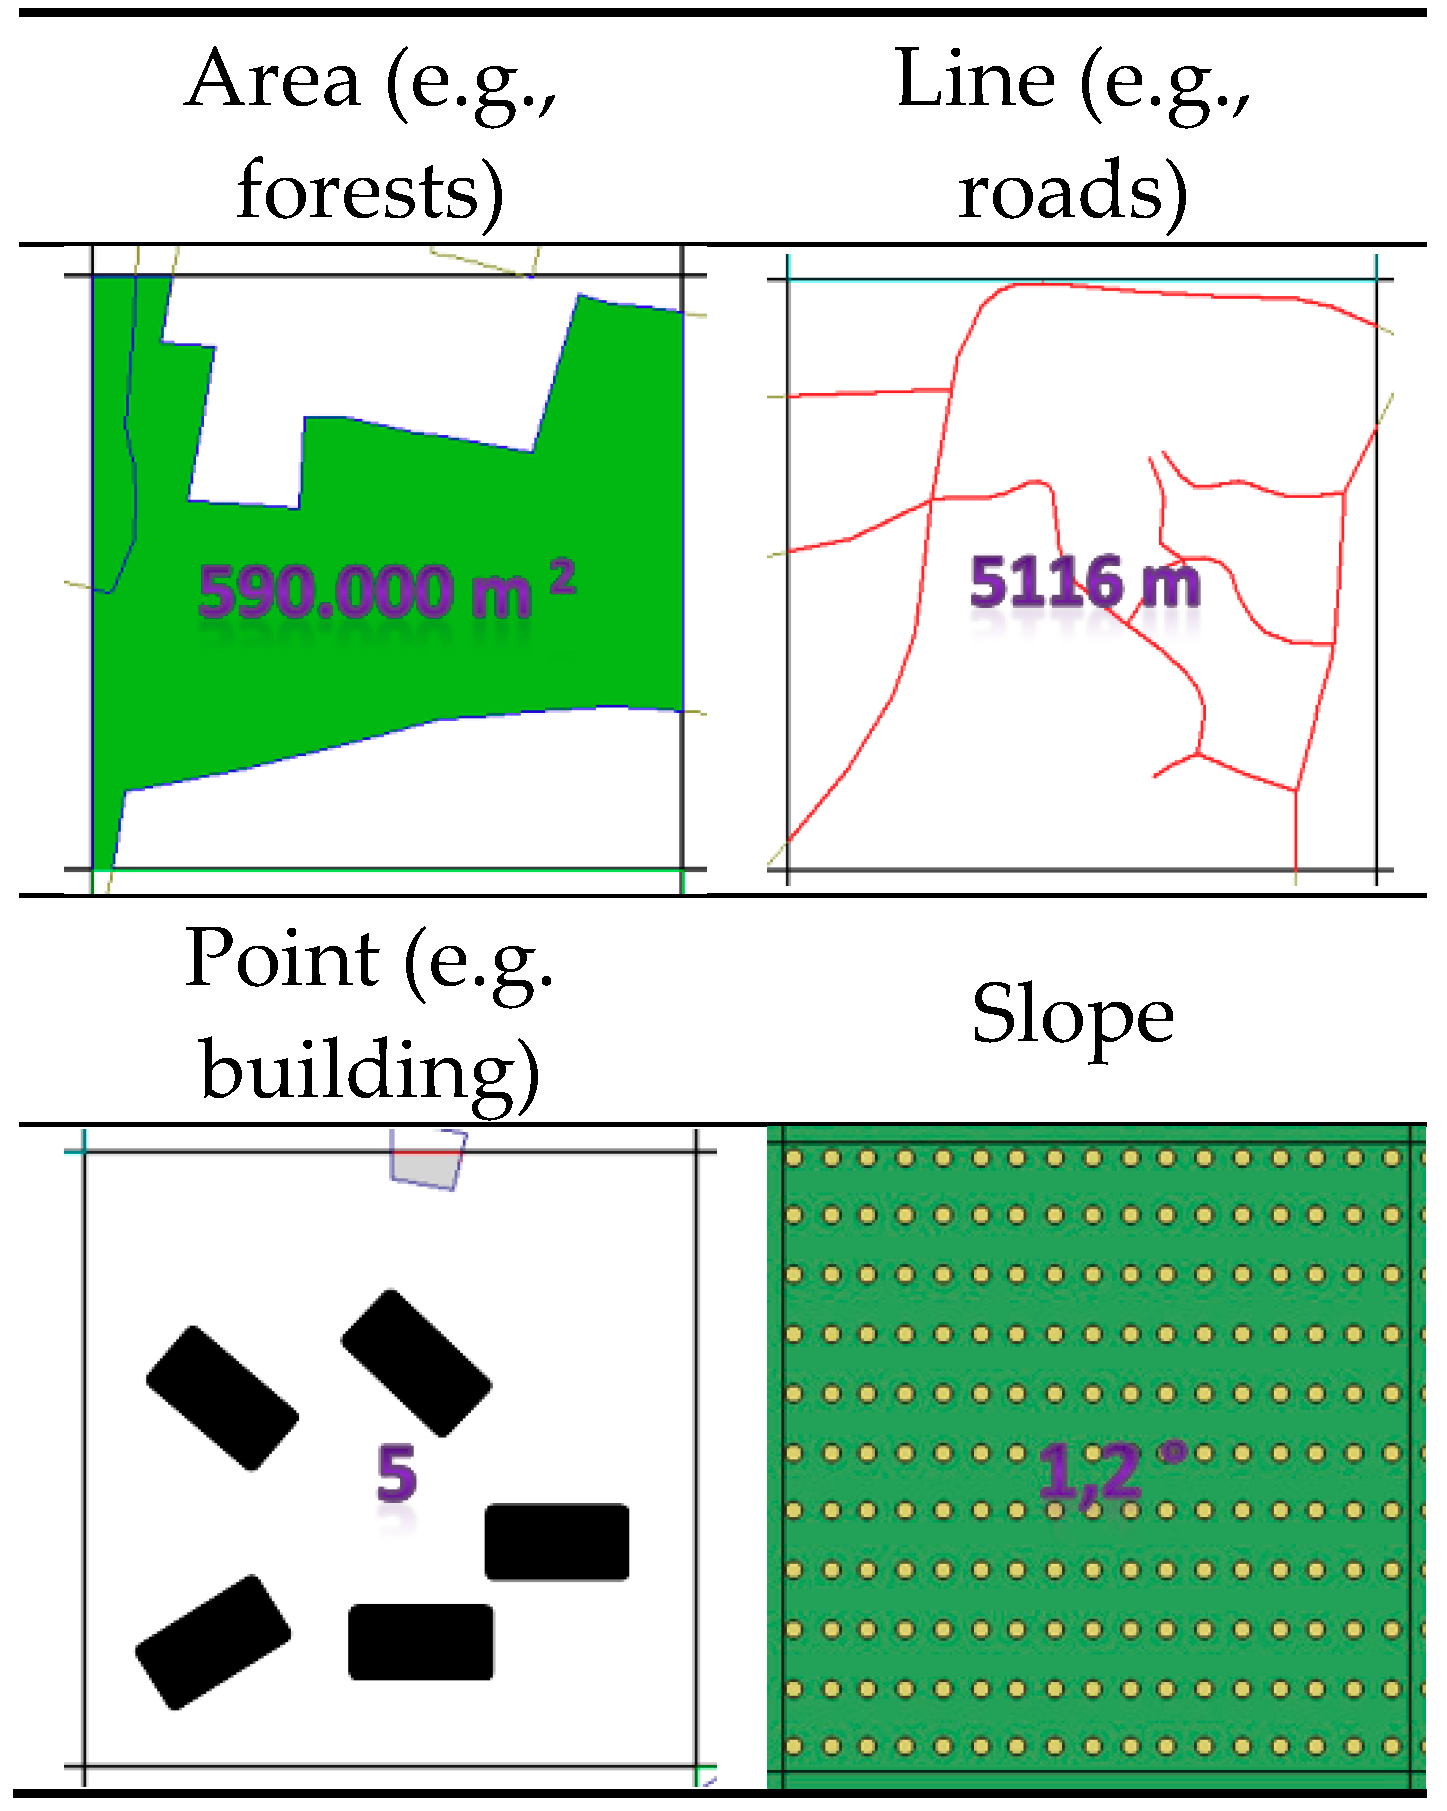
The basic methodological assumption was to determine the coefficient of terrain passability in relation to a square-shaped primary field. In this study, the experiments involved two sizes of cell: 1000 × 1000 m and 100 × 100 m. For each primary field, data was obtained on the land cover elements found within each square. Depending on the geometric representation of the objects in the database, the following data was collected for each mesh of the grid (Figure 3):
- For area objects (e.g., forests, lakes, built-up areas), the surface of a given area found within a given square of the grid;
- For line objects (e.g., rivers, roads, railways), the length of a given line object within a given square of the grid;
- For point objects (e.g., buildings, farmsteads), the number of objects within a square.
Furthermore, the average height and slope value, determined on the basis of all the measurement points in the grid area, were derived from the DTM and the digital model of the slopes. The used data model is automatically created in software written in the .NET programming environment and consists of carrying out the following steps:
- Generating primary fields for the defined area;
- Obtaining data on the land cover elements located within the primary field, for each primary field.
The last step is the most complex and time-consuming. For the 1000 × 1000 m primary field, it took about 24 h to prepare the data model for whole study area. The accuracy of the data model is affected by the accuracy of the used source data (Vmap Level 2) and the size of the primary field. A small field of 100 by 100 m, makes it possible to illustrate the shape of roads, forests and other important elements of land cover. On the other hand, maps based on 1000 by 1000 m primary fields are more general, with a decreasing number of noticeable terrain details. A detailed description of the developed software and data model used is given in another paper [24].
As the result, 61 object classes were collected, selected from the 110 VMap Level 2 classes for each primary field. The elimination stage removed those classes that were not related to land cover elements (administrative borders, contours, etc.) and those with a negligible impact on passability (mainly point objects, such as railway crossings, roadside crosses, huts, etc.).
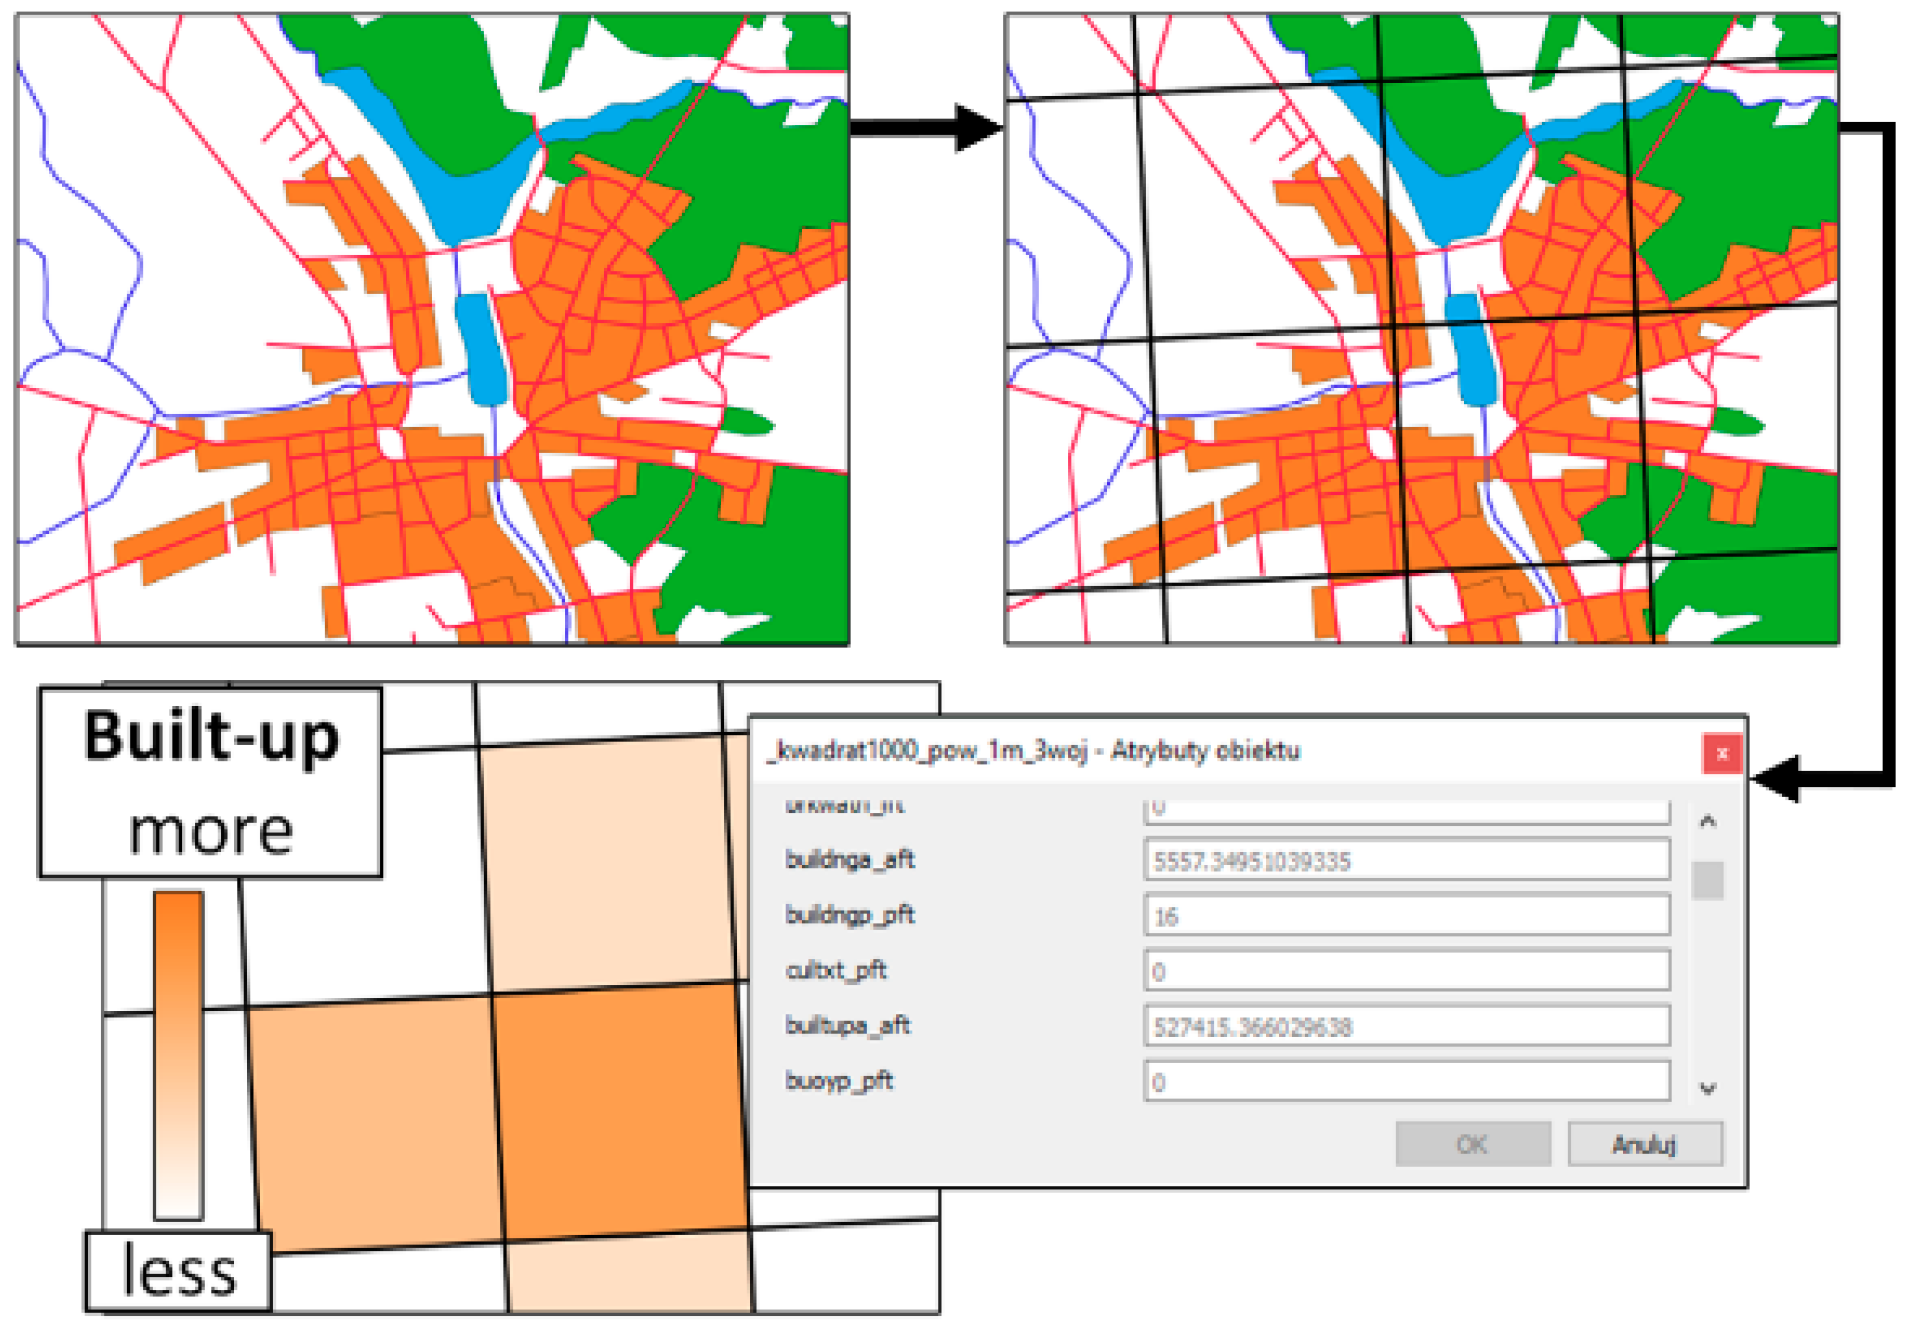
The method of data preparation was based on a specific vector conversion from a discrete data model to a continuous raster model, in which each square grid was described by a specific number of parameters. During the conversion of the data to this model, a large part of the spatial information (both geometric and descriptive, Figure 4) was lost. However, it was assumed that this method of organizing the data was sufficient for the statistical analyses and entering of the land cover parameters into the neural network, as presented elsewhere [18,25].
Due to the fact that the generated land cover parameters were presented using various units (e.g., surface area in square meters, length in meters, etc.) and numerical ranges, they were normalized to a continuous range from 0 to 1, according to the feature scaling method:
with V being an input value and the V′ the normalized value of input. Consequently, [Vmin, Vmax] is the interval of input data and [new_max, new_min] is the new data range.
2.4. Processing of Data by Artificial Neural Networks
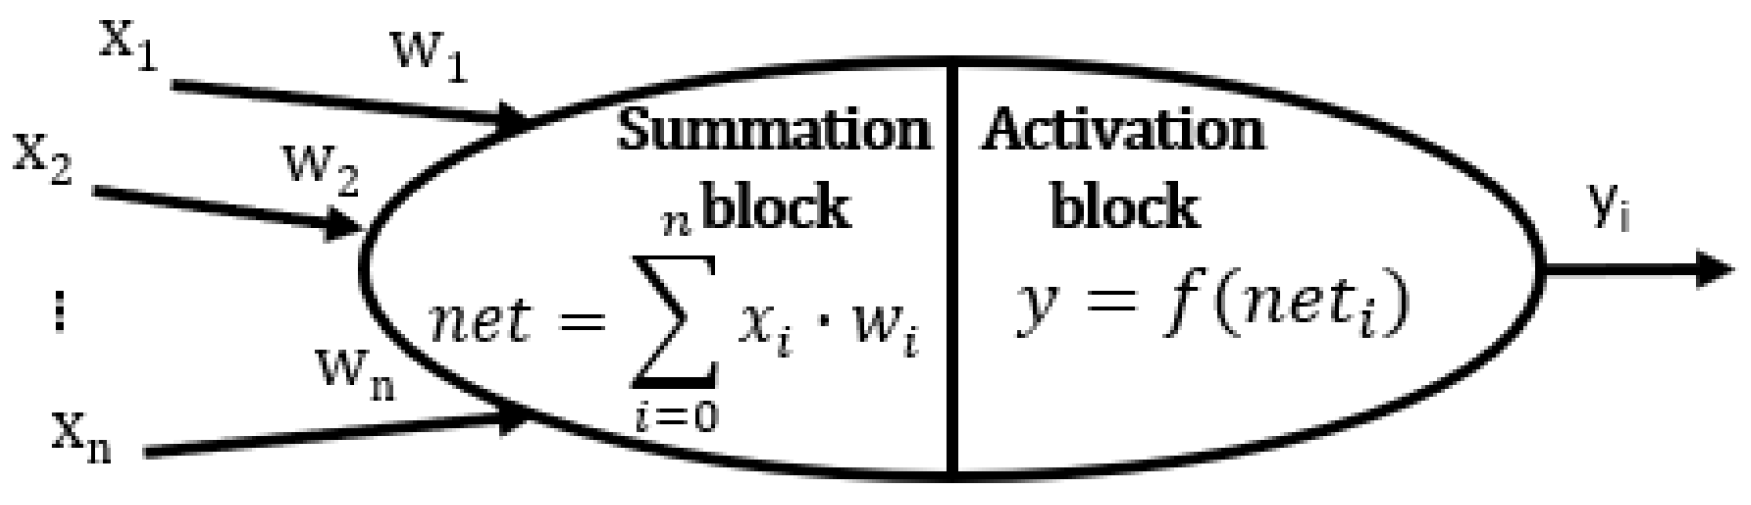
In the proposed methodology, ANN were used for the classification of terrain for the purposes of developing passability maps. The artificial neuron was defined as follows [26] (Figure 5):
- The processing of data by an artificial neuron begins when the input values (x1 … xn) are entered. These may be primary values (for input layer neurons) or signals from other neurons;
- The signals are multiplied by a weight factor (w1 … wn), called a synaptic weight. These products are added by the summation block. The resulting value is referred to as neuron stimulation;
- The result of the summation is processed by an activation block, which may be described by various functions (f(neti)) that must be monotonic and continuous;
- The value of the activation function (yi) is the final output of the neuron.
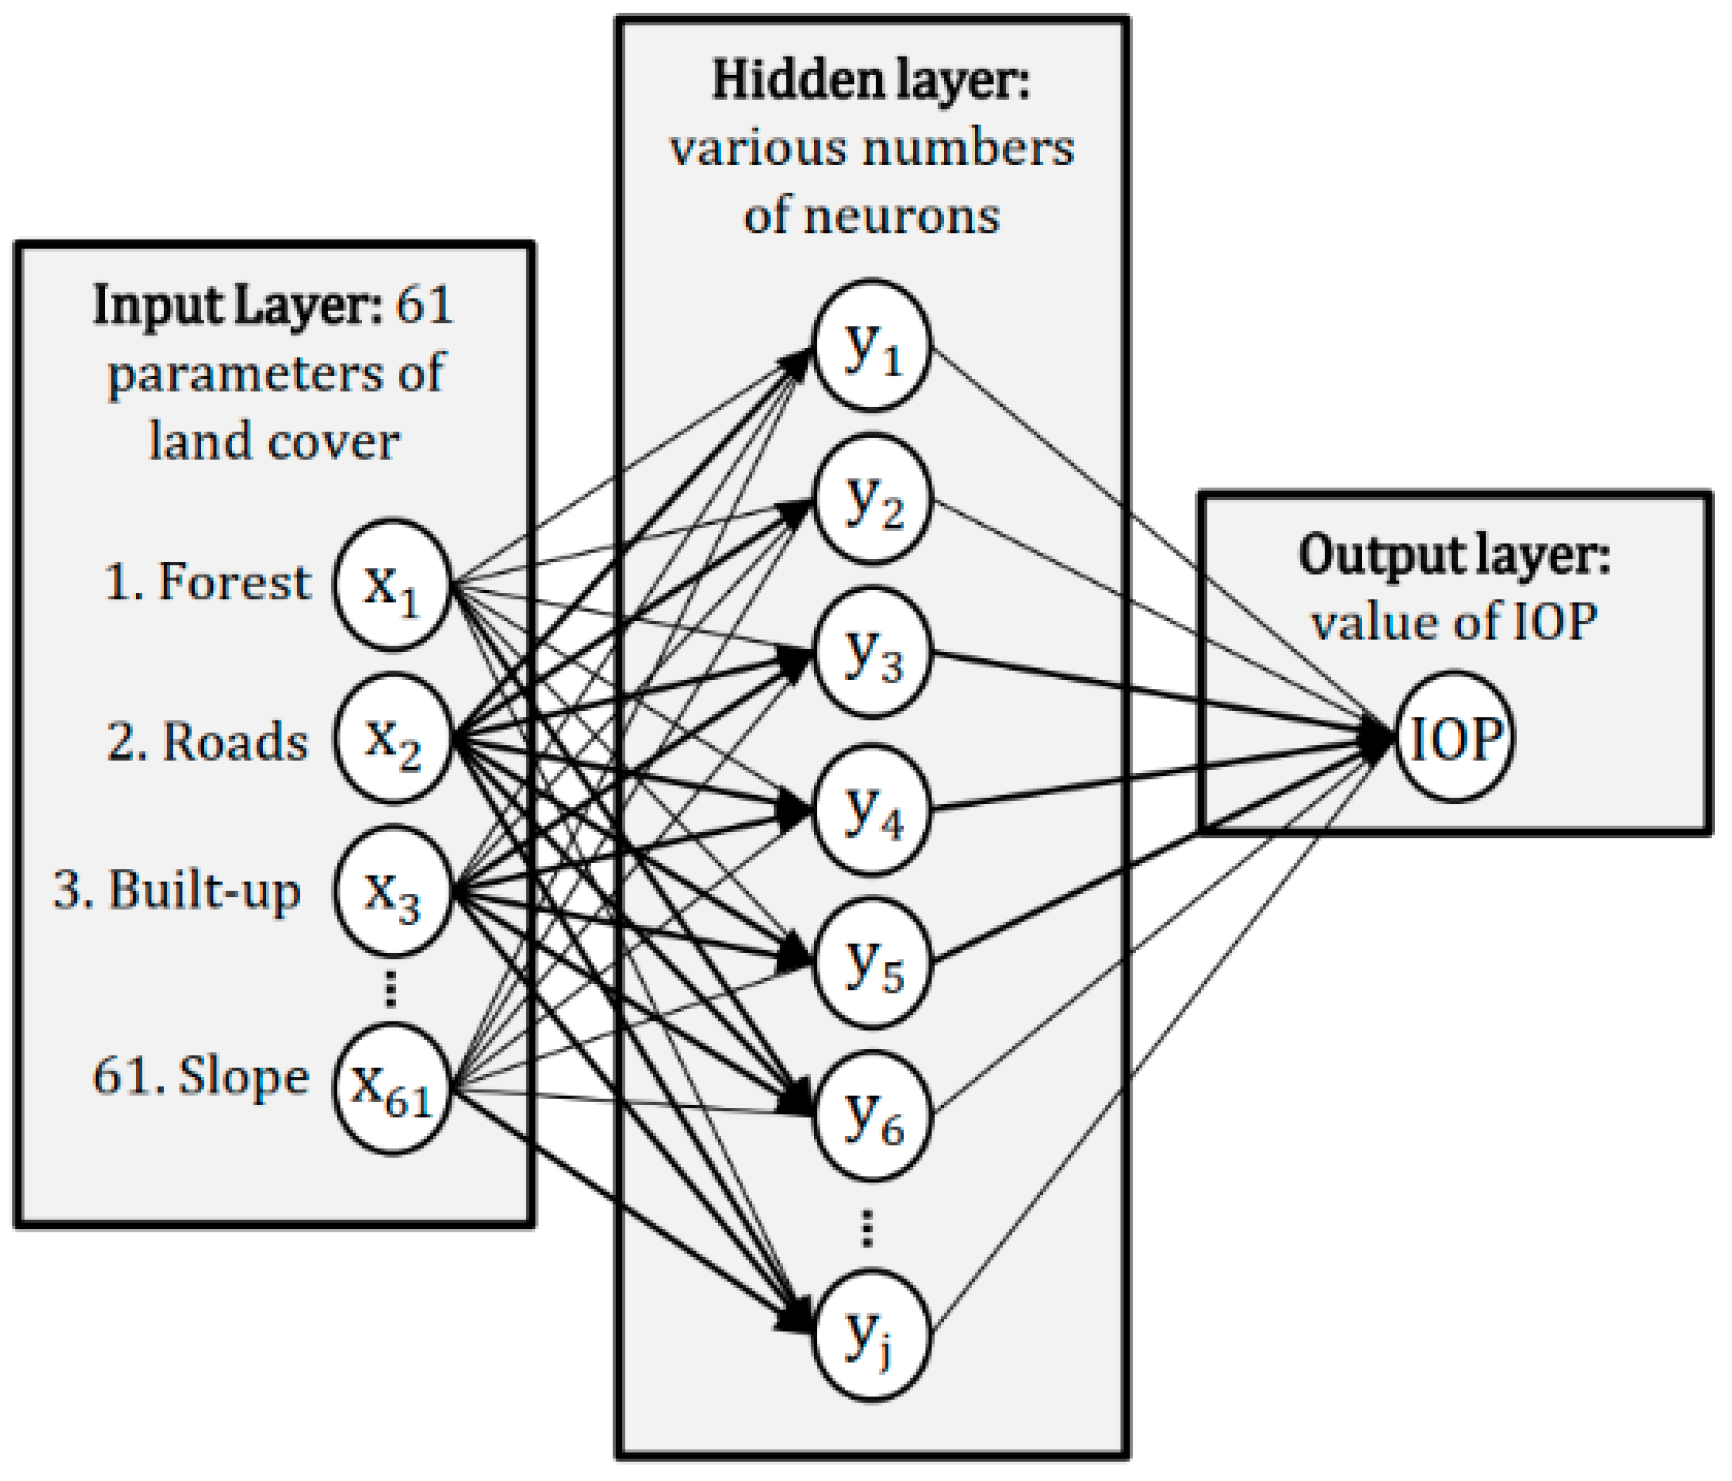
It was assumed that the passability would be determined using a perceptron consisting of three layers of neurons. The input layer were the neurons to which signals describing the pre-determined land cover parameters were input. The normalized values of the land cover elements were entered to the input layer. Data processing took place in the second layer (the ’hidden layer’). Layer 3 was the output layer, consisting of one neuron. This neuron output gave the final value of the IOP (Figure 6).
In this study, the neural networks were prepared using the supervised learning with a teacher method [26]. In general, this consists of modifying the weights of the neuronal entrances in such a way that the parameters of land cover entered into the input layer of the neuron network gave the expected result (i.e., IOP). The training data was a set of passability indices assigned a priori for a certain group of squares in the grid. These indices were defined in the range from 0 (impassable terrain) to 1 (easily passable terrain), by a reconnaissance officer who professionally developed maps of passability. He assigned them for 1000 randomly selected squares of the grid (separately for both sizes of primary field, Table 1).
In this way, training data for 1000 randomly selected grid squares were obtained. Selected primary fields evenly covered the study area. Each of them consisted of two elements:
- Index of Passability (expected neural network output);
- Information on land cover elements found in that grid square in the form of 61 parameters (from VML2 and SRTM).
The process of preparing a training set was the only long-lasting operation that was to be performed manually (preparing IOPs for 1000 grid squares took approximately 6 h). The training data set in all tests performed was divided into two subgroups: A teaching set used for network learning (80% of samples), and a validation set (20%) not used in the learning process but used for final verification of the generated network.
After learning, the “quality” of each network was examined. This coefficient was determined for both the learning and the validation samples. The Pearson Correlation Coefficient (PCC) was applied to the IOPs from the training data and the predictions made by the neural network. The quality of the generated network was a key estimator of the usefulness of the network in determining the Index of Passability [28].
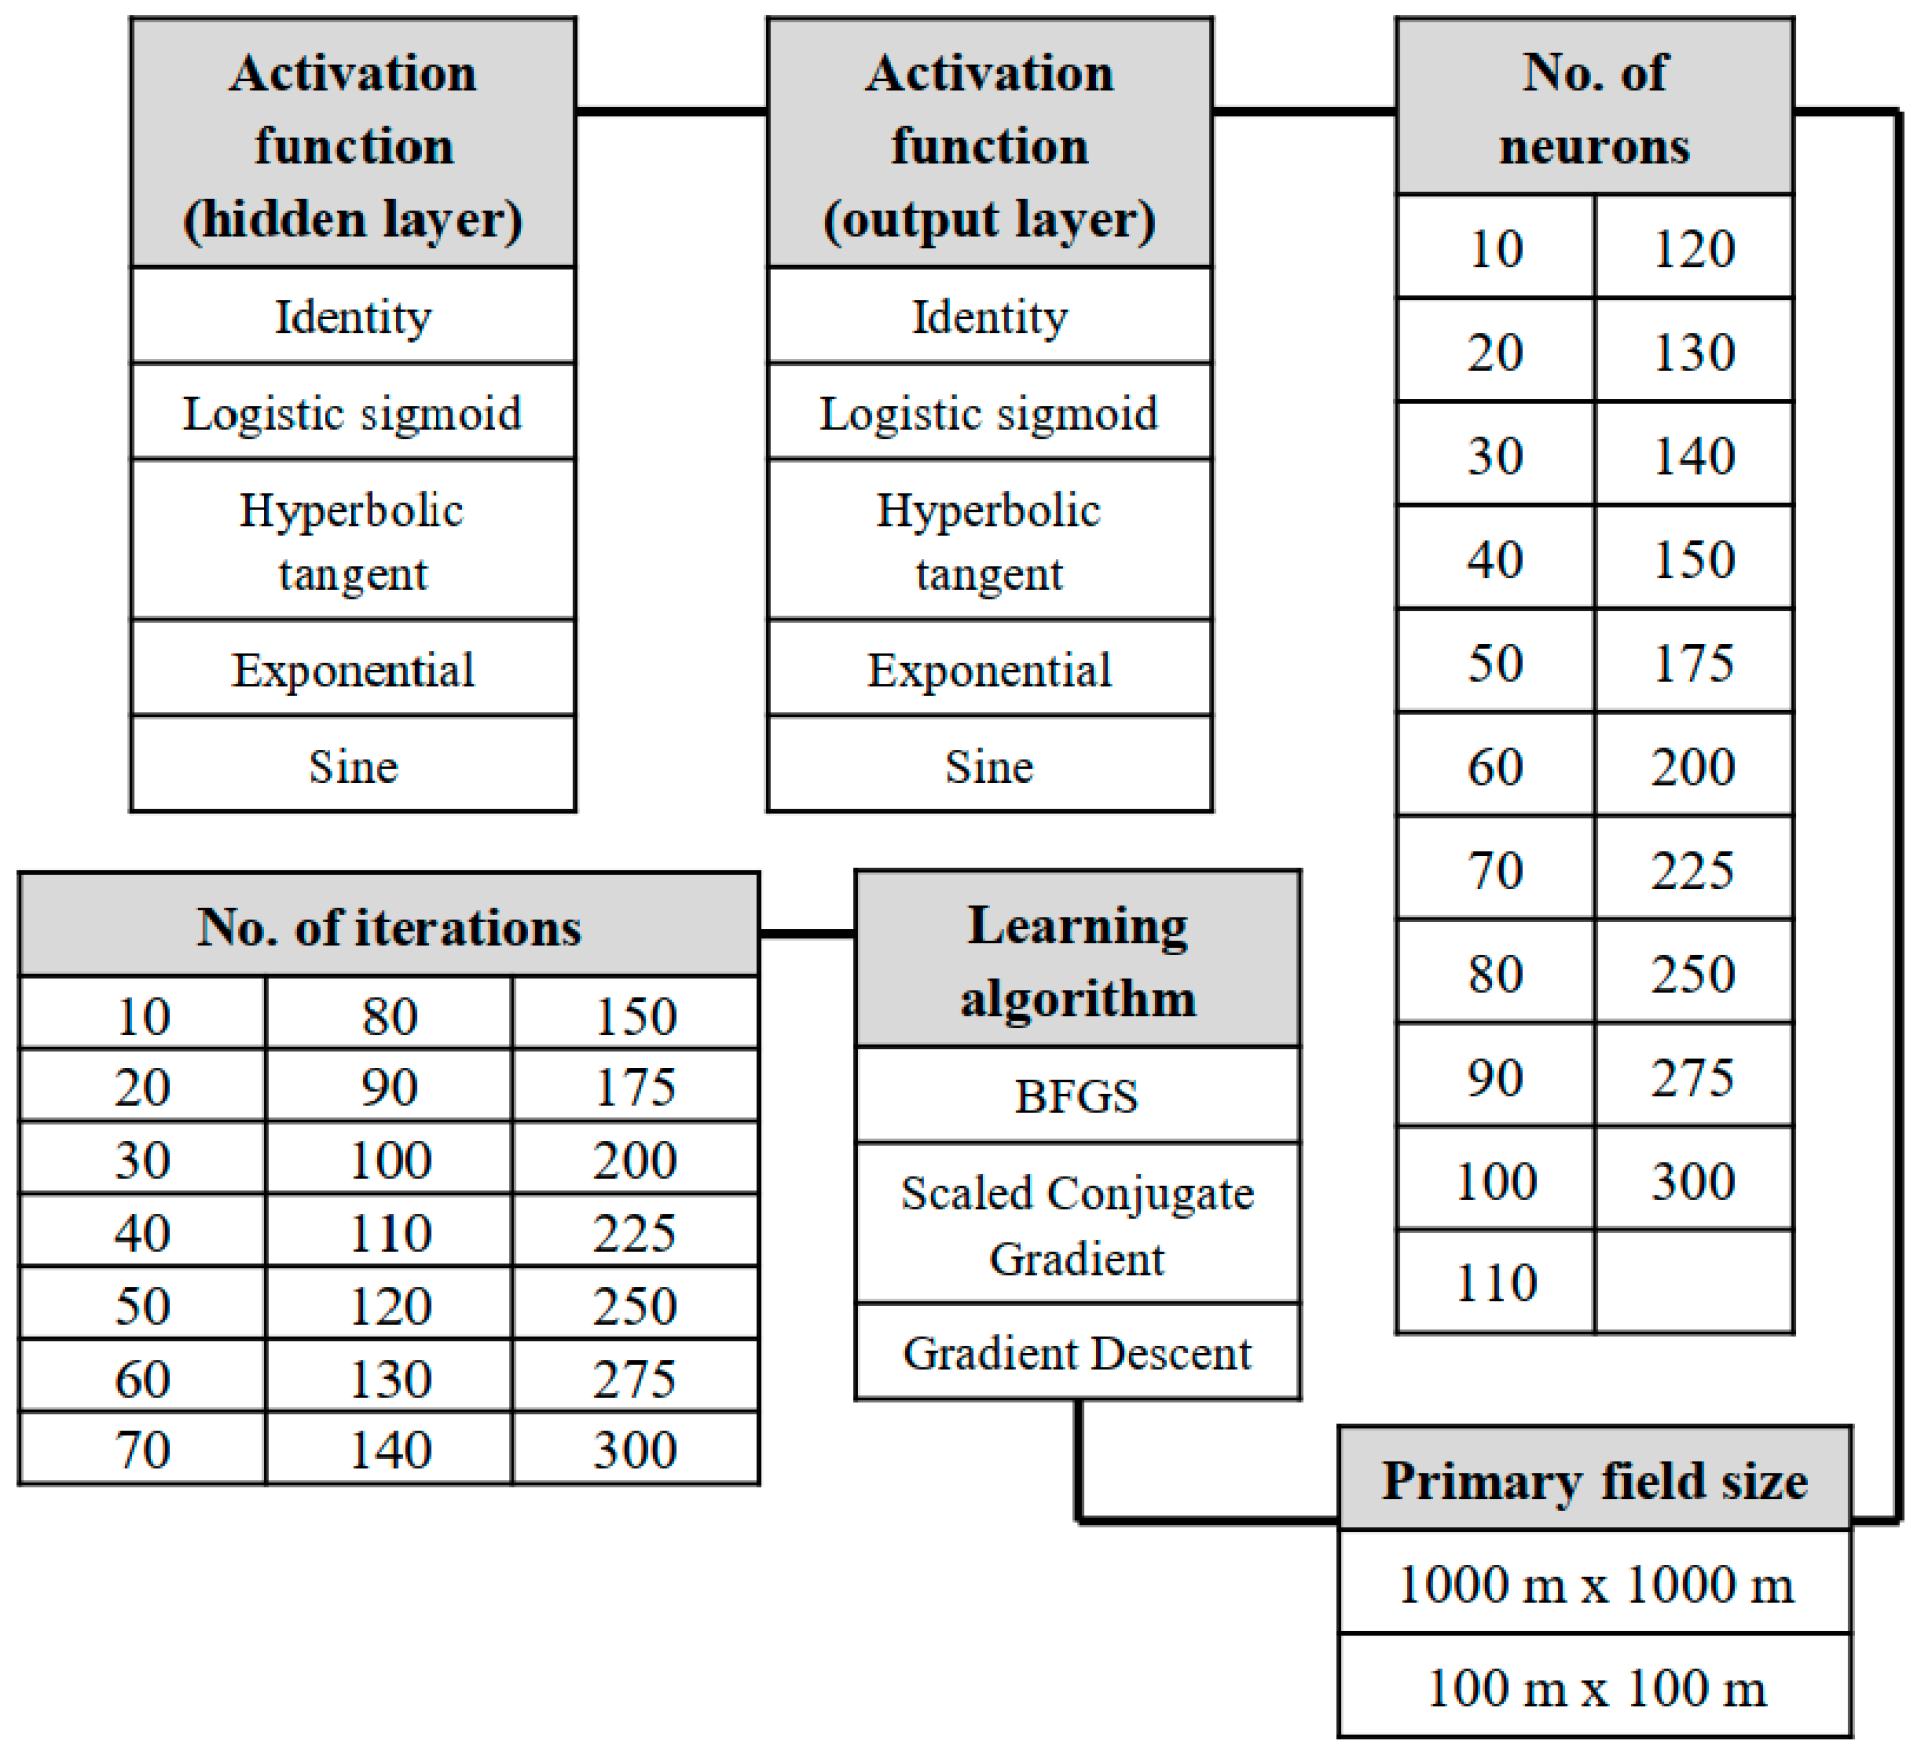
A key element for the effective operation of artificial neural networks was the appropriate selection of the network parameters. Therefore, the author generated over 66,000 neural networks in various parameter combinations. Operations related to data processing by neural networks were performed in the Statistica 12 software (networks have been generated using script written in Statistica Visual Basic). Tests were carried out using different numbers of neurons in the hidden layer (from 10 to 300) and various numbers of learning iterations (from 10 to 300). In order to determine the neuronal weights, supervised learning with a teacher method was used, according to three different algorithms [29]:
- Scaled Conjugate Gradient—it involves moving in the space of the searches towards points with decreasing error values to locate the minimum;
- Gradient descent—it is a fast learning algorithm for the multilayer perceptron that involves performing multiple linear searches in the weights space. Other directions of searches do not repeat. This is a good general algorithm with relatively fast convergence.
- Broyden–Fletcher–Goldfarb–Shanno (BFGS)—it is a strong second order algorithm with a fast convergence, but requires a large amount of computer memory.
Additionally, various combinations of the neuronal activation functions for the hidden and the output layers were used with the following functions: Linear, logistic, sine, hyperbolic tangent, and exponential (Figure 7).
3. Results and Discussion
To test the efficiency of the neural network learning algorithms, the average quality was determined, on the basis of the validation sample, for the neural networks generated using various learning algorithms (Table 2).
The highest mean validation quality was recorded using the Scaled Conjugate Gradient method. The BFGS method generated a slightly lower value, while teaching the network using the Gradient descent method gave significantly lower quality. Using the BFGS and Scaled Conjugate Gradient algorithms was consistent with the documentation of the software used for data processing in neural networks (Statistica), which recommends the use of this algorithm in teaching feedforward neural networks [28].
To verify the effectiveness of the activation functions used in the networks, the average quality for the validation sample was determined for all configurations of the activation functions used in the hidden and output layers. Calculations were made separately for both cell sizes (Table 3).
Table 3 shows that the mean quality values determined are very similar to each other. Clearer differences are evident when the Exponential function is used in the hidden layer, while the same function in the output layer gives the lowest quality. In all other cases, using the activation function has no significant effect on the received neural network quality, although in general the best results are obtained using the sine function.
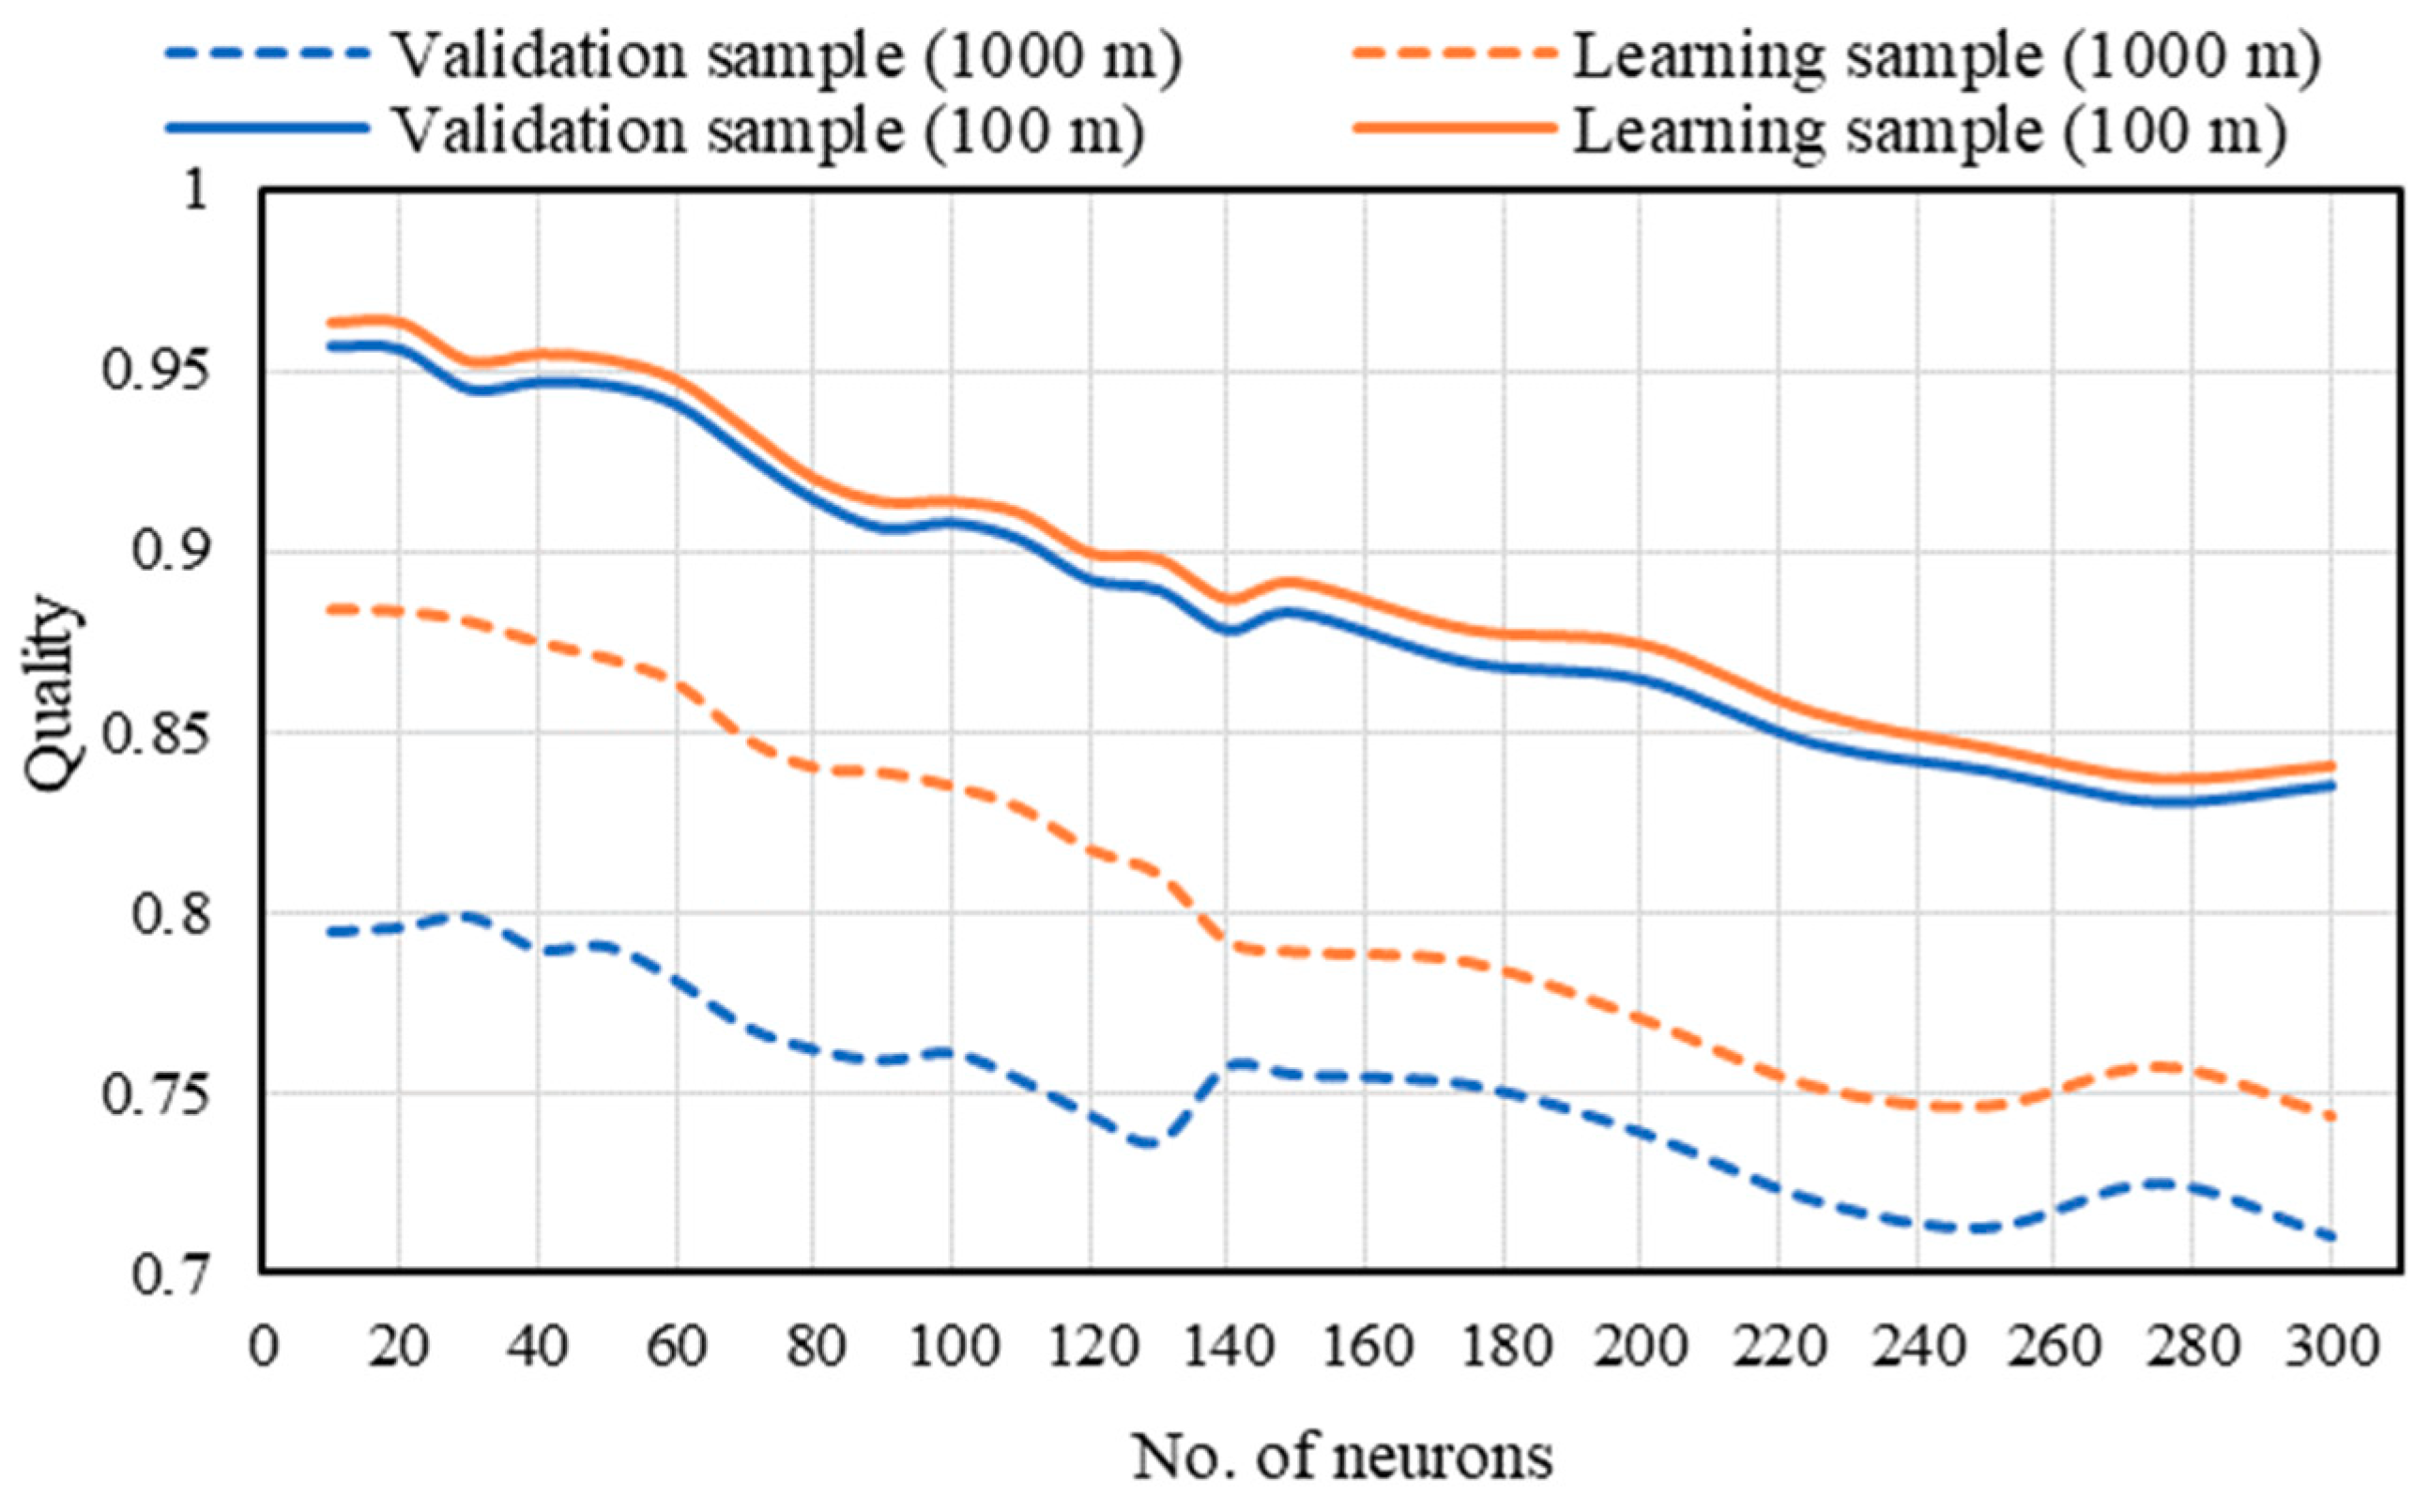
Figure 8 and Figure 9 present the effectiveness of the neural networks, expressed in terms of the model parameters. From Figure 8 it is clear that increasing the number of neurons in the hidden layer not only fails to give better network performance, but also decreases the quality of the validation sample. The highest quality generated was achieved for 20 to 40 neurons in the hidden layer.
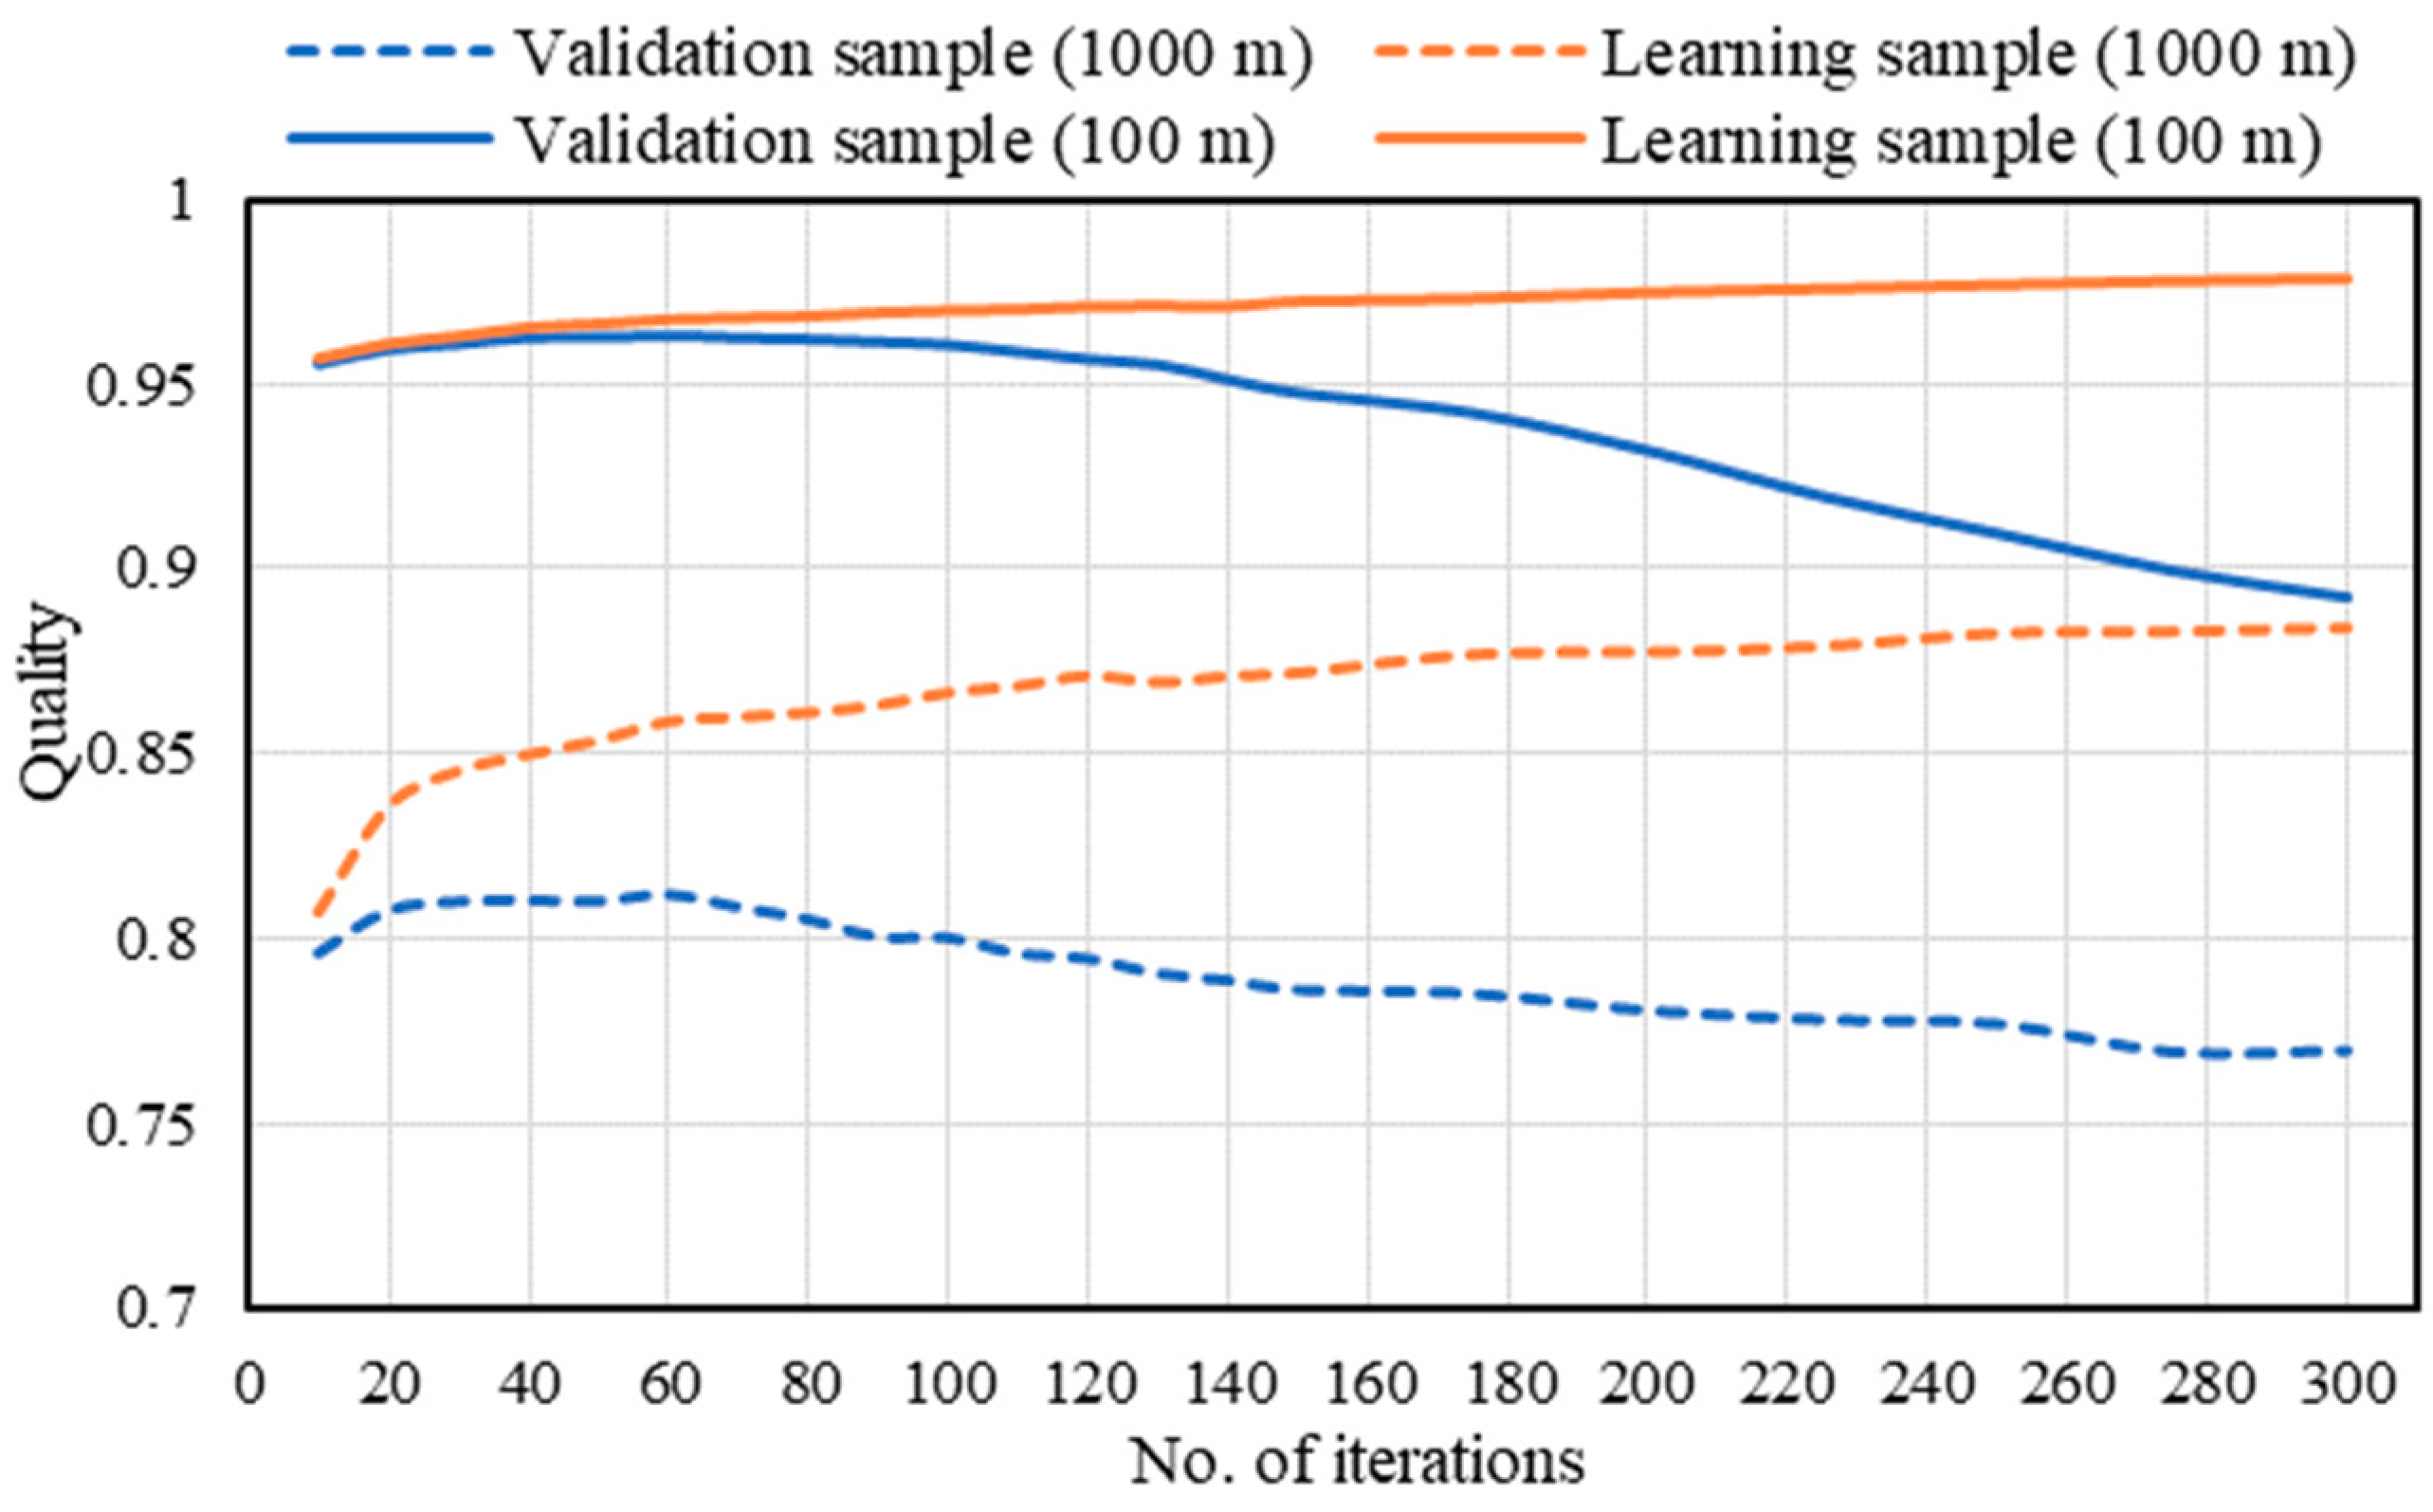
Figure 9 presents the results of the experiments on the number of learning iterations. It shows the dependence commonly found in research on feedforward neural networks [26]: Increasing the number of iterations increases the quality of the learning sample but decreases the quality of the validation sample. For the researched data set the highest value of validation sample was achieved for 20 to 60 learning iterations.
Both Figures (Figure 8 and Figure 9) clearly show that the value of quality for the 100 × 100 m primary field is significantly higher (up to approximately 0.95) than for the 1000 × 1000 m field (barely exceeding 0.8). This is because for the 100 × 100 m cell it is possible to determine the IOP more unambiguously than for larger primary fields, which contain more elements that negatively or positively influence passability. This increases noise, which hinders the learning of the neural networks.
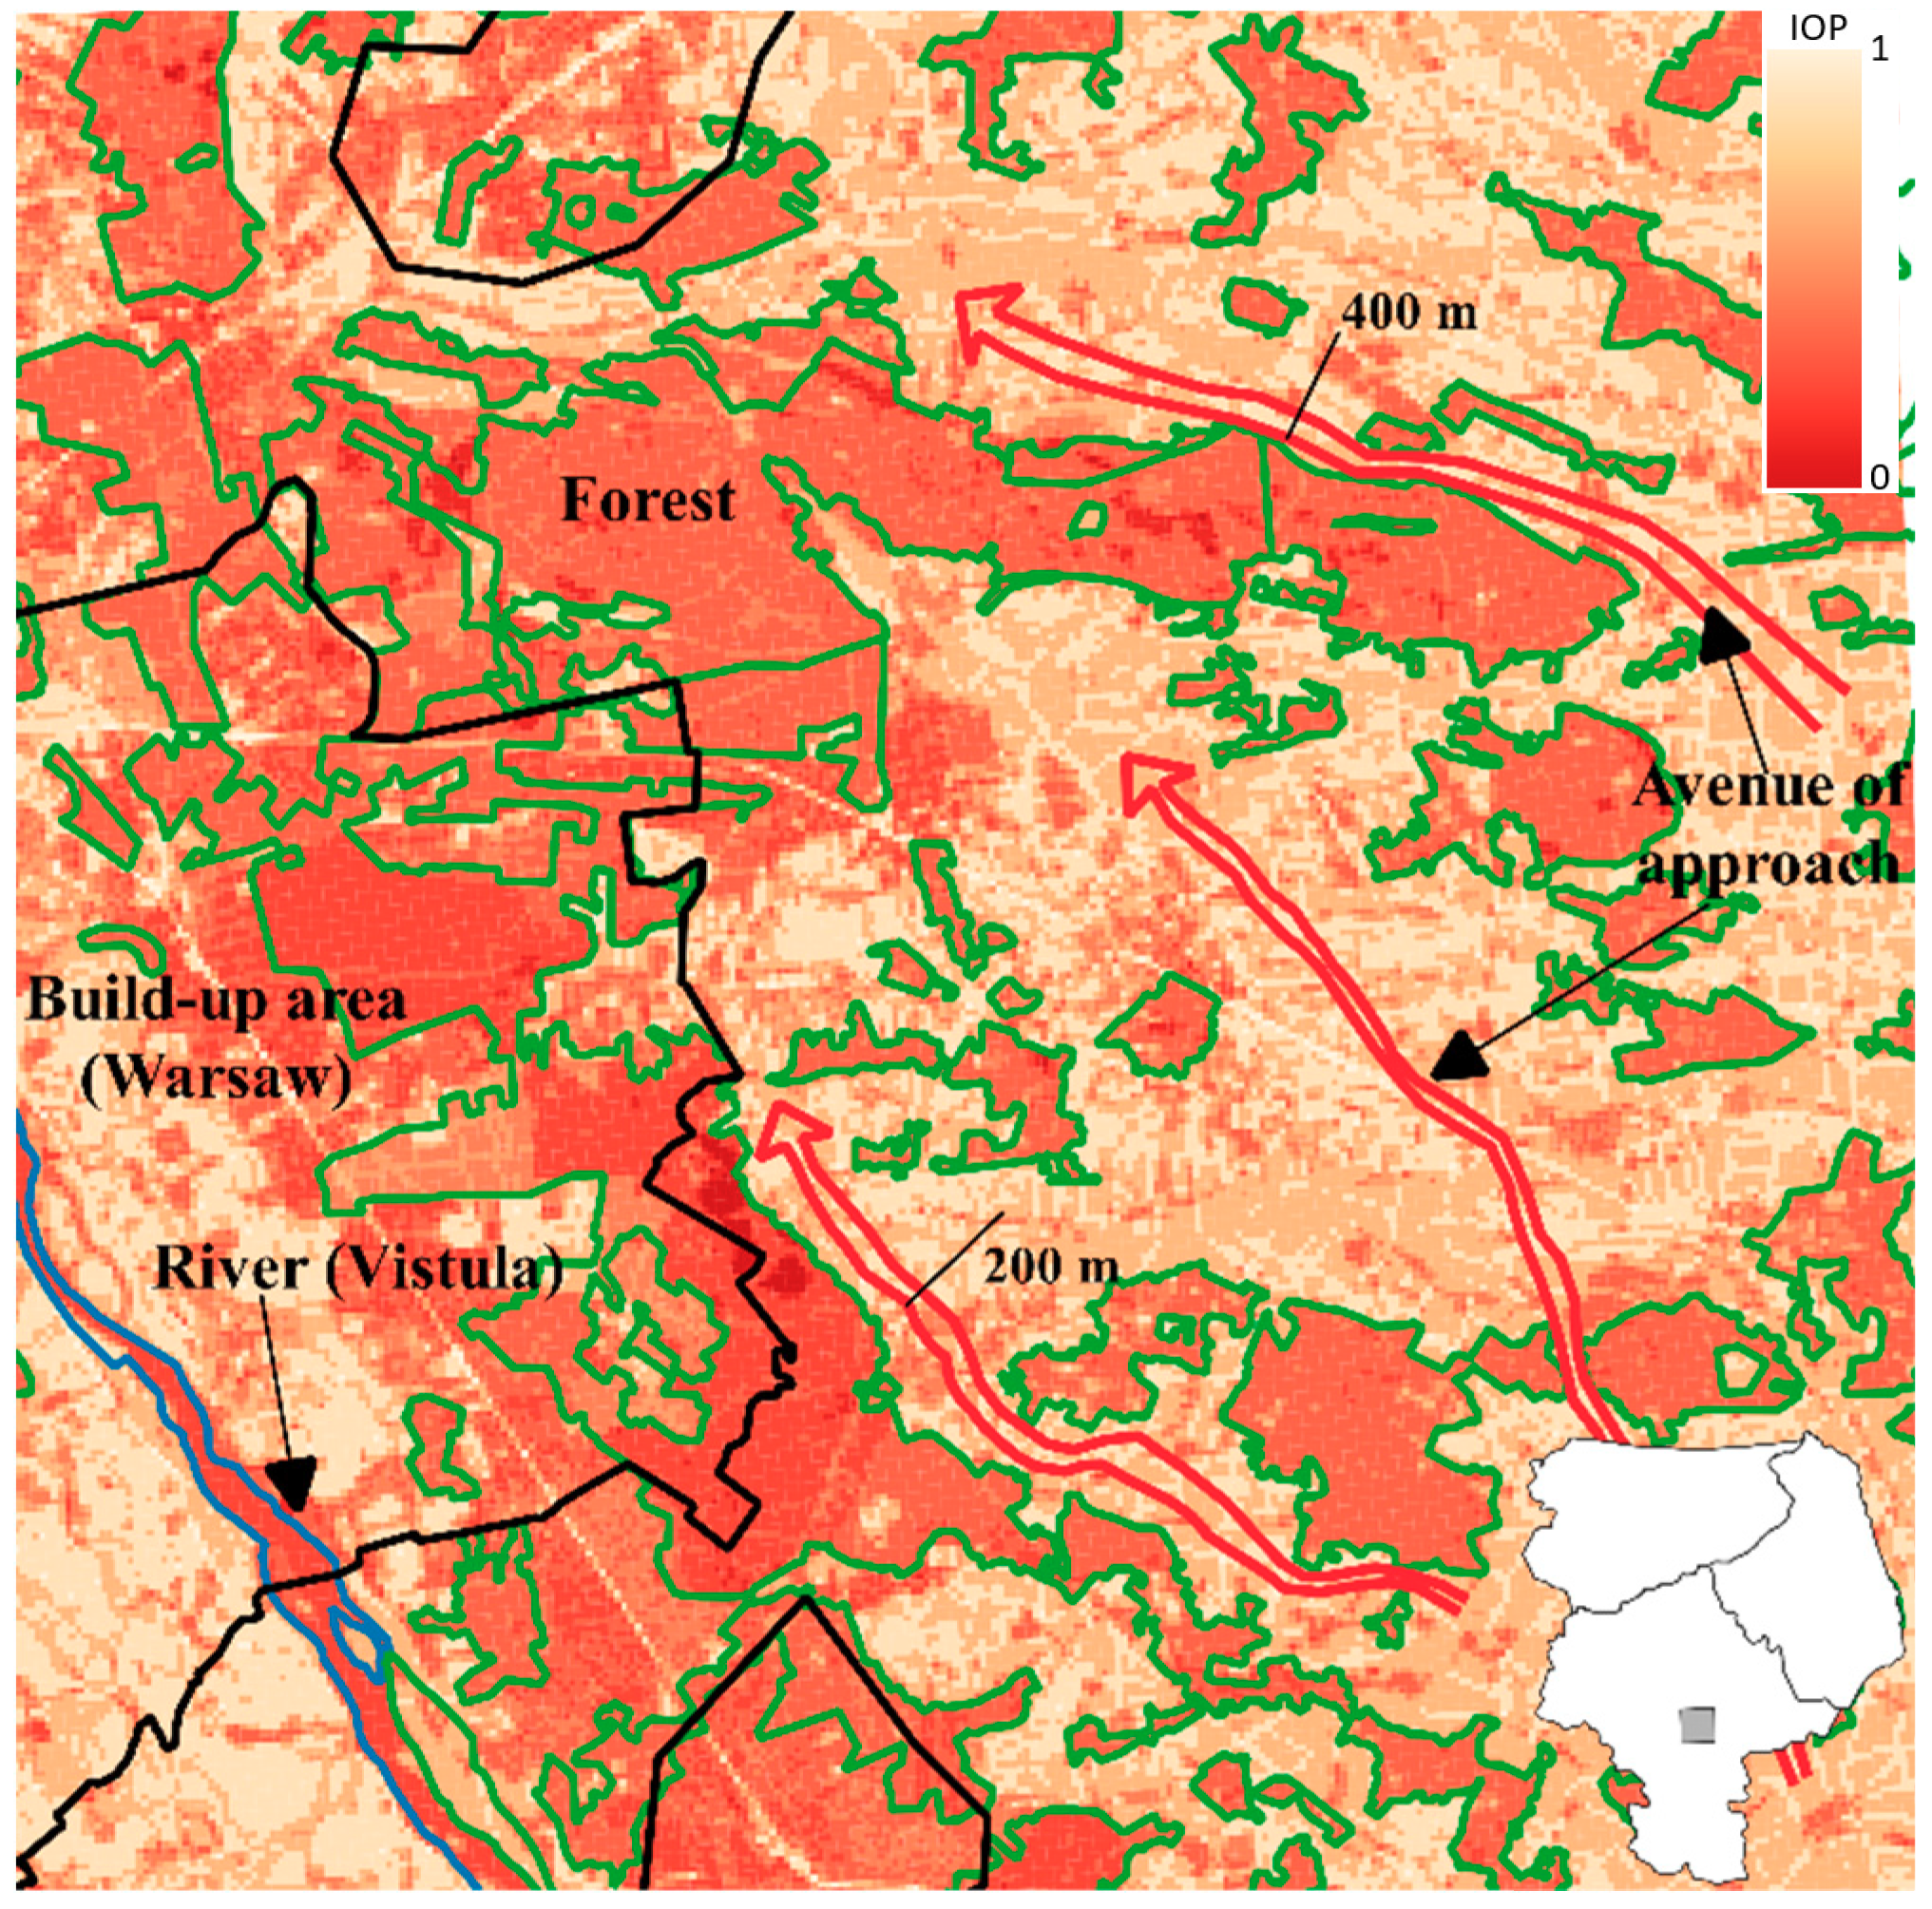
Figure 10 and Figure 11 present some of the passability maps of the considered area, with the application of the proposed methodology. The manually derived avenues of approach have also been marked on the passability maps. To generate these maps, the networks chosen were those with the highest quality of the validation sample.
The passability maps obtained using the two different sizes of primary field show the natural and artificial terrain obstacles that affect passability (e.g., forests, built-up areas and rivers). Large areas with a high Index of Passability (e.g., the western part of Warsaw in Figure 10) are also noticeable. The developed maps show the strict relationship between the size of the primary field and the detail of the generated maps. Those maps constructed with a primary field of 1000 × 1000 m, due to the high degree of generalization, allow the avenue of approach to be assigned with a minimum width of 2–3 km. This predisposes them to be used for planning at the operational level (brigade/division). The maps generated using cells of 100 × 100 m show smaller terrain obstacles and allow avenues to be drawn of 200 m and wider. This enables their use at lower command levels (platoon/company). This is also facilitated by the fact that these detailed maps contain roads, which are a key element taken into consideration during the analysis of passability at the tactical level.
4. Conclusions
This study presented the methodology of constructing maps of passability using ANN. The author investigated several neural network generation methods, indicating the optimal for this purpose. The average quality of the validation sample, after rejecting 5% of the networks with the highest error, was 0.80 for 1000 × 1000 m and 0.94 for 100 × 100 m primary fields. It should also be noted that the standard deviation of determined quality was 0.084 (1000 × 1000 m) and 0.058 (100 × 100 m), which represents approximately 10% and 5% of the average quality of the validation sample, respectively. The high similarity between the results is also demonstrated by the Pearson Correlation Coefficient, which was derived by comparing all the IOPs generated using networks of the highest and lowest validation sample quality (again, after rejecting 5% of the worst networks). The PCC was 0.914 for the 1000 × 1000 m and 0.972 for 100 × 100 m primary fields. This demonstrates a high similarity of the results generated by the networks with the highest and lowest errors.
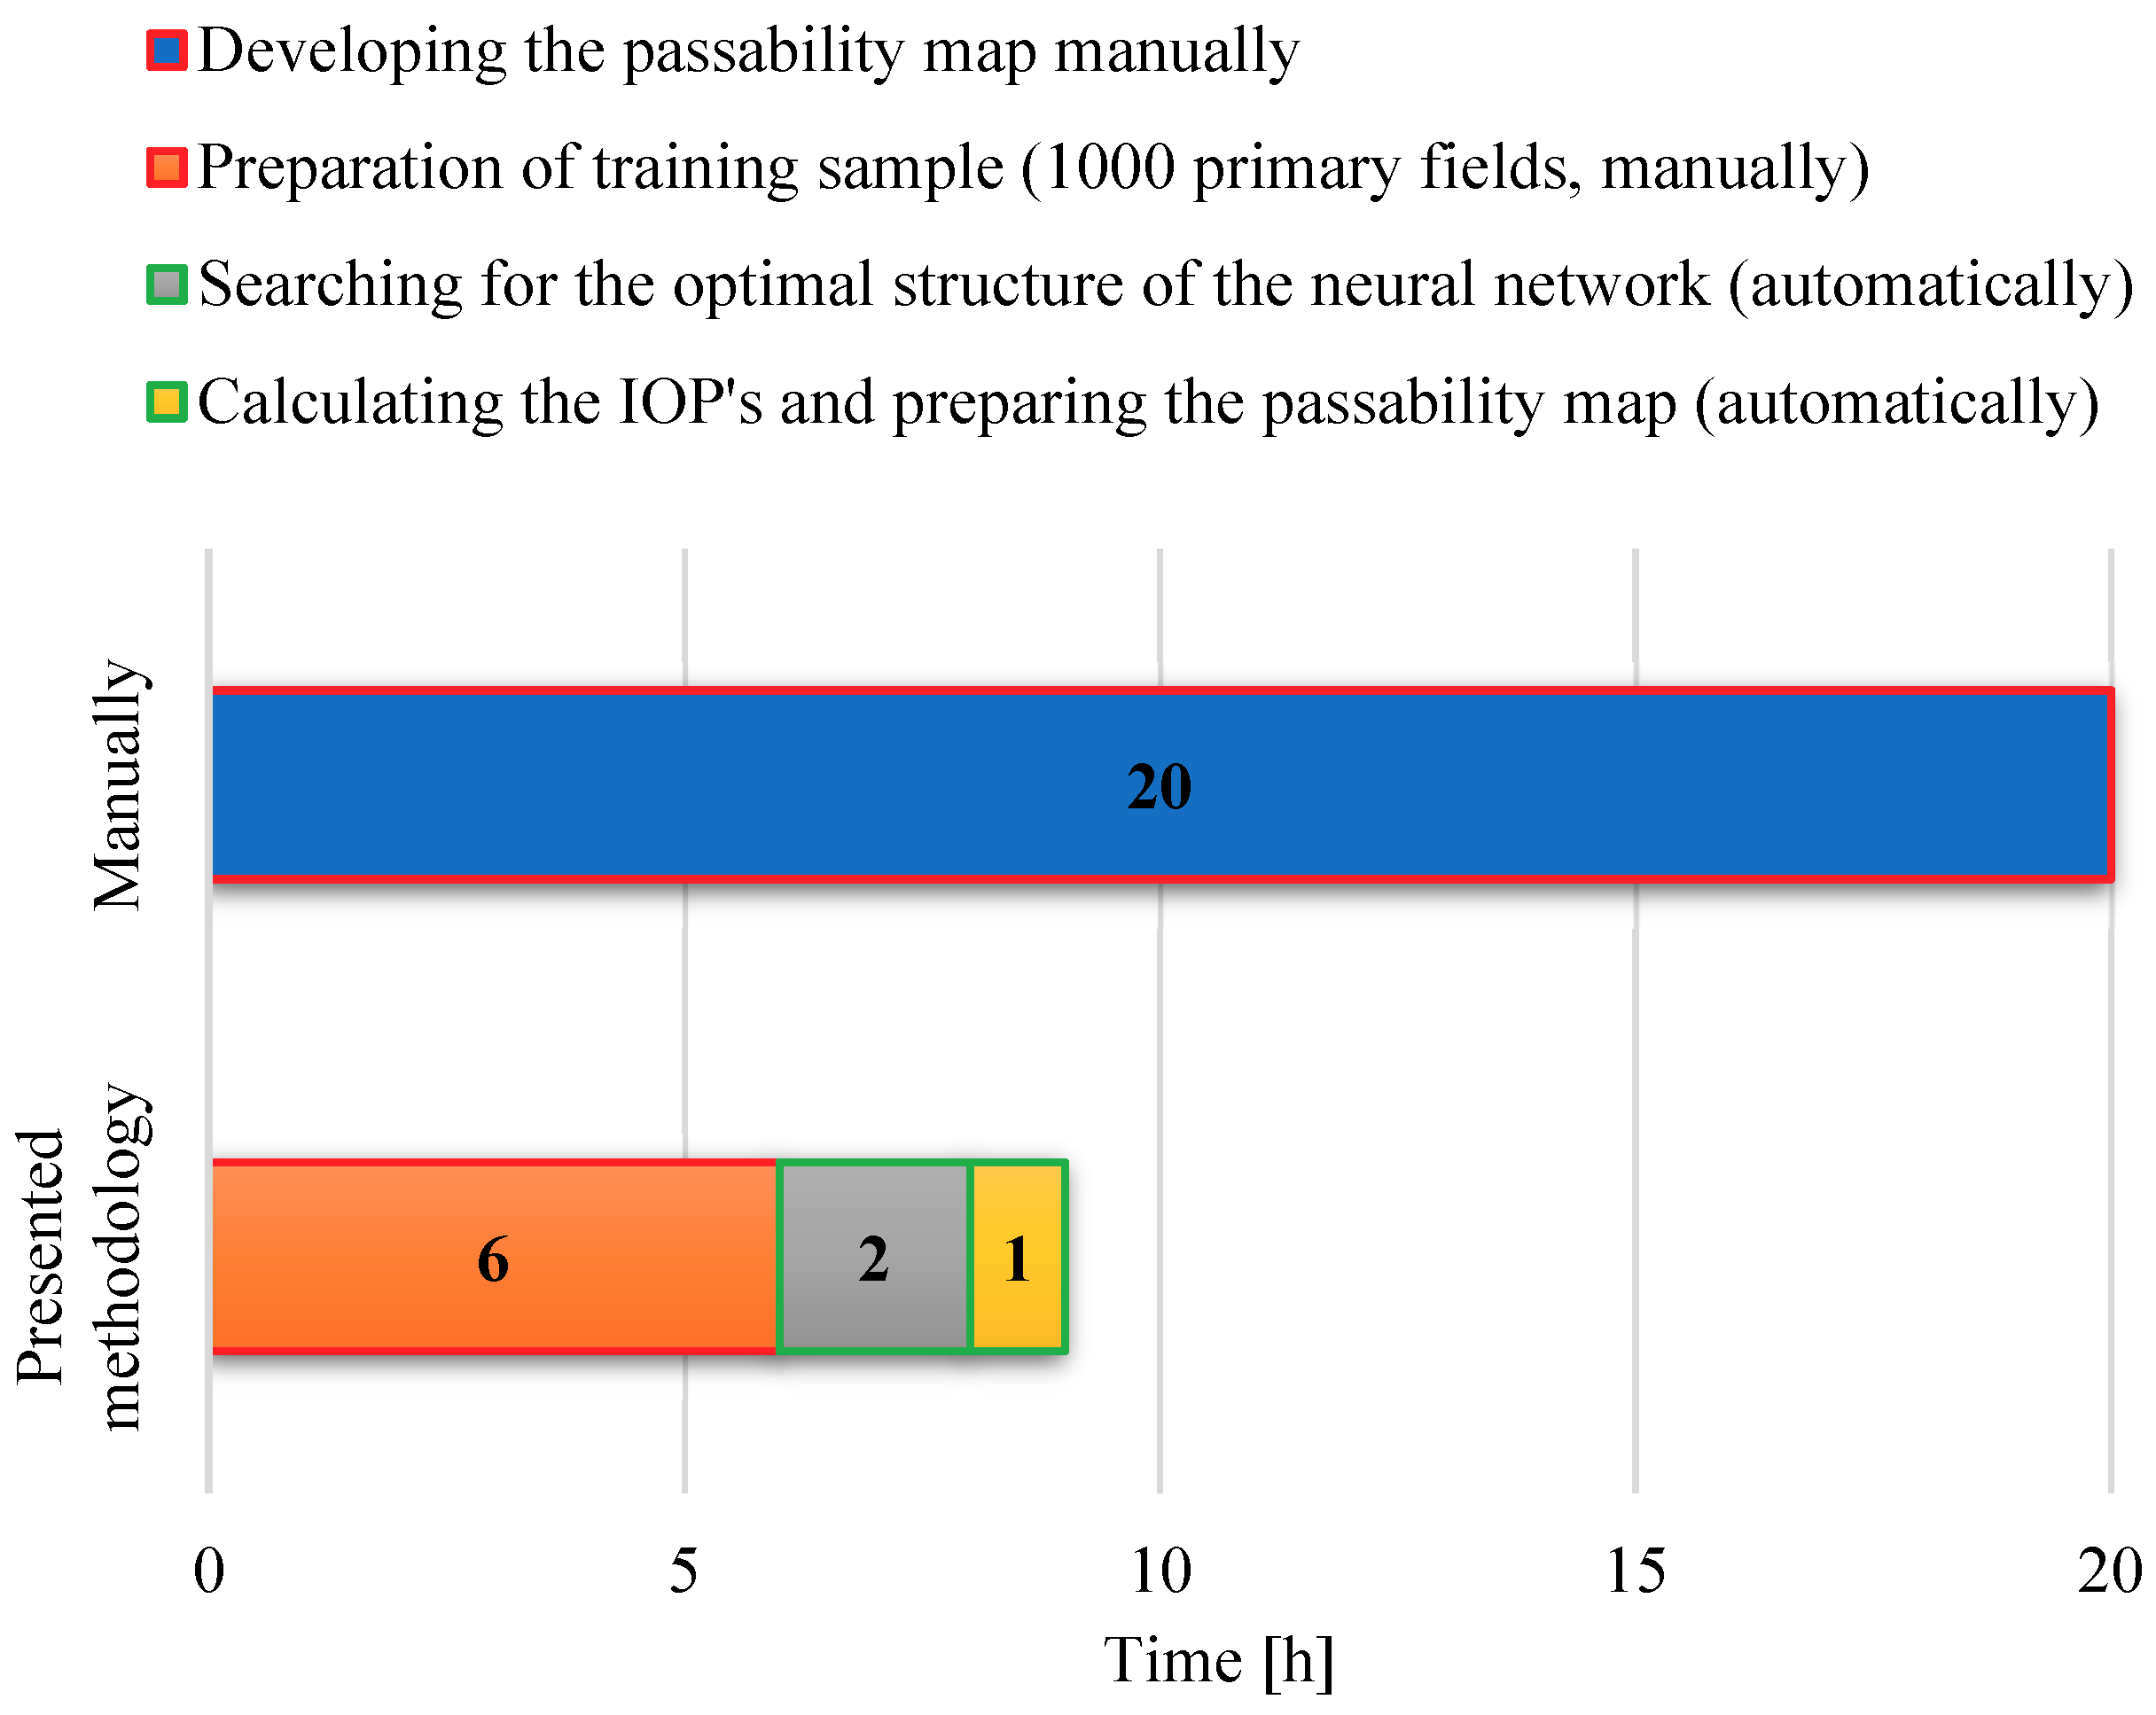
One of the greatest advantages of the presented methodology is the automation of the tedious process of developing a military passability map. The tests showed that the manual preparation of this type of map (for an area of 81,000 km2) requires about 20 h of work by an analyst. Making a map with the discussed methodology takes 9 h; however, for work that must be done manually, it is only necessary to prepare a training sample, which for 1000 primary fields takes about 6 h (Figure 12, marked in orange). The remaining work is carried out automatically.
The methodology presented in the article can be applied to any area. However, training data that takes into account the land cover elements for that specific area should be obtained. The training data prepared in the framework of this article cannot be used for desert, polar or tundra areas, for example, as such elements of land cover do not exist in North-Eastern Poland and are not included in the prepared training data set.
The proposed methodology is versatile and may be applied not only to the generation of passability maps for military use. If a set of parameters describing the land attributes is available for a primary field of any shape or size, and there is access to a sample of the expected values (results), this methodology may be used to classify terrain in a context completely unrelated to passability. An example of this is the research in Reference [30], in which the presented data model (as well as the perceptron) was used for the classification of the area in terms of the location of wind farms. Moreover, the various spatial data sources (e.g., Open Source data such as OpenStreetMap) may be introduced into the algorithm. They may be also extended by different elements, such as atmospheric conditions or information on soil type, which also may affect passability.
Funding
This study was supported by the Project under the Ministry of National Defence Republic of Poland Program—Research Grant no. GB/1/2018/205/2018/DA.
Acknowledgments
This research was performed on the basis of Vector Map Level 2, obtained from the Polish Military Directorate. The SRTM digital terrain models were obtained from NASA’s resources (http://www2.jpl.nasa.gov/srtm). The support of Prof. Janusz Bogusz and Prof. Albina Mościcka is gratefully acknowledged.
Conflicts of Interest
The author declares no conflict of interest. The founding sponsors had no role in the design of the study; in the collection, analyses, or interpretation of data; in the writing of the manuscript, and in the decision to publish the results.
References and Notes
- Doyle, P.; Bennett, M.R. Military Geography: The influence of terrain in the outcome of the Gallipoli Campaign, 1915. Geogr. J. 1999, 165, 12–36. [Google Scholar] [CrossRef]
- Maio, C.V.; Tenenbaum, D.E.; Brown, C.J.; Mastone, V.T.; Gontz, A.M. Application of geographic information technologies to historical landscape reconstruction and military terrain analysis of an American Revolution Battlefield: Preservation potential of historic lands in urbanized settings, Boston, Massachusetts, USA. J. Cult. Herit. 2013, 14, 317–331. [Google Scholar] [CrossRef]
- Rose, E.P.F.; Clatworthy, J.C. Terrain evaluation for allied military operations in Europe and the Far East during World War II: “secret” British reports and specialist maps generated by the Geological Section, Inter-Service Topographical Department. Q. J. Eng. Geol. Hydrogeol. 2008, 41, 237–256. [Google Scholar] [CrossRef]
- Field manual 5-33 Terrain Analysis 1990.
- STANAG 2259, ed. 4: Military Geographic Documentation—Terrain 1975.
- STANAG 3992, ed. 2: Military Geographic Documentation—Terrain Analysis AgeoP-1 (A) 1999.
- NO-06-A015:2012, Terrain—Rules of classification—Terrain analysis on operational level 2012.
- Rybansky, M. Effect of the Geographic Factors on the Cross Country Movement during Military Operations and the Natural Disasters. In Proceedings of the 21st International Cartographic Conference (ICC), Durban, South Africa, 10–16 August 2003. [Google Scholar]
- Hubacek, M.; Ceplova, L.; Brenova, M.; Mikita, T.; Zerzan, P. Analysis of vehicle movement possibilities in terrain covered by vegetation. In Proceedings of the International Conference on Military Technologies (ICMT), Brno, Czech Republic, 19–21 May 2015. [Google Scholar] [CrossRef]
- Hofmann, A.; Hošková-Mayerová, Š.; Talhofer, V.; Kovařík, V. Creation of models for calculation of coefficients of terrain passability. Qual. Quant. 2014, 49, 1679–1691. [Google Scholar] [CrossRef]
- Pokonieczny, K.; Wyszyński, M. Automation of the terrain assessment classification due to passability for the needs of crisis managment. In Proceedings of the 16th International Multidisciplinary Scientific GeoConference SGEM, Albena, Bulgaria, 28 June–7 July 2016; Book2 Volume 3. pp. 119–126. [Google Scholar] [CrossRef]
- Shoop, S.; Knuth, M.; Wieder, W. Measuring vehicle impacts on snow roads. J. Terramech. 2013, 50, 63–71. [Google Scholar] [CrossRef]
- Mason, G.L.; Gates, B.Q.; Moore, V.D. Determining forces required to override obstacles for ground vehicles. J. Terramech. 2012, 49, 191–196. [Google Scholar] [CrossRef] [Green Version]
- Rybansky, M.; Hofmann, A.; Hubacek, M.; Kovarik, V.; Talhofer, V. Modelling of cross-country transport in raster format. Environ. Earth Sci. 2015, 74, 7049–7058. [Google Scholar] [CrossRef]
- Vatsavai, R.R.; Bhaduri, B. A hybrid classification scheme for mining multisource geospatial data. Geoinformatica 2010, 15, 29–47. [Google Scholar] [CrossRef]
- Iwaniak, A.; Olszewski, R.; Paluszynski, W. A comparison of urban area aggregation in satellite images using neural networks, cellular automata and median filtration. In Proceedings of the 21st International Cartographic Conference (ICC), Durban, South Africa, 10–16 August 2003. [Google Scholar]
- Grebby, S.; Naden, J.; Cunningham, D.; Tansey, K. Integrating airborne multispectral imagery and airborne LiDAR data for enhanced lithological mapping in vegetated terrain. Remote Sens. Environ. 2011, 115, 214–226. [Google Scholar] [CrossRef] [Green Version]
- Pokonieczny, K. Methods of Using Self-organising Maps for Terrain Classification, Using an Example of Developing a Military Passability Map. In Dynamics in GIscience, Lecture Notes in Geoinformation and Cartography, Proceedings of the GIS Ostrava 2017, Ostrava, Czech Republic, 22–24 March 2017; Ivan, I., Horák, J., Inspektor, T., Eds.; Springer: Berlin/Heidelberg, Germany, 2017; pp. 359–371. [Google Scholar] [CrossRef]
- Lee, S.; An, H.; Yu, S.; Oh, J.J. Creating an advanced backpropagation neural network toolbox within GIS software. Environ. Earth Sci. 2014, 72, 3111–3128. [Google Scholar] [CrossRef]
- Elak, L.; Śliwa, Z. The Suwalki gap—NATO’s fragile hot spot. Zeszyty Naukowe AON 2016, 103, 24–40. [Google Scholar]
- Farr, T.G.; Rosen, P.A.; Caro, E.; Crippen, R.; Duren, R.; Hensley, S.; Kobrick, M.; Paller, M.; Rodriguez, E.; Roth, L.; et al. The Shuttle Radar Topography Mission. Rev. Geophys. 2007, 45. [Google Scholar] [CrossRef] [Green Version]
- Military specification MIL-V-89032 Vector Smart Map (VMAP) Level 2 1993.
- STANAG 7074, ed. 2: Digital Geographic Information Exchange Standard (DIGEST) 1998.
- Pokonieczny, K. Automatic military passability map generation system. In Proceedings of the International Conference on Military Technologies (ICMT), Brno, Czech Republic, 31 May–2 June 2017; pp. 285–292. [Google Scholar] [CrossRef]
- Pokonieczny, K.; Mościcka, A. The Influence of the Shape and Size of the Cell on Developing Military Passability Maps. ISPRS Int. J. Geo-Inf. 2018, 7, 261. [Google Scholar] [CrossRef]
- Suzuki, K. Artificial Neural Networks—Architectures and Applications; InTech: Vienna, Austria, 2013; ISBN 978-953-51-0935-8. [Google Scholar]
- McCulloch, W.S.; Pitts, W. A logical calculus of the ideas immanent in nervous activity. Bull. Math. Biophys. 1943, 5, 115–133. [Google Scholar] [CrossRef]
- STATISTICA Help. SANN Overviews—Network Training. Available online: http://documentation.statsoft.com/STATISTICAHelp.aspx?path=SANN/Overview/SANNOverviewsTrainingofNeuralNetowrks (accessed on 10 August 2017).
- Bishop, C.M. Neural Networks for Pattern Recognition; Oxford University Press, Inc.: New York, NY, USA, 1995; ISBN 0-19-853864-2. [Google Scholar]
- Pokonieczny, K. Using artificial neural networks to determine the location of wind farms. Miedzna district case study. J. Water Land Dev. 2016, 30, 101–111. [Google Scholar] [CrossRef] [Green Version]
Figure 1.
The study area.

Figure 2.
Thematic categories and feature classes in VMap Level 2 (A: Area, L: Line, P: Point object) [23].
Figure 2.
Thematic categories and feature classes in VMap Level 2 (A: Area, L: Line, P: Point object) [23].

Figure 3.
Example of gathering land cover element data for a 1000 × 1000 m grid.

Figure 4.
Example of a vector model conversion to a grid for the built-up area feature class.

Figure 5.
McCulloch and Pitts artificial neuron model [27].
Figure 5.
McCulloch and Pitts artificial neuron model [27].

Figure 6.
Structure of used neural network.

Figure 7.
Configuration of parameters taken into account when generating artificial neural networks.
Figure 7.
Configuration of parameters taken into account when generating artificial neural networks.

Figure 8.
Average quality of the validation sample based on the number of neurons in the hidden layer for two sizes of primary field.
Figure 8.
Average quality of the validation sample based on the number of neurons in the hidden layer for two sizes of primary field.

Figure 9.
Average quality of the validation sample based on the number of learning iterations for two sizes of primary field.
Figure 9.
Average quality of the validation sample based on the number of learning iterations for two sizes of primary field.

Figure 10.
Part of a passability map generated using a primary field of 1000 × 1000 m with avenues of approach and the most significant elements of land cover.
Figure 10.
Part of a passability map generated using a primary field of 1000 × 1000 m with avenues of approach and the most significant elements of land cover.

Figure 11.
Part of a passability map generated using a primary field of 100 × 100 m with avenues of approach and the most significant elements of land cover.
Figure 11.
Part of a passability map generated using a primary field of 100 × 100 m with avenues of approach and the most significant elements of land cover.

Figure 12.
Comparison of map generation time.


Table 1.
Sample values of Index of Passability (IOP) assigned manually by the operator for primary fields 1000 m and 100 m square.
Table 1.
Sample values of Index of Passability (IOP) assigned manually by the operator for primary fields 1000 m and 100 m square.
| 1000 × 1000 m Primary Field | ||
 |  |  |
| IOP = 0.1 | IOP = 0.4 | IOP = 0.7 |
| 100 × 100 m Primary Field | ||
 | ||
Table 2.
Average quality of the validation sample determined for the learning neural networks with the use of each of the three algorithms applied, in two sizes of primary field.
Table 2.
Average quality of the validation sample determined for the learning neural networks with the use of each of the three algorithms applied, in two sizes of primary field.
| 1000 × 1000 m | 100 × 100 m | |||
|---|---|---|---|---|
| Algorithm Name | Quality (validation) | Quality (Learning) | Quality (Validation) | Quality (Learning) |
| Scaled Conjugate Gradient | 0.822 | 0.865 | 0.957 | 0.960 |
| Gradient descent | 0.796 | 0.831 | 0.915 | 0.919 |
| BFGS | 0.766 | 0.893 | 0.948 | 0.969 |
Table 3.
Average quality of the validation sample of the network depending on the activation function used (H: Function for hidden, O: Output layer).
Table 3.
Average quality of the validation sample of the network depending on the activation function used (H: Function for hidden, O: Output layer).
| 1000 × 1000 m | |||||
|---|---|---|---|---|---|
| Logistic (O) | Tanh (O) | Exponential (O) | Identity (O) | Sine (O) | |
| Logistic (H) | 0.79 | 0.79 | 0.75 | 0.75 | 0.81 |
| Tanh (H) | 0.79 | 0.79 | 0.79 | 0.80 | 0.83 |
| Exponential (H) | 0.79 | 0.74 | 0.69 | 0.70 | 0.78 |
| Identity (H) | 0.83 | 0.82 | 0.83 | 0.83 | 0.83 |
| Sine (H) | 0.83 | 0.82 | 0.83 | 0.83 | 0.83 |
| 100 × 100 m | |||||
| Logistic (H) | 0.96 | 0.95 | 0.95 | 0.90 | 0.95 |
| Tanh (H) | 0.96 | 0.96 | 0.96 | 0.96 | 0.96 |
| Exponential (H) | 0.96 | 0.83 | 0.93 | 0.85 | 0.91 |
| Identity (H) | 0.96 | 0.95 | 0.96 | 0.96 | 0.95 |
| Sine (H) | 0.96 | 0.95 | 0.96 | 0.96 | 0.96 |
© 2018 by the author. Licensee MDPI, Basel, Switzerland. This article is an open access article distributed under the terms and conditions of the Creative Commons Attribution (CC BY) license (http://creativecommons.org/licenses/by/4.0/).
Share and Cite
MDPI and ACS Style
Pokonieczny, K. Use of a Multilayer Perceptron to Automate Terrain Assessment for the Needs of the Armed Forces. ISPRS Int. J. Geo-Inf. 2018, 7, 430. https://0-doi-org.brum.beds.ac.uk/10.3390/ijgi7110430
AMA Style
Pokonieczny K. Use of a Multilayer Perceptron to Automate Terrain Assessment for the Needs of the Armed Forces. ISPRS International Journal of Geo-Information. 2018; 7(11):430. https://0-doi-org.brum.beds.ac.uk/10.3390/ijgi7110430
Chicago/Turabian StylePokonieczny, Krzysztof. 2018. "Use of a Multilayer Perceptron to Automate Terrain Assessment for the Needs of the Armed Forces" ISPRS International Journal of Geo-Information 7, no. 11: 430. https://0-doi-org.brum.beds.ac.uk/10.3390/ijgi7110430
Note that from the first issue of 2016, this journal uses article numbers instead of page numbers. See further details here.