Estimation of Hourly Link Population and Flow Directions from Mobile CDR


1
Human Centered Urban Informatics, Institute of Industrial Science, The University of Tokyo, Tokyo 153-8505, Japan
2
Remote Sensing of Environment and Disaster, Institute of Industrial Science, The University of Tokyo, Tokyo 153-8505, Japan
*
Author to whom correspondence should be addressed.
ISPRS Int. J. Geo-Inf. 2018, 7(11), 449; https://0-doi-org.brum.beds.ac.uk/10.3390/ijgi7110449
Submission received: 27 September 2018
/
Revised: 7 November 2018
/
Accepted: 14 November 2018
/
Published: 17 November 2018
Abstract
:The rise in big data applications in urban planning and transport management is now widening and becoming a part of local government decision-making processes. Understanding people flow inside the city helps urban and transport planners build a healthy and lively city. Many flow maps are based on origin-and-destination points with crossing lines, which reduce the map’s readability and overall appearance. Today, with the emergence of geolocation-enabled handheld devices with wireless communication and networking capabilities, human mobility and the resulting events can be captured and stored as text-based geospatial big data. In this paper, we used one-week mobile-call-detail records (CDR) and a GIS road network model to estimate hourly link population and flow directions, based on mobile-call activities of origin–destination pairs with a shortest-path analysis for the whole city. Moreover, to gain the actual population size from the number of mobile-call users, we introduced a home-based magnification factor (h-MF) by integrating with the national census. Therefore, the final output link data have both magnitude (actual population) and flow direction at one-hour intervals between 06:00 and 21:00. The hourly link population and flow direction dataset are intended to optimize bus routes, solve traffic congestion problems, and enhance disaster and emergency preparedness.
1. Introduction
Information on human mobility (both magnitude and direction) inside the city is important in urban and transport planning, such as bus route planning and optimization [1], trip frequency scheduling [2], transportation modes prediction [3], traffic congestion management [4], public facility management, and disaster and emergency preparedness [5], in order to build a healthy and lively city. Today, big data applications in urban planning and transport management are widening and are becoming part of local government decision-making processes. Traditional ways of acquiring people flow inside the city are paper-based travel surveys or other transport statistics, which are expensive and labor intensive. Today, human mobility and activities can be tracked using mobile phone call activities (call-detail record, CDR), internet usage, and other social interacting events through online social networks (OSN) and other wireless sensor networks (WSNs). Although CDR has some limitation on data acquisition because of privacy protection, CDR is one means to identify the mass movement of people inside a city or across the country inexpensively and time-effectively. CDR data have been used by many researchers for origin–destination trip generation [6,7,8,9,10,11], travel behavior analysis [12,13,14], social interaction [15,16], urban analysis [17], and population estimation [18,19].
Generally, traffic-count information is acquired from observed data, such as traffic-count surveys, electronic toll collection (ETC), and gates and other roadside sensors. Many researchers attempt to estimate link flow from observed data [20], trip questionnaire surveys, and traffic-count survey data [21], and generate origin-and-destination (OD) matrices from automatic vehicle identification data [22]. Moreover, CDR data have been used for road usage and link traffic volume, and OD flow estimation [23,24,25]. In general, traffic flow measurements include not only vehicles but also travelers by measurement of their speed, direction, and magnitude at specific intersections and in specific lanes.
From a cartographic point of view in GIS, many flow-mapping algorithms and methods have been developed for visualization of either location-based flow maps (i.e., migration flow, commodity flow, flight paths, etc.) or non-spatial flow maps (i.e., Sankey diagrams, Chord diagrams, thermal flow diagrams, system flow diagrams, etc.) [26,27,28]. Flow maps can be represented as many-to-many (many origins to many destinations) or one-to-many (one origin to many destinations) in visualization methods. Many flow-mapping approaches use OD or source and target locations, which do not convey detailed movement patterns along the flow path. Moreover, many flow maps have some problems in readability and overall appearance because of crossing lines on the map. Within the scope of interactive mapping (i.e., digital cartography or Web-GIS), many paper-based cartographic problems can be overcome by means of setting visibility map scales of individual features and symbols or by adjusting the placement and orientation of labels by preventing them from overlapping with each other.
In this study, we estimate the link population (magnitude) and direction from one-week of CDR data to map people-flow patterns for the whole city at one-hour intervals. The main objective of the paper is to use mobile CDR data to estimate hourly link population and their flow direction at a regional scale to use in future urban and transportation planning processes. This paper is organized as follows. First, we list the data used in this study and describe the study area. Second, we explain our data-handling steps for CDR data preprocessing, home-based magnification factor computing, and generation of hourly link population and flow directions. Finally, we discuss the results and validation procedure.
2. Study Area
The study area is greater Yangon city, a major business center of Myanmar located in Southeast Asia. Every day, approximately six million commuters are moving in the city. In 2014, the population of Yangon Division was 7,360,703 and the urban population was 5,160,512 [29] (Figure 1). Yangon city has a major development plan to improve the current public bus system and many housing projects, including new urban mass rapid transit lines into central Yangon [30].
3. List of Data
Myanma Posts and Telecommunications’ (MPT) call-detail record data were used in this study, along with census and road network data. Table 1 shows the list of data, sources, attribute information, and the purpose of its use in the study.
4. Methodology
4.1. Research Flow
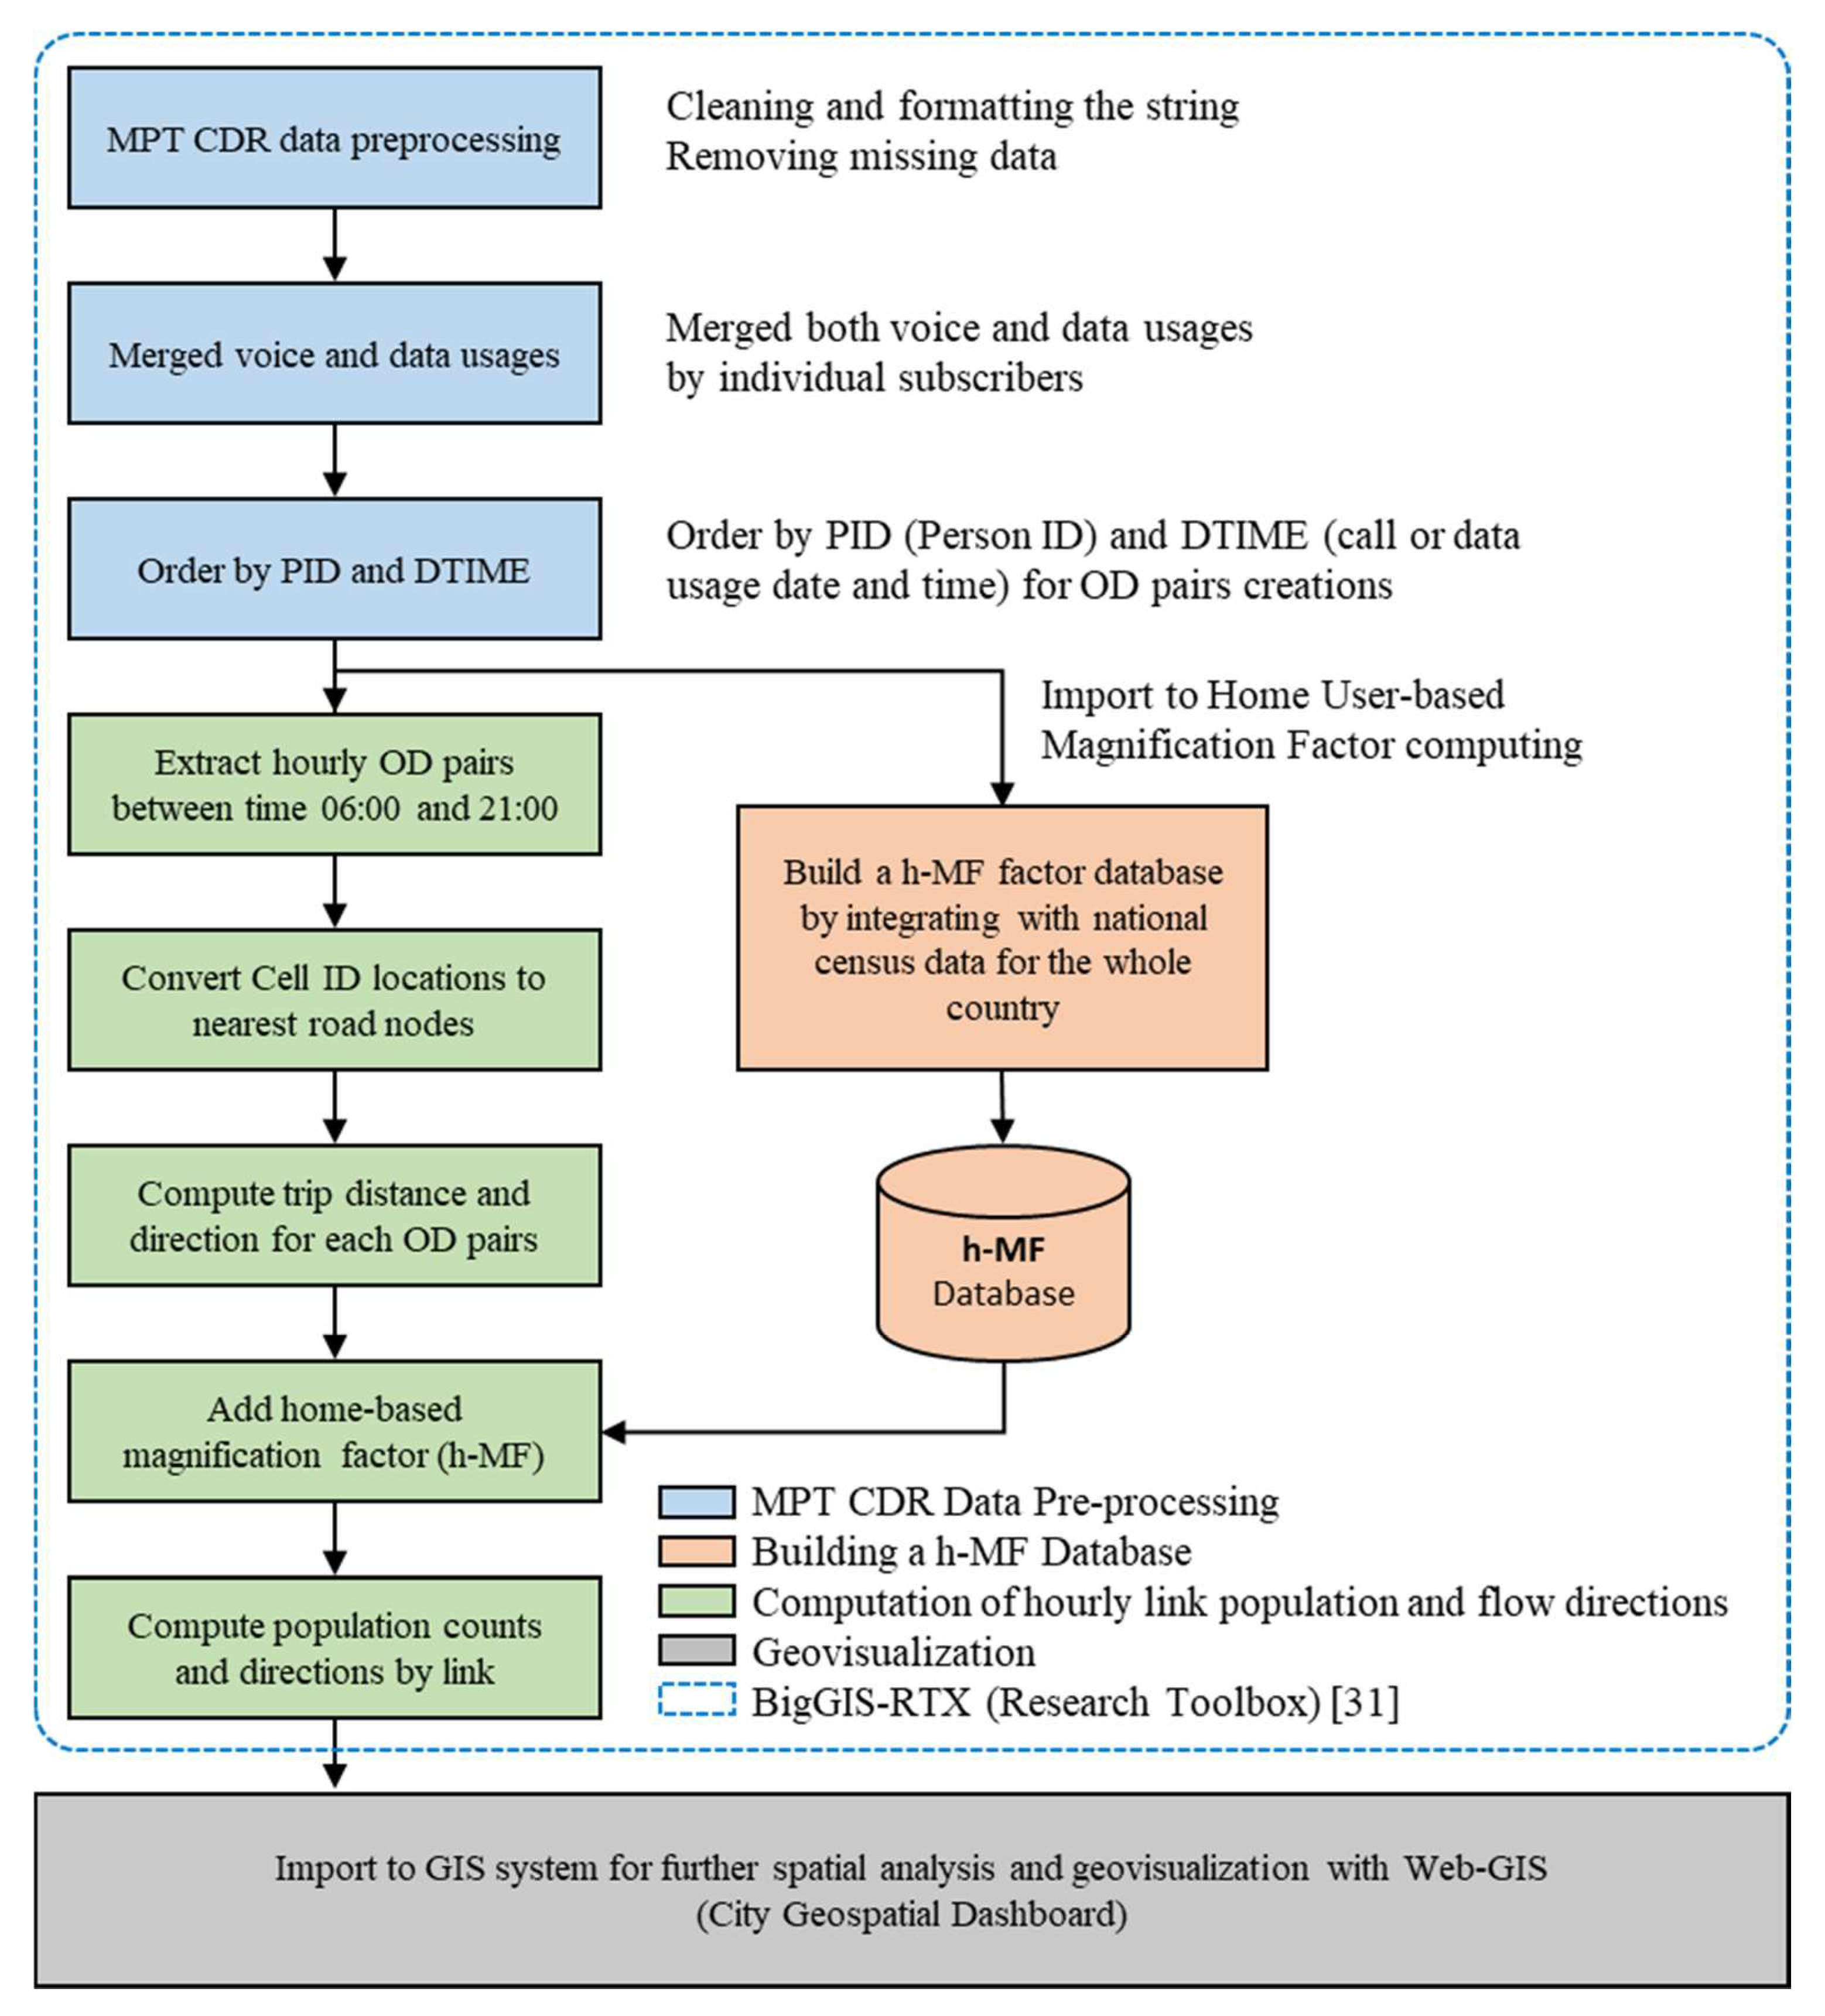
In this research, we used one-week MPT mobile CDR data to extract OD trips at one-hour intervals from 06:00 to 21:00. Later, these OD pairs were used to compute individual travel distance, duration, speed, and direction, based on GIS road network data models. Finally, we used these data to generate link population and flow directions for each road link (edge) by aggregating the total number of mobile users with their magnification factors. In this research, CDR data processing has done by BigGIS-RTX research toolbox [31]. Figure 2 gives an overview of this research.
4.2. MPT CDR Data Preprocessing
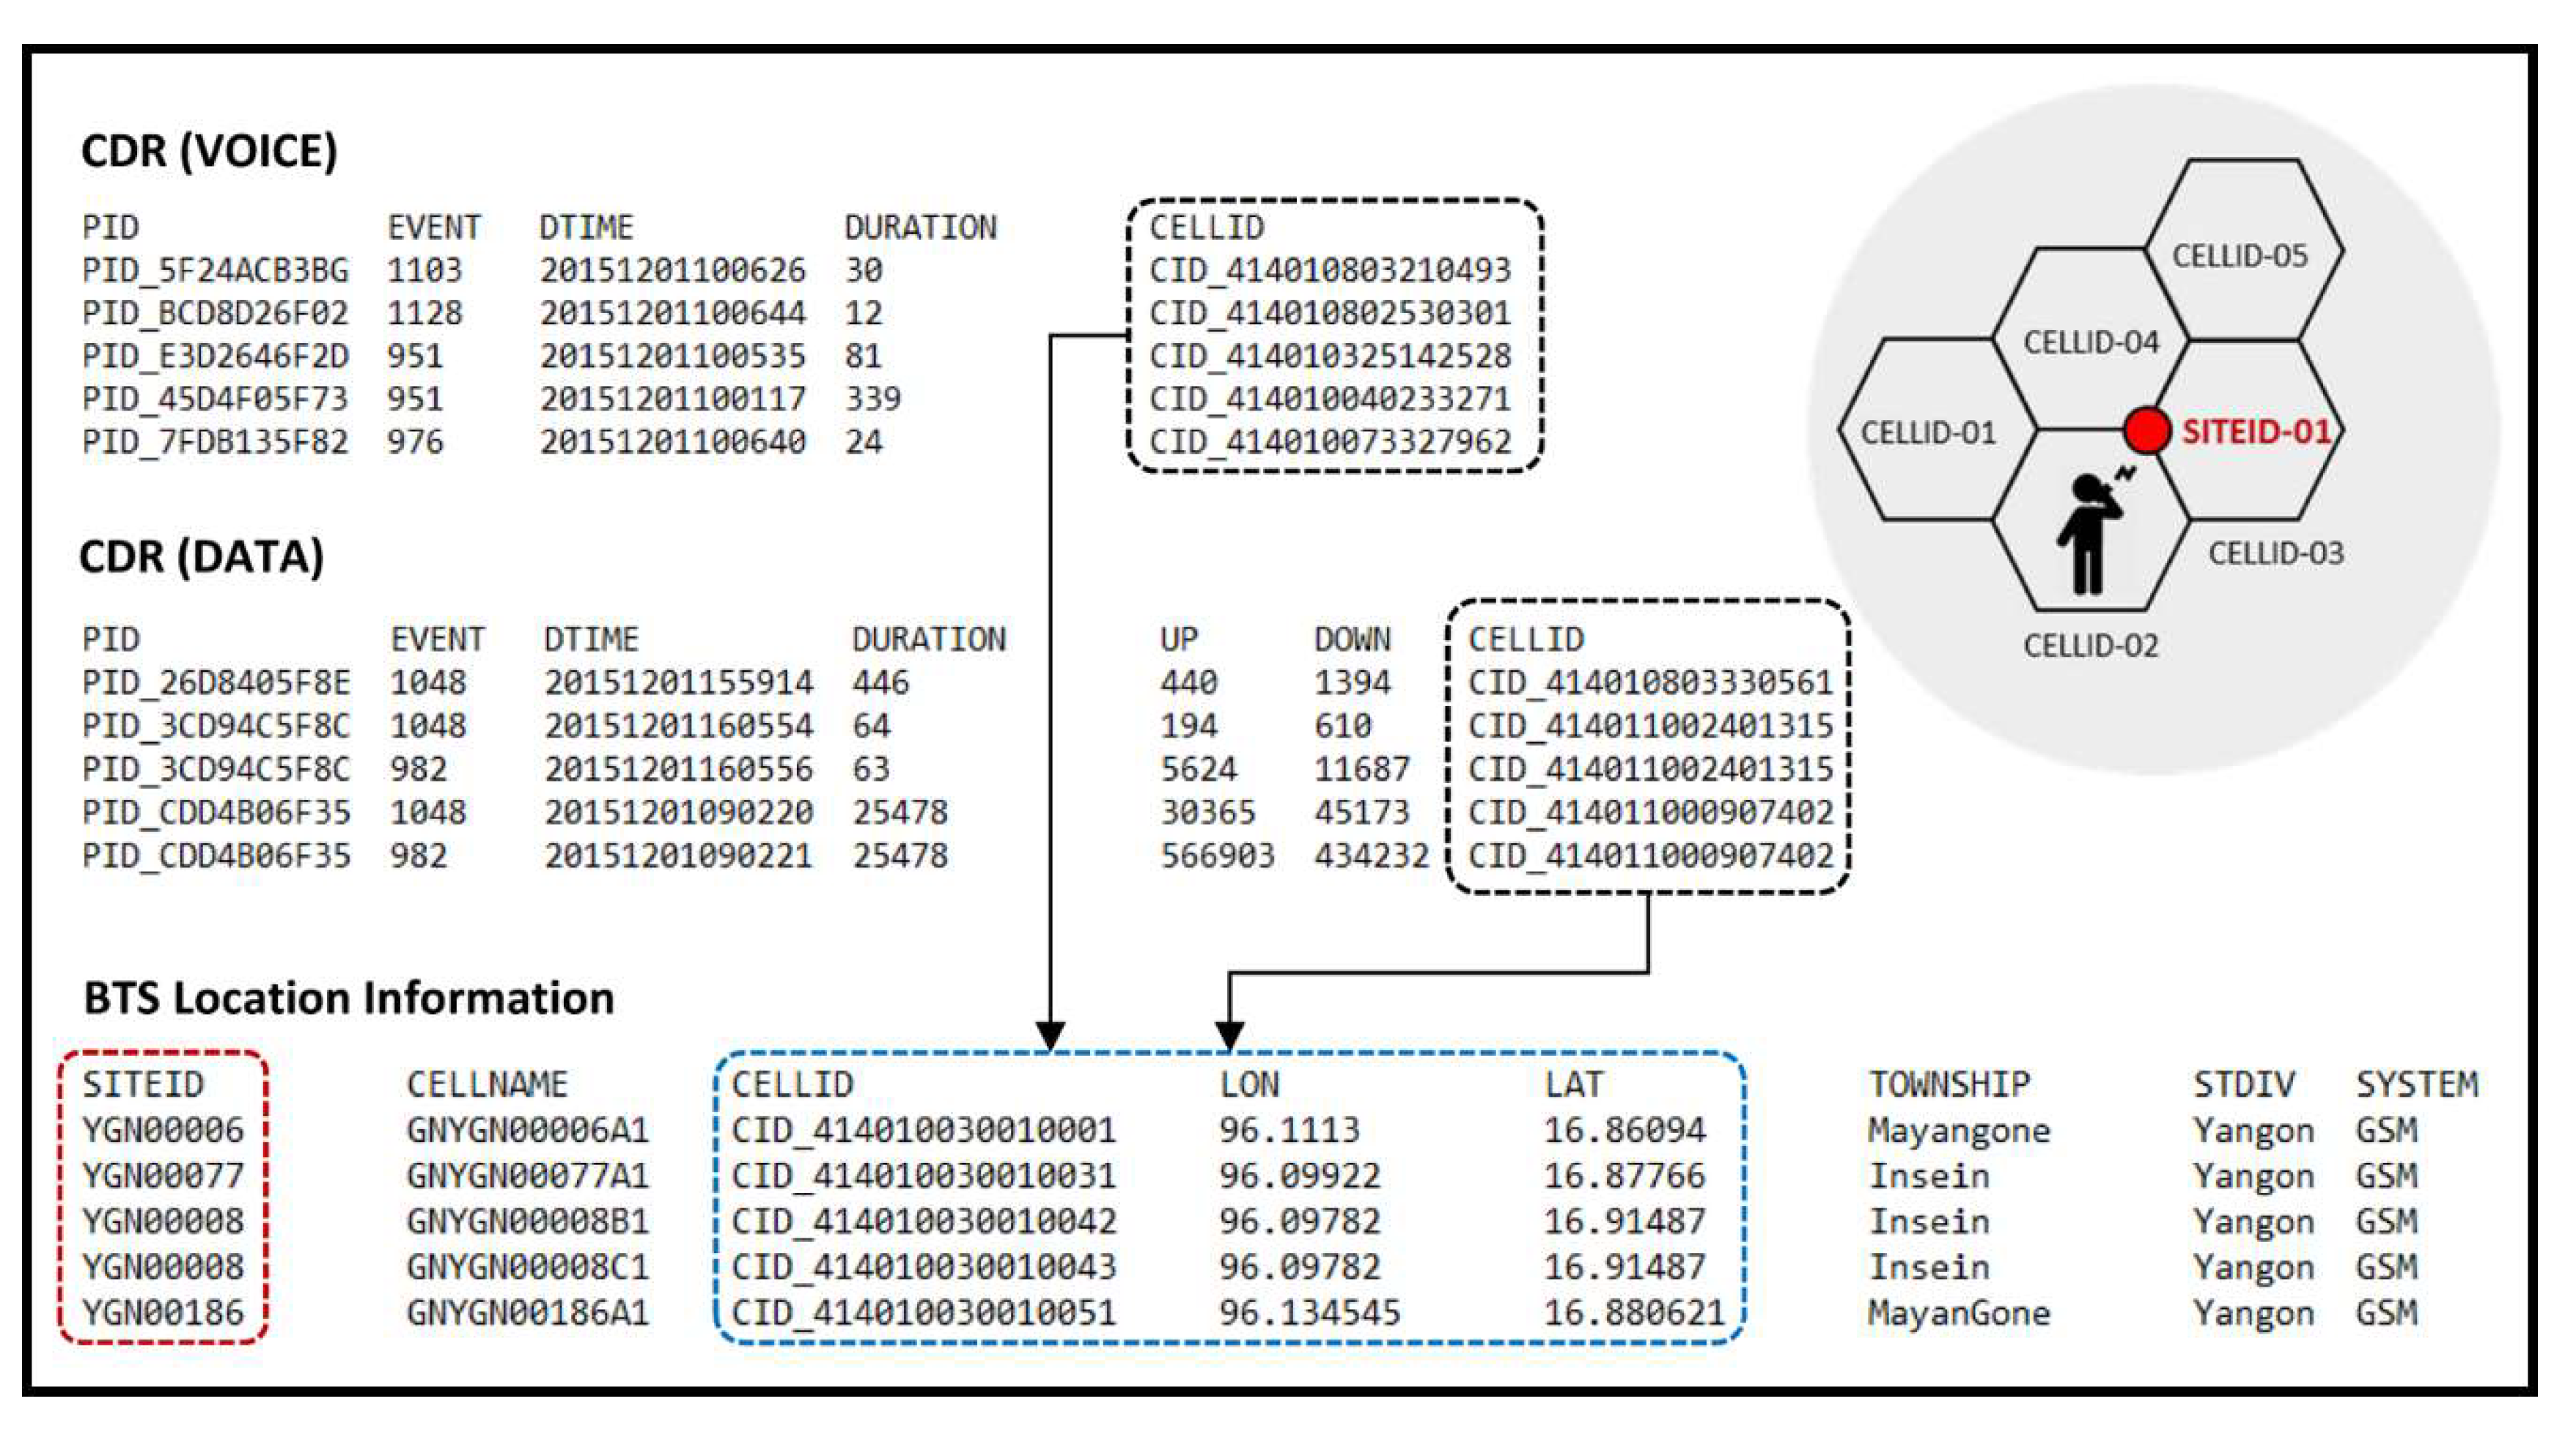
We used the anonymized subscriber ID from mobile CDR data obtained from MPT for a seven-day period (1 December 2015–7 December 2015), for the whole country. MPT owned 46% of the market share in 2015 [32], along with Telenor, Ooredoo, and other providers. MPT had 20 million subscribers in May 2016 [33], which represents 40% of the national population. MPT is a state-owned enterprise in Myanmar, and is under the supervision of the Ministry of Transport and Communications; it operates a nationwide network infrastructure, with the widest 3G mobile network coverage throughout Myanmar, recorded at 95% in March 2016. This includes both voice and data (Figure 3) with encrypted SIM card ID, Event Code, Call Time, Call Duration, Upload Data Size, and Download Data Size. Because of the nature of the big data collection system, preprocessing steps are required to use these data in this study, such as removing empty call durations and records; formatting the strings; and converting some numerical values, such as site ID, into strings to avoid manipulation during the process. In this dataset, the number of voice users was larger than that of data users.
4.3. Home User-Based CDR Data Magnification Factor
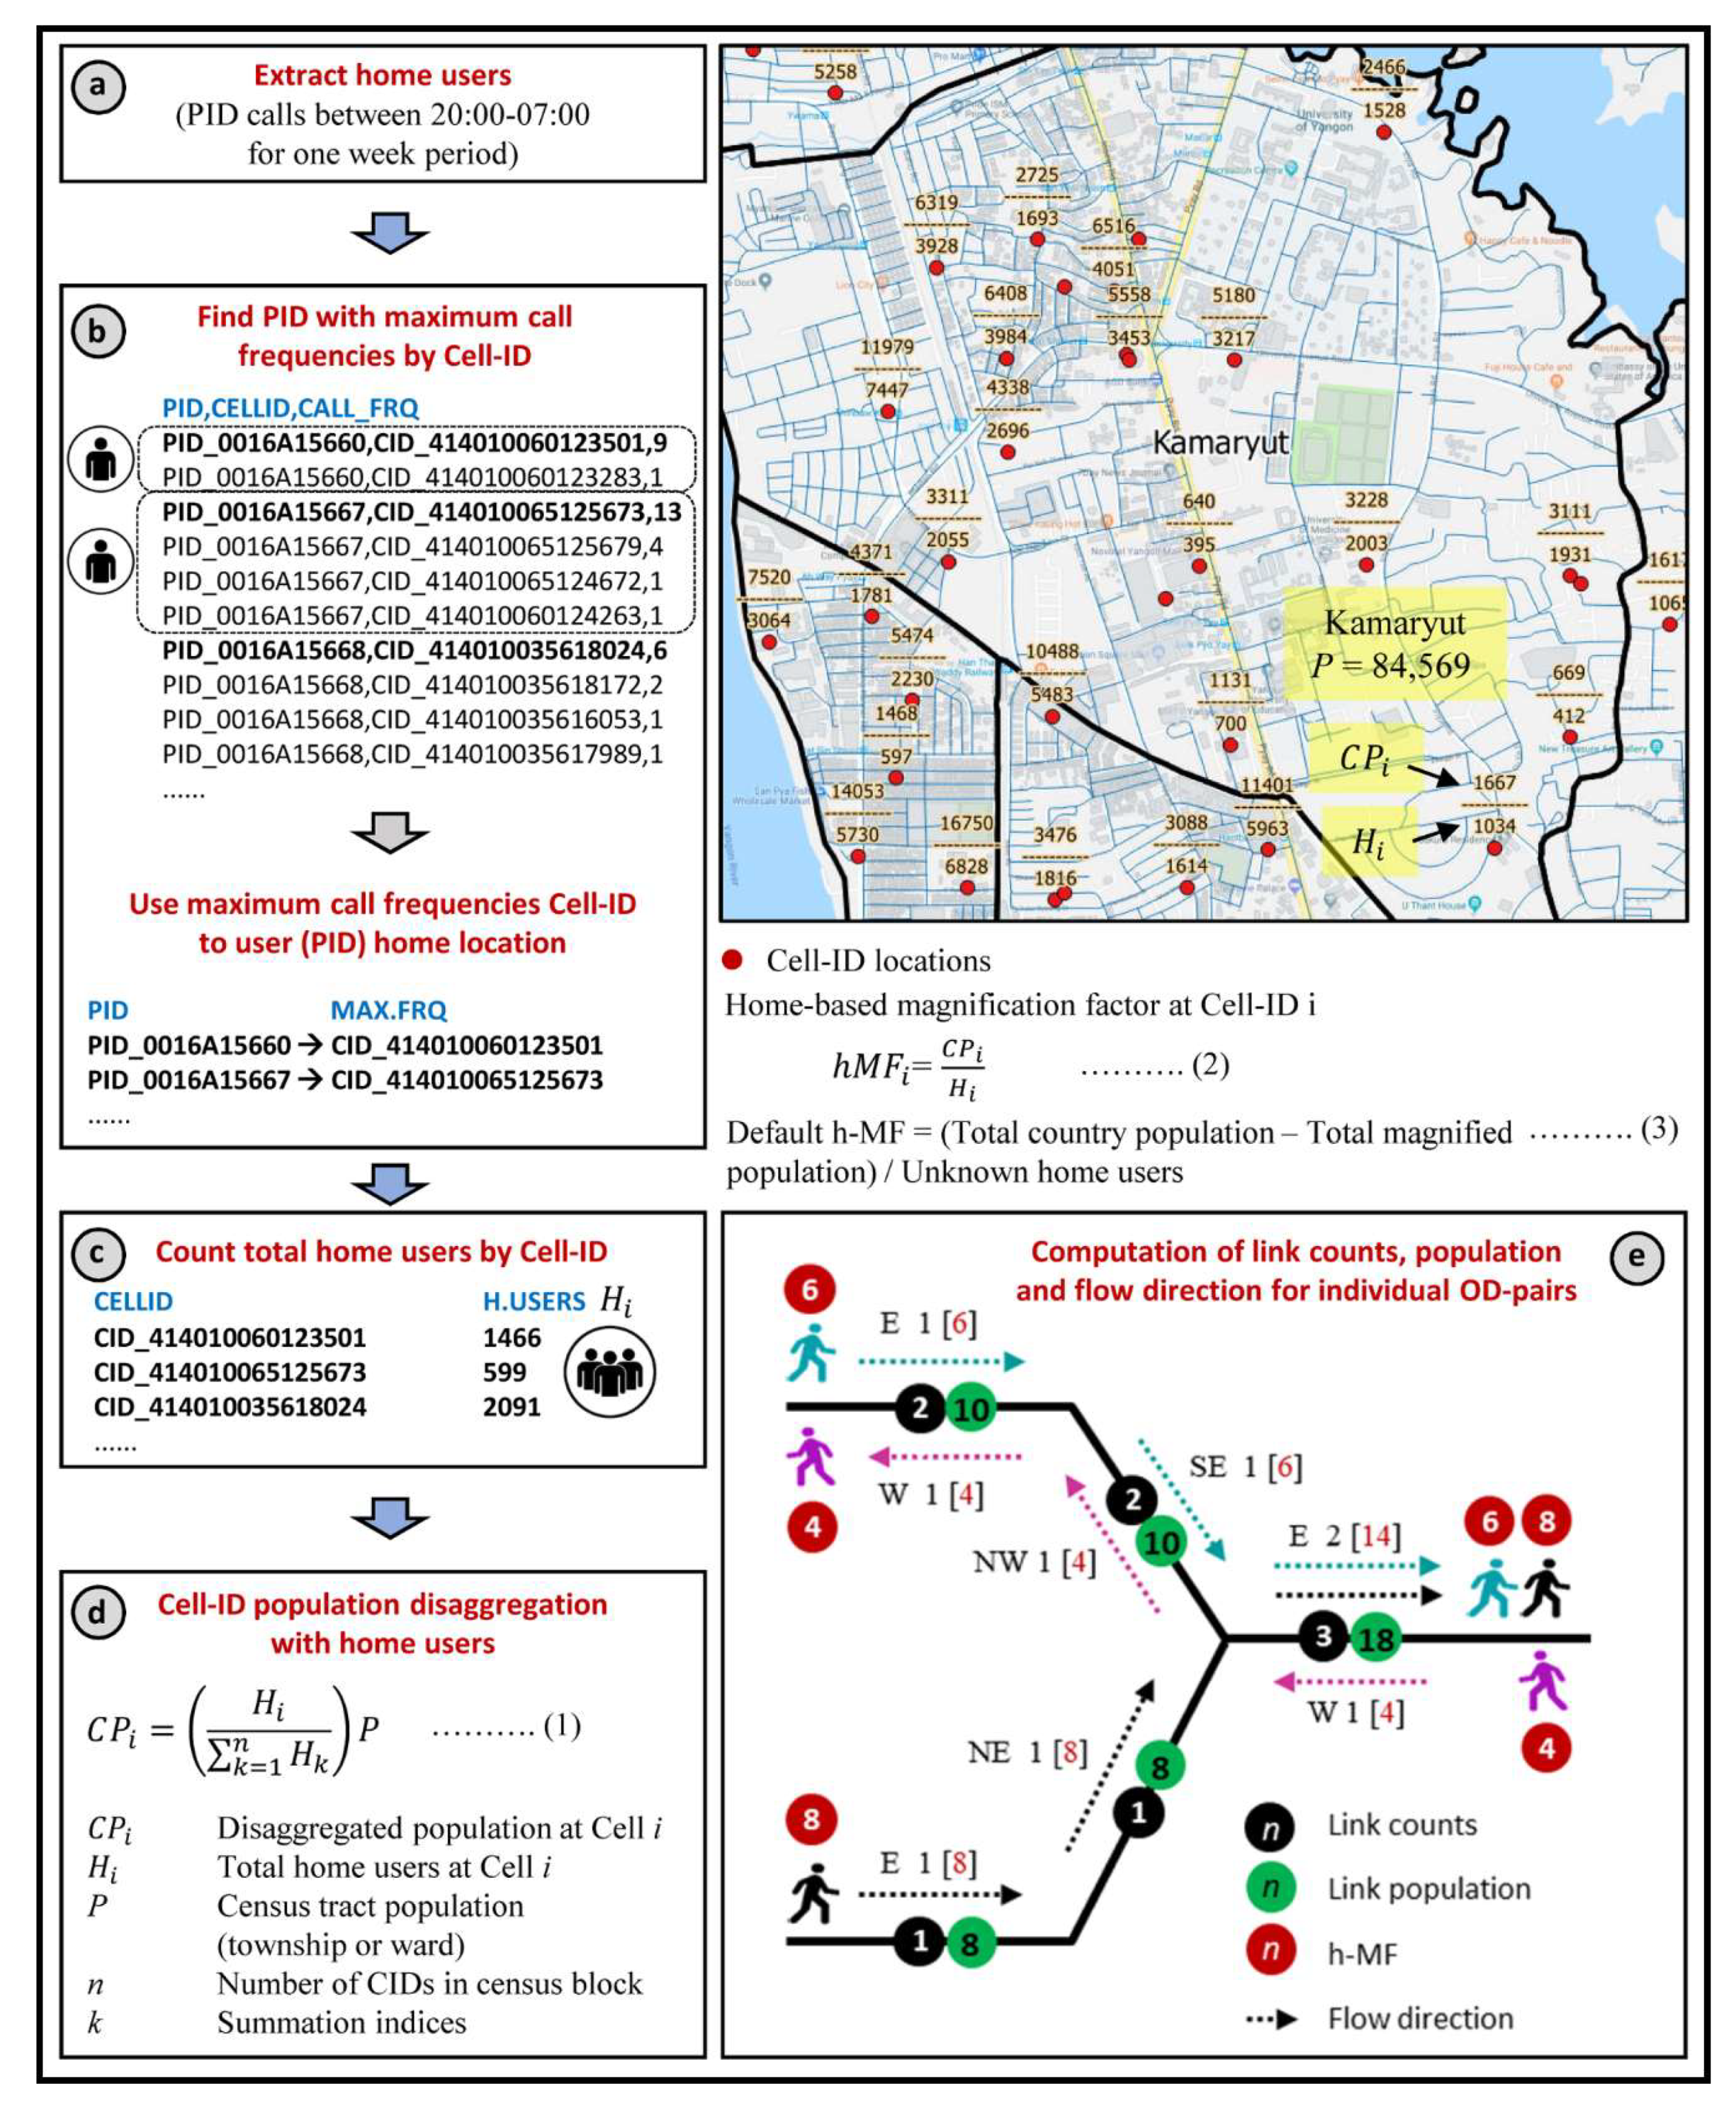
Here, we introduced the home-based magnification factor (h-MF) to obtain the actual population from mobile users. The computation of h-MF has three steps. First, find each person’s home location Cell-ID and sum the total persons by Cell-ID called Cell-ID home users. Second, find the Cell-ID disaggregated census population based on Cell-ID home users. Third, compute the Cell-ID magnification factor and assign to individual persons (person ID (PID)) who belong to this Cell-ID.
First, we found each person’s home location Cell-ID, which was extracted from seven-day CDR data calls between 20:00 and 07:00, based on the assumption that users stay at home (Figure 4a). After that, we found each person’s maximum call frequency of Cell-ID (Figure 4b) and assumed that this Cell-ID was the person’s home location. In this step, we obtained Cell-ID total home users and its belonging persons (PIDs; Figure 4c).
Second, we found the Cell-ID disaggregated census population, based on census population and Cell-ID home users obtained from the previous step. Generally, the census population was available by township or block with the aggregated population. We wanted to disaggregate census population into the Cell-ID population. Equation (1) (Figure 4d) was used to disaggregate census population, based on Cell-ID home users. This equation was modified from our previous study, building population estimation in GIS [34].
Third, we computed individual Cell-ID h-MF using Equation (2). However, one-week CDR data could not obtain all home users in the dataset, known as unknown home users. Some subscribers did not make any calls between 20:00 and 07:00 within a seven-day period. In this case, we used the default value, which was calculated by subtracting the total magnified population from the country population and dividing by unknown home users (Equation (3) in Figure 4). We found that 20% of the PIDs should be assigned a default magnification factor for the whole country. Finally, Cell-ID h-MF was assigned to its home users acquired in the first step. Therefore, the MF is fully synchronized with human mobility; wherever an individual goes, their MF will follow them. The total population can be obtained by summing all MFs in an area (Figure 4e).
4.4. Hourly Link Population and Flow Directions
The following steps were performed to achieve link population and flow directions.
Moving cell tower locations to the nearest road nodes: If the road link was too long, curved, or twisted, measurement of direction could vary depending on the location of the start and endpoints on the link (Figure 5a). To start every trip at the nearest road node, we moved all Cell-ID locations to the nearest road nodes (Figure 5b). Therefore, each road link could have only two opposite directional values, such as east or west, north or south, northeast or southwest, and southeast or northwest. Later, we grouped them into two categories, based on these two opposite directions, to determine the majority and minority flow directions.
Extract hourly OD pairs: After preprocessing was completed, we started to extract OD pairs for individual persons by pairing their successive calls or data usages (Figure 5c). During this process, we also computed several trips, duration, distance, and speed of each pair for further travel behavior and mode-choice analysis. In this process, we omitted the points where the user stayed at the same location (if successive calls or data usages are the same Cell-ID or coordinates), also known as stay points.
Compute link population and directions: In this step, we used a GIS road network data model to compute route paths and directions between each OD pair (i.e., start Cell-ID x, y; and end Cell-ID x, y), based on shortest-path analysis using the well-known modified Dijstra algorithm. Direction was computed between two start and end nodes by the angle between 0° and 360°, and grouped into eight categories, namely, north, northeast, east, southeast, south, southwest, west, and northwest. We counted unique PIDs by each road link and summed their magnification factor (h-MF) for link population to gain the actual population from mobile users (Figure 4e). Link population and flow directions were grouped into two opposite directions (i.e., east or west, north or south, northeast or southwest, etc.) to determine the majority flow direction at specific time intervals.
5. Results and Discussion
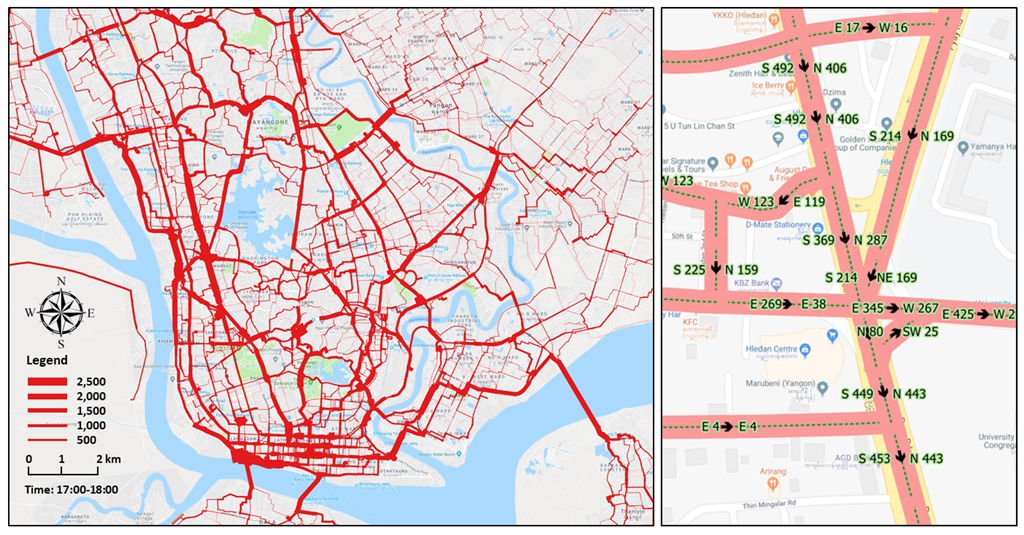
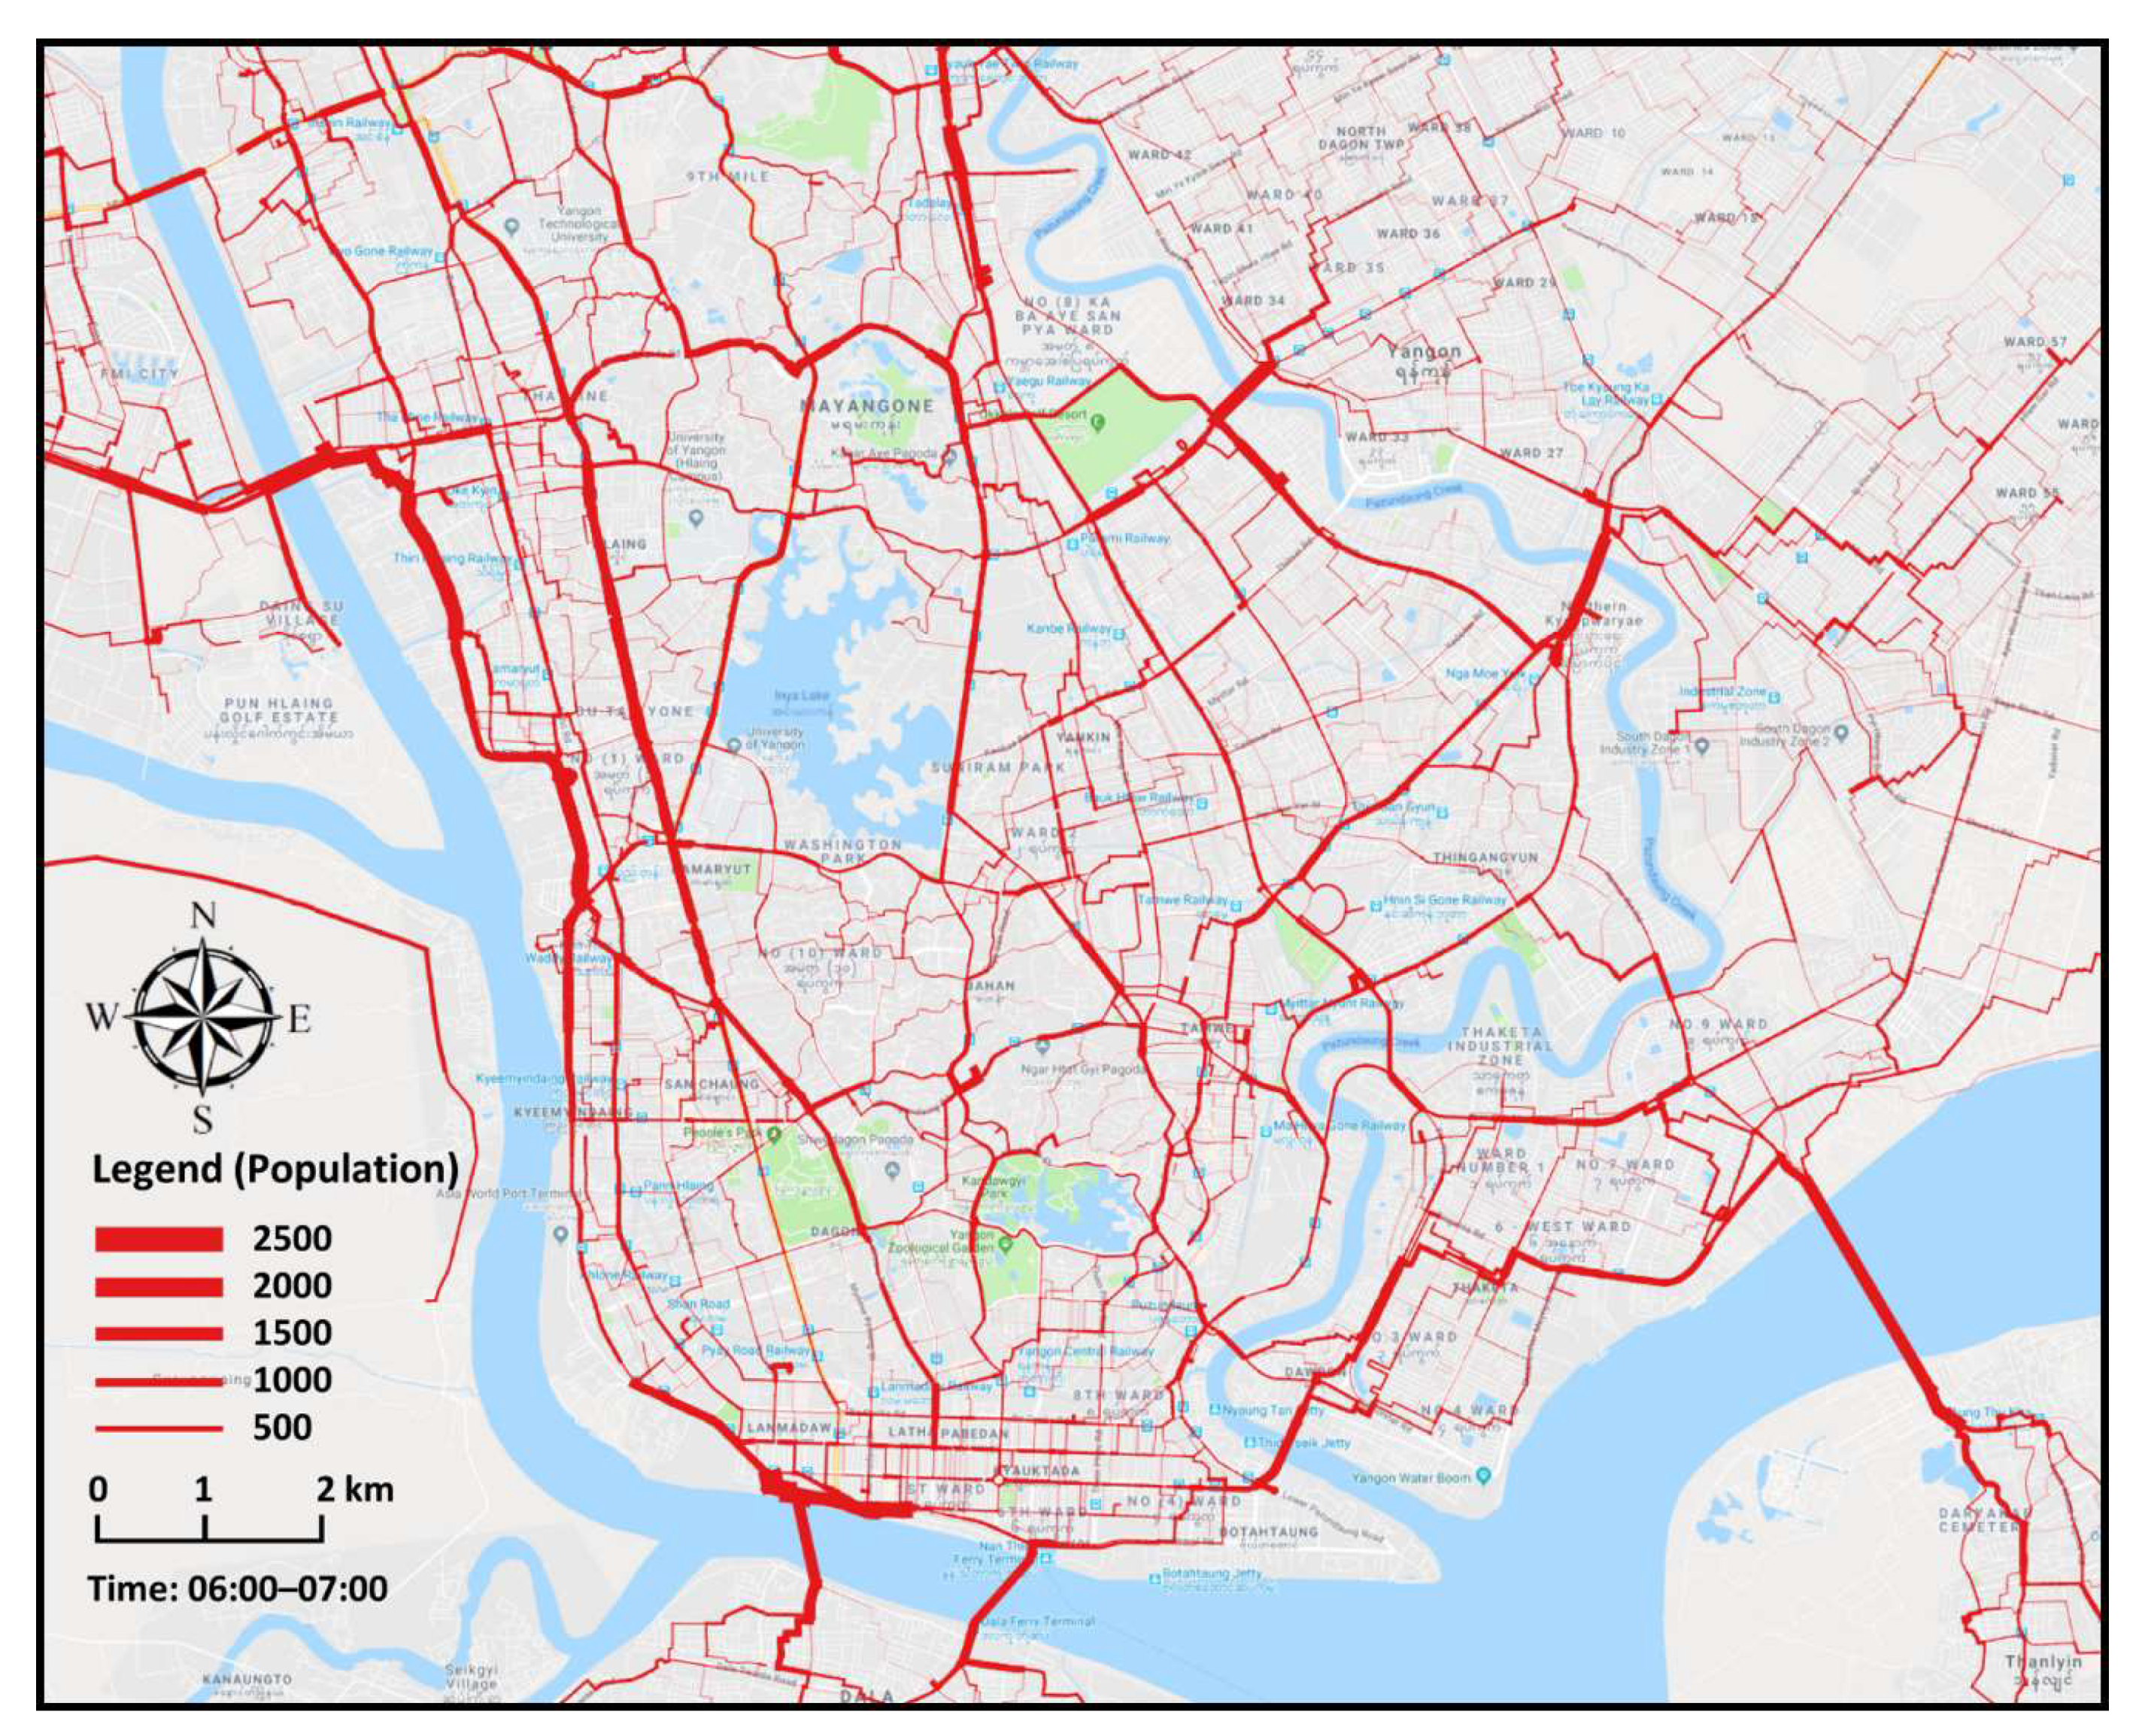
The final goal of this research was to produce hourly link population and flow direction maps to use in various urban and transport planning projects. Figure 6 and Figure 7 show the flow magnitude by line thickness (i.e., number of people) by each road link in the morning, 06:00–07:00, and evening, 17:00–18:00. According to the map, in the morning, high magnitude links were found in many rural areas where people are entering the central business area (Figure 6), and in the evening, high magnitude links were found in downtown areas, especially bus station centers, where people are departing for various regions (Figure 7).
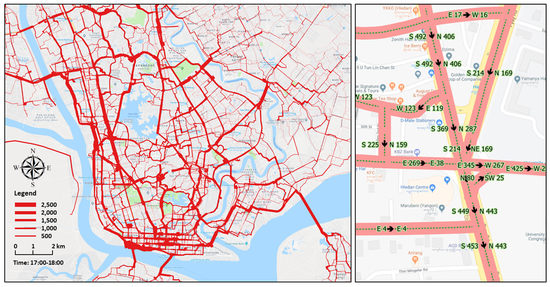
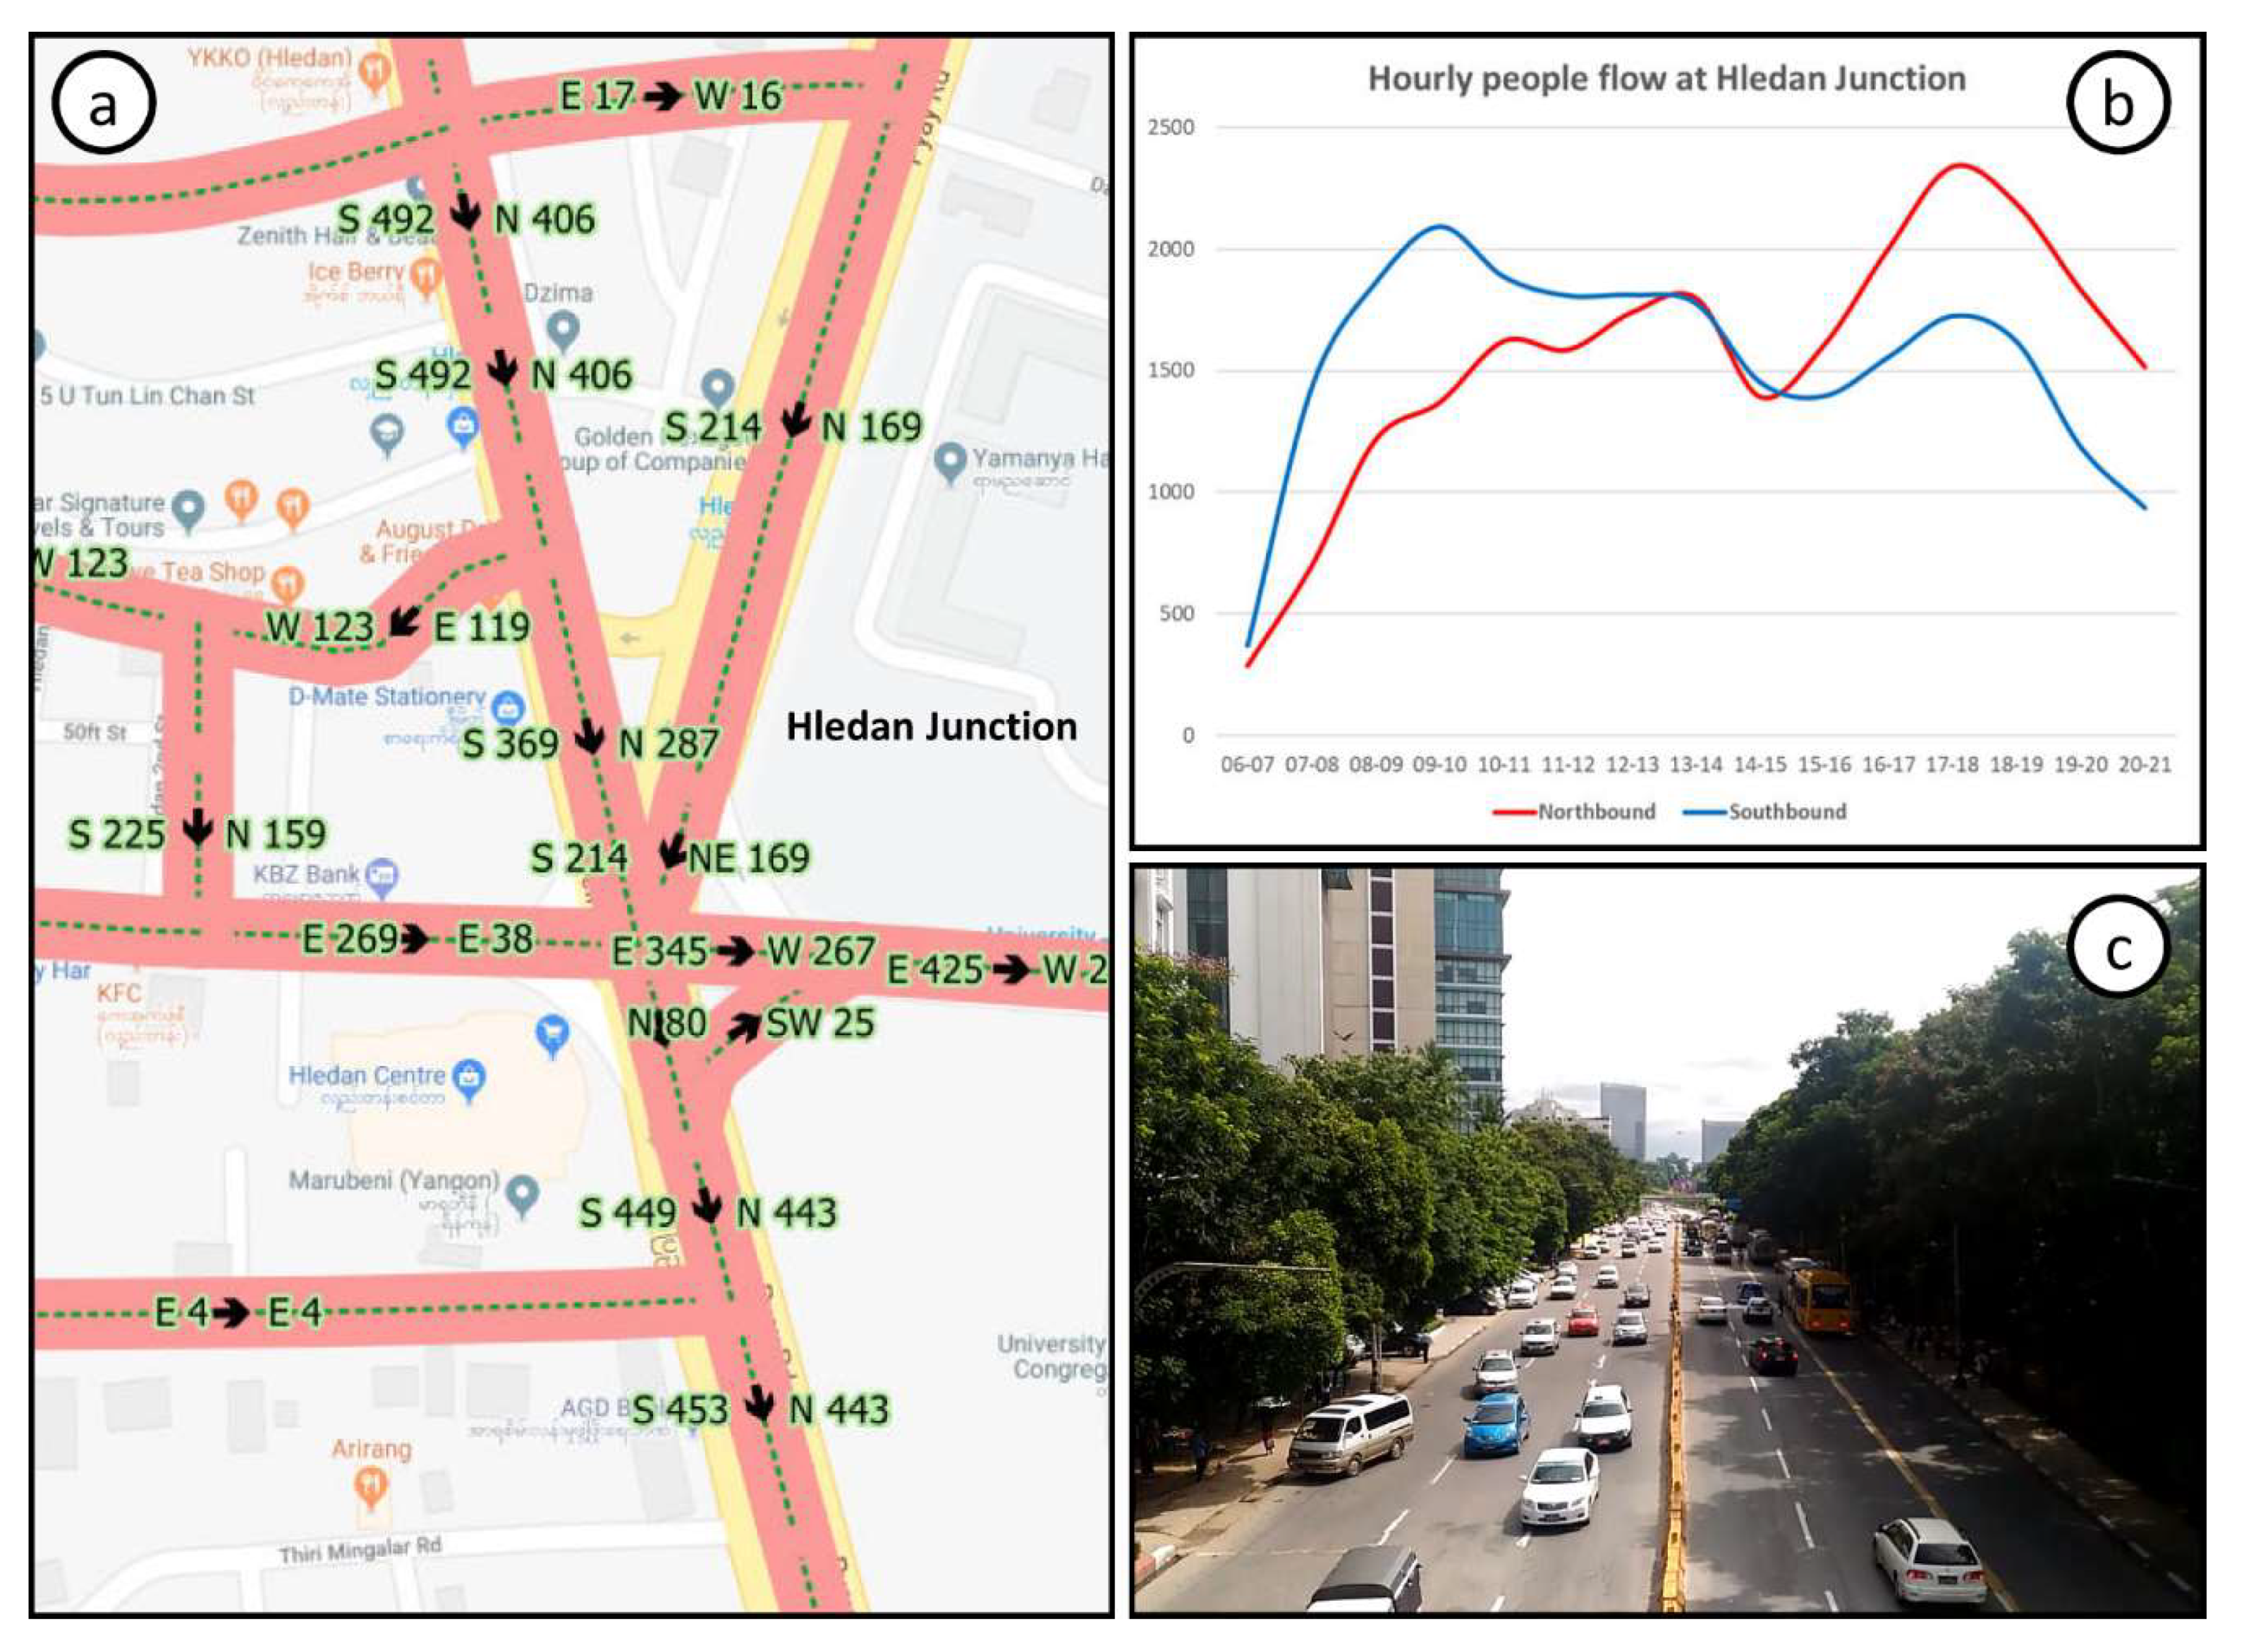
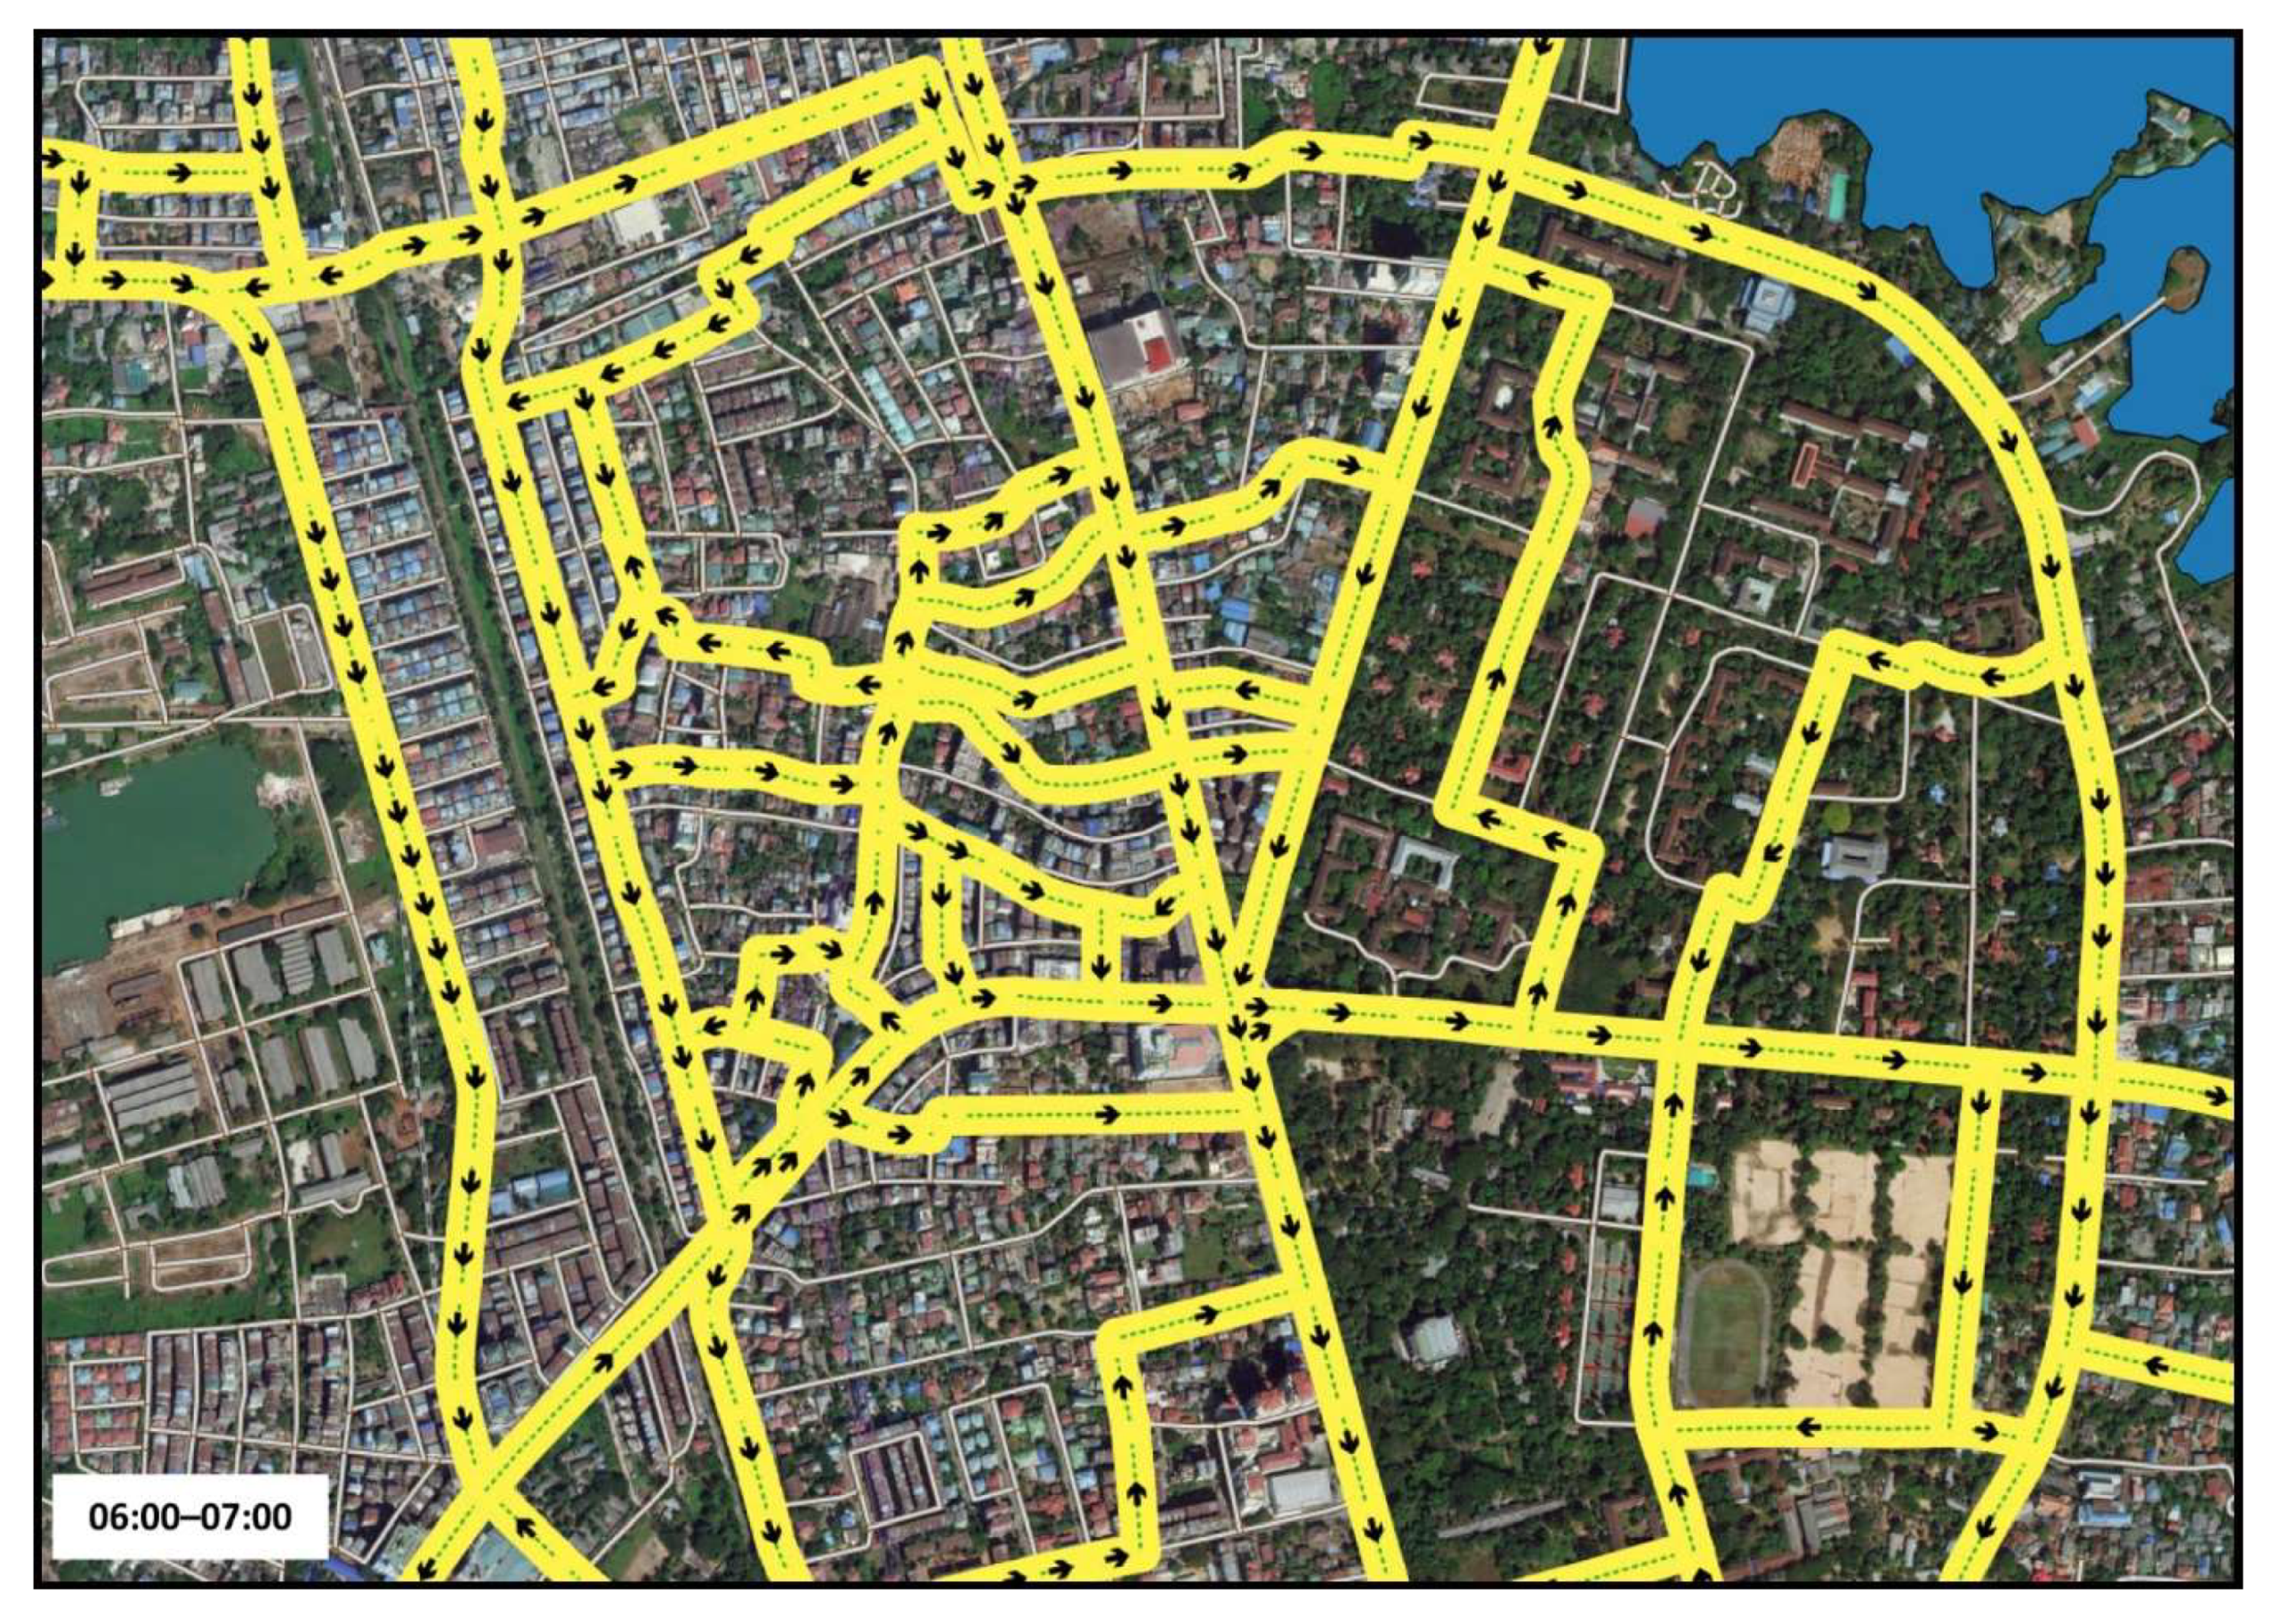
We can also visualize the link flow directions for both roadsides (Figure 8 and Figure 9). The arrow direction is the majority people-flow direction from two opposite directions. For example, if the road link has 369 southbound travelers and 287 northbound, the direction arrow will be headed south (Figure 10a). The hourly link people-flow dataset can generate an hourly profile line with estimated population number for both directions at specific points on the map (Figure 10b). Later, we will build a Web-GIS for geovisualization by providing interactive mapping and spatial decision-making functions for the city and urban transport planners, policy makers, and other spatial information users.
Result validation for dynamic population estimation is a considerable challenge for many researchers, because human mobility changes over space and time. Because there is no single population estimation model to predict an accurate population in a quantitative approach, here, we used a qualitative approach (visual interpretation) rather than a quantitative approach. The result was validated by counting moving vehicles in each direction at specific points (Figure 10c). We also used a web-based, real-time smartphone geospatial data collection system [35] to collect some passenger counts at every bus stop on selected routes to measure people-flow patterns along the bus route. The people-flow magnitude and direction of this study is directly proportional to the traffic volume and directional data, which we collected at the ground. Moreover, transport surveys conducted in 2013 by Japan International Cooperation Agency (JICA) data also helped to validate the results by comparing traffic volume with link population in specific intersections and lanes.
6. Conclusions
We used one-week mobile CDRs to generate hourly OD pairs of individuals and found the shortest paths between the pairs. Here, we introduced home-based magnification factors to estimate actual population scaling by number of mobile home users and disaggregated census population of each base transceiver station (BTS). We computed the link population and flow directions for the whole city, which allowed visualizing detailed movement of people inside the city at one-hour intervals. Moreover, using Web-GIS, we delivered link population and flow-direction information to online geospatial information users to perform additional tasks, such as generating hourly population profile lines at specific points or links and identifying average population by user-defined areas, as well as other digital cartographic functions in their decision-making processes. Owing to some limitations in researching with CDR data, vehicle- or people-flow mapping for the whole city was limited at the time and required additional ground-truth data collection and an advanced wireless monitoring system to predict these for the whole city. Although CDR has some limitations in human mobility studies (for example, mobility depends fully on their call and data usage activities, actual traveling paths may differ from shortest paths in GIS analysis, and cell tower locational information is sometimes inaccurate owing to load balancing), CDR remains one of the data sources for a massive number of human mobility patterns inside the city or across the country. We hope that hourly link population and flow direction along with other information generated from this study, such as the number of trips per person, average travel distance, duration, speed, and mode choice, will be used in the Yangon City Development Planning process in the near future.
Author Contributions
All authors contributed substantially to this work.
Funding
Japan Science and Technology Agency and the Japan International Cooperation Agency.
Acknowledgments
We thank Myanma Posts and Telecommunications for providing the one-week CDR data for this study. We also acknowledge the Japan Science and Technology Agency and the Japan International Cooperation Agency for funding and implementing the project entitled “Development of a Comprehensive Disaster Resilience System and Collaboration Platform in Myanmar”, led by Kimiro Meguro, International Center for Urban Safety Engineering at the Institute of Industrial Science, University of Tokyo, under the Science and Technology Research Partnership for Sustainable Development (SATREPS) program.
Conflicts of Interest
The authors declare no conflict of interest.
References
- Chen, C.; Zhang, D.; Zhou, Z.H.; Li, N.; Atmaca, T.; Li, S. B-Planner: Night bus route planning using large-scale taxi GPS traces. In Proceedings of the 2013 IEEE International Conference on Pervasive Computing and Communications (PerCom), San Diego, CA, USA, 18–22 March 2013; pp. 225–233. [Google Scholar]
- Van Oudheusden, D.L.; Zhu, W. Trip frequency scheduling for bus route management in Bangkok. Eur. J. Oper. Res. 1995, 83, 439–451. [Google Scholar] [CrossRef]
- Etemad, M.; Júnior, A.S.; Matwin, S. Predicting Transportation Modes of GPS Trajectories using Feature Engineering and Noise Removal. In Advances in Artificial Intelligence: Proceedings of the 31st Canadian Conference on Artificial Intelligence, Canadian AI 2018, Toronto, ON, Canada, 8–11 May 2018; Springer International Publishing: New York, NY, USA, 2018; p. 31. [Google Scholar]
- Wang, J.; Mao, Y.; Li, J.; Xiong, Z.; Wang, W. Predictability of Road Traffic and Congestion in Urban Areas. PLoS ONE. 2015. [Google Scholar] [CrossRef] [PubMed]
- Stute, M.; Maass, M.; Schons, T.; Hollick, M. Reverse Engineering Human Mobility in Large-scale Natural Disasters. In Proceedings of the 20th ACM International Conference on Modelling, Analysis and Simulation of Wireless and Mobile Systems—MSWiM 17, Miami, FL, USA, 21–25 November 2017. [Google Scholar]
- Batran, M.; Mejia, M.; Kanasugi, H.; Sekimoto, Y.; Shibasaki, R. Inferencing Human Spatiotemporal Mobility in Greater Maputo via Mobile Phone Big Data Mining. ISPRS Int. J. Geo-Inf. 2018, 7, 259. [Google Scholar] [CrossRef]
- Caceres, N.; Wideberg, J.; Benitez, F. Deriving origin-destination data from a mobile phone network. IET Intell. Transp. Syst. 2007. [Google Scholar] [CrossRef]
- Friedrich, M.; Immisch, K.; Jehlicka, P.; Otterstätter, T.; Schlaich, J. Generating Origin-Destination Matrices from Mobile Phone Trajectories. Transp. Res. Rec. J. Transp. Res. Board. 2010, 2196, 93–101. [Google Scholar] [CrossRef]
- Iqbal, M.S.; Choudhury, C.F.; Wang, P.; González, M.C. Development of origin–destination matrices using mobile phone call data. Transp. Res. Part C Emerg. Technol. 2014, 40, 63–74. [Google Scholar] [CrossRef] [Green Version]
- Mellegard, E.; Moritz, S.; Zahoor, M. Origin/Destination-estimation Using Cellular Network Data. In Proceedings of the 2011 IEEE 11th International Conference on Data Mining Workshops, Vancouver, BC, Canada, 11 December 2011. [Google Scholar]
- Zin, T.; Kyaing, D.; Lwin, K.; Sekimoto, Y. Estimation of Originating-Destination Trips in Yangon by Using Big Data Source. J. Disaster Res. 2018, 13, 6–13. [Google Scholar] [CrossRef]
- Kang, C.; Gao, S.; Lin, X.; Xiao, Y.; Yuan, Y.; Liu, Y.; Ma, X. Analyzing and geo-visualizing individual human mobility patterns using mobile call records. In Proceedings of the International Conference on Geoinformatics, Beijing, China, 18–20 June 2010; pp. 1–7. [Google Scholar]
- Kyaing, D.; Lwin, K.; Sekimoto, Y. Human Mobility Patterns for Different Regions in Myanmar Based on CDRs Data. IPTEK J. Proc. Ser. 2017. [Google Scholar] [CrossRef]
- Wu, W.; Xu, J.; Zeng, H.; Zheng, Y.; Qu, H.; Ni, B.; Yuan, M.; Ni, L.M. Telcovis: Visual exploration of co-occurrence in urban human mobility based on telco data. IEEE Trans. Vis. Comput. Graph. 2016, 22, 935–944. [Google Scholar] [CrossRef] [PubMed]
- Gao, S.; Liu, Y.; Wang, Y.; Ma, X. Discovering Spatial Interaction Communities from Mobile Phone Data. Trans. GIS 2013, 17, 463–481. [Google Scholar] [CrossRef]
- Han, Q. Social Influence Analysis Using Mobile Phone Dataset. In Proceedings of the 2016 17th IEEE International Conference on Mobile Data Management (MDM), Porto, Portugal, 13–16 June 2016. [Google Scholar]
- Ratti, C.; Frenchman, D.; Pulselli, R.M.; Williams, S. Mobile Landscapes: Using Location Data from Cell Phones for Urban Analysis. Environ. Plan. B Plan. Des. 2006, 33, 727–748. [Google Scholar] [CrossRef]
- Dan, Y.; He, Z. A dynamic model for urban population density estimation using mobile phone location data. In Proceedings of the 2010 5th IEEE Conference on Industrial Electronics and Applications, Taichung, Taiwan, 15–17 June 2010. [Google Scholar]
- Ricciato, F.; Widhalm, P.; Pantisano, F.; Craglia, M. Beyond the “single-operator, CDR-only” paradigm: An interoperable framework for mobile phone network data analyses and population density estimation. Pervasive Mob. Comput. 2017, 35, 65–82. [Google Scholar] [CrossRef]
- Castillo, E.; Gallego, I.; Menéndez, J.M.; Jiménez, P. Link Flow Estimation in Traffic Networks on the Basis of Link Flow Observations. J. Intell. Transp. Syst. 2011, 15, 205–222. [Google Scholar] [CrossRef]
- Doblas, J.; Benitez, F.G. An approach to estimating and updating origin-destination matrices based upon traffic counts preserving the prior structure of a survey matrix. Transp. Res. Part B. 2005, 39, 565–591. [Google Scholar] [CrossRef]
- Asakura, Y.; Hato, E.; Kashiwadani, M. Origin-destination matrices estimation model using automatic vehicle identification data and its application to the Han-Shin expressway network. Transportation. 2000, 27, 419–438. [Google Scholar] [CrossRef]
- Calabrese, F.; Lorenzo, G.D.; Liu, L.; Ratti, C. Estimating Origin-Destination Flows Using Mobile Phone Location Data. IEEE Pervasive Comput. 2011, 10, 36–44. [Google Scholar] [CrossRef] [Green Version]
- Hasegawa, Y.; Sekimoto, Y.; Kashiyama, T.; Kanasugi, H. Transportation Melting Pot Dhaka: Road-link Based Traffic Volume Estimation from Sparse CDR Data. In Proceedings of the First International Conference on IoT in Urban Space, Rome, Italy, 27–28 October 2014. [Google Scholar]
- Wang, P.; Hunter, T.; Bayen, A.M.; Schechtner, K.; González, M.C. Understanding Road Usage Patterns in Urban Areas. Sci. Rep. 2012. [Google Scholar] [CrossRef] [PubMed] [Green Version]
- Goodchild, M.F.; Yuan, M.; Cova, T.J. Towards a general theory of geographic representation in GIS. Int. J. Geogr. Inf. Sci. 2007, 21, 239–260. [Google Scholar] [CrossRef] [Green Version]
- Liu, L. PPFLOW: An interactive visualization system for the exploratory analysis of migration flows. Geogr. Inf. Sci. 1995, 1, 118–123. [Google Scholar] [CrossRef]
- Marble, D.F.; Gou, Z.; Liu, L.; Saunders, J. Recent advances in the exploratory analysis of interregional flows in space and time. In Innovations in GIS 4: Selected Papers from the Fourth National Conference on GIS Research UK GISRUK; Kemp, Z., Ed.; Taylor & Francis: London, UK, 1997; pp. 75–81. [Google Scholar]
- The 2014 Myanmar Population and Housing Census Report Volume 2; Department of Population, Ministry of Immigration and Population: Nay Pyi Taw, Myanmar, May 2015.
- JICA. A Strategic Urban Development Plan of Greater Yangon. 2014. Available online: http://open_jicareport.jica.go.jp/pdf/12122511.pdf (accessed on 16 November 2018).
- Lwin, K.; Sekimoto, Y.; Takeuchi, W. Development of GIS Integrated Big Data Research Toolbox (BigGIS-RTX) for Mobile CDR Data Processing in Disasters Management. J. Disaster Res. 2018, 13, 380–386. [Google Scholar] [CrossRef]
- Telenor Investor and Analyst Day in Yangon. 1 December 2016. Available online: https://www.telenor.com/wp-content/uploads/2016/12/Asia-field-trip-day-3-Myanmar.pdf (accessed on 16 November 2018).
- Mobile World Live. Myanmar’s MPT Hits 20M Subscribers Milestone. 24 May 2016. Available online: https://www.mobileworldlive.com/asia/asia-news/myanmars-mpt-hits-20m-sub-milestone/ (accessed on 16 November 2018).
- Lwin, K.; Murayama, Y. A GIS Approach to Estimation of Building Population for Micro-spatial Analysis. Trans. GIS 2009, 13, 401–414. [Google Scholar] [CrossRef]
- Lwin, K.; Hashimoto, M.; Murayama, Y. Real-Time Geospatial Data Collection and Visualization with Smartphone. J. Geogr. Inf. Syst. 2014, 6, 99–108. [Google Scholar] [CrossRef]
Figure 1.
Yangon city road network patterns (left) and census population in 2014 (right).
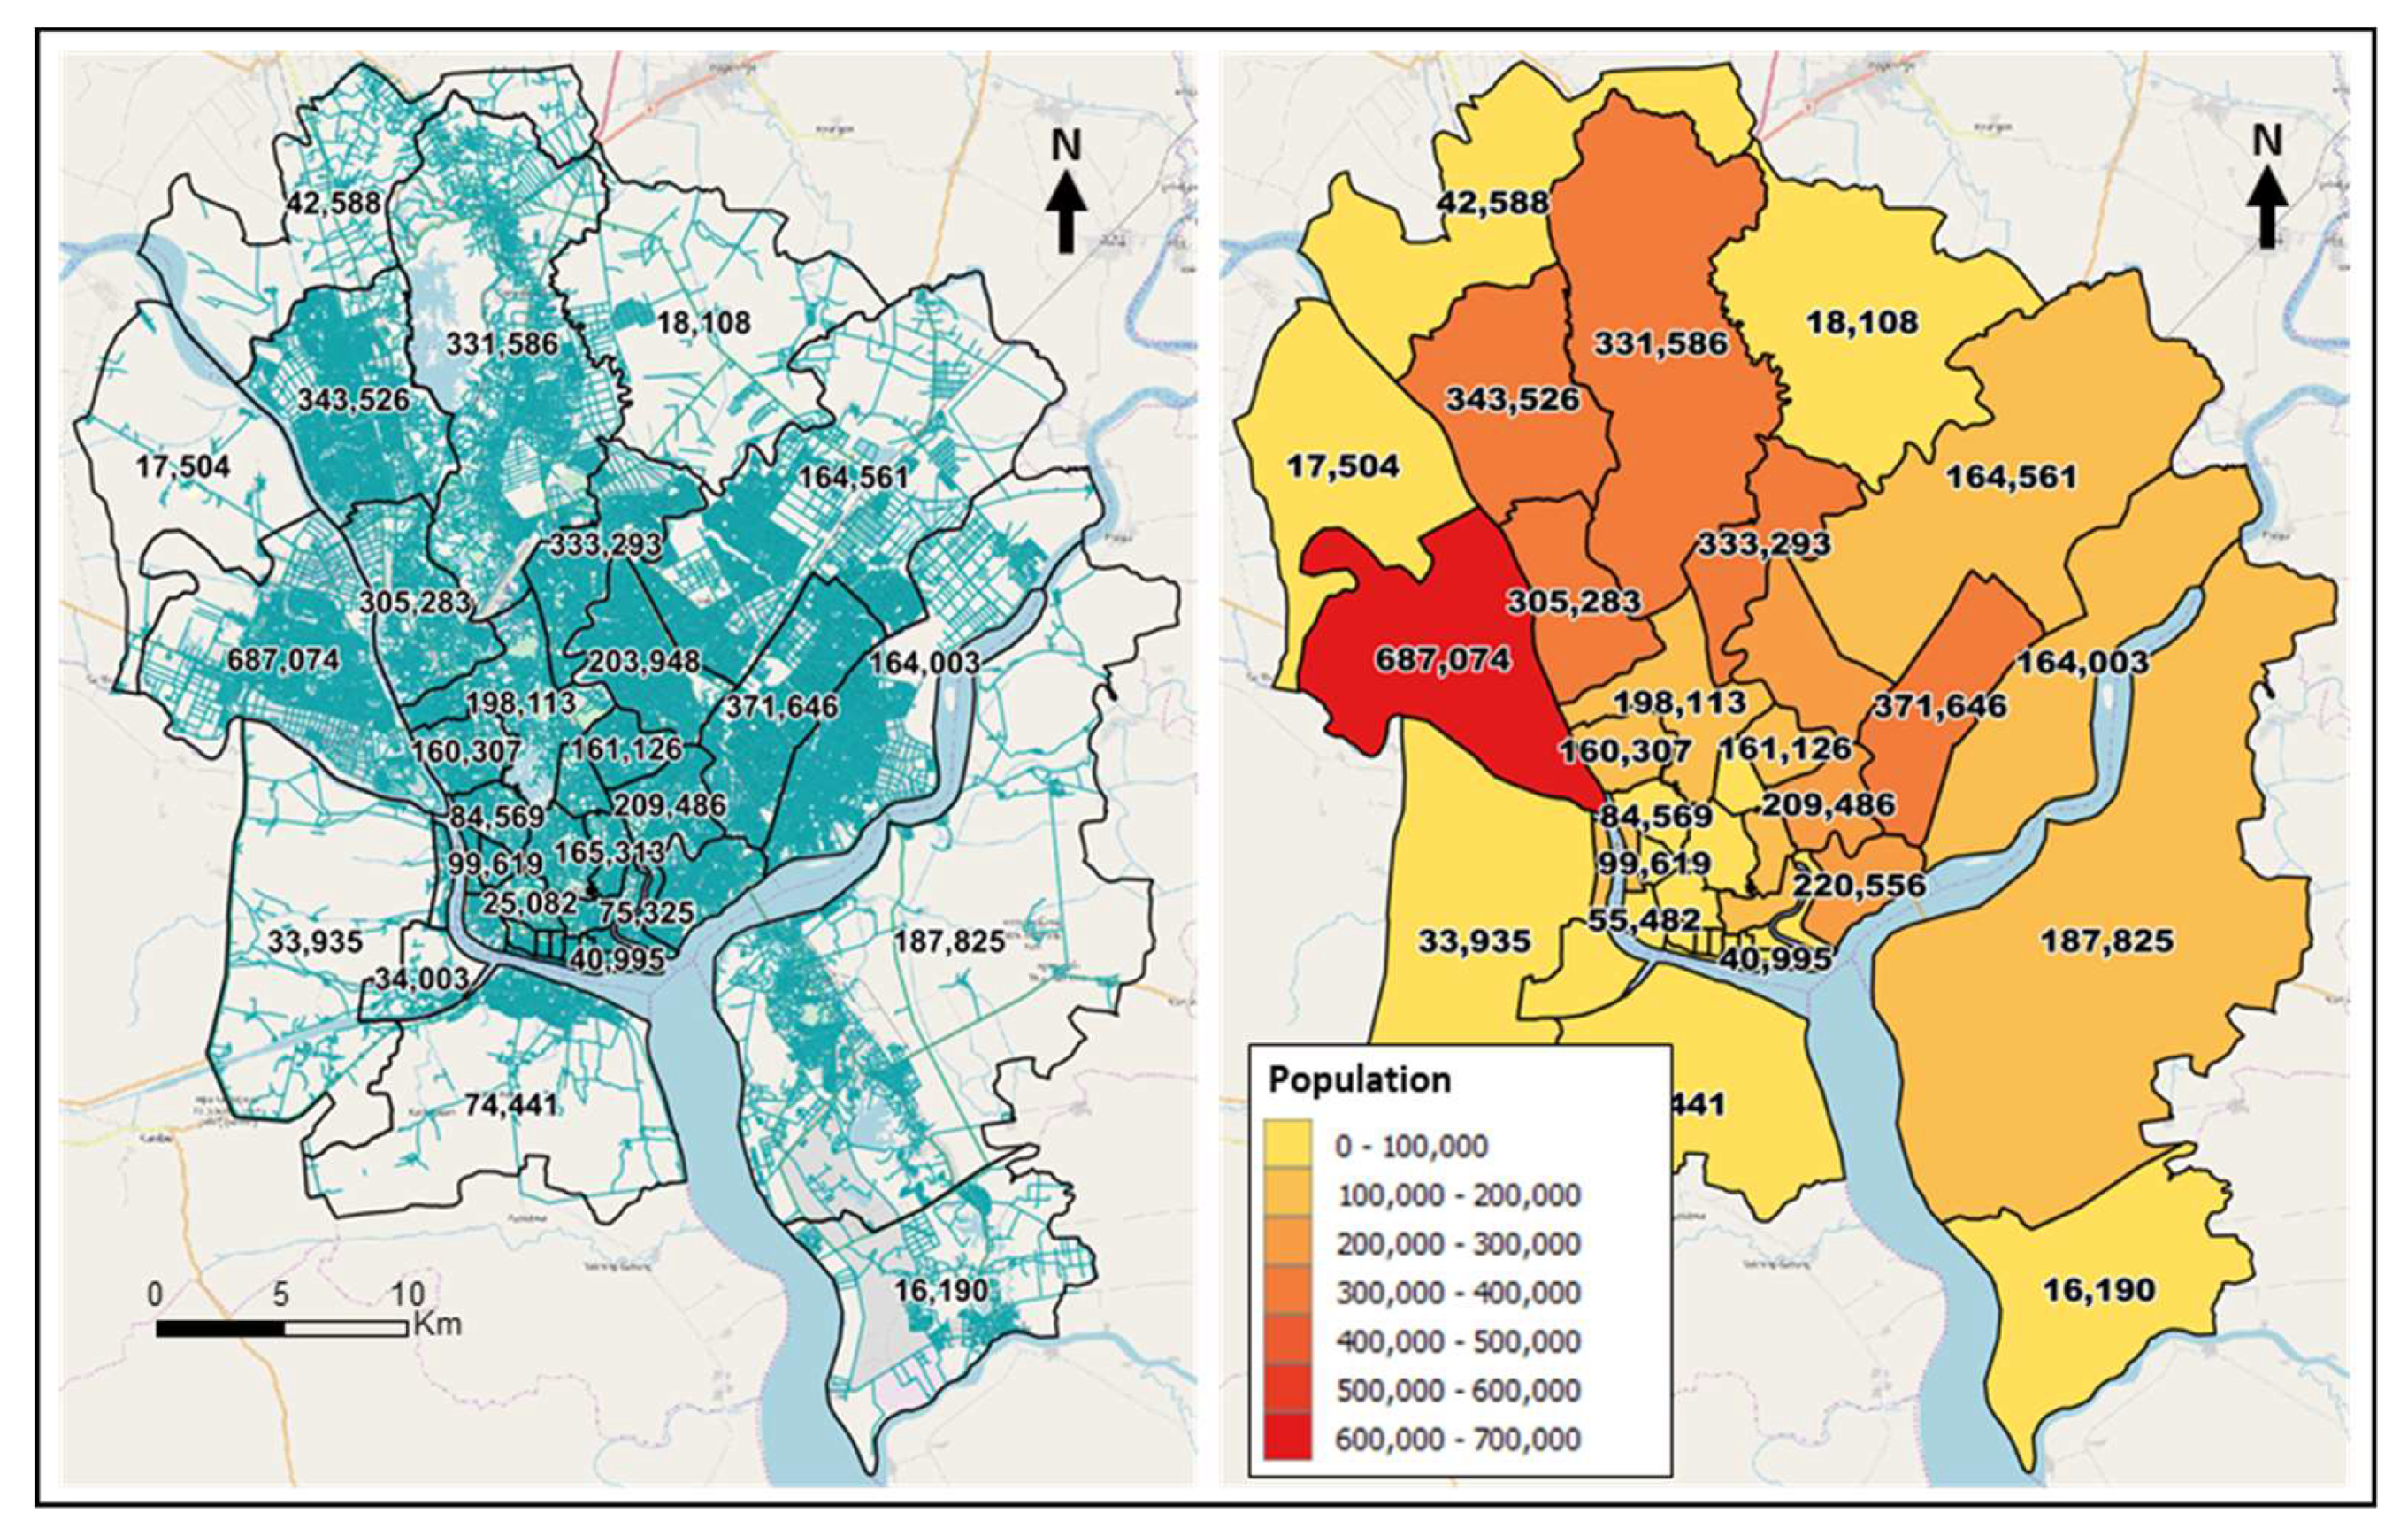
Figure 2.
Data processing and research flow. MPT—Myanma Posts and Telecommunications; CDR—call-detail records; OD—origin-and-destination.
Figure 2.
Data processing and research flow. MPT—Myanma Posts and Telecommunications; CDR—call-detail records; OD—origin-and-destination.

Figure 3.
Formatted MPT CDR for both voice and data with base transceiver station (BTS) locations.

Figure 4.
Graphical illustration of home-based magnification factor, link counts, population, and flow direction computational steps. (a) Home user extraction; (b) Finding PID with maximum call frequencies; (c) Counting total home users by Cell-ID; (d) Disaggregation of Cell-ID population with its home users; (e) Illustration of link counts, population and flow directions computation.

Figure 5.
Moving cell tower location to nearest road node to synchronize the directions and shortest path analysis. (a) Before moving Cell-ID; (b) After moving Cell-ID; (c) find the shortest path between two successive calls.
Figure 5.
Moving cell tower location to nearest road node to synchronize the directions and shortest path analysis. (a) Before moving Cell-ID; (b) After moving Cell-ID; (c) find the shortest path between two successive calls.
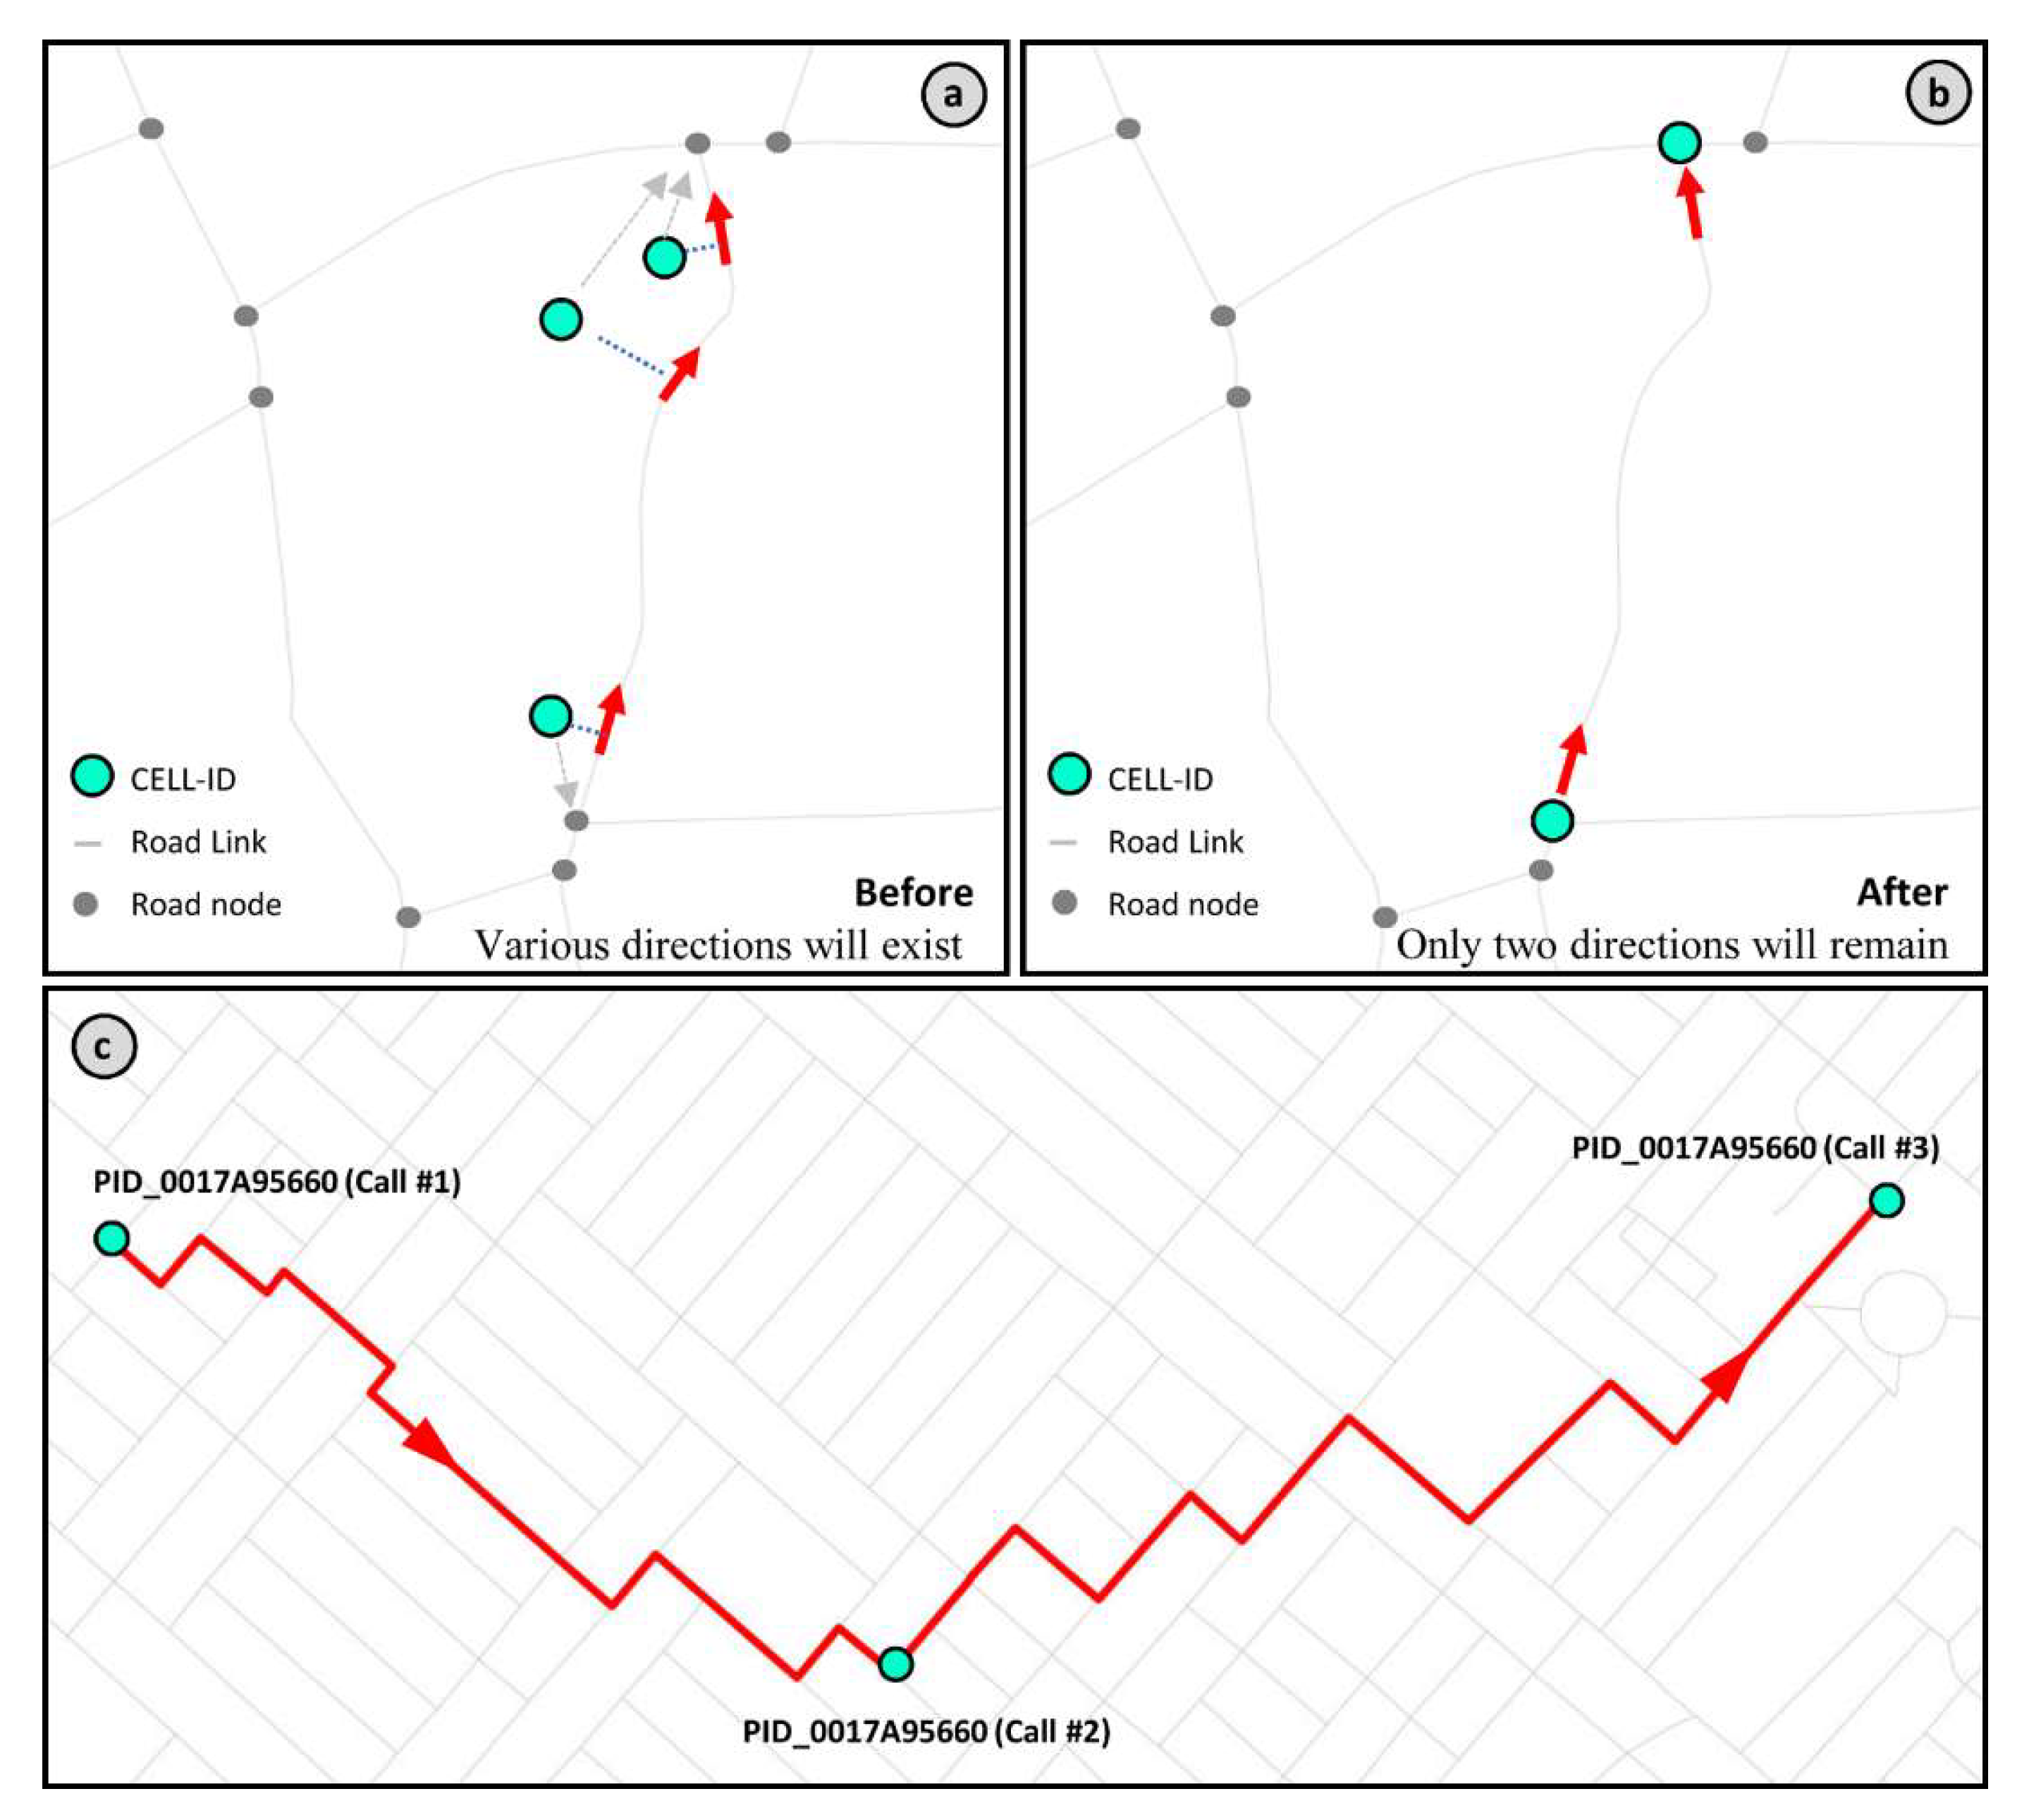
Figure 6.
Link population (magnitude) between 06:00 and 07:00.

Figure 7.
Link population (magnitude) between 17:00 and 18:00.
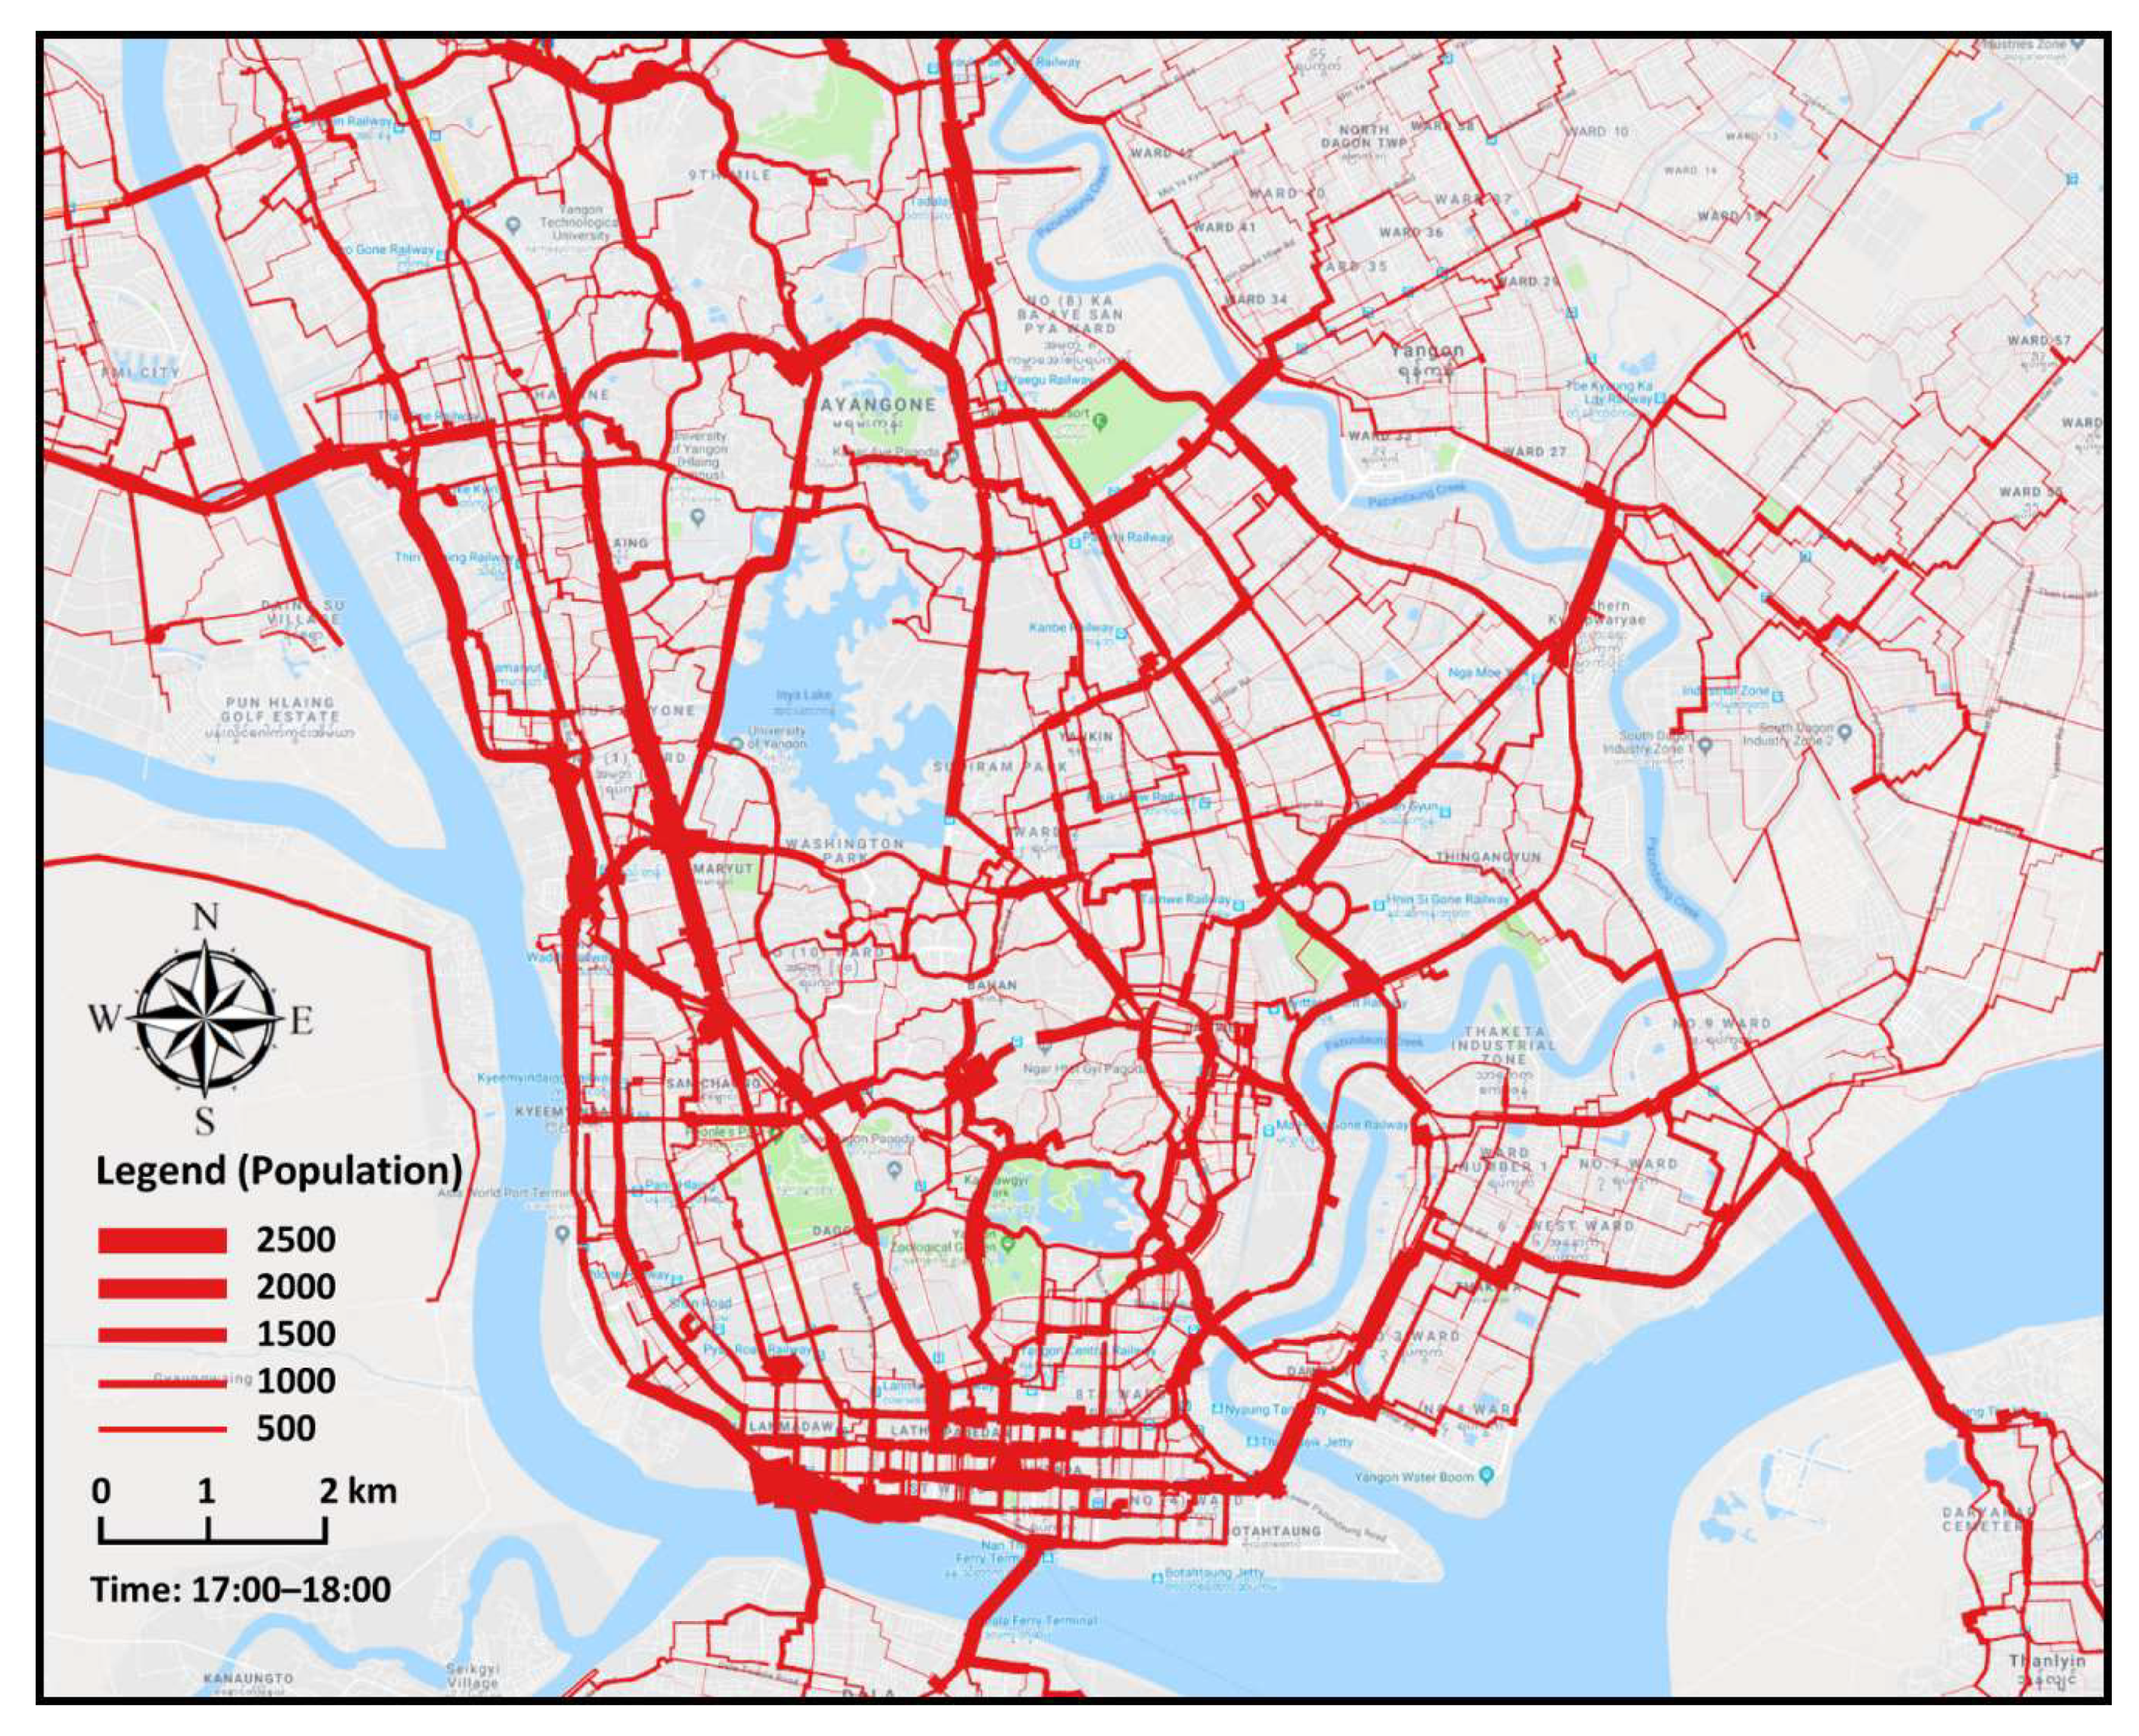
Figure 8.
Hourly link flow direction between 06:00 and 07:00.

Figure 9.
Hourly link flow direction between 17:00 and 18:00.
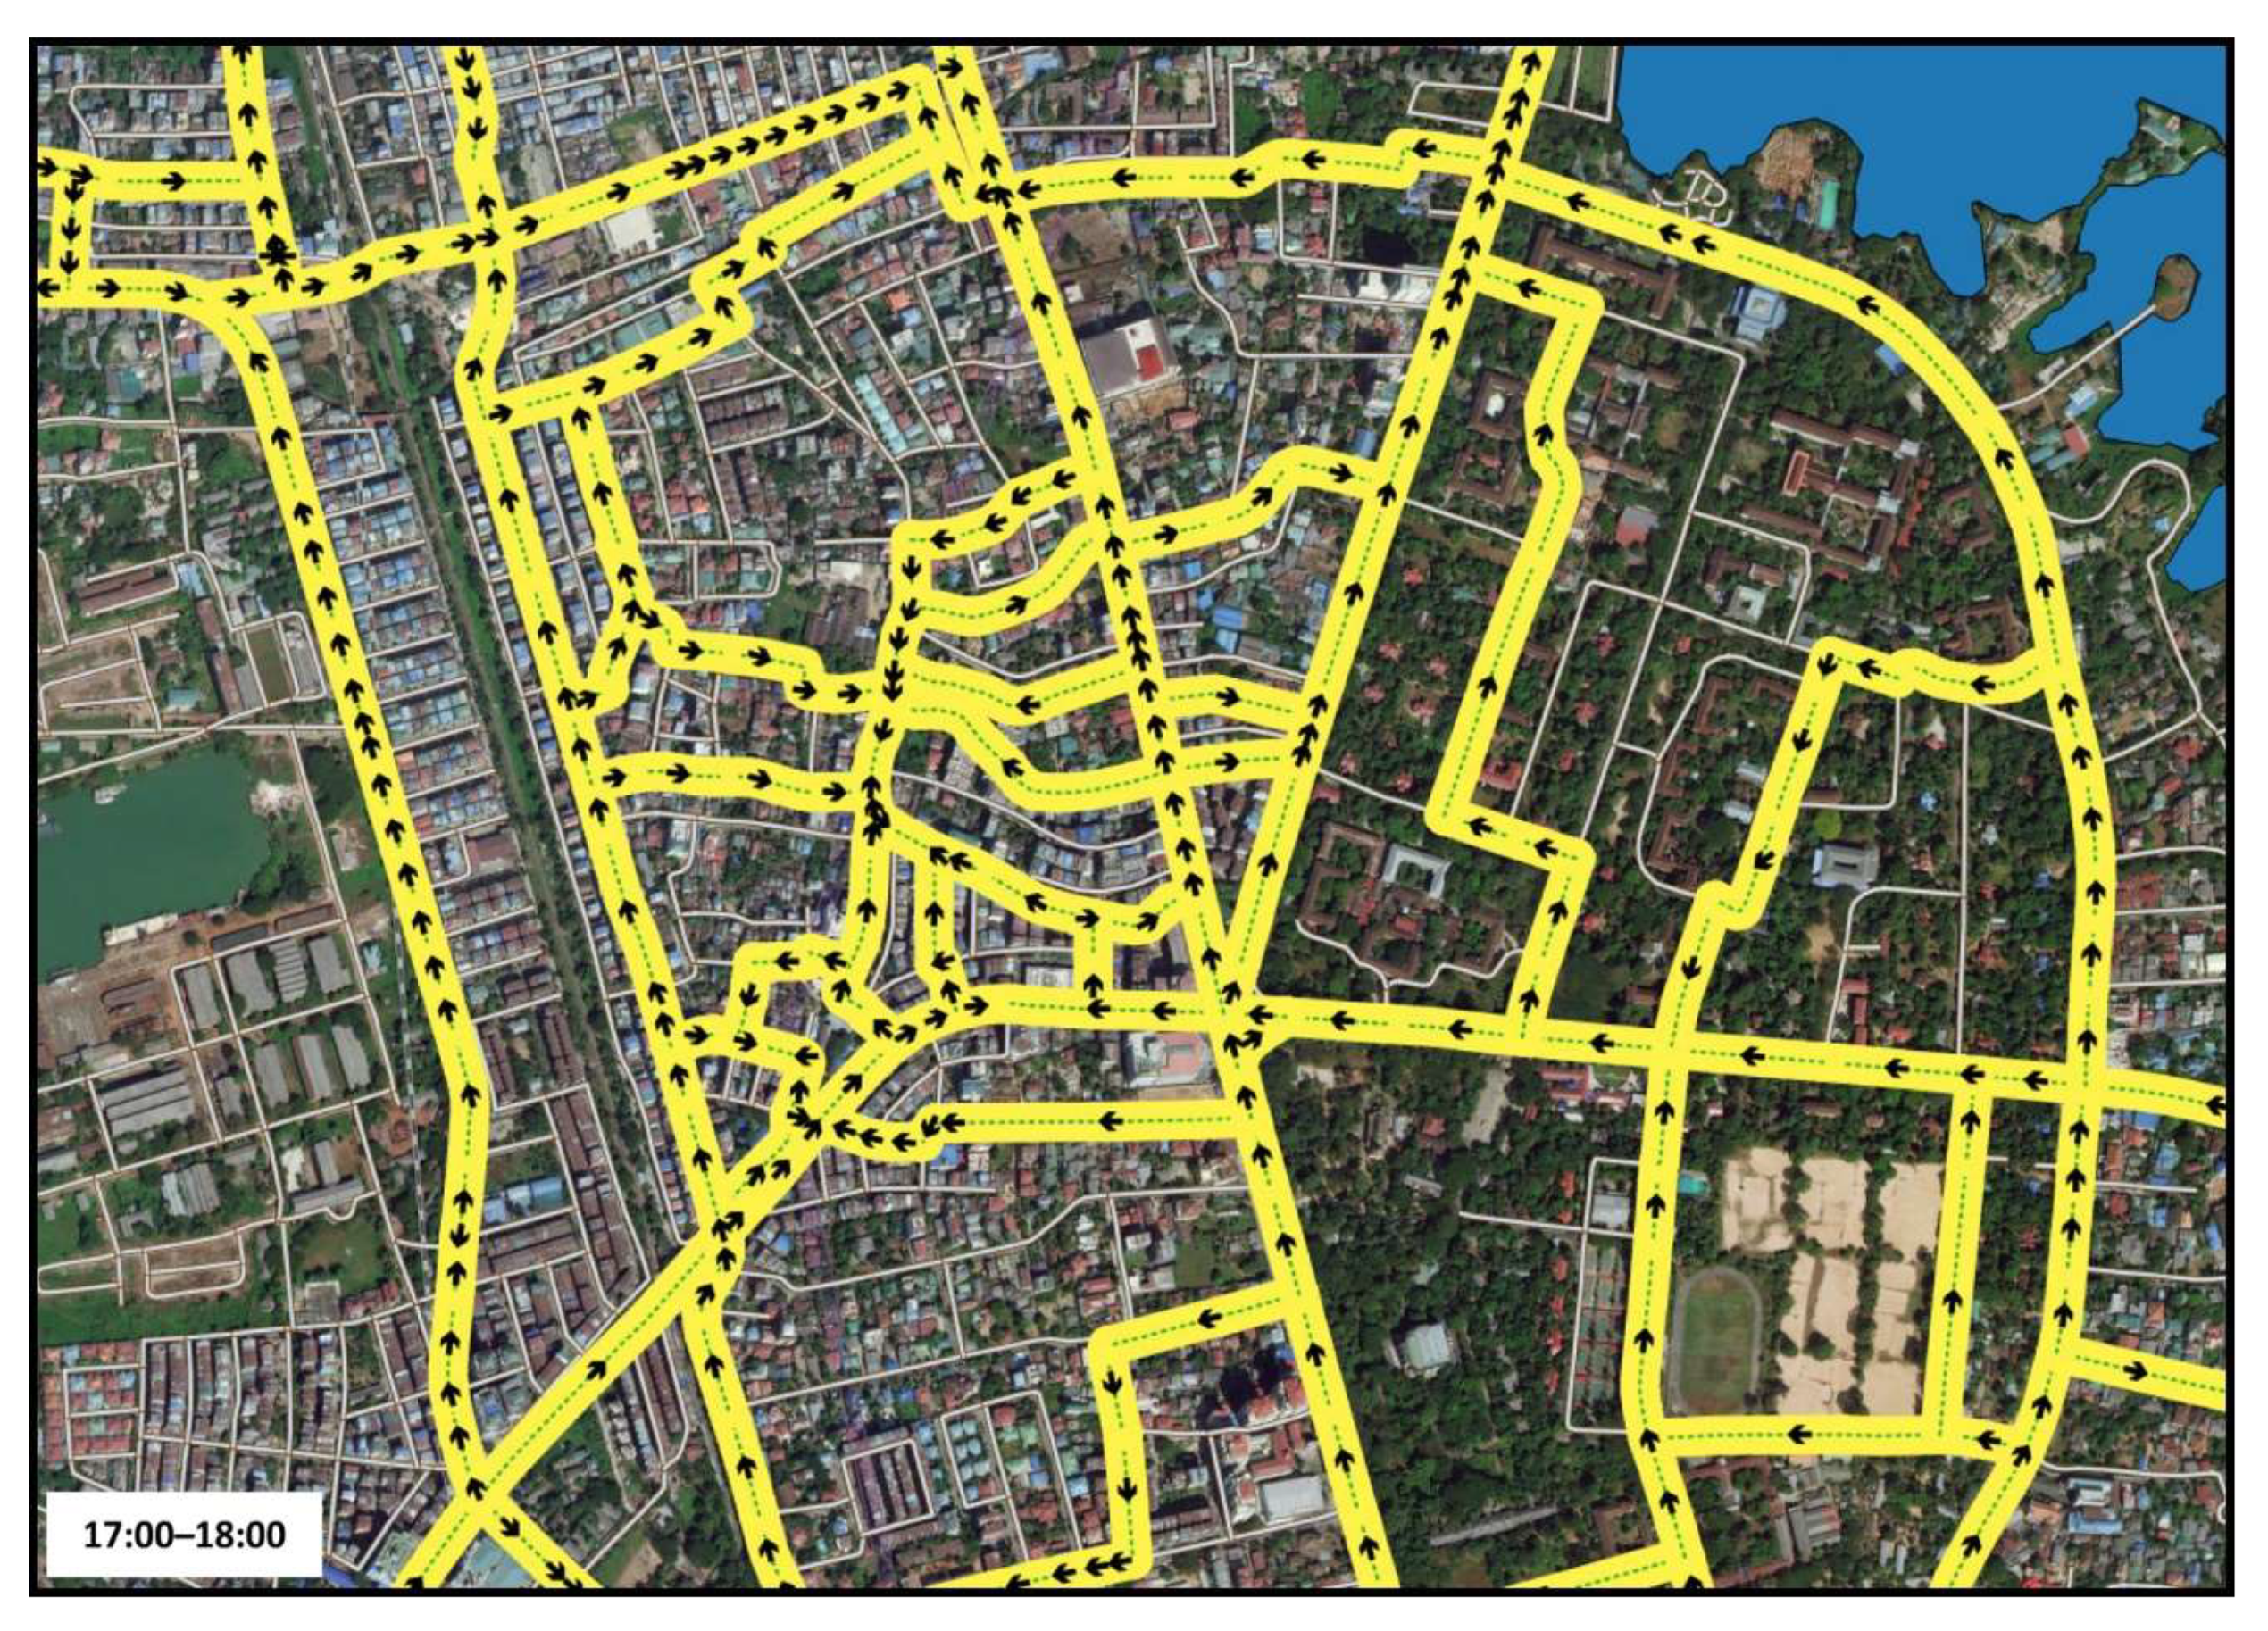
Figure 10.
(a) Hourly link flow direction with population values for both directions between 06:00 and 07:00. (b) Comparison of hourly flow magnitude for both southbound and northbound at Hledan Junction. (c) Ground-truth data collection for result validation.
Figure 10.
(a) Hourly link flow direction with population values for both directions between 06:00 and 07:00. (b) Comparison of hourly flow magnitude for both southbound and northbound at Hledan Junction. (c) Ground-truth data collection for result validation.

Table 1.
List of data, source, attribute information, and purposes. OD—origin-and-destination.
| Dataset Name | Data Source | Acquisition Date | Attribute Information | Purpose |
|---|---|---|---|---|
| MPT CDR | Myanma Posts and Telecommunications (MPT) call-detail records (CDR) for Myanmar | 1 December 2015 to 7 December 2015 | CDR for both voice and data, including text messages Attributes:
| To generate OD pairs for individuals |
| GIS road network | Yangon City Development Committee (YCDC) | 2013 | Road names, type, length, etc. | To compute trip distance, speed, and direction |
| National census | Myanmar Information Management Unit (MIMU) | 2014 |
male, female, and total | To compute home-based magnification factor (h-MF) |
| JICA Transport Surveys Report | Japan International Cooperation Agency (JICA) | Transport surveys conducted between February 2013 and August 2013 |
| Result validation |
© 2018 by the authors. Licensee MDPI, Basel, Switzerland. This article is an open access article distributed under the terms and conditions of the Creative Commons Attribution (CC BY) license (http://creativecommons.org/licenses/by/4.0/).
Share and Cite
MDPI and ACS Style
Lwin, K.K.; Sekimoto, Y.; Takeuchi, W. Estimation of Hourly Link Population and Flow Directions from Mobile CDR. ISPRS Int. J. Geo-Inf. 2018, 7, 449. https://0-doi-org.brum.beds.ac.uk/10.3390/ijgi7110449
AMA Style
Lwin KK, Sekimoto Y, Takeuchi W. Estimation of Hourly Link Population and Flow Directions from Mobile CDR. ISPRS International Journal of Geo-Information. 2018; 7(11):449. https://0-doi-org.brum.beds.ac.uk/10.3390/ijgi7110449
Chicago/Turabian StyleLwin, Ko Ko, Yoshihide Sekimoto, and Wataru Takeuchi. 2018. "Estimation of Hourly Link Population and Flow Directions from Mobile CDR" ISPRS International Journal of Geo-Information 7, no. 11: 449. https://0-doi-org.brum.beds.ac.uk/10.3390/ijgi7110449
Note that from the first issue of 2016, this journal uses article numbers instead of page numbers. See further details here.