Technical Note

Creating a Story Map Using Geographic Information Systems to Explore Geomorphology and History of Methana Peninsula

1
Faculty of Geology and Geoenvironment, National and Kapodistrian University of Athens, Panepistimioupoli Zografou, 15784 Athens, Greece
2
Natural Hazards, Tsunami and Coastal Engineering Laboratory, Technical University of Crete, 736 00 Chania, Greece
3
Engineering—Research—Software Development, Michail Mela 21, GR-11521 Athens, Greece
*
Authors to whom correspondence should be addressed.
ISPRS Int. J. Geo-Inf. 2018, 7(12), 484; https://0-doi-org.brum.beds.ac.uk/10.3390/ijgi7120484
Submission received: 25 October 2018 / Revised: 7 December 2018 / Accepted: 16 December 2018 / Published: 18 December 2018

Abstract

:
Story maps are used as an interactive tool for communication and information dissemination. A web-based application using story mapping technology is presented to explore the Methana peninsula. This volcanic area is characterized by specific volcanic geoforms, unique flora and rich history. The story map combines maps, narrative texts and multimedia content. The spatial data produce thematic maps created by a Geographic Information System on geological data, historical monuments, biodiversity and hiking paths. The purpose is to highlight the distinguishing characteristics of the Methana peninsula, to enable users to interact with maps, texts and images and to inform professional and non-professional users about the particular aspects of volcanic areas.

1. Introduction

The rapid evolution of Geographic Information Systems (GIS) provide new tools for spatial analytics with complex variable datasets. Maps are the traditional medium of presenting spatial objects, or results of a spatial analysis. Story Maps have been developed the last years for use at all levels of expertise. It is a powerful way to create, explain and present people a story for any subject. It is crucial for identifying various aspects of the same topic. Story maps are much more than thematic maps; they are an indispensable way of communication. They provide an effective visualization, robust and explanatory with multi-media data like photos and videos to emphasize story telling.
The idea of using story map data has expanded rapidly especially for education (ESRI). Baker [1] emphasizes the effectiveness of web GIS and mapping as a tool for improving student learning. A story map allows not only interaction with the map but also with the text. There are examples for education where students use the story maps to explore their world [2]. Graves [3] notes that users are more likely to engage in a story that sustains their interest, so a variety of text, maps, graphs, video and audio clips maximizes the story’s overall content. Story maps are web applications to upload and manage multimedia data, beginning with an existing map, with the goal to share and participate [4]. As web applications, they are a communication tool providing the ability for every user to include functions and data for a sophisticated story. Since it is an open source dynamic tool, knowledge can be shared and exchanged at any topic. It is a tool including a variety of apps that provide different ways of interacting with maps [5].
In addition, Story Maps can be used from non-GIS users to distribute scientific results and make them easily understood [6,7]. The main advantages are the interactivity compared to the classical maps, the active intervention of any user and the ability to present a big variety of media at the same time. A story map is a “data storytelling” or “data-driven storytelling” instrument that has been used to reveal hidden information from data and to present them to every user.
In the scientific areas of geovisualisation and geovisual, analytics have been applied to the creation of geovisual stories or story maps, using maps, texts, photos, and graphs [6,8]. A web-based application based on Google Earth “Voyager” has rapidly attracted many users and a guided story is created and updated weekly [9]. Geospatial applications develop story maps as an interactive and communicative tool. Robinson [10] presents geovisual analytics related to analytical reasoning with spatial information using interactive visual interfaces. Another approach develops interactive mapping systems to explore spatial data, detect patterns, and predict future outcomes [11]. It presents a geovisual story that connects visual snapshots, with textual metadata for further explanation and identification of important results extracted with geovisual analysis. It is also recognized in the field of geovisualization, that the ability to look at data from different perspectives, such as alternative map views in combination with diagrams, graphs, photographs, and videos, can facilitate the transformation of data into information and ultimately into knowledge [11,12]. For example, an Ocean Story Map is a web-based tool to demonstrate the ocean content and to spread important information about the ocean environment [13]. Other geographical applications like land use and urban planning use Story Maps for marketing purposes [14].
This paper presents a web-based application to disseminate information to geologists, earth scientists, tourists and other non-expert users to explore the Methana Penisnula (https://goo.gl/ok1j9F). It uses the Methana Peninsula as the case study (https://goo.gl/ok1j9F), because it combines both scientific as well as tourist interest. The application is an effort to disseminate scientific data along with information more popular to the general public like hike trails, churches, archaeological sites, etc.
In the outlined Story Map, the special volcanic geomorphological features, as well as the cultural monuments of the Methana Peninsula (East Peloponnese, Greece) were identified, recorded, mapped and photographically represented. The story map presents the physical and historical characteristics of the Peninsula together with the surrounding environment. Users can identify historical buildings, landmarks and geological features of great importance. In order to compose this Story Map, a Geographical Information System was used, the ArcGIS platform from ESRI Company, with both desktop and online applications [15].

2. Application to the Methana Volcano Peninsula

The peninsula of Methana has a long recorded volcanic history, the last eruption took place in 230 BC as recorded by the ancient geographer Strabo [16]. It is located at the Western Saronic Gulf, approximately 163 km from Athens, covering an area of 50 km2. Today, Methana is well suited for family, religious, and health tourism. It is ideal for hiking trips in beautiful paths between the hills, interesting for the unique Flora and Fauna and offers plenty of Byzantine churches and small chapels. It is a traditional site for hot baths and health spas. For these reasons, we decided to create a story map for the Methana Volcano Peninsula using existing data and new acquired in situ-data.

2.1. Methodology

A File Geodatabase was created through ArcMap v.10.5.1 software [17] and its schema is shown in Table 1. It is divided into two subsets of data. The first one consists of the available data files for the area (bibliography, topographic map, geological structure, etc.). Those that were in analog form were converted into digital, in order to make further use of them. All files were created using a projected coordinate system, the Hellenic Geodetic Reference System 1987 (HGRS87) [18], taking into account that all available information was already presented in this projection system and also bibliographic data will be kept in its original form for further research activities.
A second File Geodatabase was created which includes the vector data files that have been designed for the data collection in the field work. Two editable information layers have been created, for the field data collection one point and one polyline vector file, which apart from spatial information they also include descriptive information and photos or videos for each collected feature (Table 2, Figure 1). The formulation of the acquired information is shown in Figure 1. Collector for ArcGIS [19], was used both for Android and iOS software. In the next step, a webmap and the individual parameters for each of the information layers, e.g., its symbol and the appearance or not of tags and pop-up menus etc., have been created [20,21]. Moreover, a refresh interval for the information layer regarding data collection has been defined. Specific symbols for each user group have been created, so that each group can directly be identified. Imagery, which is available from ArcGIS platform, was assigned to be the background of the above information layers (Figure 2).
The File Geodatabase that was created for field work was also used for adding the data files that resulted from the processing of the bibliographical data (including their transformation to WGS84 Web Mercator—Auxiliary Sphere), or their modification with new field data. These are the files that thematic maps were based on, according to ISO/TC211 International Standards 19100 series that supports data management, acquiring, processing, analyzing, accessing, presenting and transferring data between different users, systems and locations [23]. These files were gradually transformed into a format suitable for online use (feature or image services), uploaded directly to the online platform, ArcGIS Online [24,25], and introduced to the Story Map (Figure 3).
In this work, GIS technology was used only to collect, analyze and visualize data, using desktop and online interactive techniques. The main aim was to disseminate the data presentation to the public, combining scientific information about the volcanic peninsula with archaeology and history.

2.2. Story Map

After uploading all the necessary information layers to ArcGIS Online, a certain template, called Story Map Series was implemented, to present the available information. Story Map Series comes with three layout options: tabbed, side accordion and bulleted. The first one was selected for the main application. Web maps, narrative text, images, tables, video, external websites, scenes which correspond to 3D presentation of data, were used. Also, other Story maps and apps were embedded, such as Story Map Shortlist, Story Map Series-Side Accordion, Story Map Journal and Time Aware. Finally, Story Map Cascade was used as the home page of the whole application (Figure 4).
Thematic maps were created in ArcGIS Online, based on the collected data, fieldwork and literature review, depicting the most important and unique points (https://goo.gl/ok1j9F). More specifically: Home page using Story Map Cascade template, gives a general view of the Methana peninsula, containing a video recorded during a UAV flight. Also, it has been designed to provide the possibility to add a language preference, before entering the main application (Figure 5). The Story Map is available in Greek, and in English.
Entering the main application, users can see eight tabs and each one can be generally distinguished into two areas: one on the left where narrative text, photos, videos and tables can be presented and the main frame, where web maps, scenes or multimedia content can be added. In the first tab (Figure 6), general information about the Methana peninsula is given. For this purpose, another Story Map, Story Map Series—Side Accordion template, having five tabs, is embedded, as follows:
  • The first Accordion tab, gives information about the geographical position of the area and its historical evolution. Narrative text accompanied by images, describes the Methana peninsula which were first mentioned in ancient documents by Thoukididis (5th century B.C). It is an old tourist resort of Saronikos Gulf, known not only for its hot springs along its SE beach, but also for the Mavri Petra volcano at Kameni Chora settlement. A 3D representation of the peninsula, where users can choose either to use the predefined views of the area, or the available tools for rotating and tilting covers the main frame. As basemap, imagery from ESRI’s basic gallery maps was used, but there is also the possibility to change it into an OpenStreetMap.
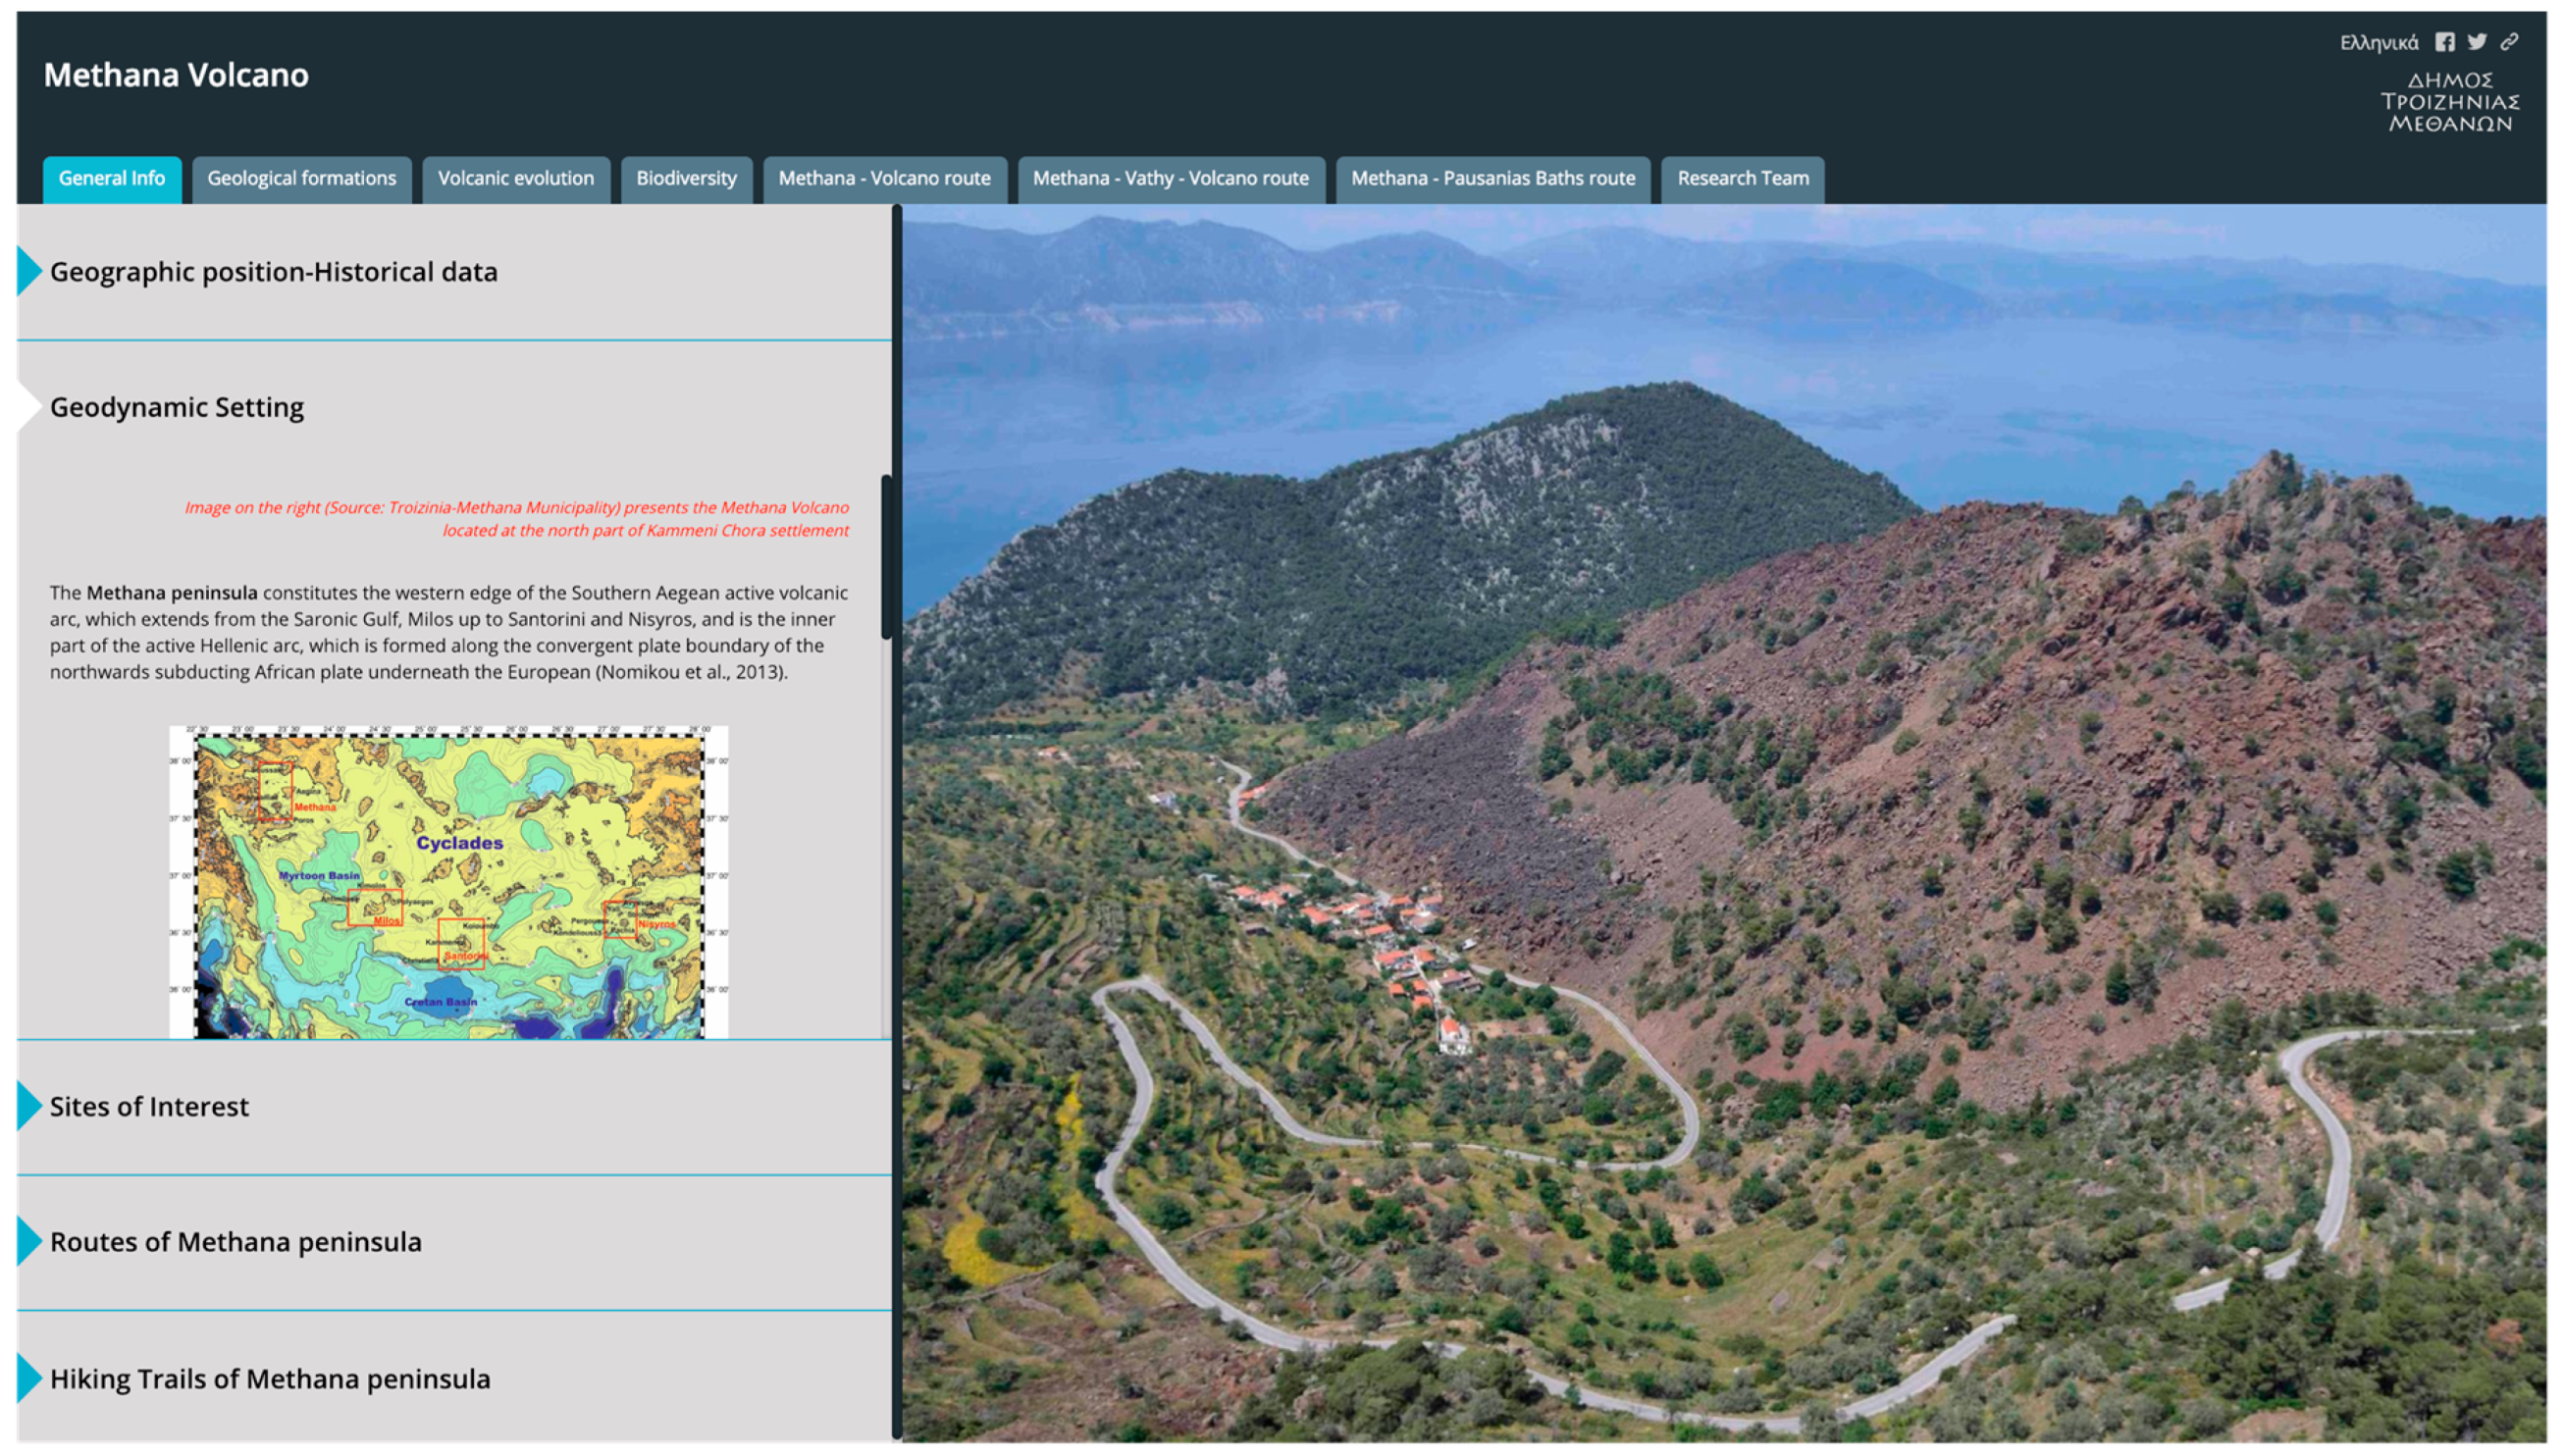
  • In the second Accordion tab (Figure 7), the geodynamic setting of the area is presented using narrative text accompanied by images to present the peninsula’s important position at the western edge of the Southern Aegean active volcanic arc. This arc extends from the Saronic Gulf to Milos up to Santorini and Nisyros, and is the inner part of the active Hellenic arc, formed along the convergent plate boundary of the northwards subducting African plate underneath the European one [26]. In the main frame a view captured during an UAV flight shows the Methana Volcano, which in its most recent eruption (230 BC) produced andesitic lava, at KameniChora, as described by Strabo, Pausanias and Ovidius [27,28,29].
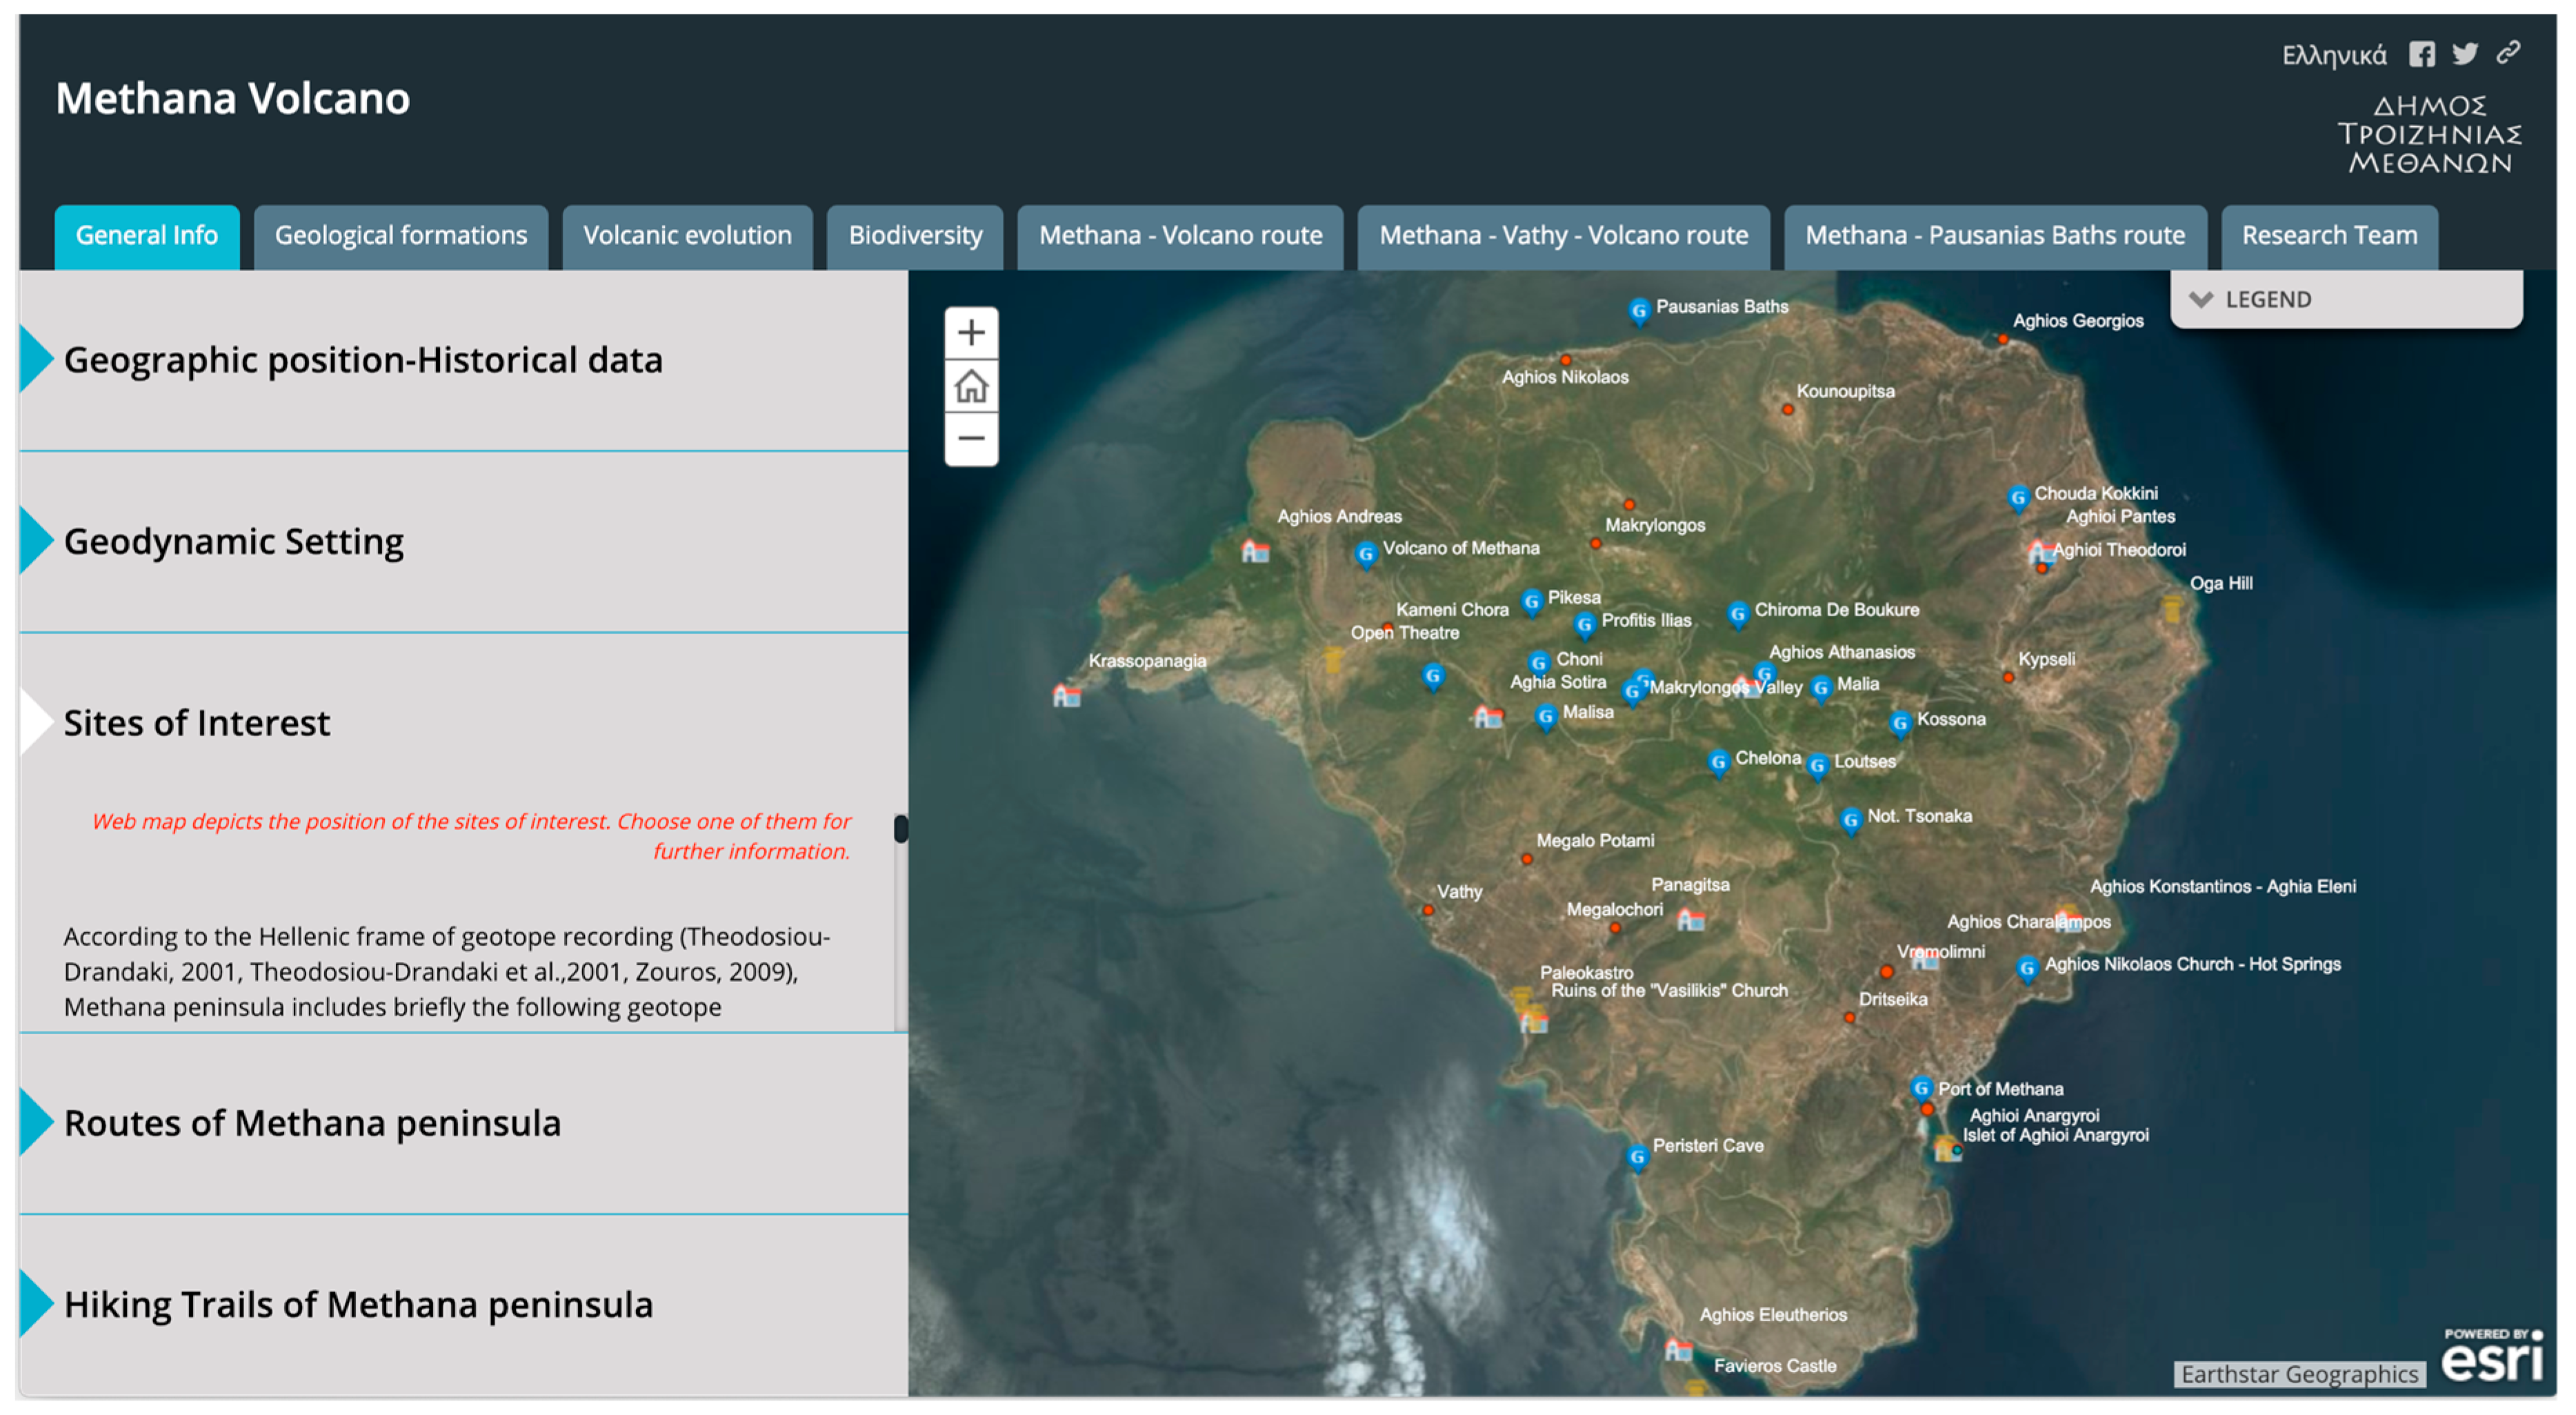
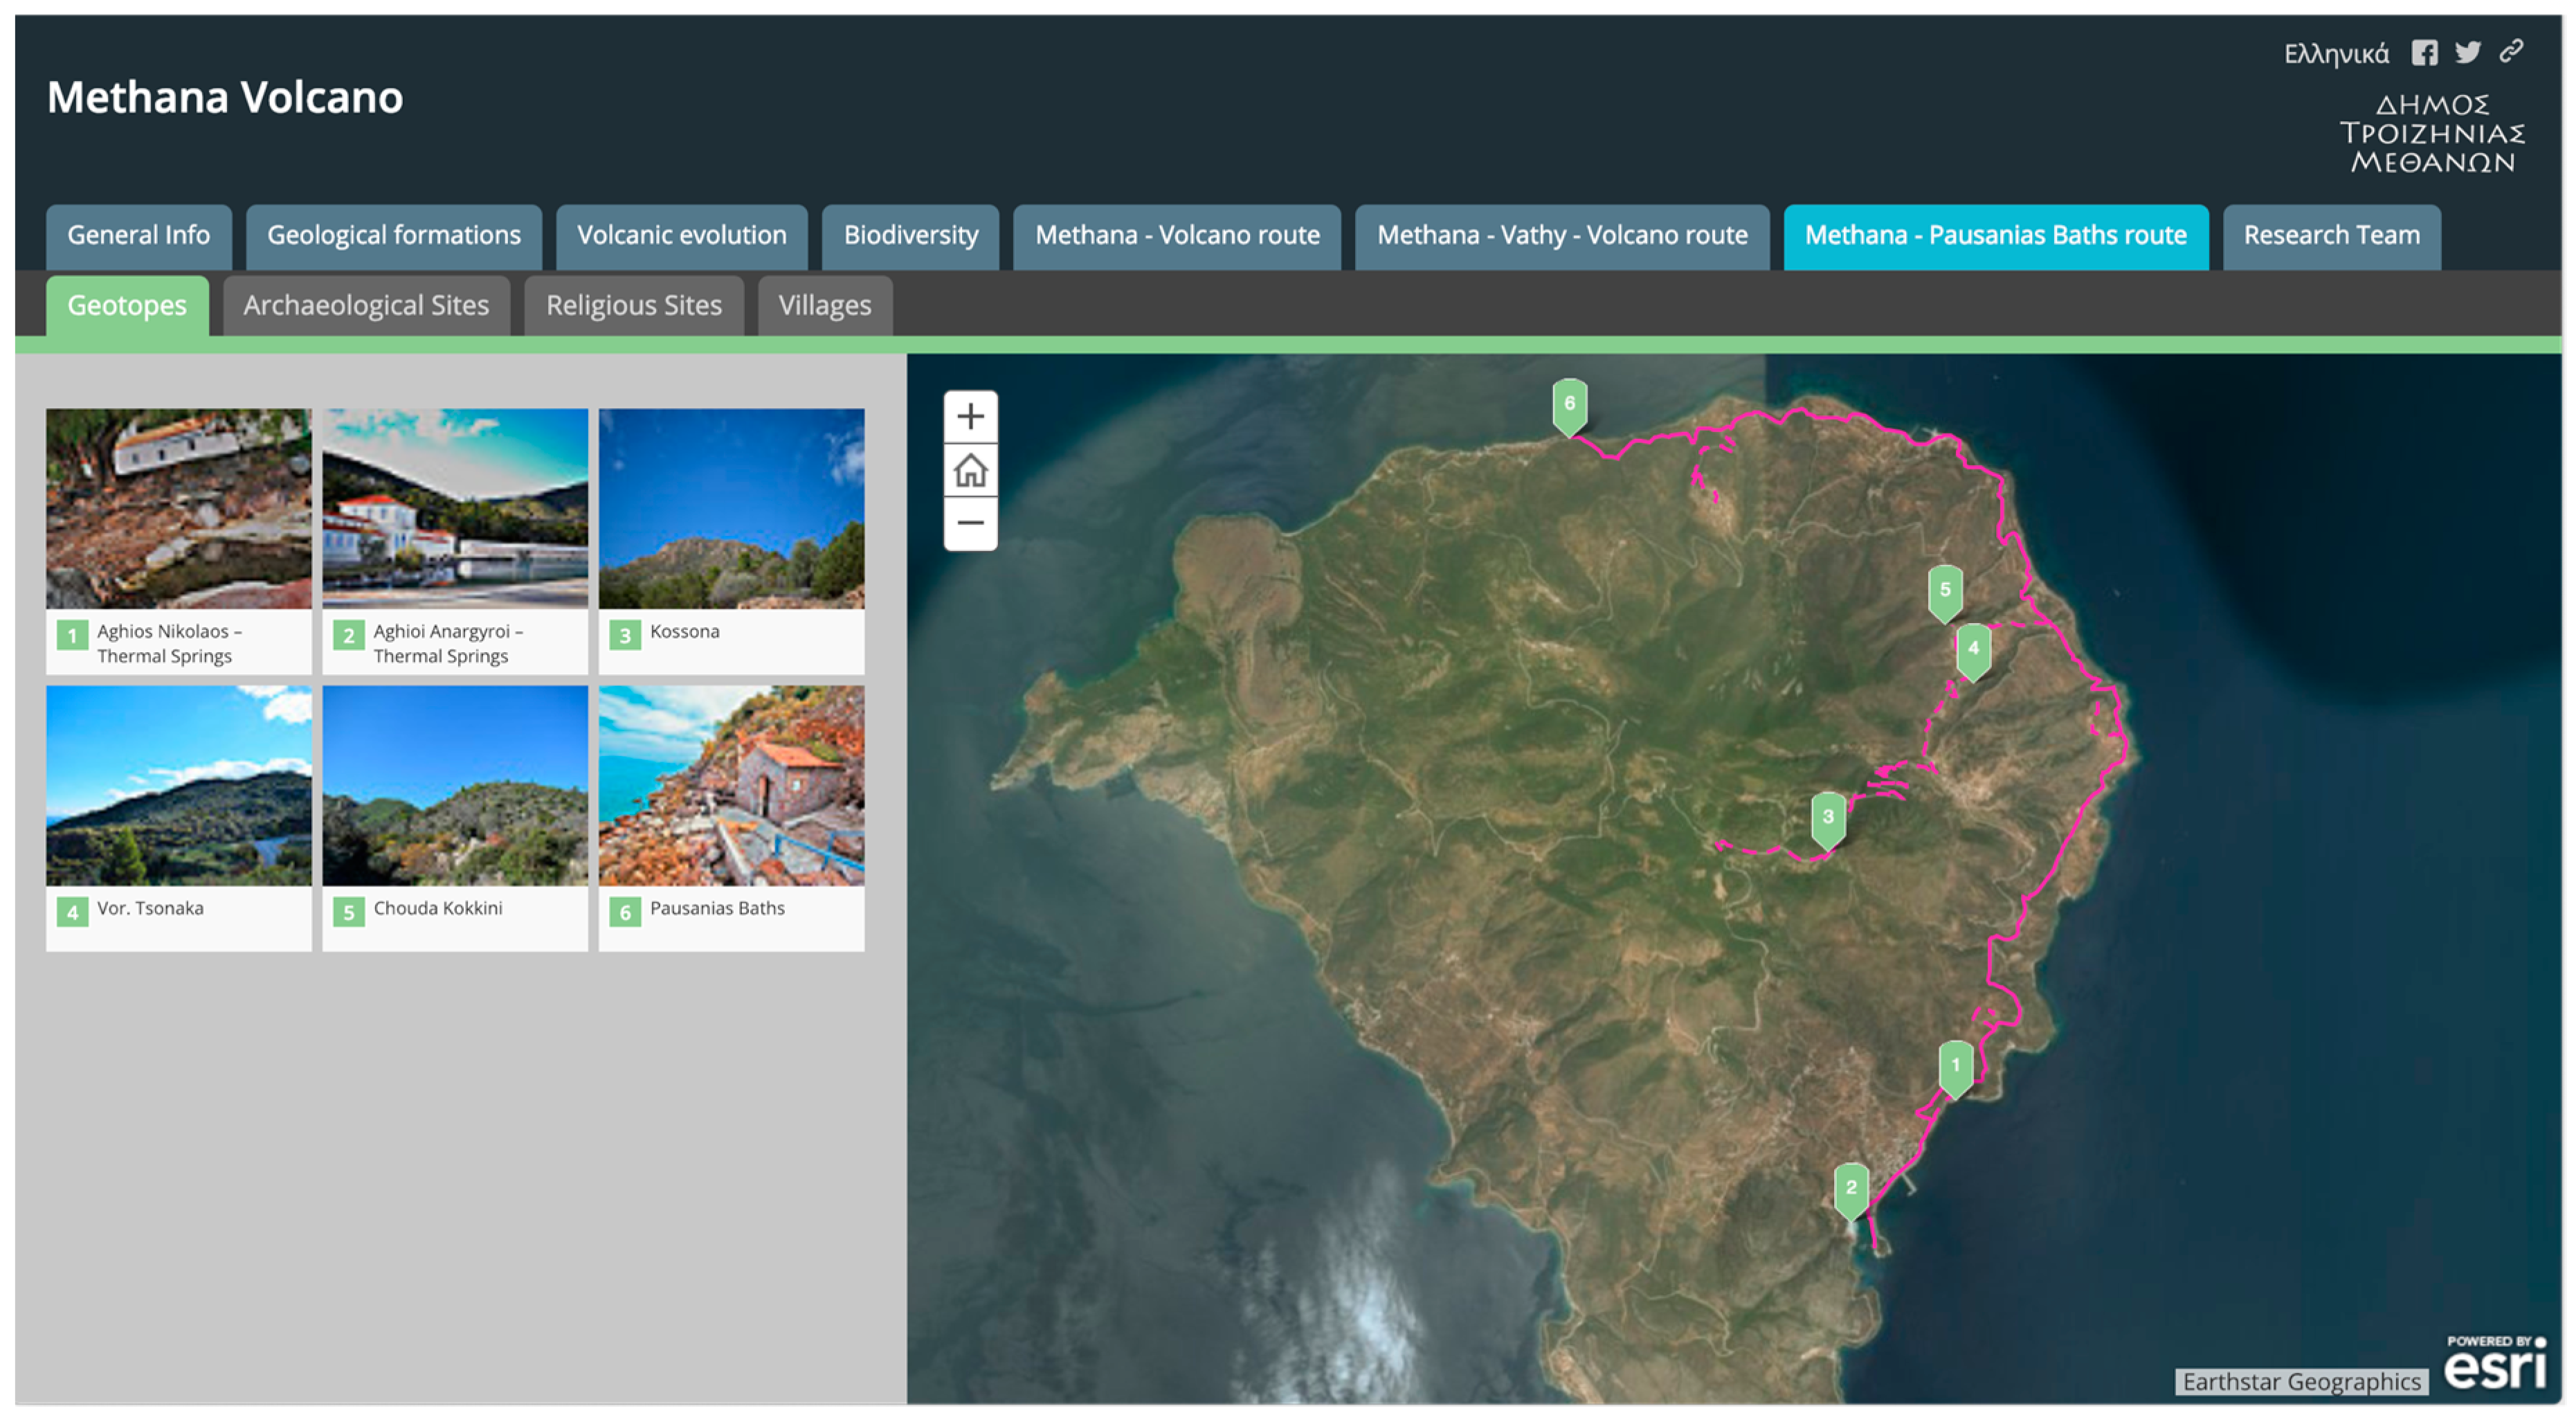
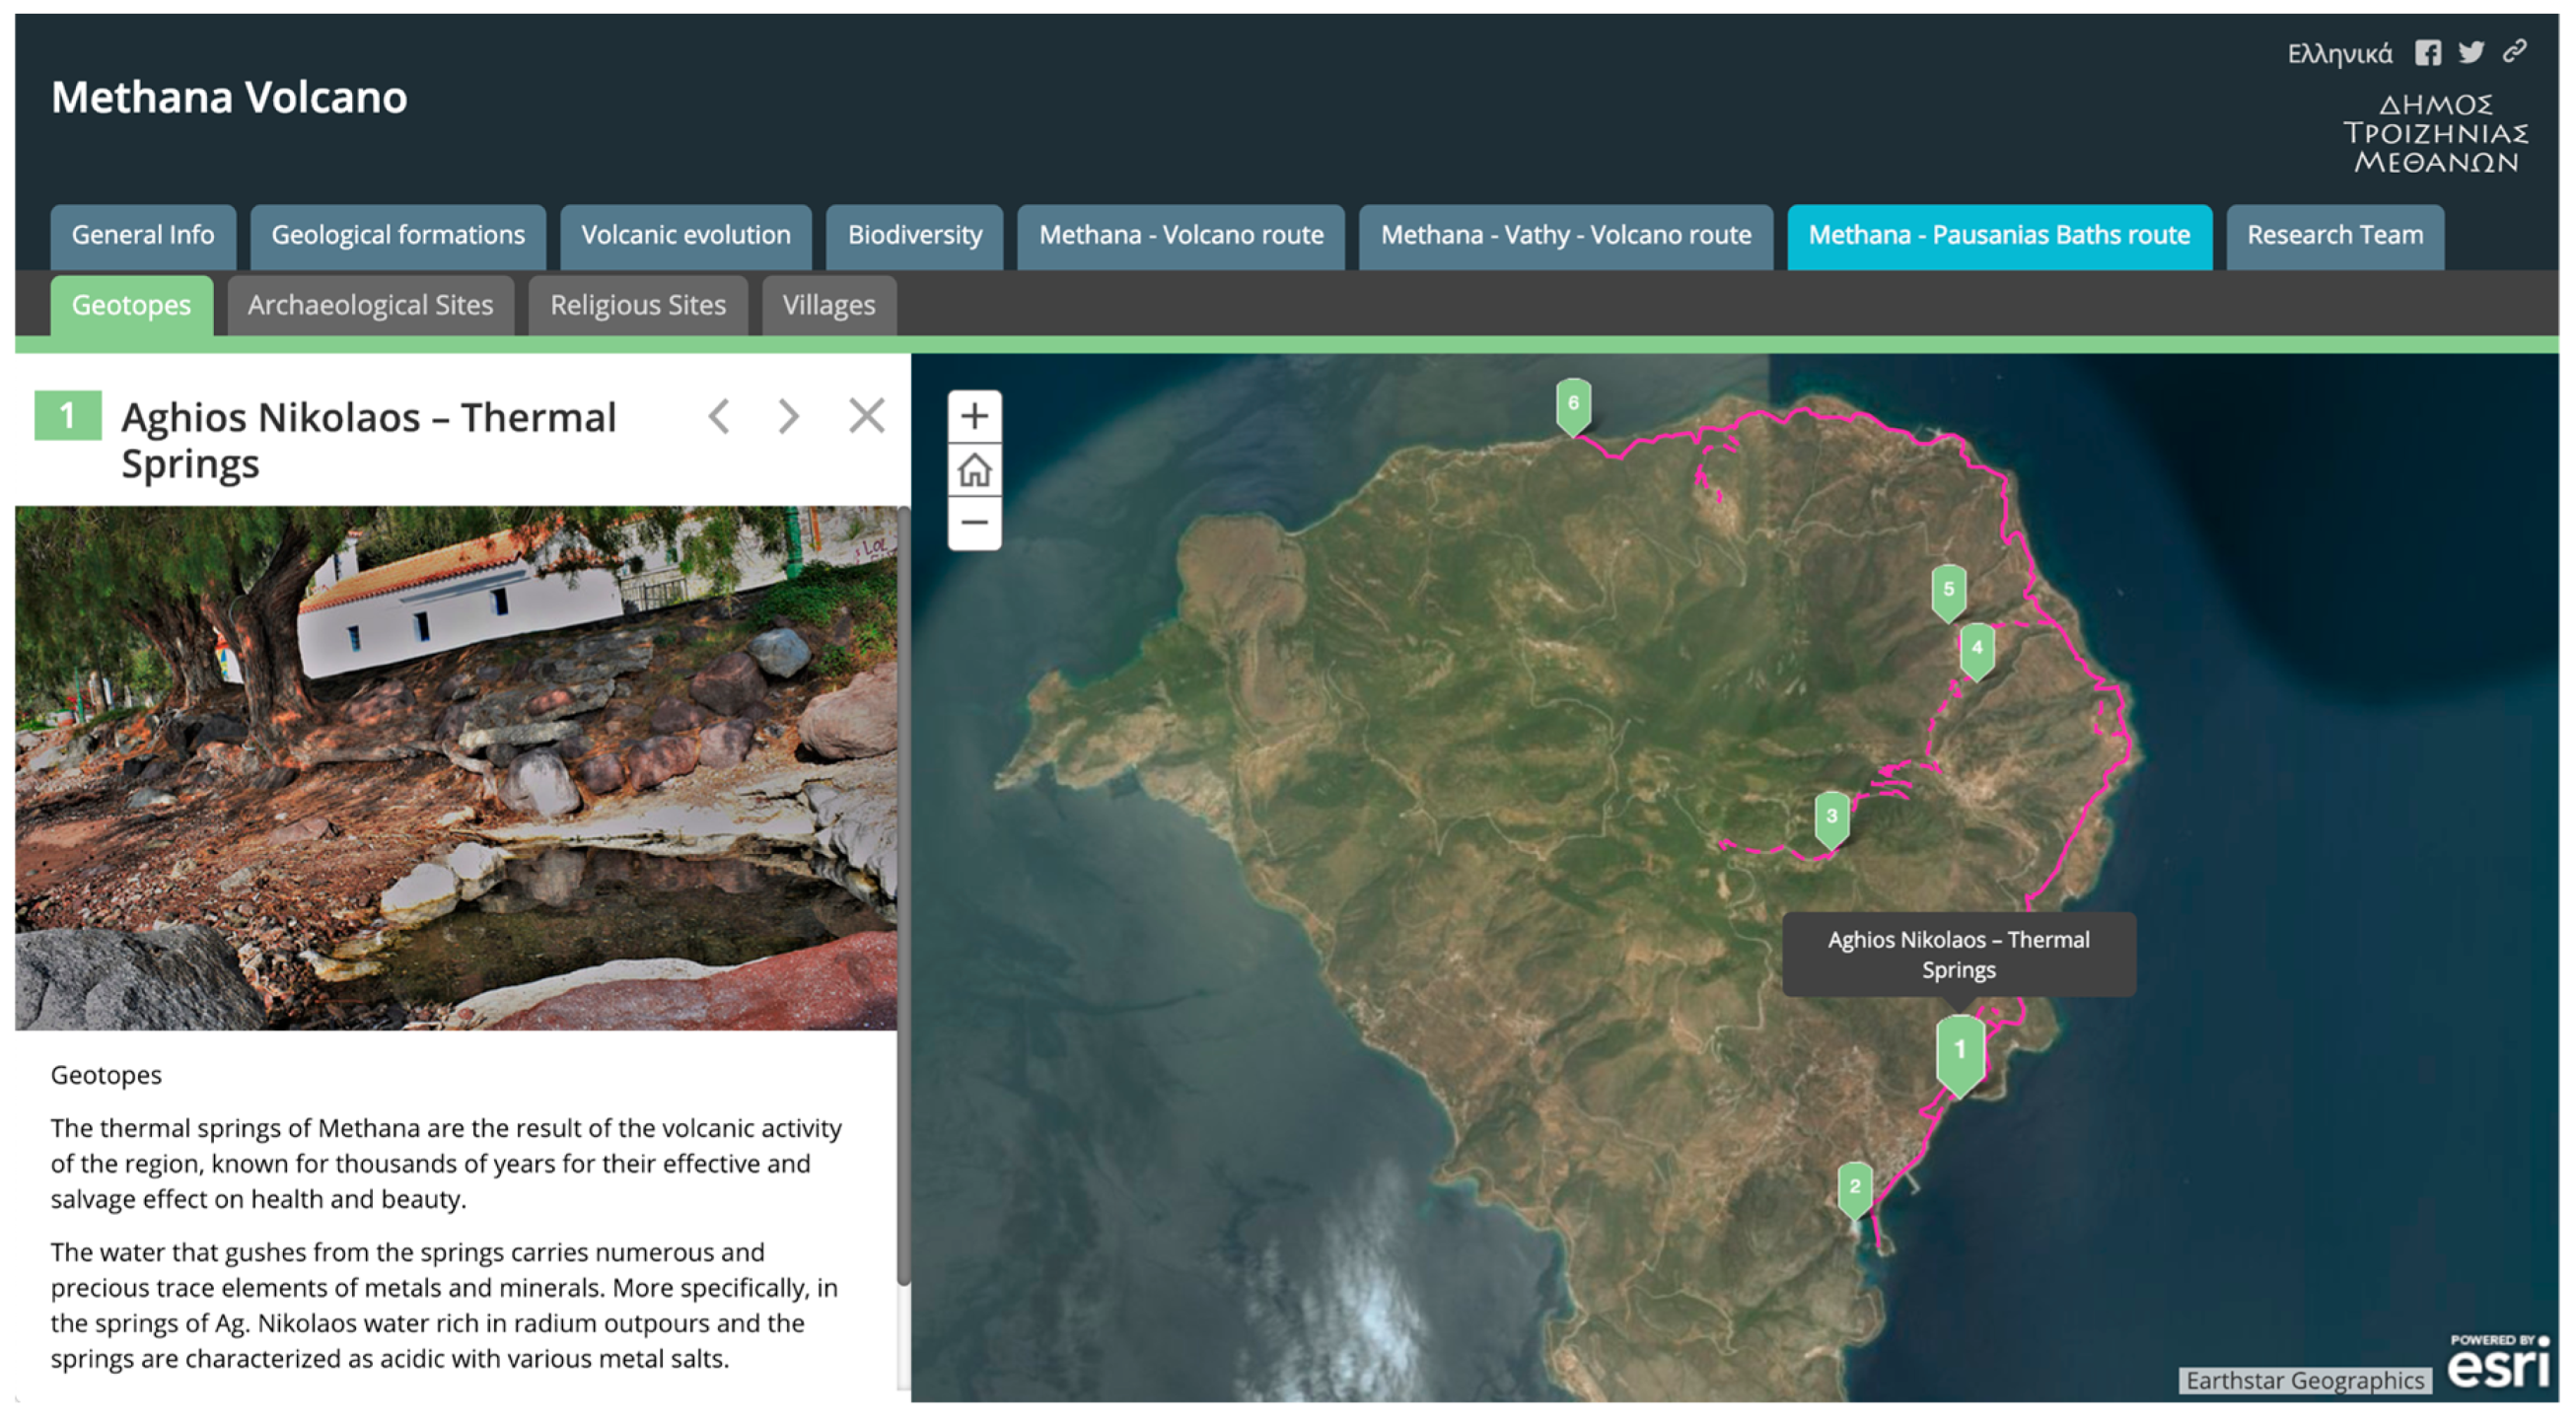
  • Third Accordion tab (Figure 8) contains information about the main points of interest, including geotopes, archaeological sites, religious sites and area’s settlements. Narrative text is giving explanatory information about interesting geoforms (e.g., volcanic geoforms, hot springs), tectonic structures (e.g., faults), sites of typical geomorphological structures (e.g., carstic formations), sites due to active geodynamic processes (e.g., coastalerosion), geo-mythical, geo-historical and geo-ancient sites and mining sites of mineral raw materials. A web map, shows their spatial distribution, having as basemap Imagery (from ESRI’s basic gallery maps). Users have the ability to choose a location to see additional information.
  • Fourth accordion tab (Figure 9) describes the main proposed paths of the Methana peninsula. Narrative text refers to each path separately, describing its route and giving information about the most characteristic features of it. A web map, using as basemap OpenStreetMap (from ESRI’s basic gallery maps), shows their location. Users can choose a path on the map to see representative photos.
  • Finally, fifth Accordion tab (Figure 10) contains information about certain hiking trails, as directed by the municipality of Troizinia-Methana, within the framework of the applied research program “Evaluation and exploitation of the Methana Volcano”. As the trails don’t abide by accepted technical specifications, it is highly recommended that hikers take tours on their own responsibility. Narrative text describes each one along with points of interest during its route and a web map shows their location on the OpenStreetMap basemap (from ESRI’s basic gallery maps). Users can select a trail to see representative photos.
Returning to the main application, the second tab (Figure 11) presents the geological setting of the peninsula. Narrative text refers to the volcanic complex of the Methana peninsula which comprises of volcanic domes, emplaced along the tectonic zones of the Western Saronic Gulf trending NNW-SSE and NE-SW, lava flows radiating from the central part of the peninsula and pyroclastic rocks. It also gives definition about the main volcanic product, the pyroclastic flow. As basemap, a 5 m-hillshade of the area overlying OpenStreetMap (from ESRI’s basic gallery maps) was used and 3D presentation was created. Users can choose either to use the predefined views of the area, or the available tools for rotating and tilting the area.
In the third tab, the volcanic evolution of the Methana peninsula is presented (Figure 12). Narrative text describes the eight evolutionary volcanic phases which have been proposed by Pe-Piper and Piper [30], taking into account new radiometric dating and by interpreting and composing all the old data. A Time Aware application is embedded in the main frame. The three-dimensional interactive map depicts and displays the eight volcanic phases, using 5-m hillshade as basement, while Additional information is available by clicking on each phase.
Fourth tab focuses on biodiversity of the Methana peninsula, which is described as a seaside and semi—mountainous landscape with volcanic terrain and spectacular views to the Western Saronic Gulf. It is a multicolored landscape as it combines the brown color of lava with the red of the volcanic rocks, the green of the scattered pine trees and the blue of the sea and the sky. Story Map Journal is embedded in this tab, using narrative text, multimedia context and internal links to effectively visualize the available information. Users can select the predefined text to access additional information (Figure 13).
In the following three tabs the main proposed paths of the Methana peninsula are further presented using an embedded Story Map Shortlist template in each one of them. Each tab showcases the archeological, religious and residential areas of interest along the path in combination with the volcanic interest points, aiming at the exploitation of the unique Geotope of the Methana peninsula. Users can either select a location on the web map or a thumbnail to see more information (Figure 14 and Figure 15). Imagery (from ESRI’s basic gallery maps) is used as basemap, while the available information is imported using properly formed and processed comma separated value (.csv) text files. The structure of the text file is shown in Table 3. Images were uploaded to Flickr [31] in order to be further used in the template.
Last tab (Figure 16), gives information about the research team responsible for gathering all the available information. It presents the National and Kapodistrian University of Athens, Faculty of Geology and Geoenvironment which undertook the execution of the Applied Research Project, the Municipality of Troizinia-Methana for funding it and gives additional information for members of the Research Team.

3. Concluding Remarks

The use of GIS technology has a great impact on web-based visual presentations. We present a flexible and interactive application to visualize the geomorphology and history of the Methana peninsula, an area of special interest due to volcanic eruptions in the past. The users can visualize, share and explore the area with this interactive tool. The created story map is based on maps and is enriched with the integration of different data like images, narrative texts and multimedia. It is a tool quite simple to master and use. The main challenge is the combination of different scientific fields in the same application, where professional and non-professional users from totally different domains, e.g., geologists, archaeologists, can share knowledge.
Also, this work emphasizes digital geography that replaces classical geography. Analog maps printed on paper and accompanied by an explanatory legend are replaced by digital, interactive web maps. The user can now interact with the map, add information and use it to visualize the content of interest. Digital, web-based maps can be presented quickly and easily all over the world. However, this approach may also have drawbacks, including the possibility of dissemination of misleading information. As far as the use of the main tools are concerned, two problems can be mentioned: (a) the possibilities for electronic analysis and processing are less, at present, compared to the classic GIS software; and (b) frequent upgrades to either the electronic platform or different programs, can cause technical problems when building and maintaining the application.
For future work, we plan to provide the ability to download the story map and customize it according to user’s needs. We plan to use a new tab having all the available data, and widgets so the users are able to use functions like data selection or formulating queries. Another extension will be to deal with real time data.
This type of application can be an ideal way for presenting the geological, geomorphological and historical contents of other places, especially places which can be characterized as geotopes or Natura areas. Such examples have already been created worldwide (https://goo.gl/g2p89P). Authors have also been involved in other such applications: (a) as part of Life projects that supports environmental, nature conservation and climate actions throughout the EU (https://goo.gl/kt6oSN), (b) for highlighting areas as geotopes like METAXA Mine (https://goo.gl/rCWcku) and (c) for dissemination of scientific information about a natural disaster phenomenon like Lesvos earthquake Mw 6.3, 12 June 2017 (https://goo.gl/cSCk71) [32]. It is worth mentioning that the local authorities of other areas in Greece, like Nisyros Island (another Volcano) and the Corinthian Gulf (new area in Natura 2000) have already commissioned a corresponding implementation. Both these Story Maps will be publicly available in six months.
Finally, we would like to mention that the interest of the scientific community has already been raised regarding story maps. For instance, Northwestern University Knight Lab, a community of designers, developers, students, and educators working on journalism into new spaces, produced a free story map platform (https://goo.gl/6LB1Qe). Google has also developed Google Earth Outreach (https://goo.gl/bHwZJE), a tool that enables community groups to tell their stories with free access to maps and satellite images. These platforms have reduced capabilities compared to the one described in this paper, but their free access will boost the use of story maps.

Funding

This research was funded by Municipality of Troizinia-Methana (Greece).

Conflicts of Interest

The authors declare no conflict of interest.

References

  1. Baker, T.R. WebGIS in Education. In Geospatial Technologies and Geography Education in a Changing World: Geospatial Practices and Lessons Learned; Solari, O.M., Demirci, A., van der Schee, J., Eds.; Springer: Tokyo, Japan, 2015; pp. 105–115. [Google Scholar]
  2. ArcGIS Online Competition for US HS + MS Students. Available online: https://community.esri.com/groups/story-maps-for-education (accessed on 13 July 2018).
  3. Graves, M.E. Spatial Narratives of Struggle and Activism in the Del Amo and Montrose Superfund Cleanups: A Community-Engaged Web GIS Story Map. Master’s Thesis, University of Southern California, Los Angeles, CA, USA, 2015. [Google Scholar]
  4. Kerski, J. Geo-awareness, Geo-enablement, Geotechnologies, Citizen Science, and Storytelling: Geography on the World Stage. Geogr. Compass 2015, 9, 14–26. [Google Scholar] [CrossRef]
  5. Kerski, J. Communicating with Story Maps. Available online: http://www.josephkerski.com/wp-content/uploads/2016/07/Story_Maps_full_current.pdf (accessed on 10 July 2018).
  6. Janicki, J.; Narula, N.; Ziegler, M.; Guénard, B.; Economo, E.P. Visualizing and interacting with large-volume biodiversity data using client–server web-mapping applications: The design and implementation of antmaps.org. Ecol. Inf. 2016, 32, 185–193. [Google Scholar] [CrossRef]
  7. Wright, D.J.; Verrill, A.; Artz, M.; Deming, R. Story maps as an effective social medium for data synthesis, communication, and dissemination. In Proceedings of the Fall Meeting 2014, San Francisco, CA, USA, 15–19 December 2014. [Google Scholar]
  8. Iturrioz, T.; Fernandez, C.R.; Gomez Barron Sierra, J.P. Creating Story Maps for Learning Purposes: The Black Death Atlas. In Proceedings of the 6th International Conference on Cartography and GIS, Albena, Bulgaria, 13–17 June 2016; pp. 221–231. [Google Scholar]
  9. Voyager Google Earth Could Become the Next Great Social Network. Available online: https://support.google.com/earth/answer/7365064?co=GENIE.Platform%3DDesktop&hl=en (accessed on 13 July 2018).
  10. Robinson, A. Geovisual Analytics. In The Geographic Information Science & Technology Body of Knowledge (3rd Quarter 2017 Edition); Wilson, J.P., Ed.; University Consortium for Geographic Information Science: Ithaca, NY, USA, 2017. [Google Scholar]
  11. Van Ho, Q.; Lundblad, P.; Astrom, T.; Jern, M. A web-enabled visualization toolkit for geovisual analytics. Inf. Vis. 2012, 11, 22–42. [Google Scholar] [CrossRef]
  12. Berendsen, M.E.; Hamerlinck, J.D.; Webster, G.R. Digital Story Mapping to Advance Educational Atlas Design and Enable Student Engagement. ISPRS Int. J. Geoinf. 2018, 7, 125. [Google Scholar] [CrossRef]
  13. Story: BringingSpatial Data to Life with Story Mapping. Available online: https://oceansolutions.stanford.edu/news-stories/bringing-spatial-data-life-story-mapping (accessed on 12 July 2018).
  14. GIS Story maps. Available online: https://www.completecommunitiesde.org/planning/gis-story-maps/ (accessed on 8 July 2018).
  15. ESRI. Available online: www.esri.com (accessed on 13 July 2018).
  16. Georgalas, G. Catalogue of the Active Volcanoes of the World, Including Solfatara Fields. Part 12: Greece; International Association of Volcanology: Rome, Italy, 1962; 40p. [Google Scholar]
  17. ArcGIS for Desktop-ArcMap. Available online: http://desktop.arcgis.com/en/arcmap/ (accessed on 13 July 2018).
  18. Hellenic Mapping; Cadastral Organisation. The Hellenic Geodetic Reference System (Greek: Το Ελληνικό Γεωδαιτικό ΣύστημαAναφοράς); Hellenic Mapping & Cadastral Organization (HEMCO): Athens, Greece, 1987. [Google Scholar]
  19. ArcGIS Collector. Available online: https://goo.gl/KoBxzn (accessed on 3 January 2018).
  20. DiBiase, D.; MacEachren, A.M.; Krygier, J.B.; Reeves, C. Animation and the Role of Map Design in Scientific Visualization. Cartogr. Geogr. Inf. Syst. 1992, 19, 201–2014. [Google Scholar] [CrossRef]
  21. Newman, G.; Zimmerman, D.; Crall ALaituri, M.; Graham, J.; Stapel, L. User-friendly web mapping: lessons from a citizen science website. Int. J. Geogr. Inf. Sci. 2010, 24, 1851–1869. [Google Scholar] [CrossRef]
  22. Antoniou, V.; Nomikou, P.; Bardouli, P.; Lampridou, D.; Ioannou, T.; Kalisperakis, I.; Stentoumis, C.; Whitworth, M.; Krokos, M.; Ragia, L. An Interactive Story Map for the Methana Volcanic Peninsula. In Proceedings of the 4th International Conference on Geographical Information Systems Theory, Applications and Management (GISTAM 2018), Madeira, Portugal, 17–19 March 2018; pp. 68–78, ISBN 978-989-758-294-3. [Google Scholar]
  23. ISO/TC 211 Geographic information/Geomatics. Available online: http://www.isotc211.org/ (accessed on 16 October 2018).
  24. Antoniou, V. Development of Modern, Online-Interactive Applications Using WebGIS for Processing and Mapping Geoenvironmental Information and Real Time Field Data, to Prevent and Manage Natural Disasters. Master’s Thesis, National and Kapodistrian University of Athens, Athens, Greece, 2016. [Google Scholar]
  25. ArcGIS Online-ArcGIS Online Help. Available online: n https://goo.gl/rJUyYn (accessed on 3 January 2018).
  26. Nomikou, P.; Papanikolaou, D.; Alexandri, M.; Sakellariou, D.; Rousakis, G. Submarine volcanoes along the Aegean Volcanic Arc. Tectonophysics 2013, 507–508, 123–146. [Google Scholar] [CrossRef]
  27. Hill, D.E. Ovid Metamorphoses XIII–XV; Aris & Phillips: Warminster, UK, 2002; p. 107. [Google Scholar]
  28. Pausanias. Description Of Greece, Revised ed.; Harvard University Press: Cambridge, MA, USA, 1918. [Google Scholar]
  29. Strabo. The Geography of Strabo: in Eight Volumes; Harvard University Press: Cambridge, MA, USA, 2014. [Google Scholar]
  30. Pe-Piper, G.; Piper, D. The effect of changing regional tectonics on an arc volcano: Methana, Greece. J. Volcanol. Geotherm. Res. 2013, 260, 146–163. [Google Scholar] [CrossRef]
  31. Flickr. Available online: https://goo.gl/ghC5YA (accessed on 3 January 2018).
  32. Antoniou, V.; Mavroulis, S.; Spyrou, N.-I.; Bardouli, P.; Andreadakis, E.; Skourtsos, E.; Kaviris, G.; Sakkas, V.; Carydis, P.; Lekkas, E. Storytelling Technologies for Dissemination of Scientific Information of Natural Disasters: The June 12, 2017, Mw 6.3 Lesvos (Northeastern Aegean, Greece) earthquake story map. In Proceedings of the 9th International INQUA Meeting on Paleoseismology, Active Tectonics and Archeoseismology (PATA), Possidi, Greece, 25–27 June 2018. [Google Scholar]
Figure 1. Screenshot showing the contents of the File Geodatabase which was created for field work (above left) and the schema of the database associated with photos or videos collected during field work (above right).
Ijgi 07 00484 g001
Figure 2. Screenshot which shows data that have been collected during field trips (adapted from [22]).
Ijgi 07 00484 g002
Figure 3. Workflow highlighting the procedure followed to produce a Story Map [24]. In the present Story Map the available information was uploaded directly to ArcGIS Online platform.
Ijgi 07 00484 g003
Figure 4. Methana peninsula Story Map structure.
Ijgi 07 00484 g004
Figure 5. Screenshot presenting the Home page of Story Map for Methana Volcano, Greece (https://goo.gl/ok1j9F).
Ijgi 07 00484 g005
Figure 6. Screenshot of the first Story Map Series—Accordion tab, where general information about the geographical position of the Methana peninsula and its historical evolution is given (https://goo.gl/UR1a9k).
Ijgi 07 00484 g006
Figure 7. Screenshot of the first tab, where general information for the Methana peninsula is given. Story Map Series—Accordion layout is used, and its second tab presents the geodynamic setting of the area (https://goo.gl/UR1a9k).
Ijgi 07 00484 g007
Figure 8. Screenshot of the first tab, where general information for the Methana peninsula is given. Story Map Series—Accordion layout is used, and its third tab presents the spatial distribution of most interesting points in the area (https://goo.gl/UR1a9k).
Ijgi 07 00484 g008
Figure 9. Screenshot of the first tab, where general information for the Methana peninsula is given. Story Map Series—Accordion layout is used, and its fourth tab presents the main paths of the Methana peninsula (https://goo.gl/UR1a9k).
Ijgi 07 00484 g009
Figure 10. Screenshot of the first tab, where general information for the Methana peninsula is given. Story Map Series—Accordion layout is used, and its fifth tab presents certain hiking trails, as directed by the municipality of Troizinia-Methana, of the Methana peninsula (https://goo.gl/UR1a9k).
Ijgi 07 00484 g010
Figure 11. Screenshot of the second tab, where the geological setting of the peninsula is presented in 3D interactive map (https://goo.gl/ezFb4q).
Ijgi 07 00484 g011
Figure 12. Screenshot of the third tab, where the volcanic evolution of the Methana peninsula is presented (https://goo.gl/DG36QU).
Ijgi 07 00484 g012
Figure 13. Screenshot of the fourth tab, where narrative text, multimedia context and internal links is used to effectively visualize the available information (https://goo.gl/Wg7DAE).
Ijgi 07 00484 g013
Figure 14. Screenshot of the fifth to seventh tab, where users can choose either a location on the webmap or a thumbnail to see further information for a point of interest (https://goo.gl/4BJ2CE).
Ijgi 07 00484 g014
Figure 15. Screenshot of the fifth to seventh tab, where narrative text, multimedia context and external links are used to effectively visualize the available information (https://goo.gl/4BJ2CE).
Ijgi 07 00484 g015
Figure 16. Screenshot of the last tab, where narrative text, multimedia context and external links are used to effectively visualize the information concerning the Research Team (https://goo.gl/Kk6xqD).
Ijgi 07 00484 g016
Table 1. File Geodatabase schema for the available bibliographic data.
Topographic Information
ContoursPolyline feature class
In this feature class rules where added, e.g., the polylines cannot cross each other
AltitudeShort integer field in meters (HGRS87) representing the altitude of the contour.
Triangular pointsPoint feature class
Altitudeshort integer field
X_coordinateDouble field representing x coordinate (HGRS87) of the point
Y_coordinateDouble field representing y coordinate (HGRS87) of the point
Geological Structure
Geological formationsPolygon feature class
In this feature class rules where added, e.g., the polygons cannot overlap, or have gaps
NameGkString field representing the name of the formation in Greek
NameEngString field representing the name of the formation in English
AgeString field representing the age of the formation
PhaseString field representing the phase of the volcanic eruption
TimeDate field representing the relative time of eruption in years
Table 2. File Geodatabase schema for data collection.
Points of InterestPoint feature class
NameGkString field for the name of the point of interest in Greek
NameEngString field for the name of the point of interest in English
CategoryGkString field having four pre-defined values (domain) for the user to choose: archeological site, religious site, volcanic site, residential area in Greek
CategoryEngString field having four pre-defined values (domain) for the user to choose: archeological site, religious site, volcanic site, residential area in English
LatDouble field for the latitude coordinate of the point of interest (in decimal degrees)
LongDouble field for the longitude coordinate of the point of interest (in decimal degrees)
Global_idA unique value, added automatically, necessary for web editing
Created_dateDate field, containing the date that the point is created
Created_userString field, containing the name of the user that created the point
CommentsString field for user’s comments about the point of interest
PathsPolyline feature class
NameGkString field for the name of the point of interest in Greek
NameEngString field for the name of the point of interest in English
Global_idA unique value, added automatically
Created_dateDate field, containing the date that the path is created
Created_userString field, containing the name of the user that created the point
CommentsString field for user’s comments about the path
Table 3. Comma Separated Value text file schema.
NameThe name of the site of interest
TAB_NAMEThe category that it belongs to (archeological, religious or volcanic site, residential area)
SHORT DESCRIPTIONShort description of the site of interest
DESC1Each text paragraph describing the site of interest enters into one of these four fields
DESC2
DESC3
DESC4
WEBSITEAdditional information to external resources
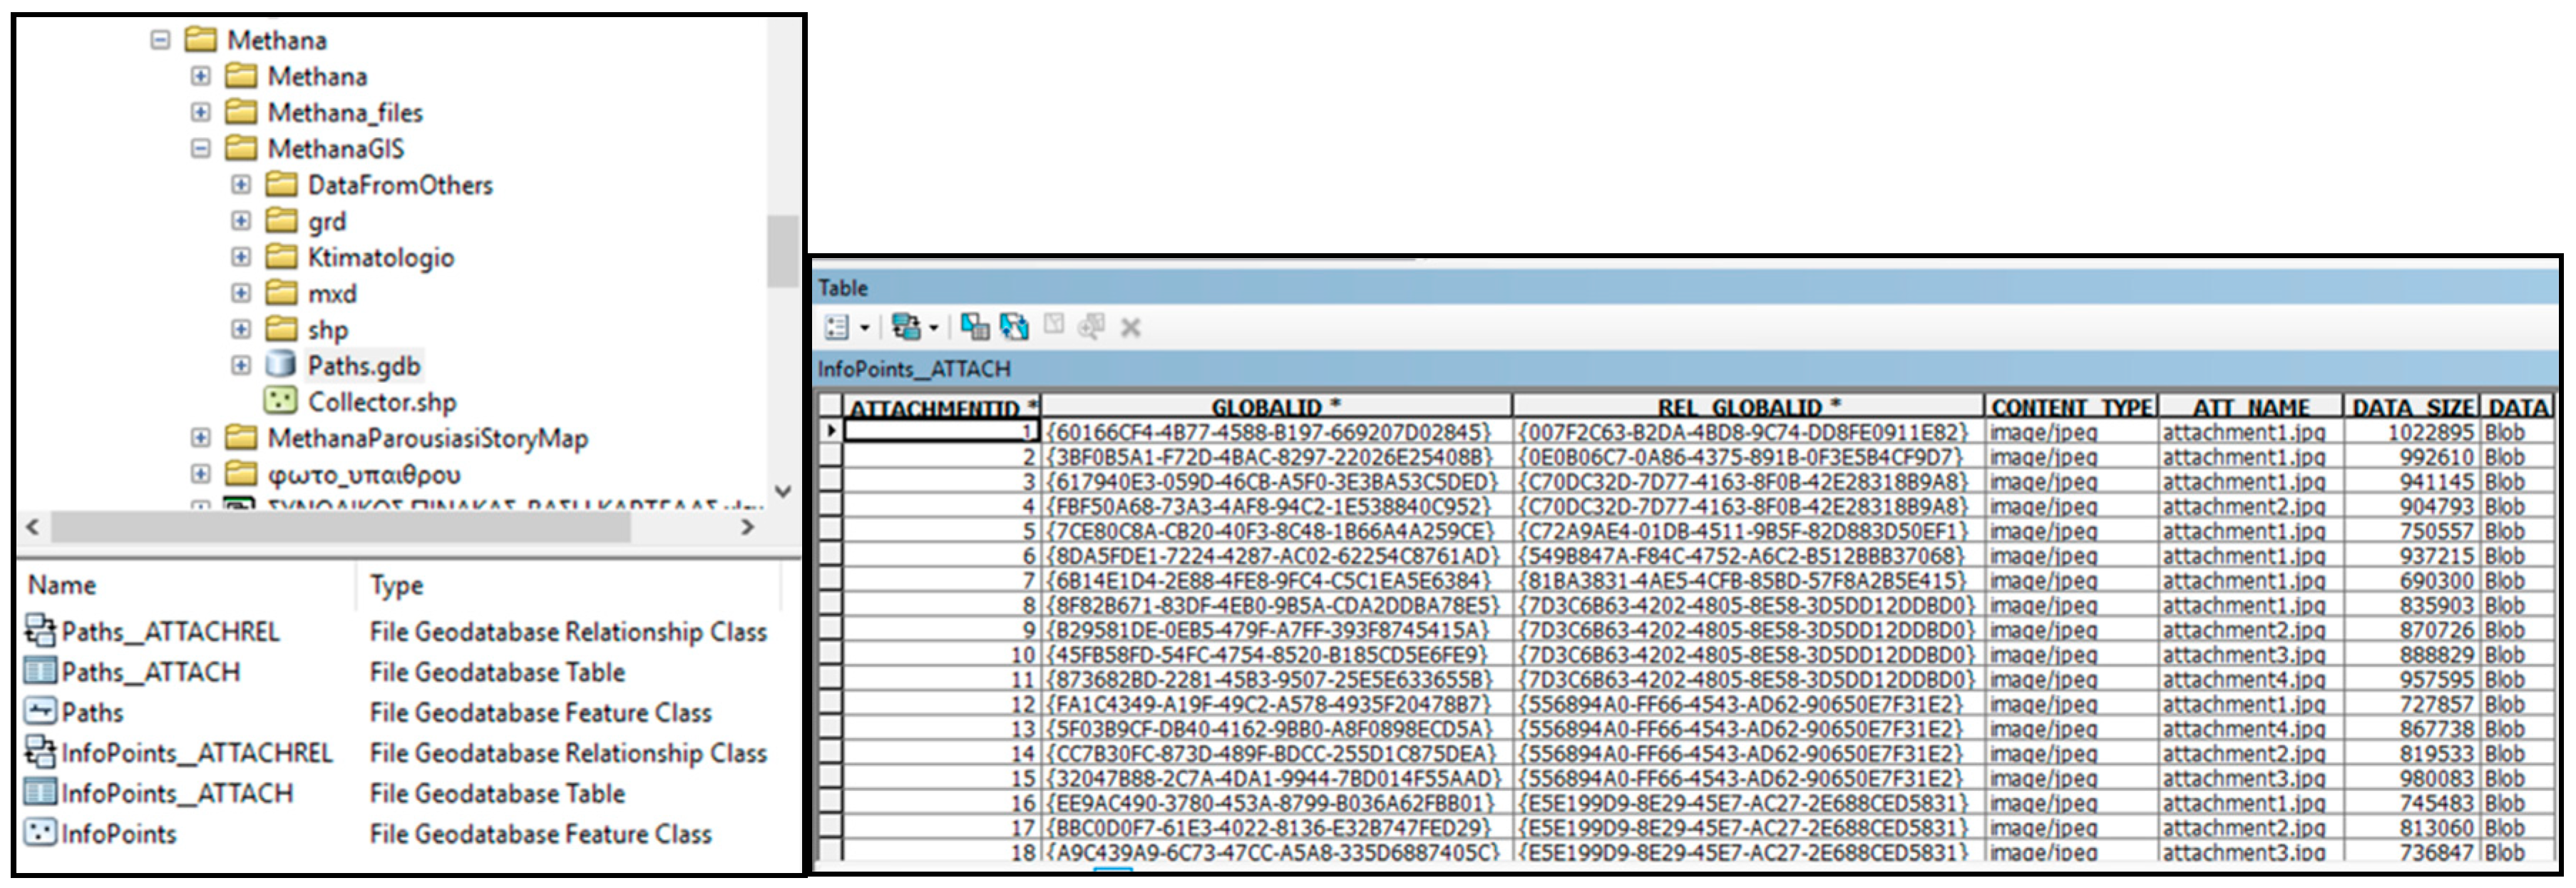
PIC_URLThe location of the representative photo of the site of interest (Flickr)
THUMB_URLThe location of the photo that will be used as thumbnail of the site of interest (Flickr)
LATLatitude coordinate in decimal degrees (WGS 84)
LONGLongitude coordinate in decimal degrees (WGS 84)

