Developing a Dynamic Web-GIS Based Landslide Early Warning System for the Chittagong Metropolitan Area, Bangladesh

 ,
,  , ,
, ,  and
and
Abstract
:
1. Introduction
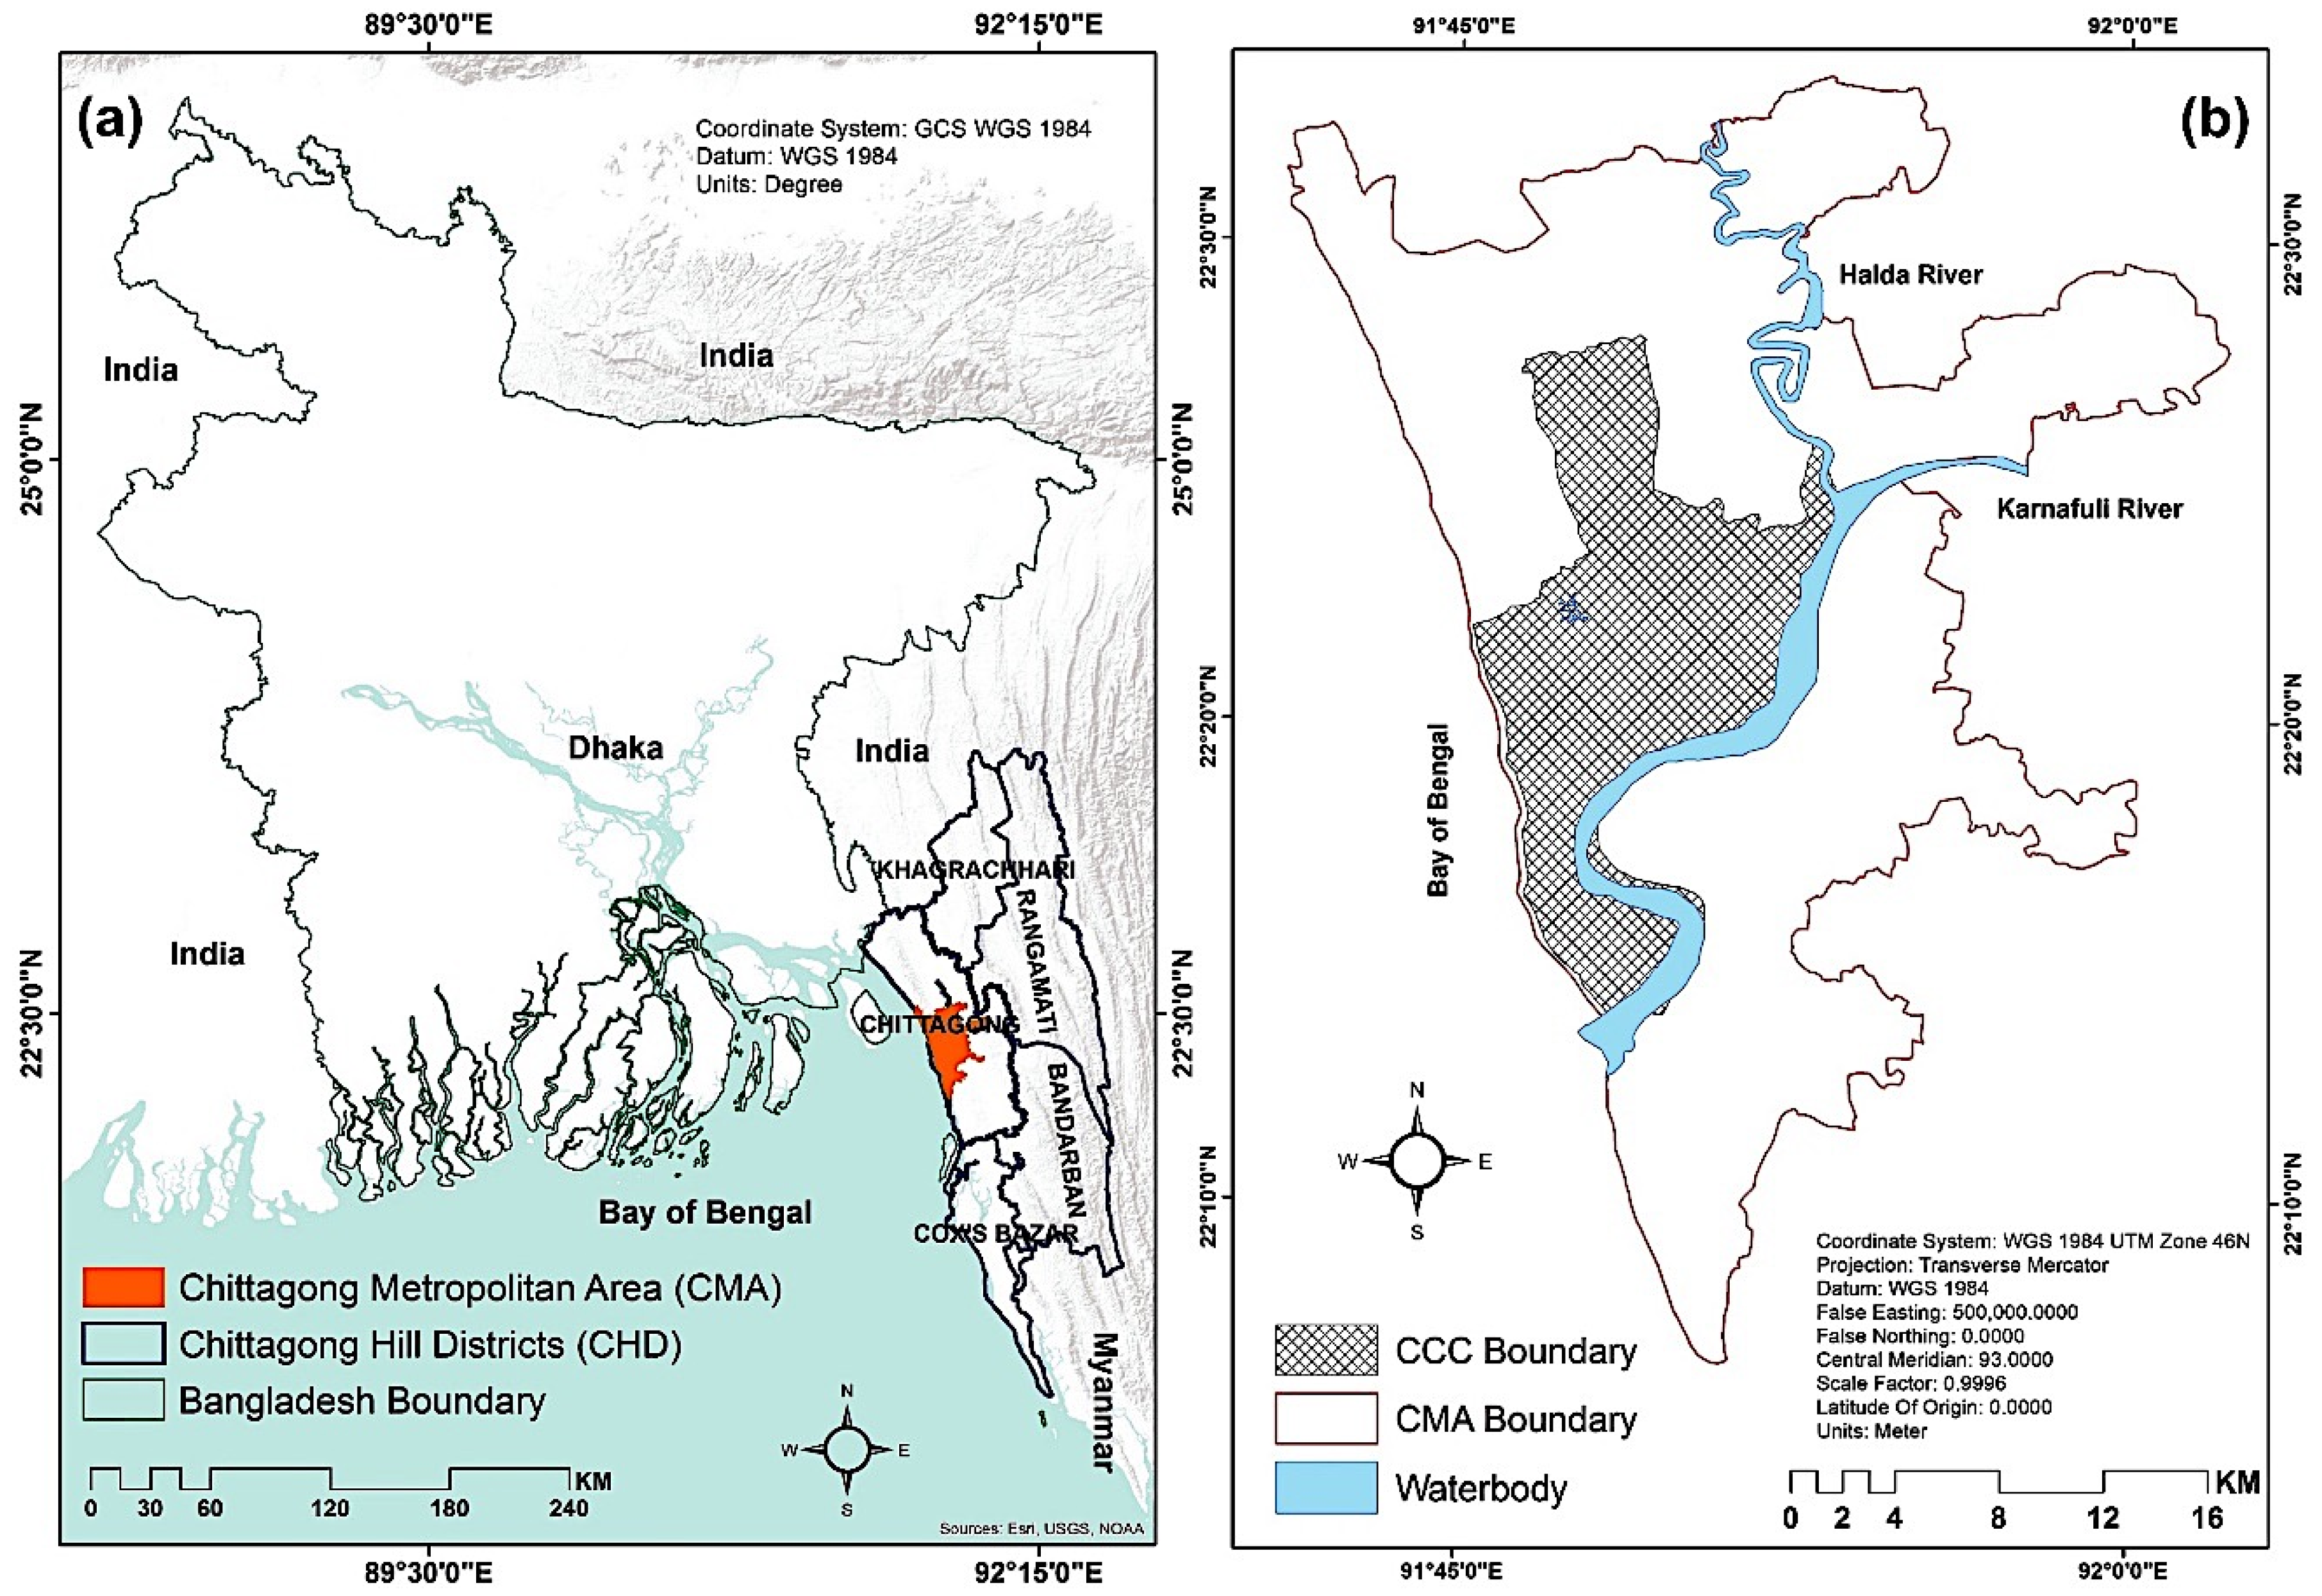
2. Study Area Profile
3. Materials and Methods
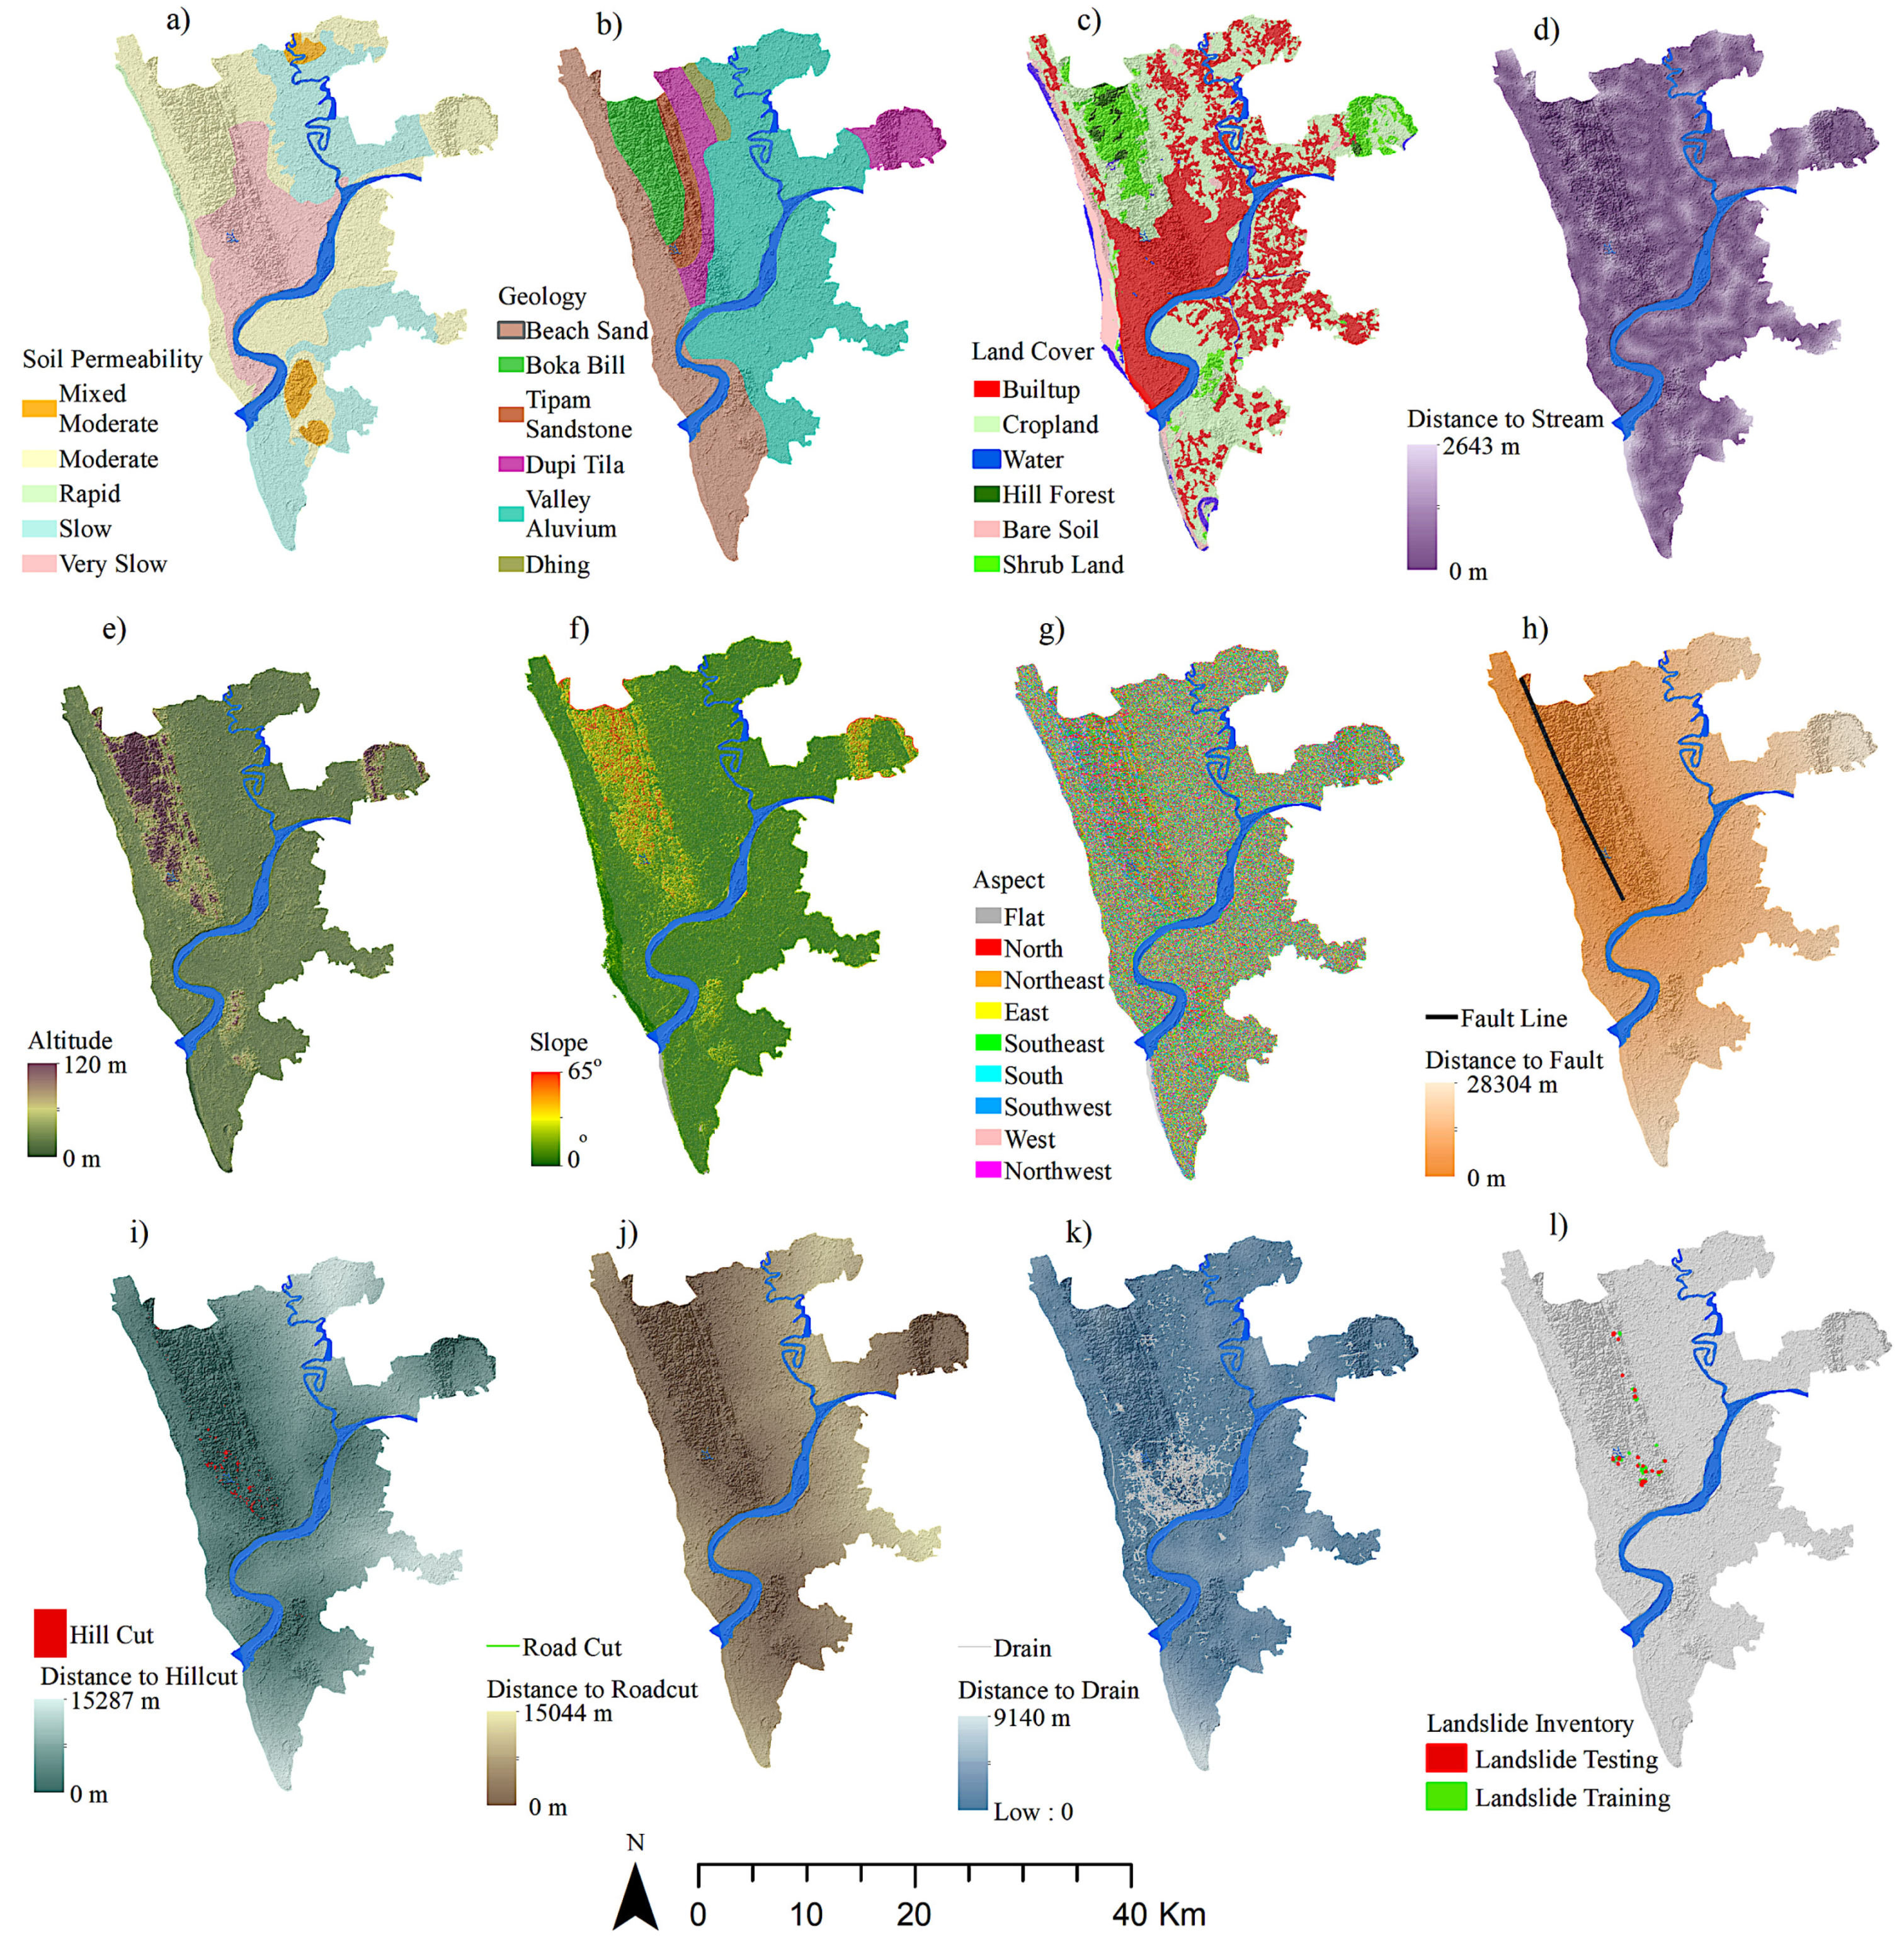
3.1. Preparing Landslide Factor Maps
3.2. Landslide Susceptibility Mapping
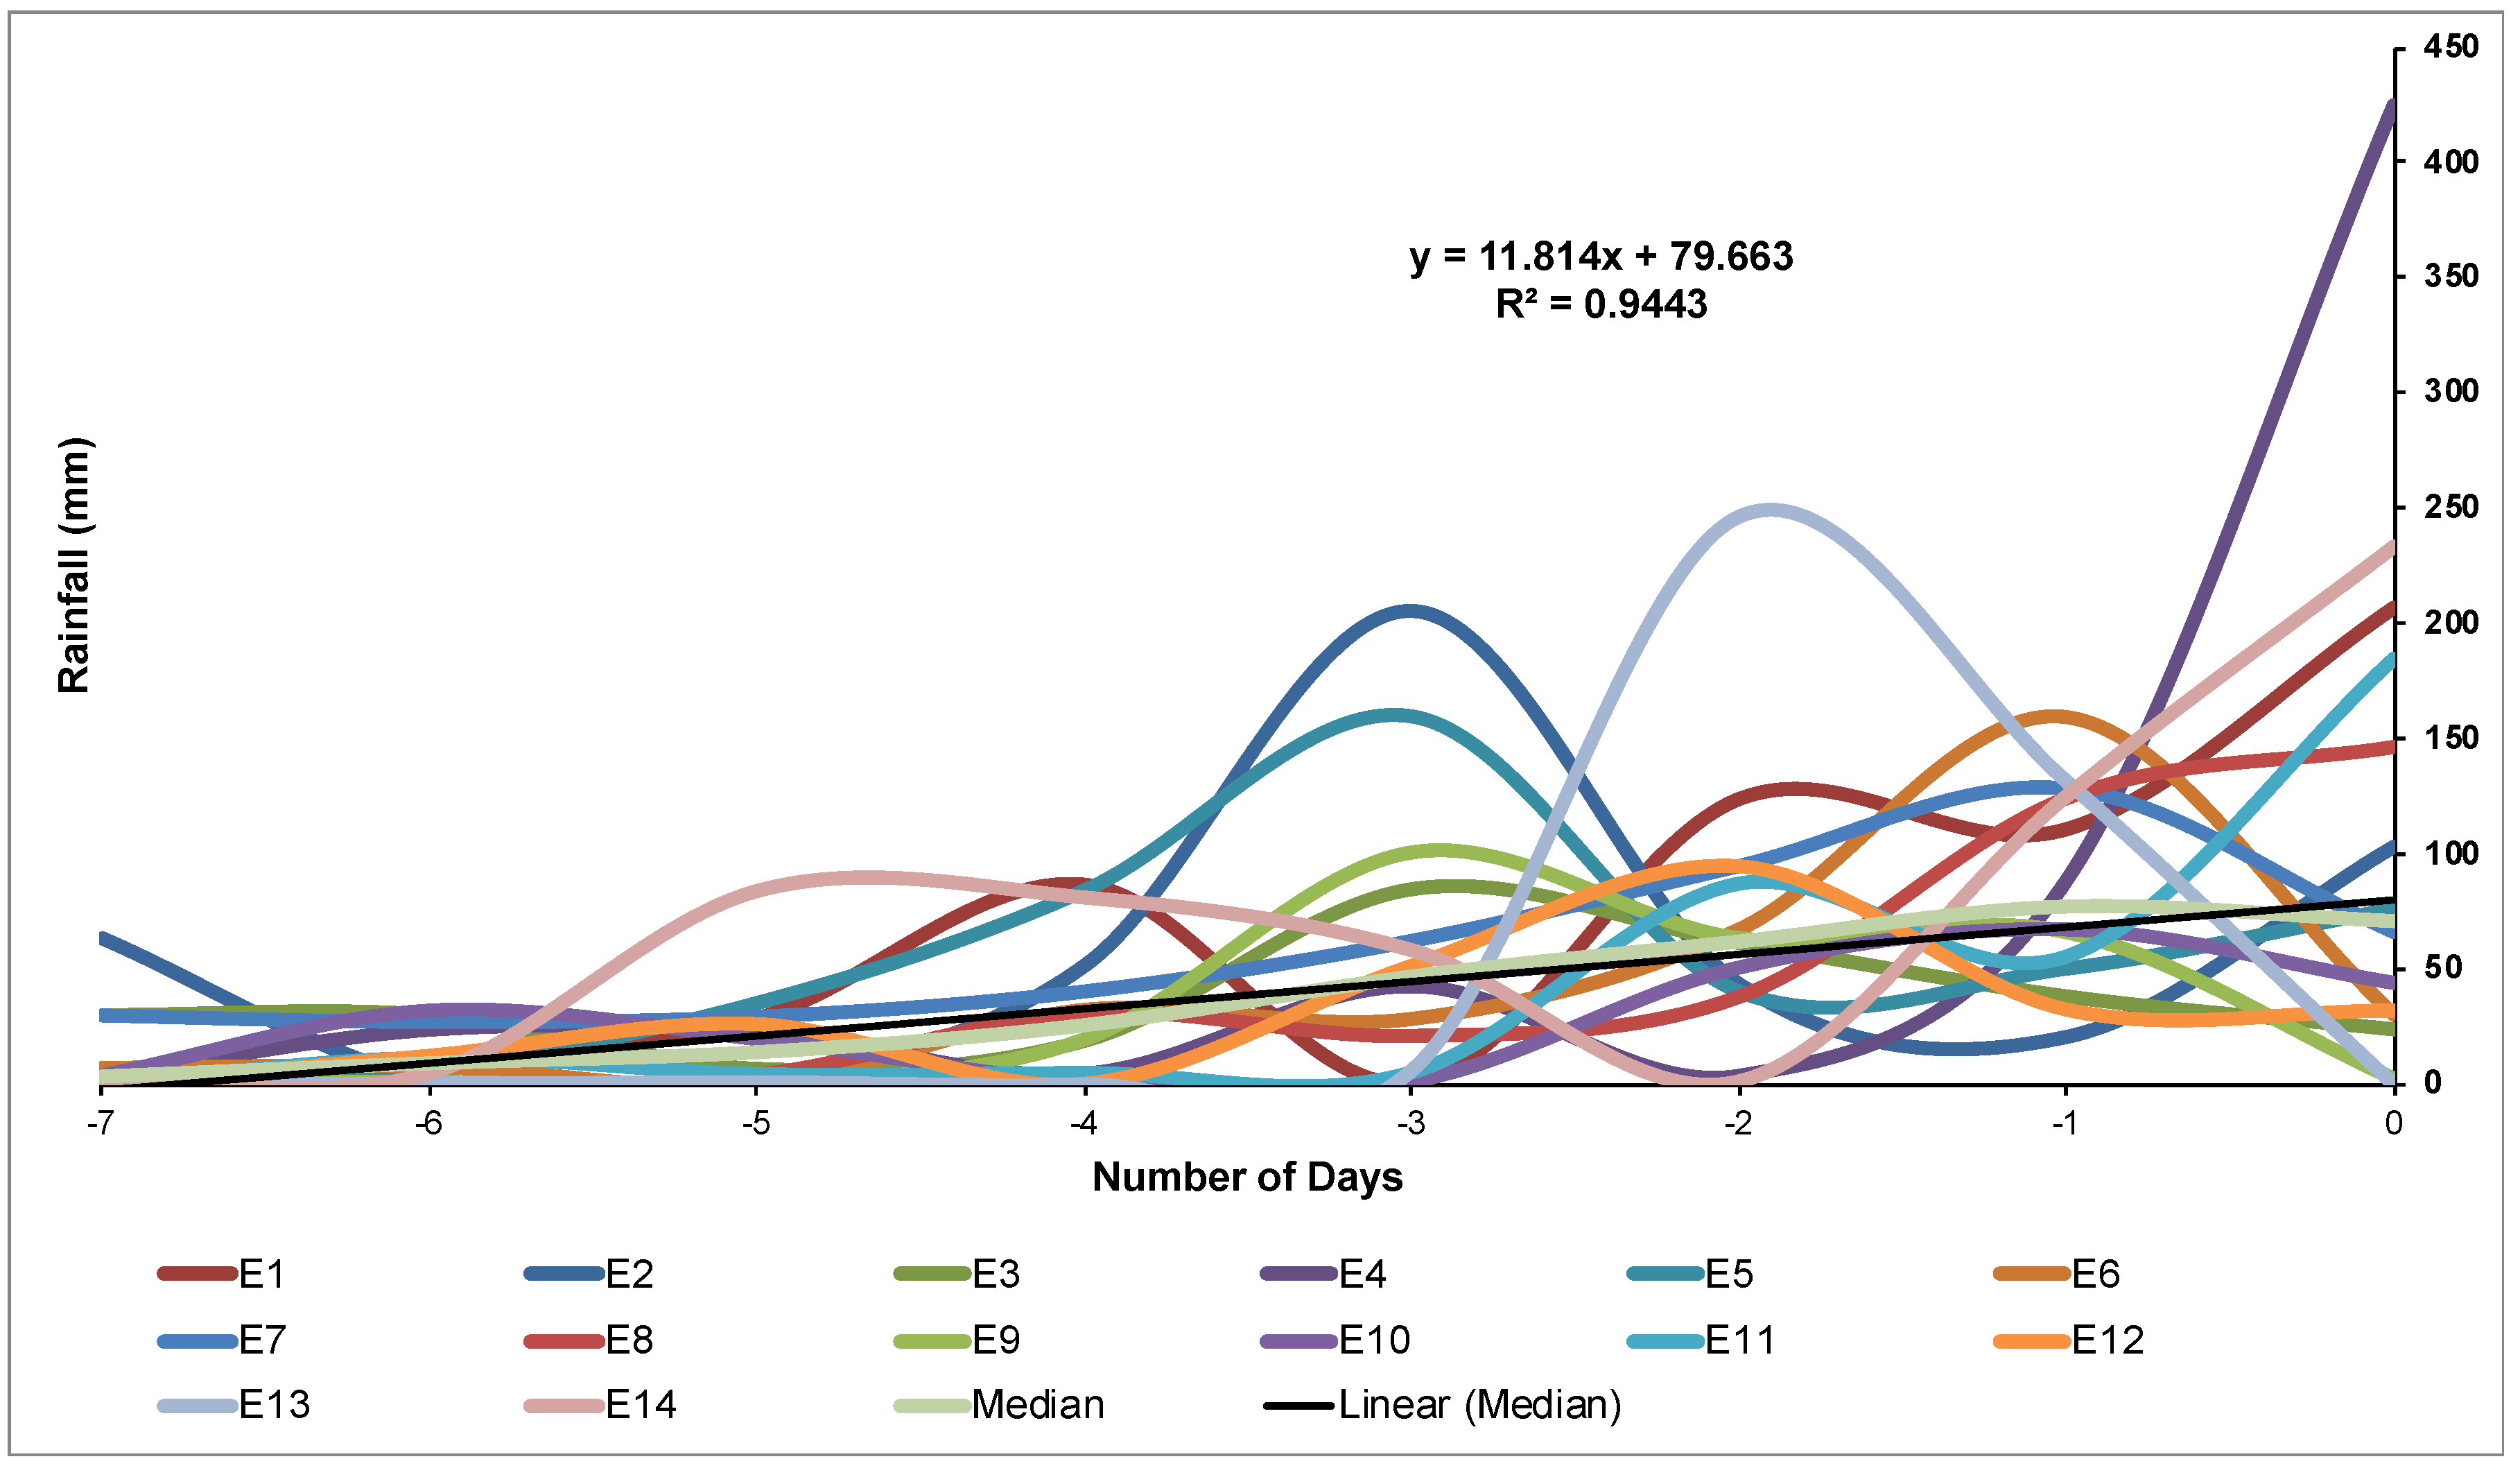
3.3. Rainfall Threshold Analysis
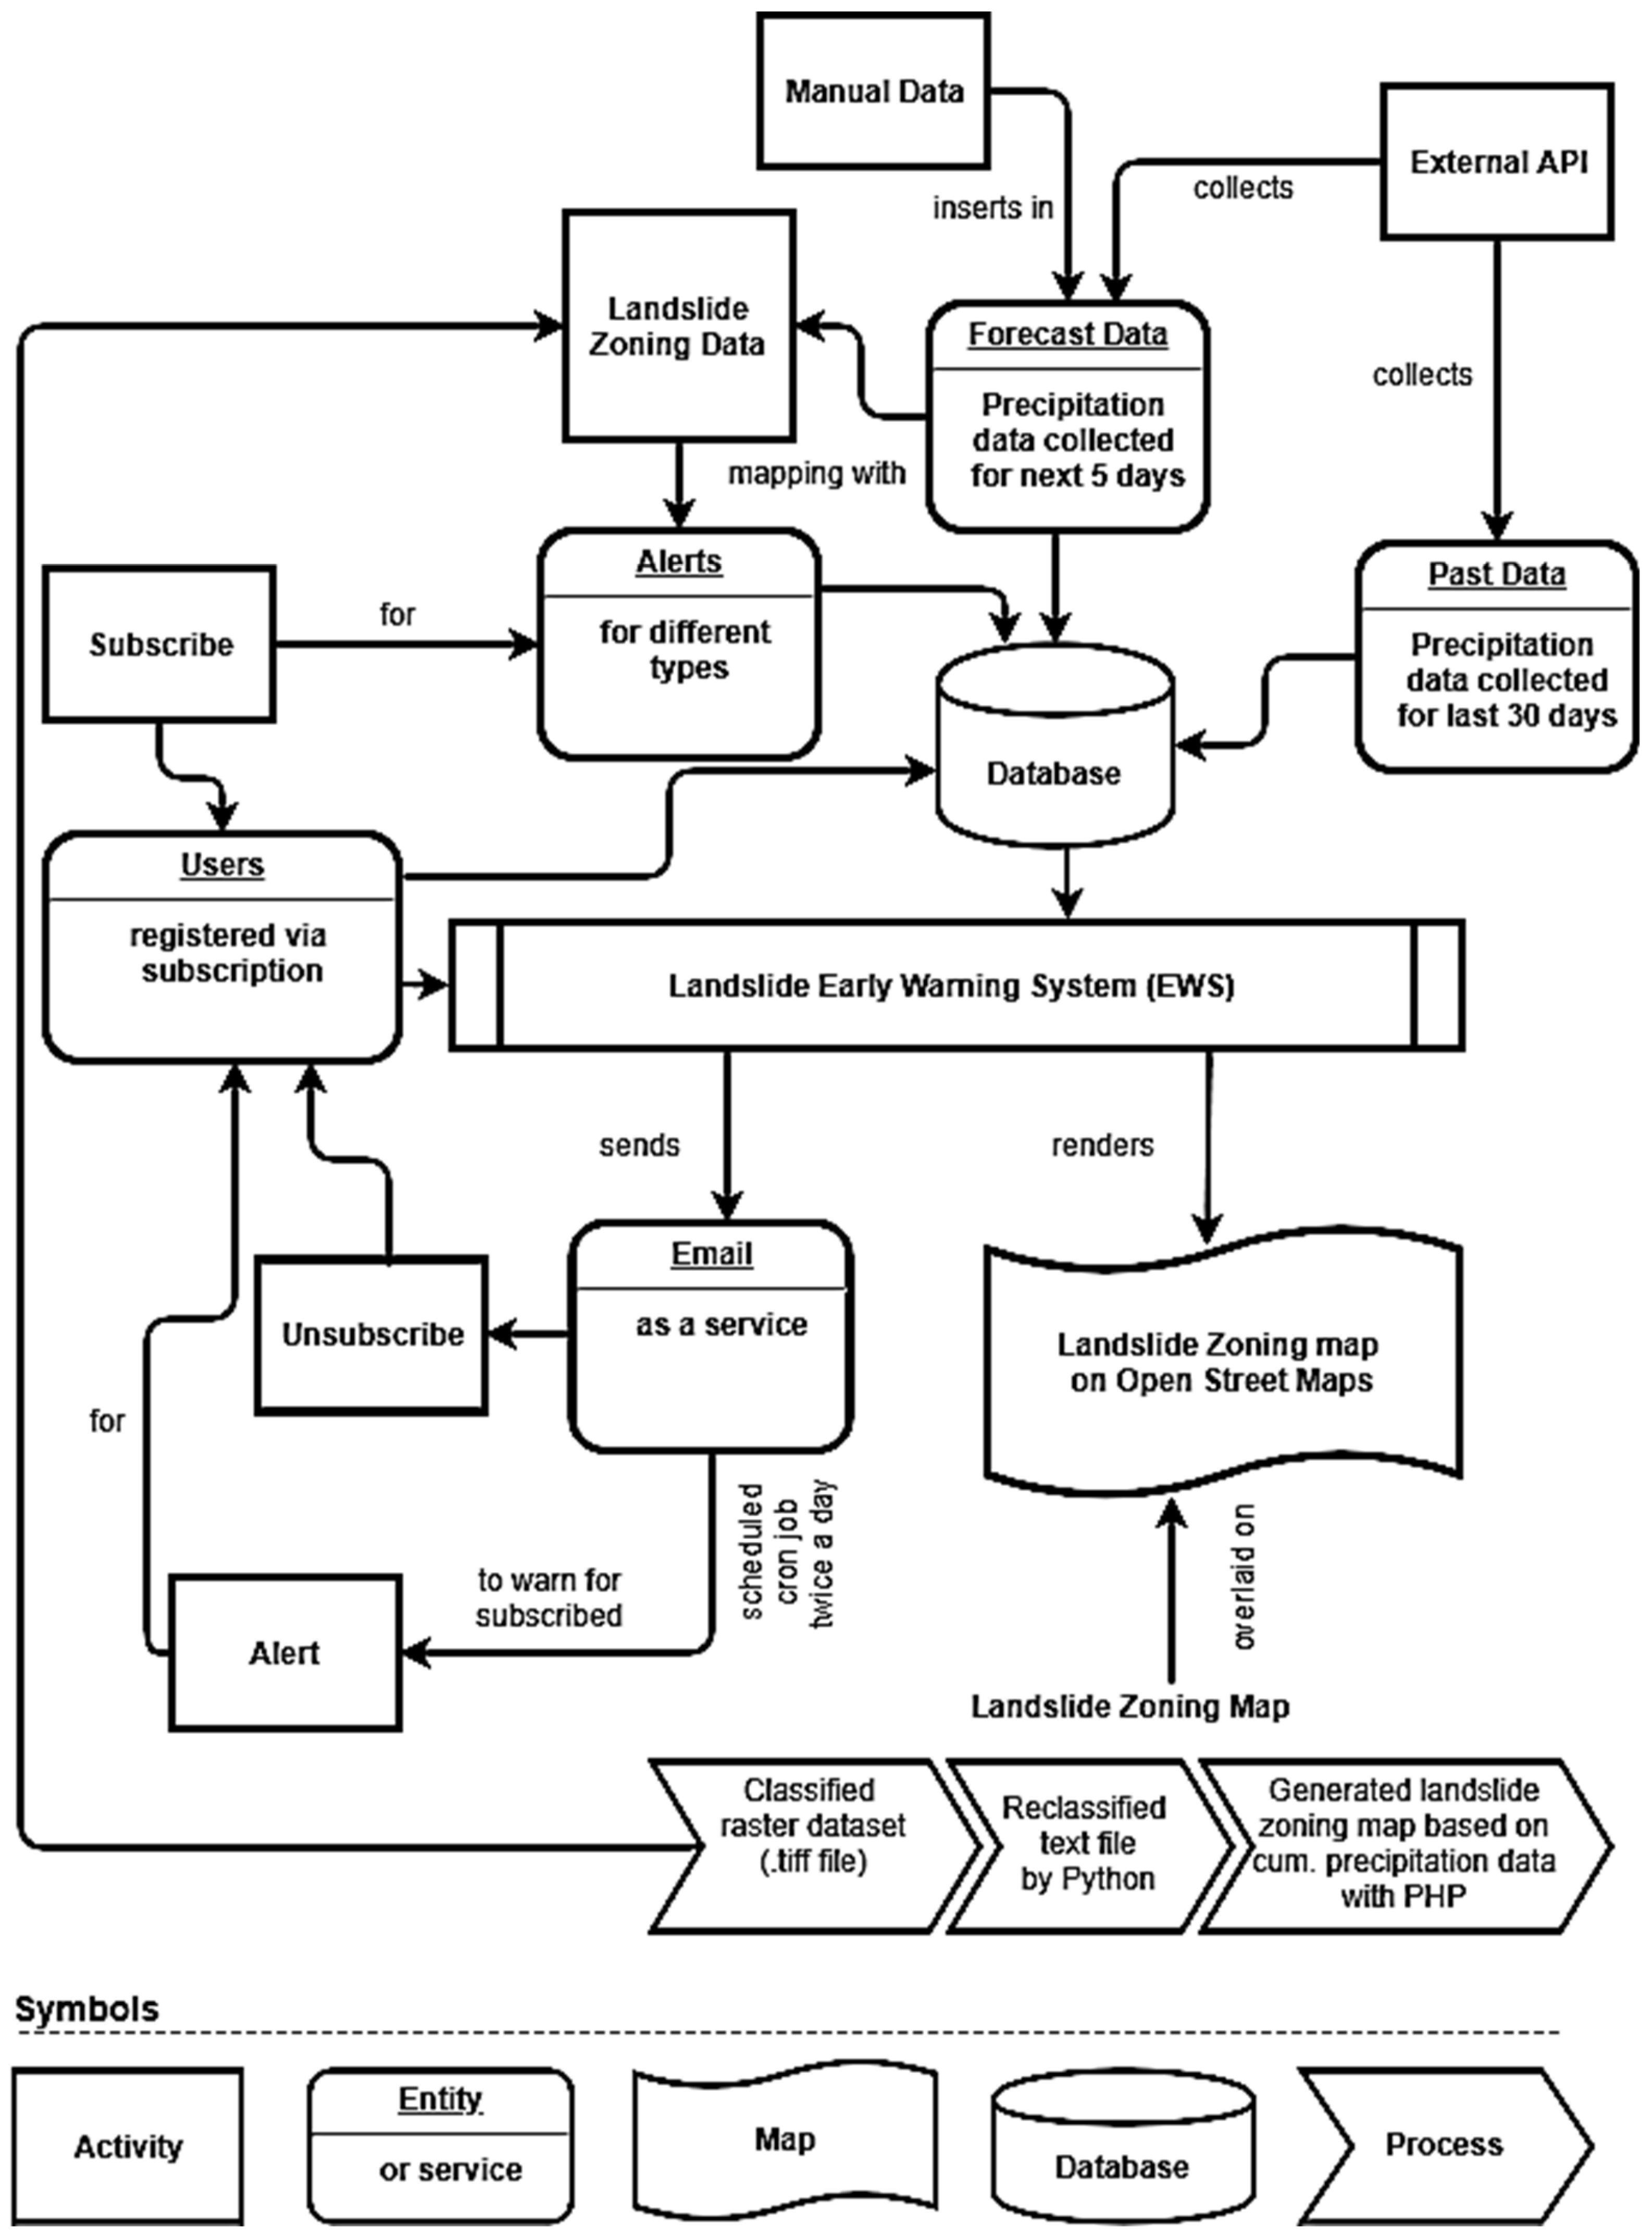
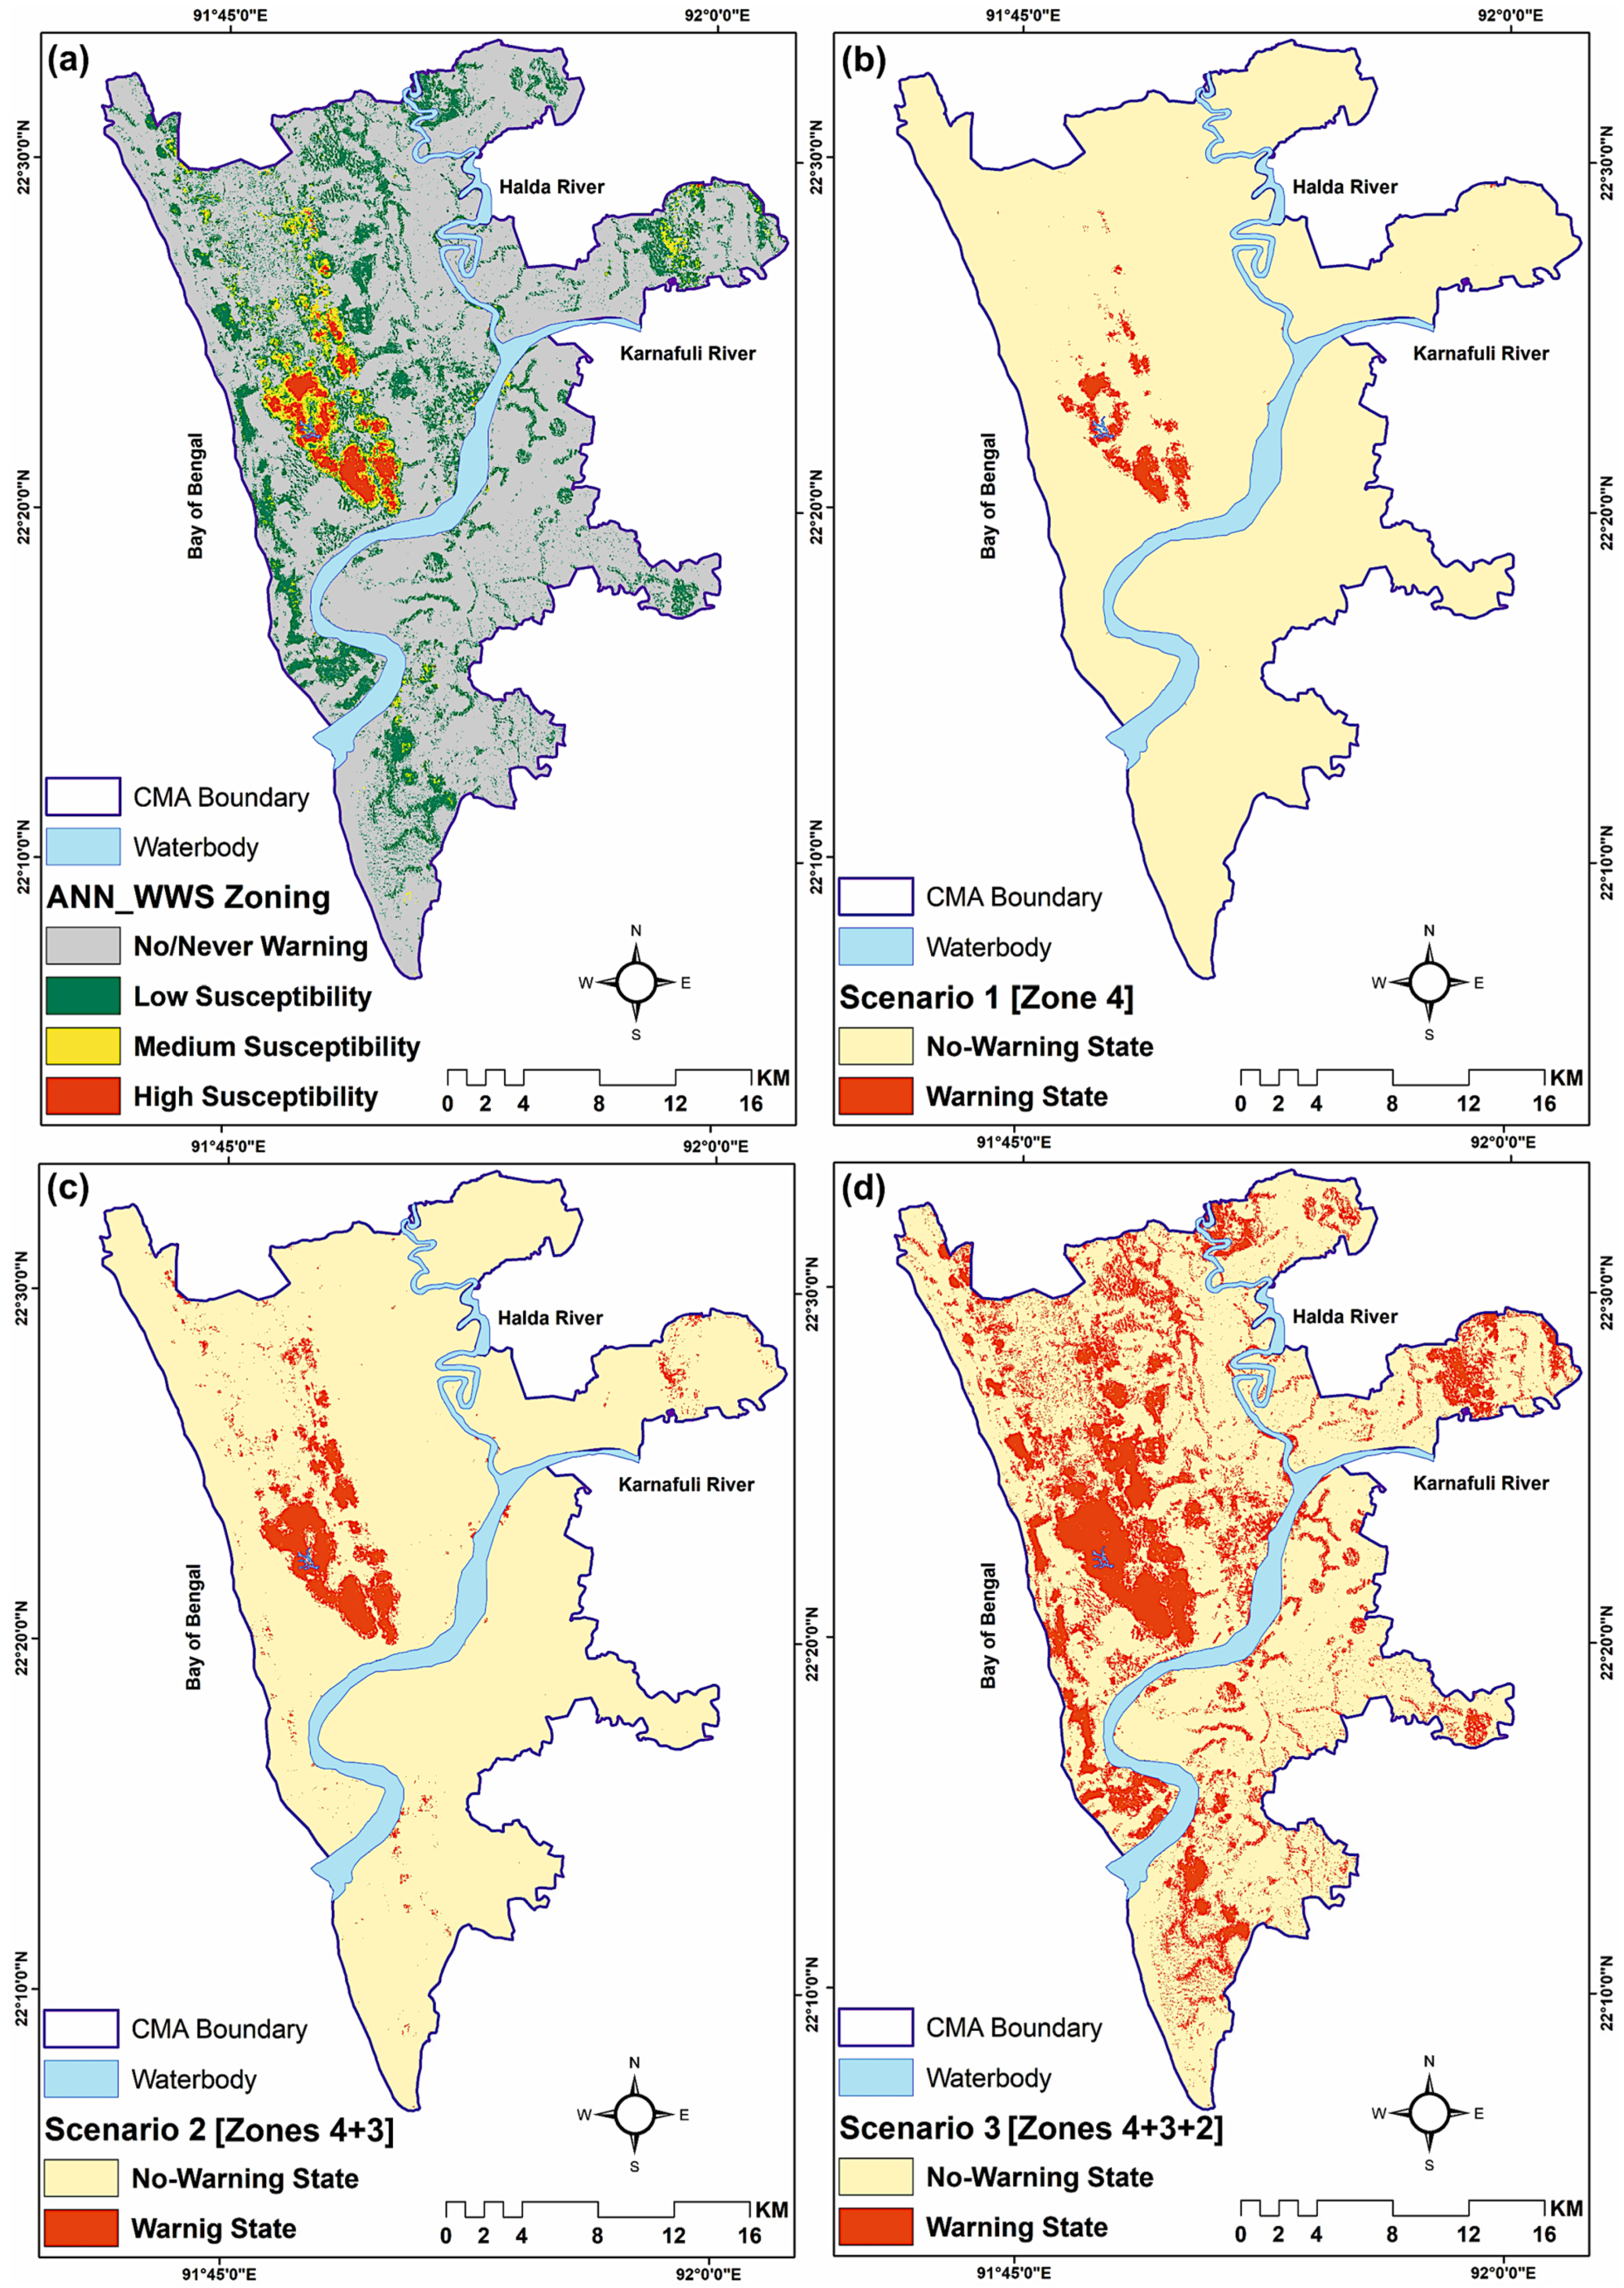
3.4. The Framework for the Landslide EWS
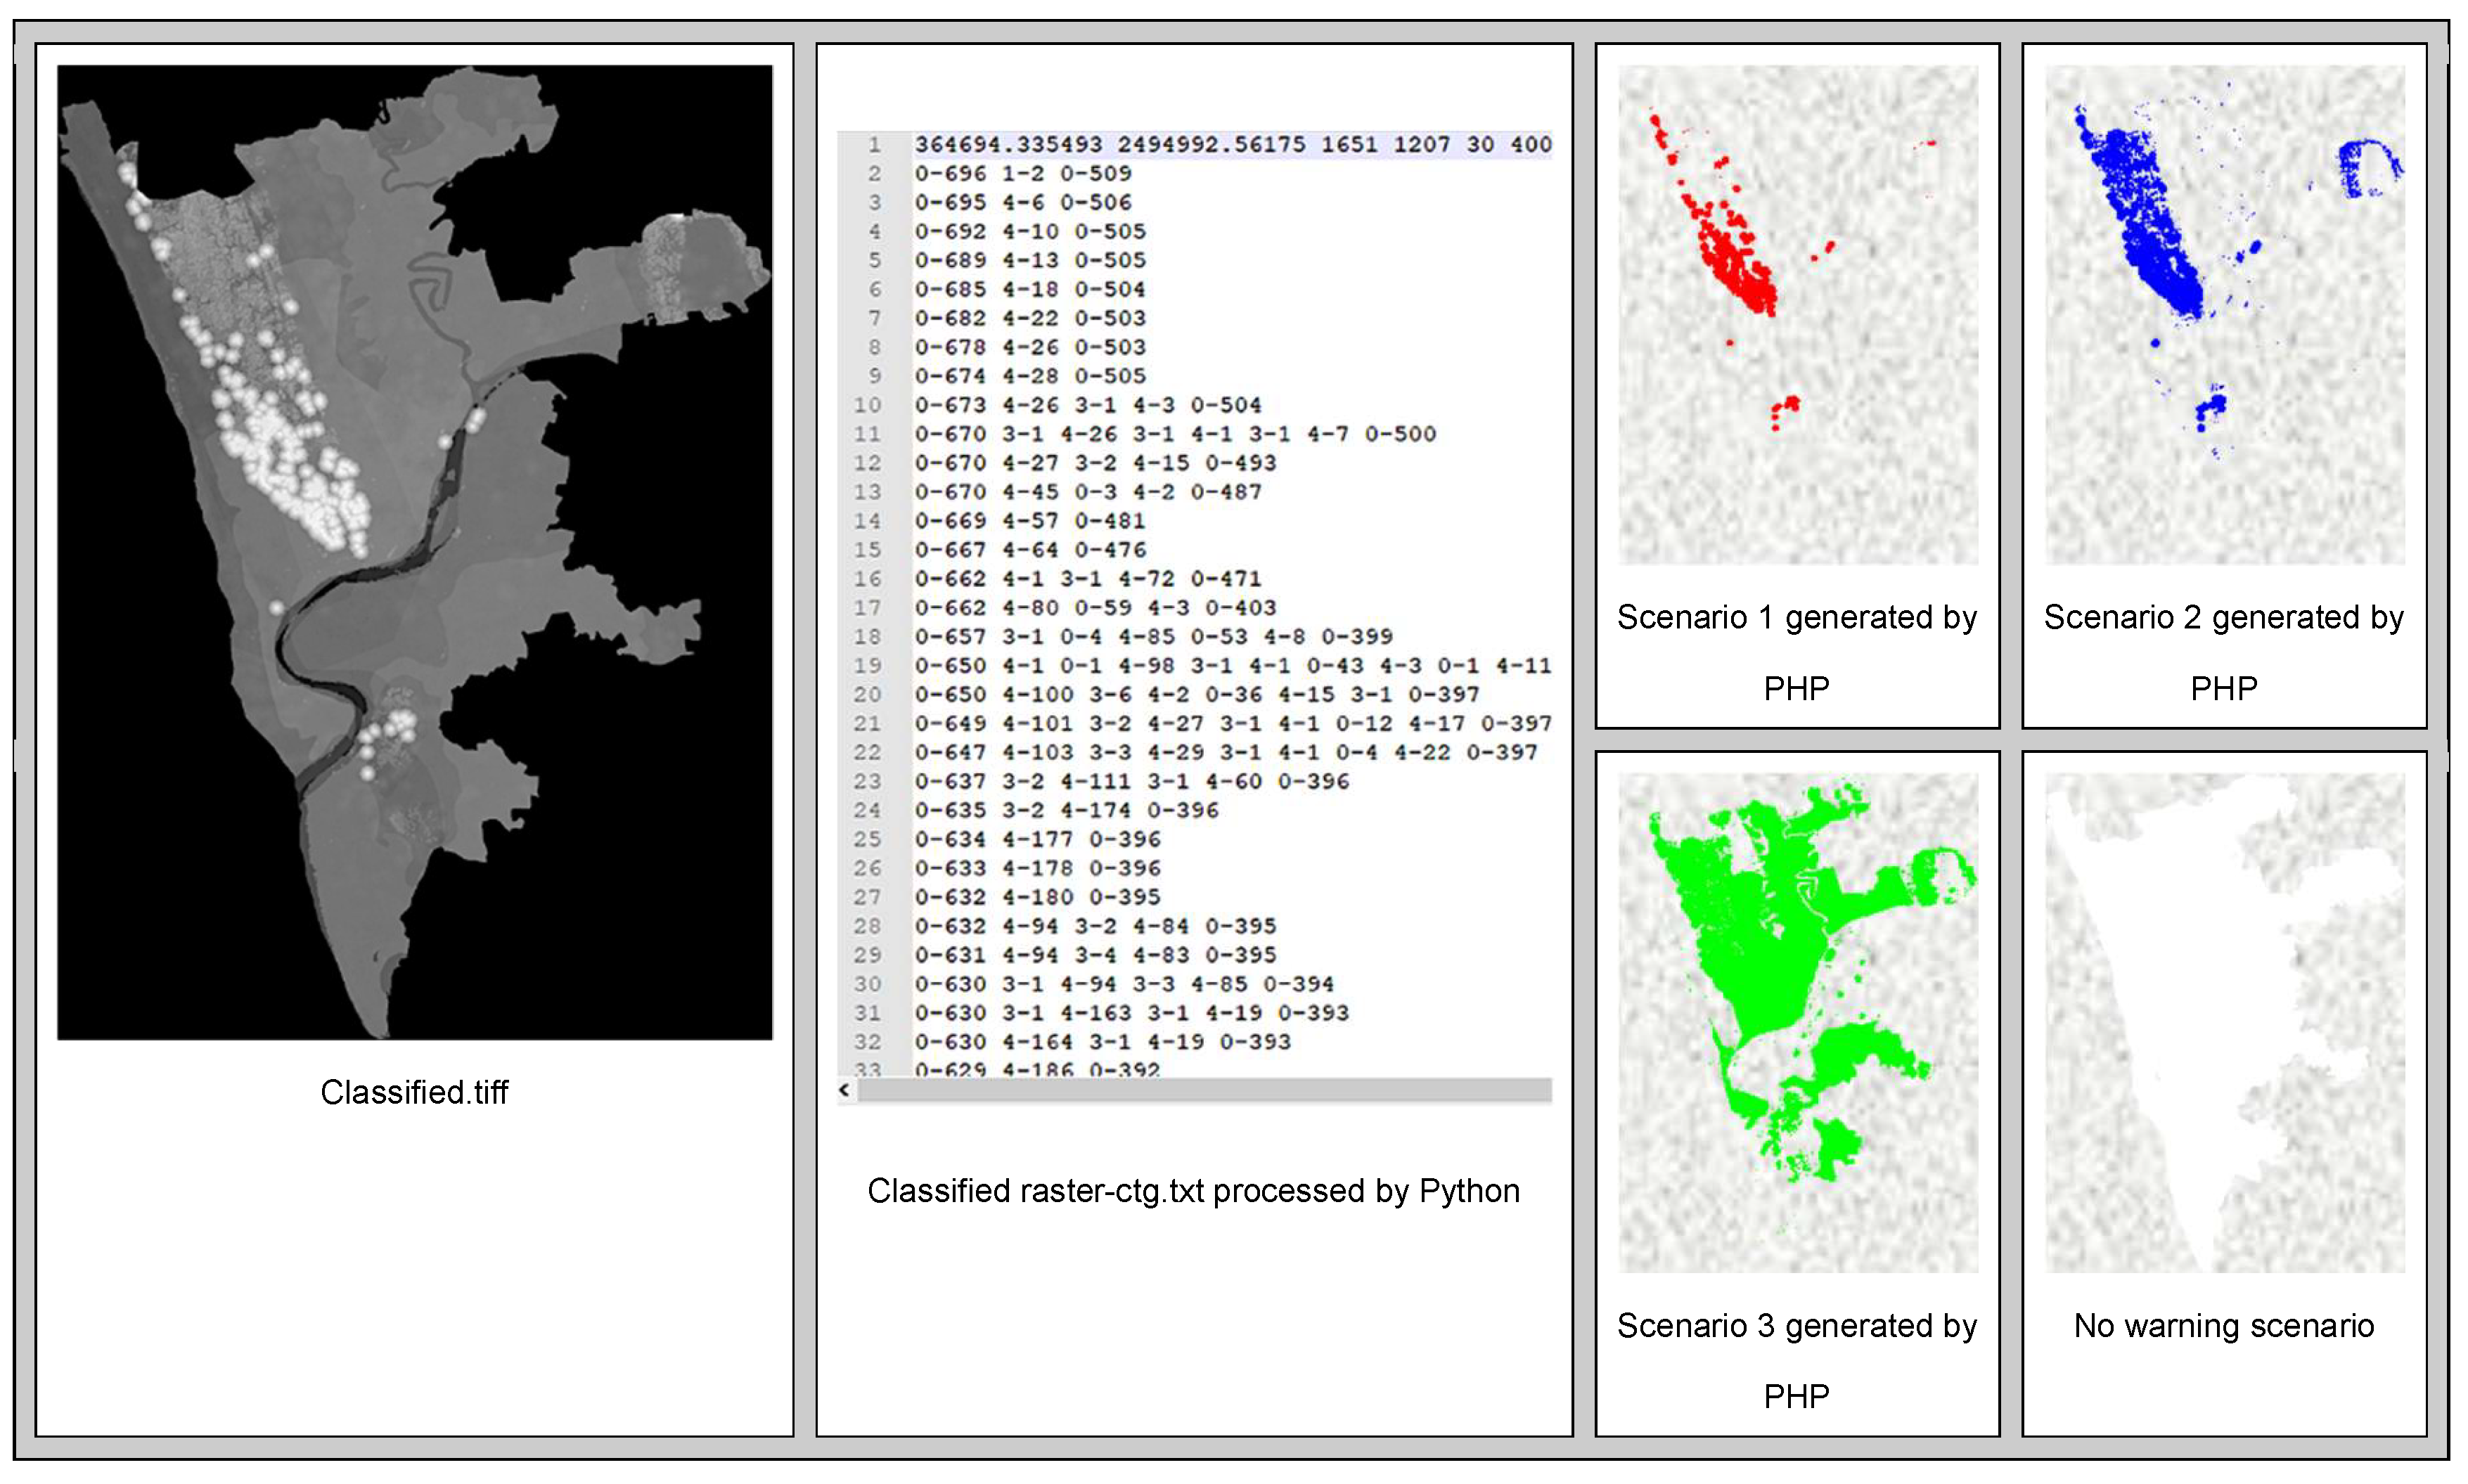
3.5. The Landslide Web-Warning System Development
3.6. Dissemination of Landslide Warnings
4. Results
4.1. Landslide Factor Maps
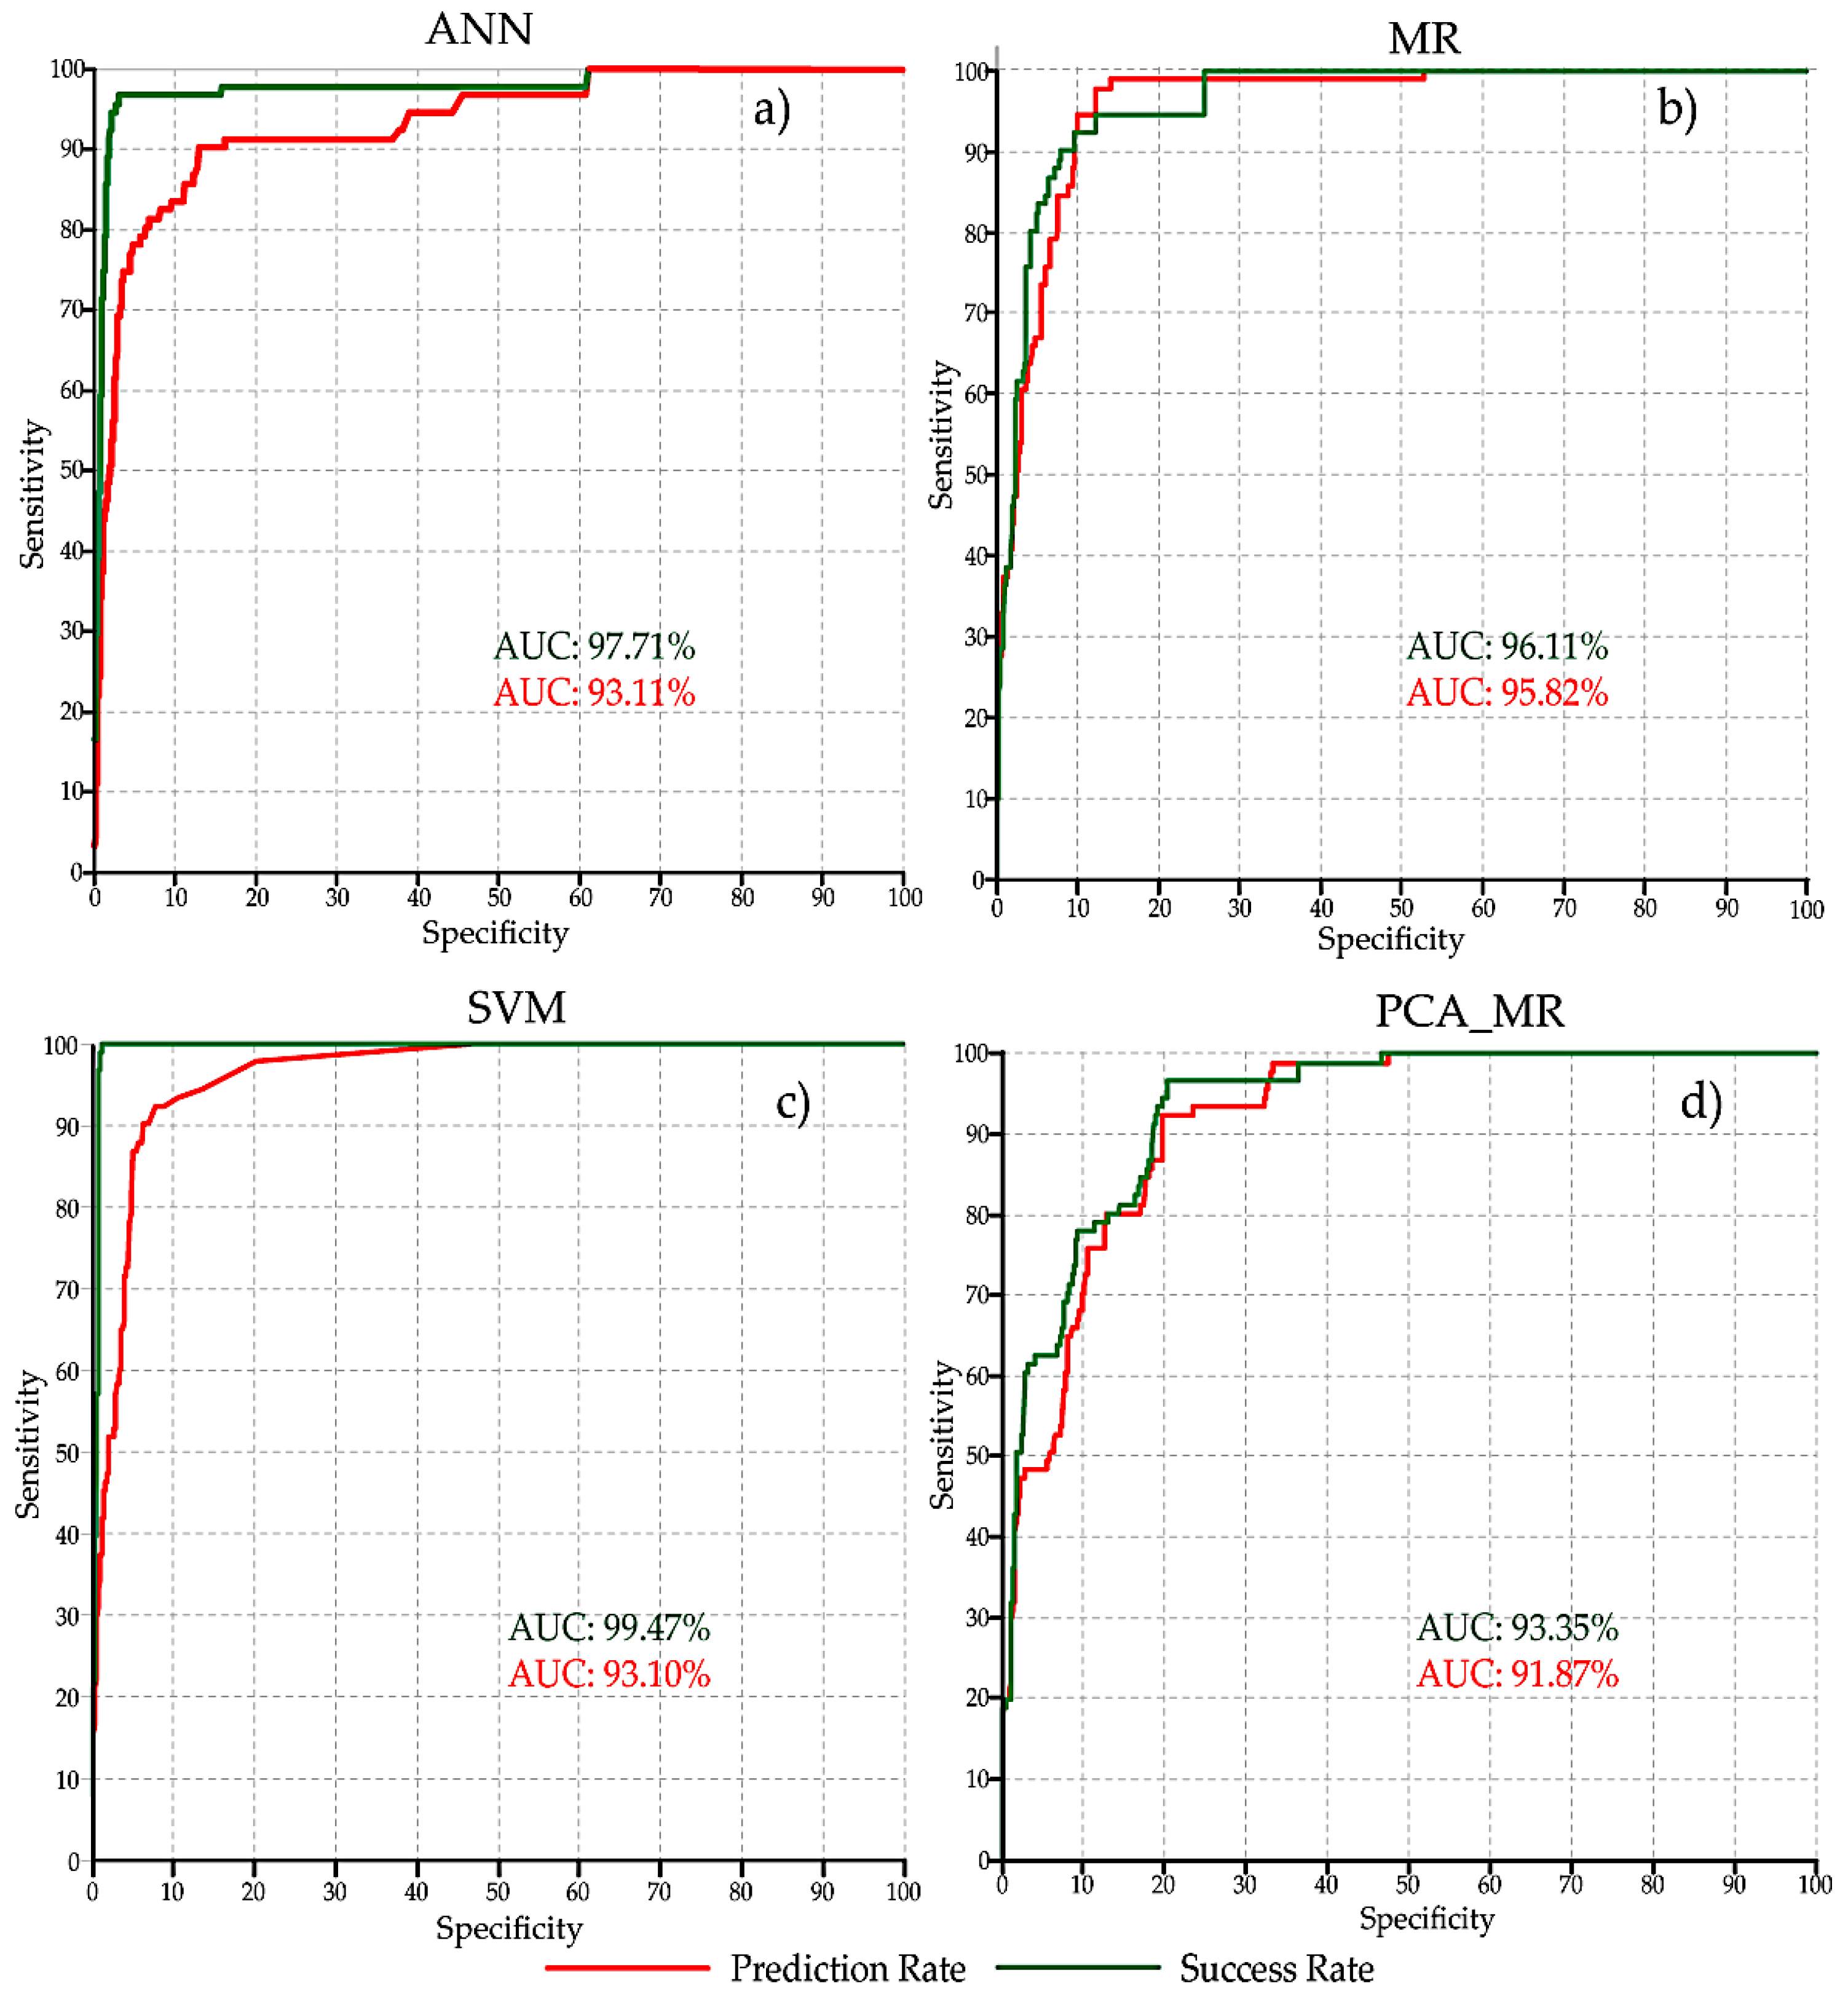
4.2. Landslide Susceptibility Mapping and Model Selection
4.3. Rainfall Threshold Analysis Results
4.4. Developing the Landslide Web-Warning System
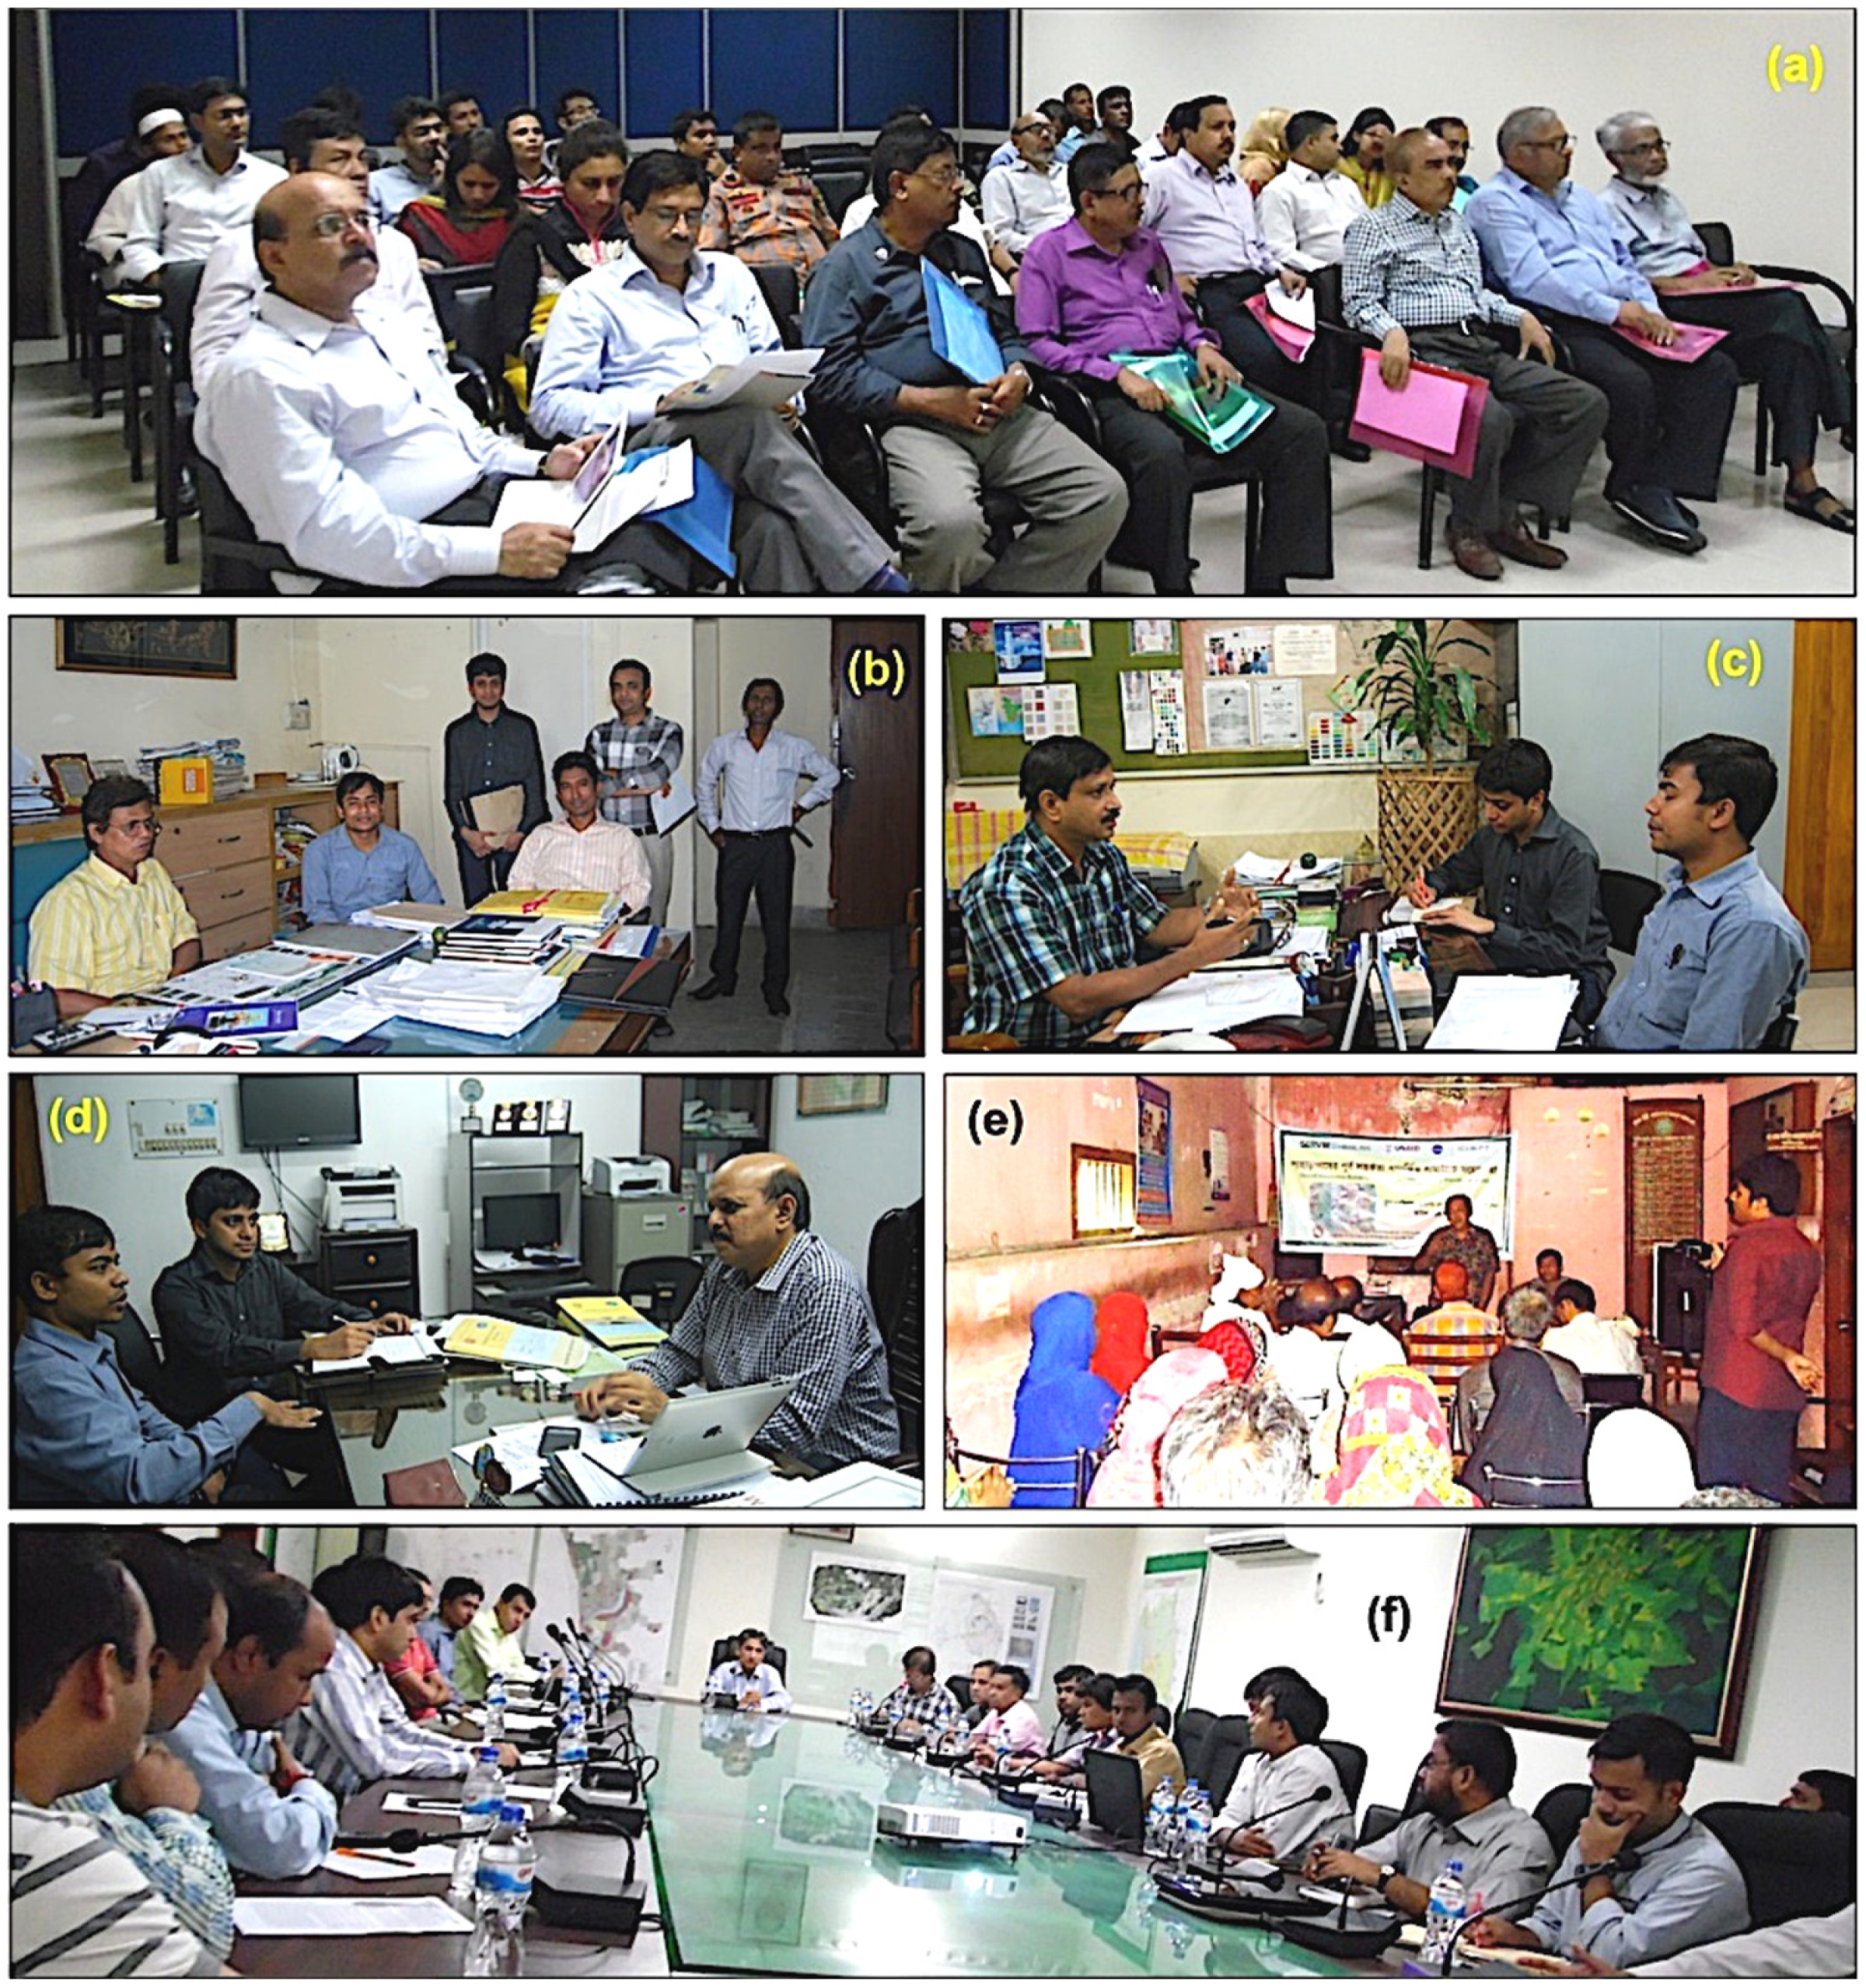
4.5. Community Training and Stakeholder Engagement
5. Discussion and Future Research
6. Conclusions
Author Contributions
Funding
Acknowledgments
Conflicts of Interest
Appendix

| Date | Landslide Locations | Rainfall Sequence | Consequences |
|---|---|---|---|
| 13/08/1999 | Different locations in Chittagong district | 435 mm—12 days 2–13 Aug 1999 | 17 fatalities, 350 houses damaged |
| 29/06/2003 | Patiya, Chittagong | 658 mm—10 days 20–29 June 2003 | 4 fatalities |
| 10/07/2006 | Satkania, Chittagong | 231 mm—6 days 4–9 July 2006 | 2 fatalities |
| 11/06/2007 | Different locations in Chittagong city | 610 mm—8 days 4–11 June 2007 | 128 people died and 100 injured |
| 10/09/2007 | Nabi Nagar, Chittagong | 452 mm—7 days 4–10 Sept 2007 | 2 fatalities |
| 18/08/2008 | Matijharna, Chittagong City Corporation | 454 mm—11 days 8–18 August 2008 | 11 fatalities and 25 injured |
| 01/07/2011 | Batali Hill, Chittagong | 200 mm—6 days 25–30 June 2011 | 19 people died and many injured |
| 26/06/2012 | Lebubagan and Foys lake surroundings, Chittagong | 889 mm—8 days 19–26 June 2012 | 90 fatalities and 150 injured |
| 28/07/2013 | Lalkhan Bazar, Chittagong City Corporation (CCC) | 148 mm—2 days 26–27 July 2013 | 2 fatalities |
| 21/06/2014 | Pachlaish, Chittagong | 2 days continuous heavy rainfall | 1 dead and 2 injured |
| 23/06/2015 | DT Road Rail Gate, Chittagong | Wall collapse due to 2 days heavy rainfall | 2 dead |
| 19/07/2015 | Motijharna and Tankir Pahar, Chittagong | 205 mm—5 days 15–19 July 2015 | 6 dead |
| 13/06/2017 | All five hill districts | Several days of continuous rainfall | 159 dead and 88 injured |
| 21/07/2017 | Sitakunda, Chittagong | Several days of continuous rainfall | 5 fatalities |
| 14/10/2018 | Akbar Shah area’s Firoz Shah Colony, and Panchlaish’s Rahman Nagar area | 464 mm—5 days 09–13 October 2018 | 4 people were killed |

| Study Area | Observed Landslide Area | ||||||
| SVM | ANN | Area Pixel | Area (km2) | % | Area Pixel | Area (km2) | % |
| None | None | 585,642 | 527.08 | 77.54 | 7 | 0.01 | 3.98 |
| Low | 130,292 | 117.26 | 17.25 | 12 | 0.01 | 6.82 | |
| Medium | 17,340 | 15.61 | 2.30 | 19 | 0.02 | 10.80 | |
| High | 4006 | 3.61 | 0.53 | 6 | 0.01 | 3.41 | |
| Low | None | 776 | 0.70 | 0.10 | 1 | 0.00 | 0.57 |
| Low | 1084 | 0.98 | 0.14 | 0 | 0.00 | 0.00 | |
| Medium | 2169 | 1.95 | 0.29 | 2 | 0.00 | 1.14 | |
| High | 1599 | 1.44 | 0.21 | 2 | 0.00 | 1.14 | |
| Medium | None | 204 | 0.18 | 0.03 | 0 | 0.00 | 0.00 |
| Low | 521 | 0.47 | 0.07 | 0 | 0.00 | 0.00 | |
| Medium | 1351 | 1.22 | 0.18 | 1 | 0.00 | 0.57 | |
| High | 1507 | 1.36 | 0.20 | 5 | 0.00 | 2.84 | |
| High | None | 122 | 0.11 | 0.02 | 2 | 0.00 | 1.14 |
| Low | 240 | 0.22 | 0.03 | 1 | 0.00 | 0.57 | |
| Medium | 1851 | 1.67 | 0.25 | 11 | 0.01 | 6.25 | |
| High | 6615 | 5.95 | 0.88 | 107 | 0.10 | 60.80 | |
| Total Area | 755,319 | 679.79 | 100.00 | 176 | 0.16 | 100.00 | |
| Total Agreed Area | 594,692 | 535.20 | 78.73 | 115 | 0.10 | 65.34 | |
| Study Area | Observed Landslide Area | ||||||
| SVM | PCA_MR | Area Pixel | Area (km2) | % | Area Pixel | Area (km2) | % |
| None | None | 271,475 | 244.33 | 35.94 | 0 | 0.00 | 0.00 |
| Low | 248,840 | 223.96 | 32.95 | 6 | 0.01 | 3.41 | |
| Medium | 137,794 | 124.01 | 18.24 | 11 | 0.01 | 6.25 | |
| High | 79,171 | 71.25 | 10.48 | 27 | 0.02 | 15.34 | |
| Low | None | 1 | 0.00 | 0.00 | 0 | 0.00 | 0.00 |
| Low | 609 | 0.55 | 0.08 | 0 | 0.00 | 0.00 | |
| Medium | 1313 | 1.18 | 0.17 | 0 | 0.00 | 0.00 | |
| High | 3705 | 3.33 | 0.49 | 5 | 0.00 | 2.84 | |
| Medium | None | 3 | 0.00 | 0.00 | 0 | 0.00 | 0.00 |
| Low | 228 | 0.21 | 0.03 | 0 | 0.00 | 0.00 | |
| Medium | 758 | 0.68 | 0.10 | 0 | 0.00 | 0.00 | |
| High | 2594 | 2.33 | 0.34 | 6 | 0.01 | 3.41 | |
| High | None | 0 | 0.00 | 0.00 | 0 | 0.00 | 0.00 |
| Low | 260 | 0.23 | 0.03 | 3 | 0.00 | 1.70 | |
| Medium | 1138 | 1.02 | 0.15 | 21 | 0.02 | 11.93 | |
| High | 7430 | 6.69 | 0.98 | 97 | 0.09 | 55.11 | |
| Total Area | 755,319 | 679.79 | 100.00 | 176 | 0.16 | 100.00 | |
| Total Agreed Area | 280,272 | 252.24 | 37.11 | 97 | 0.09 | 55.11 | |
| Study Area | Observed Landslide Area | ||||||
| SVM | MR | Area Pixel | Area (km2) | % | Area Pixel | Area (km2) | % |
| None | None | 371,927 | 334.73 | 49.24 | 1 | 0.00 | 0.57 |
| Low | 328,215 | 295.39 | 43.45 | 10 | 0.01 | 5.68 | |
| Medium | 19,594 | 17.63 | 2.59 | 8 | 0.01 | 4.55 | |
| High | 17,544 | 15.79 | 2.32 | 25 | 0.02 | 14.20 | |
| Low | None | 385 | 0.35 | 0.05 | 0 | 0.00 | 0.00 |
| Low | 1202 | 1.08 | 0.16 | 3 | 0.00 | 1.70 | |
| Medium | 1297 | 1.17 | 0.17 | 0 | 0.00 | 0.00 | |
| High | 2744 | 2.47 | 0.36 | 2 | 0.00 | 1.14 | |
| Medium | None | 55 | 0.05 | 0.01 | 0 | 0.00 | 0.00 |
| Low | 680 | 0.61 | 0.09 | 1 | 0.00 | 0.57 | |
| Medium | 643 | 0.58 | 0.09 | 0 | 0.00 | 0.00 | |
| High | 2205 | 1.98 | 0.29 | 5 | 0.00 | 2.84 | |
| High | None | 7 | 0.01 | 0.00 | 0 | 0.00 | 0.00 |
| Low | 780 | 0.70 | 0.10 | 16 | 0.01 | 9.09 | |
| Medium | 1185 | 1.07 | 0.16 | 18 | 0.02 | 10.23 | |
| High | 6856 | 6.17 | 0.91 | 87 | 0.08 | 49.43 | |
| Total Area | 755,319 | 679.79 | 100.00 | 176 | 0.16 | 100.00 | |
| Total Agreed Area | 380,628 | 342.57 | 50.39 | 91 | 0.08 | 51.70 | |
| Study Area | Observed Landslide Area | ||||||
| PCA_MR | ANN | Area Pixel | Area (km2) | % | Area Pixel | Area (km2) | % |
| None | None | 237,807 | 214.03 | 31.48 | 0 | 0.00 | 0.00 |
| Low | 33,476 | 30.13 | 4.43 | 0 | 0.00 | 0.00 | |
| Medium | 183 | 0.16 | 0.02 | 0 | 0.00 | 0.00 | |
| High | 13 | 0.01 | 0.00 | 0 | 0.00 | 0.00 | |
| Low | None | 212,546 | 191.29 | 28.14 | 1 | 0.00 | 0.57 |
| Low | 35,793 | 32.21 | 4.74 | 5 | 0.00 | 2.84 | |
| Medium | 1505 | 1.35 | 0.20 | 1 | 0.00 | 0.57 | |
| High | 93 | 0.08 | 0.01 | 2 | 0.00 | 1.14 | |
| Medium | None | 88,416 | 79.57 | 11.71 | 2 | 0.00 | 1.14 |
| Low | 44,402 | 39.96 | 5.88 | 4 | 0.00 | 2.27 | |
| Medium | 7079 | 6.37 | 0.94 | 11 | 0.01 | 6.25 | |
| High | 1106 | 1.00 | 0.15 | 15 | 0.01 | 8.52 | |
| High | None | 47,975 | 43.18 | 6.35 | 7 | 0.01 | 3.98 |
| Low | 18,466 | 16.62 | 2.44 | 4 | 0.00 | 2.27 | |
| Medium | 13,944 | 12.55 | 1.85 | 21 | 0.02 | 11.93 | |
| High | 12,515 | 11.26 | 1.66 | 103 | 0.09 | 58.52 | |
| Total Area | 755,319 | 679.79 | 100.00 | 176 | 0.16 | 100.00 | |
| Total Agreed Area | 293,194 | 263.87 | 38.82 | 119 | 0.11 | 67.61 | |
| Study Area | Observed Landslide Area | ||||||
| PCA_MR | MR | Area Pixel | Area (km2) | % | Area Pixel | Area (km2) | % |
| None | None | 160,375 | 144.34 | 21.23 | 0 | 0.00 | 0.00 |
| Low | 109,889 | 98.90 | 14.55 | 0 | 0.00 | 0.00 | |
| Medium | 937 | 0.84 | 0.12 | 0 | 0.00 | 0.00 | |
| High | 279 | 0.25 | 0.04 | 0 | 0.00 | 0.00 | |
| Low | None | 147,150 | 132.44 | 19.48 | 1 | 0.00 | 0.57 |
| Low | 97,274 | 87.55 | 12.88 | 1 | 0.00 | 0.57 | |
| Medium | 3886 | 3.50 | 0.51 | 4 | 0.00 | 2.27 | |
| High | 1627 | 1.46 | 0.22 | 3 | 0.00 | 1.70 | |
| Medium | None | 47,834 | 43.05 | 6.33 | 0 | 0.00 | 0.00 |
| Low | 81,664 | 73.50 | 10.81 | 19 | 0.02 | 10.80 | |
| Medium | 6826 | 6.14 | 0.90 | 4 | 0.00 | 2.27 | |
| High | 4679 | 4.21 | 0.62 | 9 | 0.01 | 5.11 | |
| High | None | 17,016 | 15.31 | 2.25 | 0 | 0.00 | 0.00 |
| Low | 42,050 | 37.85 | 5.57 | 10 | 0.01 | 5.68 | |
| Medium | 11,070 | 9.96 | 1.47 | 18 | 0.02 | 10.23 | |
| High | 22,764 | 20.49 | 3.01 | 107 | 0.10 | 60.80 | |
| Total Area | 755,320 | 679.79 | 100.00 | 176 | 0.16 | 100.00 | |
| Total Agreed Area | 287,239 | 258.52 | 38.03 | 112 | 0.10 | 63.64 | |
| Study Area | Observed Landslide Area | ||||||
| MR | ANN | Area Pixel | Area (km2) | % | Area Pixel | Area (km2) | % |
| None | None | 305,784 | 275.21 | 40.48 | 1 | 0.00 | 0.57 |
| Low | 65,757 | 59.18 | 8.71 | 0 | 0.00 | 0.00 | |
| Medium | 827 | 0.74 | 0.11 | 0 | 0.00 | 0.00 | |
| High | 6 | 0.01 | 0.00 | 0 | 0.00 | 0.00 | |
| Low | None | 269,705 | 242.73 | 35.71 | 3 | 0.00 | 1.70 |
| Low | 54,235 | 48.81 | 7.18 | 4 | 0.00 | 2.27 | |
| Medium | 6651 | 5.99 | 0.88 | 16 | 0.01 | 9.09 | |
| High | 286 | 0.26 | 0.04 | 7 | 0.01 | 3.98 | |
| Medium | None | 8166 | 7.35 | 1.08 | 3 | 0.00 | 1.70 |
| Low | 7218 | 6.50 | 0.96 | 3 | 0.00 | 1.70 | |
| Medium | 5912 | 5.32 | 0.78 | 2 | 0.00 | 1.14 | |
| High | 1423 | 1.28 | 0.19 | 18 | 0.02 | 10.23 | |
| High | None | 3089 | 2.78 | 0.41 | 3 | 0.00 | 1.70 |
| Low | 4927 | 4.43 | 0.65 | 6 | 0.01 | 3.41 | |
| Medium | 9321 | 8.39 | 1.23 | 15 | 0.01 | 8.52 | |
| High | 12,012 | 10.81 | 1.59 | 95 | 0.09 | 53.98 | |
| Total Area | 755,319 | 679.79 | 100.00 | 176 | 0.16 | 100.00 | |
| Total Agreed Area | 377,943 | 340.15 | 50.04 | 102 | 0.09 | 57.95 | |


References
- Disasters in Asia and the Pacific: 2015 year in review. In United Nations (UN) Report. Economic and Social Commission for Asia and the Pacific (ESCAP); UN ESCAP: Bangkok, Thailand, 2015.
- Van Westen, C.J.; Quan Luna, B.; Vargas Franco, R.; Malet, J.P.; Jaboyedoff, M.; Horton, P.; Kappes, M. Development of training materials on the use of geo-information for multi-hazard risk assessment in a mountainous environment. In Proceedings of the Mountain Risks International Conference, Firenze, Italy, 24 November 2010; pp. 24–26. [Google Scholar]
- Kirschbaum, D.B.; Adler, R.; Hong, Y.; Hill, S.; Lerner-Lam, A. A global landslide catalog for hazard applications: Method, results, and limitations. Nat. Hazards 2010, 52, 561–575. [Google Scholar] [CrossRef]
- Petley, D.N.; Dunning, S.A.; Rosser, N.J.; Hungr, O. The Analysis of Global Landslide Risk through the Creation of a Database of Worldwide Landslide Fatalities. Landslide Risk Management; Taylor and Francis Group: London, UK, 2005; pp. 367–374. [Google Scholar]
- WU, C. Comparison and Evolution of Extreme Rainfall-Induced Landslides in Taiwan. ISPRS Int. J. Geo-Inf. 2017, 6, 367. [Google Scholar] [CrossRef]
- Shrestha, S.; Kang, T.-S.; Suwal, M.K. An Ensemble Model for Co-Seismic Landslide Susceptibility Using GIS and Random Forest Method. ISPRS Int. J. Geo-Inf. 2017, 6, 365. [Google Scholar] [CrossRef]
- Rabby, Y.W.; Li, Y. An integrated approach to map landslides in Chittagong Hilly Areas, Bangladesh, using Google Earth and field mapping. Landslides 2018. [Google Scholar] [CrossRef]
- Japan Hit by Worst Weather Disaster in Decades: Why Did so Many Die? Available online: https://www.reuters.com/article/us-weather-japan-explainer/japan-hit-by-worst-weather-disaster-in-decades-why-did-so-many-die-idUSKBN1K10ET (accessed on 18 December 2018).
- Ahmed, B. Community Vulnerability to Landslides in Bangladesh. Ph.D Thesis, University College London, London, UK, 2017. [Google Scholar]
- Ahmed, B. Landslide susceptibility mapping using multi-criteria evaluation techniques in Chittagong Metropolitan Area, Bangladesh. Landslides 2015, 12, 1077–1095. [Google Scholar] [CrossRef]
- Ahmed, B. Landslide susceptibility modelling applying user-defined weighting and data-driven statistical techniques in Cox’s Bazar Municipality, Bangladesh. Nat. Hazards 2015, 79, 1707–1737. [Google Scholar] [CrossRef]
- Rahman, M.S.; Ahmed, B.; Di, L. Landslide initiation and runout susceptibility modeling in the context of hill cutting and rapid urbanization: A combined approach of weights of evidence and spatial multi-criteria. J. Mt. Sci. 2017, 14, 1919–1937. [Google Scholar] [CrossRef]
- Ahmed, B.; Dewan, A. Application of bivariate and multivariate statistical techniques in landslide susceptibility modeling in Chittagong City Corporation, Bangladesh. Remote Sens. 2017, 9, 304. [Google Scholar] [CrossRef]
- Kelman, I.; Ahmed, B.; Esraz-Ul-Zannat, M.; Saroar, M.M.; Fordham, M.; Shamsudduha, M. Warning systems as social processes for Bangladesh cyclones. Dis. Prev. Manag. Int. J. 2018, 27, 370–379. [Google Scholar] [CrossRef]
- Kelman, I.; Glantz, M.H. Early warning systems defined. In Reducing Disaster: Early Warning Systems for Climate Change; Springer: Heidelberg, Germany, 2014; pp. 89–108. [Google Scholar]
- Kelman, I. Warning for the 26 December 2004 tsunamis. Dis. Prev. Manag. Int. J. 2006, 15, 178–189. [Google Scholar] [CrossRef] [Green Version]
- Intrieri, E.; Gigli, G.; Mugnai, F.; Fanti, R.; Casagli, N. Design and implementation of a landslide early warning system. Eng. Geol. 2012, 147, 124–136. [Google Scholar] [CrossRef] [Green Version]
- Michoud, C.; Bazin, S.; Blikra, L.H.; Derron, M.-H.; Jaboyedoff, M. Experiences from site-specific landslide early warning systems. Nat. Hazards Earth Syst. Sci. 2013, 13, 2659–2673. [Google Scholar] [CrossRef] [Green Version]
- Segoni, S.; Rosi, A.; Rossi, G.; Catani, F.; Casagli, N. Analysing the relationship between rainfalls and landslides to define a mosaic of triggering thresholds for regional-scale warning systems. Nat. Hazards Earth Syst. Sci. 2014, 14, 2637–2648. [Google Scholar] [CrossRef] [Green Version]
- Calvello, M.; d’Orsi, R.N.; Piciullo, L.; Paes, N.; Magalhaes, M.; Lacerda, W.A. The Rio de Janeiro early warning system for rainfall-induced landslides: Analysis of performance for the years 2010–2013. Int. J. Disaster Risk Reduct. 2015, 12, 3–15. [Google Scholar] [CrossRef]
- Caine, N. The rainfall intensity-duration control of shallow landslides and debris flows. Geografiska Annal. 1980, 62, 23–27. [Google Scholar]
- Kirschbaum, D.; Stanley, T. Satellite-Based Assessment of Rainfall-Triggered Landslide Hazard for Situational Awareness. Earth’s Future 2018, 6, 505–523. [Google Scholar] [CrossRef]
- Segoni, S.; Battistini, A.; Rossi, G.; Rosi, A.; Lagomarsino, D.; Catani, F.; Moretti, S.; Casagli, N. An operational landslide early warning system at regional scale based on space–time-variable rainfall thresholds. Nat. Hazards Earth Syst. Sci. 2015, 15, 853–861. [Google Scholar] [CrossRef]
- Glade, T.; Crozier, M.; Smith, P. Applying probability determination to refine landslide-triggering rainfall thresholds using an empirical “Antecedent Daily Rainfall Model”. Pure Appl. Geophys. 2000, 157, 1059–1079. [Google Scholar] [CrossRef]
- Wieczorek, G.F.; Glade, T. Climatic Factors Influencing Occurrence of Debris Flows. In Debris-Flow Hazards and Related Phenomena; Springer: Berlin, Heidelberg, 2005; pp. 325–362. [Google Scholar]
- Gabet, E.J.; Burbank, D.W.; Putkonen, J.K.; Pratt-Sitaula, B.A.; Ojha, T. Rainfall thresholds for landsliding in the Himalayas of Nepal. Geomorphology 2004, 63, 131–143. [Google Scholar] [CrossRef]
- Peruccacci, S.; Brunetti, M.T.; Gariano, S.L.; Melillo, M.; Rossi, M.; Guzzetti, F. Rainfall thresholds for possible landslide occurrence in Italy. Geomorphology 2017, 290, 39–57. [Google Scholar] [CrossRef]
- Mirus, B.B.; Becker, R.E.; Baum, R.L.; Smith, J.B. Integrating real-time subsurface hydrologic monitoring with empirical rainfall thresholds to improve landslide early warning. Landslides 2018, 15, 1909–1919. [Google Scholar] [CrossRef]
- Segoni, S.; Rosi, A.; Lagomarsino, D.; Fanti, R.; Casagli, N. Brief communication: Using averaged soil moisture estimates to improve the performances of a regional-scale landslide early warning system. Nat. Hazards Earth Syst. Sci. 2018, 18, 807–812. [Google Scholar] [CrossRef] [Green Version]
- Liao, Z.; Hong, Y.; Wang, J.; Fukuoka, H.; Sassa, K.; Karnawati, D.; Fathani, F. Prototyping an experimental early warning system for rainfall-induced landslides in Indonesia using satellite remote sensing and geospatial datasets. Landslides 2010, 7, 317–324. [Google Scholar] [CrossRef]
- Lagomarsino, D.; Segoni, S.; Fanti, R.; Catani, F. Updating and tuning a regional-scale landslide early warning system. Landslides 2013, 10, 91–97. [Google Scholar] [CrossRef]
- CDMP-II Rainfall Triggered Landslide Hazard Zonation in Cox’s Bazar & Teknaf Municipalities as well as Introducing Community-based Early Warning System for Landslide Hazard Management; Ministry of Food and Disaster Management (MoFDM): Dhaka, Bangladesh, 2012.
- CDMP II Landslide Inventory and Landuse Mapping, DEM Preparation, Precipitation Threshold Value and Establishment of Early Warning Device; Comprehensive Disaster Management Programme-II (CDMP-II); Ministry of Food and Disaster Management (MoFDM) Disaster Management and Relief Division (DMRD) Government of the People’s Republic of Bangladesh: Dhaka, Bangladesh, 2012.
- BBS District Statistics 2011—Chittagong. Bangladesh Bureau of Statistics; Statistics and Informatics Division (SID), Ministry of Planning, Parishankhan Bhaban, E-27/A, Agargaon, Dhaka-1207; Government of the People’s Republic of Bangladesh: Dhaka, Bangladesh, 2013.
- Brammer, H. Physical Geography of Bangladesh; The University Press Ltd.: Dhaka, Bangladesh, 2012. [Google Scholar]
- Ahmed, B.; Rahman, M.S.; Rahman, S.; Huq, F.F.; Ara, S. Landslide Inventory Report of Chittagong Metropolitan Area, Bangladesh; BUET-Japan Institute of Disaster Prevention and Urban Safety: Dhaka, Bangladesh, 2014. [Google Scholar]
- Rahman, M.S.; Ahmed, B.; Huq, F.F.; Rahman, S.; Al-Hussaini, T. Landslide inventory in an urban setting in the context of Chittagong Metropolitan Area, Bangladesh. In Proceedings of the 3rd International Conference on Advances in Civil Engineering, Chittagong, Bangladesh, 21–23 December 2016. [Google Scholar]
- Daily Observational Data Map: GIS Maps. National Oceanic and Atmospheric Administration (NOAA). Available online: https://www.ncdc.noaa.gov/maps/ (accessed on 5 August 2018).[Green Version]
- Ahmed, B.; Ahmed, R. Modeling urban land cover growth dynamics using multi-temporal satellite images: A case study of Dhaka, Bangladesh. ISPRS Int. J. Geo-Inf. 2012, 1, 3–31. [Google Scholar] [CrossRef]
- Ahmed, B.; Ahmed, R.; Zhu, X. Evaluation of model validation techniques in land cover dynamics. ISPRS Int. J. Geo-Inf. 2013, 2, 577–597. [Google Scholar] [CrossRef]
- Couture, R.; Blais-Stevens, A.; Bobrowsky, P.; Wang, B.; VanDine, D. Canadian technical guidelines and best practices related to landslides: A national initiative for loss reduction. In Landslides: Global Risk Preparedness; Springer: Berlin, Germany, 2013; pp. 315–322. [Google Scholar]
- Merghadi, A.; Abderrahmane, B.; Tien Bui, D. Landslide Susceptibility Assessment at Mila Basin (Algeria): A Comparative Assessment of Prediction Capability of Advanced Machine Learning Methods. ISPRS Int. J. Geo-Inf. 2018, 7, 268. [Google Scholar] [CrossRef]
- Feizizadeh, B.; Roodposhti, M.S.; Blaschke, T.; Aryal, J. Comparing GIS-based support vector machine kernel functions for landslide susceptibility mapping. Arab. J. Geosci. 2017, 10, 122. [Google Scholar] [CrossRef]
- Kalantar, B.; Pradhan, B.; Naghibi, S.A.; Motevalli, A.; Mansor, S. Assessment of the effects of training data selection on the landslide susceptibility mapping: a comparison between support vector machine (SVM), logistic regression (LR) and artificial neural networks (ANN). Geomat. Nat. Hazards Risk 2018, 9, 49–69. [Google Scholar] [CrossRef]
- Pradhan, B. A comparative study on the predictive ability of the decision tree, support vector machine and neuro-fuzzy models in landslide susceptibility mapping using GIS. Comput. Geosci. 2013, 51, 350–365. [Google Scholar] [CrossRef] [Green Version]
- Yilmaz, I. Landslide susceptibility mapping using frequency ratio, logistic regression, artificial neural networks and their comparison: A case study from Kat landslides (Tokat—Turkey). Comput. Geosci. 2009, 35, 1125–1138. [Google Scholar] [CrossRef]
- Zhou, C.; Yin, K.; Cao, Y.; Ahmed, B.; Li, Y.; Catani, F.; Pourghasemi, H.R. Landslide susceptibility modeling applying machine learning methods: A case study from Longju in the Three Gorges Reservoir area, China. Comput. Geosci. 2018, 112, 23–37. [Google Scholar] [CrossRef]
- Yilmaz, I. The effect of the sampling strategies on the landslide susceptibility mapping by conditional probability and artificial neural networks. Environ. Earth Sci. 2010, 60, 505–519. [Google Scholar] [CrossRef]
- Vapnik, V. The Nature of Statistical Learning Theory; Springer Science & Business Media: New York, NY, USA, 2013. [Google Scholar]
- Cramer, H. Mathematical Methods of Statistics; Princeton University: Princeton, NJ, USA, 1946. [Google Scholar]
- Salvatici, T.; Tofani, V.; Rossi, G.; D’Ambrosio, M.; Stefanelli, C.T.; Masi, E.B.; Rosi, A.; Pazzi, V.; Vannocci, P.; Petrolo, M. Application of a physically based model to forecast shallow landslides at a regional scale. Nat. Hazards Earth Syst. Sci. 2018, 18, 1919–1935. [Google Scholar] [CrossRef]
- Aleotti, P. A warning system for rainfall-induced shallow failures. Eng. Geol. 2004, 73, 247–265. [Google Scholar] [CrossRef]
- Zhang, X.; Yang, F. RClimDex (1.0) user manual. Clim. Res. Branch Environ. Can. 2004, 13–21. [Google Scholar]
- Segoni, S.; Tofani, V.; Rosi, A.; Catani, F.; Casagli, N. Combination of rainfall thresholds and susceptibility maps for dynamic landslide hazard assessment at regional scale. Front. Earth Sci. 2018, 6, 85. [Google Scholar] [CrossRef]
- Segoni, S.; Lagomarsino, D.; Fanti, R.; Moretti, S.; Casagli, N. Integration of rainfall thresholds and susceptibility maps in the Emilia Romagna (Italy) regional-scale landslide warning system. Landslides 2015, 12, 773–785. [Google Scholar] [CrossRef]
- Auflič, M.J.; Šinigoj, J.; Krivic, M.; Podboj, M.; Peternel, T.; Komac, M. Landslide prediction system for rainfall induced landslides in Slovenia (Masprem). Geologija 2016, 59, 259–271. [Google Scholar] [CrossRef]
- Kayastha, P.; Dhital, M.R.; De Smedt, F. Evaluation of the consistency of landslide susceptibility mapping: A case study from the Kankai watershed in east Nepal. Landslides 2013, 10, 785–799. [Google Scholar] [CrossRef]
- IPCC—SR15. Global Warming of 1.5 °C. Intergovernmental Panel on Climate Change (IPCC). Available online: http://www.ipcc.ch/report/sr15/ (accessed on 22 October 2018).
- Ahmed, B.; Kelman, I. Measuring Community Vulnerability to Environmental Hazards: A Method for Combining Quantitative and Qualitative Data. Nat. Hazards Rev. 2018, 19, 4018008. [Google Scholar] [CrossRef] [Green Version]
- Persits, F.M.; WAndrey, C.J.; Milici, R.C.; Manwar, A. Digital Geologic and Geophysical Data of Bangladesh; U.S. Geological Survey (USGS): Reston, VA, USA, 1997.


| Indicator Description | Precipitation Index (Unit) | Minimum | Maximum | Average |
|---|---|---|---|---|
| Monthly maximum 1-day precipitation | R × 1 (mm) | 115 | 511 | 236 |
| Monthly maximum consecutive 5-day precipitation | R × 5 (mm) | 208 | 1037 | 490 |
| Annual count of days when PRCP >= 10 mm | R10 (days) | 41 | 80 | 61 |
| Annual count of days when PRCP >= 20 mm | R20 (days) | 27 | 60 | 41 |
| Annual count of days when PRCP >= nn mm; nn is user defined threshold | R50 (days) | 8 | 30 | 18 |
| R75 (days) | 4 | 18 | 10 | |
| R100 (days) | 1 | 14 | 6 | |
| Maximum number of consecutive days with PRCP >= 1 mm | CWD (days) | 7 | 30 | 15 |
| Annual total PRCP in wet days (PRCP >= 1 mm) | PRCPTOT (mm) | 1780 | 4340 | 2917 |
| Event ID | Event Date | Number of Days Prior to and on the Day of the Major Landslide Events | |||||||
|---|---|---|---|---|---|---|---|---|---|
| −7 | −6 | −5 | −4 | −3 | −2 | −1 | 0 | ||
| E1 | 13/08/1999 | 5 | 9 | 28 | 86 | 0 | 123 | 110 | 206 |
| E2 | 29/06/2003 | 63 | 1 | 2 | 51 | 206 | 43 | 20 | 103 |
| E3 | 10/07/2006 | 30 | 30 | 7 | 19 | 84 | 61 | 38 | 24 |
| E4 | 11/06/2007 | 3 | 23 | 22 | 4 | 42 | 3 | 88 | 425 |
| E5 | 10/09/2007 | 0 | 7 | 35 | 84 | 160 | 40 | 50 | 76 |
| E6 | 18/08/2008 | 7.2 | 7.8 | 0.2 | 32.4 | 28.5 | 67.4 | 159.5 | 30.4 |
| E7 | 01/07/2011 | 30 | 27.2 | 29.5 | 40.4 | 62.2 | 94.5 | 127.8 | 66 |
| E8 | 26/06/2012 | 1 | 0 | 4.3 | 31.2 | 21.1 | 38.1 | 124.2 | 146.3 |
| E9 | 28/07/2013 | 0 | 0.5 | 0 | 19.1 | 100.6 | 63.2 | 65.8 | 2 |
| E10 | 21/06/2014 | 3.8 | 31.8 | 19.6 | 1 | 1.3 | 50.5 | 66.8 | 43.9 |
| E11 | 23/06/2015 | 0 | 11.4 | 4.3 | 4.8 | 5.1 | 86.6 | 55.1 | 183.9 |
| E12 | 19/07/2015 | 0 | 12.2 | 25.9 | 0 | 51.3 | 94.5 | 32.3 | 31.8 |
| E13 | 13/06/2017 | 0 | 0.3 | 0.8 | 0 | 6.1 | 246.4 | 131.6 | 0 |
| E14 | 21/07/2017 | 2 | 5.1 | 84.1 | 81.3 | 58.4 | 1.5 | 125.2 | 233.4 |
| Mean | 10.36 | 11.88 | 18.76 | 32.44 | 59.04 | 72.34 | 85.31 | 112.26 | |
| Median | 2.50 | 8.40 | 13.30 | 25.15 | 46.65 | 62.10 | 77.40 | 71.00 | |
| Validation Matrix | S1 = Zone 2 (Low LSM) | S2 = Zone 3 (Medium LSM) | S3 = Zone 4 (High LSM) | Total Landslides (%) |
|---|---|---|---|---|
| R1 (Low Rainfall) | 0 | 0 | 2 | 2 (6%) |
| R2 (Medium Rainfall) | 0 | 4 | 6 | 10 (28%) |
| R3 (High Rainfall) | 2 | 4 | 18 | 24 (66%) |
| Total Landslides (%) | 2 (6%) | 8 (22%) | 26 (72%) | 36 (100%) |
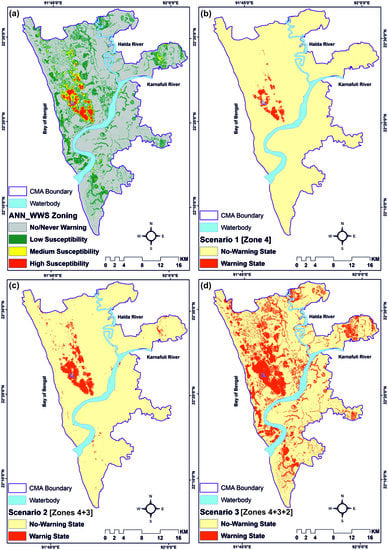
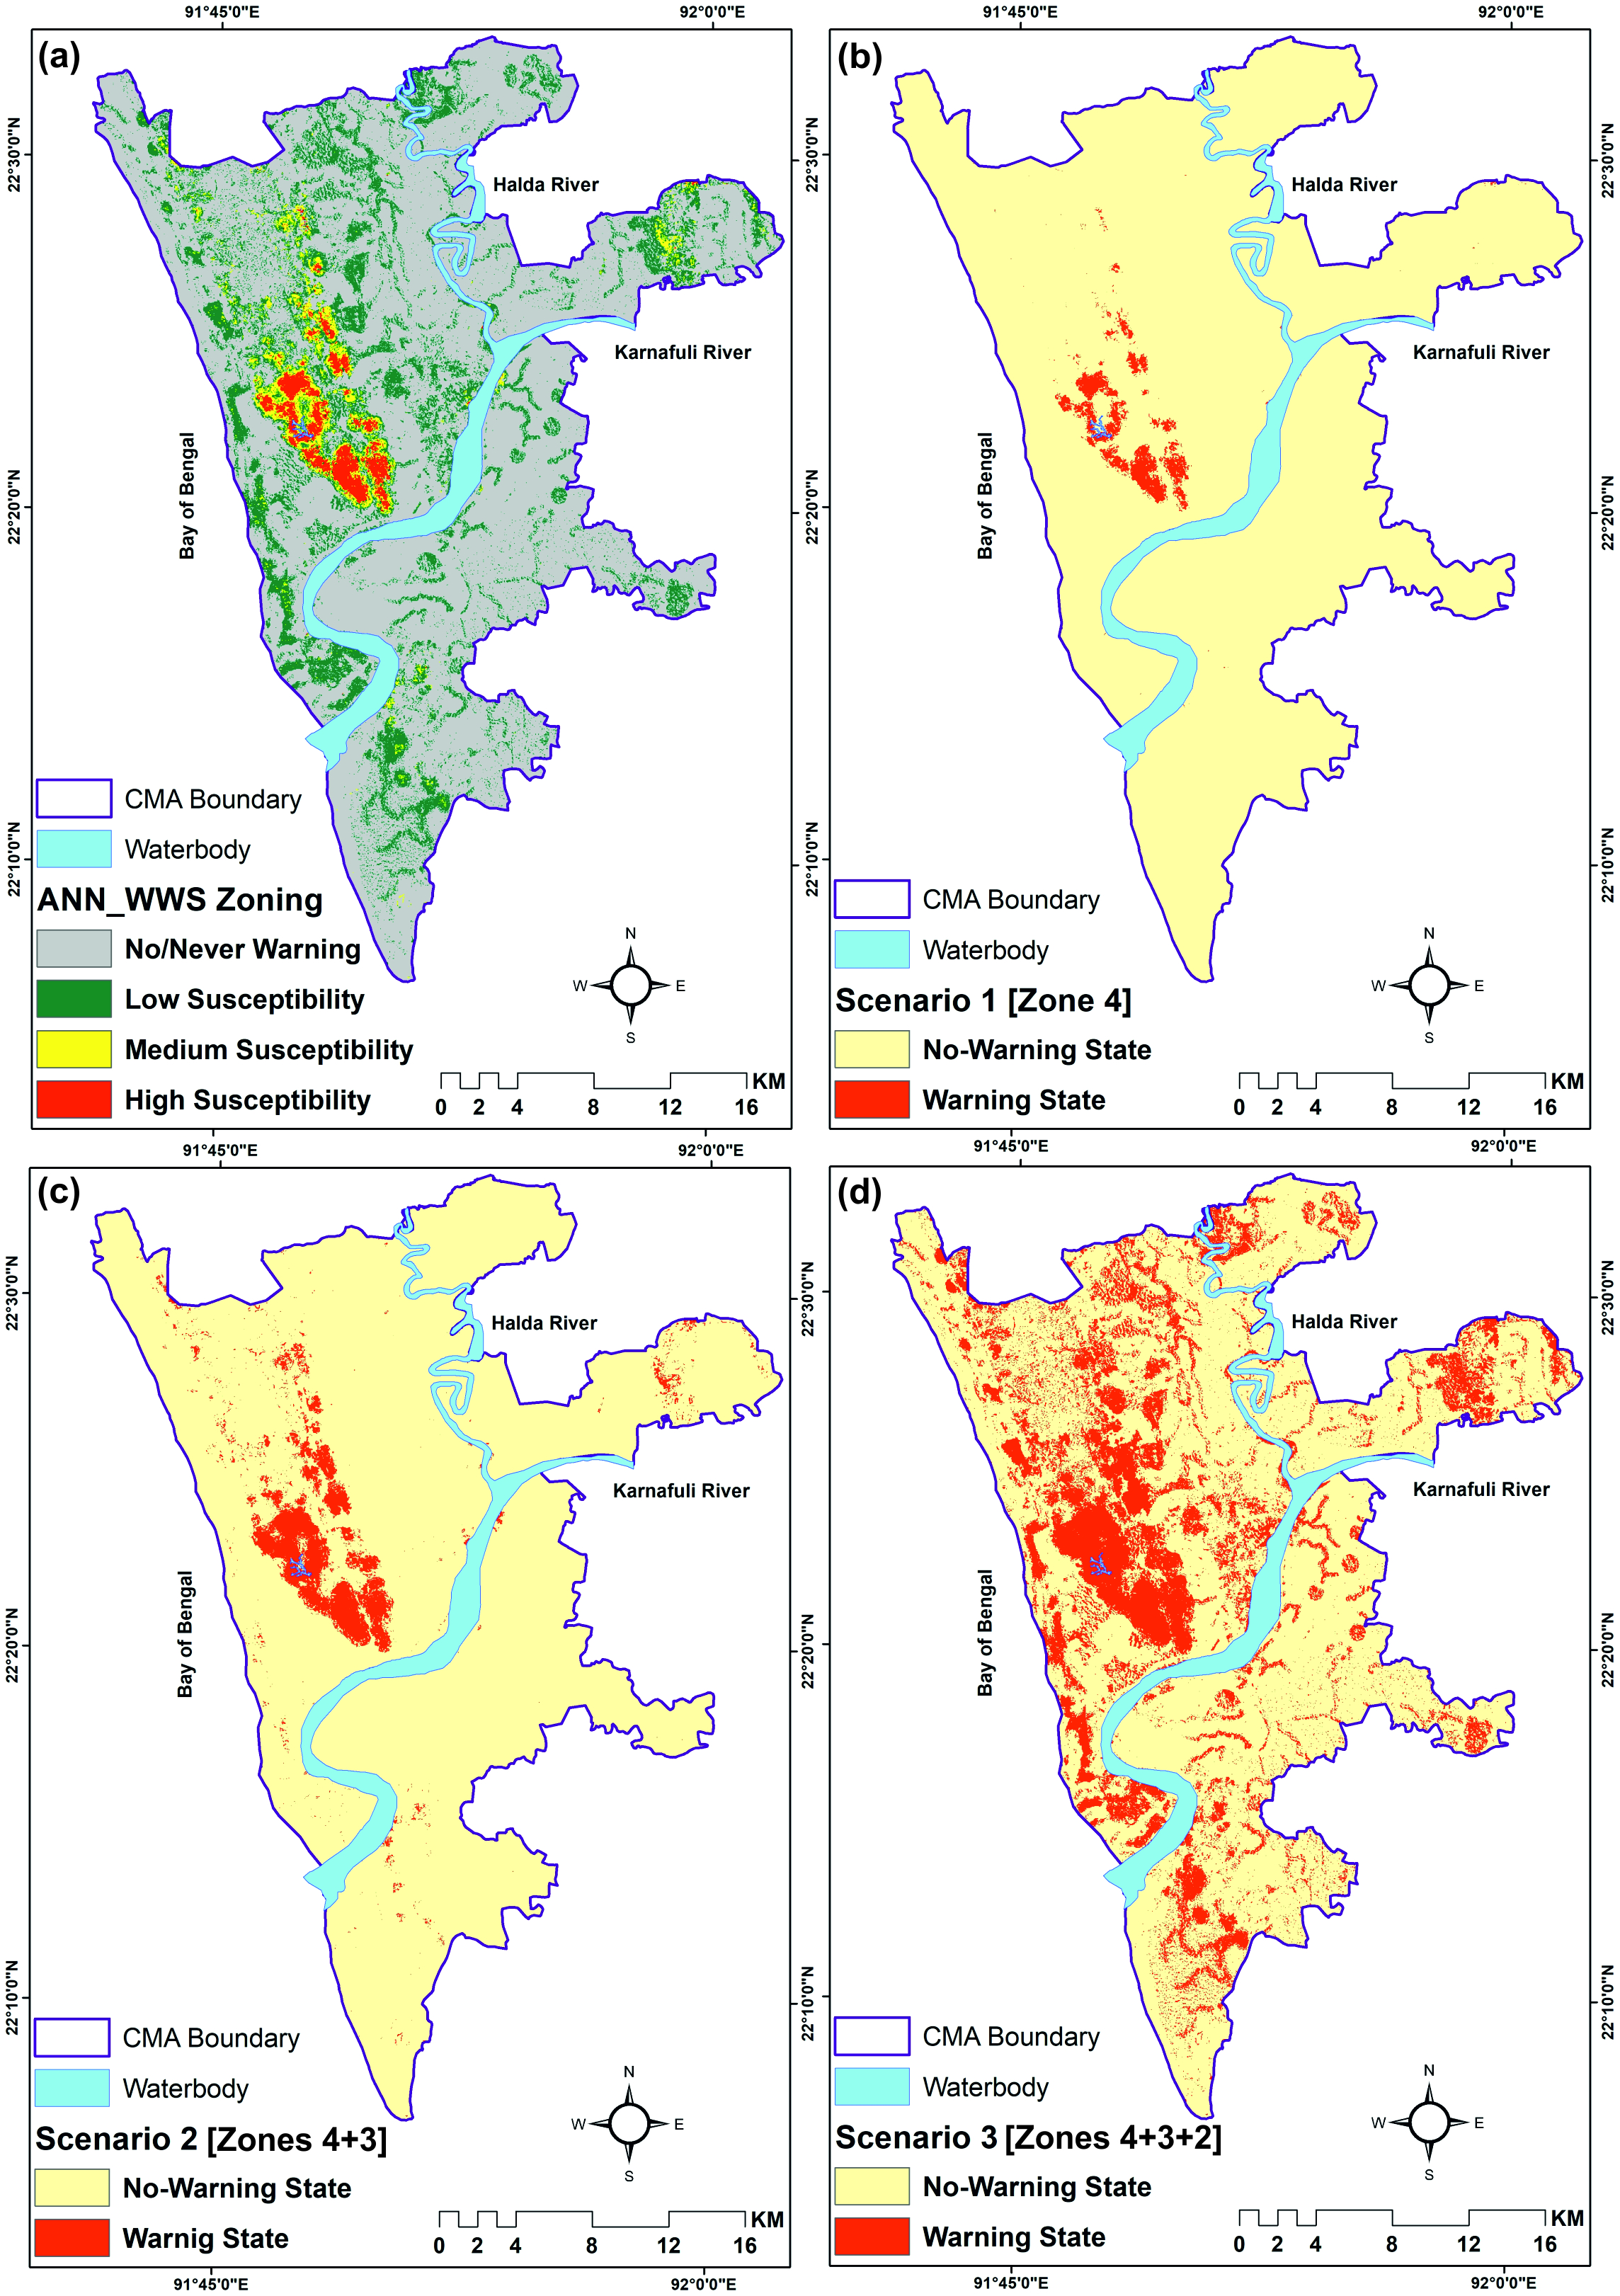
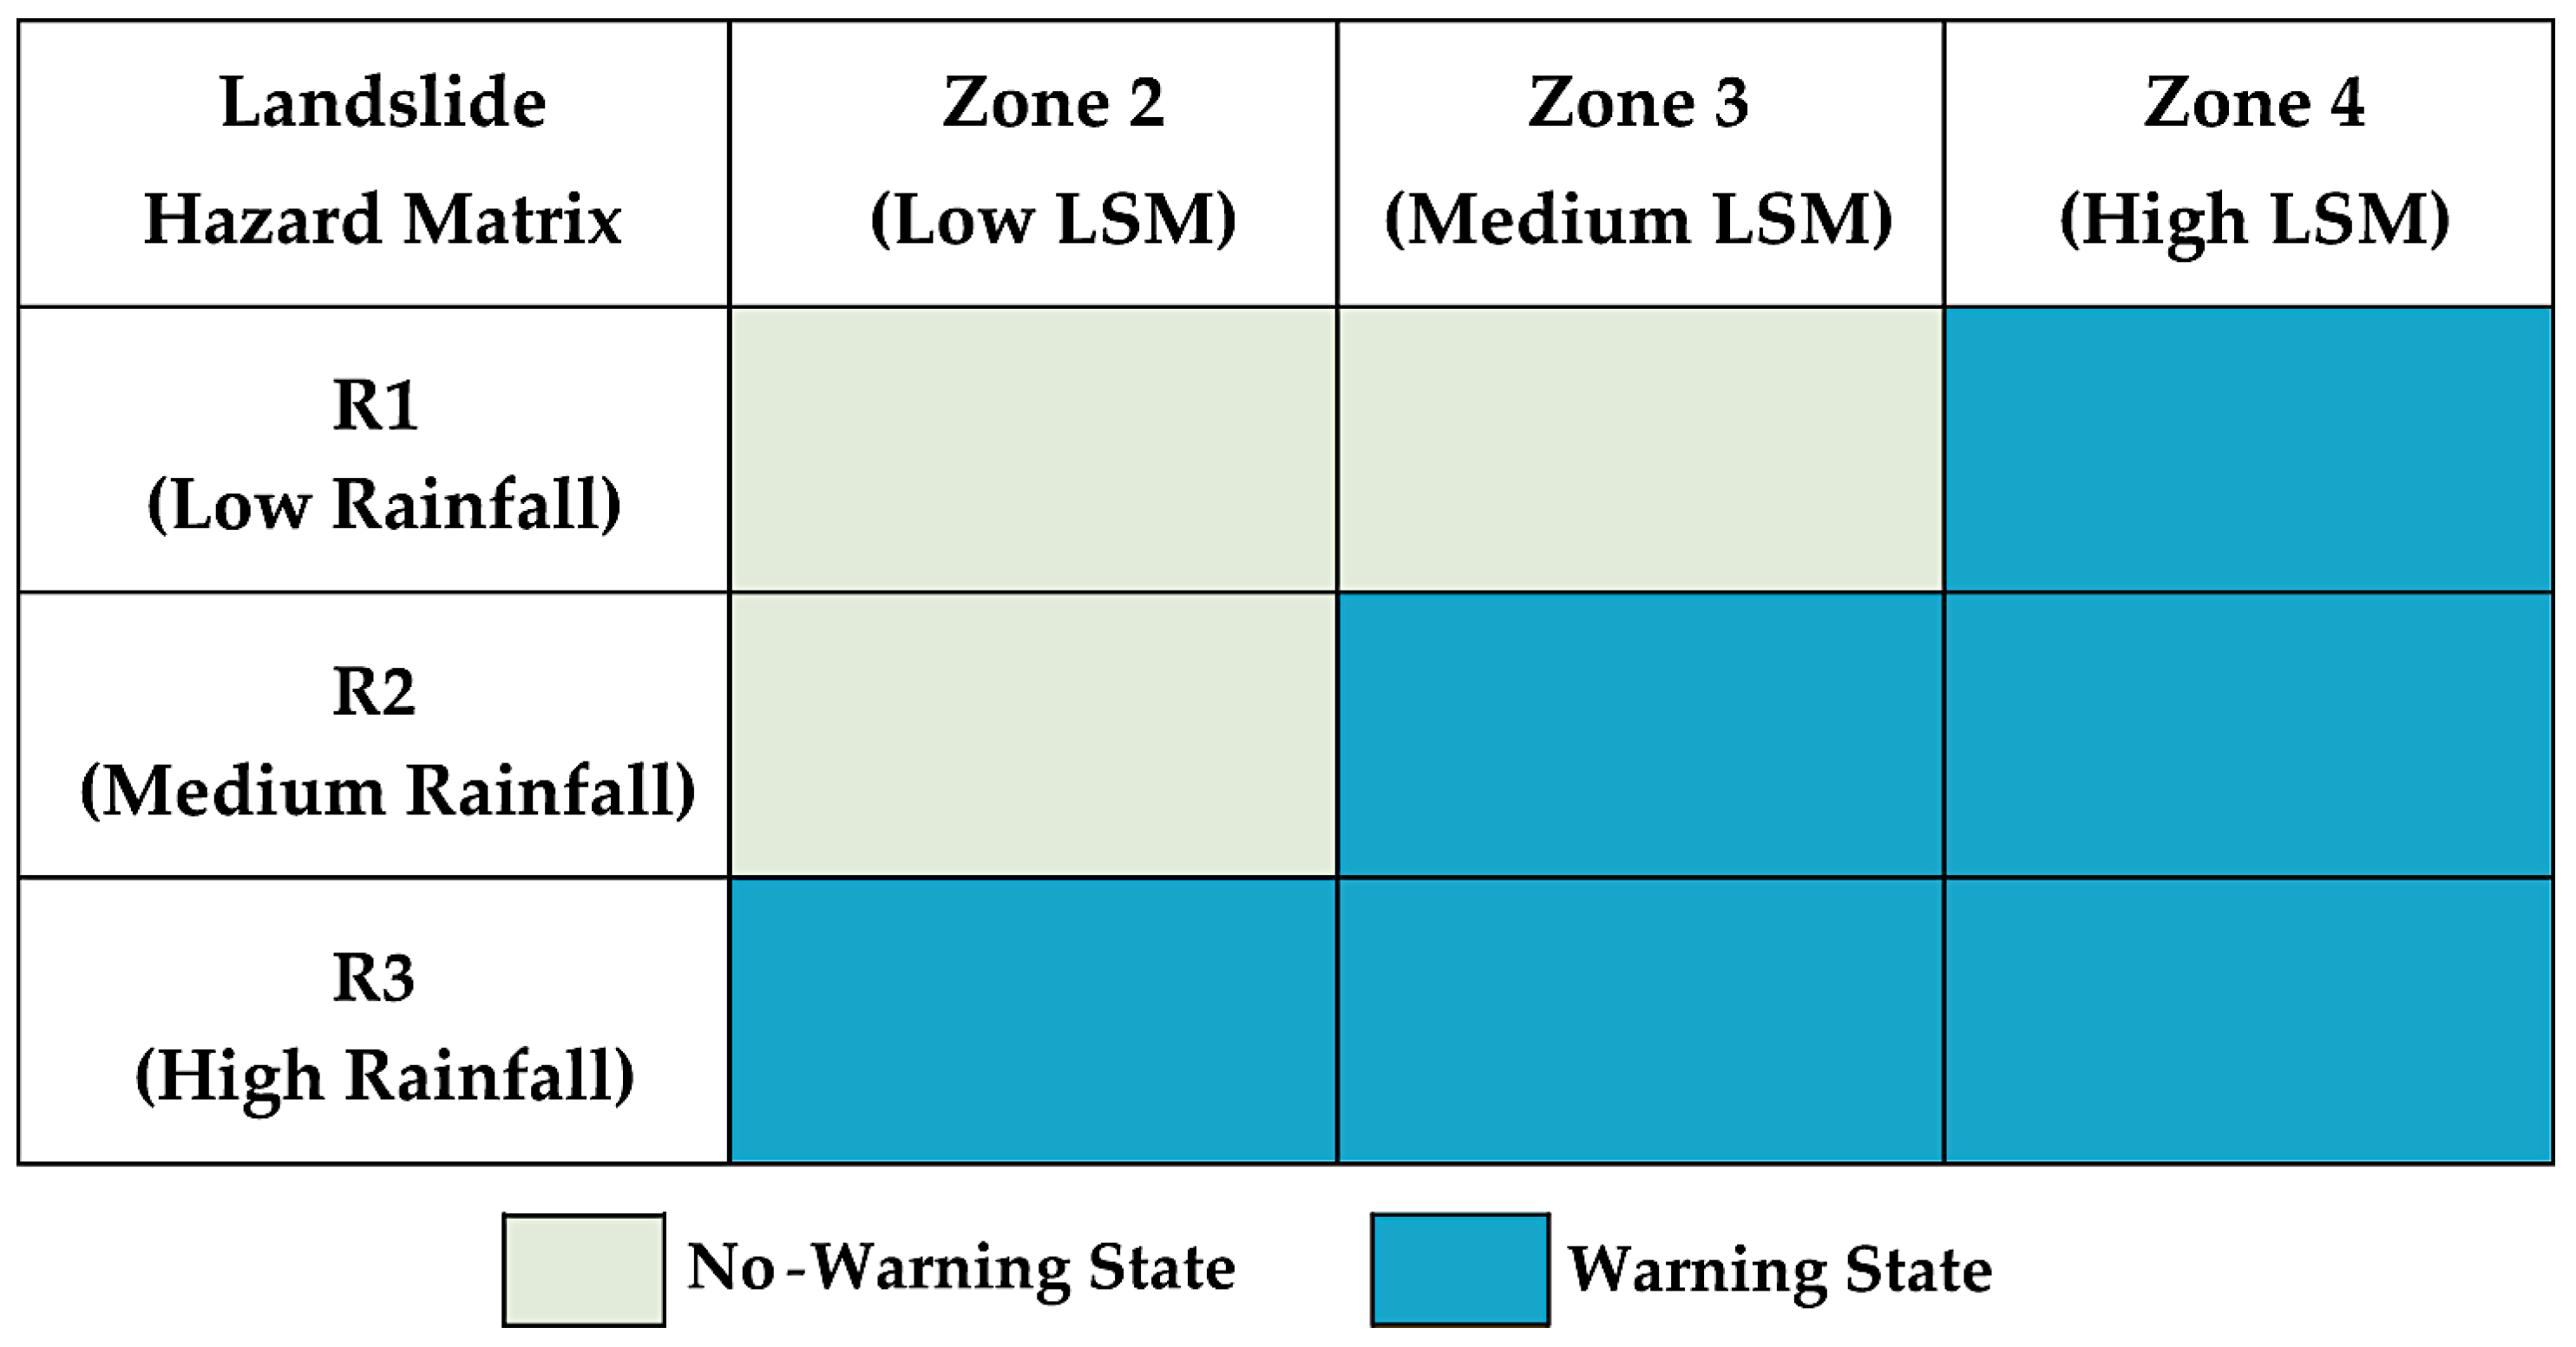
| Rainfall Amount (mm) [Consecutive 5 Days Cumulative] | LSM Index Values | Zone and Scenario Delineation |
|---|---|---|
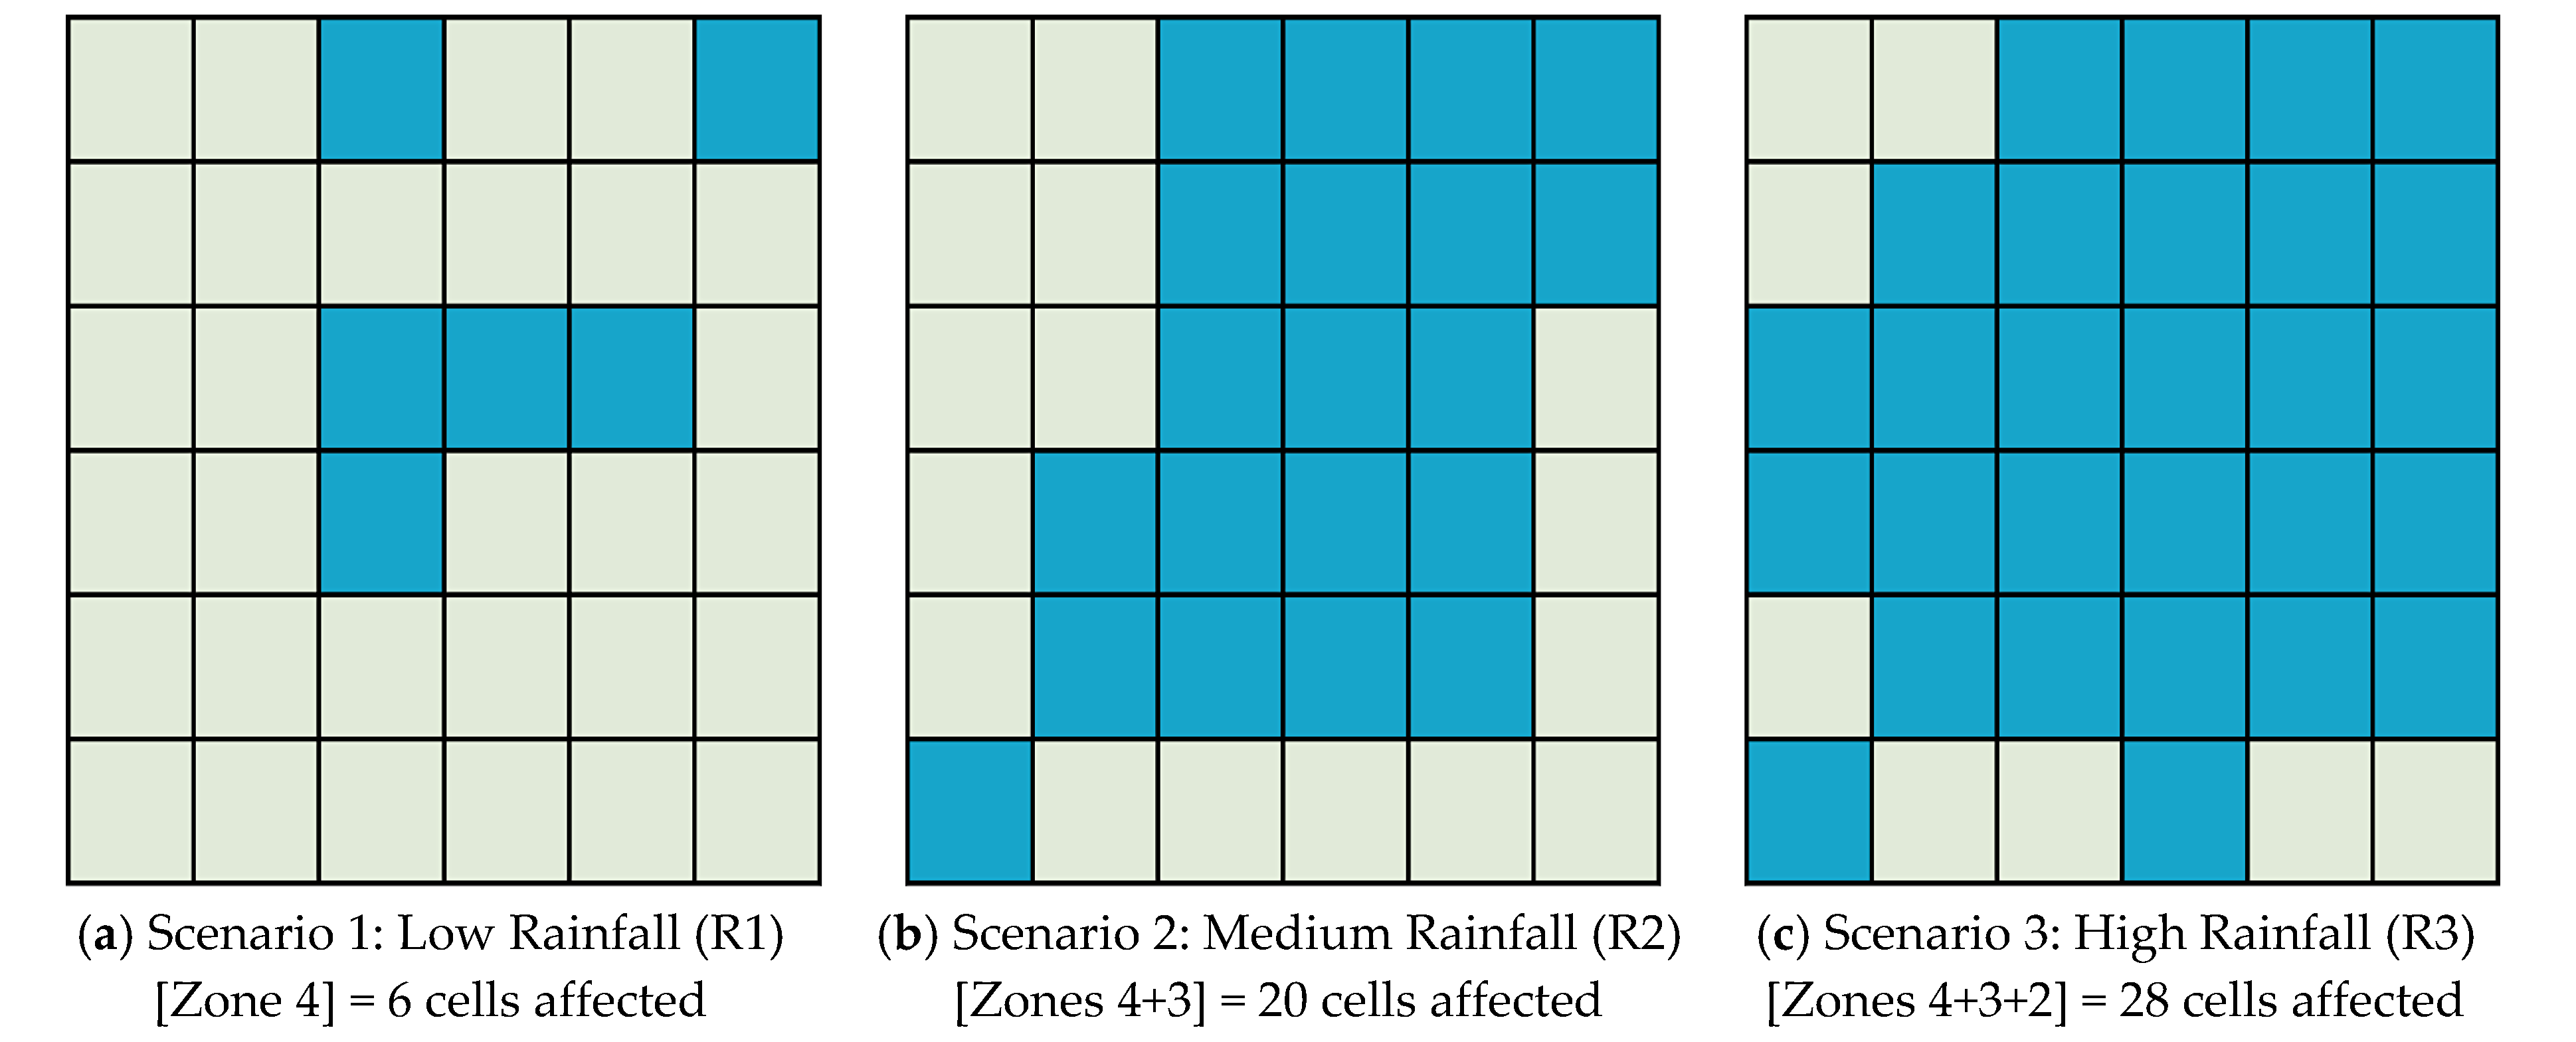
| Low Rainfall (R1) = 70–160 | 0.592–1 | Zone 4 [Scenario 1] |
| Medium Rainfall (R2) = 161–250 | 0.263–1 | Zones 4+3 [Scenario 2] |
| High Rainfall (R3) > 250 | 0.071–1 | Zones 4+3+2 [Scenario 3] |
| Never Warning | 0–0.071 | Zone 1 |
© 2018 by the authors. Licensee MDPI, Basel, Switzerland. This article is an open access article distributed under the terms and conditions of the Creative Commons Attribution (CC BY) license (http://creativecommons.org/licenses/by/4.0/).
Share and Cite
Ahmed, B.; Rahman, M.S.; Islam, R.; Sammonds, P.; Zhou, C.; Uddin, K.; Al-Hussaini, T.M. Developing a Dynamic Web-GIS Based Landslide Early Warning System for the Chittagong Metropolitan Area, Bangladesh. ISPRS Int. J. Geo-Inf. 2018, 7, 485. https://0-doi-org.brum.beds.ac.uk/10.3390/ijgi7120485
Ahmed B, Rahman MS, Islam R, Sammonds P, Zhou C, Uddin K, Al-Hussaini TM. Developing a Dynamic Web-GIS Based Landslide Early Warning System for the Chittagong Metropolitan Area, Bangladesh. ISPRS International Journal of Geo-Information. 2018; 7(12):485. https://0-doi-org.brum.beds.ac.uk/10.3390/ijgi7120485
Chicago/Turabian StyleAhmed, Bayes, Md. Shahinoor Rahman, Rahenul Islam, Peter Sammonds, Chao Zhou, Kabir Uddin, and Tahmeed M. Al-Hussaini. 2018. "Developing a Dynamic Web-GIS Based Landslide Early Warning System for the Chittagong Metropolitan Area, Bangladesh" ISPRS International Journal of Geo-Information 7, no. 12: 485. https://0-doi-org.brum.beds.ac.uk/10.3390/ijgi7120485