Using the TensorFlow Deep Neural Network to Classify Mainland China Visitor Behaviours in Hong Kong from Check-in Data


Abstract
:1. Introduction
2. Literature Review
2.1. User-Generated Big Data for Tourist Research
2.2. Deep Learning Methods for Human Behaviours
3. Methodology
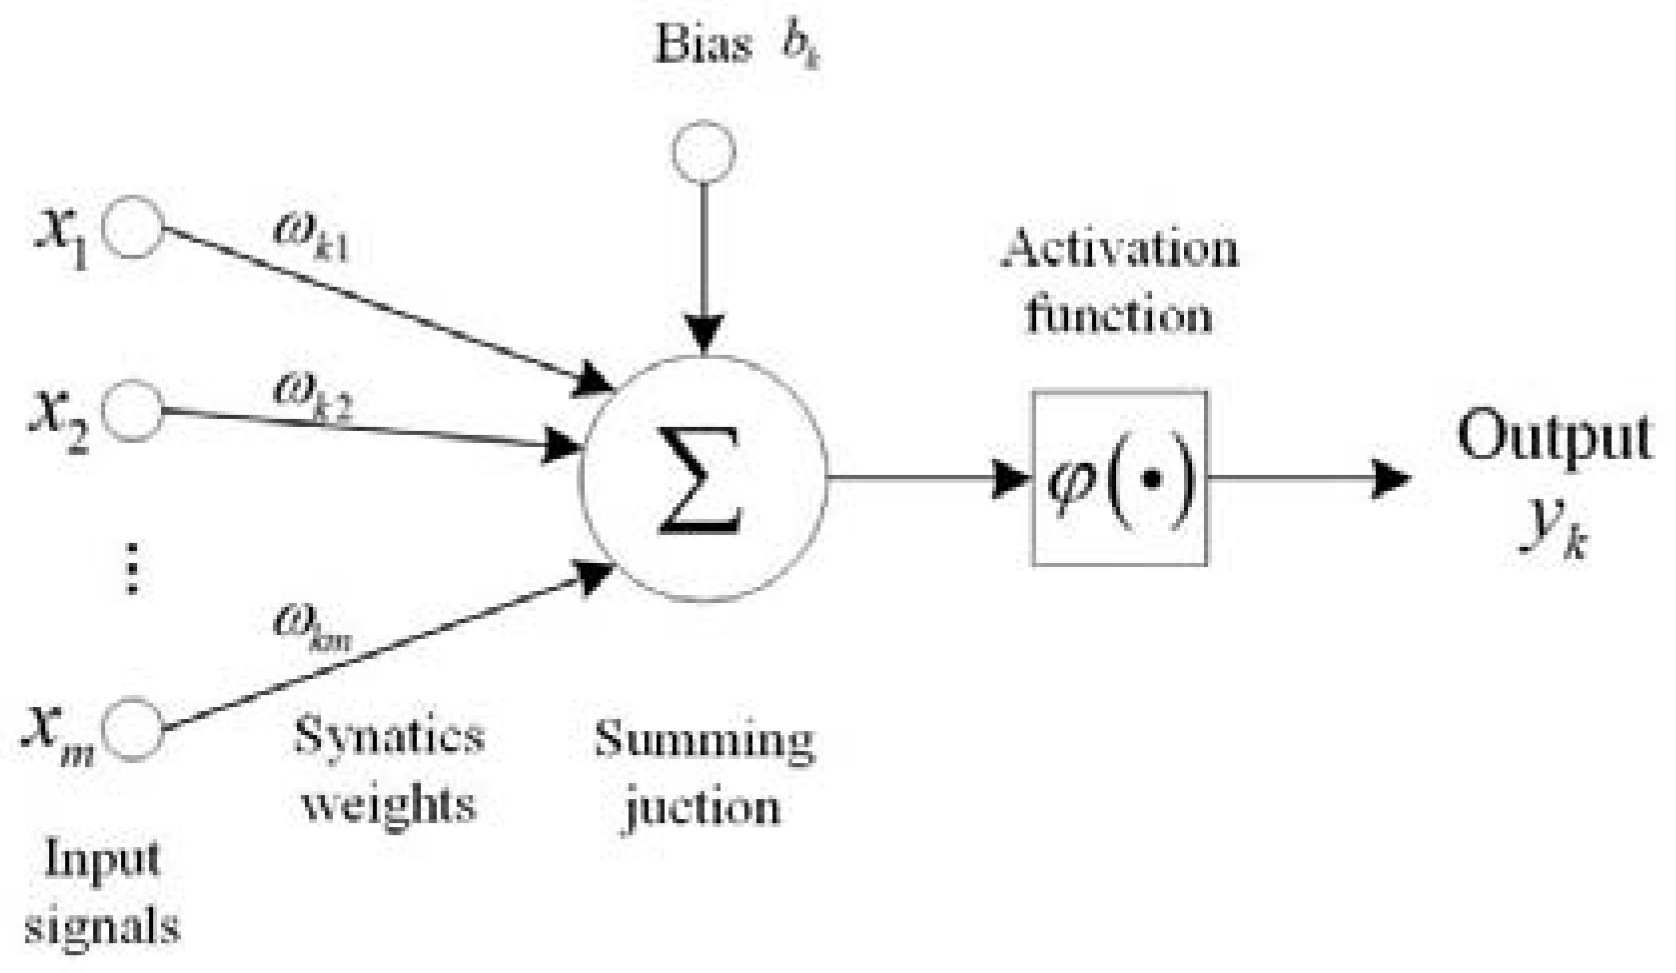
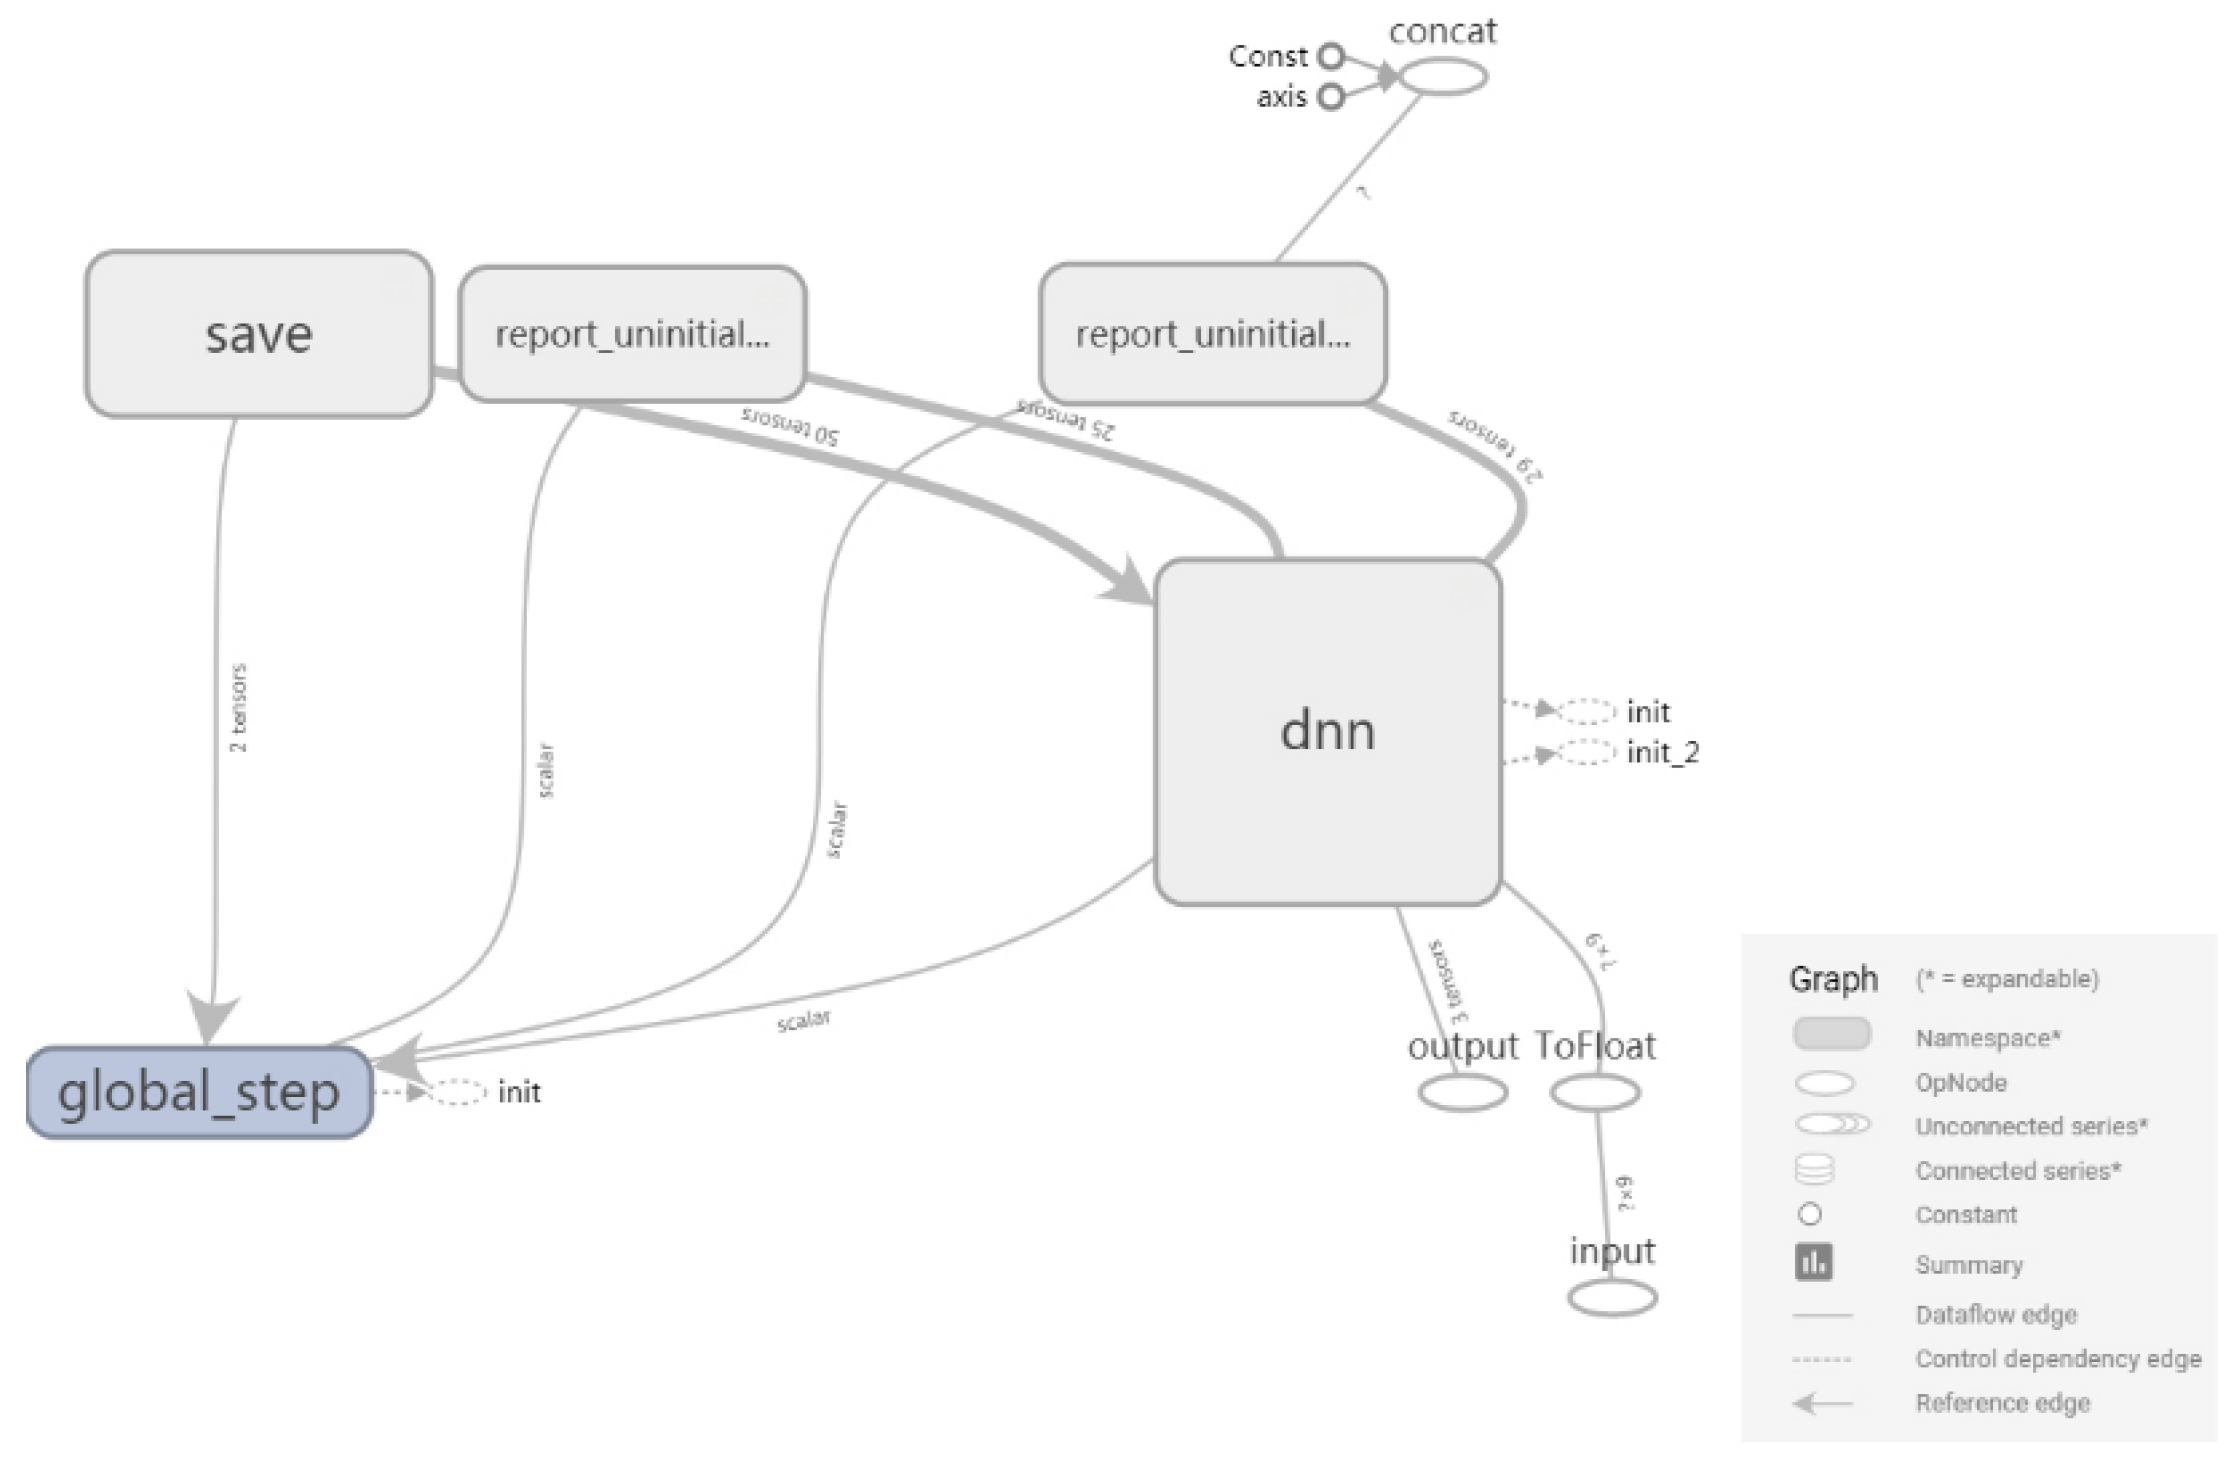
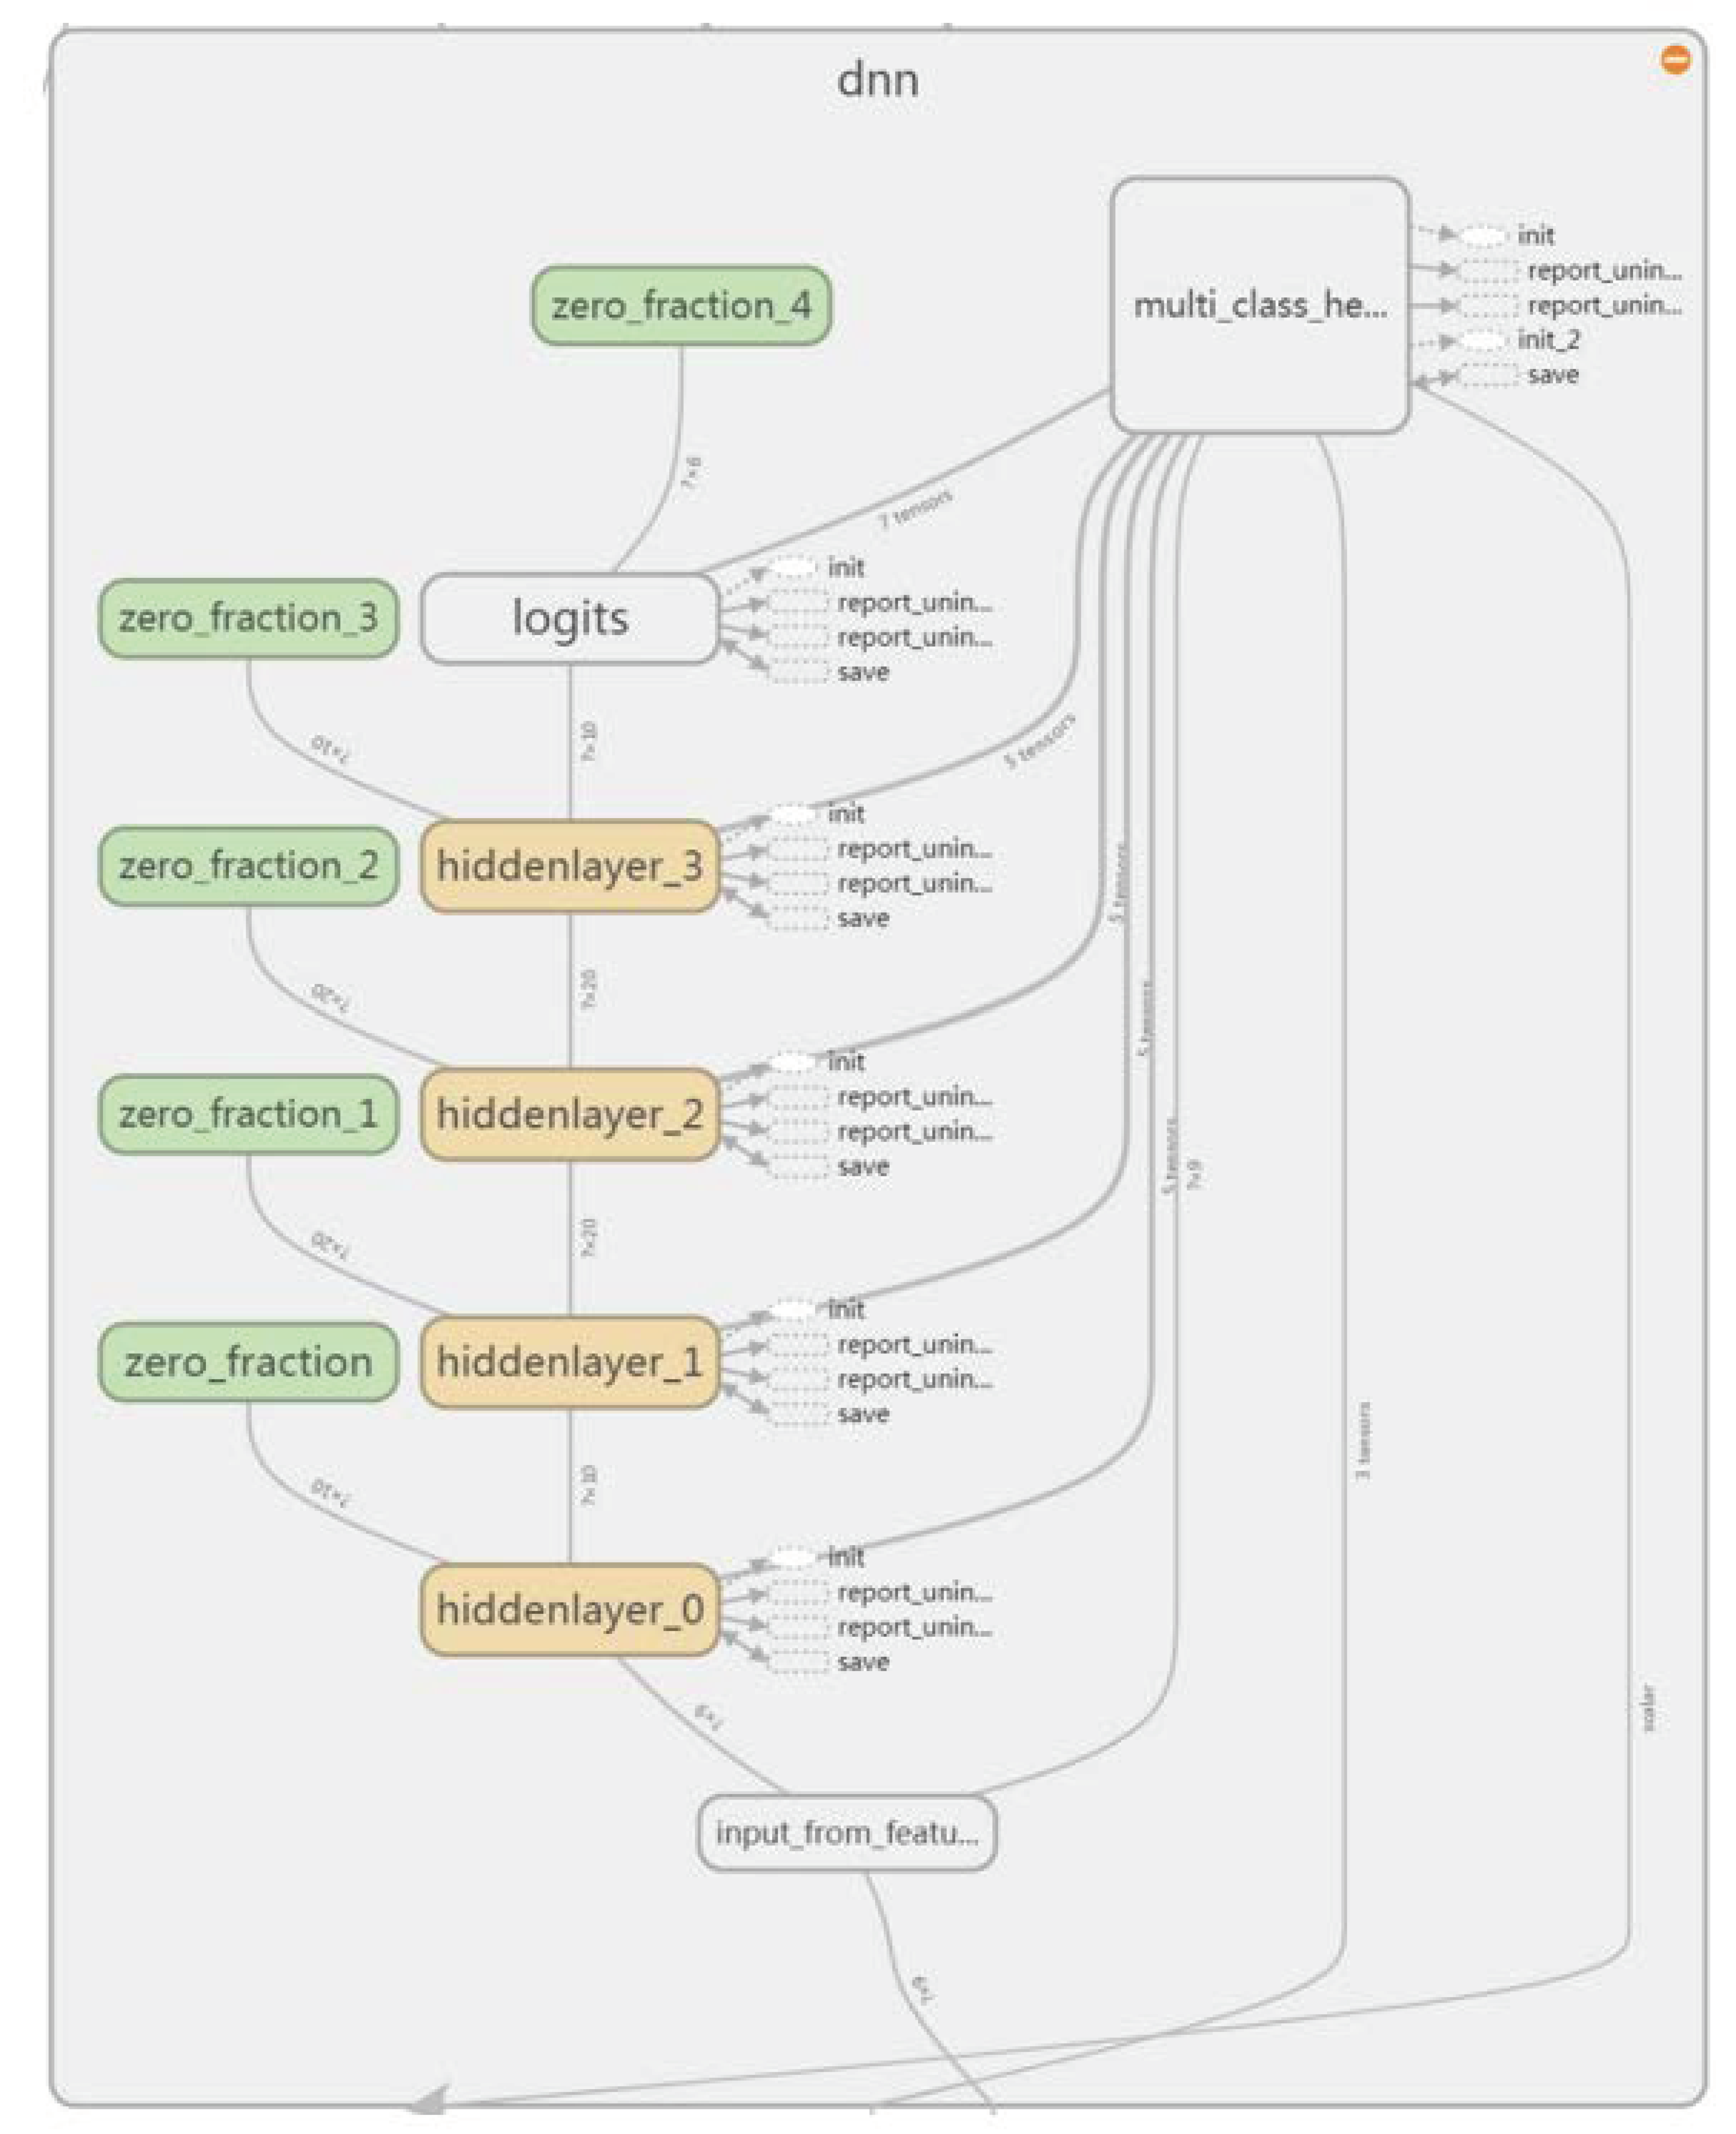
3.1. TensorFlow and Neural Networks
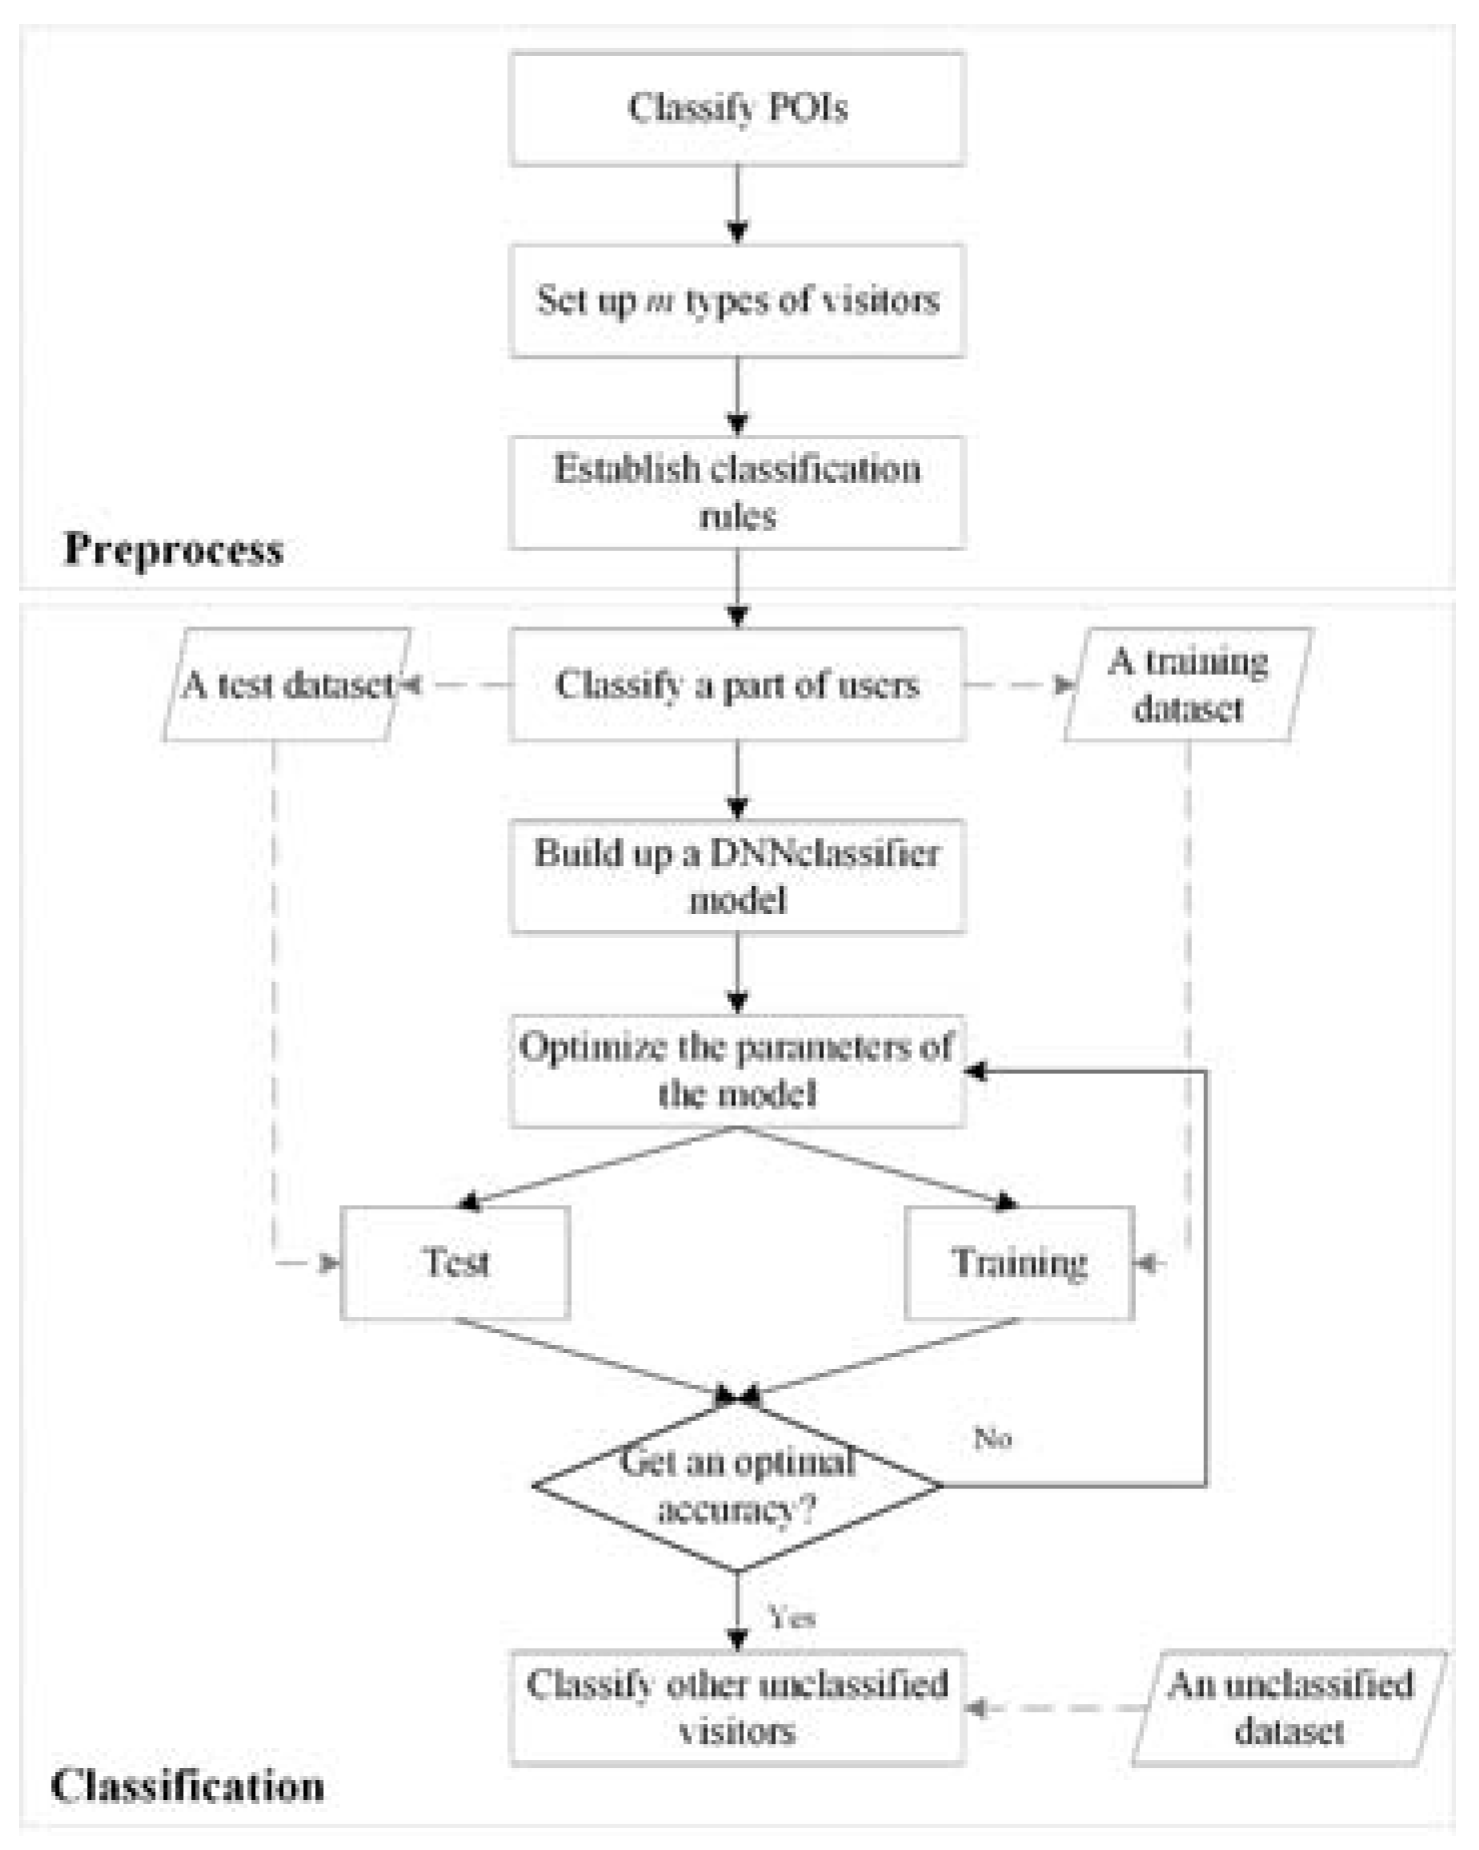
3.2. Data Processing
4. Materials
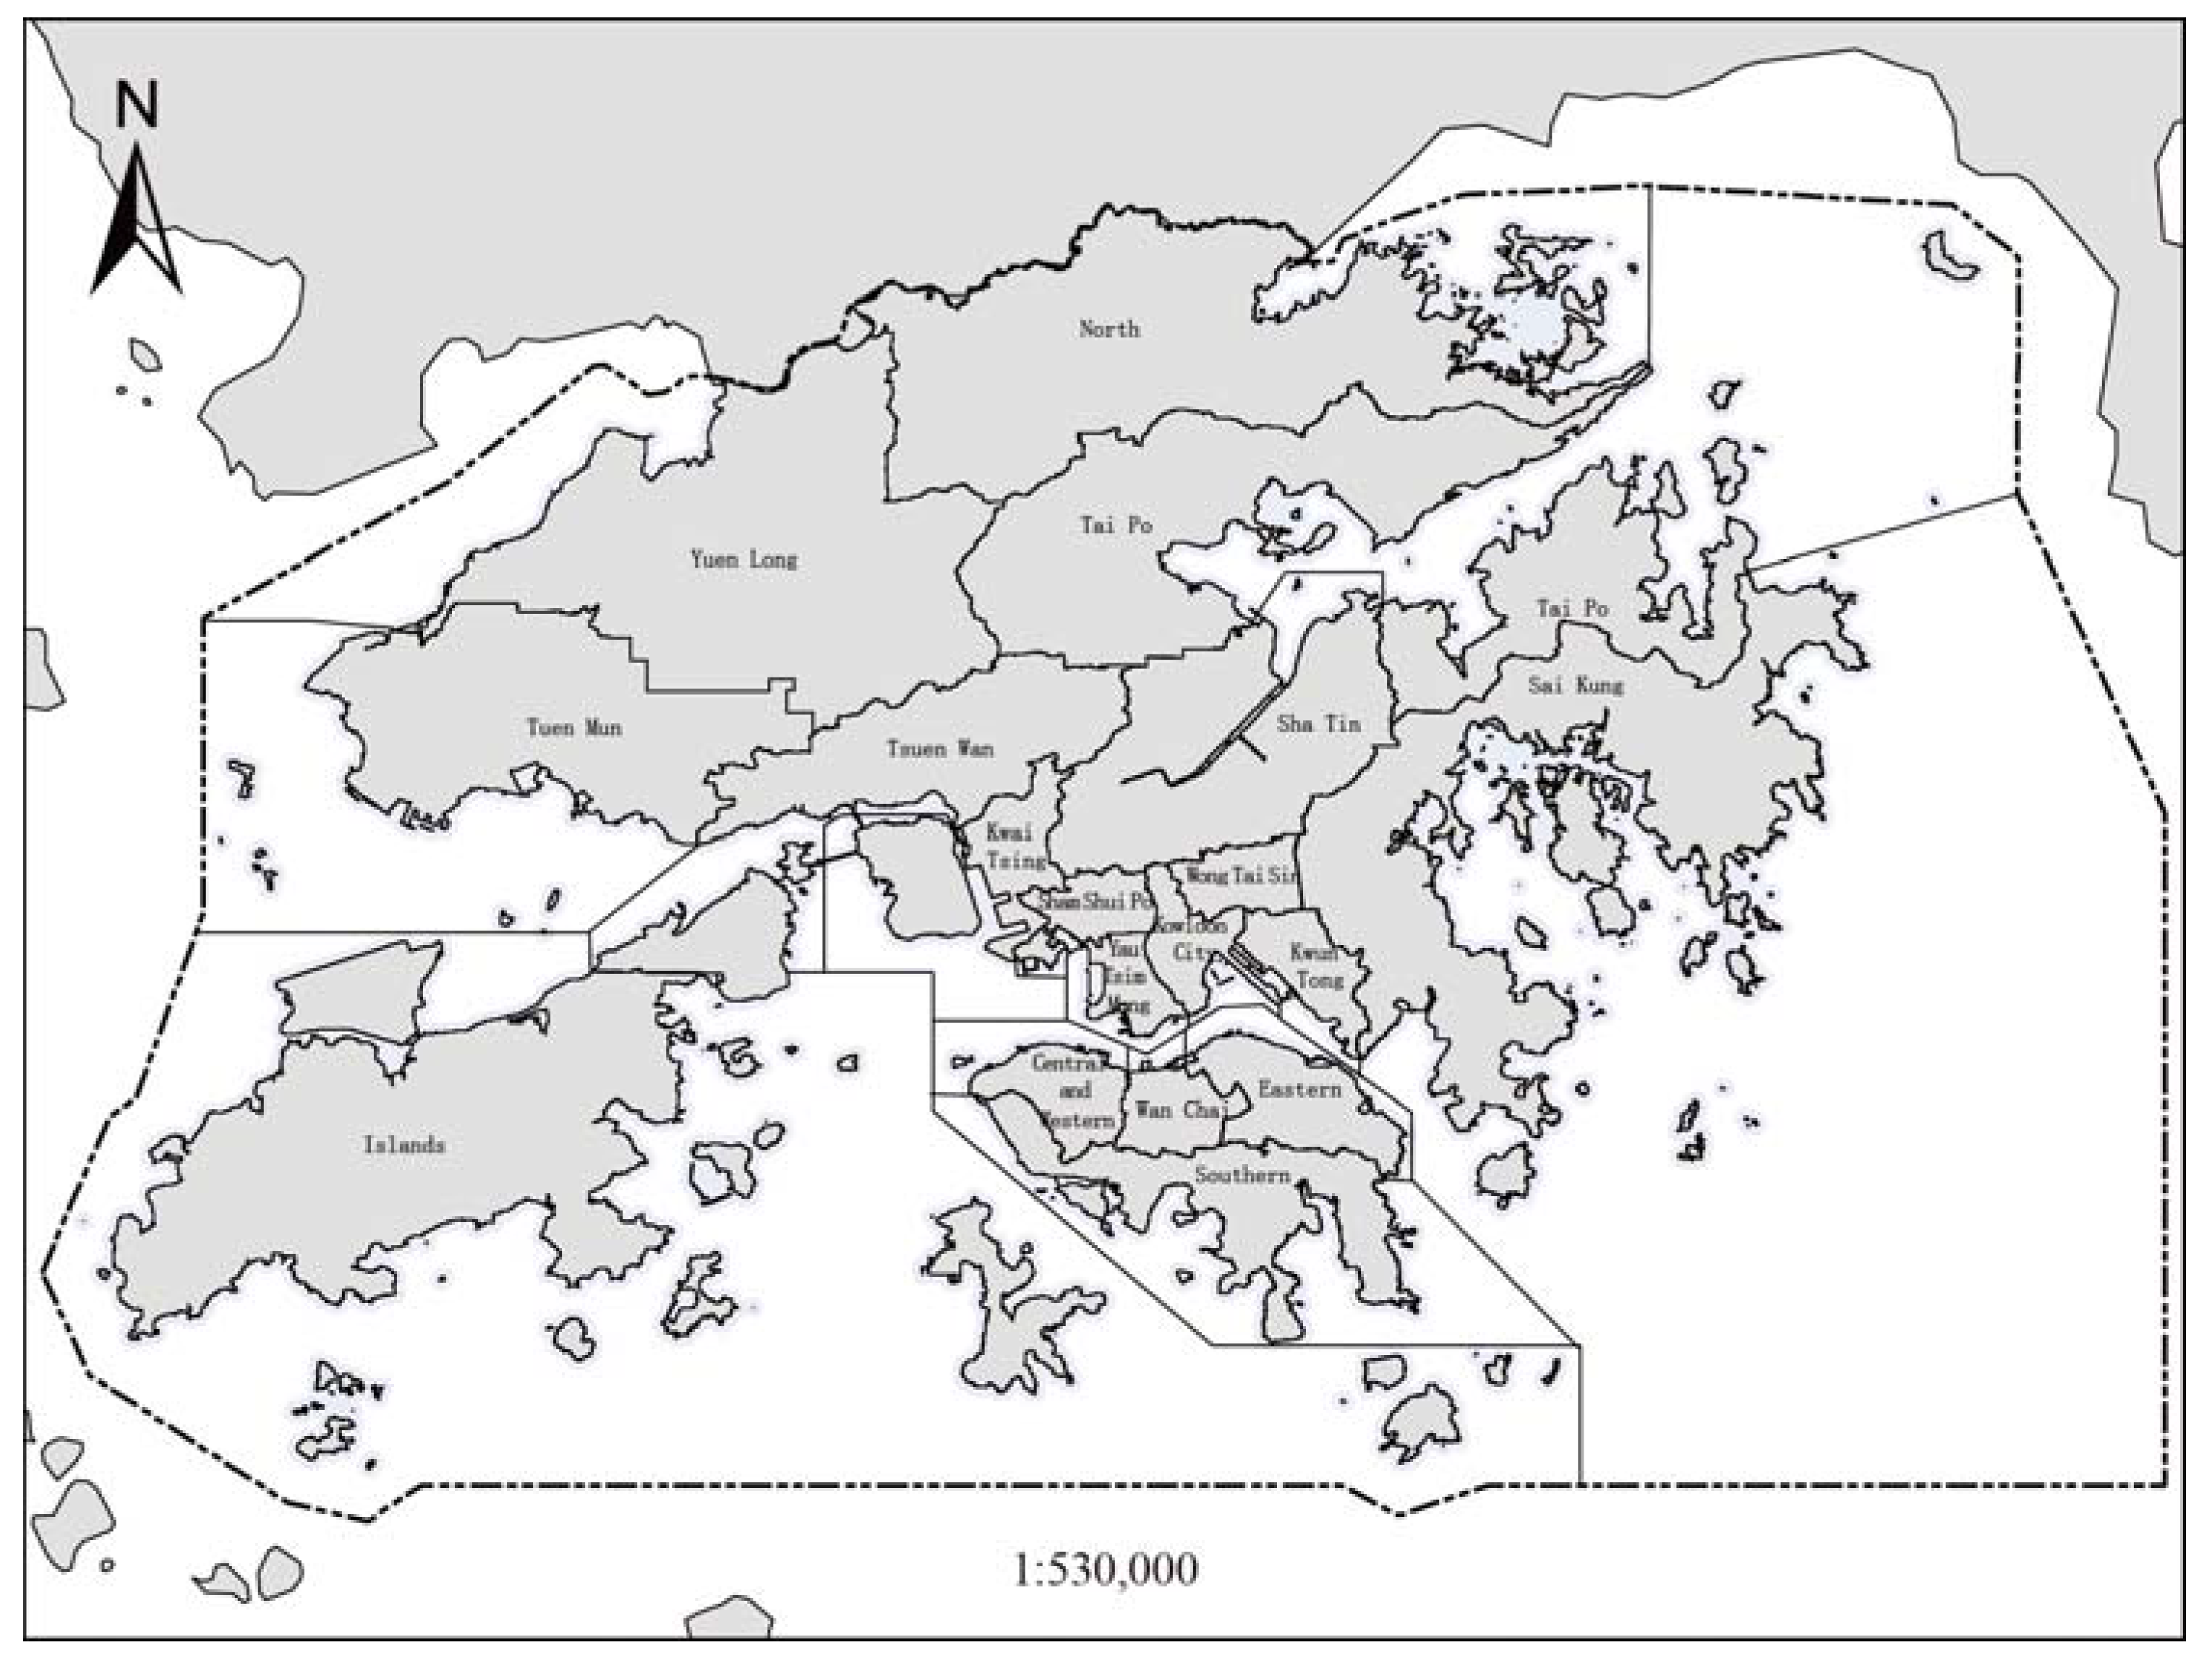
4.1. Research Case
4.2. Data Specification
- (1)
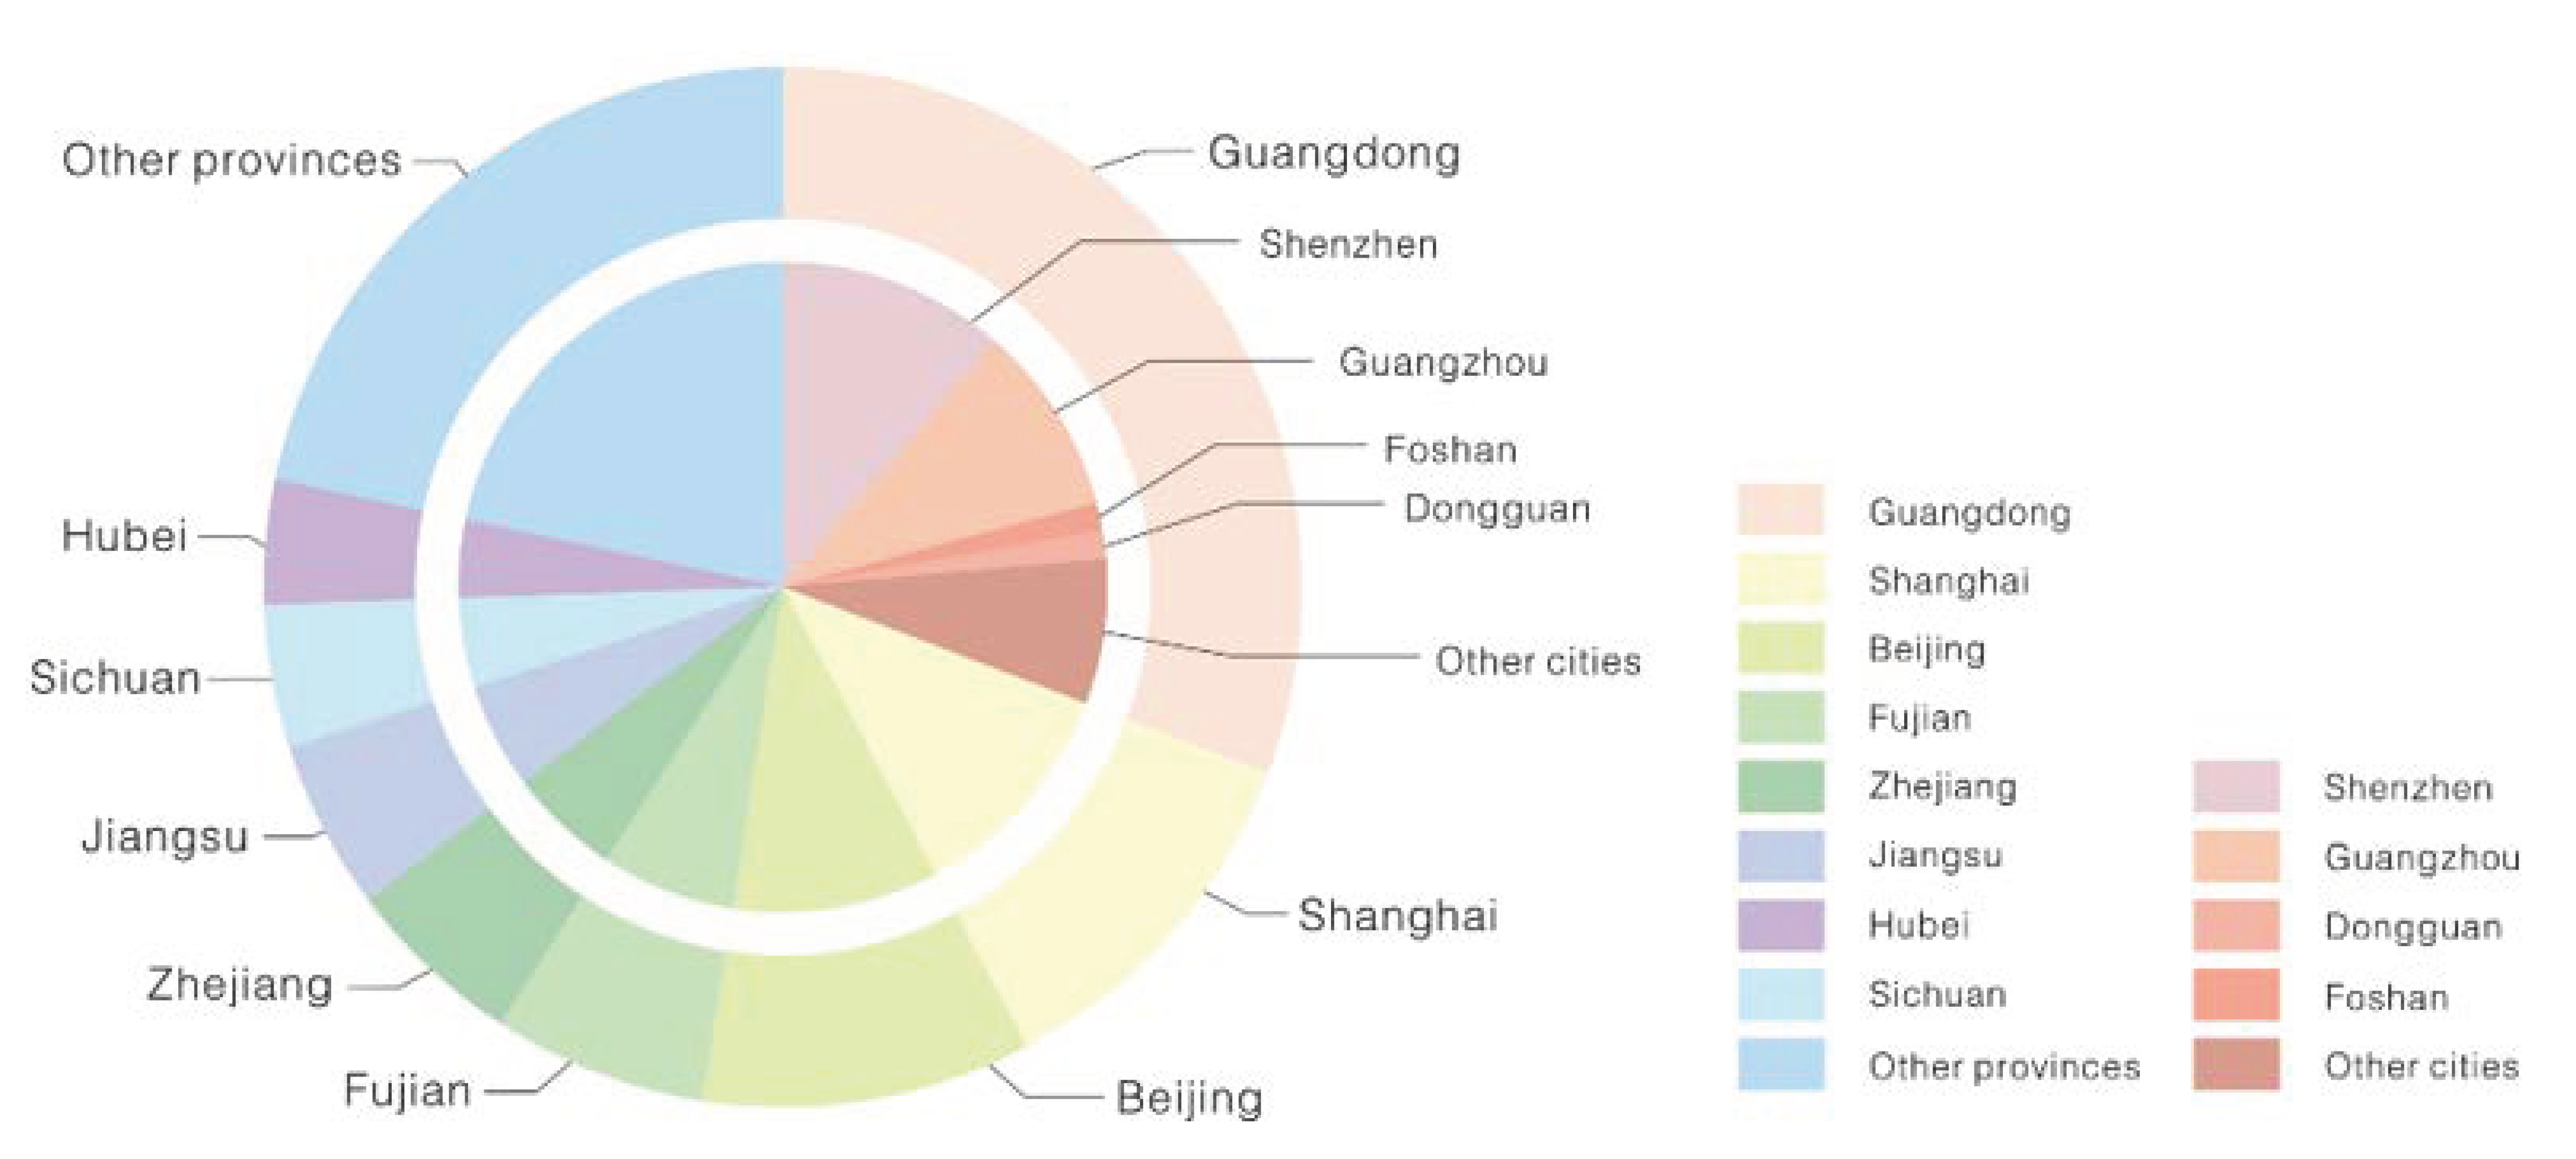
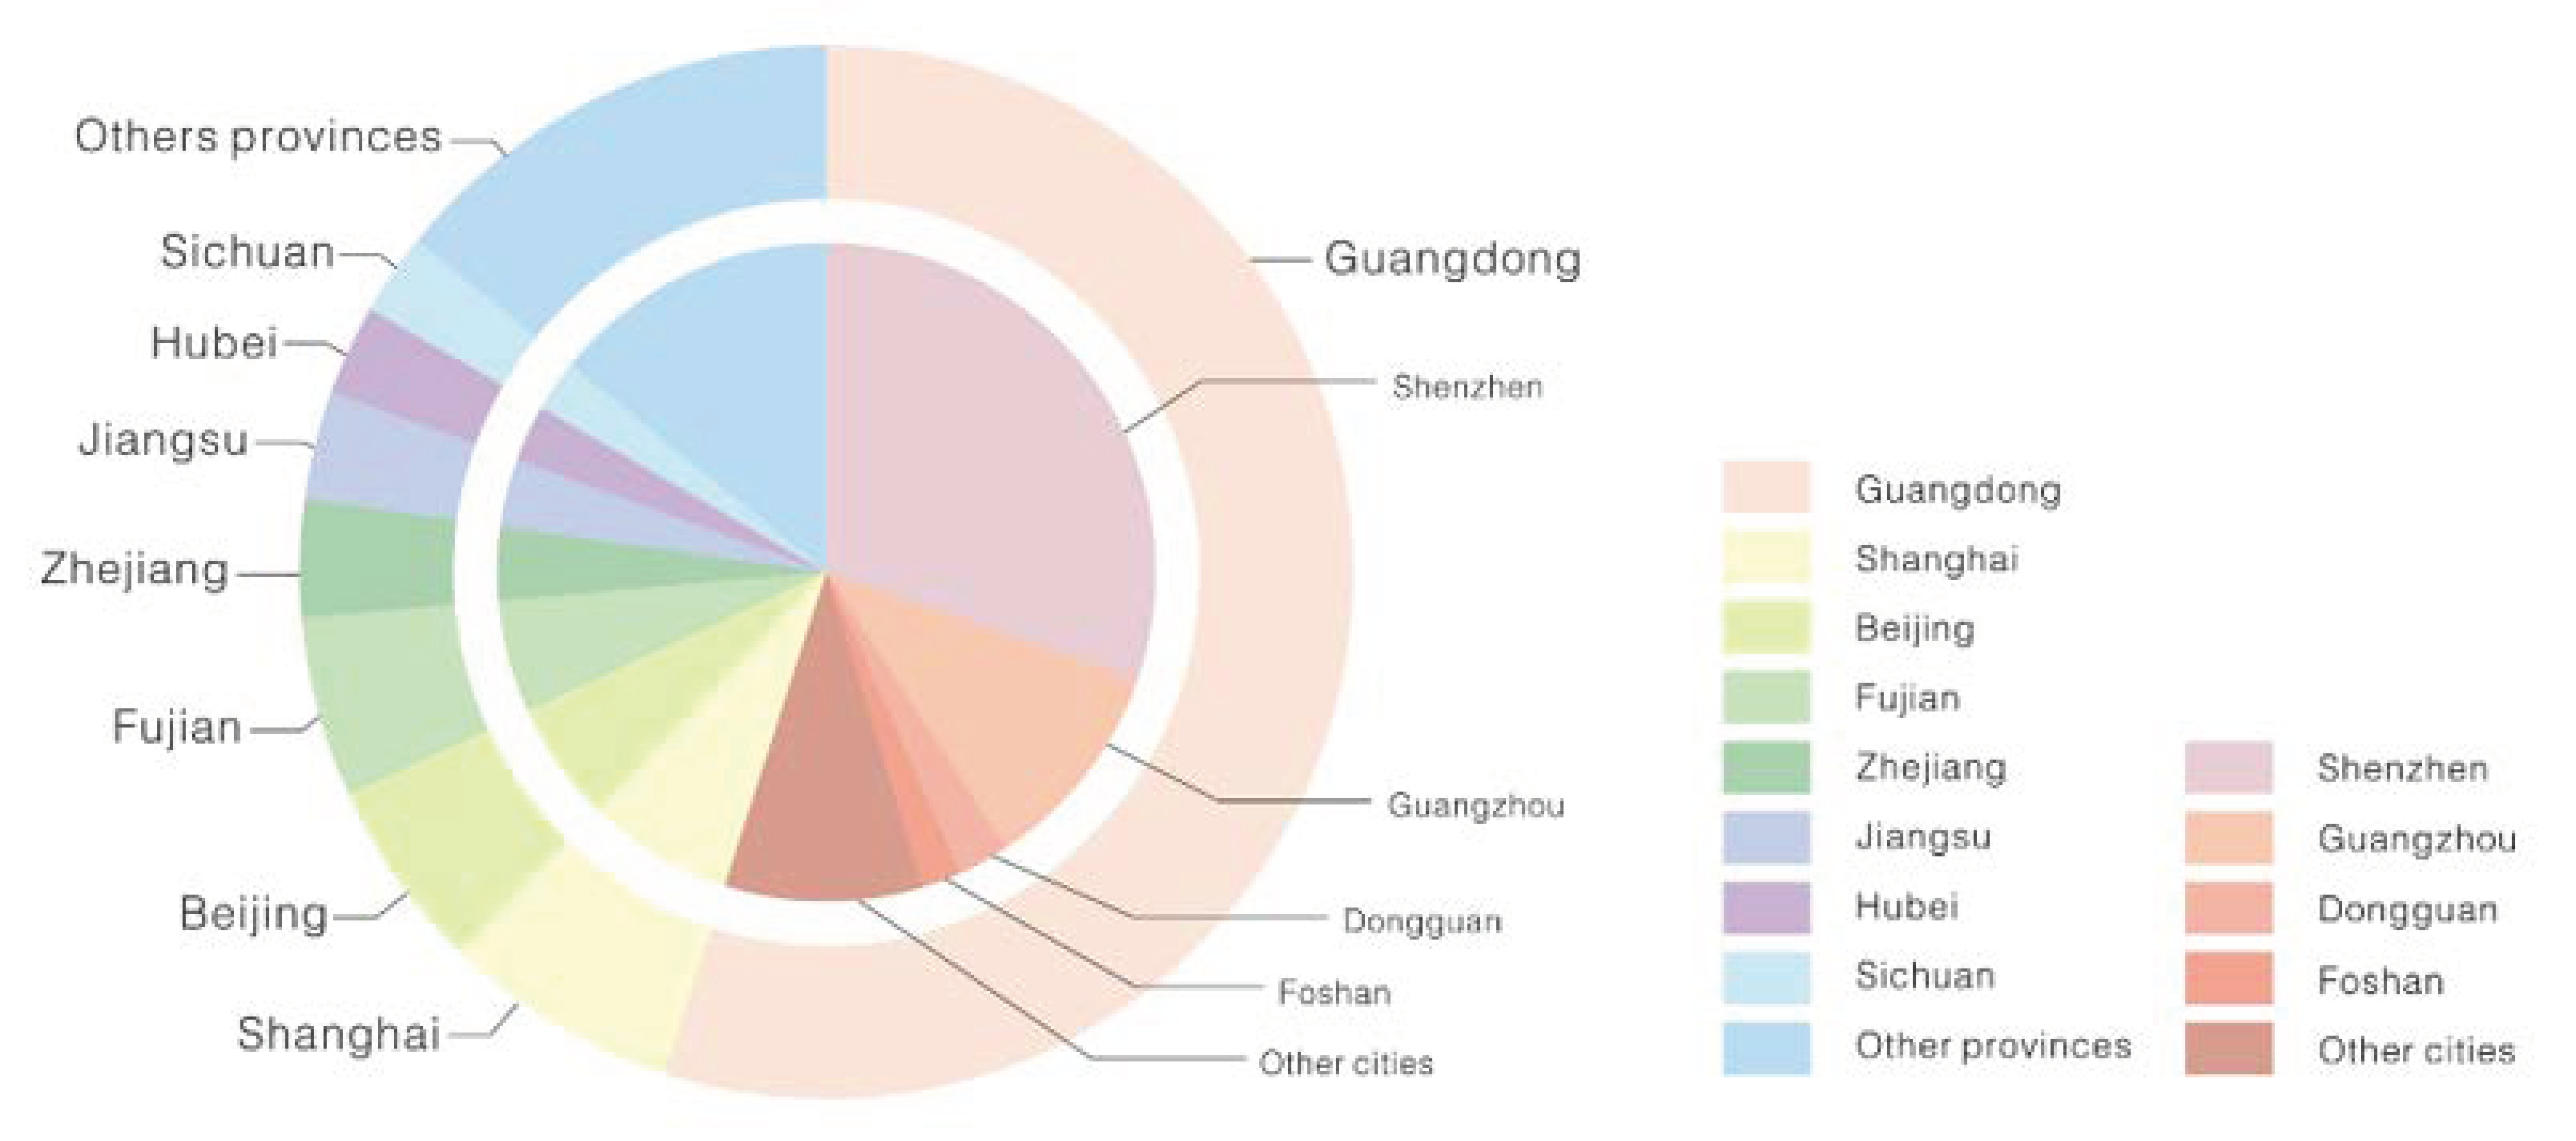
- Purchasing-oriented visitors. Because of tariff preferences and monetary exchange rates, mainland residents, particularly residents living near Hong Kong (such as residents in Guangdong Province or other neighbouring provinces), are fond of buying in Hong Kong. Some people are even professional ”daigou”, which means that they buy products in Hong Kong on behalf of mainland residents [49]. Therefore, the main purpose of visitors of this type is purchasing. Most of their check-in POIs are shopping malls, retail stores, etc.
- (2)
- Tourism-oriented visitors. Visitors of this type are typical tourists. Their check-in locations are mainly concentrated in tourist and scenic spots, as well as hotels. In addition, because Hong Kong is a famous “shopping paradise” and ”gourmet paradise”, some of these visitors’ check-in locations are word-of-mouth shopping malls and restaurants.
- (3)
- Special event-oriented visitors. This type of visitor comes to Hong Kong for particular events, such as concerts, large international conferences and exhibitions. The majority of these visitors’ check-in locations are conference and exhibition centres and coliseums. Additionally, those who participate in the same event have similar check-in records over a certain time at a certain place.
- (4)
- Education-oriented visitors. These visitors can be subdivided into two types. The first type is those who study and live in Hong Kong and can be regarded as temporary residents. Most of these visitors are undergraduates or postgraduates, and some are middle school students. The other type is those who are born and study in Hong Kong but live in Mainland China [50]. These students are called “Shenzhen-Hong Kong cross-boundary students”. These students are common because many mainland pregnant women give birth to children in Hong Kong, and their children, who do not have Hukou in mainland, cannot study in mainland public schools.
- (5)
- En-route visitors. Visitors of this type merely pass through Hong Kong while travelling to other destinations. Notably, many international flights stop at Hong Kong International Airport. Additionally, there are ports in Hong Kong where ships can transfer passengers to other regions or to ships from other regions.
- (6)
- Others. Other visitors are those who cannot be classified into the aforementioned categories.
5. Classification and Analysis Results
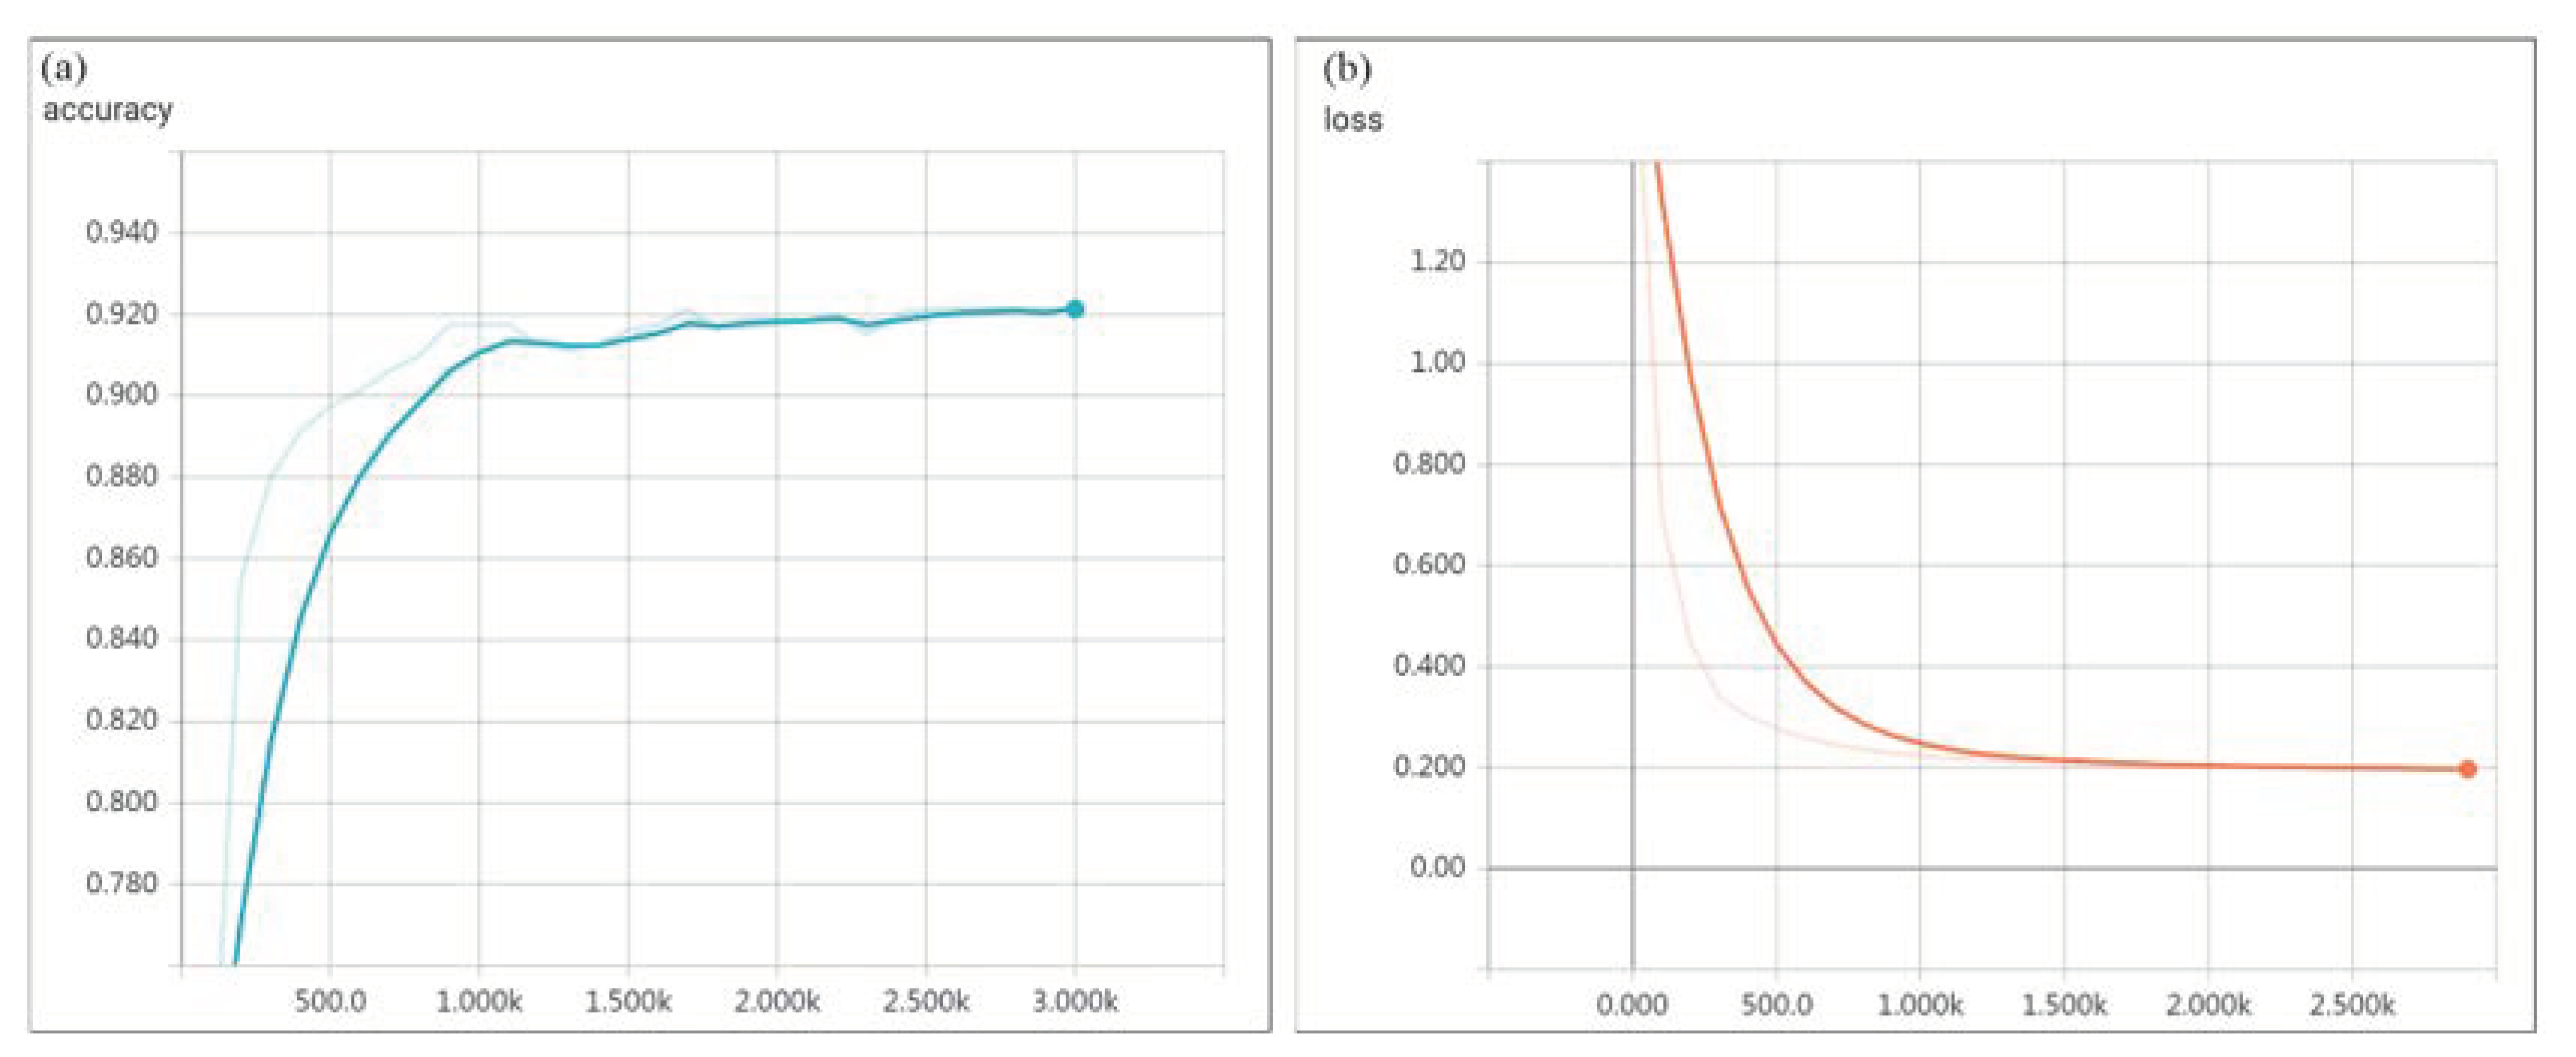
5.1. Classification Results of TensorFlow
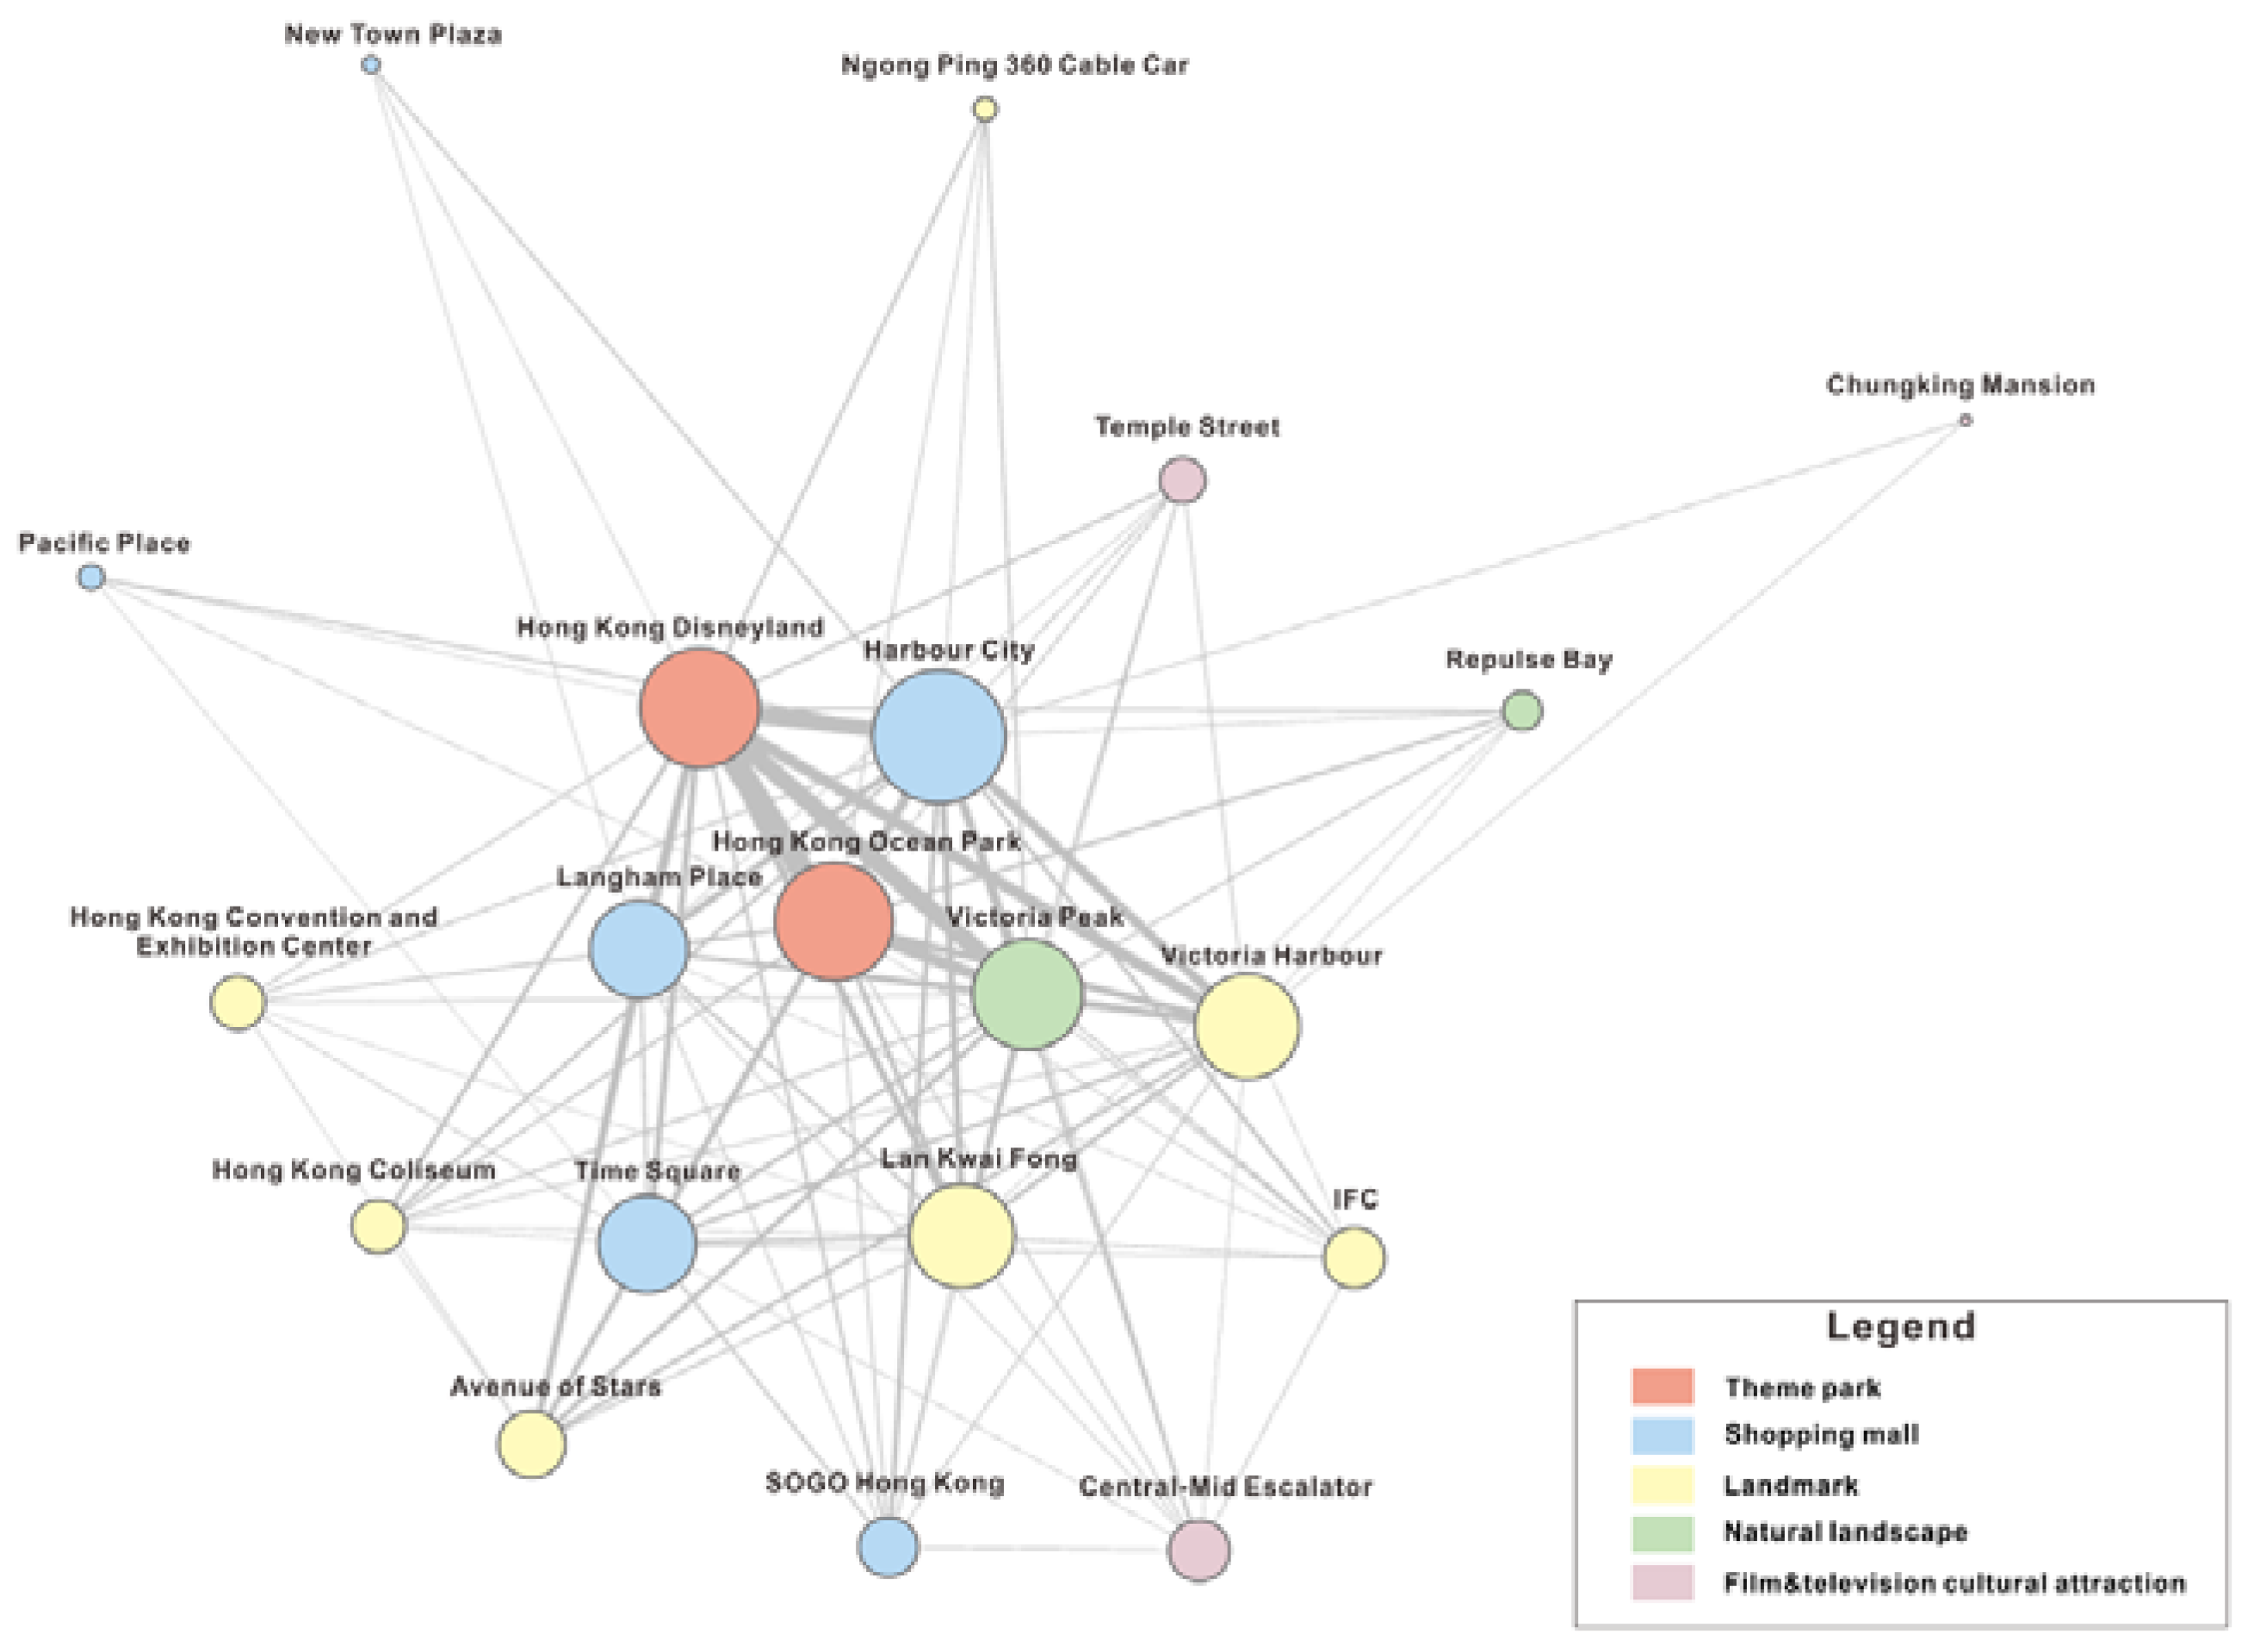
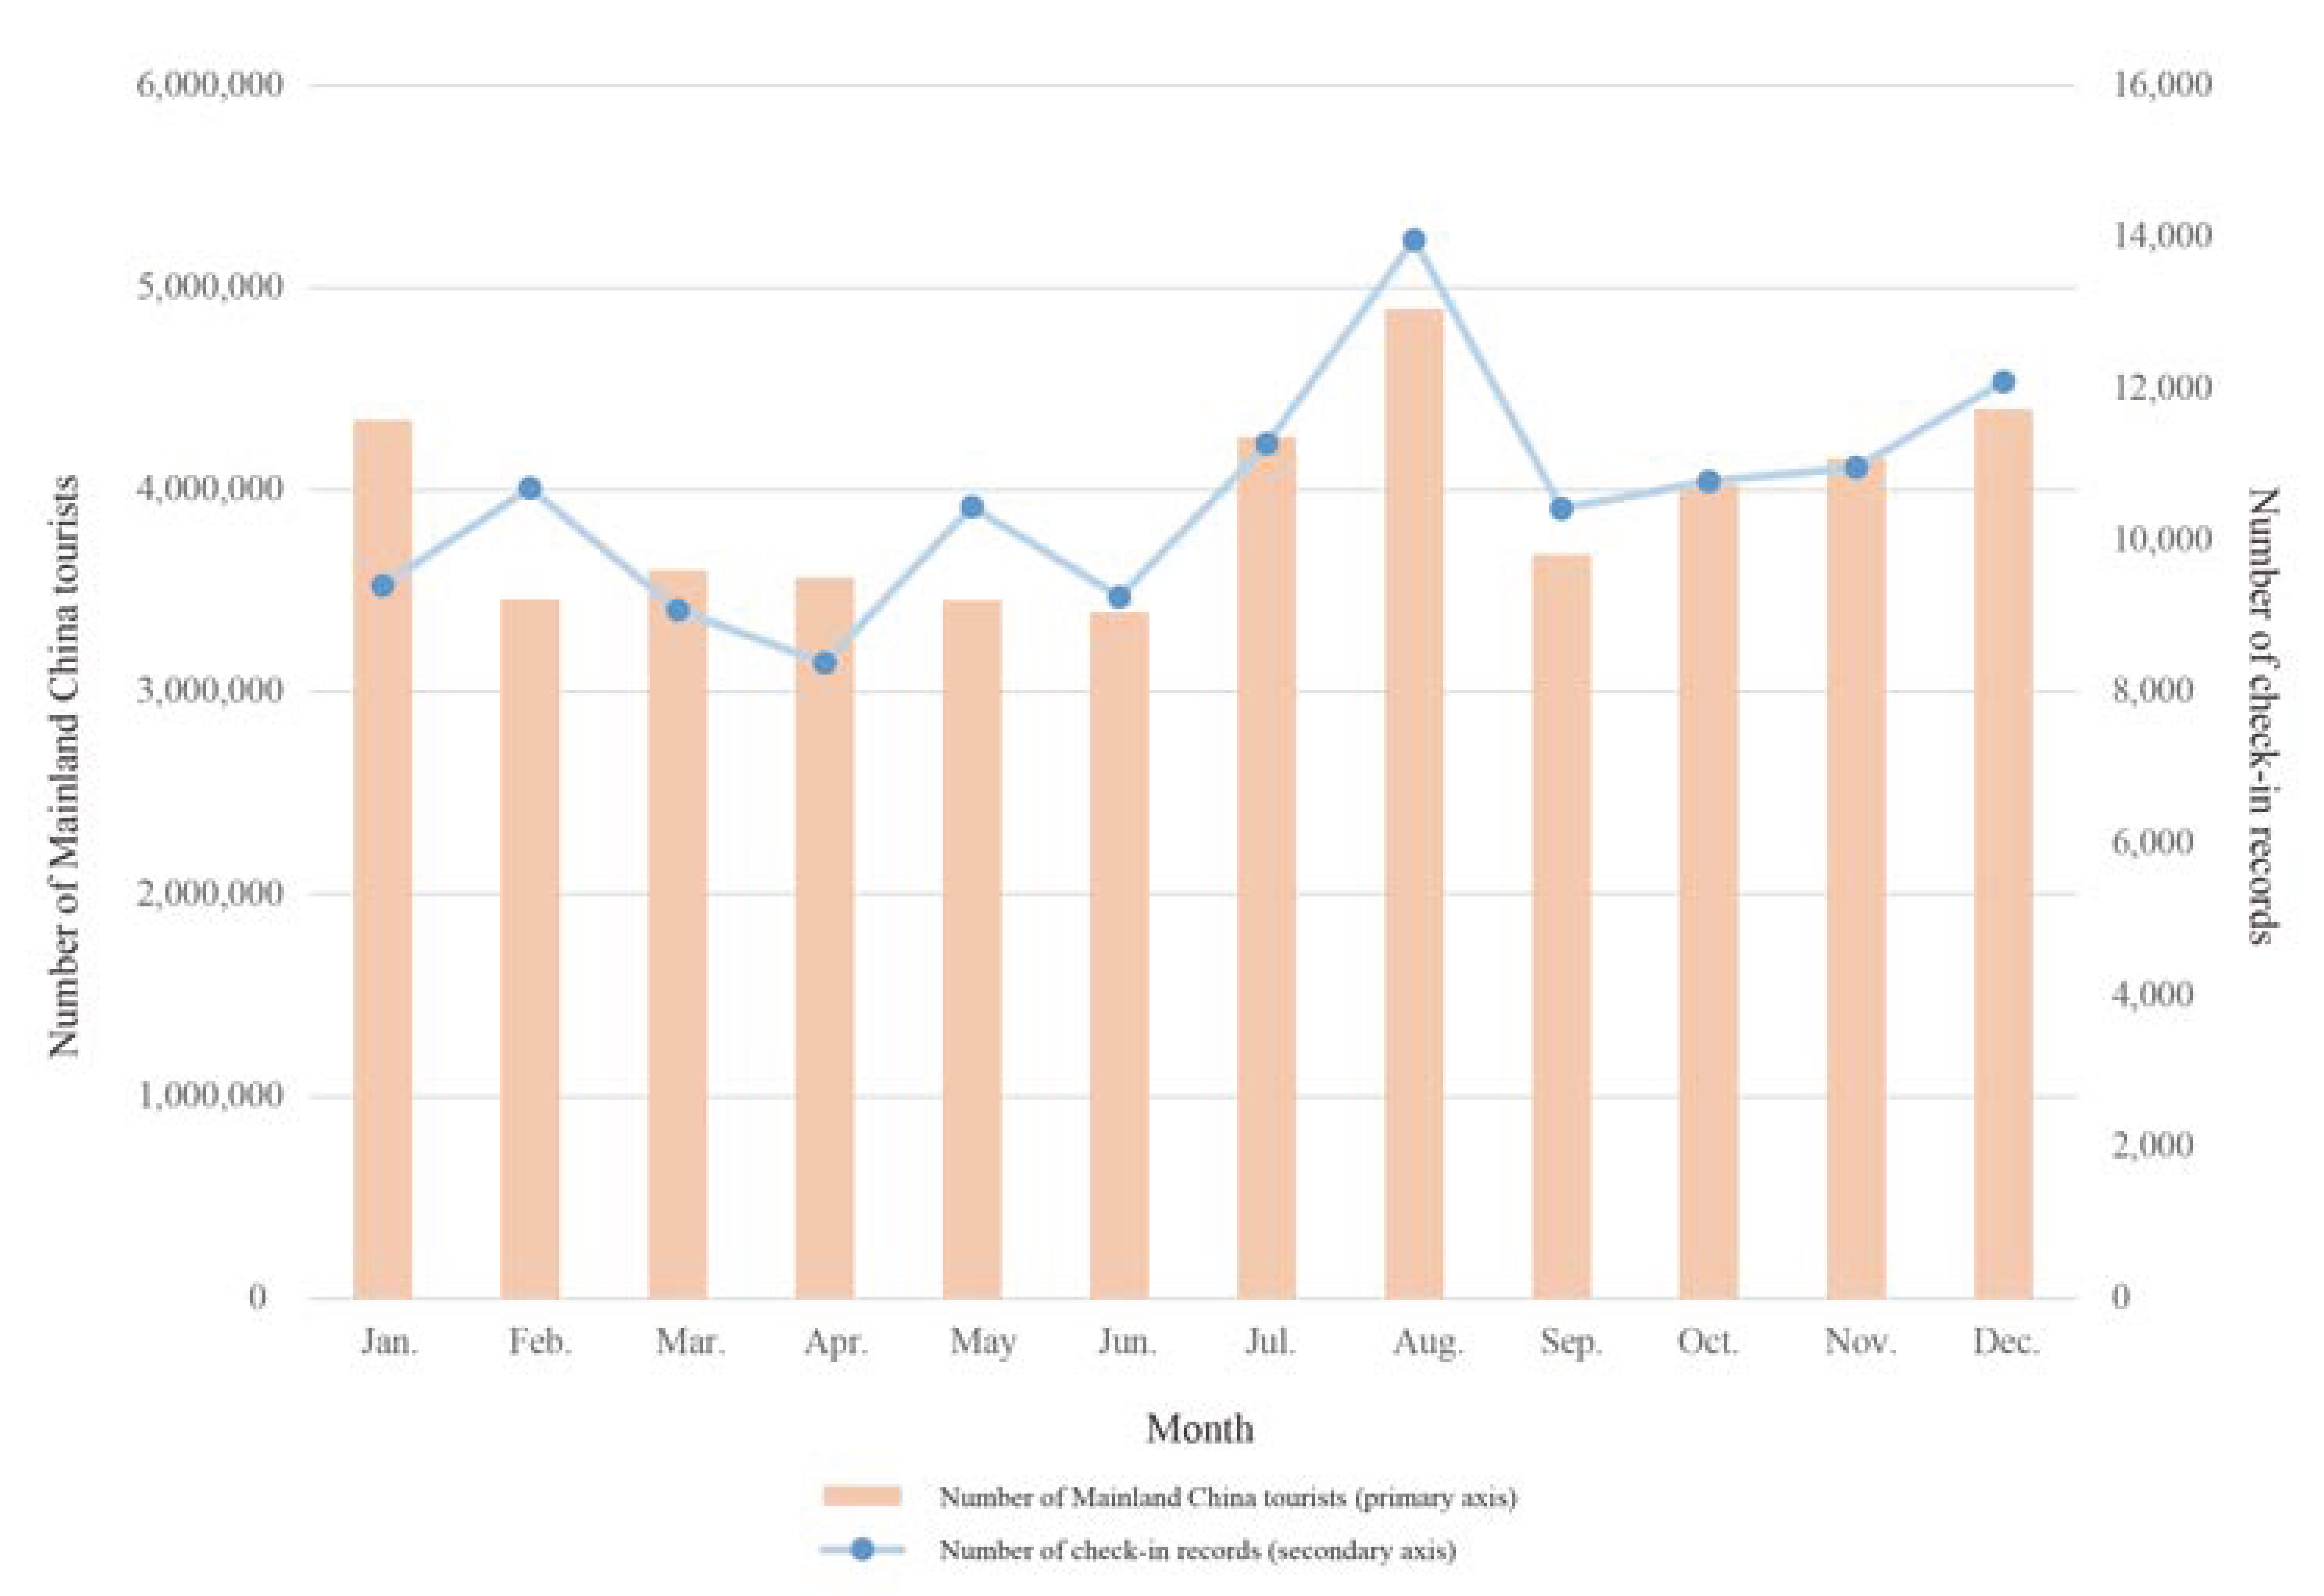
5.2. Proportions and Characteristics of Visitor Behaviours
5.2.1. Tourism-Oriented Visitors
5.2.2. Purchasing-Oriented Visitors
5.2.3. Special Event-Oriented Visitors
5.2.4. Education-Oriented Visitors
6. Discussion
Acknowledgments
Author Contributions
Conflicts of Interest
References
- McKercher, B.; Shoval, N.; Ng, E.; Birenboim, A. First and repeat visitor behaviour: Gps tracking and gis analysis in Hong Kong. Tour. Geogr. 2012, 14, 147–161. [Google Scholar] [CrossRef]
- Zheng, W.; Huang, X.; Li, Y. Understanding the tourist mobility using gps: Where is the next place? Tour. Manag. 2017, 59, 267–280. [Google Scholar] [CrossRef]
- Phithakkitnukoon, S.; Horanont, T.; Witayangkurn, A.; Siri, R.; Sekimoto, Y.; Shibasaki, R. Understanding tourist behavior using large-scale mobile sensing approach: A case study of mobile phone users in Japan. Pervasive Mob. Comput. 2015, 18, 18–39. [Google Scholar] [CrossRef]
- Asakura, Y.; Iryo, T. Analysis of tourist behaviour based on the tracking data collected using a mobile communication instrument. Transp. Res. Part A 2007, 41, 684–690. [Google Scholar] [CrossRef]
- Cao, J.; Hu, Q.; Li, Q. A study of users’ movements based on check-in data in location-based social networks. In Proceedings of the International Symposium on Web and Wireless Geographical Information Systems, Seoul, Korea, 29–30 May 2014; Springer: Berlin, Germany, 2014; pp. 54–66. [Google Scholar]
- Min, L.I.; Wang, X.C.; Zhang, J.; Liu, Z.J. Study on check-in and related behaviors of location-based social network users. Comput. Sci. 2013, 40, 72–76. [Google Scholar]
- Li, L.; Yang, L.; Zhu, H.; Dai, R. Explorative analysis of wuhan intra-urban human mobility using social media check-in data. PLoS ONE 2015, 10, e0135286. [Google Scholar] [CrossRef] [PubMed]
- Huang, Q.; Cao, G.; Wang, C. From where do tweets originate? A gis approach for user location inference. In Proceedings of the 7th ACM SIGSPATIAL International Workshop on Location-Based Social Networks, Dallas/Fort Worth, TX, USA, 4–7 November 2014; ACM: New York, NY, USA, 2014; pp. 1–8. [Google Scholar]
- Wu, L.; Zhi, Y.; Sui, Z.; Liu, Y. Intra-urban human mobility and activity transition: Evidence from social media check-in data. PLoS ONE 2014, 9, e97010. [Google Scholar] [CrossRef] [PubMed]
- World Tourism Organization. Annual Report 2015. Available online: http://cf.cdn.unwto.org/sites/all/files/pdf/annual_report_2015_lr.pdf (accessed on 23 August 2017).
- Salah, A.A.; Lepri, B.; Pianesi, F.; Pentland, A.S. Human behavior understanding for inducing behavioral change: Application perspectives. In Proceedings of the International Workshop on Human Behavior Understanding, Amsterdam, The Netherlands, 16 November 2011; Springer: Berlin, Germany, 2011; pp. 1–15. [Google Scholar]
- Hartford, J.S.; Wright, J.R.; Leyton-Brown, K. Deep learning for predicting human strategic behaviour. In Advances in Neural Information Processing Systems; MIT Press: Cambridge, MA, USA, 2016; pp. 2424–2432. [Google Scholar]
- YouTube. Match 1—Google Deepmind Challenge Match: Lee Sedol vs. Alphago. Available online: https://www.youtube.com/watch?v=vFr3K2DORc8&t=1h57m (accessed on 4 July 2017).
- Ritter, S.; Barrett, D.G.T.; Santoro, A.; Botvinick, M.M. Cognitive psychology for deep neural networks: A shape bias case study. arXiv, 2017; arXiv:1706.08606. [Google Scholar]
- TensorFlow. Image Recognition. Available online: https://www.tensorflow.org/tutorials/image_recognition (accessed on 25 June 2017).
- TensorFlow. Mnist for ml Beginners. Available online: https://www.tensorflow.org/versions/r0.7/tutorials/mnist/beginners/index.html (accessed on 25 June 2017).
- Kovalev, V.; Kalinovsky, A.; Kovalev, S. Deep learning with theano, torch, caffe, tensorflow, and deeplearning4j: Which one is the best in speed and accuracy? In Proceedings of the XIII International Conference on Pattern Recognition and Information Processing, Minsk, Belarus, 3–5 October 2016. [Google Scholar]
- Duc, H.H.; Jung, K. Applying tensorflow with convolutional neural networks to train data and recognize national flags. In Advanced Multimedia and Ubiquitous Engineering: Mue/Futuretech 2017; Park, J.J., Chen, S.-C., Raymond Choo, K.-K., Eds.; Springer: Singapore, 2017; pp. 367–373. [Google Scholar]
- Ferri, A. Object Tracking in Video with Tensorflow; Universitat Politècnica de Catalunya: Barcelona, Spain, 2016. [Google Scholar]
- Dean, J. Large-scale deep learning for intelligent computer systems. In Proceedings of the Ninth ACM International Conference on Web Search and Data Mining, San Francisco, CA, USA, 22–25 February 2016. [Google Scholar]
- Baccouche, M.; Mamalet, F.; Wolf, C.; Garcia, C.; Baskurt, A. Sequential deep learning for human action recognition. In Proceedings of the International Workshop on Human Behavior Understanding, Amsterdam, The Netherlands, 16 November 2011; pp. 29–39. [Google Scholar]
- Alahi, A.; Goel, K.; Ramanathan, V.; Robicquet, A.; Li, F.F.; Savarese, S. Social lstm: Human trajectory prediction in crowded spaces. In Proceedings of the IEEE Conference on Computer Vision and Pattern Recognition, Las Vegas, NV, USA, 26 June–1 July 2016; pp. 961–971. [Google Scholar]
- Oh, J.Y.-J.; Cheng, C.-K.; Lehto, X.Y.; O’Leary, J.T. Predictors of tourists’ shopping behaviour: Examination of socio-demographic characteristics and trip typologies. J. Vacat. Mark. 2004, 10, 308–319. [Google Scholar] [CrossRef]
- Johns, N.; Gyimóthy, S. Market segmentation and the prediction of tourist behavior: The case of bornholm, denmark. J. Travel Res. 2002, 40, 316–327. [Google Scholar] [CrossRef]
- Morrison, A.M.; Braunlich, C.G.; Cai, L.A.; O’Leary, J.T. A profile of the casino resort vacationer. J. Travel Res. 1996, 35, 55–61. [Google Scholar] [CrossRef]
- Vu, H.Q.; Li, G.; Law, R.; Ye, B.H. Exploring the travel behaviors of inbound tourists to Hong Kong using geotagged photos. Tour. Manag. 2015, 46, 222–232. [Google Scholar] [CrossRef]
- Lau, G.; Mckercher, B. Understanding tourist movement patterns in a destination: A GIS approach. Tour. Hosp. Res. 2006, 7, 39–49. [Google Scholar] [CrossRef]
- Mckercher, B.; Gigi, L. Movement patterns of tourists within a destination. Tour. Geogr. 2008, 10, 355–374. [Google Scholar] [CrossRef]
- Leung, X.Y.; Wang, F.; Wu, B.; Bai, B.; Stahura, K.A.; Xie, Z. A social network analysis of overseas tourist movement patterns in beijing: The impact of the olympic games. Int. J. Tour. Res. 2012, 14, 469–484. [Google Scholar] [CrossRef]
- Yuan, Y.; Medel, M. Characterizing international travel behavior from geotagged photos: A case study of flickr. PLoS ONE 2016, 11, e0154885. [Google Scholar] [CrossRef] [PubMed]
- Padhi, S.S.; Pati, R.K. Quantifying potential tourist behavior in choice of destination using google trends. Tour. Manag. Perspect. 2017, 24, 34–47. [Google Scholar] [CrossRef]
- Clements, M.; Serdyukov, P.; de Vries, A.P.; Reinders, M.J.T. Using flickr geotags to predict user travel behaviour. In Proceedings of the 33rd International ACM SIGIR Conference on Research and Development in Information Retrieval, Geneva, Switzerland, 19–23 July 2010; ACM: New York, NY, USA, 2010; pp. 851–852. [Google Scholar]
- Yuan, L.; Xiao, L.; Yu, Y.; Xu, W.; Law, A. Understanding tourist space at a historic site through space syntax analysis: The case of Gulangyu, China. Tour. Manag. 2016, 52, 30–43. [Google Scholar]
- Plog, S.C.; Ritchie, J.R.B.; Goeldner, C.R. Understanding psychographics in tourism research. In Understanding Psychographics in Tourism Research; CABI: Wallingford, UK, 1987; pp. 203–213. [Google Scholar]
- Bianchi, C.; Milberg, S.; Cúneo, A. Understanding travelers’ intentions to visit a short versus long-haul emerging vacation destination: The case of Chile. Tour. Manag. 2017, 59, 312–324. [Google Scholar] [CrossRef]
- Chen, K.; Yan, Z.J.; Huo, Q. A context-sensitive-chunk bptt approach to training deep lstm/blstm recurrent neural networks for offline handwriting recognition. In Proceedings of the International Conference on Document Analysis and Recognition, Johannesburg, South Africa, 12–13 January 2016; pp. 411–415. [Google Scholar]
- Simonyan, K.; Zisserman, A. Very Deep Convolutional Networks for Large-Scale Image Recognition. Available online: https://arxiv.org/abs/1409.1556 (accessed on 25 June 2017).
- Graves, A.; Jaitly, N.; Mohamed, A.R. Hybrid speech recognition with deep bidirectional LSTM. In Proceedings of the Automatic Speech Recognition and Understanding, Olomouc, Czech, 8–12 December 2013; pp. 273–278. [Google Scholar]
- Graves, A.; Jaitly, N. Towards end-to-end speech recognition with recurrent neural networks. In Proceedings of the International Conference on Machine Learning, Beijing, China, 21–26 June 2014; pp. 1764–1772. [Google Scholar]
- Graves, A. Generating Sequences with Recurrent Neural Networks. Available online: https://arxiv.org/abs/1308.0850 (accessed on 25 June 2017).
- Yao, D.; Zhang, C.; Huang, J.; Bi, J. SERM: A recurrent model for next location prediction in semantic trajectories. In Proceedings of the 2017 ACM on Conference on Information and Knowledge Management, Singapore, 6–10 November 2017; ACM: New York, NY, USA, 2017; pp. 2411–2414. [Google Scholar]
- Abadi, M.; Agarwal, A.; Barham, P.; Brevdo, E.; Chen, Z.; Citro, C.; Corrado, G.S.; Davis, A.; Dean, J.; Devin, M. Tensorflow: Large-scale machine learning on heterogeneous distributed systems. arXiv, 2016; arXiv:1603.04467. [Google Scholar]
- Abadi, M.; Barham, P.; Chen, J.; Chen, Z.; Davis, A.; Dean, J.; Devin, M.; Ghemawat, S.; Irving, G.; Isard, M. Tensorflow: A system for large-scale machine learning. arXiv, 2016; arXiv:1605.08695. [Google Scholar]
- Haykin, S.S. Neural Networks and Learning Machines; Pearson: Upper Saddle River, NJ, USA, 2009; Volume 3. [Google Scholar]
- TensorFlow. Tf.Contrib.Learn Quickstart. Available online: https://www.tensorflow.org/get_started/tflearn (accessed on 25 June 2017).
- Hong Kong Tourism Board PartnerNet. Visitor Arrival Statistics. Available online: https://securepartnernet.hktb.com/china/sc/research_statistics/research_publications/index.html?id=3631 (accessed on 5 July 2017).
- Sina Tech. Gaode Unites Sina to Launch the Social Network Map Platform. Available online: http://tech.sina.cn/?sa=t84v44d21223704&pos=108&vt=4 (accessed on 12 March 2017).
- Gaode Open Platform, Web Services API and Related Downloads. Available online: http://lbs.amap.com/api/webservice/download/ (accessed on 12 March 2017).
- Kuah-Pearce, K.E. Chinese Women and the Cyberspace; Amsterdam University Press: Amsterdam, The Netherlands, 2008. [Google Scholar]
- Wikipedia. Shenzhen-Hong Kong Cross-Boundary Students. Available online: https://en.wikipedia.org/wiki/Shenzhen%E2%80%93Hong_Kong_cross-boundary_students (accessed on 5 May 2017).
- Manning, C.D.; Raghavan, P.; Schütze, H. Introduction to Information Retrieval; Cambridge University Press: Cambridge, UK, 2008; Volume 1. [Google Scholar]
- Li, J.; Cheng, J.-H.; Shi, J.-Y.; Huang, F. Brief introduction of back propagation (bp) neural network algorithm and its improvement. In Advances in Computer Science and Information Engineering; Springer: Berlin, Germany, 2012; pp. 553–558. [Google Scholar]
- Buscema, M. Back propagation neural networks. Subst. Misuse 1998, 33, 233–270. [Google Scholar] [CrossRef]
- Hecht-Nielsen, R. Theory of the backpropagation neural network. Neural Netw. 1988, 1, 445–448. [Google Scholar] [CrossRef]
- Powell, M.J.D. Radial Basis Functions for Multivariable Interpolation: A Review; Clarendon Press: Wotton-under-Edge, UK, 1987. [Google Scholar]
- Breiman, L. Random forests. Mach. Learn. 2001, 45, 5–32. [Google Scholar] [CrossRef]
- Ukil, A. Support vector machine. Comput. Sci. 2002, 1, 1–28. [Google Scholar]
- Ranganathan, A. The levenberg-marquardt algorithm. Tutor. Algorithm 2004, 11, 101–110. [Google Scholar]
- Hong Kong Tourism Board PartnerNet. Visitor Profile Report—2014. Available online: http://securepartnernet.hktb.com/filemanager/intranet/ir/ResearchStatistics/paper/Visitor-Pro/Profile2014/visitor_profile_2014_0.pdf (accessed on 15 July 2017).
- Hu, Y. Efficient, high-quality force-directed graph drawing. Math. J. 2005, 10, 37–71. [Google Scholar]
- Weng, J.; Lee, B.-S. Event detection in twitter. ICWSM 2011, 11, 401–408. [Google Scholar]
- Xu, Z.; Zhang, H.; Hu, C.; Mei, L.; Xuan, J.; Choo, K.K.R.; Sugumaran, V.; Zhu, Y. Building knowledge base of urban emergency events based on crowdsourcing of social media. Concurr. Comput. Pract. Exp. 2016, 28, 4038–4052. [Google Scholar] [CrossRef]
- Weibo. Weibo Users Development Report—2014. Available online: http://data.weibo.com/report/reportDetail?id=215 (accessed on 27 July 2017). (In Chinese).


| No. | Type | Abbreviation | Check-in POI Count | Check-in Users | Number of Check-Ins |
|---|---|---|---|---|---|
| 1 | Common attractions | AFC | 1200 | 30,717 | 40,599 |
| 2 | Special event attractions | AFS | 126 | 5251 | 9054 |
| 3 | Transport | TRA | 193 | 15,257 | 20,401 |
| 4 | Hotels | HOT | 677 | 19,722 | 32,882 |
| 5 | Catering | CAT | 2787 | 12,915 | 15,644 |
| 6 | Retail | RET | 1599 | 32,870 | 115,319 |
| 7 | Education | EDU | 378 | 3756 | 7469 |
| 8 | Residence | RES | 1021 | 3001 | 7199 |
| 9 | Other | OTH | 1563 | 6790 | 10,495 |
| No. | Classification | Classification Rules |
|---|---|---|
| 1 | Purchasing-oriented visitors | Most check-in records occur at shopping POIs (RET), with few at common tourist attractions (AFC) and hotels (HOT) |
| 2 | Tourism-oriented visitors | Most check-in POIs are common tourist attractions (AFC) and hotels (HOT), while some are restaurants (CAT), shopping POIs (RET), etc. |
| 3 | Special event-oriented visitors | Most check-in records occur at attractions for special events (AFS) |
| 4 | Education-oriented visitors | Check-in records occur mostly at education POIs (EDU), as well as some in residential areas (RES) and other (OTH) areas |
| 5 | En-route visitors | Check-in records only occur at airports and ports or surrounding areas (TRA) |
| 6 | Others | Check-in users that cannot be classified by the aforementioned classification rules |
| No. | Neural Network Model | Accuracy | Precision | Recall | f-Score |
|---|---|---|---|---|---|
| 1 | Back propagation neural network | 90.25 | 87.22 | 87.94 | 87.58 |
| 2 | Radial basis function neural network | 86.6 | 80.04 | 71.34 | 75.44 |
| 3 | Random forest | 88.87 | 92.05 | 73.76 | 81.90 |
| 4 | Support vector machine | 89.75 | 87.78 | 82.16 | 84.88 |
| 5 | DNNClassifier | 92.43 | 88.17 | 89.94 | 89.05 |
| No. | Classification | Sum | Percentage (%) |
|---|---|---|---|
| 1 | Purchasing-oriented visitors | 5831 | 13.8 |
| 2 | Tourism-oriented visitors | 27,404 | 64.9 |
| 3 | Special event-oriented visitors | 1875 | 4.4 |
| 4 | Education-oriented visitors | 1577 | 3.7 |
| 5 | En-route visitors | 2357 | 5.6 |
| 6 | Others | 3210 | 7.6 |
| Type | Average Stay Time (Days) | Average Number of Visits to Hong Kong (No.) | Proportion of Same-Day Trips (%) |
|---|---|---|---|
| Purchasing-oriented visitors | 1.6 | 3.3 | 76.1 |
| Tourism-oriented visitors | 2.3 | 1.5 | 46.4 |
| No. | Date | Check-in Frequency | Place | Event |
|---|---|---|---|---|
| 1 | 30 May 2014 | 145 | Hong Kong Coliseum | Mayday Just Rock it!! Hong Kong Concerts |
| 2 | 24 May 2014 | 121 | Hong Kong Coliseum | |
| 3 | 29 May 2014 | 109 | Hong Kong Coliseum | |
| 4 | 23 May 2014 | 81 | Hong Kong Coliseum | |
| 5 | 22 May 2014 | 74 | Hong Kong Coliseum | |
| 6 | 26 May 2014 | 65 | Hong Kong Coliseum | |
| 7 | 27 May 2014 | 57 | Hong Kong Coliseum | |
| 8 | 1 Jun. 2014 | 120 | AsiaWorld Expo | EXO FROM. EXOPLANET #1—THE LOST PLANET IN HONGKONG |
| 9 | 16 Aug. 2014 | 106 | AsiaWorld Expo | 2014 JYJ Asia Tour Concert THE RETURN OF THE KING IN HONG KONG |
| 10 | 30 Aug. 2014 | 94 | AsiaWorld Expo | JYP NATION “ONE MIC” 2014 Concert |
| 11 | 3 Dec. 2014 | 91 | AsiaWorld Expo | Mnet Asian Music Awards 2014 MAMA in Hong Kong |
| 13 | 24 Nov. 2014 | 60 | AsiaWorld Expo | Opus2 Jay 2014 WORLD TOUR |
| 14 | 23 Nov. 2014 | 46 | AsiaWorld Expo | |
| 15 | 22 Nov. 2014 | 42 | AsiaWorld Expo | |
| 16 | 1 Jun. 2014 | 44 | Hong Kong Coliseum | Della In Concert-Hong Kong |
| 17 | 15 Mar. 2014 | 39 | Hong Kong Convention and Exhibition Centre | C3 in Hong Kong |
| 18 | 25 Jul. 2014 | 39 | Hong Kong Coliseum | Stefanie Sun <Kepler> 2014 World Tour-Hong Kong |
| 19 | 27 Jul. 2014 | 35 | Hong Kong Coliseum | |
| 20 | 30 Aug. 2014 | 38 | Hong Kong Coliseum | Father of Concert Glory SHOW |
| Subclassification | Above University | Secondary School | Primary School | Others |
|---|---|---|---|---|
| Proportion (%) | 95.3 | 2.3 | 0.3 | 2.1 |
© 2018 by the authors. Licensee MDPI, Basel, Switzerland. This article is an open access article distributed under the terms and conditions of the Creative Commons Attribution (CC BY) license (http://creativecommons.org/licenses/by/4.0/).
Share and Cite
Han, S.; Ren, F.; Wu, C.; Chen, Y.; Du, Q.; Ye, X. Using the TensorFlow Deep Neural Network to Classify Mainland China Visitor Behaviours in Hong Kong from Check-in Data. ISPRS Int. J. Geo-Inf. 2018, 7, 158. https://0-doi-org.brum.beds.ac.uk/10.3390/ijgi7040158
Han S, Ren F, Wu C, Chen Y, Du Q, Ye X. Using the TensorFlow Deep Neural Network to Classify Mainland China Visitor Behaviours in Hong Kong from Check-in Data. ISPRS International Journal of Geo-Information. 2018; 7(4):158. https://0-doi-org.brum.beds.ac.uk/10.3390/ijgi7040158
Chicago/Turabian StyleHan, Shanshan, Fu Ren, Chao Wu, Ying Chen, Qingyun Du, and Xinyue Ye. 2018. "Using the TensorFlow Deep Neural Network to Classify Mainland China Visitor Behaviours in Hong Kong from Check-in Data" ISPRS International Journal of Geo-Information 7, no. 4: 158. https://0-doi-org.brum.beds.ac.uk/10.3390/ijgi7040158