Comic Strip Narratives in Time Geography


1
National School of Surveying, University of Otago, Dunedin 9054, New Zealand
2
Department of Computer Science, Norwegian University of Science and Technology (NTNU), NO-2802 Gjøvik, Norway
*
Author to whom correspondence should be addressed.
ISPRS Int. J. Geo-Inf. 2018, 7(7), 245; https://0-doi-org.brum.beds.ac.uk/10.3390/ijgi7070245
Submission received: 5 May 2018
/
Revised: 8 June 2018
/
Accepted: 18 June 2018
/
Published: 22 June 2018
(This article belongs to the Special Issue Storytelling with Geographic Data)
Abstract
:On the basis of a shared emphasis on time as well as space, this paper argues for introducing elements of comic art into cartography, specifically the mapped comic, with an illustrated strip literally plotted and placed in a 3D time geographic virtual world. This approach is situated within current initiatives regarding the relationship between cartography and art, given that comics are a type of sequential art. Two examples demonstrate that the approach succeeds as a way of representing the geometry of a story without compromising emotional content. Comic conventions neatly package narrative geography for visual deployment. An example demonstrating the expressiveness of comic art principles when applied to maps (maps as comics) is discussed.

1. Introduction
The value of the map is beyond doubt. The cartographer’s technical skill and artistic vision work together to create representations that communicate geography efficiently and effectively. Traditionally, printed maps were designed for rendering scientific data and there is accordingly need for augmentation when considering other categories of data with intrinsic geographic content, such as human narrative data and stories. Such modifications can yield, in effect, “emotionally-charged maps” capable of facilitating better understanding of places and inducing motivation in map readers [1,2,3,4]. There is historical precedent for this personal aspect in maps, in the form of adornments such as personal annotations [5], a case where maps become ‘holders of our memories’ and ‘records of our passage through life itself’ [6].
In the digital realm, maps and stories are increasingly found together. For example, Web 2.0 enables geotagged places and photos and geocoded individual narratives [7,8]. In such an example, “multimedia metaphor extensions [provide] users with a tool, with information obtained from the real world, rather than from an artificial, map-defined world ...” ([9], p. 337). Another example is the ‘story map’, an alternative to the conventional ‘grid map’, used “to describe forms of spatial expressions that embody our personal experiences of the environment and contribute to creating a deep understanding of places” ([10], p. 136) (see also Esri Story Maps (e.g., [11])). Hybridization [7,12], a blurring of the boundaries between grid mapping on the one hand and representations of very personal feelings and emotions on the other, is another possibility.
1.1. Cartography and Art
The central challenge in synthesizing maps and stories together into a narrative map, is to retain emotional vitality while also rendering geographic information correctly and systematically [13]. We can look to art, adapting artistic methods and techniques for this purpose and this activity is part of the research agenda on cartography for Big Data [14]. Art was once a major part of any map or atlas produced, albeit as a “decorative component” [15], but there is a current reappraisal of the place of art in cartography (conferences and books on Cartography and Art, e.g., [16], are now regular, propelled by groups such as the ICA (Commission on Art and Cartography), with art able to offer a perspective on the world that maps alone cannot [17,18]). An argument has been made against an art/science dualism, instead, both art-led and scientific approaches to cartography should co-exist functionally as new mapping methods are developed [19]. This is echoed by comic artist Scott McCloud: “The best way to understand the nature of our environment is to return to it from as many vantage points as possible—triangulating its shape from without” ([20], p. 19).
The inherent subjectivity of all maps should also be recognised. Map aesthetics are a “powerful and often unacknowledged link between art and science” ([17], p. 287) and as such afford opportunities to present multiple viewpoints on our world. These authors [17] suggest three ways in which the combination of cartography and art could be effected:
- -
- Linking the artistic with the conventional map (“anti-map/map”).
- -
- The artist develops their own vision in relation to the conventional map.
- -
- Integrating the methods and techniques of artists into conventional maps. This is the approach put forward in this paper using the practice of comic book artists.
Narrative map creators may look to examples from other visual storytelling media to invoke emotional power in geovisualisation [1]. Storyboarding, a visual planning tool often used in cinema [7], has been adapted in geospatial science and HCI [21,22,23,24]. More directly, we may look to comic strips and their use of static frames to create narratives. Similar to the sequence of frames in a movie, time, space and the emotional content of relationships among agents in a story can all be represented by frame content and by spatial relationships in and across individual frames. Moreover, because static frames present an inherently incomplete representation of space, time and relationships [25], the viewer is invited (required) to engage cognitively and emotionally with the story [26,27], promoting temporal flow [25]. It is these sequential, connected visual storytelling means that will be the focus of this paper, depicting narratives in space and time. Responding to the call for affective geovisualisations (e.g., [1]), comics also have the potential to add fun to maps, generating interest in even the driest of topics, while retaining the promise of all works of art, to challenge and have aesthetic value [28].
1.2. Comics and Art
There is no single definition for comics. Details of the definitions vary according to scientific or artistic perspectives, and with underlying argument contexts (for example, as in [25,26]). Here, we define comics as sequences of framed panels containing images and text, separated by gutters with a narrative structure created by their arrangement relative to each other and on the page. The similar term cartoon is used to describe standalone panels, but this simpler form is not of interest here. Will Eisner was the first to argue for comics as an art form (sequential art) [29] and as literature [25]. In the past, comics’ accessibility has contributed to negative attitudes toward their recognition as either [20]. However, the very same accessibility and the comic’s ability to communicate effectively both intellectual and emotional content [20] is what makes the medium so potentially powerful for cartography.
2. Narratives, Comics and Maps
This paper presents a case for the use of comic design in cartography to create maps that are expressive in new ways, specifically in representing narratives, and implicitly, the time dimension. Indeed, Dylan Horrocks, an established comic artist, called for an exploration of “… connections between comics and … cartography” ([30], p. 6). There is appreciable overlap between comic and cartographic principles, particularly when considering caricature [31,32].
Regarding comics as sequential art, the medium is rich for expressively revealing aspects of the geographical world that conventional maps do not, the central impetus for Cartography and Art. Comics readily accept multiple perspectives and experiences of space, natively represent the passage of time, and embed written expression. The scheme of integrated words and pictures so well exploited by comics has long been promoted by the influential data scientist Edward Tufte, “words and pictures belong together” ([33], p. 180). In an argument against prioritizing either the written word or the map as a source of geographic knowledge, the education scholar and cartoonist Nick Sousanis reminds us that “when represented through any single mode, this world of our experience, of endless horizons, is necessarily flattened” ([34], p. 57).
A map as a comic would normally be an example of a non-fiction comic (fictional narrative mapping is discussed in Section 4), which “… examine[s] a subject directly without the pretense of a story” [20], though a narrative progression may factor into it (e.g., [35]). Non-fiction (instructional) comics have an advantage over “rigid” photographs [29], and are one of seven recommended genres of narrative visualization in online newspapers [36]. This type of comic is exemplified to good effect in Data Comics, which uses data driven visualisations, clipped from the web, decorated with comic-style rendering before assemblage in a comic strip [37]. They have the ability to distil information to the bare minimum to clearly communicate its essence, and the license to exaggerate to more quickly make a point. This is facilitated by the cartoons’ expressiveness that removes any interpretational ambiguity by relaxing the constraints of physical laws (e.g., by squashing a subject’s statue to express anger emotions—referred to as “squash and stretch” in the context of animation [38]) and allowing for the pictorial representation of motion [38]. Maps also enjoy this freedom, exaggeration being one process of map generalization [31].
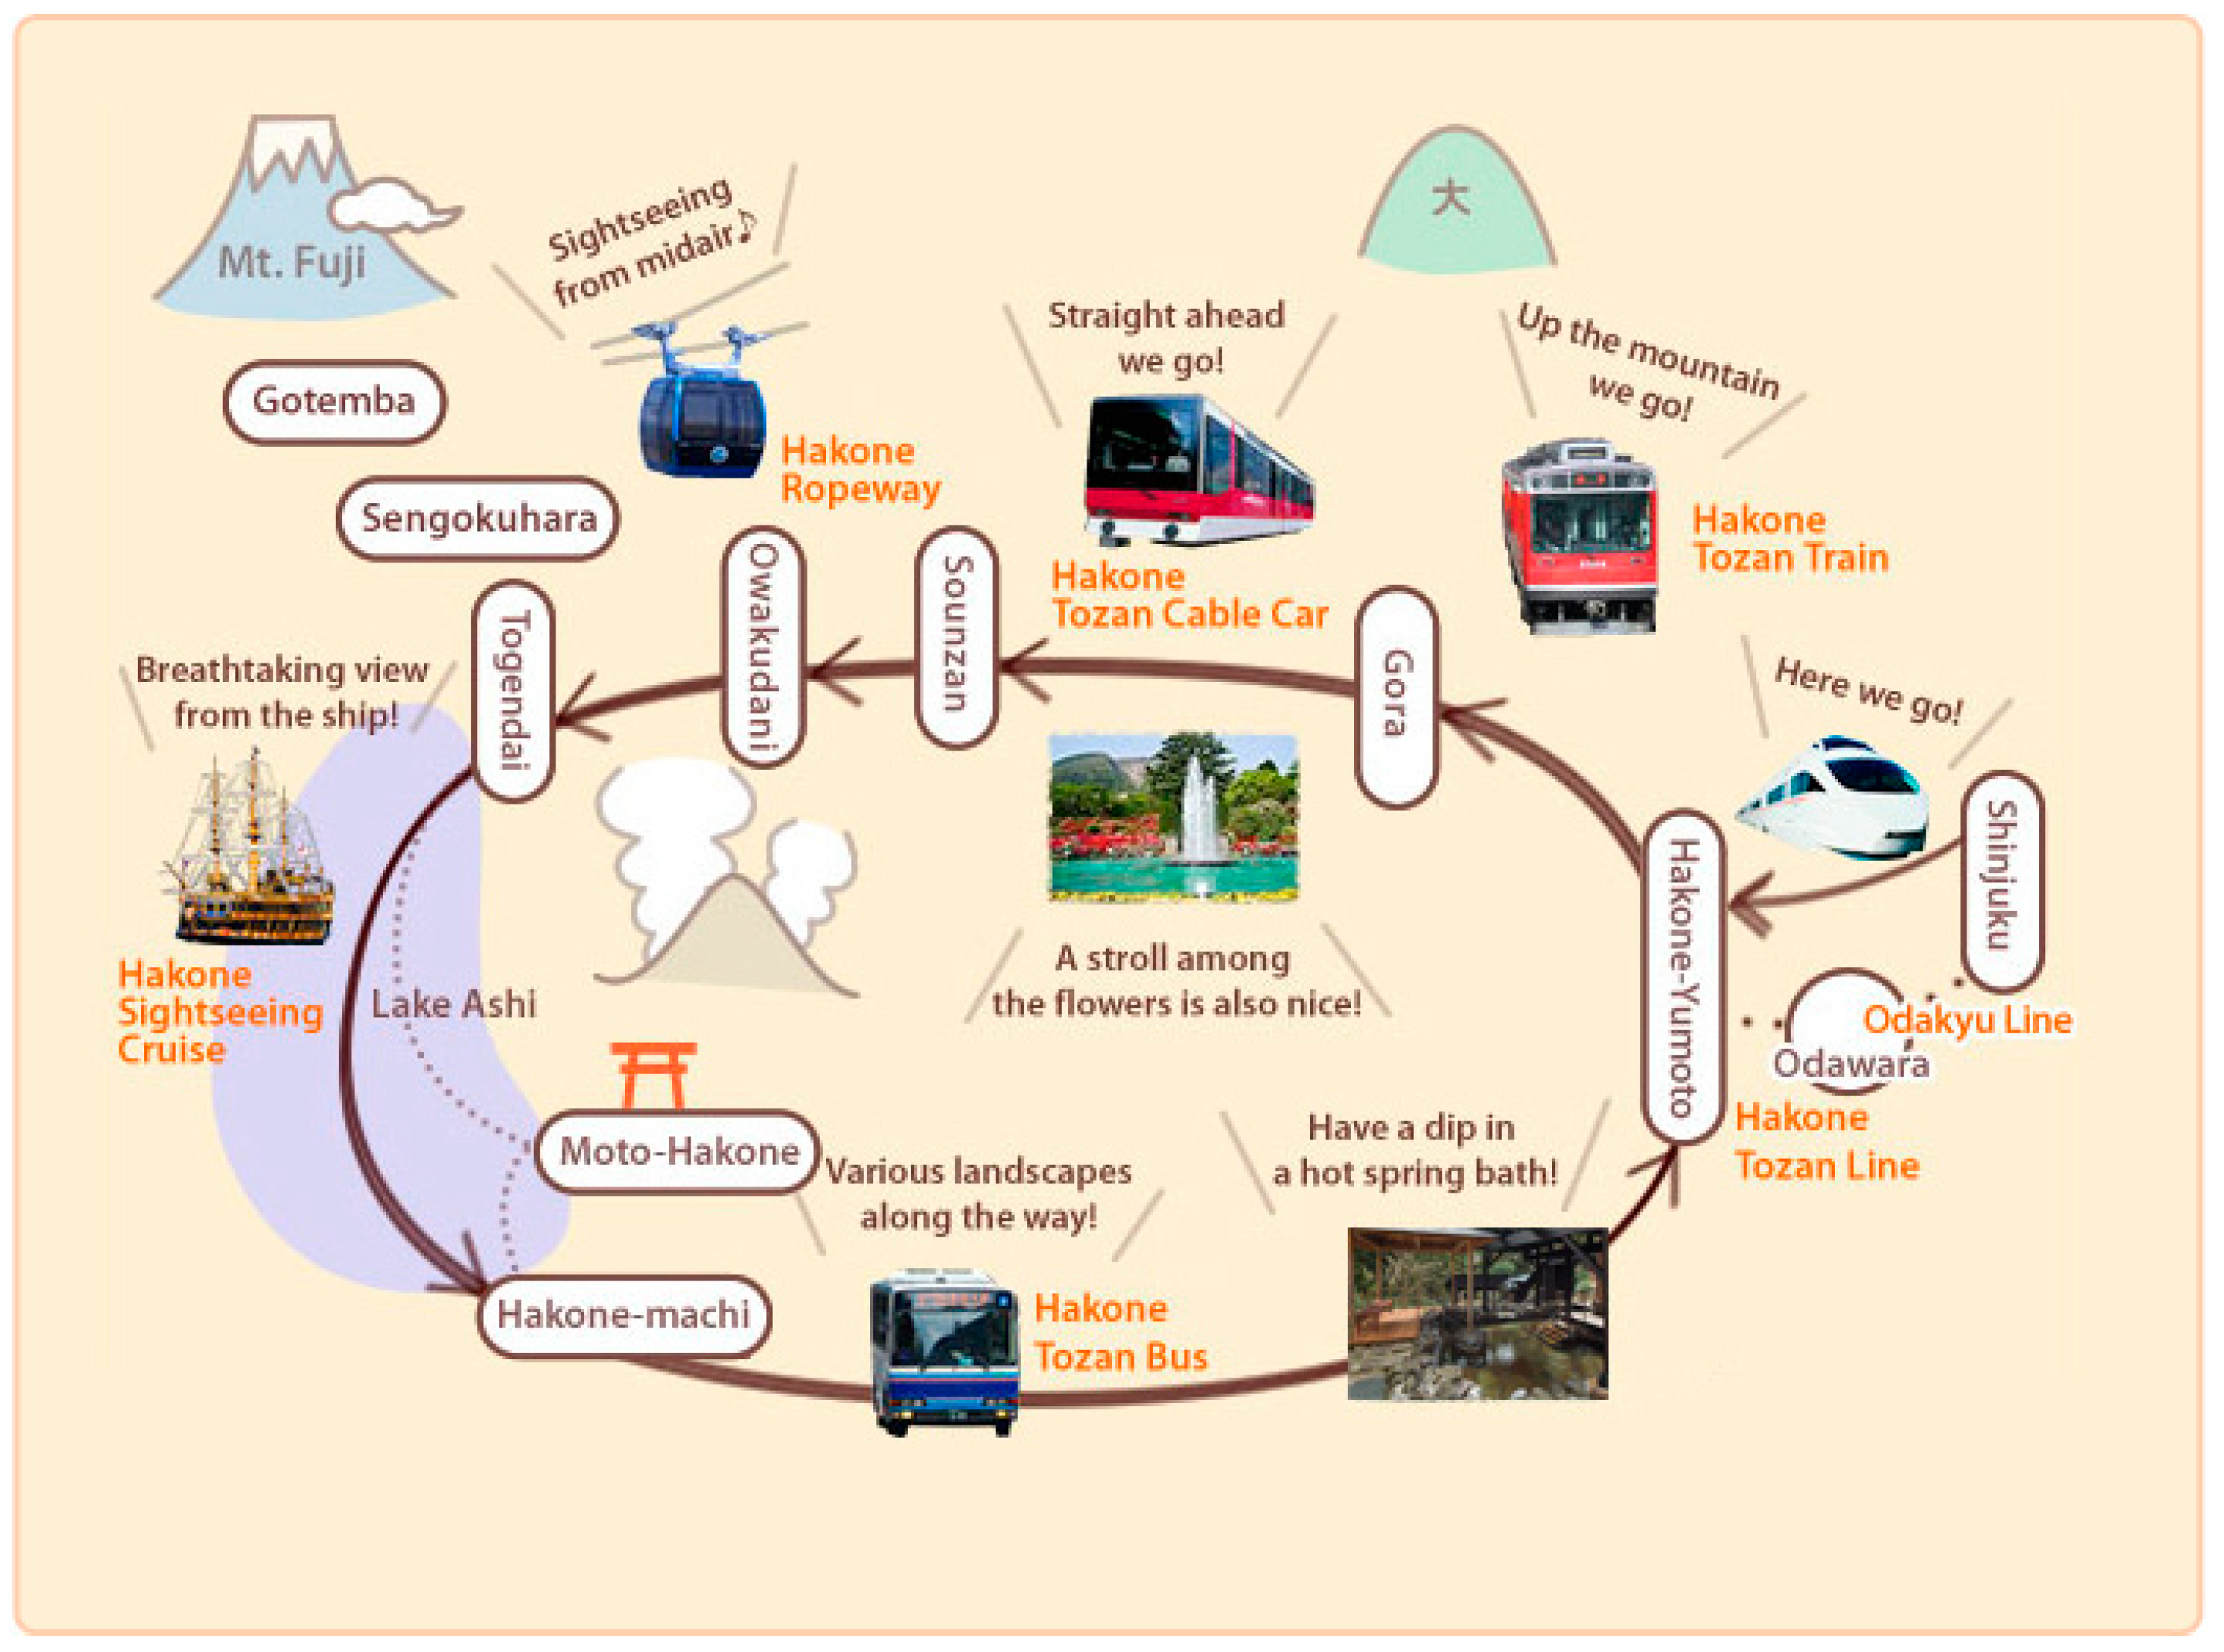
When maps feature as major themes in comics, it is often as a metaphor. This is part of an approach described as world-building [39], in which the emphasis of the comic is not on story and time, but on place and space, for exploration (examples from other arts that do the same are also cited). Horrocks’ interest in maps as well as comics is expressed in “Atlas” [40], a comic book in which the main character is both a cartoonist and cartographer. World-building happens to good effect in a literal cartographic sense in the “Atlas of Experience” [41], which contains maps that communicate aspects of a typical life. Comics also use geographic representations as a device to drive a story. For example, in McCloud’s book [20], a map of Europe was used as a metaphor for European comic makers. From a cartographic point of view, maps can use comic-like techniques for a more expressive effect; these are relatively common, particularly in tourist applications (see for example Figure 1).
Fundamentally, traditional narratives, such as those told through written stories, comics or films, involve place as well as space, and indeed often drive a story’s ‘shape’ [42]. Typically, the places in traditional stories are mappable and thus, form the geographic structure of the narrative, “stories contribute to the production of spatial identities” ([13], p. 18). Simple geographical locations alone (i.e., mapped points) are limited in “capturing and characterizing the complex spatio-temporal dimensions of narratives” ([3], p. 18) and this directs us toward a requirement that map narratives manifest themselves geometrically in higher dimension features, such as lines (central to this research) and areas. Even though points can be useful in map narratives (e.g., landmarks), lines and areas are needed to support the generally more complex geographic renderings derived from story-telling mechanisms. In this work we explore the use of 2D storytelling in the comic style that has been transformed into a 3D spacetime map presentation of geographical data. This is to provide richer and deeper contextualization of space and the dynamic and static geographical entities that inhabit it (i.e., communicate the human-oriented elements that turn a space into a place), making for effective hybrid (space-place/map-narrative) communication.
The remainder of this paper sets out a framework for using geospatial mapping conventions, particularly the vector line in a time geographic context, to integrate comic strip and cartographic practices into a new narrative map form. Two case studies will demonstrate this: (1) a typical work day; and (2) an account of a holiday roadtrip. The potential of the hybrid comic-map representation has a far larger scope for use than these straightforward domestic diary applications, however. For example, it could be used to add pictorial heft to critical real-world scenarios such as the consequences of climate change (global warming, sea-level rise) or environmental health issues, including active transport and mobility. In an environmental justice example [43], visual storytelling is explored (a process that can involve cartoons) as a means of enhancing communication beyond the map of the spatial correlations between hazardous waste disposal sites and poor/minority communities. The mapping technique introduced in this paper could add colour to increasingly available animal tracking data, making conservation issues publicly prevalent (the book “Where the Animals Go” [44] has in effect achieved this through its innovative mapping of tracks). Finally, the mapped comic strip can be brought back to its origins in fiction (discussed in Section 4), punctuating a large group of books accompanied by author-drawn ‘worlds’ (e.g., Tolkien’s “Lord of the Rings”), a much larger group of works that are situated in recognisable geography, leaving those publications with imagined locations that can be generated through synthetic means (e.g., fractals). Reuschel and Hurni have addressed the challenge of mapping locations in fiction that have no certain link to real-world geography [45].
3. Comic Snapshots Embedded in the Map
3.1. Initial Thoughts
Opportunities enabled by contemporary computing infrastructures, such as interactivity with a map representation in a virtual context, can facilitate the embedding of comic strips in map contexts (“comics as maps”). These all signify that comic art has much to offer cartography. In discussing temporal map snapshots, the concept of which originates in GIS, our discussion of comics and cartography has borrowed from the computer realm. Indeed, technology is presented as an equal partner with art and science in the practice of cartography [16]. Cartoons in a digital context have already been used to good effect in delivering wayfinding instructions [46] and for demonstrating interactive multimedia environments [47]. There are opportunities for both domains that are specifically enabled by computers, beyond the effects that are now simple to do (e.g., pixelating, blurring, embossing) and of course routine cartographic tasks such as lettering fall into the same category. Beyond that, for comics, we now have the choice of aping the page on the screen (not imaginative) or clicking through panel by panel (but then one loses the sequential nature of comic art).
The modern print format of comics is shaped by the page [26]. Comic artists exploit the paginated layout to structure their stories, in a system that builds from panel to strip, to page, to story. Groensteen’s [26] term gridding, which expresses both the creation process and the geometric attributes of comics, references the usual rectilinear relationships among panel frames and the page. When translations are made from one kind of page to another, say, from a newspaper to a book anthology, the regridding retains the essential rectilinear structure ([26], p. 25, [45]), although this highlights a spatial constraint—it is inevitably the case that at various levels of granularity (row to row, page to page), adjacency cannot be maintained [20]. It is important here to make a distinction between ‘series’ of panels linked by semantic relationships and ‘sequences’, which form the narrative.
Presenting comics digitally opens up a new opportunity, a window onto an “infinite canvas” rather than a fixed page. This allows, for example, the emergence of long sequential strips that maintain adjacency indefinitely. More radically, it also liberates comic strips to follow non-orthogonal configurations [20], just as modernist poets broke free from older forms. Cartwright [9] called for a similar consideration of the form of the digital map, to expand beyond physical print-based constraints (i.e., the large format map sheet, the page in a city street atlas). This also raises new challenges regarding the relationship between series and sequences and the creation of narrative rhythms and structure.
The digital comic canvas has an affinity with the large format map (McCloud calls for a “spatial model” to accommodate the large format comic). This can be taken literally. As a starting point, the comic strip can be regarded as a line in a GIS sense. One can imagine a hybrid map in which the path of a road trip or a walk to work is represented by a winding strip of panels. From the point of view of the comic strip, this arrangement breaks the grid, though it maintains the narrative network of sequenced panels ([26], p. 146). In comic books, even when the frames enclosing panels adopt non-orthogonal arrangements, panel content usually conforms to the axes of the page and a coordinate along only one axis is needed to trace (or map) the content of the strip. In the simplest imagined reconfiguration, two (x, y) coordinates are required.
Reprojection of the strip into the map, following the system of a geographic feature, would be a way of augmenting the geometric feature, scientifically rendered by the cartographer, with a narrative capability. The places will be therefore enriched with a narrative in which a human being or a group plays the role of story protagonist. Reprojected strips representing the journeys of different protagonists (in the progression of the story) could intersect on the map, requiring the reader to choose and determine how the emergent narrative flows from one series of panels to another. In this way, the hybrid map reader would explore the geography both spatially and in that narrative dimension. The reader would also have a hand in structuring the narrative sequence and thus has a more intimate relationship with the map and the unfolding story. Of course, as more strips were reprojected into it, the hybrid map would become a complex, and perhaps unreadable network. Adding time as a vertical dimension in the 3D representation would reduce the clutter and create a new narrative geometry. It would effectively turn the map into a space-time cube (STC) and the lines into the lifelines of time geography ([48], Figure 2).
Beyond this relatively straightforward example, the hybrid map could incorporate recent animation and multimedia innovations in cartography and multimedia atlases (e.g., [49]). The reprojected strip could be accompanied by a wealth of ancillary support in the form of notes, videos and additional maps [20].
This hybridisation of story and map aligns well with the ‘Storyteller’ metaphor for online maps and multimedia presentations [9]. Interactive storytelling is structured in 5 ways [50]: single-threaded/no choices; single-threaded/minor detours; multi-threaded/preset branching; multi-threaded/unprompted; and free exploratory mode. In a story composed of words and pictures, the user is ‘told’ about geography to give a sense of place as well as space, but the reader is an observer (as opposed to a director or actor; [50]). In mapping cinematic narrative, the need was recognized to capture places, connections among places and the passage of time [13]. In this case, the user can have enough control to follow a linear or non-linear narrative—an example is given of a pictorial landscape with different features that can be followed for different located stories [9]. This free, exploratory mode is the highest form of the 5 types of interactive story [50]. Relatedly, the cinematic storyboard has been categorized into linear, decision-based, circular and open types [24]. Another of Cartwright’s metaphors, the ‘Guide’, could be employed to insert narrative navigation guidance, while maintaining open exploration capability [9].
This set of conditions is met by the 3D space-time cube, (a ‘space’ capable of capturing narrative lines, as connections between places) but with fully interactive facilities for free exploration of narrative [27,51]. The space-time cube has cognitive advantages for communicating narratives [52,53]. In a comparison with other space-time representations (coordinated views, animations, layer superimposition, layer juxtaposition) the cube, despite its propensity for clutter with too many lifelines, offered “one perceptually integrated view in which the story can unfold”, with space and time paths having similar saliency [52], and support for transfer and navigation in the cognitive realm [54].
Delivering the narrative itself via a comic strip convention requires a true 3D environment capable of high-resolution texturing. A virtual environment would not only deliver this, but have assets to get the user immersed in the story. The virtual setting also has advantages with freedom of spatial representation to frame or customize the “readers” experience in ways suggested above (i.e., free exploration). Different psychological experiences are elicited based on the first- or third-person perspective assumed by the reader, a variation easily afforded in spatial representations found in virtual environments, making the latter a suitable vehicle to either shape and experience, or providing the user with the ability to “customize narratives” based on individual preference and context [55]. Digital storytelling through virtual environments (with AI agents as storytellers) is not a new idea [56]. An example in the classroom environment [57] aimed to make the virtual classroom as naturalistic as the real one. Shaw’s “The Legible City” is an example of narrative in a virtual environment, with buildings constructed of 3D text [58].
It is important to note however, that transferring narrative to digital geographic environments is not straightforward. Stories tend to be fragmented in space and time, which poses a challenge for cartographic representation. Breaking the narrative into ‘geographic bits and pieces’, requires issues such as imprecision, multiple scales, and in the case of fictional accounts, a mix of real-world and made-up places, to be managed so that a clear narrative rhythm is maintained. Caquard and Fiset offer cartographic solutions to these challenges [13], also discussed in Section 4. In their cinematic narrative context, location and duration are communicated through proportional symbols and line texture is used to distinguish between physical and ‘projected’ (where the narrative actors are interacting remotely e.g., via a phone call) connections [13]. The time geographic approach put forward here will build on this.
3.2. A Comic Lifeline Strip in a Space-Time Cube
Comic strips in 3D space echo a suggestion for digital comics from McCloud: adjusting the orientation of frames in 3D space to convey a narrative element [20]. In effect this would create an annotated lifeline and would enrich the space-time representation (Figure 3). The practice of collecting personal space-time diaries in support of community GIS (e.g., [59]) is ready for adaptation into the hybrid 3D map. A second example uses time geography to depict the daily path of a Muslim woman before and post 9/11, to illustrate her space-time reaction to anti-Muslim feeling [3]. Finally, the Space-Time Cube has been used to represent troop movements in a battle as part of Napoleon’s campaign on Russia (1812), linked with a commemorative journey to the battle site 200 years later. As well as the unifying space-time structure, STC stations are used to link the two times, and importantly, all movements are annotated by drawings, photos and text to convey a dual narrative [53].
Interactivity must support usability. Every hybrid 3D map, or space-time cube, will look like a typical example of its kind when viewed in its entirety. To interact with the map and its story/place content, the user would zoom in on a line to enter a strip and then align the strip for optimal reading. Simultaneously, the user should be able to remain aware in a peripheral sense of the surrounding features in space or space-time for the map to achieve its hybrid potential. These peripheral features (other strips, map elements) could be de-emphasized, for example by blurring, to avoid a “busy” view for the user.
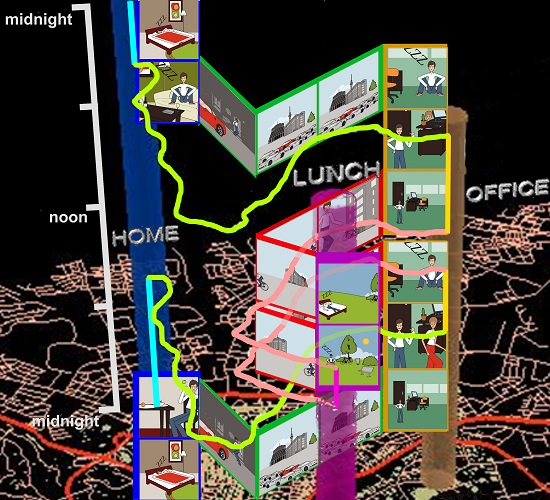
A hybrid map is demonstrated in Figure 3. With time in the upward z-dimension, the colour-coded line is a person’s lifeline in a typical day as they occupy and travel between “stations” (the vertical poles that denote home, office and lunch places). The comic strips (the frames of which are colour coded to match their respective part of the lifeline) are what would be seen if a map user zoomed into the lifeline; the user would be able to follow the lifeline as a story. The frames in the comic strip are aligned to the direction of the lifeline, so that vertical strips are read from bottom to top in the positive time direction. However, more opportunities arise in the horizontal (i.e., journeys), with the home-work commute read from left to right (work-home commute right to left) while the journey to and from lunch combines both directions. The present example is limited by its rendering as static on the page—placing the map in a dynamic (e.g., virtual) environment would afford easier reading from optimal viewpoints.
It is interesting to note that in our example hybrid, time is grounded by the cartographic map and thus progresses upward, rather than downward as would be the case on the comic book page [26,60]. It might be argued that, for the conveyance of narrative, the direction of the time axis should be reversed, lessening the cognitive load in trying to effectively “read backwards” but this would change the relationship between map and comic, perhaps in undesirable ways. Moreover, in the well-formed comic, reading direction will be guided by the structure of the multi-frame network and its interpretation is part of the intellectual activity from which meaning arises.
As a second strategy, the strip could be constrained by area (or geography). For example, the outline of a country enclosing a comic strip can lend an overriding and specific geographic ambience to a narrative more succinctly than is possible with words or other types of image (see similar example with faces from [20], p. 227). Ultimately, these new formulations will require the cartographer to collaborate with the comic (or other) artist. The extra complication may be a barrier to some map makers, though we note that semi-automated comic strips are becoming available on the web (e.g., [61], which formed the strip in Figure 3). These options require little artistic skill on the part of the user, just a script and the choreography for stock characters, props and scenes provided.
3.3. A Photographic Lifeline Strip in a Space-Time Cube
The second case study describes a powerful combination of a 3D space-time map and a journey captured by a sequence of photographs. The photographs are discrete episodic glimpses of events that occur within the journey. Such snapshots might have been arranged sequentially, as in a comic strip, to tell a story. Photograph snapshots also represent a common basis—as the timeslice—for representing geographic phenomena in episodic time in a GIS [62]. It is the intention here to achieve the same effect, but while taking advantage of the freedom afforded by digital representation in (x, y, t) space time (e.g., again, Hägerstrand’s space-time aquarium [48] or Kraak’s space-time cube [53,63]).
In her initiative to engage people and their attitudes towards Muslims post 9/11, Kwan used a space-time cube constructed in the 3D ArcGIS ArcScene [3]. The narrative of a Muslim woman is provided through a colour-coded lifeline path, features mentioned in her account, a coloured surface (for example, red immediately post-9/11) as well as 3D background data such as buildings, city blocks, and streets. The GeoTime tool places the space-time cube into a visual analytics context, with initial space-time pattern finding; visual highlighting of the pattern with an expressive graphic before; the authoring of narratives based on the discovered pattern. In addition to lifelines there are “representations for the base elements of a story: events, people, objects, places and relationships”, with annotations stored with any graphical object. Although they make reference to snapshots, it refers more to visualization stats rather than frames in a graphical narrative [64]. Finally, purely time-based (i.e., not spatial) narrative tools are also available [65,66].
The lifting of analogue constraints manifests itself in not having to fit within a physical page and enabling interactivity (regarding the strip as a succession of photos in comic strip style). The comic art form has been described as “the artists map of time itself” [20]. This is the theoretical basis for embedding a comic strip in a space-time map: to move along the strip in linear narrative along the time line of the story is to also move along the time axis of the map. There is a natural affinity between the two representations, enabling their meshing together.
3.3.1. Context
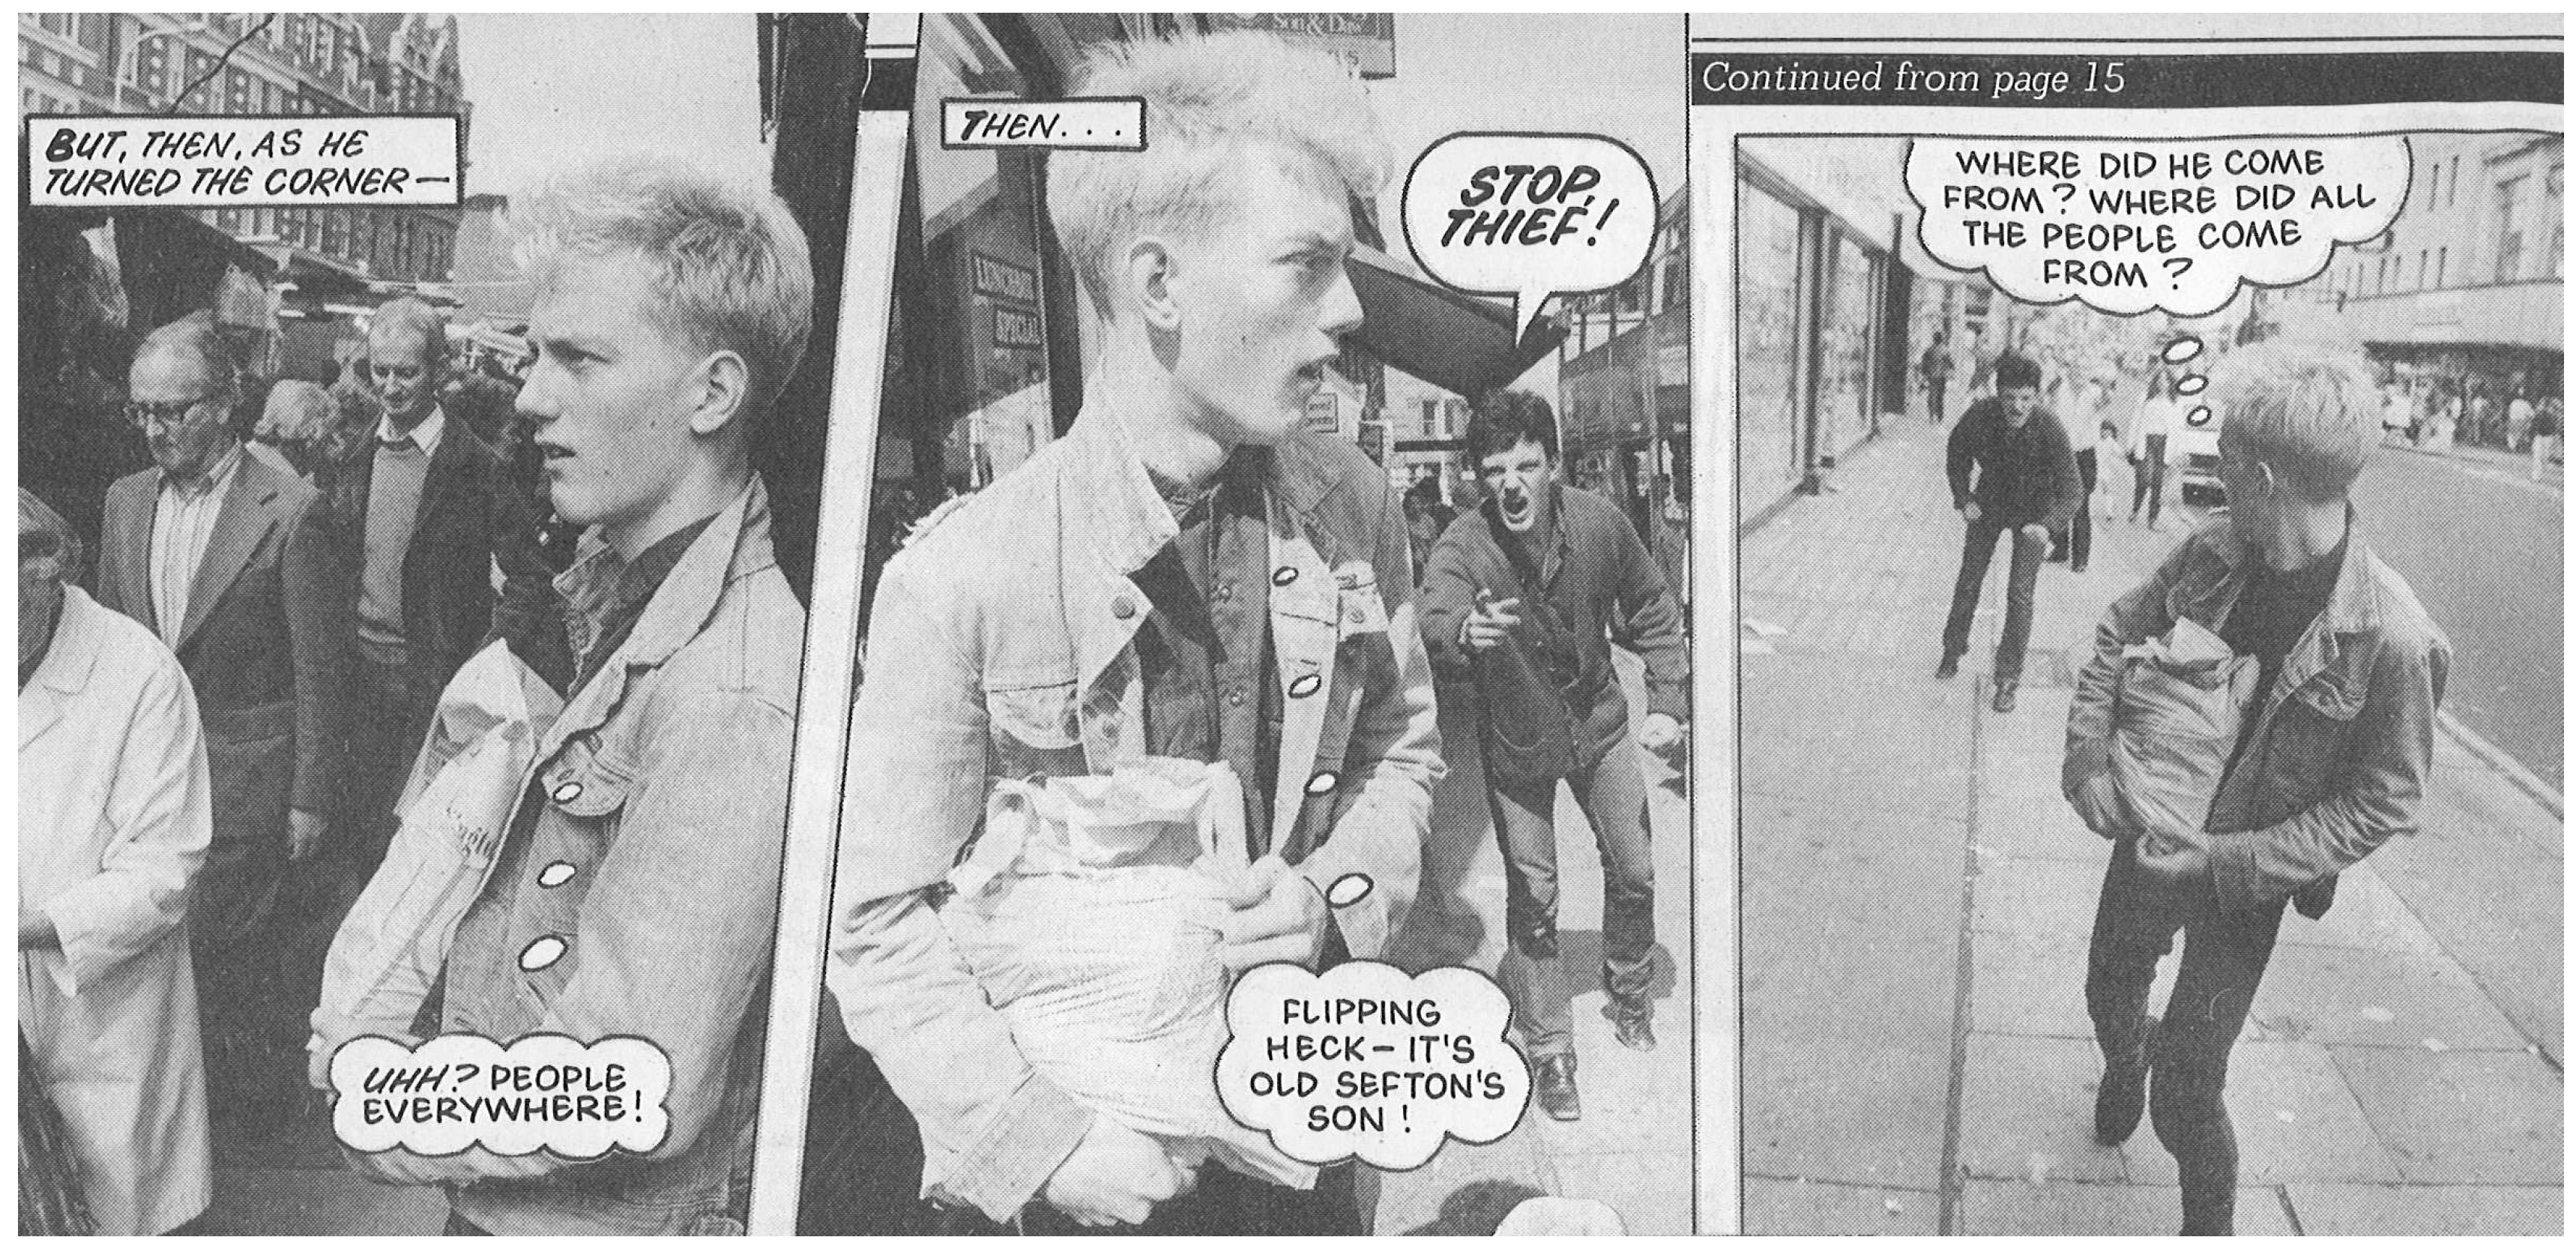
Photographs may be viewed as having less expressive potential than comic strip art. Eisner [29], for example, argued that the advantage of non-fiction (instructional) comics over “rigid” photographs is the license to exaggerate to make a point quickly and directly. However, using photographs potentially makes hybrid map/art expression accessible to those not gifted in art. Photo comic strips have been attempted in the popular media (e.g., Figure 4). This approach is in line with Web 2.0 and grassroots technology (democracy) widening access to and relevance of this form of expression. Other art forms explored in the context of cartography include cinema [67] and theatre [35]. Even when photographs are used, the display technique demonstrated in this paper would harness the inherent accessibility of comic strips and present a powerful alternative viewpoint on the world to display alongside maps (i.e., expressively revealing aspects of the geographic world that conventional maps do not).
3.3.2. Approach and Methods
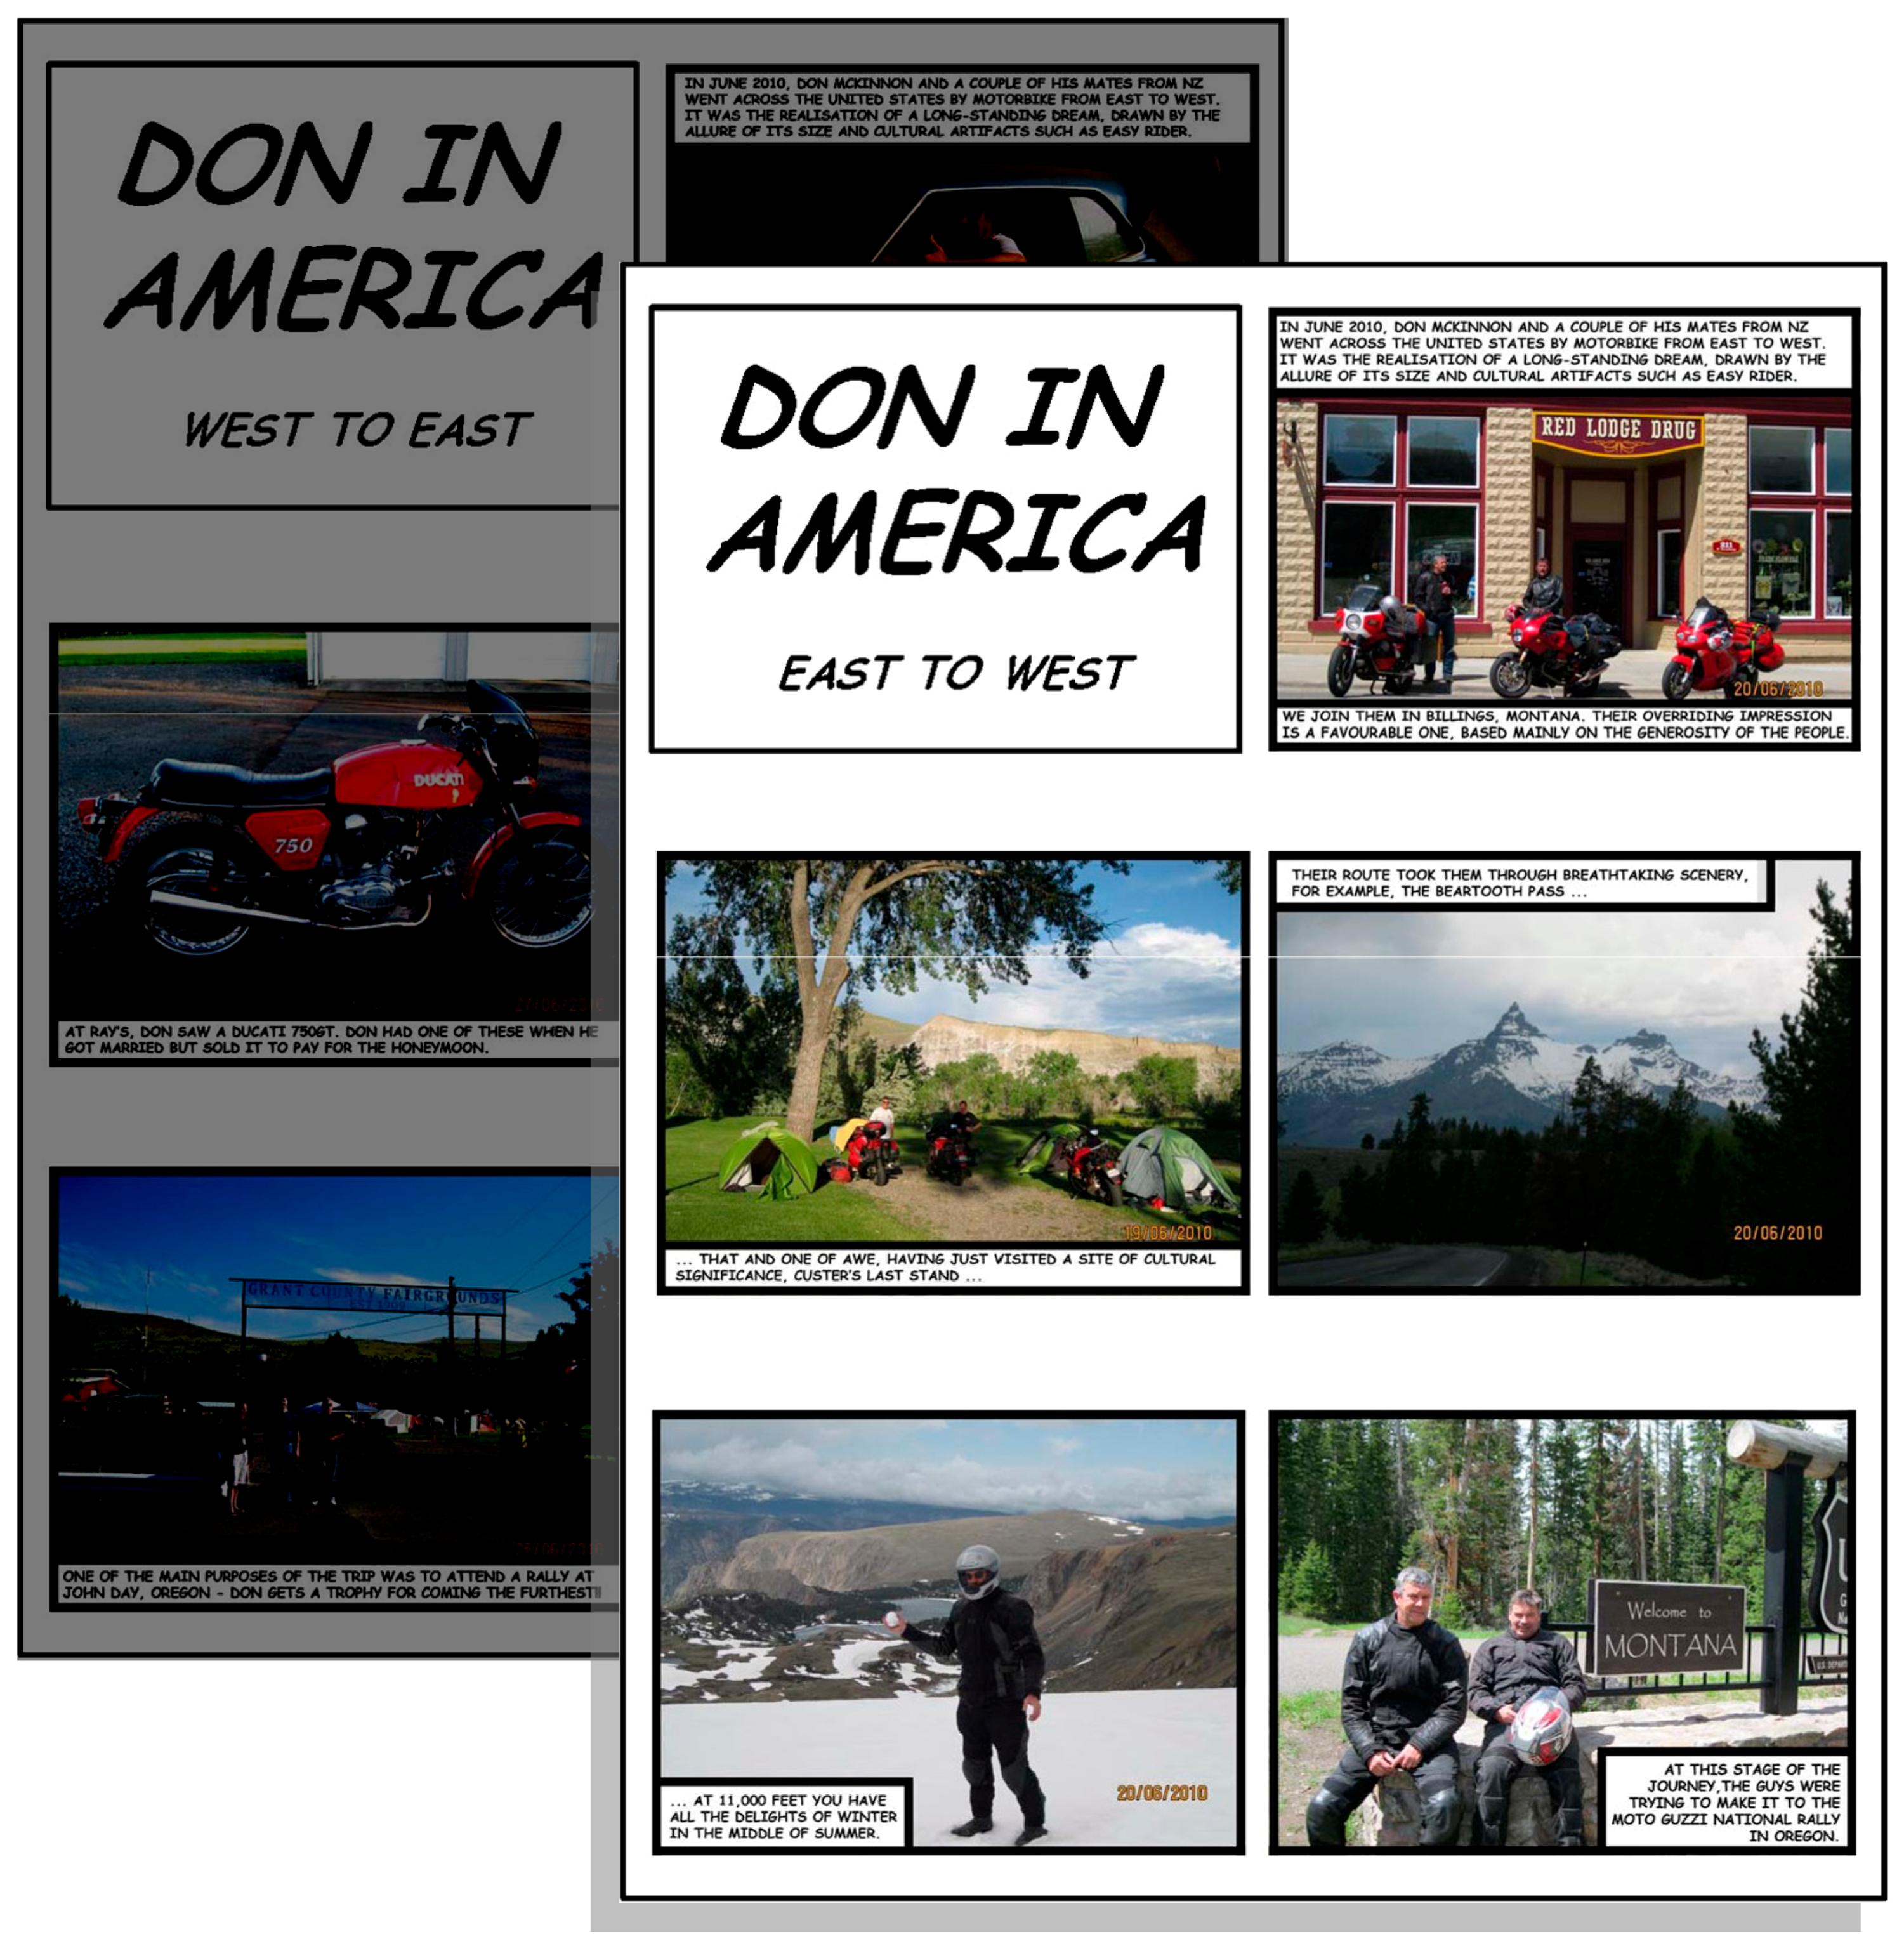
The aim of the hybrid representation is to depict two views of a journey (by motorbike across the USA). One is measured and scientific, the output of the GPS unit on the bike. The other is a qualitative record of the journey, the photographs that are part and parcel of our lives and are particularly valuable in commemorating significant occasions, such as this journey is (arranged as a photo strip in Figure 5).
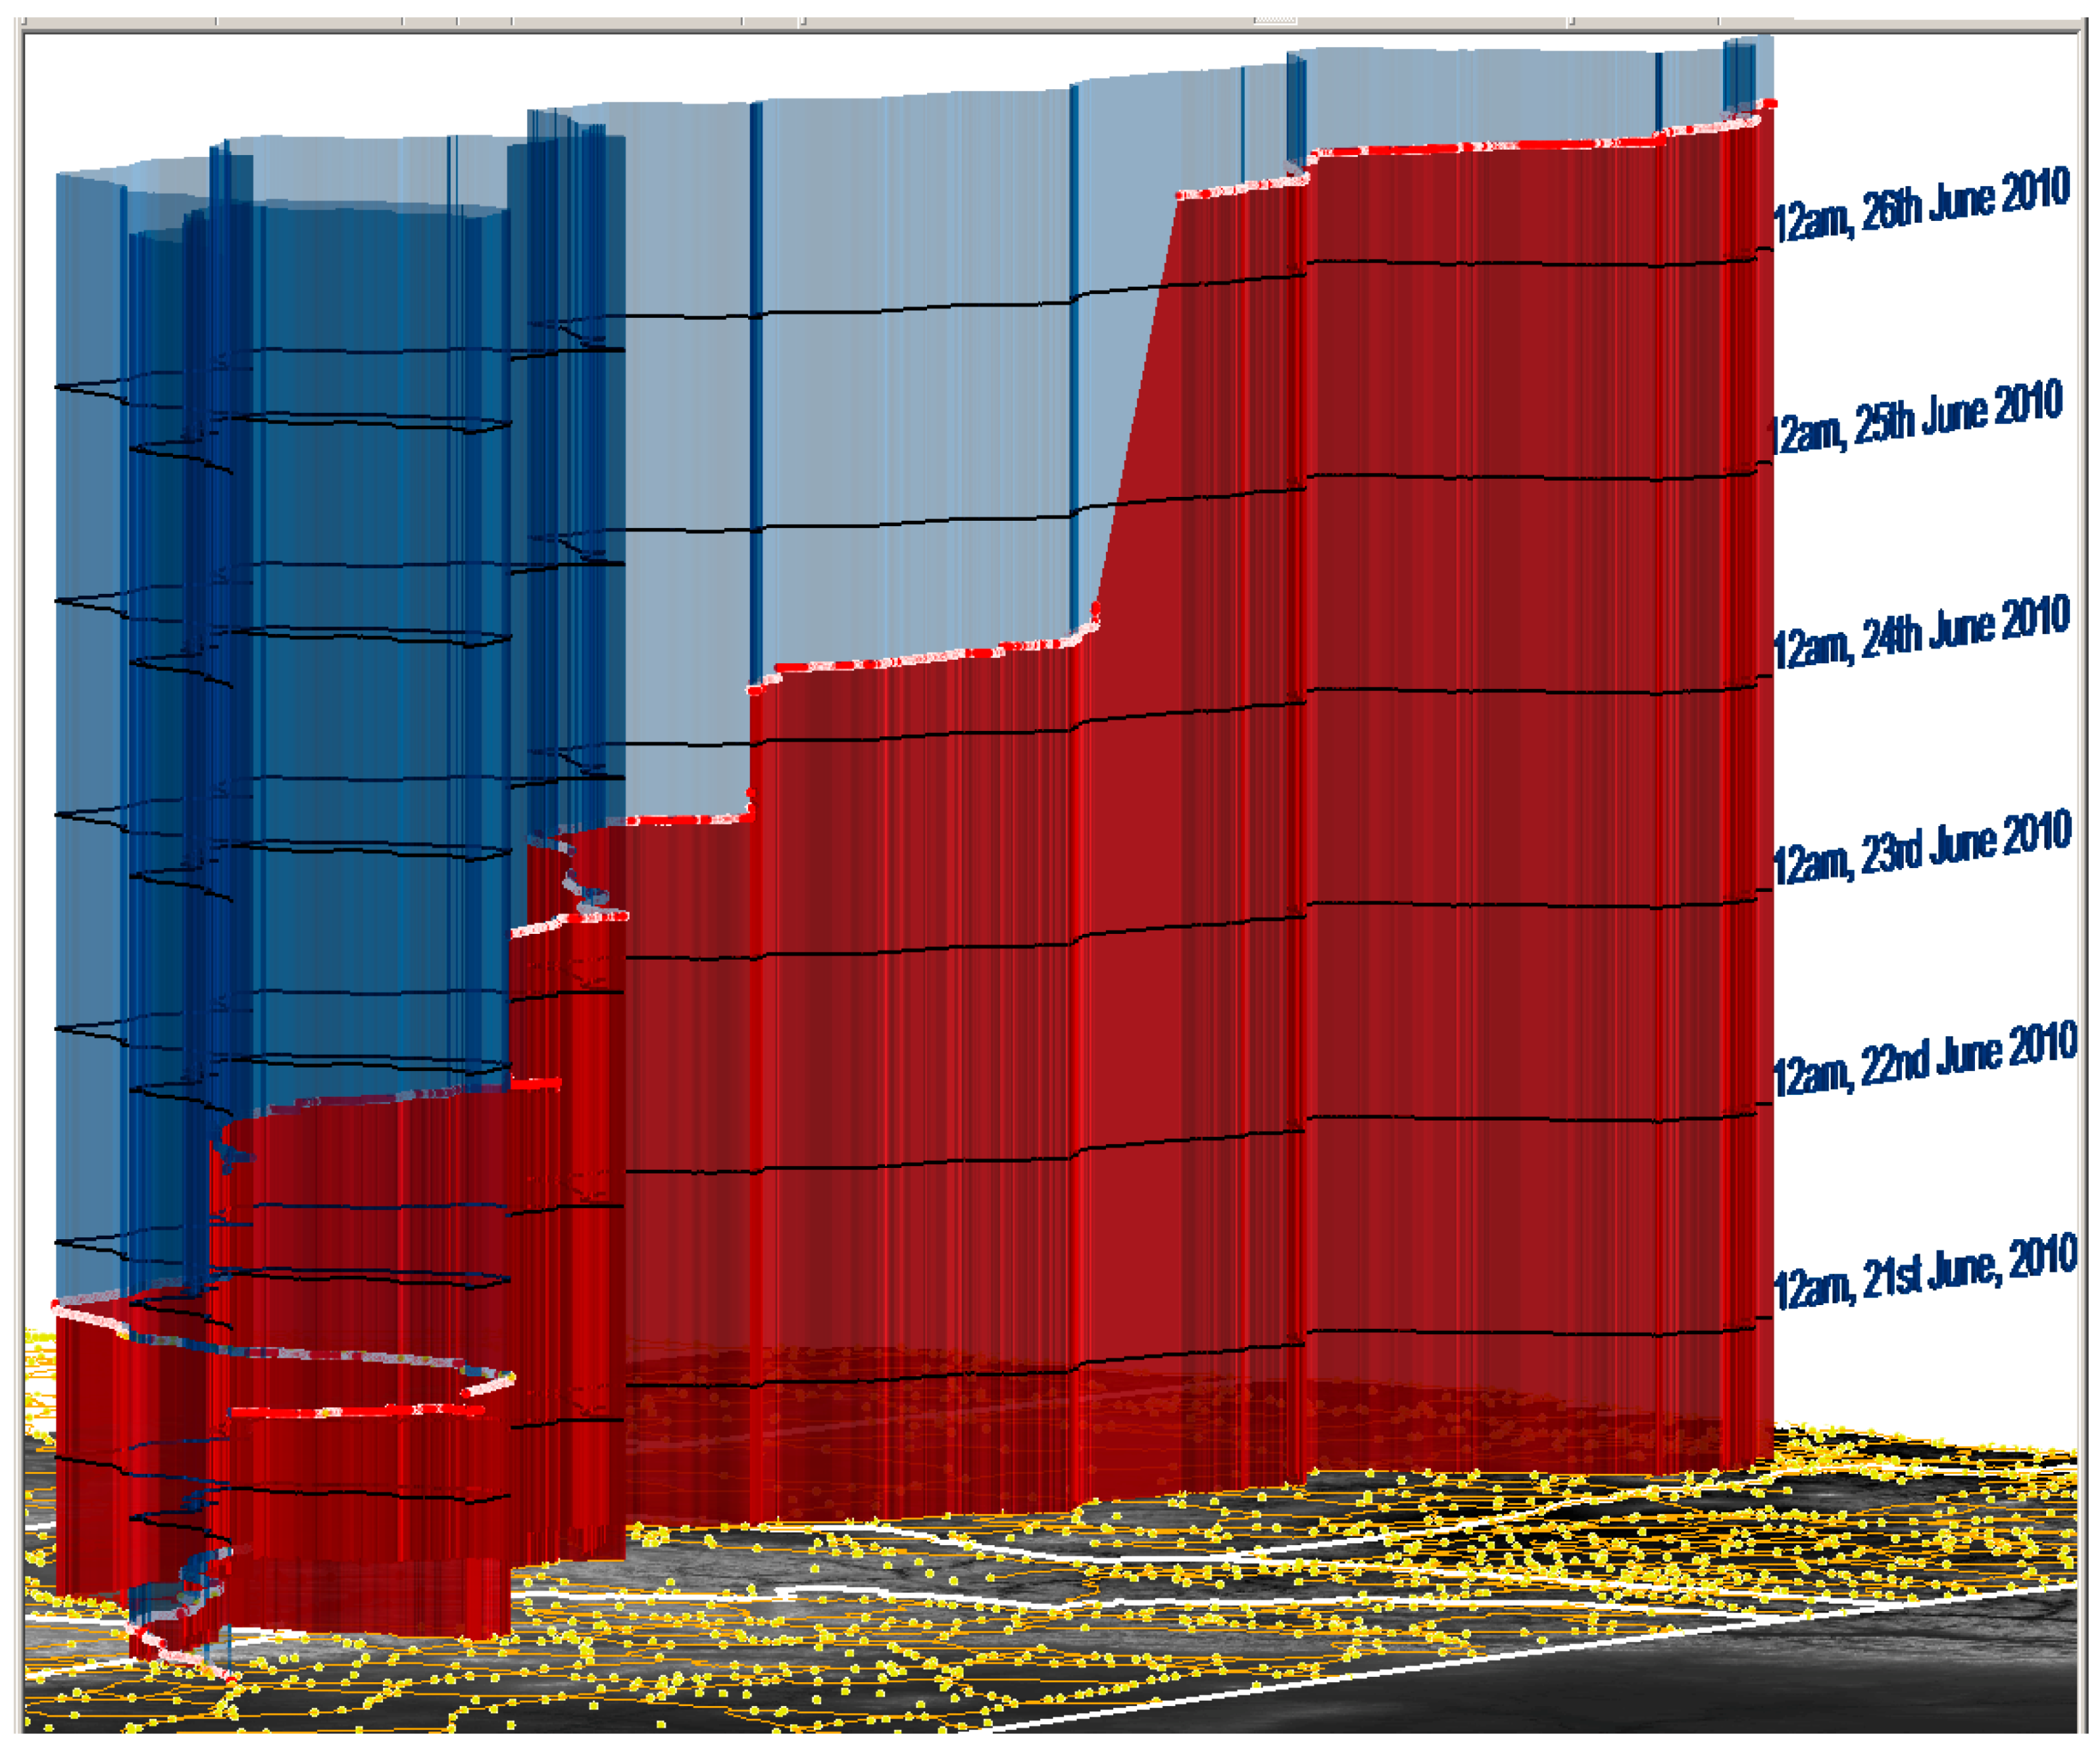
The GPS data was downloaded using DNR Garmin into Esri ArcGIS. The track data was generalised and converted into a 3D line with the Z field being linked to time. Within the ArcScene module this enabled an (x, y, t) view, with the lifeline formed extruded to the base (x, y) plane, forming a “curtain”. This avoids the viewer relying too much on a suspended lifeline in 3D space, by anchoring it to the ground [59]—as shown in Figure 6.
The (x, y, t) curtain was exported as a 3D scene (VRML97 format) and edited in Blender, a 3D modelling package. The editing step converted the 3D map into a sculpted primitive and mapped photographs from the road trip onto the primitive. The last stage in the process is the importing of the 3D map into a desktop virtual reality environment, where users are able (via avatars) to follow the road trip narrative in comic strip photo form, as plotted in (x, y, t) space. OpenSimulator was the virtual environment (VE) used for our experiment, a free emulation of the popular Second Life (which has been used to implement a classroom-based storytelling environment [57]). The underlying terrain was derived from GTopo30 data. The Continental USA has been scaled to fit on an OpenSim tile, with height exaggeration to make topography discernible through the avatar. This dual use of the vertical axis in the STC, conveying both time and height has been shown to be effective [53], as each occur at a different scale of viewing (z-as-time occurs at the general overview level, while z-as-height is only applicable when specifically viewing the terrain at the bottom of the map). An initial modified terrain was used to guide placement of the 3D sculpted primitives.
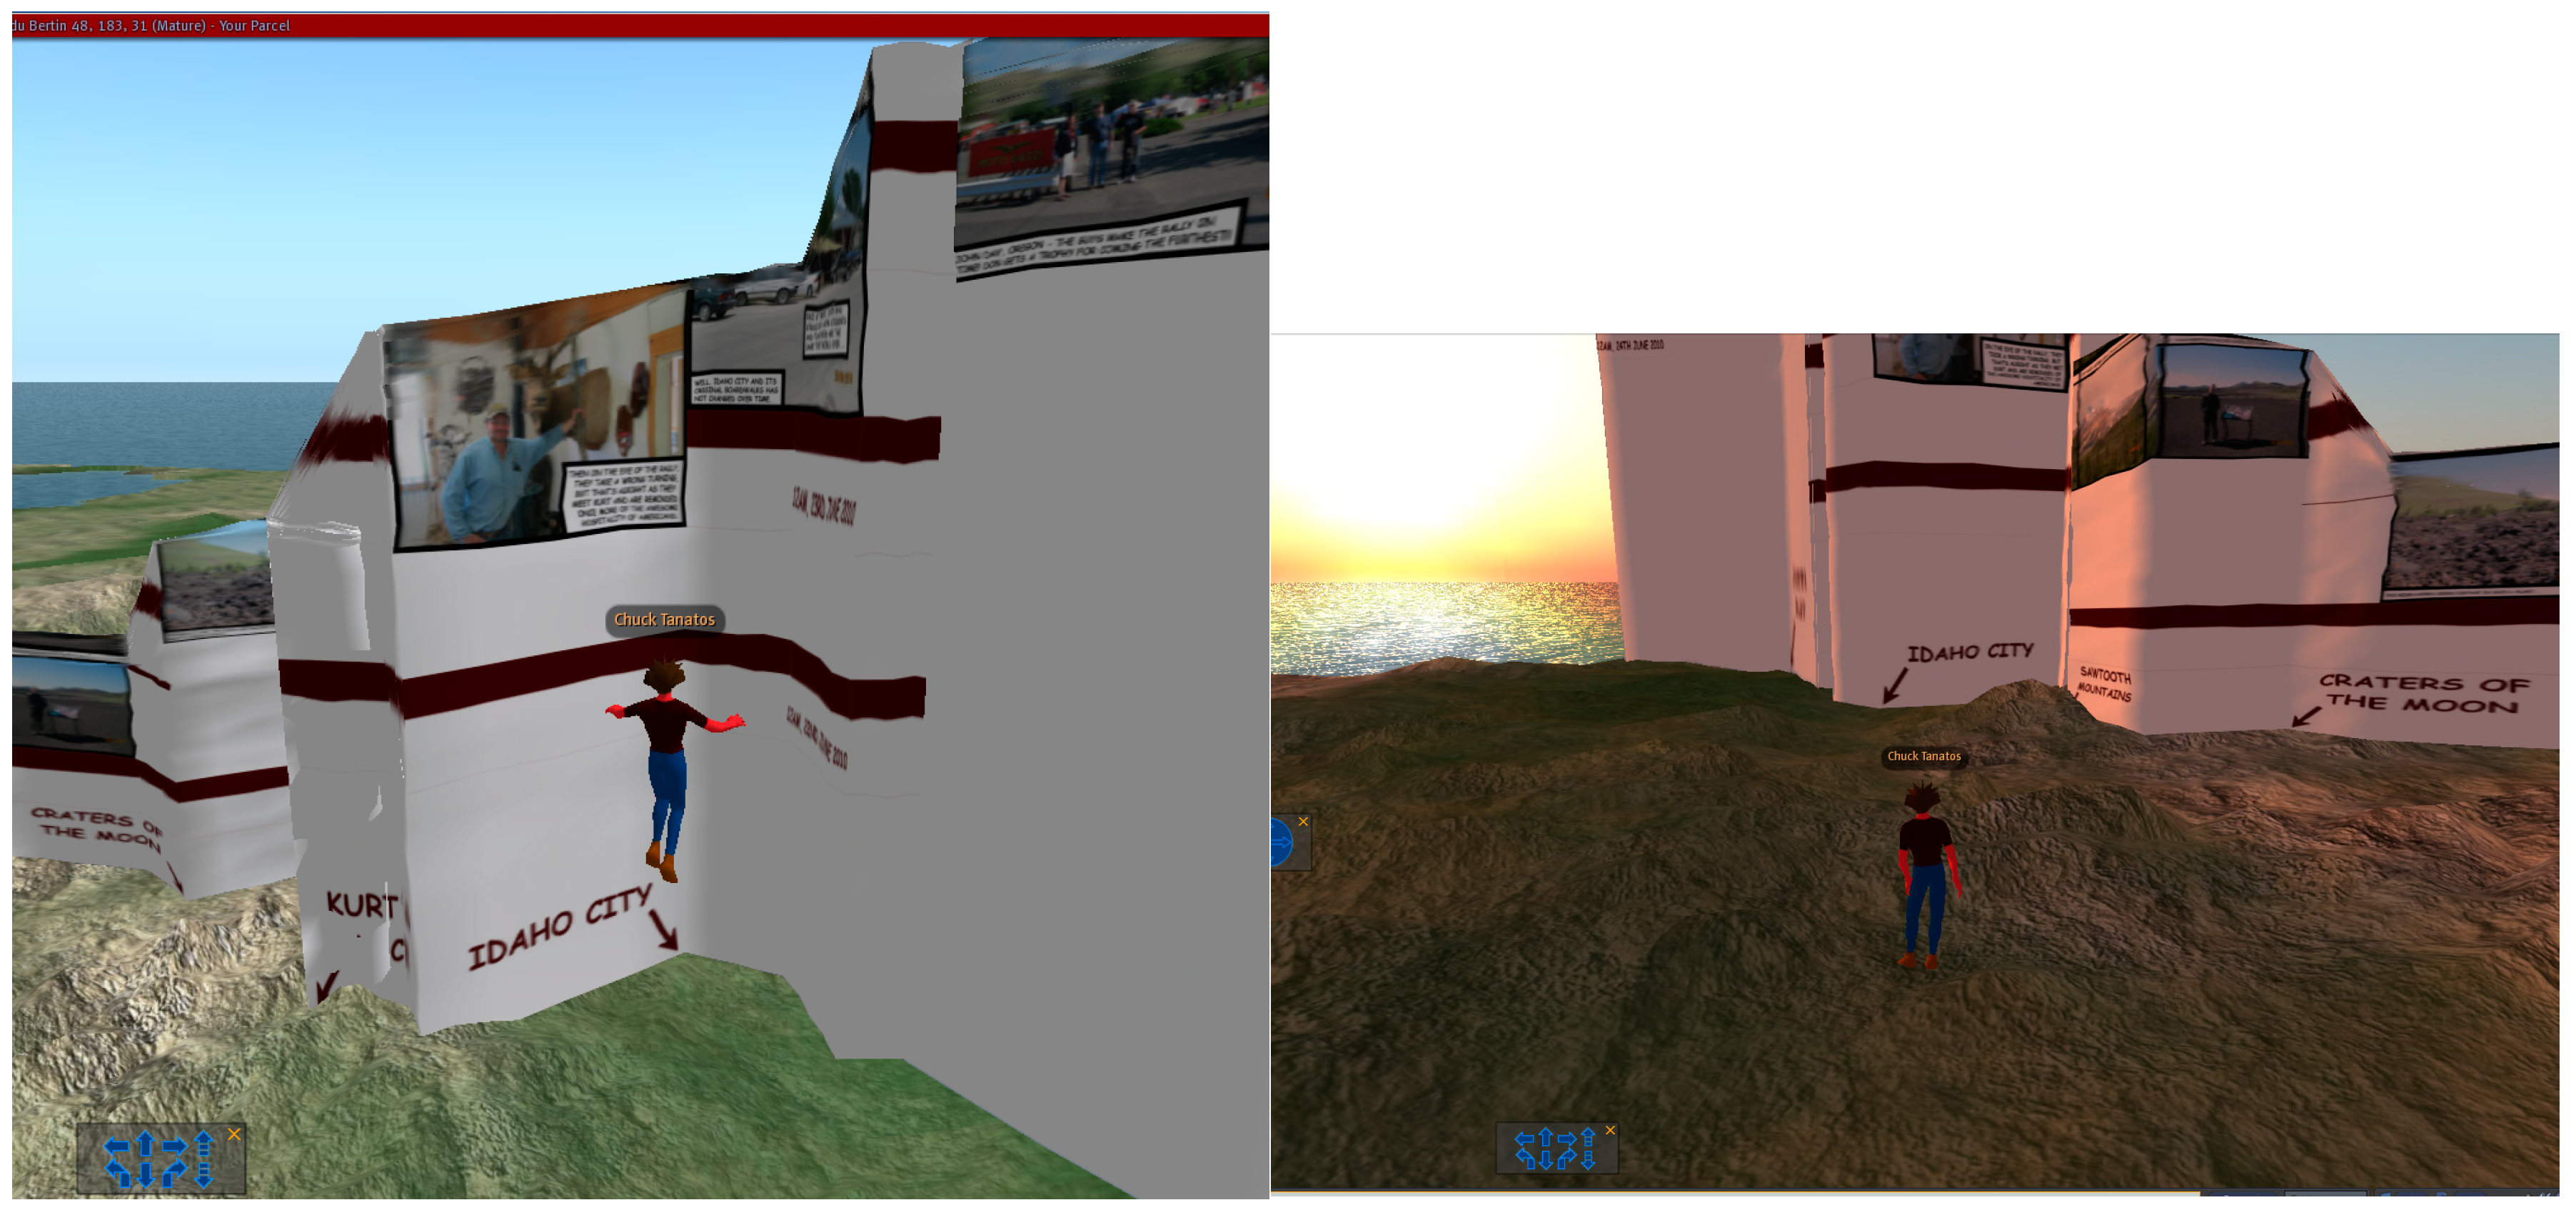
The resulting hybrid map allows the exploration of inter-relations between both representations by the avatar (Figure 7). The 3D nature of the geographically situated narrative means that there is opportunity for the story to be told in reverse—this means that there is something to engage the avatar, whichever way they approach the space-time curtain.
Although the representation as developed here is only suited to specific events with space-time data, the digital implementation naturally facilitates more complex functionality, such as zooming to specific areas of activity on a timeline with predominant inactivity, for example, if only vacations were depicted. Although the 3D virtual environment currently allows interactive zooming, driven by the avatar, there are no facilities for provision of greater amounts of detail once you are close up to the object. Increasingly, we are likely to deal with situations with too much data to be comfortably shown with the featured visualization method, even at the smallest scale, due to people having the means to collect data about their space-time behaviour on a daily basis. In these cases, the ability to generalize the data should be built in, perhaps coordinated with the multi-scale structure implied by zooming into greater levels of detail.
4. Discussion
In this presentation of a comic strip situated in 3D (x, y, t) space, we have tried to address the traditional map’s storytelling limitations [43]. Much of the guidance so far for packaging stories geographically has come from cinema [13], where the storyboard planning tool packages narrative into discrete scenes [7] with directorial meaning. At the other end of production, the film strip presents a complete story, but the content of each individual frame is fleeting [28]. We can also look to the comic strip, in which individual frames persist among collected series of frames that together create narrative meaning.
Monmonier [35] appropriated the language of the theatre for authoring graphic scripts, with the cartographer as playwright or screenwriter writing “stage plays” employing variables as “characters”, signified by hue, and dramatic pacing. He uses a narration metaphor in a “how to …” script for analysing historical trends relating to spatiotemporal change in a single variable. In the short graphic sequences produced, supporting text is an essential component; this mix of graphics and words is comic-like. As in comics, there is also an imperative to hold the user’s attention. Caquard and Wright [67] argue for drawing from self-reflexive instances in cinema—i.e., where the narrative flow of the film has been broken intentionally through devices such as addressing the audience directly or laying bare the film-making process—in the cartographic process. In addition to the suggested methods of achieving this (e.g., montage, sound) the comic medium would be a good vehicle to achieve self-reflexivity by involving both the map and its maker in the display.
Moreover, the comic shares the dramatic arts’ ability to convey tension through its visual language, as exemplified in Figure 8, contributing to an ability of engaging emotions in the reader. Part of the emotional content is uncertainty, doubts and fear—in short: the pathos of our narrative. Beyond the opportunity to refine contemporary conventions of narrative representation, the use of cartography enables a novel form of mapping this component of narrative communication. By affording the representation of “what ifs”, maps can emphasize the impact of “choice” by outlining alternative branches and pathways that emerge during protagonists’ passage along their lifelines. This is in line with Simon’s account on bounded rationality, who likened the structure found in the physical environment as a means to compensate for the short-comings in human reasoning abilities [68]. Following this analogy, the use of a spatial environment affords a substantiated disambiguation/disentanglement of the choices along the lifeline, the unknown consequences of which feature in narratives as emotions of confusion and uncertainty.
Through the upward direction of the time axis, time geography dictates that we read the located comic strip from the bottom up. This goes against the common experience of reading from top to bottom, and in the case of western tests like the present volume, in a top-down, left-right “Z-path” [26,60]. An experiment run by Cohn [60] offers evidence that some breaking of this order does not adversely affect the reading experience, overall. Interestingly, this result did not always hold for non-comic book readers who are used to the “Z-path” and have less exposure to the varied layouts of the modern comic page. This suggests that a bottom-up reading might be too radical for many readers. A reversal of the time axis for time geographic narratives would enable top-down reading (easily visualized through the near-symmetry of Figure 3), though the horizontal (i.e., journey-based) reading would remain structured by geography and would be as complicated as the route taken is (being part of a sequential strip will help here).
As if single-lifeline representation issues were not enough, the featured technique will have further challenges to overcome when addressing complicated stories. This would manifest itself as bundles of lifelines in Time Geography, which could be used to tackle 4 stories (as an example of the number of stories that could be comfortably viewed in 3D) at the same place at the same time. A possible visual solution to this is use of translucency or transparency if any narrative occludes the one you want to follow. An alternative pathway is to exploit the affordances of the environment, e.g., by dynamically shifting the “camera” perspective onto the story of interest, likening the participatory customization found in modern multi-angle cinematography. Priority could be decided by story order in a linear narrative. For bundles of people, it may make sense to them collectively in one strip if they are interacting with each other in a given place (in Time Geography, station) or on the move. There may be situations for character(s) to branch off into their own strip if they become significant on their own/as a smaller group in the narrative.
The unevenness of narrative across space and time (events occur in clusters with large swaths of space-time in between where nothing happens) has already been highlighted [13]. A possible solution to this is to transform (i.e., project) space-time to match the story (while still visually conveying the geographic identity of the place featured). In space, this could take the form of a simple mathematical transform such as Hägerstrand’s logarithmic azimuthal projection [69], which may suit a locally focused narrative. By spreading space in the centre with increasing compression toward the edges of the map, the projection captures the spatial life of someone who lives and interacts in and around their settlement, with comparatively little travel beyond that (as originally intended). As a more complex example, a cartogram-based solution was proposed to emphasise a narrative setting, compressing areas where action does not take place [70]. A distortion of time could similarly take place, compressing a timeline to accommodate periods when action does not take place. Distorting space-time can also be used to address the vagueness often found in stories [7].
Space and time can manifest themselves in stories in explicit and implicit ways. We have based our examples on where and when the protagonists have an explicit physical presence, a spatial data-oriented implementation. More subtle expressions are possible, with characters linked across space because they are sharing a phone or video call (another, but different kind of projection) [13]. When adapting spatial locations from non-fictional (e.g., interviews) and fictional (e.g., films) sources, protagonists can mention places in the narrative while physically being somewhere else. They can explicitly or implicitly (inferred from description, context or knowledge of the protagonist) locate themselves or others. These geographic instances could happen in the past, present or future [13]. These pose further challenges for representation in a time geographic narrative: a symbolization system for handing the different types of space-time evidence and potentially having to display to close to the limits of space and time, from a human perspective (the strategies in the previous paragraph may help)—e.g., what would a time geographic narrative of “2001: A Space Odyssey” look like?
The examples featured in this paper take place in a real-world geography, subject to our commonly held system of time. Both examples are underpinned with spatiotemporal data collected by individuals as they pursue work and vacation activities—they can be termed as non-fiction (though the Figure 3 data is real, the comic strip is fictional). With a grounding in, and emphasis on, fiction, the comic strip already has advantages if it was applied to narratively describe fictional space-time worlds. There is a huge wealth of extant comics, superb examples of sequential art and storytelling, waiting to be situated in their fictional geographies (with the caveat that they were originally designed for the printed page, so some elements will be lost with the move from 2D page to 1D strip). In addition, the contents of fictional books and films are available to be similarly mapped [13,45]. A lot of fiction takes place in real-world geography, so in these cases there is a space-time setting to put the story in. However, there is a bottleneck as instead of explicit spatiotemporal data we are now relying on often uncertain or incomplete space-time evidence gleaned from pages [45], comic strips or frames [13] to provide our locations. Imaginary or partially imaginary (e.g., Tintin’s fictional countries of Syldavia or San Theodoros set in an otherwise recognizable world) geographies may offer the least or hardest challenge to adapt. Some stories come with their author-drawn worlds (the fantasy genre lends itself to this), which can be digitized to become the geographic setting for a hybrid comic-map (though georeferencing and scale challenges need to be overcome). These maps are designed to be referenced when a place is referred to in the text—in effect creating a comparatively rich geographic resource. With fictional artefacts for which no map exists, we have means to create synthetic worlds, through fractal surfaces [71] and techniques used to spatialize non-spatial data [72,73]. In some ways these “clean slate” worlds afford more freedom to situate narratives in space and time, coming with no real-world or imagined baggage. Finally, fiction, particularly science fiction, can play with space and time itself. For example, teleporting instantaneously from one place to another, being simultaneously in several places, any number of time travel stories and a situation where as well as the geographic world, there are underlying layers of dream spaces, each with time operating at different speeds (the film “Inception” [74]). These all offer challenging (but fun) scenarios for the time geographic narrative.
4.1. Snapshots and Sequential Art
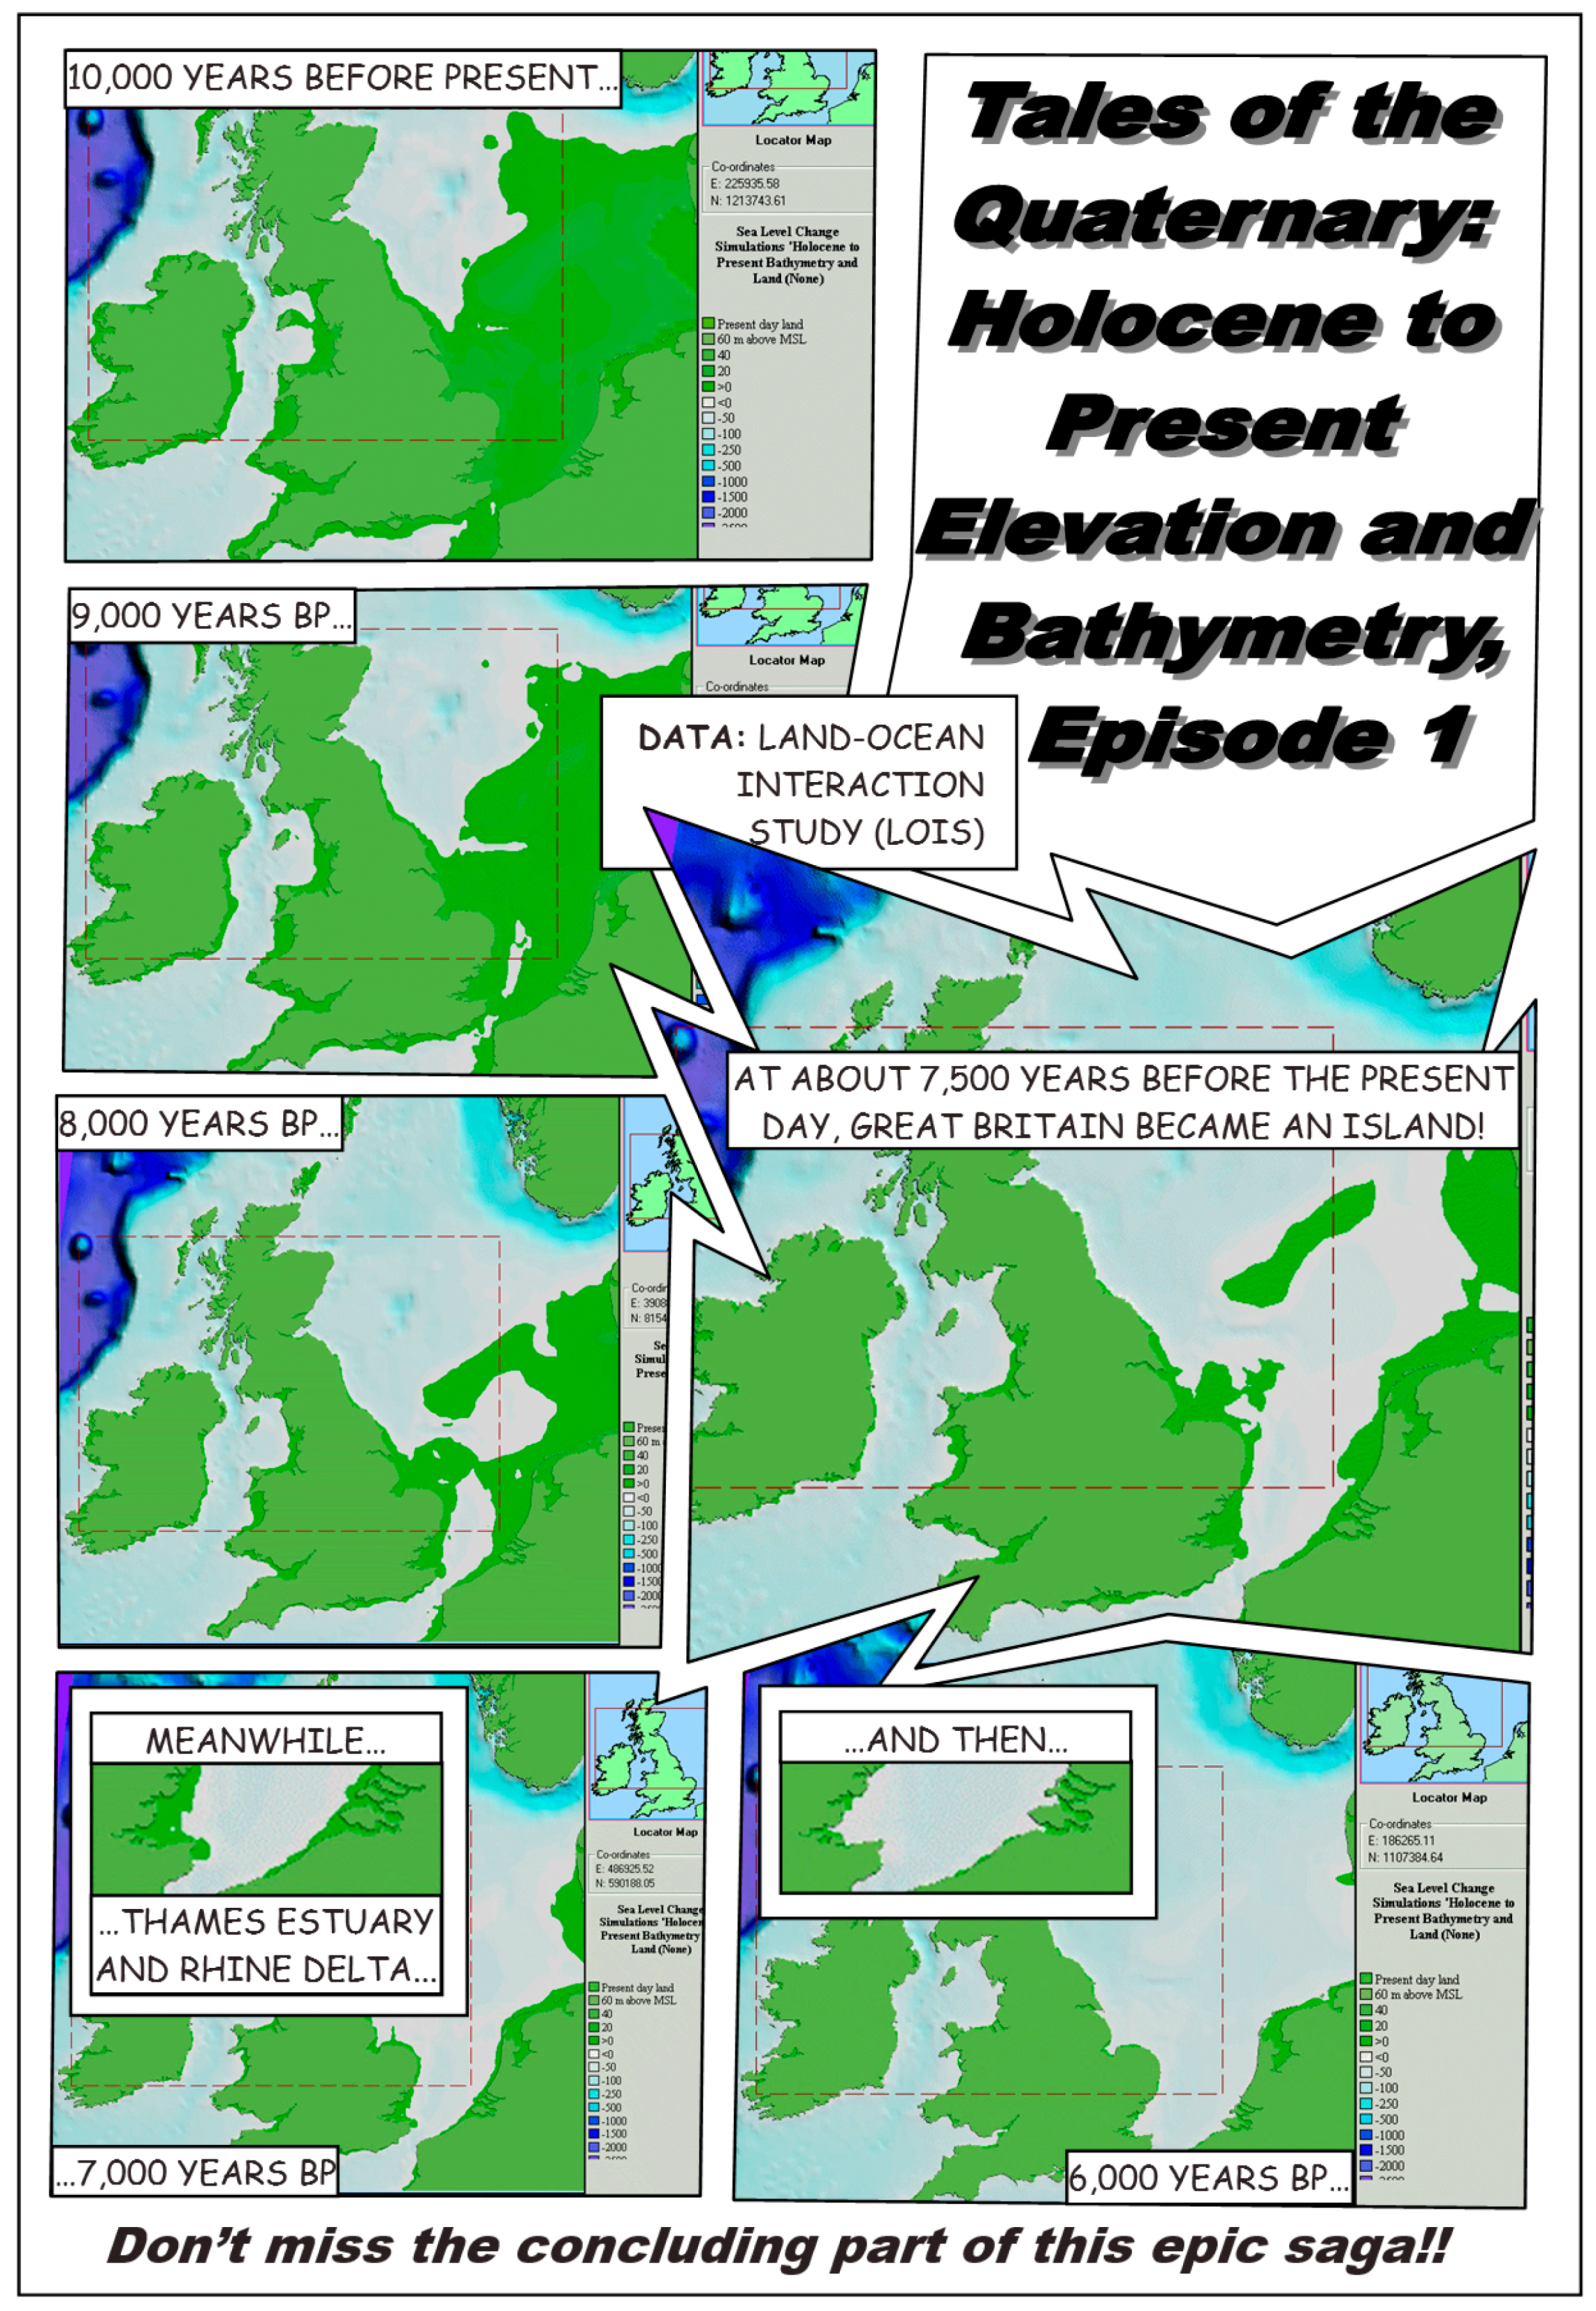
A map is something like a photographic snapshot, fixing the representation of mapped features to a particular moment in time. The GIS conceptualization of the snapshot, as appropriated by cartography, is conceptually close to the frame in a comic strip. To move across a series of frames (the comic ‘map’) is to move in time. So it would be with geographic snapshots if they were arranged on the printed page comic-style. Snapshots, or timeslices, are separate layers representing the same variable at different times when defined in a GIS context [62]. There is a key difference between a panel inside a comic frame and GIS snapshot of an episode of geographic data. The comic panel is carefully planned and arranged while the geographic snapshot occurs wherever and whenever the data happens to have been produced. The time represented by the data may not be an optimal time relative to the story of whatever attribute is being depicted. Figure 8 is an example of snapshots of a sea level rise model of NW Europe covering the last 10,000 years [75], linked together using rectilinear layout. The images in the panels are from the LOIS Overview CD-ROM [76].
No attempt has been made to render each frame as a purpose-designed map as the action of the comic frame sequence itself will be demonstrated. This is a time sequence in which most of the “action” is between 10,000 and 7000 years before present. (The second episode is not promising!). An extra frame has been inserted, relative to the typical frame rate of every 1000 years, around the time of most rapid coastline change (and the time when Great Britain became an island with sea level rise), 7500 years before present. This is to maximise interest in the sequence, by prolonging the event that is the most interesting. However, true comic style would end the episode on a cliffhanger (probably at around 8000 years b.p.). As it is, exclamatory language has been used to inject a bit of excitement into the proceedings.
A change of scale might also be used to enliven the frame sequence where the coastline moves relatively little. A comic frame inset, not obscuring any area where significant change is occurring (spatial closure is in play) could be used to create a zoom effect into a specific area. Its place within the larger frame, which remains constant, is like Eisner’s meta-panels [29]. These two strategies use the visual language of comics to heighten dramatic tension in what would otherwise be a rather dry sequence of maps.
When data is depicted as a series of geospatial snapshots you could argue that a form of temporal closure is happening on the part of the map viewer, otherwise the sense of a continuous timeline could not be established. Closure, from the point of view of the comics panel, is supplied by its frame ([26], p. 40), and the artist has the liberty to depict whatever is required. This may not be possible with geospatial snapshots if, as is often the case, relevant events are not recorded in the data sampling regime. For example, it would be a coincidence if a remotely sensed image captured an earthquake fault line at the moment of rupture. It is more likely that ‘before’ and ‘after’ images may be the snapshots available and that temporal closure would have to occur to complete the story. Recognising the power of the gutter (the blank space) between frames, the cartographer can craft the existing panels to emphasize what is known to have happened but hasn’t been captured by raw geospatial data. For example, using exaggeration or a zoomed in frame (as in Figure 8) can highlight the specific region that will be/has been the focus of activity.
The shape of the frame can be an expressive comic icon [29]. In our map snapshots example (Figure 8), a sensationalist zigzag edge (“explosive action”) draws attention to the main event occurring during the several thousand year timeline. Other strategies include widening the frame to imply a longer duration [25]. Subtler recommendations may be more effective in the map context—considering time relatively, Eisner states that wavy or scalloped panel borders indicate content that happened in the past. Both Eisner and McCloud recommend no borders to convey a “timeless” feel (McCloud also suggests extending the panel space to the edge of the page—“bleeding”—to achieve the same effect), which may be useful if juxtaposed with typical panels that are fixed in time.
4.2. Immersive Virtual Environments and Testing
Contemporary developments of technology enable immersive 3D visualisations through the use of Virtual Reality headsets such as those developed by Oculus (Facebook) and ViVe (HTC). The next stage will have the prototype in OpenSimulator (Figure 7) converted to use Unity (a 3D game engine) to provide a truly immersive experience. The Blender file format can be directly imported into a Unity scene (meshes and textures), and a 3D environment can be reconstructed and rendered for viewing in VR headsets. Importing meshes into Unity can be achieved from two main types of files: .fbx and .obj. However, Unity also supports many proprietary file formats from 3D applications, such as .max from 3D Studio Max and .blend from Blender.
Once implemented, the effect of the Virtual Environment as the delivery mechanism needs to be established. They may be realistically and aesthetically pleasing, but they can be difficult to use, particularly in a problem-solving situation [77]. It is a fundamentally different interface, so in a User Centred Design (UCD) context [77], there is a need to adapt 2D-based design guidelines for 3D. For example, immersive VE users tend to stand as opposed to typical sitting postures [78]. However, in basing this 3D environment on well-tried principles of comic art, we already have a tailored and effective narrative VE. Although usability testing has occurred for a previous instance of data represented as a comic strip [37], this has yet to be tested in a VE context.
5. Conclusions
Principles derived from the art of the comic strip have been applied to cartography with powerful, expressive and dramatic effect. As such, comic art has the potential to form an alternative and compelling viewpoint on the world, complementing maps well. The narrative elements combined with real and imagined environments enrich the experience of both, stimulating a more intimate, in-depth relationship between the reader, the embedded story and emergent places rendered in space-time. The mapped comic is illustrated here, with sequences of panels literally reprojected into the map to create a hybrid 3D time-geography representation.
The other major link between sequential art and cartography—the map in comic form (snapshots and space-time composites captured in frames separated by gutters, has been discussed, though caricaturing and generalization has been ignored in this discussion). Along with further investigation of spatiotemporal hybridisations of maps and comic art, the abstraction link is rich with possibility (and to some extent it has already started with the comic-like principles employed in non-photorealistic rendering, [79]). With the visual imagination that comics have on show, the question is in how far we can “subvert cartographic convention” [17] with comic art as inspiration.
Author Contributions
A.B.M. devised and implemented the VE-based comic/photo strip and drafted most of the initial form of this paper, some of which is drawn from earlier versions presented at the 24th International Cartographic Conference (Santiago, 2009) and 25th International Cartographic Conference (Paris, 2011). M.N. and C.F. contributed ideas and written material on technological aspects including virtual reality and digital gaming. C.H. contributed ideas and written material on comic strips, space, time and narratives, as well as general written edits.
Funding
No source of funding.
Acknowledgments
Thanks to Don McKinnon for the road trip data, photographs and collaboration on the narrative. Thanks to Melanie Middlemiss, who ran the New Zealand Virtual World Grid (OpenSimulator facility).
Conflicts of Interest
The authors declare no conflicts of interest.
References
- Aitken, S.; Craine, J. Guest editorial: Affective geovisualizations. Directions Magazine. 8 February 2006. Available online: http://www.directionsmag.com/articles/guest-editorial-affective-geovisualizations/123211 (accessed on 21 June 2018).
- Dodge, M.; Perkins, C.; Kitchin, R. Mapping modes, methods and moments: A manifesto for map studies. In Rethinking Maps: New Frontiers of Cartographic Theory; Dodge, M., Kitchin, R., Perkins, C., Eds.; Routledge: Abingdon, UK, 2009; pp. 220–243. [Google Scholar]
- Kwan, M.-P. From oral histories to visual narratives: Re-presenting the post-September 11 experiences of the Muslim women in the USA. Soc. Cult. Geogr. 2008, 9, 653–669. [Google Scholar] [CrossRef]
- Nold, C. Emotional Cartography: Technologies of the Self. 2009. Available online: www.emotionalcartography.net (accessed on 21 June 2018).
- Caquard, S.; Cartwright, W. Narrative Cartography: From Mapping Stories to the Narrative of Maps and Mapping. Cartogr. J. 2014, 51, 101–106. [Google Scholar] [CrossRef] [Green Version]
- Tasker, N. Chairman’s message. The Society of Cartographers Newsletter, July 1999; 1. [Google Scholar]
- Caquard, S. Cartography I: Mapping narrative cartography. Prog. Hum. Geogr. 2011, 37, 135–144. [Google Scholar] [CrossRef]
- Amoroso, N. The Exposed City: Mapping the Urban Invisibles; Routledge: New York, NY, USA, 2010. [Google Scholar]
- Cartwright, W. Extending the map metaphor using web-delivered multimedia. Int. J. Geogr. Inf. Sci. 1999, 13, 335–353. [Google Scholar] [CrossRef]
- MacFarlane, R. The Wild Places; Granta Books and Penguin Books: London, UK, 2007. [Google Scholar]
- Cartwright, W.; Field, K. Exploring cartographic storytelling. Reflections on mapping real-life and fictional stories. In Proceedings of the 27th International Cartographic Conference, Rio de Janiero, Brazil, 23–28 August 2015. [Google Scholar]
- Coulis, M. Hermeneut on a bike: Eleven geo-logical lessons in love and landscapes. In Expanding the Boundaries of Cartography: Journeys Beyond the Neatline; Rangel, M.J., Coulis, M.J., Jones, D.L., Eds.; University of Alberta Libraries: Edmonton, AB, Canada, 2010. [Google Scholar]
- Caquard, S.; Fiset, J.-P. How can we map stories? A cybercartographic application for narrative cartography. J. Maps 2014, 10, 18–25. [Google Scholar] [CrossRef]
- Robinson, A.C.; Demsar, U.; Moore, A.B.; Buckley, A.; Jiang, B.; Field, K.; Kraak, M.-J.; Camboim, S.P.; Sluter, C.R. Geospatial big data and cartography: Research challenges and opportunities for making maps that matter. Int. J. Cartogr. 2017, 3 (Suppl. 1), 32–60. [Google Scholar] [CrossRef]
- Casey, E.S. Earth-Mapping: Artists Reshaping Landscape; University of Minnesota Press: Minneapolis, MN, USA, 2005. [Google Scholar]
- Cartwright, W. Art and Cartographic Communication. In Cartography and Art; Cartwright, W., Gartner, G., Lehn, A., Eds.; Springer: Berlin, Germany, 2009; pp. 9–22. [Google Scholar]
- Caquard, S.; Taylor, D.R.F. Art, Maps and Cybercartography: Stimulating Reflexivity among Map-Users. In Cybercartography: Theory and Practice; Taylor, D.R.F., Ed.; Elsevier: Amsterdam, The Netherlands, 2005; pp. 285–307. [Google Scholar]
- Priestnall, G.; Hampson, D. Landscape Visualization: Science and Art. In Geographic Visualization; Dodge, M., McDerby, M., Turner, M., Eds.; John Wiley: New York, NY, USA, 2008; pp. 241–258. [Google Scholar]
- Krygier, J.B. Cartography as an art and a science? Cartogr. J. 1995, 32, 3–10. [Google Scholar] [CrossRef]
- McCloud, S. Reinventing Comics; Harper Collins: New York, NY, USA, 2000. [Google Scholar]
- Cartwright, W. Interactive multimedia for mapping. In Visualisation in Modern Cartography; MacEachren, A., Taylor, D.R.F., Eds.; Academic Press: Oxford, UK, 1994; pp. 63–89. [Google Scholar]
- Dix, A.; Finlay, J.; Abowd, G.D.; Beale, R. Human-Computer Interaction, 3rd ed.; Prentice Hall: Upper Saddle River, NJ, USA, 2004. [Google Scholar]
- Riedl, A. State-of-the-art of tactile hyperglobes. In True-3D in Cartography; Buchroithner, M., Ed.; Springer: Berlin, Germany, 2012; pp. 215–226. [Google Scholar]
- Thöny, M.; Schnürer, R.; Sieber, R.; Hurni, L.; Pajarola, R. Storytelling in Interactive 3D Geographic Visualization Systems. Int. J. Geo-Inf. 2018. [Google Scholar] [CrossRef]
- McCloud, S. Understanding Comics; Harper Collins: New York, NY, USA, 1993. [Google Scholar]
- Groensteen, T. The System of Comics; University Press of Mississippi: Jackson, MS, USA, 2009. [Google Scholar]
- Gershon, N.; Page, W. What Storytelling can do for Information Visualization. Commun. ACM 2001, 44, 31–37. [Google Scholar] [CrossRef]
- Wolk, D. Reading Comics: How Graphic Novels Work and What They Mean; Da Capo Press: Cambridge, MA, USA, 2007. [Google Scholar]
- Eisner, W. Comics and Sequential Art; Poorhouse Press: Tamarac, FL, USA, 1985. [Google Scholar]
- Horrocks, D. Inventing Comics. 2001. Available online: www.hicksville.co.nz/Inventing%20Comics.htm (accessed on 5 May 2018).
- Jones, C. Geographical Information Systems and Computer Cartography; Longman: London, UK, 1997. [Google Scholar]
- Moore, A. Cubes, shadows and comic strips—A.k.a. Interfaces, metaphors and maps? In SIRC 2004: A Spatio-Temporal Workshop, Proceedings of the 16th Annual Colloquium of the Spatial Information Research Centre; Whigham, P.A., McLennan, B.R., Eds.; University of Otago: Dunedin, New Zealand, 2004; pp. 97–102. [Google Scholar]
- Tufte, E. The Visual Display of Quantitative Information, 2nd ed.; Graphics Press: Cheshire, CT, USA, 2001. [Google Scholar]
- Sousanis, N. Unflattening; Harvard University Press: Cambridge, MA, USA, 2015. [Google Scholar]
- Monmonier, M. Authoring Graphic Scripts: Experiences and Principles. Cartogr. Geogr. Inf. Syst. 1991, 19, 247–260, 272. [Google Scholar] [CrossRef]
- Segel, E.; Heer, J. Narrative Visualization: Telling Stories with Data. IEEE Trans. Vis. Comput. Graph. 2010, 16, 1139–1148. [Google Scholar] [CrossRef] [PubMed] [Green Version]
- Zhao, Z.; Marr, R.; Elmqvist, N. Data Comics: Sequential Art for Data-Driven Storytelling; Technical Report; Human Computer Interaction Lab, University of Maryland: College Park, MD, USA, 2015. [Google Scholar]
- Thomas, F.; Johnston, O. Disney Animation: The Illusion of Life; Abbeville Press: New York, NY, USA, 1981. [Google Scholar]
- Horrocks, D. The Perfect Planet: Comics, Games and World-Building. In Writing at the Edge of the Universe: Essays Arising from the “Creative Writing in New Zealand” Conference; Williams, M., Ed.; University of Canterbury Press: Christchurch, New Zealand, 2004; pp. 197–223. [Google Scholar]
- Horrocks, D. ATLAS. 2008. Available online: http://www.hicksville.co.nz/Atlas.htm (accessed on 5 May 2018).
- Van Swaaij, L.; Klare, J. The Atlas of Experience; Bloomsbury: London, UK, 2000. [Google Scholar]
- Marmon Silko, L. Yellow Woman and a Beauty of the Spirit: Essays on Native American Life Today; Interior and Exterior Landscapes: The Pueblo Migration Stories; Simon and Schuster: New York, NY, USA, 1996; pp. 25–47. [Google Scholar]
- Moore, S.A.; Roth, R.E.; Rosenfeld, H.; Nost, E.; Vincent, K.; Arefin, M.R.; Buckingham, T.M.A. Undisciplining environmental justice research with visual storytelling. GeoForum 2017. [Google Scholar] [CrossRef]
- Cheshire, J.; Uberti, O. Where the Animals Go; Norton: New York, NY, USA, 2017. [Google Scholar]
- Reuschel, A.; Hurni, L. Mapping Literature: Visualisation of Spatial Uncertainty in Fiction. Cartogr. J. 2011, 48, 293–308. [Google Scholar] [CrossRef] [Green Version]
- Paelke, V.; Elias, B. Stories as Route Descriptions. In Spatial Information Theory–COSIT 2007; Winter, S., Duckham, M., Kulik, L., Kuipers, B., Eds.; Lecture Notes in Computer Science 4736; Springer: Berlin, Germany, 2007; pp. 255–267. [Google Scholar]
- Rich, C.; Waters, R.C.; Strohecker, C.; Schabes, Y.; Freeman, W.T.; Torrance, M.C.; Golding, A.R.; Roth, M. Demonstration of an Interactive Multimedia Environment. Computer 1994, 27, 15–22. [Google Scholar] [CrossRef]
- Hägerstrand, T. What about people in spatial science? Pap. Reg. Sci. Assoc. 1970, 24, 7–21. [Google Scholar] [CrossRef]
- Cron, J.; Wiesmann, S.; Hurni, L. Facilitating the Handling of Interactive Atlases by Dynamic Grouping of Functions–The Example of “Smart Legend”. In Geospatial Vision: New Dimensions in Cartography; Moore, A., Drecki, I., Eds.; Springer: Berlin, Germany, 2008; pp. 1–18. [Google Scholar]
- Platt, C. Interactive Entertainment. WIRED 1995, 3, 9. [Google Scholar]
- Roth, R.E.; Ross, K.S.; MacEachren, A.M. User-Centred Design for Interactive Maps: A Case Study in Crime Analysis. Int. J. Geo-Inf. 2015, 4, 262–301. [Google Scholar] [CrossRef]
- Mayr, E.; Windhager, F. Once upon a Spacetime: Visual Storytelling in Cognitive and Geotemporal Information Spaces. Int. J. Geo-Inf. 2018. [Google Scholar] [CrossRef]
- Kraak, M.J.; Kveladze, I. Narrative of the annotated Space—Time Cube—Revisiting a historical event. J. Maps 2017, 13, 56–61. [Google Scholar] [CrossRef]
- Bach, B.; Dragicevic, P.; Archambault, D.; Hurter, C.; Carpendale, S.A. Descriptive Framework for Temporal Data Visualizations Based on Generalized Space-Time Cubes. Comput. Graph. Forum 2016, 36, 36–61. [Google Scholar] [CrossRef]
- Hartung, F.; Burke, M.; Hagoort, P.; Willems, R.M. Taking perspective: Personal pronouns affect experiential aspects of literary reading. PLoS ONE 2016, 11, e0154732. [Google Scholar] [CrossRef] [PubMed] [Green Version]
- Spierling, U. Digital storytelling. Comput. Graph. 2002, 26, 1–2. [Google Scholar] [CrossRef]
- Danilicheva, P.; Klimenko, S.; Baturin, Y.; Serebrov, A. Education in Virtual Worlds: Virtual Storytelling. In Proceedings of the International Conference on CyberWorlds, Bradford, UK, 7–11 September 2009; pp. 333–338. [Google Scholar]
- Shaw, J. Legible City, digital dialogues. TEN 1991, 8, 46–47. [Google Scholar]
- Chew, C.Y.; Moore, A.; Chong, A.K. A Strategy for Space-Time Data Collection, Processing and Representation on Complex Transportation Networks. In Proceedings of the GeoCart 2006, Auckland, New Zealand, 4–6 September 2006; Drecki, I., Ed.; University of Auckland: Auckland, New Zealand, 2007; pp. 111–123. [Google Scholar]
- Cohn, N. Navigating comics: An empirical and theoretical approach to strategies of reading comic page layouts. Front. Psychol. 2013, 4, 186. [Google Scholar] [CrossRef] [PubMed]
- Pixton, T.M. PixtonTM—Comic Strip Creator—Make Your Own Web Comics Online. 2018. Available online: http://pixton.com/uk/ (accessed on 5 May 2018).
- Langran, G. Time in Geographic Information Systems; Taylor and Francis: London, UK, 1992. [Google Scholar]
- Kraak, M. The Space-Time Cube Revisited from a Geovisualisation Perspective. In Proceedings of the 21st International Cartographic Conference (ICC), Durban, South Africa, 10–16 August 2003; pp. 1988–1996. [Google Scholar]
- Eccles, R.; Kapler, T.; Harper, R.; Wright, W. Stories in GeoTime. Inf. Vis. 2008, 7, 3–17. [Google Scholar] [CrossRef]
- Plaisant, C.; Milash, B.; Rose, A.; Widoff, S.; Shneiderman, B. LifeLines: Visualizing personal histories. In Proceedings of the CHI ’96, Vancouver, BC, Canada, 13–18 April 1996; ACM: New York, NY, USA, 1996; pp. 221–227. [Google Scholar]
- Gemmell, J.; Bell, G.; Lueder, R.; Drucker, S.; Wong, C. MyLifeBits: Fulfilling the memex vision. In Proceedings of the ACM Multimedia ’02, Juan-les-Pins, France, 1–6 December 2002; ACM: New York, NY, USA, 2002; pp. 235–238. [Google Scholar]
- Caquard, S.; Wright, B. Challenging the Digital Cartographic Continuity System: Lessons from Cinema. In Cartography and Art; Cartwright, W., Gartner, G., Lehn, A., Eds.; Springer: Berlin, Germany, 2009; pp. 193–206. [Google Scholar]
- Simon, H. Models of Man; Wiley: Hoboken, NJ, USA, 1957. [Google Scholar]
- Hägerstrand, T. Migration and area. In Migration in Sweden, Lund studies in Geography; Series B, Human Geography, No. 13; Department of Geography, University of Lund: Lund, Sweden, 1957; pp. 27–158. [Google Scholar]
- Weber-Reuschel, A.-K.; Piatti, B.; Hurni, L. Data-Driven Expansion of Dense Regions—A Cartographic Approach in Literary Geography. Cartogr. J. 2014, 51, 123–140. [Google Scholar] [CrossRef]
- Laurini, R.; Thompson, D. Fundamentals of Spatial Information Systems; Academic Press: Waltham, MA, USA, 1992. [Google Scholar]
- Fabrikant, S.I. Visualizing region and scale in information spaces. In Proceedings of the 20th International Cartographic Conference (ICC 2001), Beijing, China, 6–10 August 2001; pp. 2522–2529. [Google Scholar]
- Russwurm, M.; Moore, A. “Visualising the project landscape”—A spatialisation describing workload attributes as terrain. Environ. Earth Sci. 2015, 74, 7159–7172. [Google Scholar] [CrossRef]
- Inception Ending. FastCoDesign—2010 Inception Infographic by Daniel Wang. 2010. Available online: http://www.inceptionending.com/theory/2010-inception-infographic-by-daniel-wang/ (accessed on 8 June 2018).
- Shennan, I.; Lambeck, K.; Flather, R.; Horton, B.; McArthur, J.; Innes, J.; Lloyd, J.; Rutherford, M.; Wingfield, R. Modelling western North Sea palaeogeographies and tidal changes during the Holocene. In Holocene Land-Ocean Interaction and Environmental Change around the North Sea; Shennan, I., Andrews, J., Eds.; Geological Society of London Special Publication: London, UK, 2000; pp. 299–319. [Google Scholar]
- Land Ocean Interaction Study (LOIS). LOIS Overview CDROM, version 2.0; Windows, Natural Environment Research Council (NERC): Swindon, UK, 2000. [Google Scholar]
- Gabbard, J.L.; Hix, D.; Swan, J.E. User-centered design and evaluation of virtual environments. IEEE Comput. Graph. Appl. 1999, 19, 51–59. [Google Scholar] [CrossRef]
- Bowman, D.A.; Gabbard, J.L.; Hix, D. A survey of usability evaluation in virtual environments: Classification and comparison of methods. Presence 2002, 11, 404–424. [Google Scholar] [CrossRef]
- Döllner, J. Non-Photorealistic 3D Geovisualization. In Multimedia Cartography, 2nd ed.; Cartwright, W., Peterson, M.P., Gartner, G., Eds.; Springer: Berlin, Germany, 2007; pp. 229–240. [Google Scholar]
Figure 1.
Example tourist attractions itinerary (source: https://www.hakonenavi.jp/english/basics/trip/).
Figure 1.
Example tourist attractions itinerary (source: https://www.hakonenavi.jp/english/basics/trip/).

Figure 2.
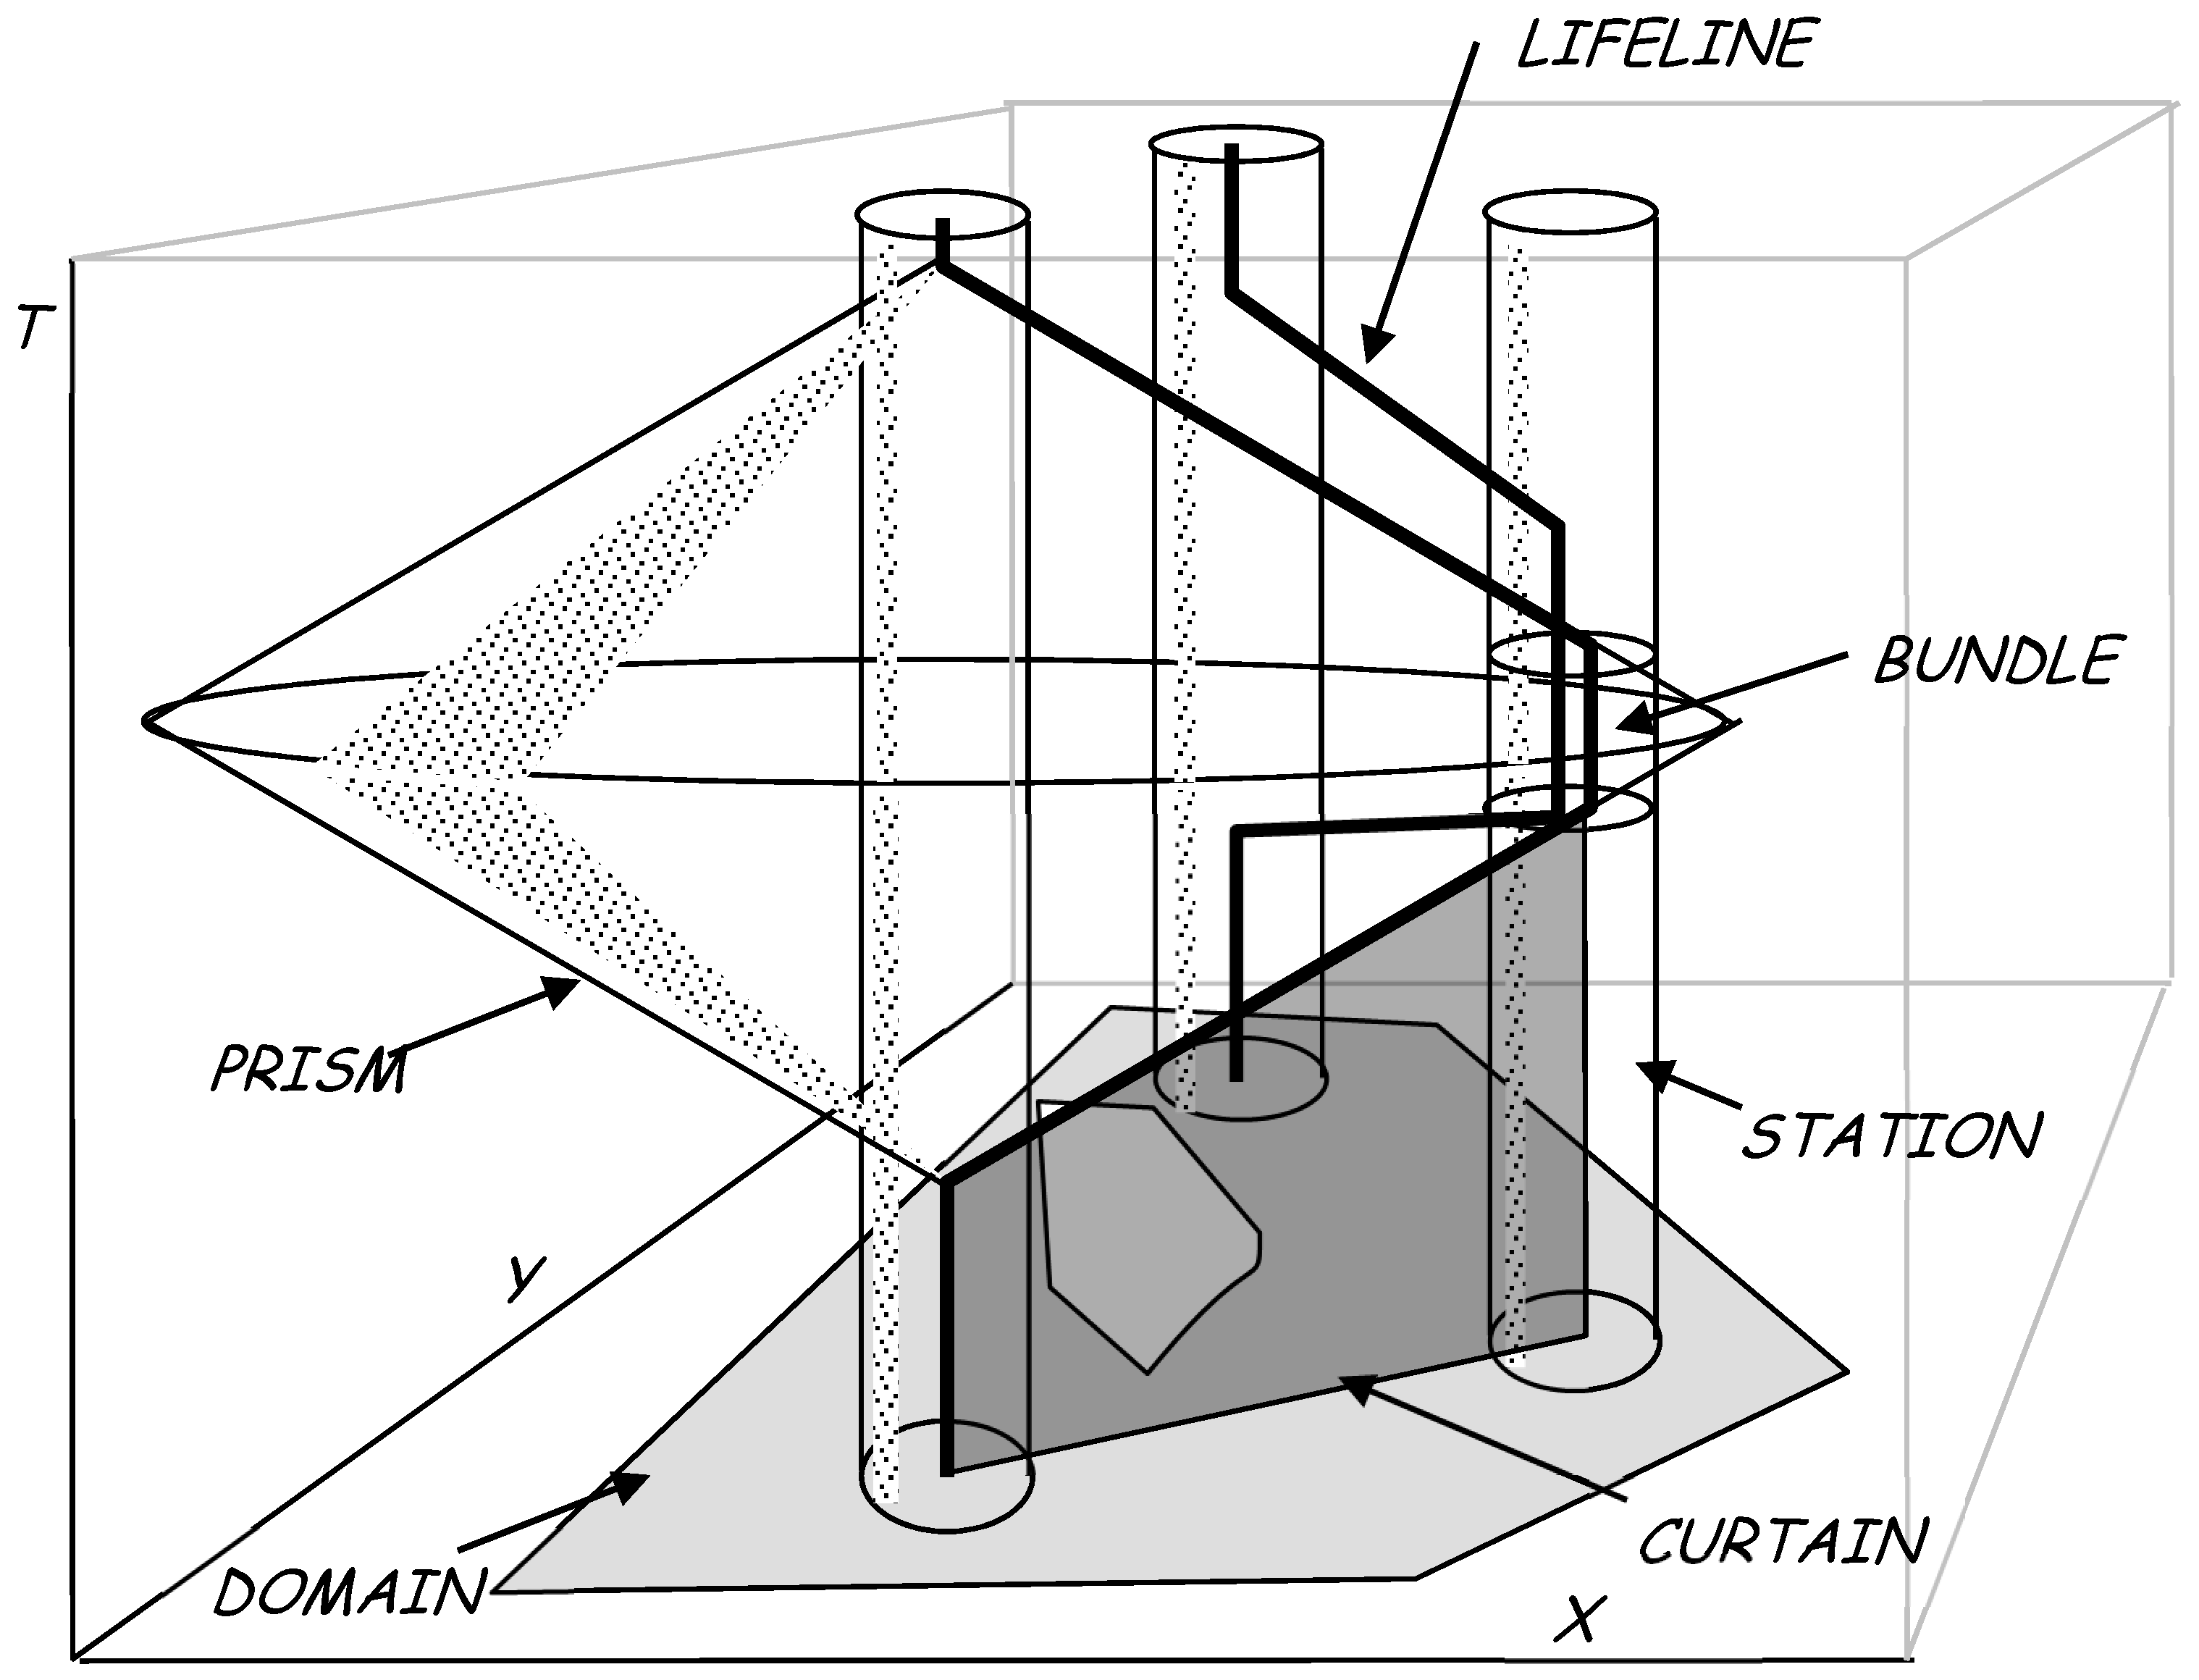
The time geography aquarium, or space-time cube.

Figure 3.
The comic strip embedded in a 3D time geography map (map from [59]).
Figure 3.
The comic strip embedded in a 3D time geography map (map from [59]).

Figure 4.
An example of a photo strip (Eagle, 20 November 1982).

Figure 5.
First page of a photo strip based on holiday photographs, arranged as a two way narrative (enabled by 3D viewing in the space-time environment).
Figure 5.
First page of a photo strip based on holiday photographs, arranged as a two way narrative (enabled by 3D viewing in the space-time environment).

Figure 6.
About a week’s worth of holiday trip shown in a time-geographic environment in ArcGIS ArcScene. View is towards the southwest across the northwest US. The route, depicted as a Red Curtain, is from just east of the Rockies to the Oregon coast.
Figure 6.
About a week’s worth of holiday trip shown in a time-geographic environment in ArcGIS ArcScene. View is towards the southwest across the northwest US. The route, depicted as a Red Curtain, is from just east of the Rockies to the Oregon coast.

Figure 7.
(left) The avatar exploring the situated photo comic strip in OpenSim, in this instance in the direction of the route travelled; (right) The avatar following the reverse direction story, a narrative using the same photos but “looking back” on the trip.
Figure 7.
(left) The avatar exploring the situated photo comic strip in OpenSim, in this instance in the direction of the route travelled; (right) The avatar following the reverse direction story, a narrative using the same photos but “looking back” on the trip.


© 2018 by the authors. Licensee MDPI, Basel, Switzerland. This article is an open access article distributed under the terms and conditions of the Creative Commons Attribution (CC BY) license (http://creativecommons.org/licenses/by/4.0/).
Share and Cite
MDPI and ACS Style
Moore, A.B.; Nowostawski, M.; Frantz, C.; Hulbe, C. Comic Strip Narratives in Time Geography. ISPRS Int. J. Geo-Inf. 2018, 7, 245. https://0-doi-org.brum.beds.ac.uk/10.3390/ijgi7070245
AMA Style
Moore AB, Nowostawski M, Frantz C, Hulbe C. Comic Strip Narratives in Time Geography. ISPRS International Journal of Geo-Information. 2018; 7(7):245. https://0-doi-org.brum.beds.ac.uk/10.3390/ijgi7070245
Chicago/Turabian StyleMoore, Antoni B., Mariusz Nowostawski, Christopher Frantz, and Christina Hulbe. 2018. "Comic Strip Narratives in Time Geography" ISPRS International Journal of Geo-Information 7, no. 7: 245. https://0-doi-org.brum.beds.ac.uk/10.3390/ijgi7070245
Note that from the first issue of 2016, this journal uses article numbers instead of page numbers. See further details here.