Article

Distribution Pattern of Red Fox (Vulpes vulpes) Dens and Spatial Relationships with Sea Turtle Nests, Recreation, and Environmental Characteristics

1
Department of Earth and Ocean Sciences, University of North Carolina Wilmington, Wilmington, NC 28403, USA
2
Department of Environmental Sciences, University of North Carolina Wilmington, Wilmington, NC 28403, USA
3
North Carolina Division of Coastal Management, Wilmington, NC 28409, USA
*
Author to whom correspondence should be addressed.
ISPRS Int. J. Geo-Inf. 2018, 7(7), 247; https://0-doi-org.brum.beds.ac.uk/10.3390/ijgi7070247
Submission received: 21 May 2018 / Revised: 14 June 2018 / Accepted: 19 June 2018 / Published: 23 June 2018

Abstract

:
Although sea turtles are formidable prey as adults, their nests are highly vulnerable to terrestrial predation. Along the Southeastern coast of the United States, a primary predator of sea turtle nests is the red fox (Vulpes vulpes). Examining the relationship between fox populations and nest predation is often difficult due to coastal development. Masonboro Island, North Carolina is an undeveloped, natural, 13-km-long barrier island complex that is a component of the North Carolina National Estuarine Research Reserve (NERR). Masonboro Island consists of beaches, a dune ridge, back barrier flats, an expansive salt marsh, a lagoon, and spoil islands seaward of the Intracoastal Waterway. A field survey, which was conducted each spring from 2009 through 2012, recorded den entrance coordinates based upon recent use by foxes. Sea turtle nests were located using a similar survey methodology, which identifies viable and predated nests as well as false crawls. A series of spatial-temporal pattern analysis techniques were used to identify trends through time. The results indicated that: (1) fox den entrances and predated sea turtle nests were clustered throughout the island (p = 0.01); (2) den entrances in the northern part of the island were closer to the sea turtle nests than other locations on the island; (3) fox den entrances were positively correlated (p = 0.01) with dune height, (4) fox den entrances were located closer to the island boat access sites than expected (p = 0.01). A variety of spatial sensitivity tests were used to test the validity of the statistically significant cluster analyses. A Geographically Weighted Regression model was created to predict the location of fox dens using dune elevation, the distance to predated sea turtle nests, and the distance to boat access sites. The model accounted for 40% of the variance and had a small residual error, which indicates that the independent variables were statistically valid. Results from this project will be used by the NC NERR staff to develop management plans and to further study fox-related impacts on the island. For example, given the higher density of fox den entrances on the northern part of the island, managers may consider targeted wildlife control measures during the sea turtle nesting season to diminish predation.

1. Introduction

The distribution and abundance of the red fox (Vulpes vulpes) has steadily increased in the United States [1]. Although there are no historical population records, the opportunistic behavior of the red fox has led to this species rapidly establishing its existence in the Southeastern United States [2]. In North Carolina, the red fox population has expanded due to deforestation of pine (Pinus spp.) plantations and an increase in agricultural land [3]. Current fox population estimates are based on hunter harvest surveys conducted by the North Carolina Wildlife Resources Commission and disparity exists among stakeholders regarding population trends [3,4]. The purpose of this project was to investigate the spatial relationship between the red fox and environmental and human influences on an undeveloped barrier island.
Red foxes can use multiple dens and each den may have several entrances [5]. They are also opportunistic predators [6] and, therefore, we hypothesized that the location of red fox den entrances was correlated to the location of sea turtle nests and the proximity of human recreational activity. To test this hypothesis, we addressed the following research questions.
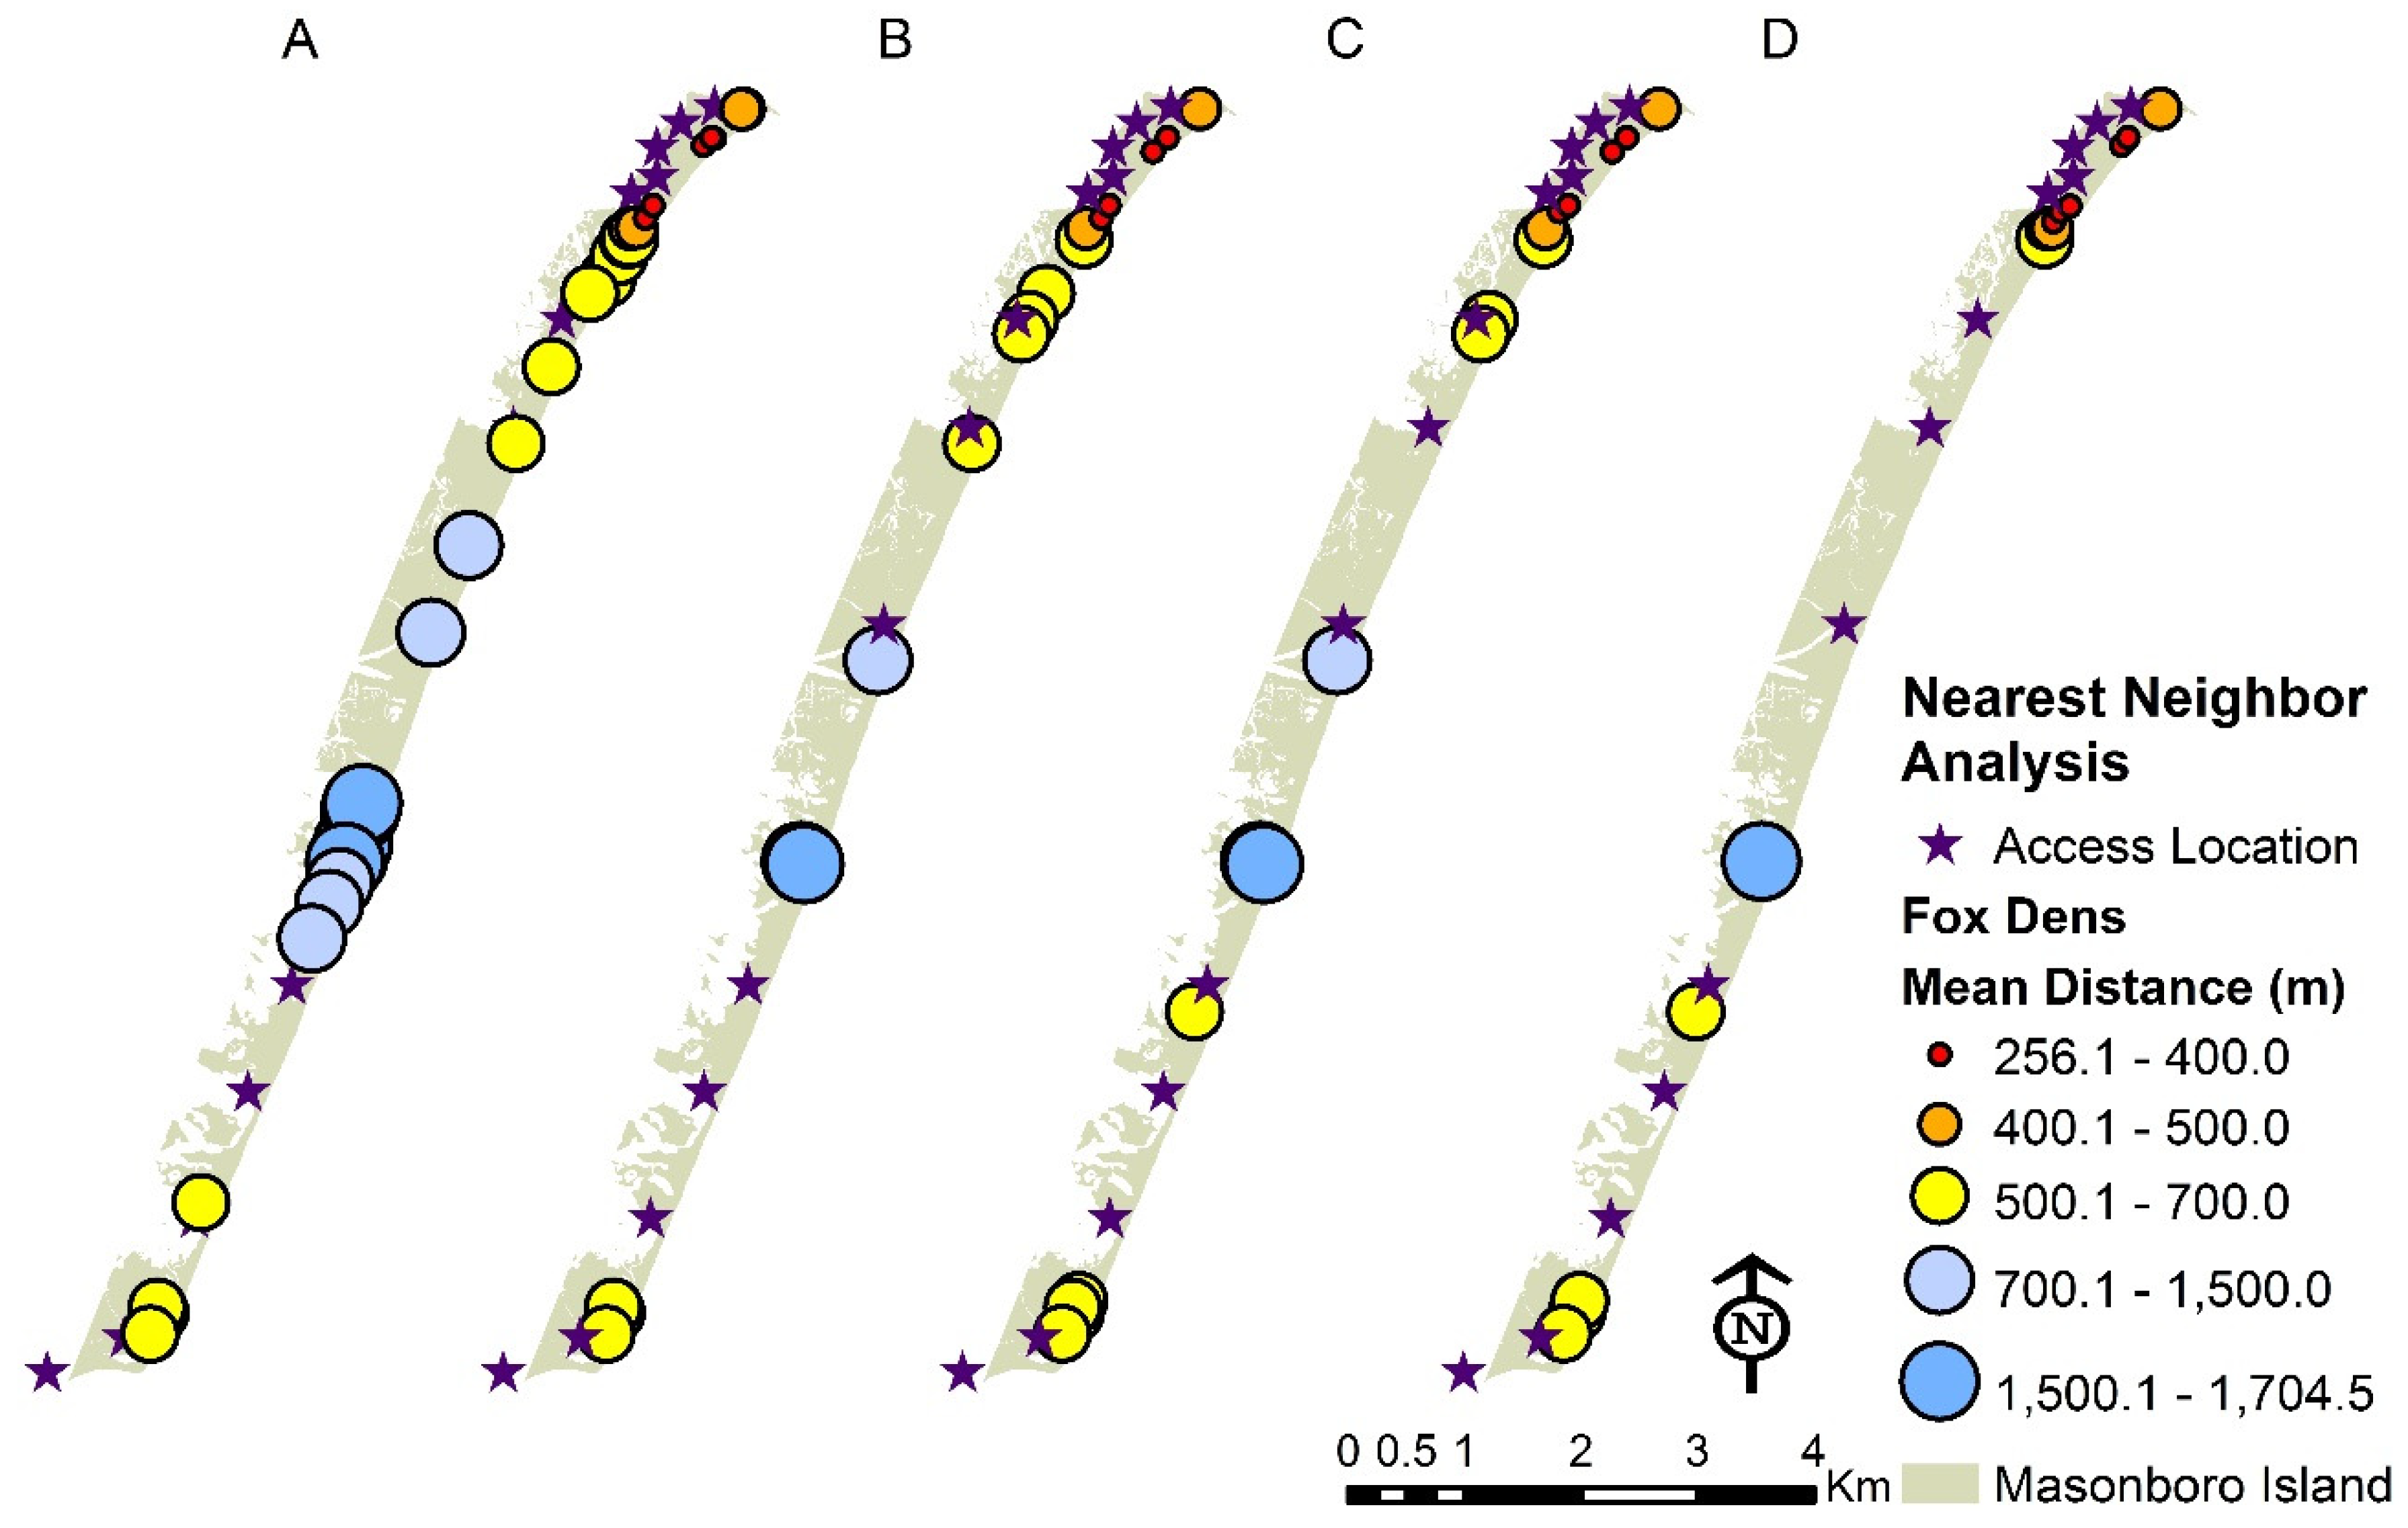
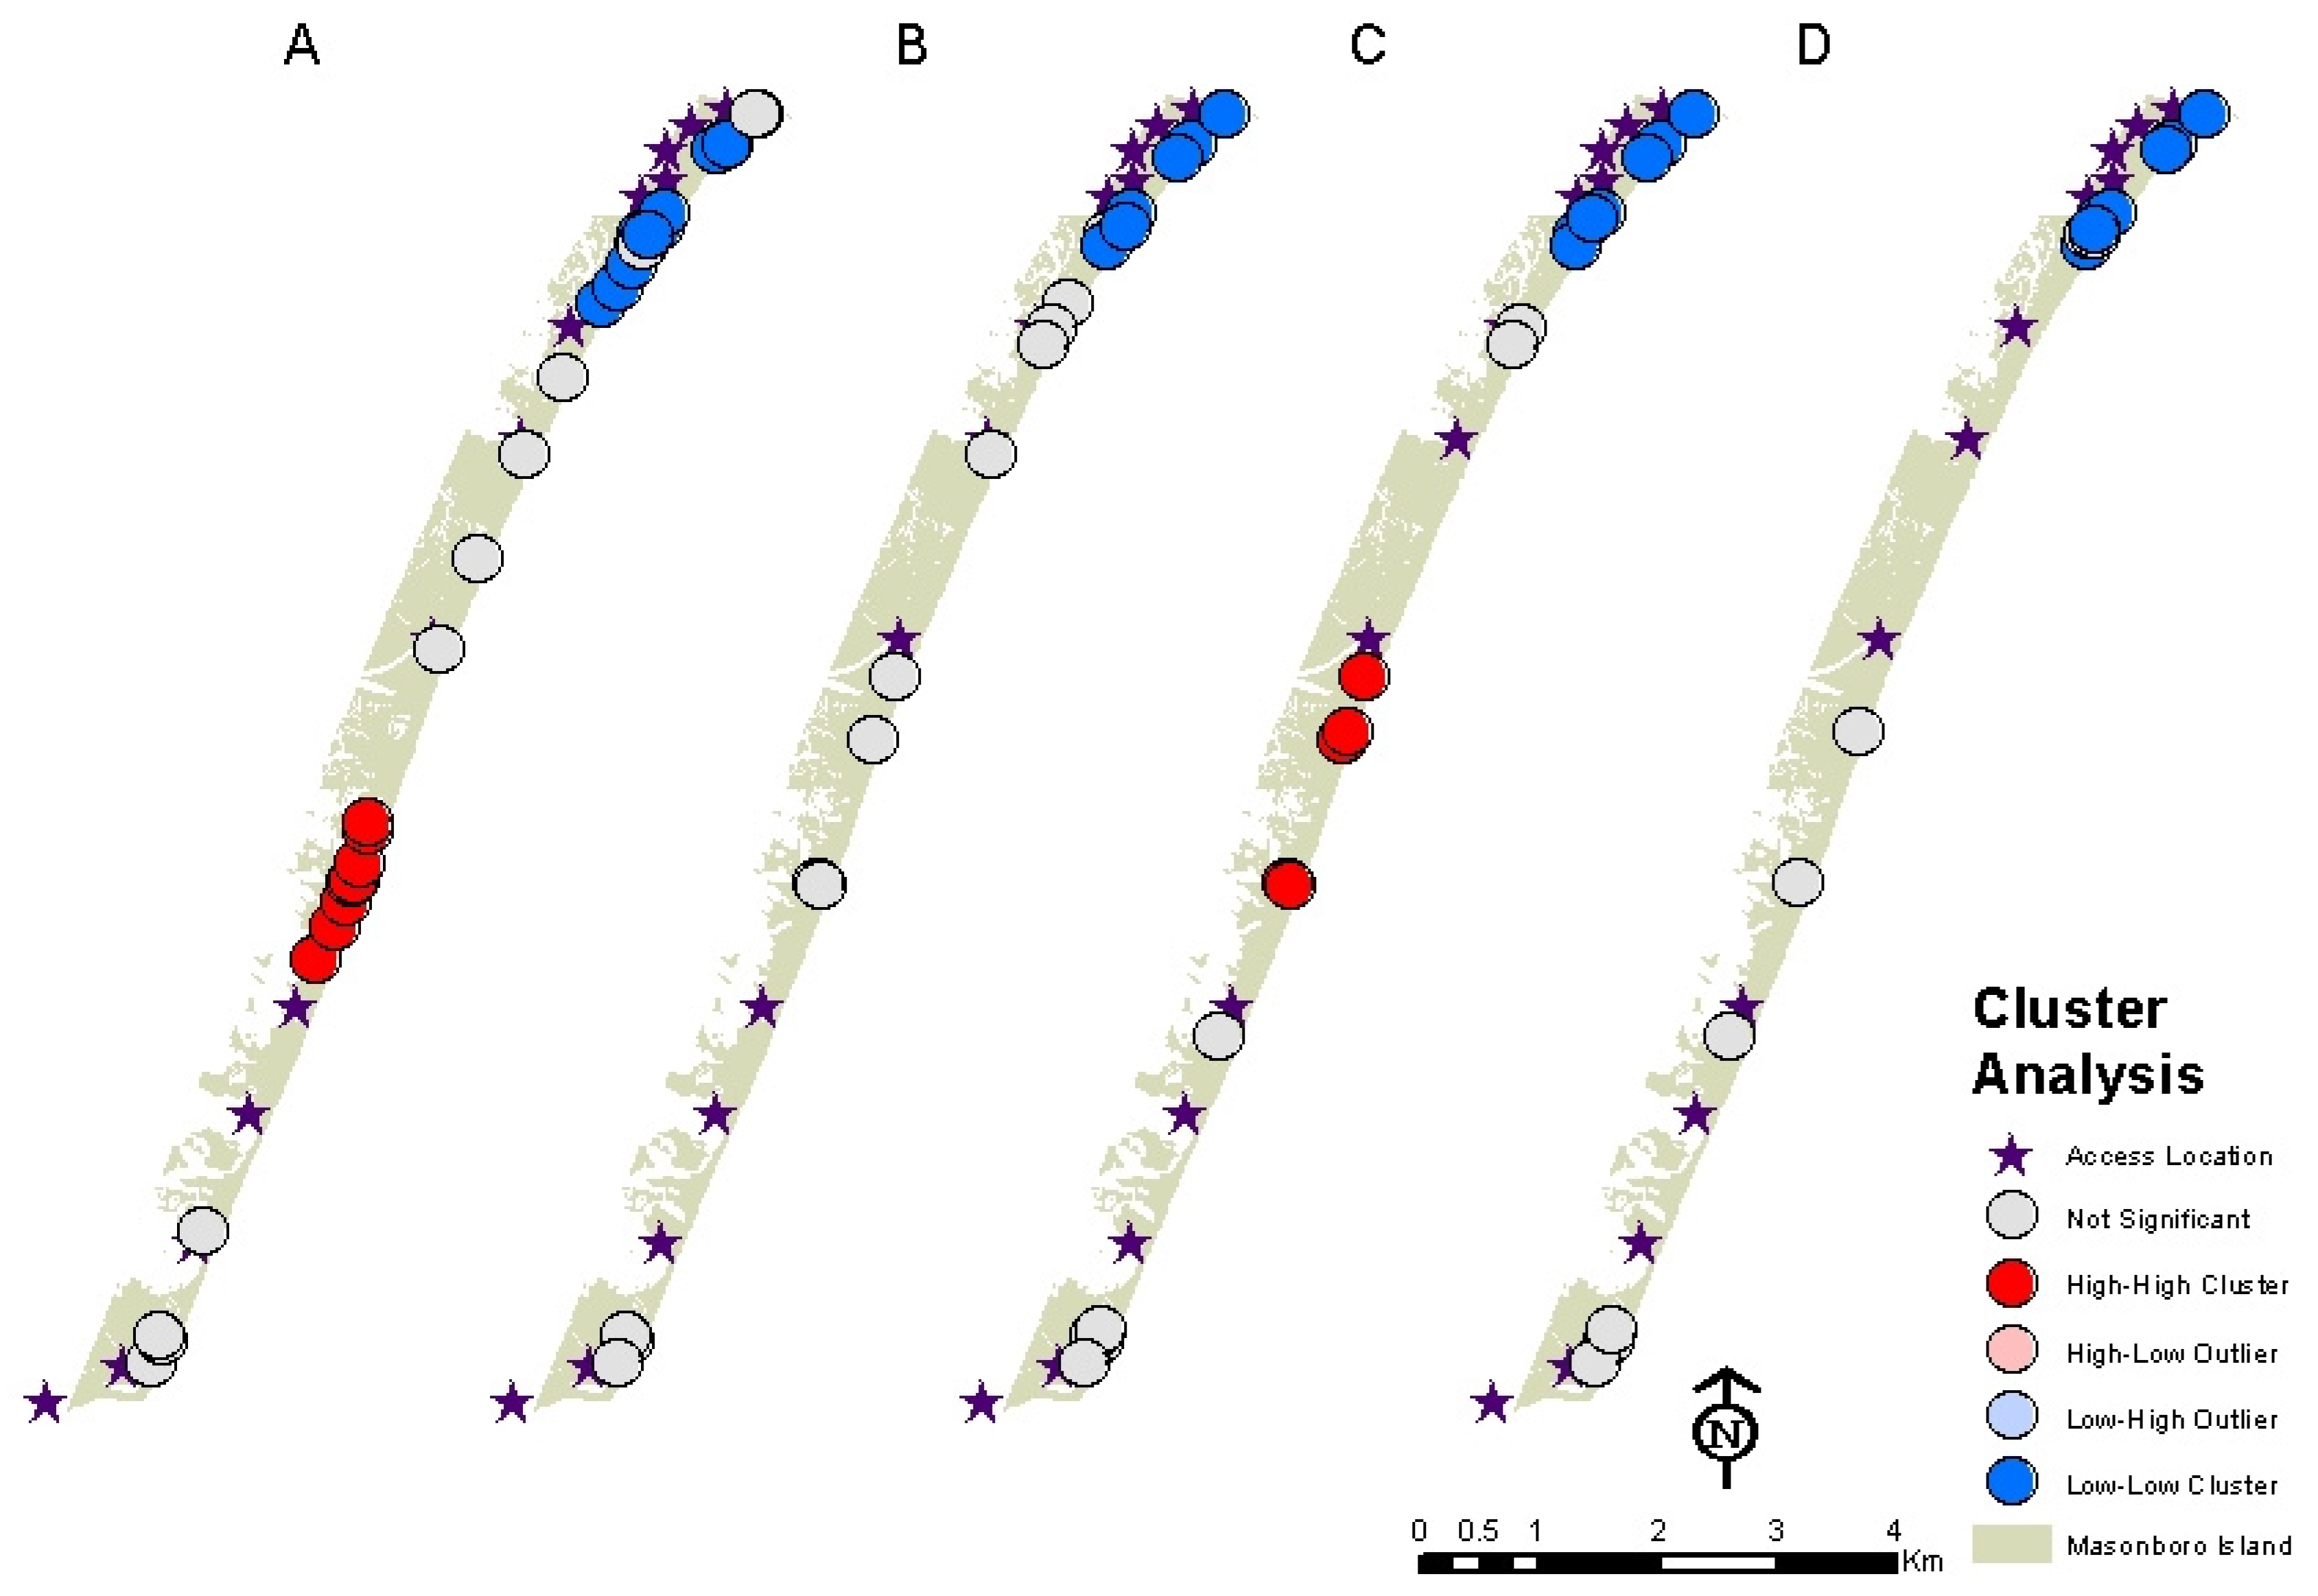
  • Are fox den entrances clustered, random, or evenly distributed across Masonboro Island? If they are clustered, are there particular hot spots? Is the pattern consistent from year to year?
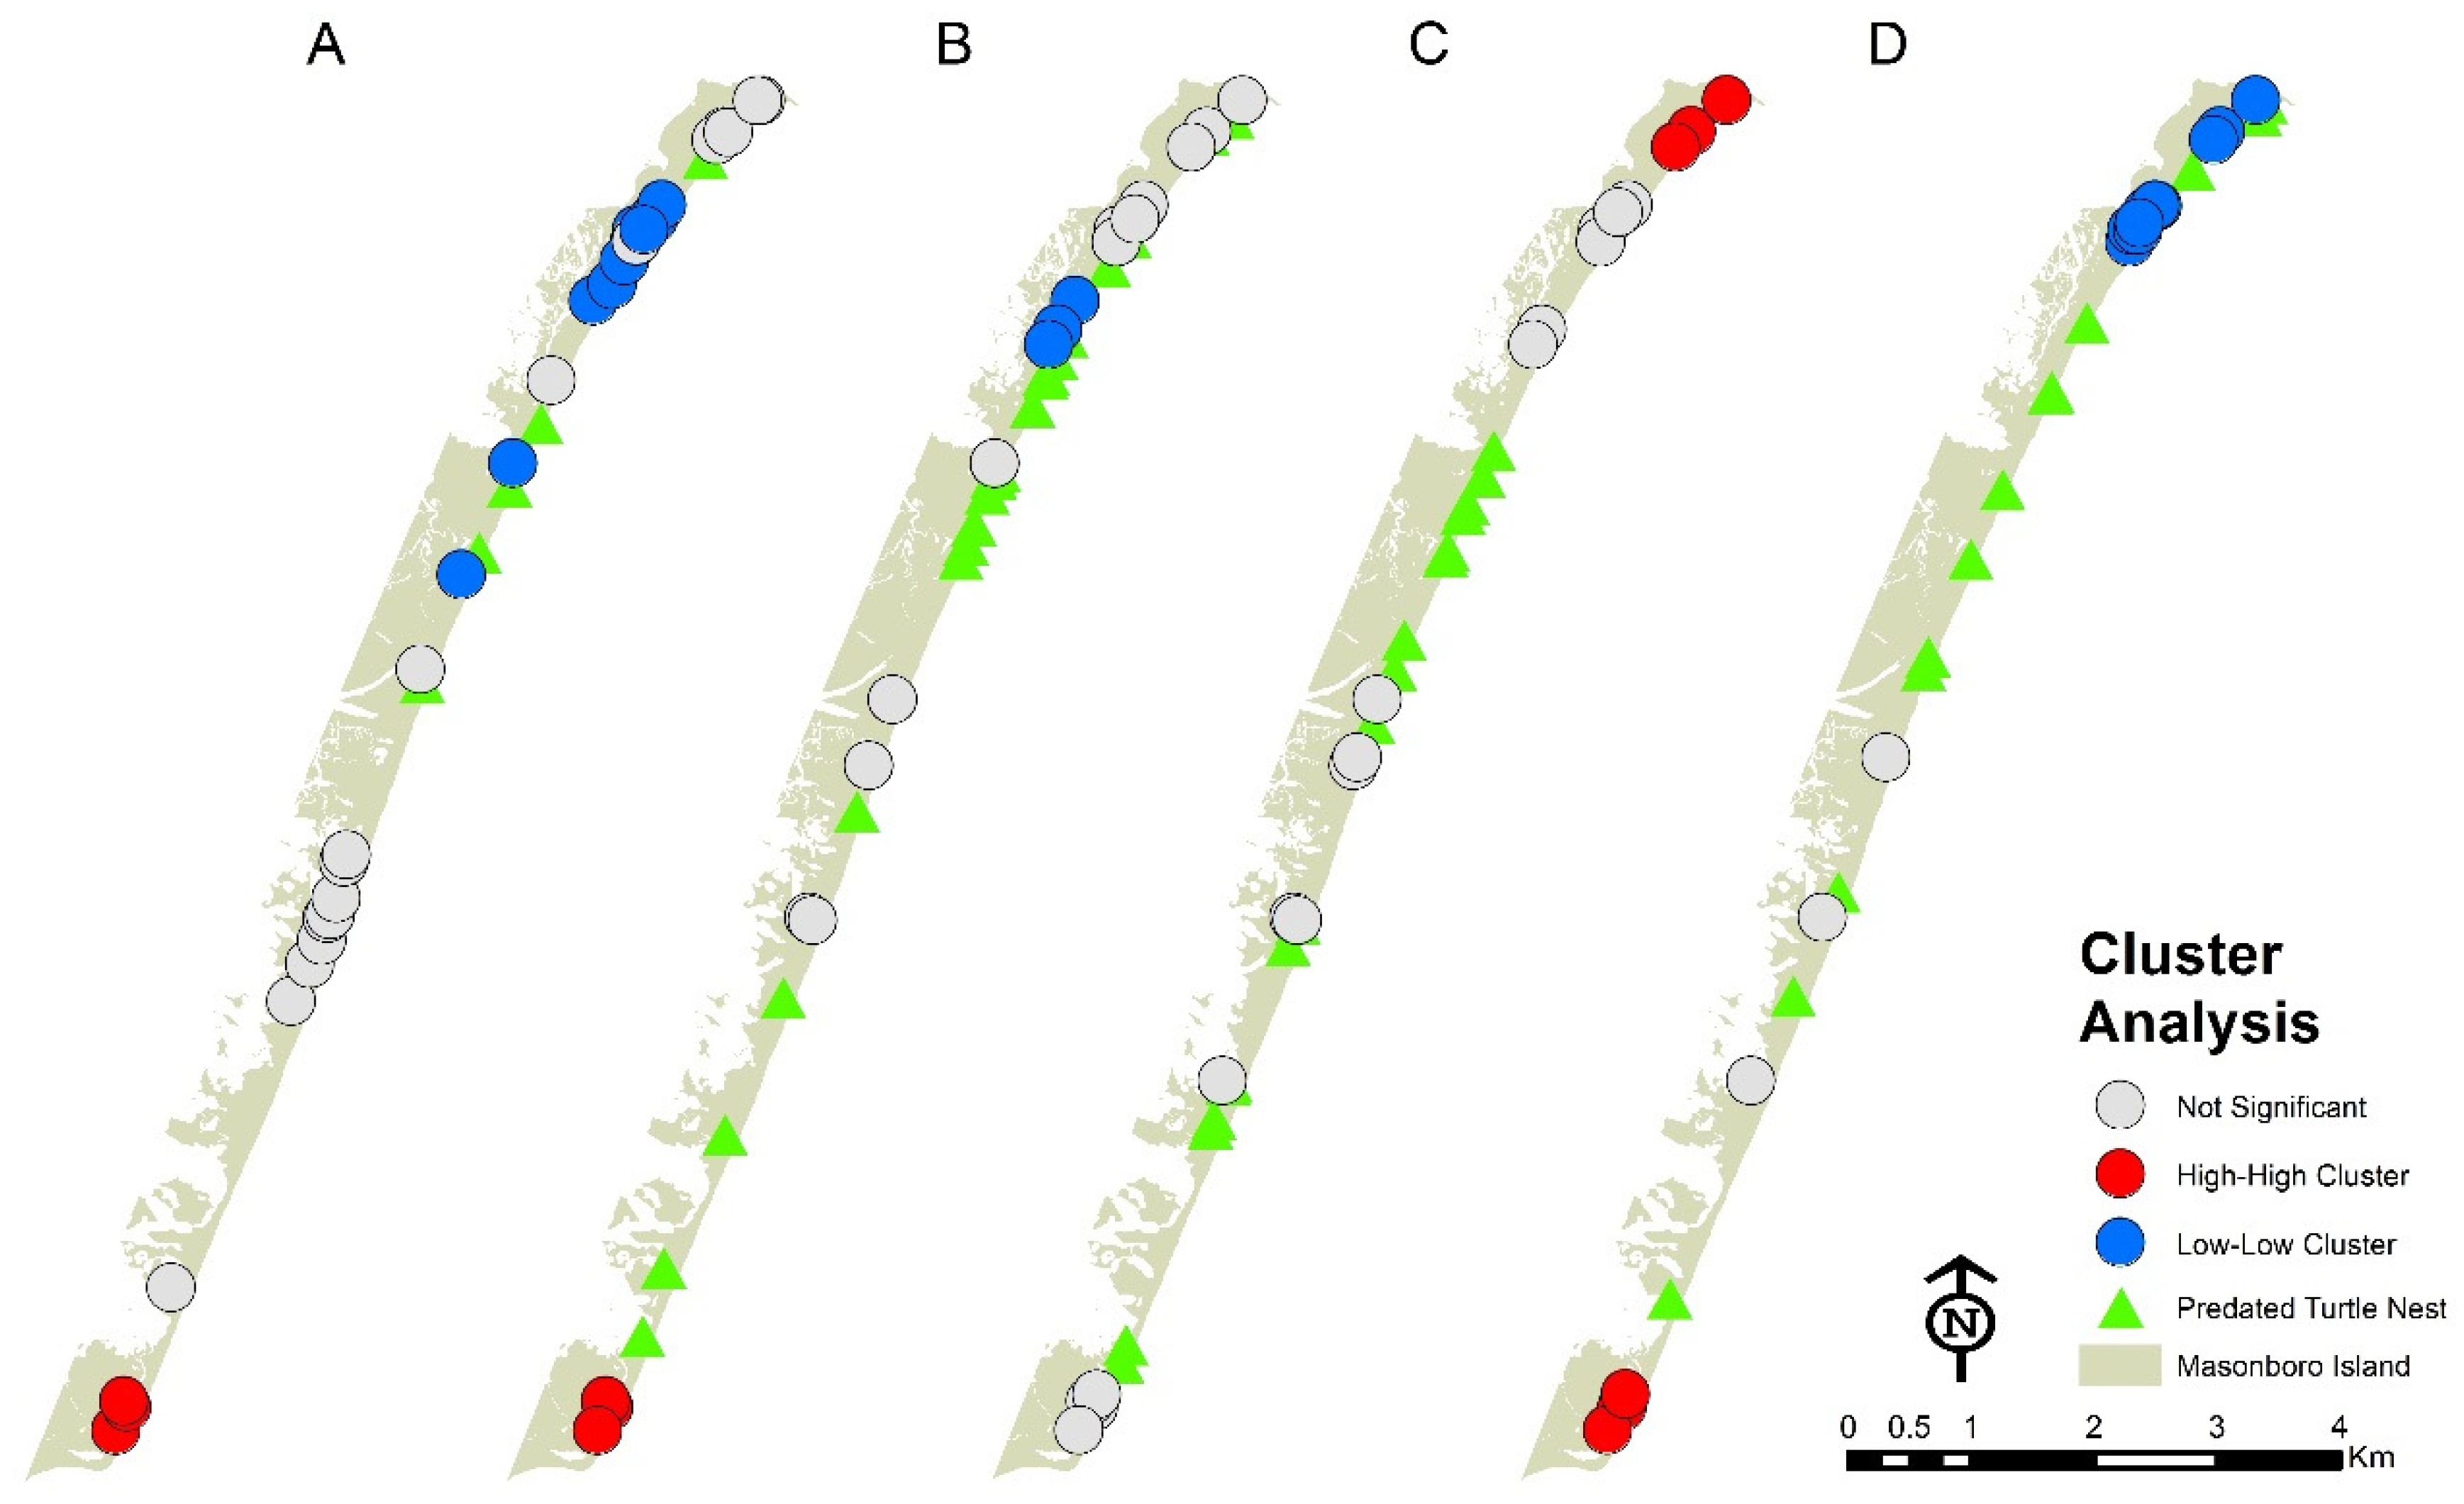
  • Are the sea turtle nests clustered, random, or evenly distributed? Is there a difference in the spatial pattern for nests that have been predated vs. not predated?
  • Is there a spatial relationship between the fox den entrances and sea turtle nests?
  • Is there a spatial relationship between the fox den entrances and the location of recreational activity?
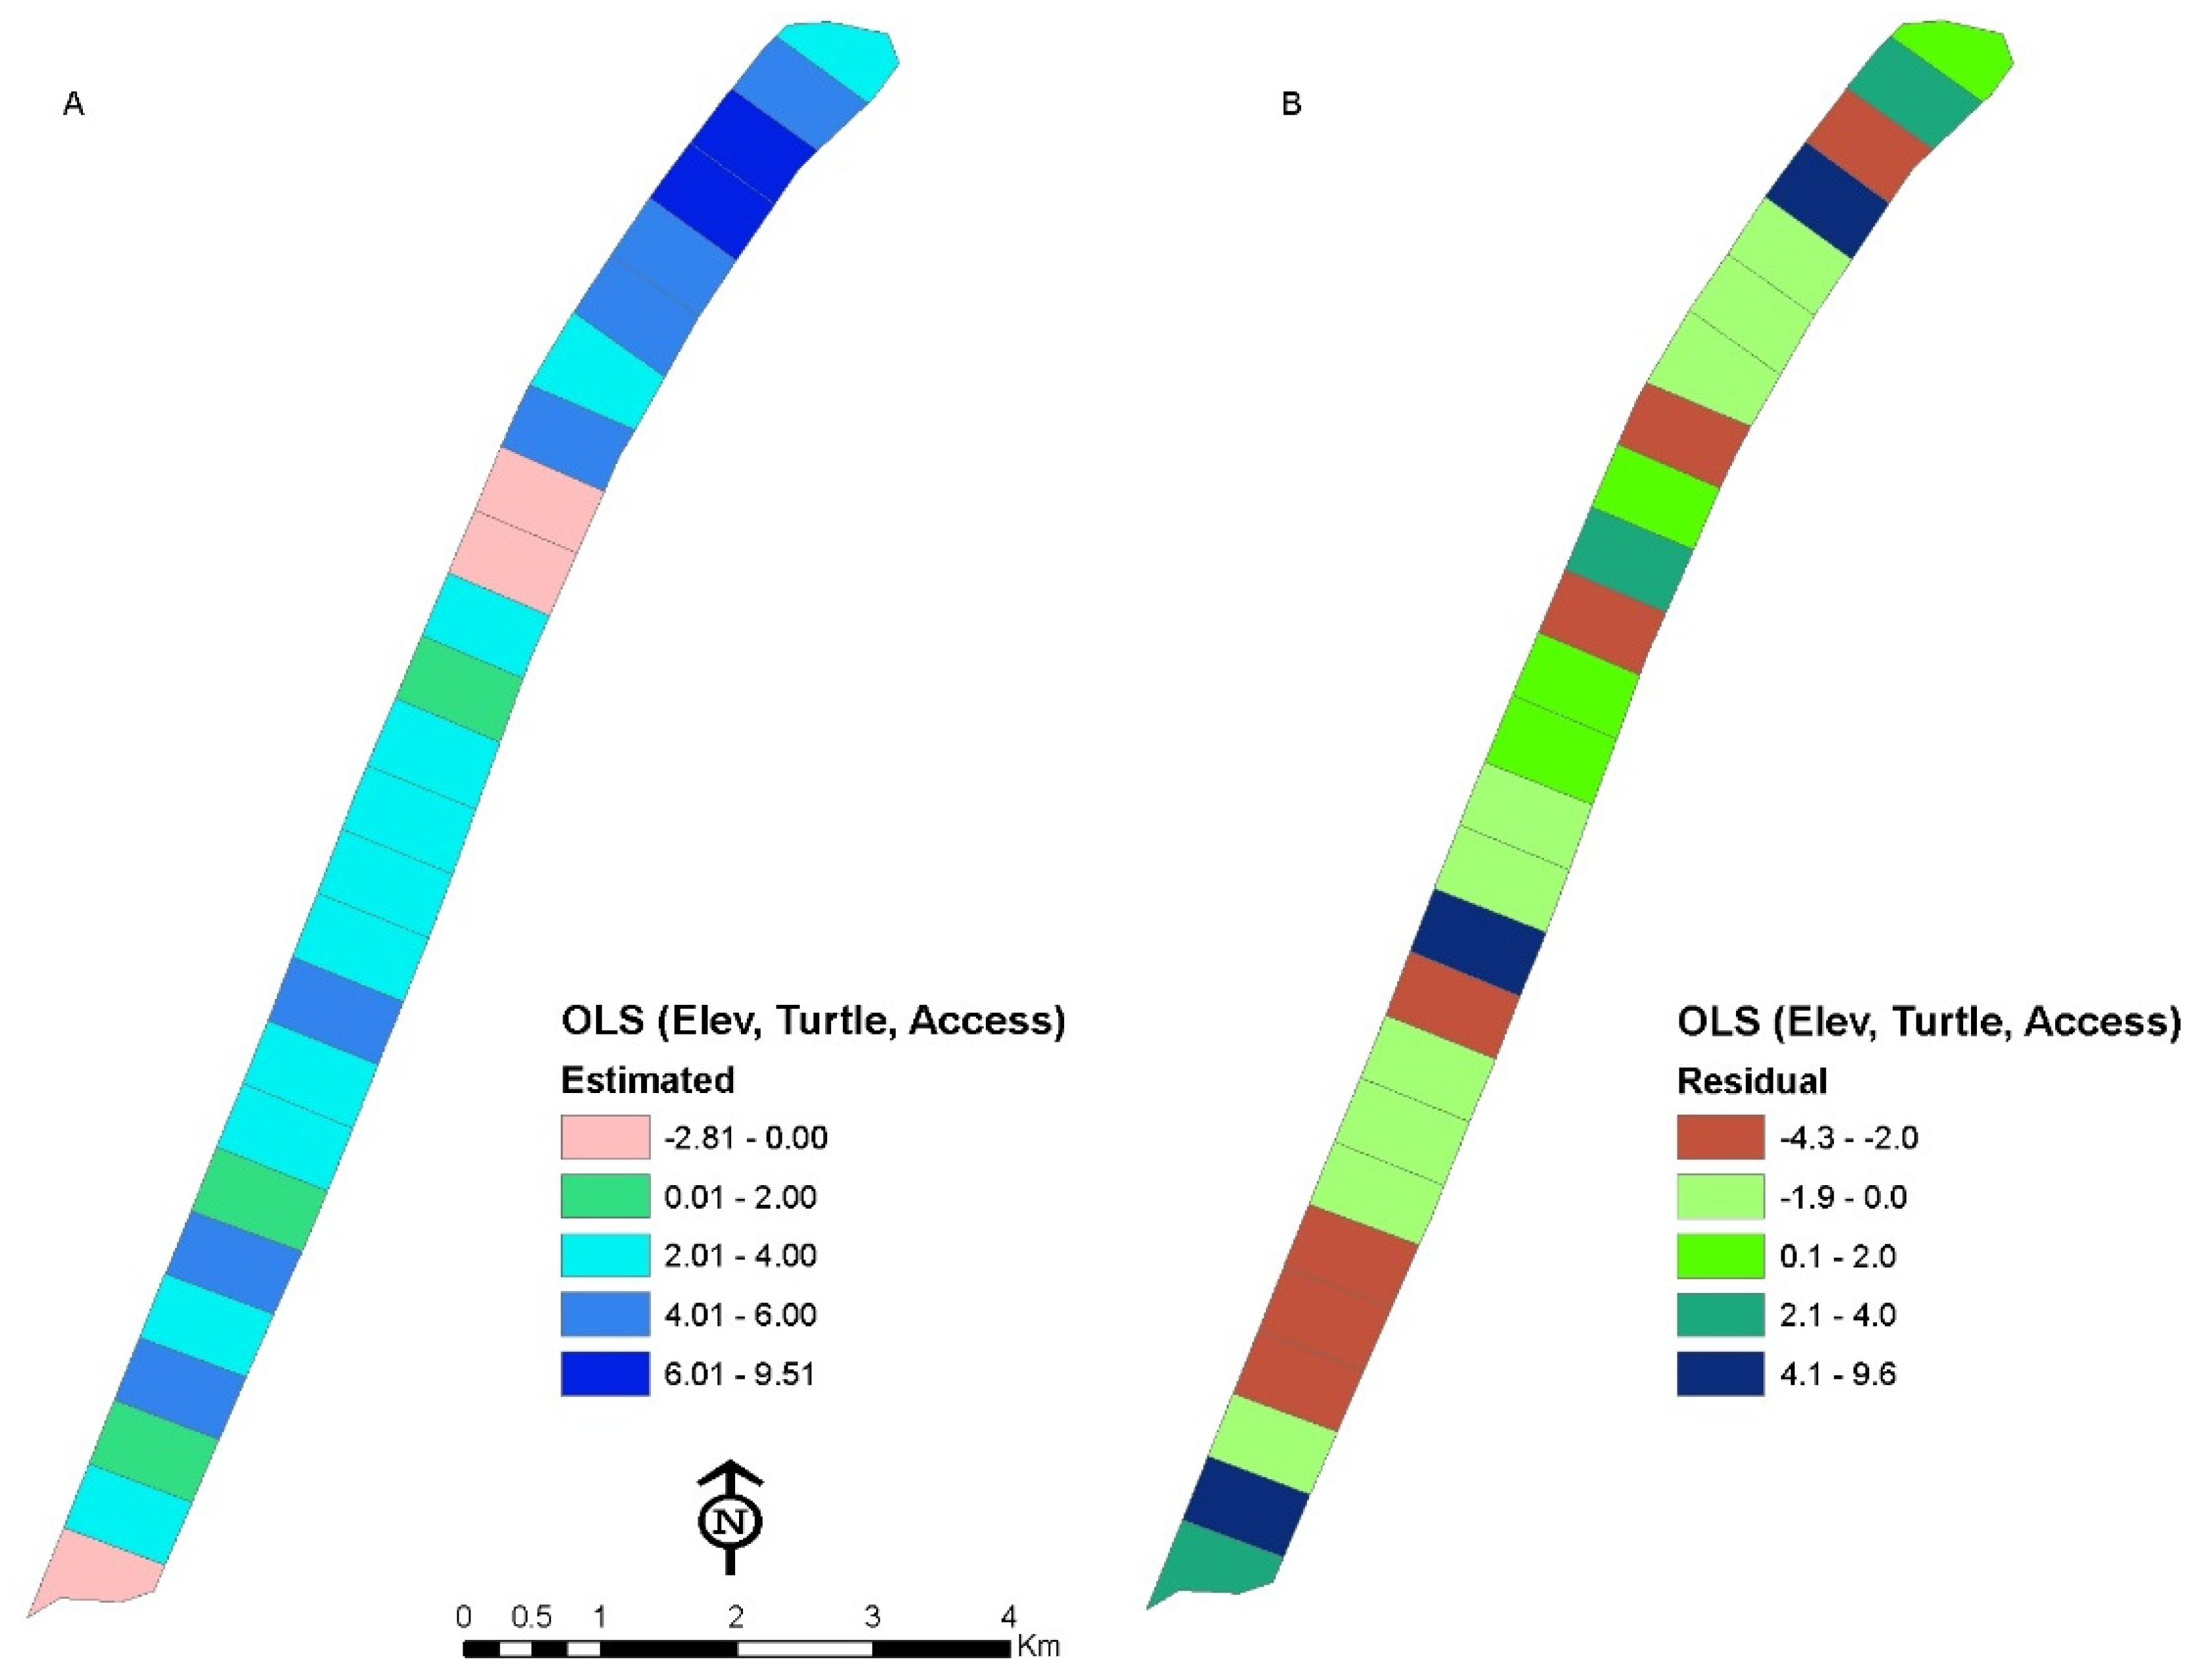
  • Are the locations of fox den entrances related to the topography of the island?
To address these questions, we employed spatial metrics (e.g., distance, density, and interpolation) and spatial statistics.

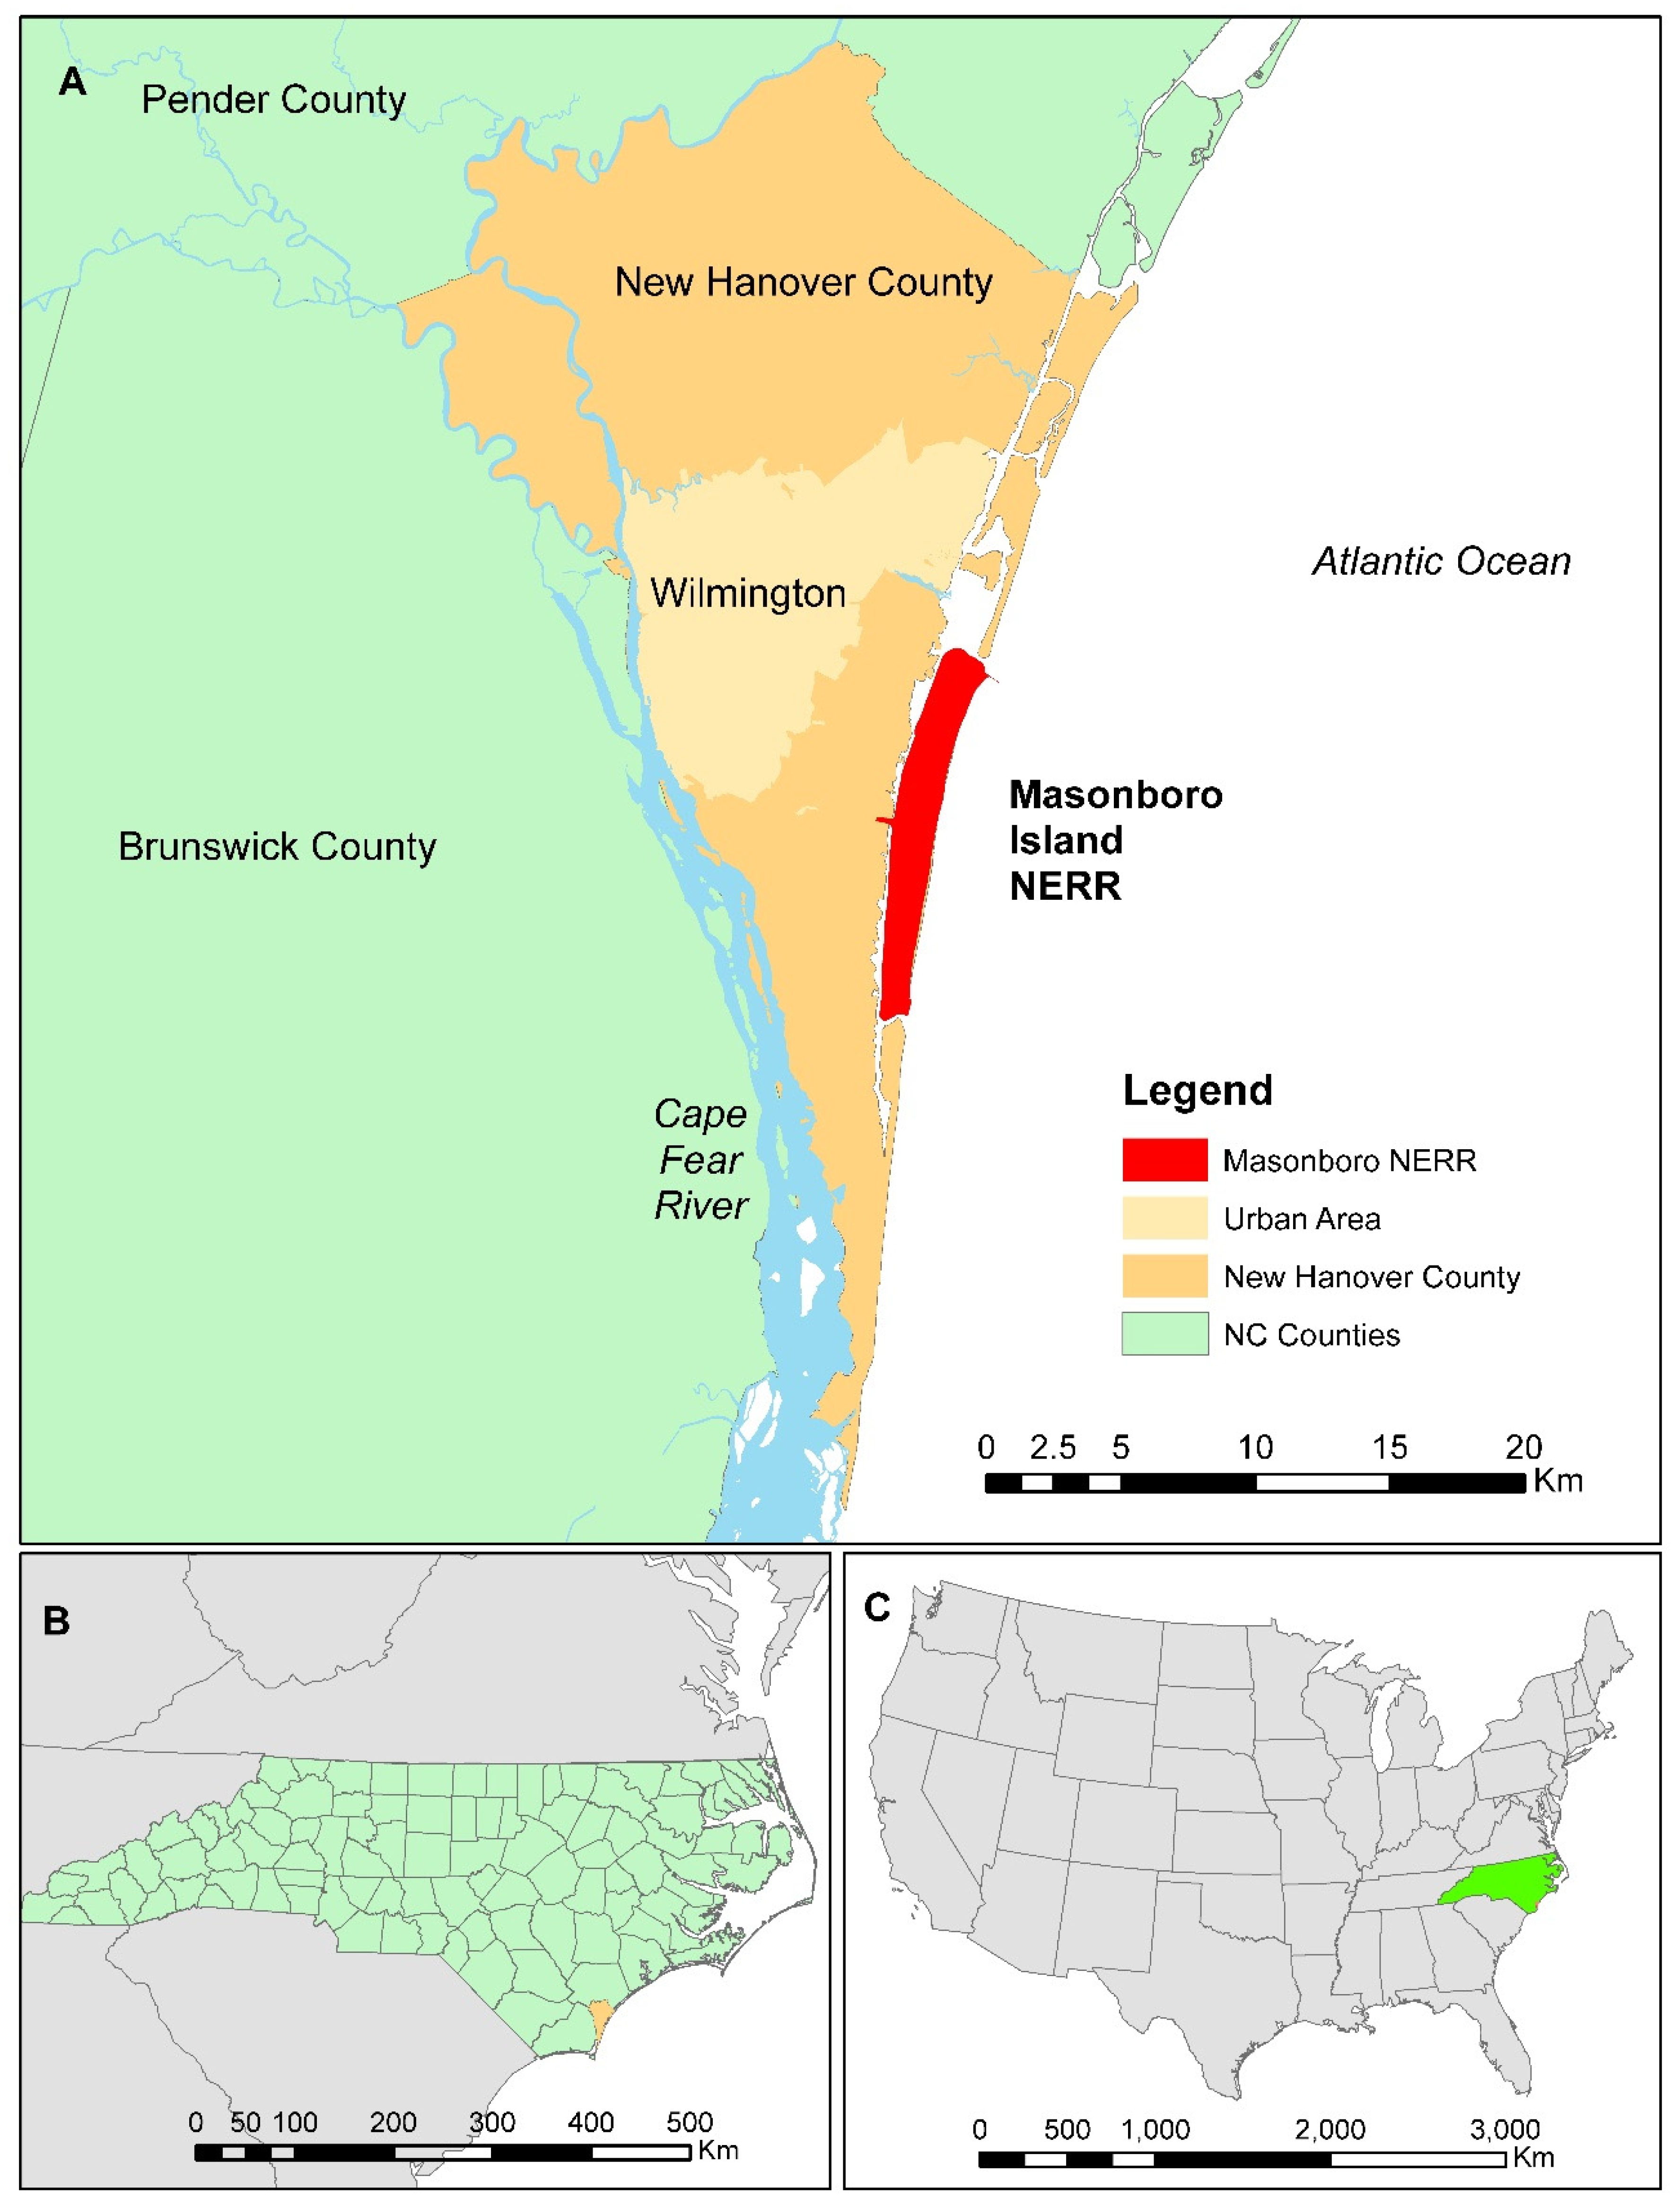
1.1. Masonboro Island Study Area

In Southeastern North Carolina, the coastline consists of large rivers, estuaries, tidal creeks, and nearshore barrier islands. Many barrier islands have human settlements dating back to the early 1900s, with few remaining barrier islands lacking permanent settlement and development infrastructure (e.g., roads). Masonboro Island is an example of an undeveloped barrier island that is legislatively protected by being designated as part of the North Carolina National Estuarine Research Reserve (NC NERR) (see https://coast.noaa.gov/nerrs/ for a complete description of the NERR system).
Masonboro Island is the largest undisturbed barrier island in Southeastern North Carolina. Over 13 km in length, it is bounded by the Atlantic Ocean to the east, the Intracoastal Waterway to the west, and the highly developed barrier islands of Wrightsville Beach to the north and Carolina Beach to the south. As is typical of a southeastern barrier island, its ecosystem encompasses oceanfront beaches, dune fields, shrub thickets, and extensive intertidal marshes. The Masonboro Island component of the NC NERR is currently managed under a cooperative agreement between the National Oceanic and Atmospheric Administration (NOAA) and the North Carolina Division of Coastal Management.
National Estuarine Research Reserves are established for long-term research, education, and stewardship. Given this statutory protection in an undisturbed state, the Masonboro Island Reserve (designated in 1991) provides an opportunity to study the spatial distribution of red fox in relation to environmental factors as well as investigate whether recreational use of the island influences the distribution of foxes (Figure 1). Although there are no permanent structures on the barrier island and it is accessible only by boat, there is a lengthy history of traditional recreational use for camping, walking, fishing/shell-fishing, and swimming/surfing [7,8]. This inevitably results in a wide variety of human impacts ranging from disturbance of vegetation to littering.
Due to its rarity as an undeveloped barrier island, Masonboro Island also provides habitat for various fauna. These range from overwintering and migrating shorebirds to nesting sea turtles. The two main species of sea turtles that nest on the island are the green (Chelonia mydas) and loggerhead (Caretta caretta). Both turtle species are listed as threatened under the Endangered Species Act by the U.S. Fish and Wildlife Services [9,10]. Red fox, Northern Raccoons (Procyon lotor), and Virginia Opossums (Didelphis virginianus) also inhabit the island. The former two species are widely considered the main predator of sea turtle nests in North Carolina [11]. A full description of the Masonboro Island component of the NC NERR can be found on the North Carolina Reserve website (http://www.nccoastalreserve.net/web/crp).

2. Methods

Our methods consisted of fieldwork to locate red fox dens, development of a GIS database, computation of spatial patterns of fox den entrances on an annual basis, and correlation of the spatial distribution of fox den entrances with sea turtle nests, island topography, and location of boat access sites.

2.1. Field Work

In order to identify fox den locations, a field survey of Masonboro Island (13 km) was conducted annually at the end of April or early May between 2009 through 2012. The research team walked the entire length of the island visually searching for fox den entrances. Fox den entrances are typically 38 cm in height, cleared out, and usually have a conspicuous pile of sand at the entrance [5]. When a den entrance was identified, its coordinates and whether the entrance was being actively used based on physical evidence (such as tracks or food caches) were recorded. The area around each den entrance was extensively surveyed and only one large den complex at the north end of the island had multiple entrances. Entrances to fox dens have been recorded no more than 10 m apart [5]. It is possible, although unlikely, that a den entrance was not observed. Therefore, we herein refer to each den’s coordinates as a den entrance. For the den complex, we used a midpoint between all entrances to record the coordinates and counted it as a single den entrance. Fox den entrance GPS coordinates were recorded using a Garmin eTrex 20× (Figure 2A). The Garmin eTrex 20× has an average position accuracy of less than 15 m depending upon the configuration of the unit. In this study, WAAS was enabled on the units, which increased position accuracy. However, the accuracy data were not stored in the database.
In order to identify sea turtle nests, the entire length of Masonboro Island was patrolled 5–7 days per week starting shortly after sunrise from May through November. Teams of 2–4 NERR seasonal staff, interns, and community volunteers walked along the high tide line scanning the supratidal and intertidal beach areas for signs of sea turtle nesting activity (May through August). When tracks were located, GPS coordinates and photographs were collected. If no nest was located, then the location was recorded as a “false crawl.” If a body pit was present, team members attempted to locate the nest by probing by hand throughout the area of disturbance. If a nest was located, the eggs were uncovered at the minimum amount required to confirm its specific location and for collection of one egg sample. Each nest was then covered with damp sand, protected with a plastic mesh to prevent predation, and marked with a sign noting the nest number and office phone number. Nests were checked on a daily basis throughout incubation and signs of predation or hatching (collapse of the center of the nest and/or hatchling tracks) were noted. Following state protocol, nests were excavated 72 h after observing signs of hatching (July through October). The number of hatched eggs, unhatched eggs, live hatchlings, and dead hatchlings was recorded. All data related to sea turtle nesting were submitted to the International Sea Turtle website (http://www.seaturtle.org/about/) for incorporation into the standardized database (Figure 2B).

2.2. Data Processing

A geo-database was developed using ArcGIS 10.5.1 [12]. The yearly fox den entrance point data were converted to a feature class with attributes for year, activity (active and inactive), and a description of the site. The Masonboro Island Reserve staff provided the following data including NERR site boundary, the annual sea turtle nest survey, and boat access sites. The annual sea turtle nest survey data were converted into a feature class with attributes for date, species, type (false crawl or nest), predation, management activity (e.g., placed mesh), number of eggs predated, date of hatching, and information about the hatching specifics (e.g., undeveloped, dead, live). Boat access sites were also converted into a feature class containing no attributes.
A study area polygon was created to limit the area to the main barrier island rather than the entire Masonboro Island Reserve site, which includes estuarine waters and spoil islands. An elevation grid was derived from 2010 LiDAR LAS data collected by the US Army Corps of Engineers and available for download from NOAA’s Digital Coast viewer (https://www.coast.noaa.gov/dataviewer/#/). All data layers were projected to North Carolina State Plane, NAD 83 (meters).

2.3. Spatial Analysis

Spatial analyses consisted of identifying patterns with the location of fox den entrances, investigating the spatial relationship between fox den entrance locations, sea turtle nests, and boat access sites, investigating fox den entrance locations with respect to island topography, and predicting fox den entrance locations using spatial statistics.

2.3.1. Point Pattern Analysis

Point data can be characterized in one of three categories: dispersed, random, or clustered by using a variety of tests. There are several techniques to investigate patterns in point data [13,14,15]. One is the Average Nearest Neighbor statistic, which was used to calculate the degree of clustering for fox den entrances and sea turtle nests each year [16]. Given the long and linear shape of the study area, it is important that the size of the study area is included in the calculation. Otherwise, the default minimum bounding rectangle size would be a much larger area and would yield unrealistic results. The Masonboro Island Reserve includes the barrier island as well as the back barrier marshes, water, and spoil islands. Therefore, to accurately account for the possible location of fox den entrances on the barrier island, the above-high-tide, upland portion of the barrier island was extracted from the land cover data. This changed the study area size from the full extent of the NERR site at 10,664,055 m2 (10.7 km2) to 5,544,893 m2 (5.5 km2), which is a substantial reduction in area.
Once the overall degree of clustering was calculated, the Ripley’s K Function was used to measure the degree of clustering over various distances [13,17]. Ripley’s K is used to measure the pattern by counting the number of features within multiple distances and compares this to a random distribution. The result is a measure of clustering and dispersion as distances increase away from each feature. As with the Average Nearest Neighbor, the size of the study area is important and ideally there are a minimum of 30 points.
The Average Nearest Neighbor and Ripley’s K measure geographic clustering of features within the study area determine the spatial pattern of fox den entrances in relation to some other attribute (e.g., count or density). Then additional spatial statistics can be used. For example, spatial autocorrelation and incremental spatial autocorrelation measures the geographic distribution of features as well as the value of an attribute to determine if the features are clustered, dispersed, or randomly distributed relative to both the locations and the attribute values [18]. The distances between fox den entrances and boat access sites, turtle nests, predated nests, and false crawls were calculated and used to measure spatial autocorrelation using the Moran’s I index. To do this, the distance between fox den entrances and predated sea turtle nests was calculated and then averaged to the nearest 2, 3, 4, and 5 predated nests. Calculating the distance between the nearest X number of predated nests will indicate if the clustering of den entrances is related to the location of sea turtle nests. Spatial autocorrelation was also computed by counting the number of fox den entrances within multiple radii around each fox den entrance location. For each year, the fox den entrances were counted at 100 m, 300 m, 500 m, 700 m, and 900 m. These counts were then used as the attributes for testing spatial autocorrelation. Given that the mean distance between den entrances ranged from 193 m (2009) to 352 m (2012) (Table 1), we accounted for the variety and range of distances by counting the number of dens at 200 m increments from 100 m to 900 m.

2.3.2. Spatial Relationships between Fox Den Entrances, Sea Turtle Nests, and Boat Access Sites

Once the degree of clustering for the location of fox den entrances was known, the next step was to compare distances between fox den entrances, boat access sites, and sea turtle nests to test whether these distances were significantly different from random locations.
Spatial clustering based on location and value or attribute can be tested using the Local Moran’s I statistic. Local Moran’s I was computed using the distance between fox den entrances and the predated sea turtle nests. However, to test the validity or strength of the results, the distances to the nearest 3, 4, and 5 neighbors were calculated. These results were used in the Local Moran’s I to identify if there were clusters in fox den entrances where the clusters were located and the type of cluster. For example, a “high-high” cluster is a fox den entrance that was clustered with other den entrances (high clustering) and also has significant larger distance (high values) to the predated turtle nests. Conversely, a “low-low” cluster has den entrances that are clustered with significantly shorter distances (low values) to the turtle nests [19].

2.3.3. Island Topography and Fox Den Entrance Locations

To investigate if there is a relationship between the location of fox dens and the elevation along the barrier island, 2010 bare earth point cloud (LAS format) LiDAR data were obtained from the US Army Corps of Engineers via the National Oceanic Atmospheric Administration (NOAA) Digital Coast website (https://coast.noaa.gov/digitalcoast/). LiDAR is commonly used to derive Digital Elevation Models (DEMs) in the coastal zone and the accuracy of DEMs is dependent on the density of points collected especially in areas with lots of vegetative cover [20,21,22,23,24,25]. NOAA has distributed LiDAR data for many years and the Digital Coast is a tremendous asset to managers and researchers who are investigating coastal patterns [26]. For this study, the LiDAR elevation data (with vertical datum of NAVD88) were interpolated to create a Digital Elevation Model (DEM) with 0.5 m cell size for the Masonboro Island Reserve and then a new raster grid was created for the upland area (elevation ≥ 0).
Given the map accuracy of the GPS fox den entrance locations (±15 m at worst) and the 0.5 m cell size of the DEM, it was inappropriate to extract the DEM elevation at each den X, Y location. Instead a buffer was used to calculate the average elevation for each den entrance. For each year, fox den entrances were buffered at 10 m, 20 m, and 30 m and then the mean elevation within each buffer was calculated. Given that the spatial accuracy of the GPS field effort was on average 20 m, it was decided that these three buffer distances would be used to calculate the mean elevation and then these results were tested using correlation coefficients and t-tests to determine if there was a statistical difference in mean elevation by the size of the buffer. This sensitivity analysis is important in order to determine whether the size of the buffer influenced the mean elevation. The average elevations within each buffer distance were compared using a t-test and were not significantly different. Therefore, the mean elevation for the 20 m buffer was used in the analysis since this size accounted for the potential error in the fox den entrance GPS locations. Spatial autocorrelation (global Moran’s I) and cluster analysis (local Moran’s I) were used to identify the spatial relationship between yearly fox den entrance locations and island elevation.

2.3.4. Predictive Model for Fox Den Entrance Locations

Regression analysis can be used in a spatial or geographic model where the location of independent variables can be compared with dependent variables [27]. If the independent variables explain a sufficient amount of the variance, then these variables can be used to predict the dependent variable. In this study, the independent variables were the distance to predated sea turtle nests, the distance to boat access sites, and an elevation at fox den entrance locations. The dependent variable was the density or number of fox den entrances per unit area. The only independent variable that changed through time was the location and number of sea turtle nests. Therefore, spatial models were first tested using Ordinary Least Squares (OLS) regression and then predictive models were created using Geographically Weighted Regression (GWR). Understanding the predictability of the independent variables is OLS regression, which is a global approach where a single linear equation for the entire study area is produced from the independent variables [28]. Next, GWR analysis, which is a local regression approach, produces a regression equation for each polygon or zone in the study area. This is a local linear regression model rather than a single, global, equation for the entire study area. The properties of each zone and the immediate neighbors are used to develop regression equations for each zone. Therefore, if there are differences in the influence of the independent variables across space then GWR can identify how these relationships change across the study area [29].
Regression techniques have been successfully used to investigate a variety of landscape changes through time. For example, changing coastal environments have predicted the relationship between land use development and vegetation loss [30]. However, the global or overall approach using OLS regression can miss spatial intricacies at the local level that may be derived using GWR [31].
To create a predictive model, the Masonboro Island study area was divided into equally-sized transect polygons perpendicular to the island from the north to the south. A spatial sensitivity analysis was conducted to determine the appropriate size of the transect polygons. We created 10 randomly placed transects at the north end of the island and then generated transects of varying sizes from 100 m through 800 m. The number of den entrances per transect polygon was computed. Given that statistical analysis recommends that the number of transects with no observations be less than 25% and larger transects would not have enough observations to be statistically valid, it was decided that the 500 m wide transects (26 polygons) best represented the data and were statistically useful. The 26 transect polygons had an average size of 40 hectares. Within each transect polygon, the dependent variable was the count of fox den entrances each year (2009–2012) and the independent variables were the yearly mean distance from den entrances to predated sea turtle nests (3, 4, and 5 closest neighbors), yearly mean elevation at fox den entrances, and yearly mean distance from den entrances to boat access points.

3. Results

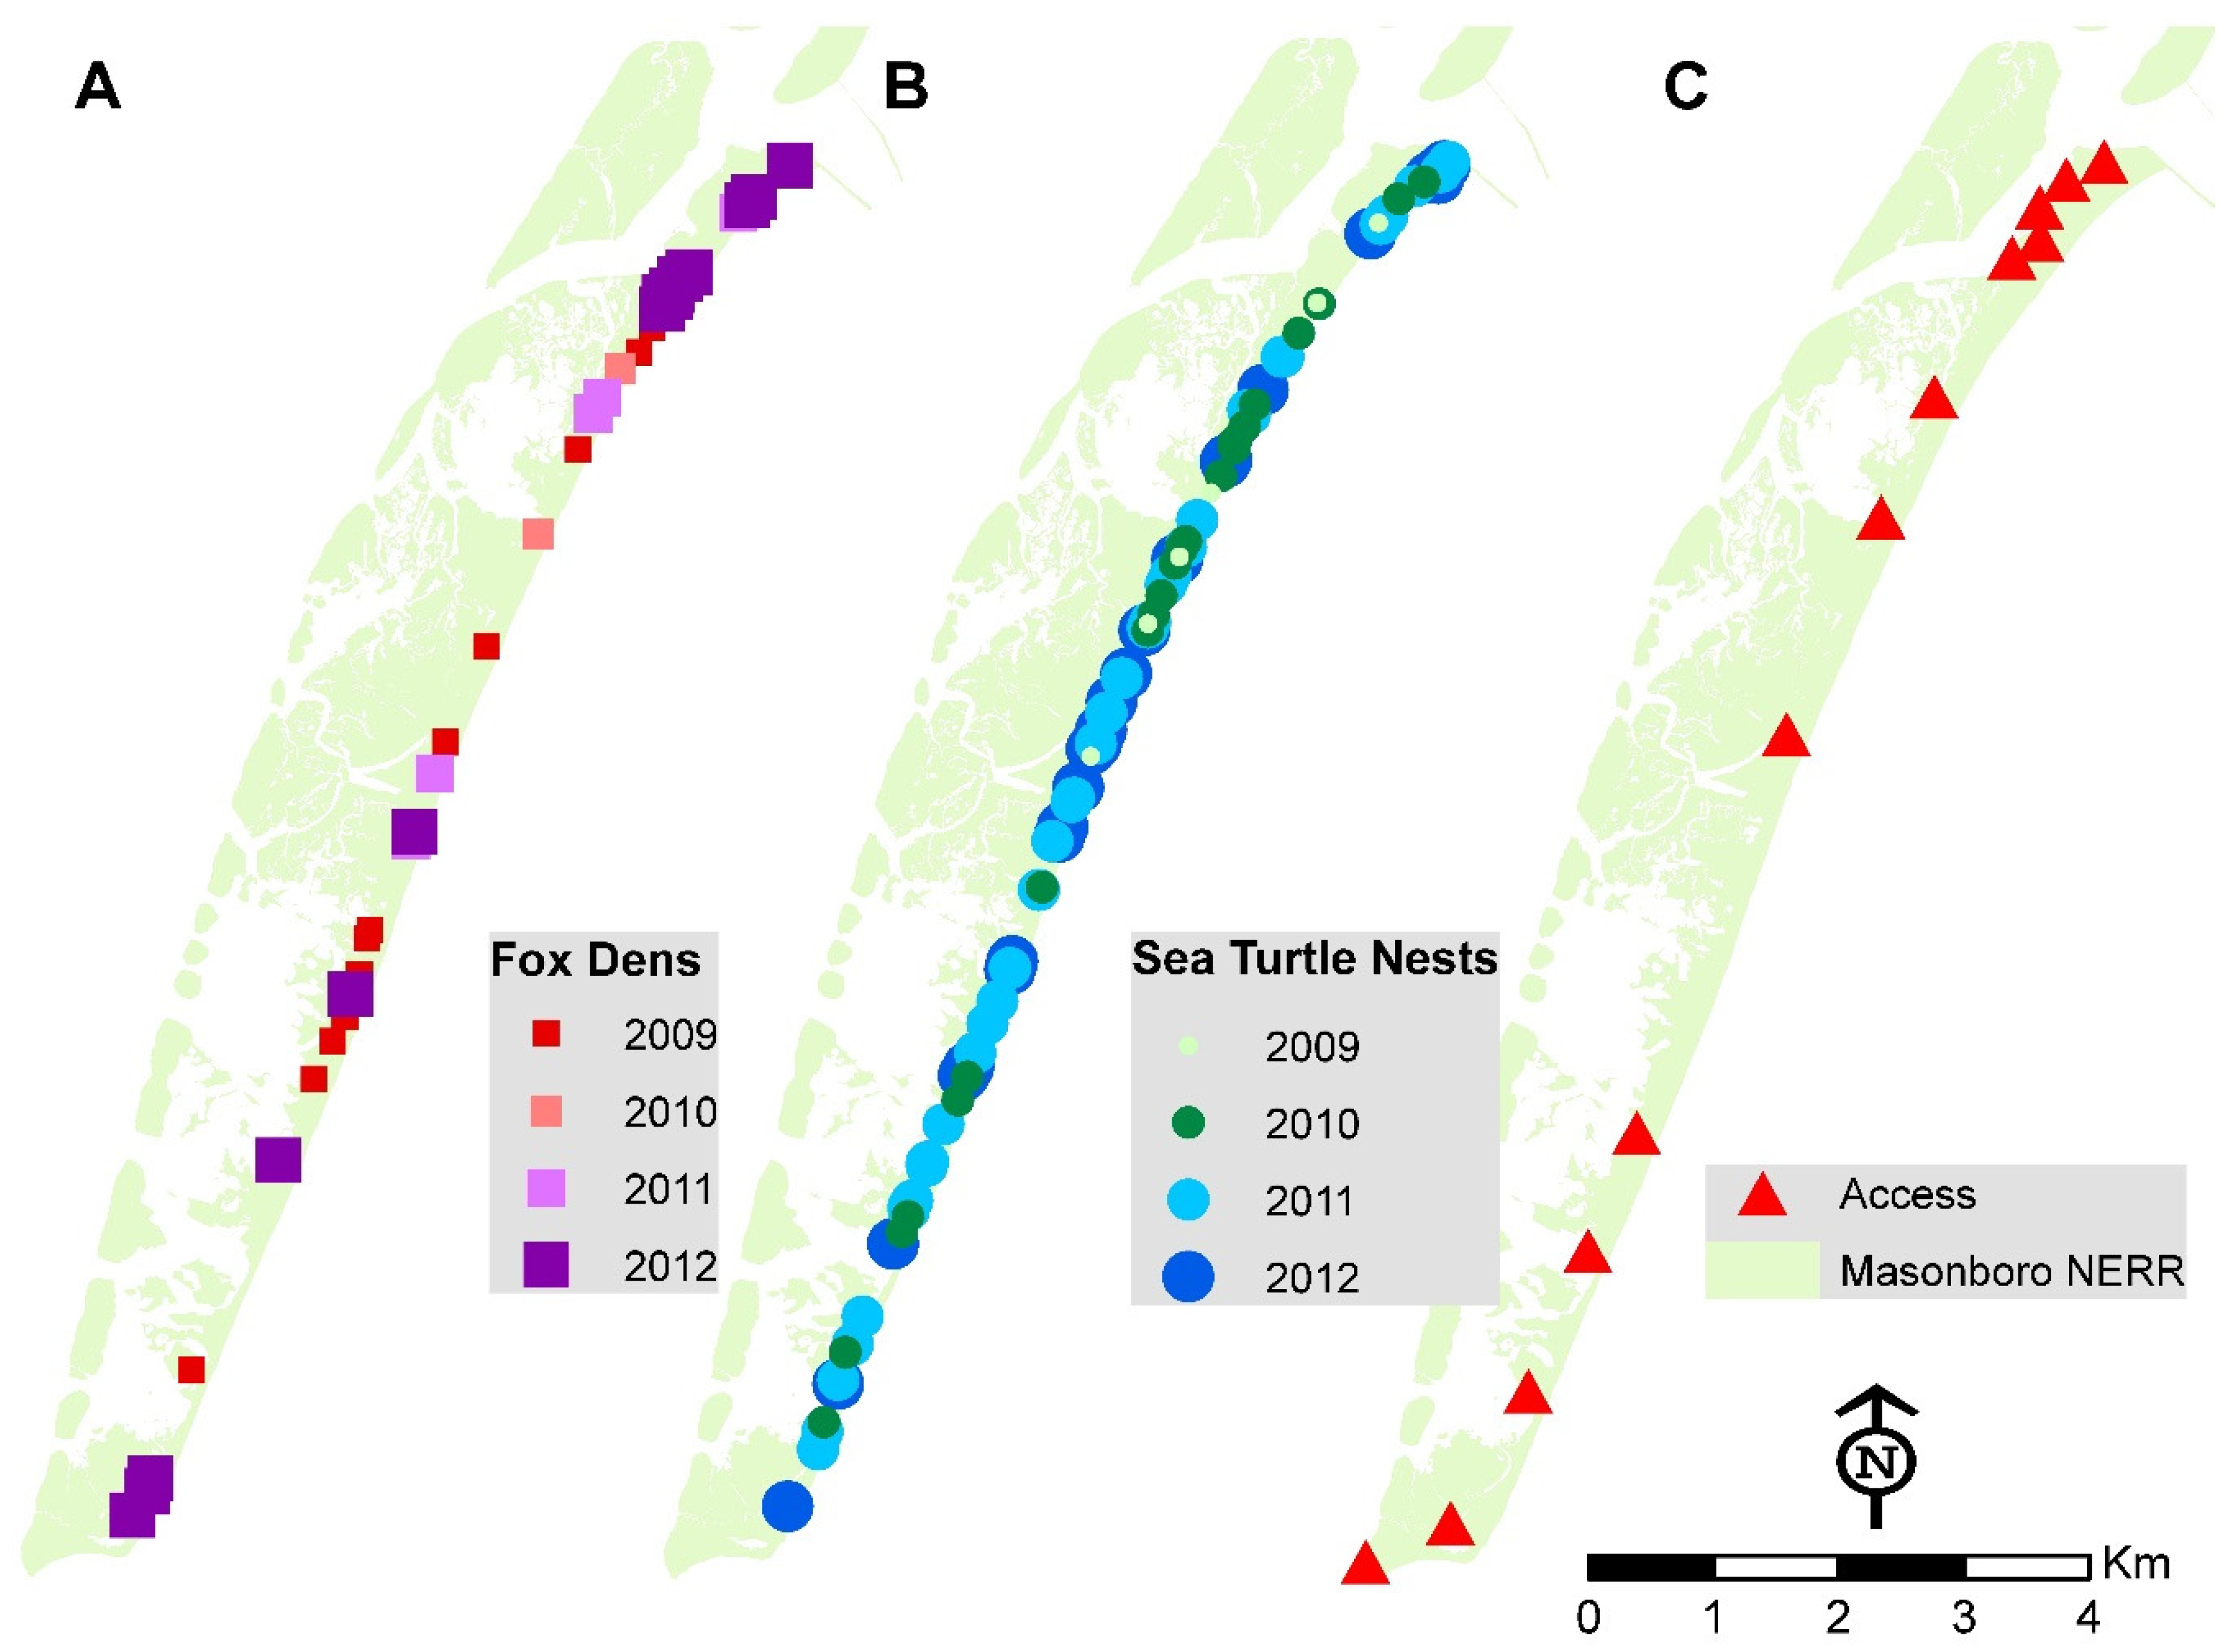
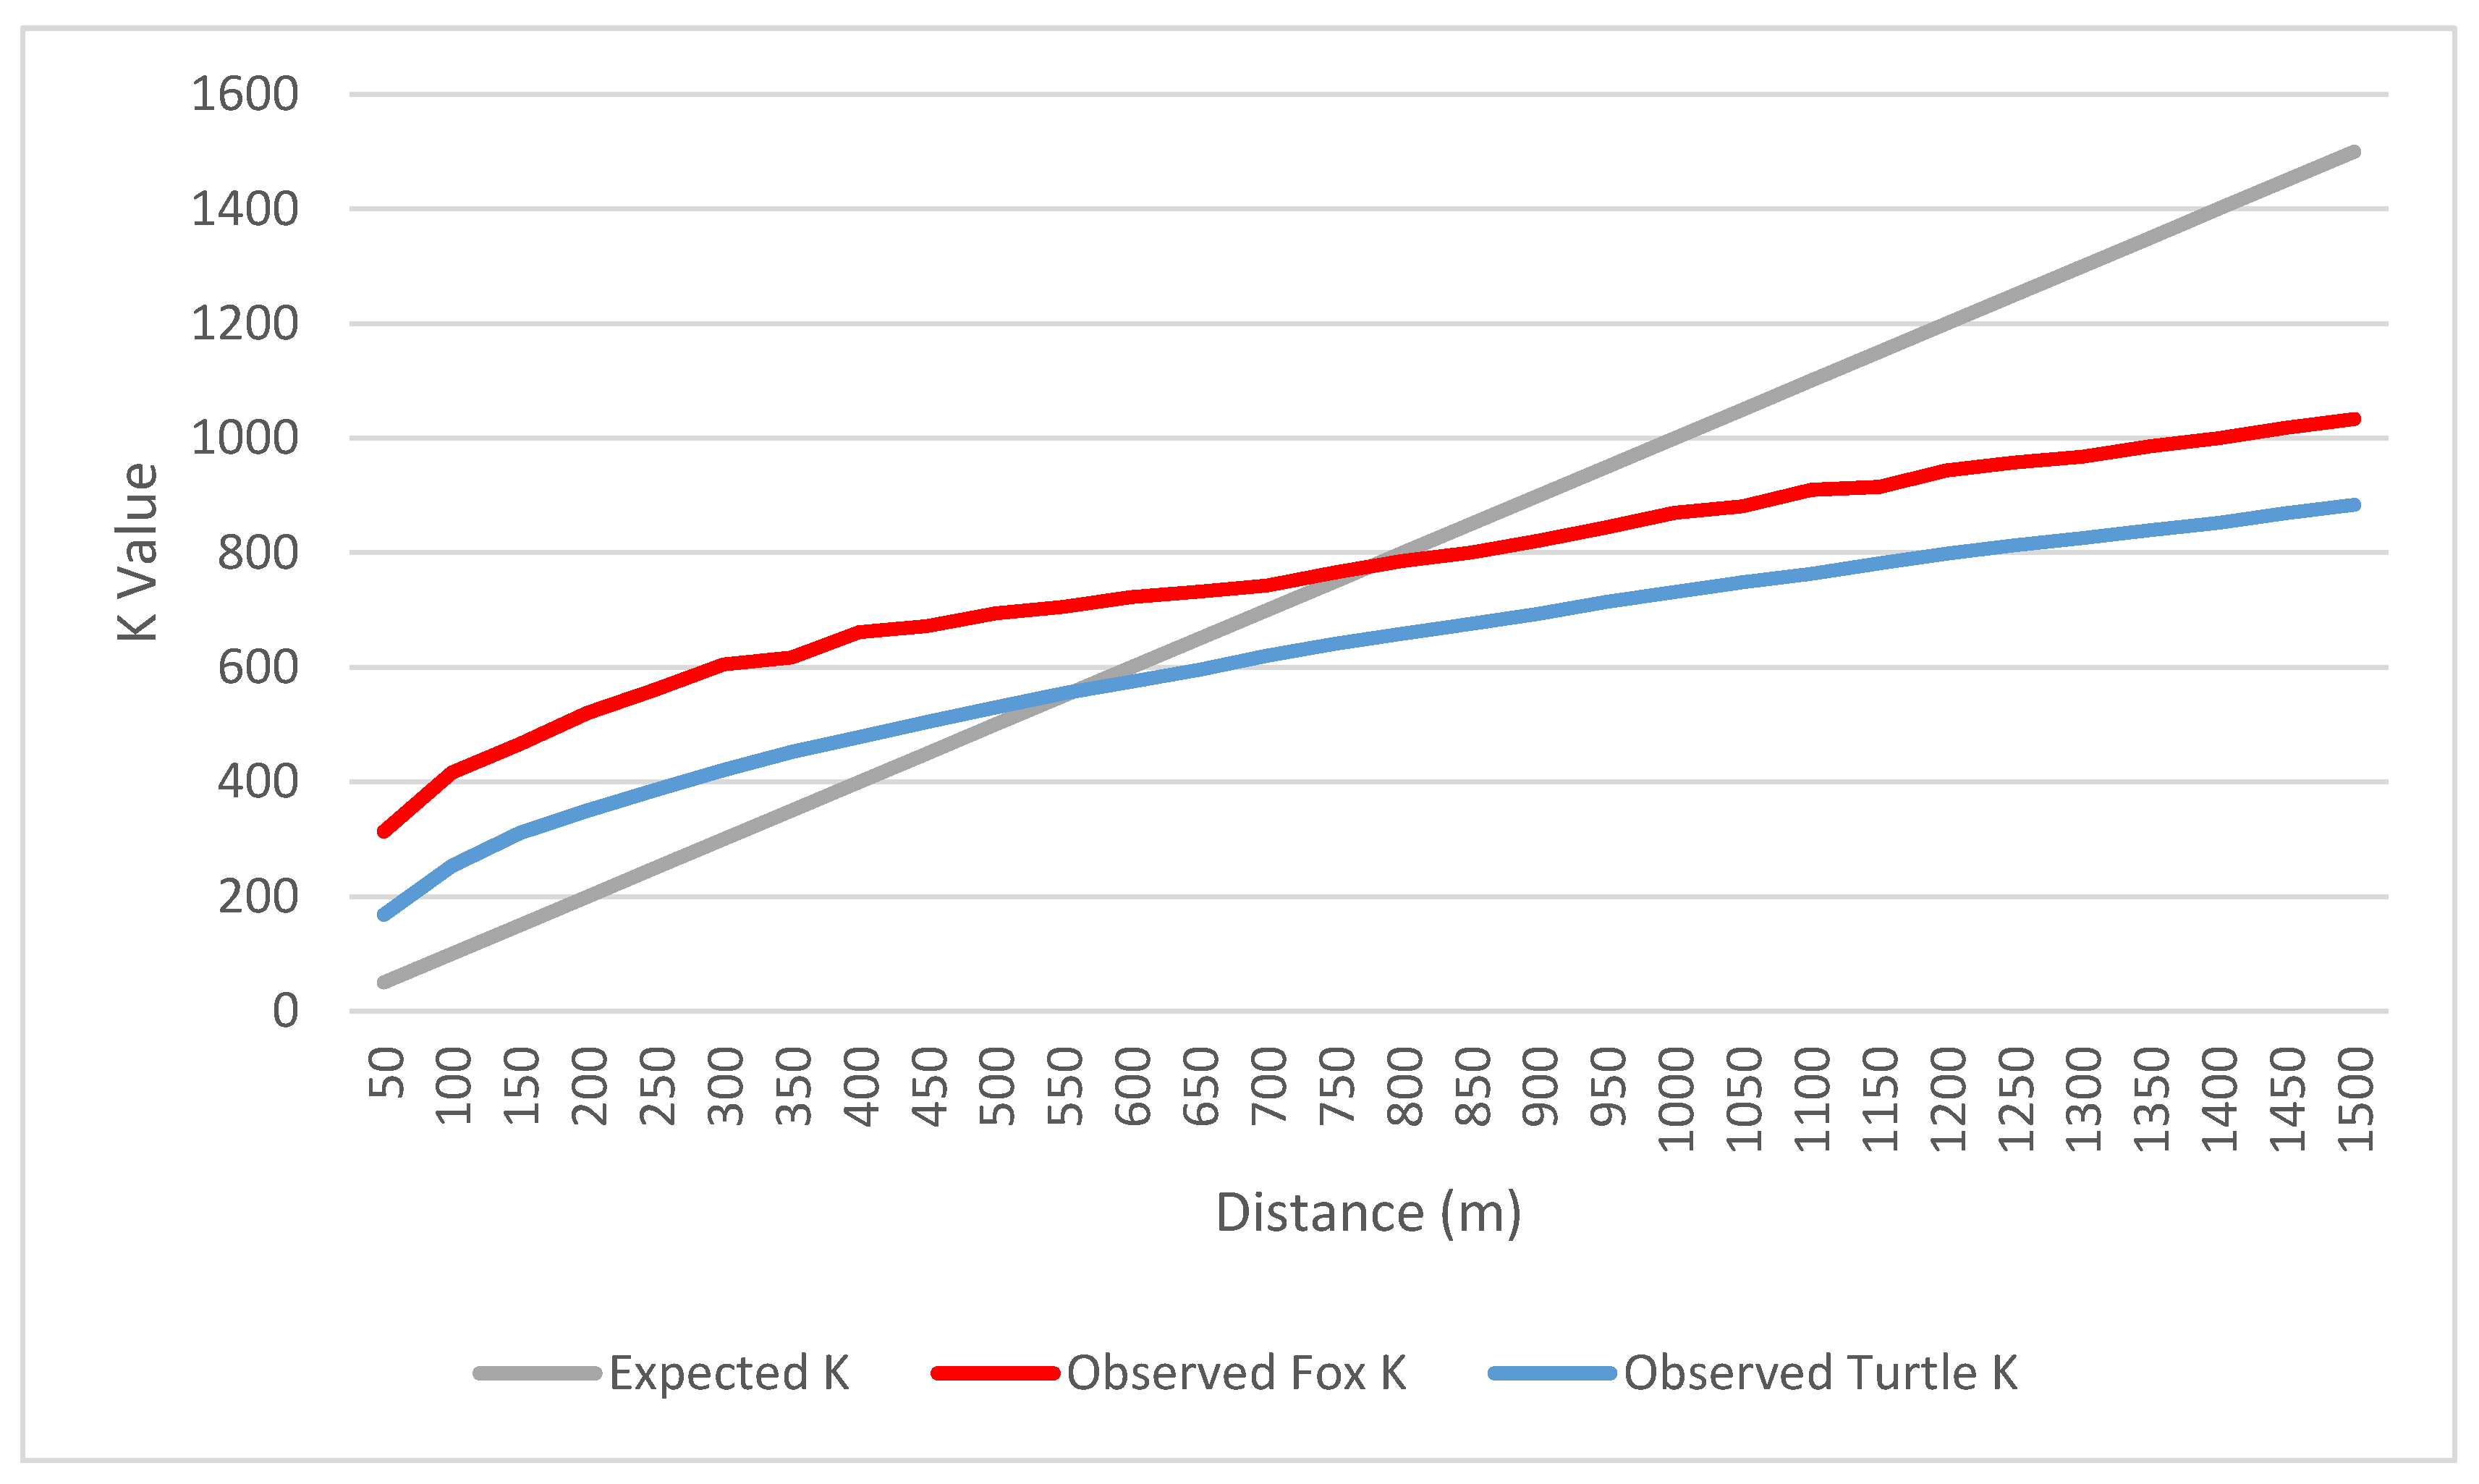
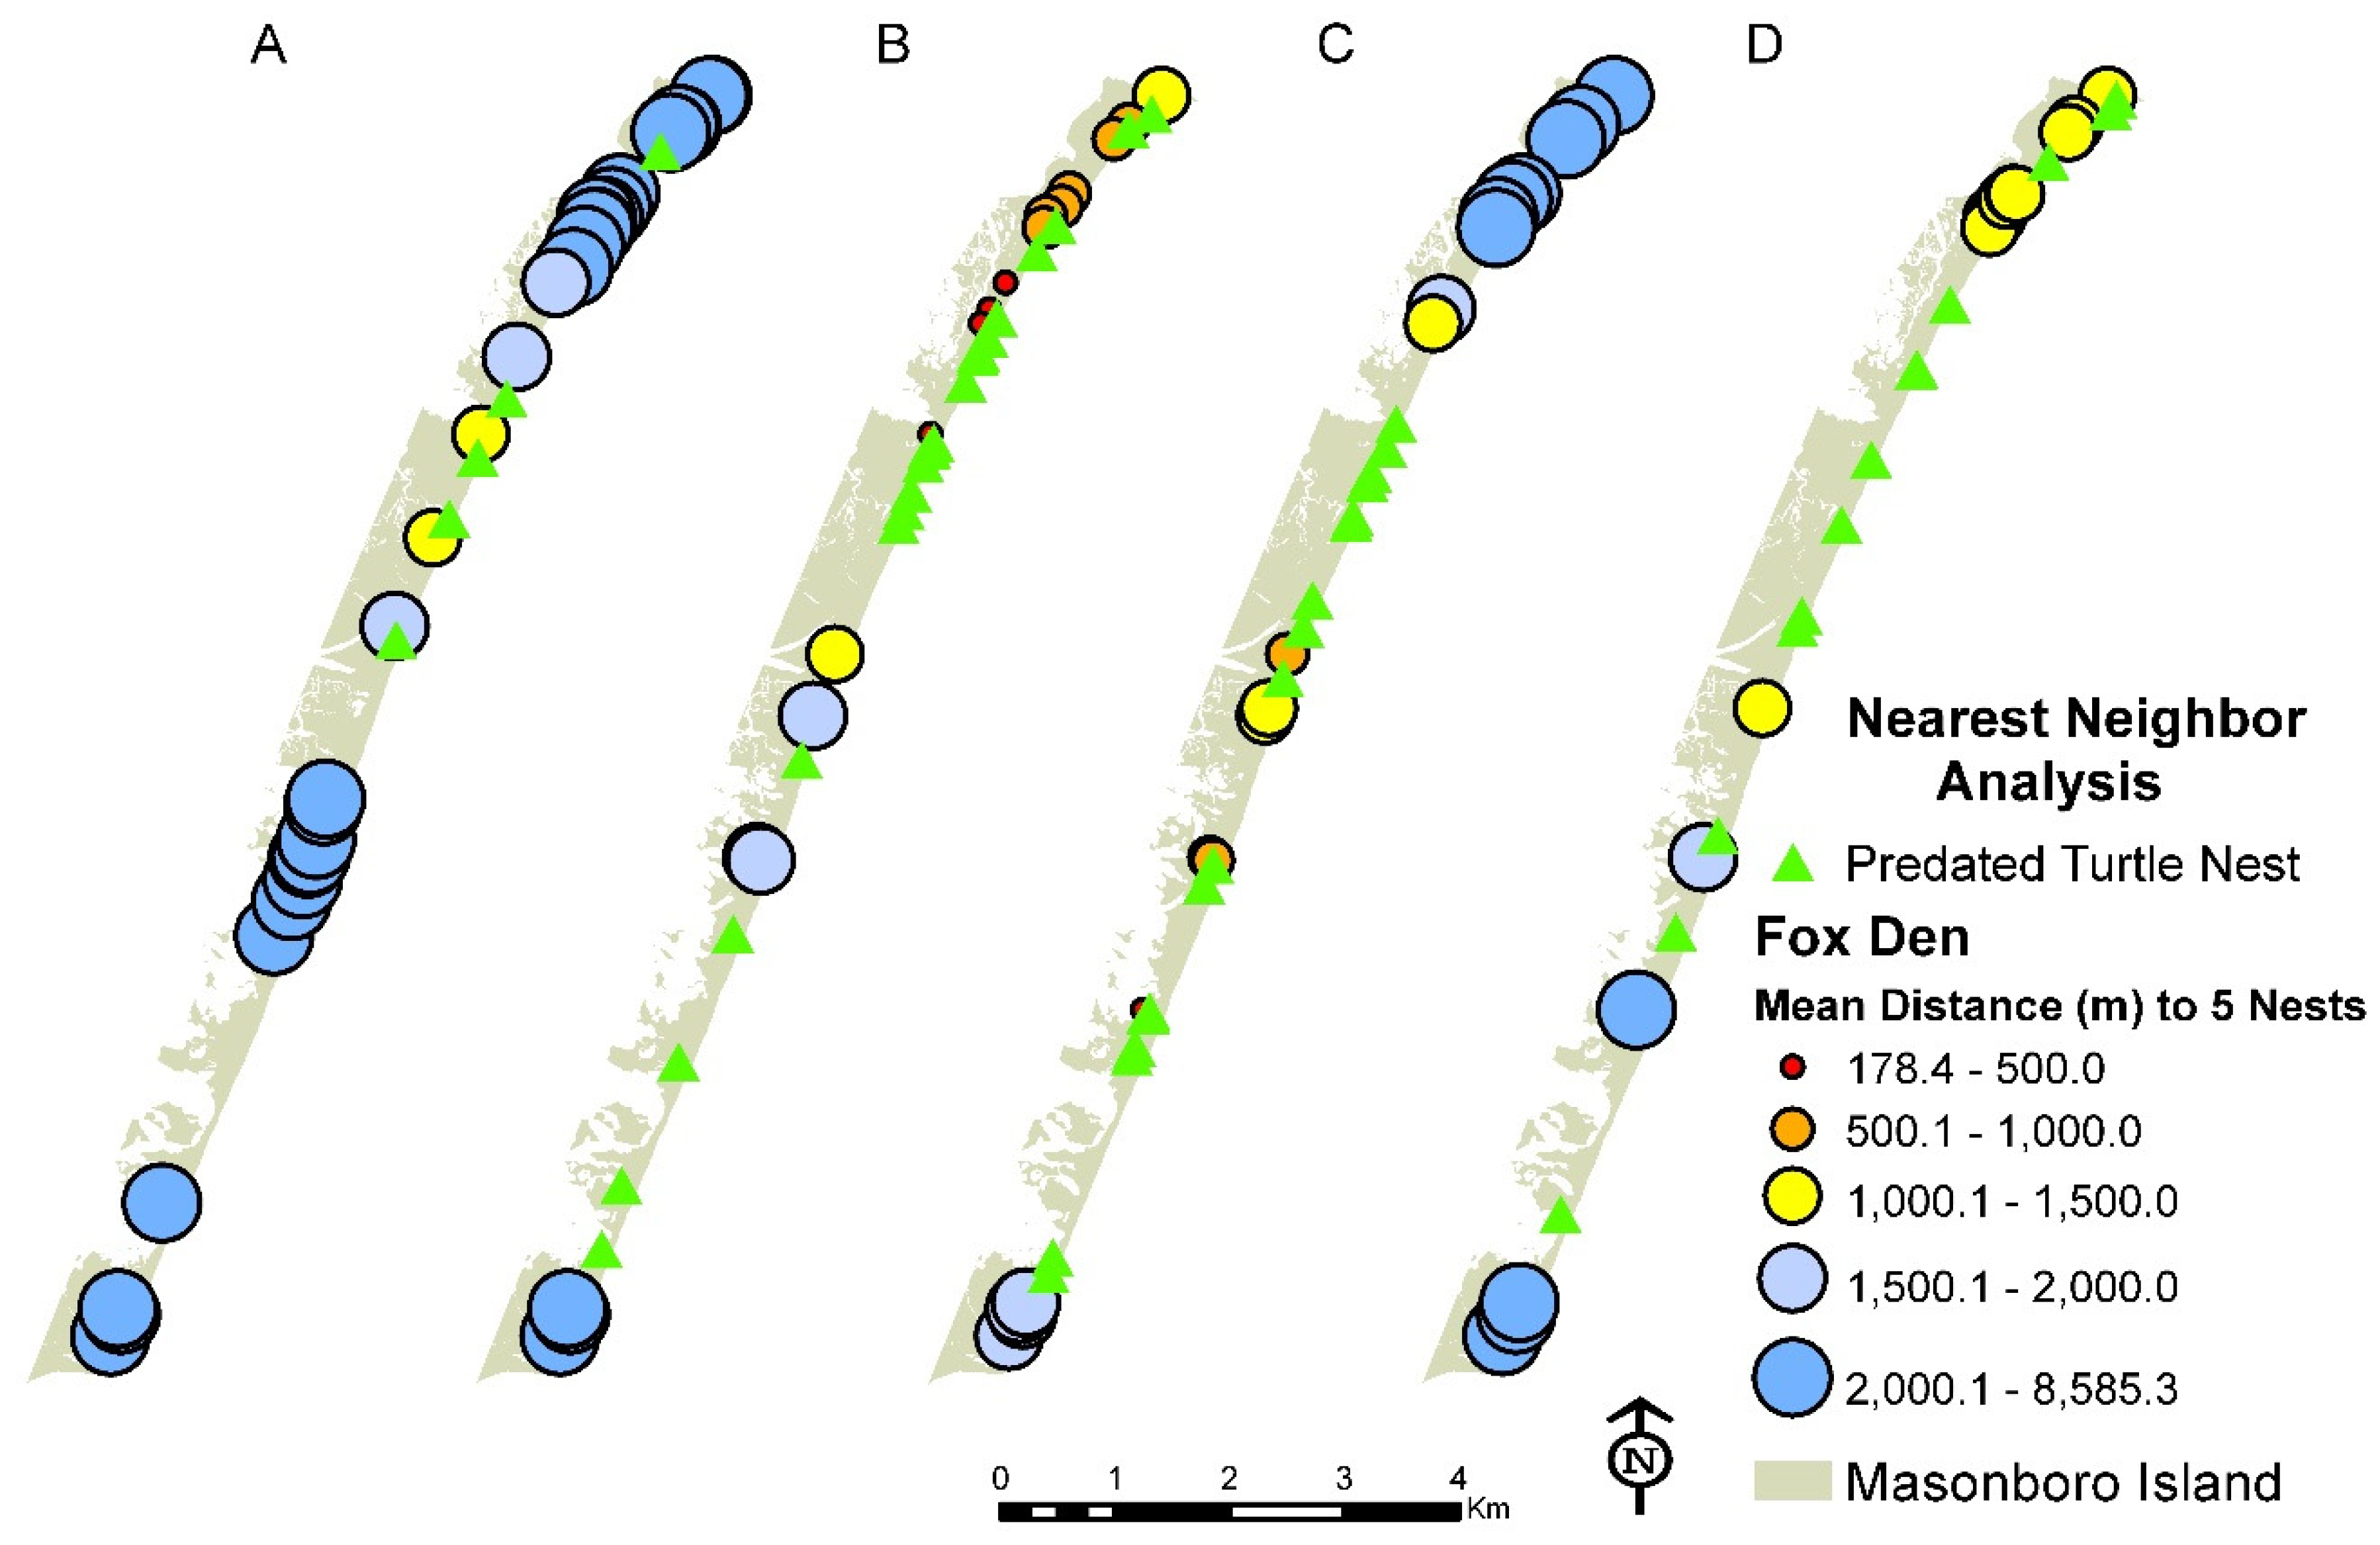
3.1. Distribution of Fox Den Entrances and Sea Turtle Nests

The total number of fox den entrances from 2009 through 2012 was 84 and the Average Nearest Neighbor analysis had significant clustering (p = 0.01). If the den entrances were equally spaced along the length of the study area, this would have equaled one den entrance for each 1.7 km (total length of the island is 13 km). However, the annual den entrance count ranged from a minimum of 16 (2012) to a maximum of 31 (2009) and the average distance between entrances was 200 m. When all years were considered, there was a significant degree of spatial clustering. However, on an annual basis, the den entrances were randomly distributed in 2009, 2010, and 2012 and significantly clustered in 2011 (Table 1). Even though the cluster statistics was not significant in 3 out of 4 years, the observed mean distance was approximately 200 m, which was far less than 1.7 km. Results indicate that some years are not spatially clustered, but the trend over the study period (2009 to 2012) was clustered.
The sea turtle nests and false crawls were significantly clustered based on analysis of all four years, but examination by year (2009 through 2012) showed only 1 year (2011) in which nests were clustered and three years in which turtle nests were regularly spaced, or dispersed across the island (Table 2). Therefore, in general, the sea turtle nests and false crawls were clustered at various locations throughout the study area. Given the long and linear shape of the study area, both the fox den entrances and sea turtles were significantly clustered.
The Ripley K function documented that both the fox den entrance locations and the sea turtle nests/false crawls were clustered at the local level and dispersed across the barrier island study area (Figure 3). There was no significant difference in the K values for the sea turtle nests, false crawls, combined nests, and false crawls.
Given that both the fox den entrances and sea turtle nests were clustered and the degree of clustering was similar using the Ripley K results, the measure of spatial autocorrelation and incremental spatial autocorrelation were used to identify whether the den entrances and sea turtle nests have similar spatial patterns. As described in Section 2.3.1 and Section 2.3.2, the distances between fox den entrances and nearest predated sea turtle nests were calculated and then tested with spatial autocorrelation. Results indicated that den entrances and predated nests were clustered in 2010, 2011, and 2012 but were randomly distributed in 2009. The degree or amount of clustering increased as the number of the nearest predated nests also increased. For example, when the average distance to five neighboring predated nests were used, there was a stronger clustering statistic than the average distance toward two of the nearest predated nests. When all years are considered, there is significant clustering (the relationship is not random) between the den entrances and distance to predated sea turtle nests. In 2009, there were only 5 predated nests out of 9 nests that year. This is a very low number of nests and may be considered an anomaly. Therefore, when there is an average number of sea turtle nests, the yearly results documented clustering between fox den entrances and sea turtle nests and the average distances between entrances and nests varied across the study area (Figure 4).
Results for the Spatial Autocorrelation of fox den entrances using the entrance count within 100 m, 300 m, 500 m, 700 m, and 900 m radii shows that none were clustered at any of these distances. Therefore, the den entrance count did not have significant clusters but the distance to predated nests was clustered. The Incremental Spatial Autocorrelation results indicate that there was significant clustering at distances from 200 m to 800 m using 3, 4, and 5 nearest neighbor distance averages.
Cluster analysis was used to test whether the locations of fox den entrances were related to the distance to the nearest predated sea turtle nests. A spatial sensitivity of the cluster analysis was conducted by clustering the nearest 3, 4, and 5 predated sea turtle nests and all results were the same. Therefore, the number of neighbors is not relevant. However, the location of den entrances and distance to nests resulted in significant clusters across the study area (Figure 5).
There were significant high clusters in the furthest southern part of the island, which means the den entrances are spatially clustered in this location and they had high distances to the predated sea turtle nests. Conversely, the northern end of the island had a significant clustering of dens, but the distances to turtle nests were significantly less than at the southern end. Of the four years in the study, 2011 had different clustering results where the only clustering of den entrances occurred in the north and these were much further from the turtle nests than in other years.

3.2. Distribution of Fox Dens and Boating Access Sites

The distance between fox den entrances and island boating access sites was computed in order to determine whether den entrance spatial clustering is sensitive to a human presence. Given that Masonboro Island is accessible only via boat, recreational use tends to be greater and the subsequent impact is greater as well at boat access sites. Similar to the earlier results, the den entrance locations in 2010, 2011, 2012, and all years combined were statistically clustered with respect to the mean distance to the nearest two boat access sites (Figure 6). The 2009 entrance locations were not clustered with respect to the access sites.
Cluster analysis was used to test whether or not the locations of fox den entrances were related to the distance to the nearest boat access site. The locations of den entrances and the distance to access sites resulted in significant clusters across the study area (Figure 7).
Each year (2009 through 2012) had significant clusters in the northern end of the island where there are shorter distances to the boat access sites. Unlike the distance to predated sea turtle nests, the middle of the island had some clustering with access sites. In addition, the southern end did not have any significant clusters related to the access sites.

3.3. Distribution of Fox Den Entrances Versus Island Topography

Similar to predated turtle nests and the access sites, the fox den entrance locations in 2010, 2011, 2012, and all years combined were statistically clustered relative to the mean elevation at a 20 m radius around each entrance. The 2009 den entrance locations were not clustered relative to the mean elevation. The mean elevation of den entrances resulted in significant clusters across the study area (Figure 8).
The northern end of the island, which has the tallest dunes, showed significant clusters with higher elevations. Conversely, some significant clusters were located at the southern end of the island where elevation is much lower and dunes are smaller. In 2009, the year that did not have an overall significant clustering by elevation, there were local clusters of den entrances at low elevations in the middle section of the island.

3.4. Relationship between Dependent and Independent Variables

The Ordinary Least Squares regression model was computed for each year and for all combinations of the independent variables. For example, OLS results for individual independent variables were not statistically correlated to fox den entrances. However, when all three independent variables were used, 42% of the variance was explained with elevation being the strongest variable. Then distance to predated sea turtle nests and then a very small, but significant, contribution showed the distance to boat access sites.
# Fox Den Entrances = −20.7 + 13.35 × [Elevation] − 0.857 × [Turtle] + 0.000005 × [Access]
This global regression equation was used to predict the number of fox den entrances by zone (Figure 9). Additionally, the residuals are the difference between the predicted number of fox den entrances and the observed number (dependent variable).
The regression equation had the lowest residuals in several places along the length of the study area. The model overestimated the number of den entrances in the far north, far south, and one location in the middle of the area. The model also underestimated them in several locations throughout the study area. Given that this is a global equation for the study area and the earlier results document significant clusters, this equation is a good representation of the importance of the independent variables. However, the Geographic Weighted Regression provides unique equations for each zone polygon, which are useful when a global equation cannot estimate clustered data. The results of the GWR analysis including the predicted number of den entrances, residuals, and local R2 are shown in Figure 10.
The GWR model did not improve the overall R2 values. However, the model performed better in the northern part of the study area where there was a larger number of fox den entrances. To test the robustness of the OLS model versus the GWR model, the residuals from each model were compared. Differences were small and ranged from −0.6 to 0.1. Although the OLS results were not significant when testing only the elevation independent variable, it was clearly the most important variable in both OLS and GWR. So a GWR was tested with only an elevation as the predictor. The model produced larger residuals (−5 to 11) and lower R2 ranged from very low (0.05) in the southern end of the island to higher (0.33) in the north. Therefore, the GWR model with all significant variables is the best approach for predicting the number of fox den entrances. These results indicate that elevation is the most important predictor for fox den entrance locations, but it is far more important in the north where the dunes are much taller. Based on results presented above, it is not surprising that the GWR and OLS produced similar results where elevation was the most important independent variable. However, the local GWR equations more accurately predicted the distribution of fox den entrances.

4. Discussion and Conclusions

4.1. Wildlife Patterns and Predictions

In most years (3 out of 4), clustering of red fox den entrances was positively correlated with dune elevation and inversely related to the distance to predated sea turtle nests and the distance to island access. In 2009, there were very few predated sea turtle nests (only 6 out of 9 nests), which resulted in the lack of a significant relationship with the location of red fox den entrances to dune elevation. However, the other variables remained significant. Although there were significant annual results, care must be taken to evaluate the significance because only one year (2009) had more than 30 observations of fox den entrances. It is not required to have 30 observations, but less than 30 could result in an increased error of omission and commission.
Red fox home ranges in the U.S. can range from 3.9–1.02 km2 [32], which can be extrapolated to one family of foxes inhabiting the island each year. Additionally, foxes will have multiple den sites and a single den can have up to 20 different entrances [5,33]. Approximately 70% of dens used by foxes are temporary in nature and act as shallow retreats during hunting while one complex den is often used to raise litters [5]. Similarly, we identified only one complex den on the island and all others likely were temporary retreats. Fox families will use the complex dens from late February to late June until pups are weaned. The families use the entirety of the home range until the pups disperse in late September to October [5]. The use of a complex den and retreat dens along the island corresponds directly with the nesting season for sea turtles. Fox will also reuse den sites each year [6] in lieu of creating new ones. As such, it is not surprising that the den entrances were clustered when data were pooled across four years especially given the relationship to dune height and boat access in the northern part of the island.
The red fox can traverse 10 km daily [34], but movement patterns within their home range are strongly influenced by the distribution of food resources [5,33]. The red fox den entrances were highly clustered and had shorter mean distances to boat accesses and predated turtle nests in the northern part of the island. Combined with a potentially more preferred habitat (i.e., taller dunes) and a denser food resource distribution due to turtle nests and human refuse, it is unsurprising then that fewer den entrances and predated nests were found along the middle portion of the island. In the south, boat access sites and predated nests were more important drivers to fox den clustering than dune elevation. Even though dune elevation is the strongest variable, in the south, this variable is less important when compared to the north where there are taller dunes.
Our regression models account for 40% of the variance in the data. Predictive models (OLS and GWR) can never achieve a complete explanation for all variance and future research, which will consider additional variables that may improve model performance. For example, research has found that there is a correlation between the presence of coyotes and the abundance of red foxes [35]. It has also been found that the density of red fox dens is related to the distribution of hares, but not other rodents (voles) [36]. Identification of red fox prey species as well as their distribution on Masonboro Island may improve predictive modelling as well.

4.2. Assumptions

The primary assumption for this project was that the location of red fox den entrances represents the central tendency for the location of the red fox. The fox den entrance survey did not attempt to achieve better mapping precision above 15 m. Therefore, the assumption is that the location of fox den entrances is no better than 30 m (±15 m). The spatial resolution of the GPS data, both red fox den entrances and sea turtle nests, may have affected the clustering analyses and spatial statistics. The variation in distances between fox den entrances and predated sea turtle nests was significantly different in the north, middle, and southern parts of the study area. Therefore, it is unlikely these results are due to chance. However, future surveys should record GPS coordinates with greater precision.
Given that there is no location data for all recreation activities (e.g., camping and beach), the assumption was that the location of boat access sites are close to where recreation activity occurs because people do not venture far from the boating access sites to use the island. This assumption was grounded in prior research on the distribution of recreational use at Masonboro Island [8,37].

4.3. Management Implications

The results of this study have direct implications for the management of human recreational use and red fox predation of sea turtle nests on barrier islands. Given that the present study found a positive relationship between dune elevation and clustering of red fox den entrances, efficiency and effectiveness of associated predator control operations to minimize sea turtle nest predation could be focused on areas that exhibit sizeable fore and back dune topography. Such focused efforts may optimize the effort and expense required in predator control operations including in both management and monitoring.
Furthermore, since the present study found a positive relationship between boating access locations and the density of red fox den entrances, management of recreational use of barrier islands during the sea turtle nesting season may enhance efforts to reduce nest predation. These management activities may be focused upon direct external locus of control such as regulation of boating access. Restricting boat access during the nesting season may also alleviate potential Domestic Dog (Canis familiaris) predation on sea turtle eggs, which have been reported to cause 5–50% of sea turtle nest failure throughout Central America [38,39,40,41]. However, indirect internal locus of control efforts such as education regarding refuse disposal may be received more positively by the public and be equally as effective. For example, public education of the role that refuse plays in supplementing predator diets is a positive method for helping to control the predator population since many visitors may not have considered the impact that refuse has on the biology of the site.
Finally, it is likely that the management of red fox populations, either directly through predator control or indirectly through alteration of recreational behavior, may have ancillary benefits to other species as well. For example, red fox preyed on water-birds (waterfowl, gulls, and rails) in a similar coastal setting in Spain, especially during the breeding season [42]. Given the abundance of water-bird nesting on Masonboro Island, it would be prudent to review potential management strategies to determine whether red fox predator control operations would have ancillary benefits in protecting water-bird populations and perhaps other species as well.

5. Conclusions and Future Work

A series of spatial analysis techniques were used to investigate the distribution of fox den entrances and relationships with predated sea turtle nests, island topography, and boat access sites. Spatial autocorrelation analyzed the fox dens, which were highly clustered (p = 0.01). Den entrances located on the north end of the island were significantly closer to the turtle nests than the den entrances on the south end of the island. Den entrances in the middle of the island were not significantly clustered. The north end has significantly higher dunes in comparison to the middle and south end of the island. This correlates with the shorter distances between the fox den entrances and the predated turtle nests. Access points were close to the den entrances, which confirms that the foxes are opportunistic and find human refuse to consume. However, the access points are spread across the entire island and, therefore, this variable is less useful in predicting the location of fox den entrances.
Given the statistical relationships identified in this study, the next step is to create a habitat suitability model using terrain (elevation and slope), geomorphology (dunes and swales), and habitat. The purpose for developing a species distribution model using habitat suitability is to create maps of potential locations of fox den entrances given the input data. The spatial regression approach used in this current study has created prediction maps, but by using the derived significant independent variables, a species distribution model is another approach that may lead to additional insight into the potential spatial distribution of the red fox species. For example, others have used maxent to predict the invasion of Tamarix in the Western United States [43]. Background information on species distribution modeling can be found in Reference [44]. Another open source software called VisTrails was developed to model species distribution and incorporates workflow documentation so that sensitivity in input data can be tested [45].
Given the importance of elevation and the preference to be located on the backside of dunes, this information can be used to refine the location probability by incorporating detailed topographic information such as identifying areas above the highest tide, adjacent to the dune field, and adjacent to swales that have slight slopes that reduce exposure. During rain events, small depressions (e.g., swales) can collect water. This is a good source of freshwater. Additionally, we can add land cover where dens would be within open or upland grass but not within scrub/shrub or maritime forest.
A spatial simulation model of the red fox was developed using data collected from wildlife cameras in Grampians National Park, Australia [46]. Simulation models are possible when there is spatial data that is related to the predicted species at a spatial scale relevant to the species’ habitat use [47]. ST-Sim (State-and-Transition Simulation) is open-source software that has been used to develop models that integrate existing data and knowledge about species behavior, can identify gaps or missing data, and can explore “what if” scenarios such as management strategies and habitat changes [48,49]. Future work on Masonboro Island will include the development of habitat suitability models and state-and-transition simulation models to estimate the spatial patterns of the red fox species given various management scenarios. Habitat maps of the island and several dates of LiDAR data will be used to develop habitat suitability models. A variety of topographic algorithms and barrier island statistics will be derived in order to build a State-Transition model and then perform scenario simulations to predict the location of fox dens [50,51,52,53,54]. For example, island width, dune shape, configuration, and multiple dune ridges and swales will provide more space to accommodate fox dens and, therefore, create more fox den entrances. Previous research on the Masonboro Island has shown that these geomorphological changes have occurred through time and can be measured from LiDAR data [51,55]. Therefore, spatial metrics of island features will be incorporated into both habitat suitability models and state-transition models to predict the future habitat availability for red fox dens.

Author Contributions

J.N.H. and J.M.H. handled the conceptualization. J.N.H. was responsible for the methodology. J.N.H. managed the software. J.M.H. and R.E.U. took part in validation of the results. J.N.H. performed the formal analysis. J.N.H., J.M.H. and R.E.U. were responsible for the investigation. H.S. handled the resources. J.N.H. curated the data. J.N.H. wrote and prepared the original draft; J.N.H., J.M.H., R.E.U. and H.S. reviewed and edited the draft. J.N.H. managed the visualization. J.N.H. supervised and administered the project.

Funding

This research received no external funding.

Acknowledgments

The authors would like to thank the North Carolina Coastal Reserve and the National Estuarine Research Reserve for granting a research permit and providing boat transportation to the island. We express our gratitude to James Herstine and Bob Buerger for contributing to conceptualizing the initial project and participating in the fieldwork. Sarah Chahin, graduate student in the MS in Geoscience program at the University of North Carolina Wilmington, provided assistance in creating Figure 1.

Conflicts of Interest

The authors declare no conflict of interest.

References

  1. Kamler, J.F.; Ballard, W.B. A review of native and nonnative red foxes in North America. Wildl. Soc. Bulletin 2002, 30, 370–379. [Google Scholar]
  2. Statham, M.; Sacks, B.; Aubry, K.; Perrine, J.; Wisely, S. The origin of recently established red fox populations in the united states: Translocations or natural range expansions? J. Mammal. 2012, 93, 52–65. [Google Scholar] [CrossRef]
  3. NCWRC. Fox and Coyote Populations Study Final Report; North Carolina Wildlife Resources Commission: Raleigh, NC, USA, 2012. [Google Scholar]
  4. Albers, G.; Day, K.A.; Olfenbuttel, C.; Sawyer, D.; Sumner, P. Red Fox: North Carolina Wildlife Profiles. North Carolina Wildlife Resources Commission: Raleigh, NC, USA, 2017. Available online: http://www.ncwildlife.org/Portals/0/Learning/documents/Profiles/RedFox_1.pdf (accessed on 15 September 2017).
  5. Sheldon, W.G. Denning habits and home range of red foxes in new-york state. J. Wildl. Manag. 1950, 14, 33–42. [Google Scholar] [CrossRef]
  6. Soulsbury, C.D.; Baker, P.J.; Iossa, G.; Harris, S. Red foxes (vulpes vulpes). In Urban Carnivores: Ecology, Conflict, and Conservation; Gehrt, S.D., Riley, S.P.D., Cypher, B.L., Eds.; John Hopkins University Press: Baltimore, MD, USA, 2010; pp. 63–75. [Google Scholar]
  7. Buerger, R.; Hill, J.; Hertsine, J.; Taggart, J. The impact of recreation on barrier islands: A case study on masonboro island. Coast. Manag. 2000, 28, 249–259. [Google Scholar]
  8. Buerger, R.; Hill, J.; Herstine, J.; Auger, D.; Taggart, J. Re-emerging recreational use patterns on an undeveloped barrier island following the impact of hurricanes: A North Carolina case study. Soc. Nat. Resour. 2003, 16, 527–539. [Google Scholar] [CrossRef]
  9. Rabon, D. Green Sea Turtles in North Carolina. Available online: https://www.fws.gov/nc-es/reptile/greensea.html (accessed on 18 May 2017).
  10. Rabon, D. Loggerhead Sea Turtles in North Carolina. Available online: https://www.fws.gov/nc-es/reptile/logger.html (accessed on 18 May 2017).
  11. Kurz, D.; Straley, K.; DeGregorio, B. Out-foxing the red fox: How best to protect the nests of the endangered loggerhead marine turtle caretta caretta from mammalian predation? Oryx 2012, 46, 223–228. [Google Scholar] [CrossRef]
  12. Esri. Arcgis; 10.5.1; Esri: Redlands, California, USA, 2017. [Google Scholar]
  13. Bailey, T.C.; Gatrell, A.C. Interactive Spatial Data Analysis; J. Wiley: New York, NY, USA, 1995; p. 413. [Google Scholar]
  14. Fritz, C.E.; Schuurman, N.; Robertson, C.; Lear, S. A scoping review of spatial cluster analysis techniques for point-event data. Geospat. Health 2013, 7, 183–198. [Google Scholar] [CrossRef] [PubMed]
  15. Ma, Z.; Zuckerberg, B.; Porter, W.F.; Zhang, L. Use of localized descriptive statistics for exploring the spatial pattern changes of bird species richness at multiple scales. Appl. Geogr. 2012, 32, 185–194. [Google Scholar] [CrossRef]
  16. Wilkins, D.E.; Ford, R.L. Nearest neighbor methods applied to dune field organization: The coral pink sand dunes, Kane County, Utah, USA. Geomorphology 2007, 83, 48–57. [Google Scholar] [CrossRef]
  17. Law, R.; Illian, J.; Burslem, D.; Gratzer, G.; Gunatilleke, C.V.S.; Gunatilleke, I. Ecological information from spatial patterns of plants: Insights from point process theory. J. Ecol. 2009, 97, 616–628. [Google Scholar] [CrossRef]
  18. Getis, A. A history of the concept of spatial autocorrelation: A geographer’s perspective. Geographical Analysis 2008, 40, 297–309. [Google Scholar] [CrossRef]
  19. Anselin, L. Local indicators of spatial association—Lisa. Geogr. Anal. 1995, 27, 93–115. [Google Scholar] [CrossRef]
  20. Medeiros, S.; Hagen, S.; Weishampel, J.; Angelo, J. Adjusting lidar-derived digital terrain models in coastal marshes based on estimated aboveground biomass density. Remote Sens. 2015, 7, 3507–3525. [Google Scholar] [CrossRef]
  21. Mongus, D.; Zalik, B. Parameter-free ground filtering of lidar data for automatic dtm generation. ISPRS J. Photogramm. Remote Sens. 2012, 67, 1–12. [Google Scholar] [CrossRef]
  22. Pietro, L.S.; O’Neal, M.A.; Puleo, J.A. Developing terrestrial-lidar-based digital elevation models for monitoring beach nourishment performance. J. Coast. Res. 2008, 24, 1555–1564. [Google Scholar] [CrossRef]
  23. Rayburg, S.; Thoms, M.; Neave, M. A comparison of digital elevation models generated from different data sources. Geomorphology 2009, 106, 261–270. [Google Scholar] [CrossRef]
  24. Rogers, J.N.; Parrish, C.E.; Ward, L.G.; Burdick, D.M. Assessment of elevation uncertainty in salt marsh environments using discrete-return and full-waveform lidar. J. Coast. Res. 2016, 76, 107–122. [Google Scholar] [CrossRef]
  25. Smeeckaert, J.; Mallet, C.; David, N.; Chehata, N.; Ferraz, A. Large-scale classification of water areas using airborne topographic lidar data. Remote Sens. Environ. 2013, 138, 134–148. [Google Scholar] [CrossRef]
  26. Pe’eri, S.; Long, B. Lidar technology applied in coastal studies and management. J. Coast. Res. 2011. [Google Scholar] [CrossRef]
  27. Gosselink, T.E.; Van Deelen, T.R.; Warner, R.E.; Joselyn, M.G. Temporal habitat partitioning and spatial use of coyotes and red foxes in east-central Illinois. J. Wildl. Manag. 2003, 67, 90–103. [Google Scholar] [CrossRef]
  28. Hamilton, L. Regression with Graphics: A Second Course in Applied Statistics; Duxbury Press: Belmont, CA, USA, 1992. [Google Scholar]
  29. Fotheringham, A.S.; Brunsdon, C.; Charlton, M. Geographically Weighted Regression: The Analysis of Spatially Varying Relationships; Wiley: Hoboken, NJ, USA, 2002. [Google Scholar]
  30. Crawford, T.W.; Marcucci, D.J.; Bennett, A. Impacts of residential development on vegetation cover for a remote coastal barrier in the outer banks of North Carolina, USA. J. Coast. Conserv. 2013, 17, 431–443. [Google Scholar] [CrossRef]
  31. Kim, J.; Nicholls, S. Using geographically weighted regression to explore the equity of public open space distributions. J. Leis. Res. 2016, 48, 105–133. [Google Scholar] [CrossRef]
  32. Trewhella, W.; Harris, S.; McAllister, F. Dispersal distance, home-range size and population-density in the red fox (vulpes vulpes)—A quantitative analysis. J. Appl. Ecol. 1988, 25, 423–434. [Google Scholar] [CrossRef]
  33. Ables, E.D. Ecology of the red fox in america. In The Wild Canids; Fox, M.W., Ed.; Van Nostrand Reinhold: New York, NY, USA, 1975; pp. 216–235. [Google Scholar]
  34. Voight, D.R. Red fox. In Wild Furbearer Management and Conservation I North America; Novak, M., Baker, J.A., Obbard, M.E., Malloch, B., Eds.; Ontario Trappers Association and Ontario Ministry of Natural Resources: Ottawa, ON, Canada, 1987; pp. 379–392. [Google Scholar]
  35. Newsome, T.; Ripple, W. A continental scale trophic cascade from wolves through coyotes to foxes. J. Anim. Ecol. 2015, 84, 49–59. [Google Scholar] [CrossRef] [PubMed]
  36. Panek, M. Factors affecting predation of red foxes vulpes vulpes on brown hares lepus europaeus during the breeding season in Poland. Wildl. Biol. 2009, 15, 345–349. [Google Scholar] [CrossRef]
  37. Hill, J.; Herstine, J.; Buerger, R.; Snider, A. North Carolina Coastal Reserve Program Initiatives, Unpublished data. 2008.
  38. Fowler, L.E. Hatching success and nest predation in the green sea turtle, chelonia-mydas, at tortuguero, costa rica. Ecology 1979, 60, 946–955. [Google Scholar] [CrossRef]
  39. Hitipeuw, C.; Dutton, P.; Benson, S.; Thebu, J.; Bakarbessy, J. Population status and internesting movement of leatherback turtles, dermochelys coriacea, nesting on the Northwest Coast of Papua, Indonesia. Chelonian Conserv. Biol. 2007, 6, 28–36. [Google Scholar] [CrossRef]
  40. Ordonez, C.; Troeng, S.; Meylan, A.; Meylan, P.; Ruiz, A. Chiriqui beach, panama, the most important leatherback nesting beach in central America. Chelonian Conserv. Biol. 2007, 6, 122–126. [Google Scholar] [CrossRef]
  41. Patino-Martinez, J.; Marco, A.; Quinones, L.; Godley, B. Globally significant nesting of the leatherback turtle (dermochelys coriacea) on the caribbean coast of Colombia and Panama. Biol.Conserv. 2008, 141, 1982–1988. [Google Scholar] [CrossRef]
  42. Ruiz-Olmo, J.; Blanch, F.; Vidal, F. Relationships between the red fox and waterbirds in the ebro delta natural park, ne spain. Waterbirds 2003, 26, 217–225. [Google Scholar] [CrossRef]
  43. Jarnevich, C.; Evangelista, P.; Stohlgren, T.; Morisette, J. Improving national-scale invasion maps: Tamarisk in the western United States. W. N. Am. Nat. 2011, 71, 164–175. [Google Scholar] [CrossRef]
  44. Pearson, R.G. Species’ distribution modeling for conservation educators and practitioners. Synth. Am. Mus. Nat. Hist. 2007, 3, 54–89. [Google Scholar]
  45. Morisette, J.; Jarnevich, C.; Holcombe, T.; Talbert, C.; Ignizio, D.; Talbert, M.; Silva, C.; Koop, D.; Swanson, A.; Young, N. Vistrails sahm: Visualization and workflow management for species habitat modeling. Ecography 2013, 36, 129–135. [Google Scholar] [CrossRef]
  46. Ramsey, D.S.L.; Caley, P.A.; Robley, A. Estimating population density from presence-absence data using a spatially explicit model. J. Wildl. Manag. 2015, 79, 491–499. [Google Scholar] [CrossRef]
  47. West, A.; Evangelista, P.; Jarnevich, C.; Kumar, S.; Swallow, A.; Luizza, M.; Chignell, S. Using multi-date satellite imagery to monitor invasive grass species distribution in post-wildfire landscapes: An iterative, adaptable approach that employs open-source data and software. Int. J. Appl. Earth Observ. Geoinf. 2017, 59, 135–146. [Google Scholar] [CrossRef]
  48. Daniel, C.J.; Frid, L.; Sleeter, B.M.; Fortin, M.J. State-and-transition simulation models: A framework for forecasting landscape change. Methods Ecol. Evolut. 2016, 7, 1413–1423. [Google Scholar] [CrossRef]
  49. Vall-llosera, M.; Woolnough, A.; Anderson, D.; Cassey, P. Improved surveillance for early detection of a potential invasive species: The alien rose-ringed parakeet Psittacula krameri in Australia. Biol. Invasions 2017, 19, 1273–1284. [Google Scholar] [CrossRef]
  50. Brock, J.C.; Krabill, W.B.; Sallenger, A.H. Barrier island morphodynamic classification based on lidar metrics for North Assateague Island, Maryland. J. Coast. Res. 2004, 20, 498–509. [Google Scholar] [CrossRef]
  51. Halls, J.N. Measuring habitat changes in barrier island marshes: An example from Southeastern North Carolina. In Remote Sensing and Geospatial Technologies for Coastal Ecosystem Assessment and Management: Principles and Applications; Yang, X., Ed.; Lecture Notes in Geoinformation and Cartography; Springer: Berlin/Heidelberg, Germany, 2009; pp. 391–413. [Google Scholar]
  52. Houser, C. Feedback between ridge and swale bathymetry and barrier island storm response and transgression. Geomorphology 2012, 173–174, 1–16. [Google Scholar] [CrossRef]
  53. Mitasova, H.; Overton, M.F.; Recalde, J.J.; Bernstein, D.J.; Freeman, C.W. Raster-based analysis of coastal terrain dynamics from multitemporal lidar data. J. Coast. Res. 2009, 25, 507–514. [Google Scholar] [CrossRef]
  54. Halls, J.N.; Frishman, M.A.; Hawkes, A.D. An Automated Model to Classify Barrier Island Geomorphology Using Lidar Data. In Proceedings of the 2nd International Electronic Conference on Remote Sensing, Online. 22 March–5 April 2018; p. 336. [Google Scholar]
  55. McCarthy, M.; Halls, J. Habitat mapping and change assessment of coastal environments: An examination of worldview-2, quickbird, and ikonos satellite imagery and airborne lidar for mapping barrier island habitats. ISPRS Int. J. Geo-Inf. 2014, 3, 297–325. [Google Scholar] [CrossRef]
Figure 1. The Masonboro Island Reserve is located in (A) New Hanover County, in (B) Southeastern North Carolina, and in the (C) Southeastern United States.
Ijgi 07 00247 g001
Figure 2. Location of: (A) red fox (Vulpes vulpes) den entrances; (B) sea turtle nests; and (C) access sites at Masonboro Island National Estuarine Research Reserve, North Carolina, USA (2009–2012).
Ijgi 07 00247 g002
Figure 3. Ripley K spatially clustering of fox den entrances and sea turtle nests at distances between 50 m and 600 m (fox) and 50 m and 400 m (sea turtles). At larger distances, the locations are dispersed across the entire study area.
Ijgi 07 00247 g003
Figure 4. Mean distance to the nearest five predated sea turtle nests: (A) 2009 had random spatial autocorrelation; (B) 2010 had clustered spatial autocorrelation; (C) 2011 had clustered spatial autocorrelation; and (D) 2012 had clustered spatial autocorrelation.
Ijgi 07 00247 g004
Figure 5. Results from the local Moran’s I cluster analysis using distance to the nearest five predated sea turtle nests: (A) 2009, (B) 2010, (C) 2011, and (D) 2012.
Ijgi 07 00247 g005
Figure 6. Mean distance (m) to the nearest two boat access sites: (A) 2009, (B) 2010, (C) 2011, and (D) 2012.
Ijgi 07 00247 g006
Figure 7. Results from the local Moran’s I cluster analysis using distance to the nearest two boat access sites: (A) 2009, (B) 2010, (C) 2011, and (D) 2012.
Ijgi 07 00247 g007
Figure 8. Results from the local Moran’s I cluster analysis using mean elevation at each den entrance location: (A) 2009, (B) 2010, (C) 2011, and (D) 2012.
Ijgi 07 00247 g008
Figure 9. Ordinary Least Square regression analysis where (A) is the predicted number of fox den entrances and (B) is the distribution of residuals (predicted den entrances minus observed den entrances).
Ijgi 07 00247 g009
Figure 10. GWR regression analysis where (A) is the predicted number of fox den entrances; (B) is the distribution of residuals (predicted dens minus observed); (C) is the local R2 values for each zone; and (D) is the difference between GWR residuals and OLS residuals.
Ijgi 07 00247 g010
Table 1. Results of the Average Nearest Neighbor Analysis for fox den entrance locations by year.
YearCountObserved Mean Distance (m)Expected Mean Distance (m)z-Scorep-ValueIndexResult
all8443.2128.5−11.640.0000.336clustered
200931193.2211.5−0.920.3570.914random
201018242.7277.5−1.020.3070.875random
201119210.3270.1−1.850.0650.778clustered
201216352294.31.490.1371.194random
Table 2. Results from the Average Nearest Neighbor Analysis for sea turtle nests and false crawls.
YearCountObserved Mean Distance (m)Expected Mean Distance (m)z-Scorep-ValueIndexResult
All years (nests & false crawls)1774388.5−13.080.0000.486significantly clustered
All years (false crawls)8479.9128.5−6.620.0000.622significantly clustered
All years (nests)9370.8122.1−7.760.0000.579significantly clustered
All Years (predated nests)58107154.6−4.480.0000.662significantly clustered
2009 nests6749.9480.72.620.00871.560dispersed
2010 nests24242.7240.30.0930.92551.010random
2011 nests38147.03190.99−2.710.00660.769significantly clustered
2012 nests25295235.482.440.01491.255dispersed
2009 false crawls9326.5392.5−0.9650.33460.832random
2010 false crawls11874.8354.999.290.0002.464dispersed
2011 false crawls29208.3218.6−0.4850.62760.953random
2012 false crawls35184.85199.01−0.8050.42070.929random

