Ex Post Impact Assessment of Master Plans—The Case of Shenzhen in Shaping a Polycentric Urban Structure


1
Leibniz Institute of Ecological Urban and Regional Development, 01217 Dresden, Germany
2
Chinese Academy of Surveying and Mapping, Beijing 100830, China
*
Author to whom correspondence should be addressed.
ISPRS Int. J. Geo-Inf. 2018, 7(7), 252; https://0-doi-org.brum.beds.ac.uk/10.3390/ijgi7070252
Submission received: 25 May 2018
/
Revised: 20 June 2018
/
Accepted: 24 June 2018
/
Published: 27 June 2018
(This article belongs to the Special Issue Historic Settlement and Landscape Analysis)
Abstract
:This study of ex post impact assessment aims to review the lessons learned from the implementation of previous master plans in the case study city of Shenzhen (China) in order to provide evidence-based input for the possible integration of impact assessment in future master planning in Shenzhen and other world cities, particularly in developing and emerging countries. The paper uses GIS data to derive maps for the visualization of spatial developmental patterns with complementary quantitative analysis for the spatial-temporal impact assessment. The ex post impact assessment shows that the master plans of Shenzhen have successfully guided urban development towards a polycentric spatial structure. Regarding the data used in the study, Global Human Settlement Layer (GSHL) is a valuable dataset that is generally suited to assessing the urban development pattern. The time series mapping of growth in built-up areas as well as population and built-up intensity mapping based on time specific categorization supplemented by the quantitative assessment of high urban concentrations (hUCs) based on time specific thresholding allows the identification of development patterns over a long period of time.
1. Introduction
The New Urban Agenda—Habitat III [1] emphasizes the planning and managing of urban spatial development while promoting the integration of planning and evaluation. Since the 1950s, we have seen a paradigm shift in the urban planning debate and discourse from top-down rational planning to communicative and participative planning based on the counter flow principle. One of the distinctive features of this change has been the recognition of the need for evaluation and its integration into urban planning [2,3,4]. To this end, advances in evaluatory methods have been particularly evident in both planning theory and planning practice over the last few decades [5,6,7,8,9,10,11,12,13,14]. Specifically, ex ante evaluation is applied to the preparation stage and ex post evaluation to the implementation stage of urban planning [9,15]. Around the world, intergovernmental organizations, political and economic agencies as well as national governments have considerably stepped up their efforts in ex ante and ex post impact assessments through measures such as the environmental impact assessment of United Nations Environment Programme (UNEP), the social impact assessment of the Centre for Good Governance in India or the EU’s Better Law-Making in Action. In addition, academic research on ex post impact evaluations using mixed methods (e.g., [16]) has promoted knowledge transfer through the description of a generic theory-based evaluation framework for application to country-led impact evaluations. However, while ex-ante evaluation of proposed strategies and policies is common in the legal framework of environmental impact assessment, ex post evaluation is much less common [17] (p. 146). This is reflected in the lack of interest shown by urban planners in such subsequent evaluation measures. However, ex post impact assessment, which can identify actual impacts during and after the implementation, is crucial in helping us understand how, and to which extent, a programme or project achieves its intended objectives and subsequently, enables corrective action to be taken where necessary as well as providing evidence-based information to improve the design of future interventions.
The UK’s Royal Town Planning Institute has claimed that planning is arguably the single most important tool that governments have at their disposal for managing rapid urban population growth and expansion [18]. Indeed, by establishing a system of urban planning at the municipal level, China has achieved great success (also in international comparison) in constructing urban infrastructure while eliminating urban slums under conditions of rapid urban expansion and massive growth in the urban population [19,20]. Yet, the integration of evaluation methods has not been fully implemented in China’s urban planning process [13,21,22,23]. Previously, urban planning in China has mainly focused on the formulation of urban development goals and the introduction of blueprints for development. The function of urban plans to provide a legal framework and guidelines for urban development has not been established by accompanying laws and regulations [24,25,26]. To remedy this situation, the Chinese government is currently promoting coordinated planning in order to cope with the problems and loopholes caused by multiple planning processes. The master plan has long been envisaged as the only necessary framework to guide long-term urban development by ensuring stable and effective implementation of urban plans [27]. In fact, the efforts undertaken by the Chinese government in this respect are similar to the proposal of the New Urban Agenda—Habitat III on “reinvigorating long-term and integrated urban and territorial planning and design in order to optimize the spatial dimension of the urban form and to deliver the positive outcomes of urbanization” [1] (p. 8). Based on this background and considering future developments, this article makes use of empirical research conducted in China with a view to contributing to the development of other major cities around the world.
Shenzhen was chosen as a case study for an ex post impact assessment of master plans as it is a prime example within China of the application of comprehensive urban planning as a reaction to high-speed urban growth. The purpose of the study is to assess the extent to which the master plans of Shenzhen have realized their objectives in shaping a polycentric urban spatial structure, which is a common thread running through the various urban master plans of different urban development epochs. One major challenge for empirical investigations of polycentricity is to define the centre and sub-centre(s) [28]. Except for a few papers that have extended the scope of investigation (e.g., references [29,30,31,32]), the vast majority of studies concerning polycentricity in spatial research have analyzed the intensity of economic activity (employment) in order to identify the centre and sub-centres (e.g., [33,34,35]). Internationally recognized methods of measuring polycentricity, specifically those methods developed around the spatial characteristics of metropolitan regions of North America (e.g., [33,36,37,38,39,40,41]), have recently been extended to Europe (e.g., [31,32,42,43]). However, very few in-depth empirical studies have been carried out in cities in developing and emerging countries, despite the fact that polycentric urban structures are also an emerging issue there. As informal employment remains pervasive in many developing and emerging countries [44] (p. 19), the lack of available data (on employment) hampers empirical investigations that apply methods first created for the analysis of US and European cities. Thus, this paper’s contribution is to transfer established methods to a new form of polycentricity measurement that is better adapted to the data availability in developing and emerging countries. Moreover, this paper adopts a cross-sectoral perspective to realize an ex post impact assessment of urban planning and research on polycentric spatial structure. The paper’s originality is in using GIS data to derive maps for the visualization of spatial developmental patterns with complementary quantitative analysis for the spatial-temporal impact assessment. This methodological framework serves to minimize the subjectivity of the analysis. Meanwhile, it simplifies the understanding of research results for individuals who are unfamiliar with geography or urban planning, for instance, policymakers or citizens who may be involved in drawing up future master plans. In summary, this study of ex post impact assessment aims to review the lessons learned from the implementation of previous master plans in Shenzhen in order to provide evidence-based input for the possible integration of impact assessment in future master planning for Shenzhen and other world cities, particularly in developing and emerging countries.
2. Materials and Methods
2.1. The Case Study
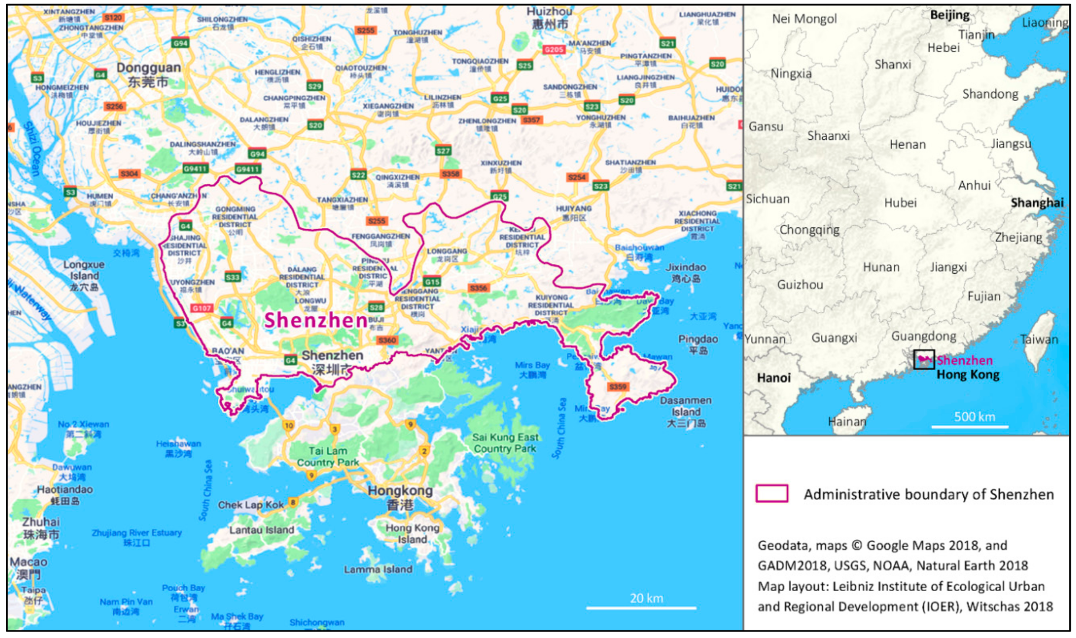
The project follows a case study approach, which enables in-depth, multi-faceted exploration of complex issues in their real-life settings [45]. Shenzhen is a coastal city in Southern China located 22°24′ to 22°52′ N and 113°46′ to 114°37′ E. Lying on the Pearl River Delta, it borders Hong Kong to the south, Huizhou to the north and northeast and Dongguan to the north and northwest. As a pilot city for China’s economic reforms and ‘open door’ policy, Shenzhen has undergone massive change over past decades. Since 1979, the city has grown and developed from a small county dominated by agriculture into the country’s fourth most populous city, and indeed, the world’s sixth most competitive global city [46]. Before the establishment of the modern-day city, this area was known as Bao’an County, an ancient administrative unit that has existed since 331 AD. On 5 March 1979, China’s State Council approved the renaming of Bao’an County, determining that the 1997 sq km area would be converted into an administrative area known as Shenzhen city. At that time, the actual urban extent of Shenzhen was only 3 sq km with a resident population of about 314,100 [47]. In August 1980, the Shenzhen Special Economic Zone (SEZ) was formally established over an area of 327.5 sq km (see Figure 1). By the end of 2016, Shenzhen had a built-up area of around 900 sq km with 11.9 million permanent residents, translating into a population density of 5697 people per sq km [48,49].
In Shenzhen, planning is recognized as a motor for manufacturing and industry [50] (p. 1). The city has established an evolving planning system to cope with the birth and transformation of an industry-led Special Economic Zone, funded by domestic capital, to a booming world city which has attracted millions of “floating” inhabitants as well as much international investment [51] (p. 439). Since the establishment of the Shenzhen Special Economic Zone in 1980, no fewer than twelve comprehensive urban planning and development strategies have been drawn up [52]. This large number of master plans confirms the explosive nature of Shenzhen’s urban growth. Under these master plans, the city has coped rather well with its rapid urban development in comparison with other Chinese cities. This background makes Shenzhen an ideal case study for the ex post impact assessment of master plans.
2.2. Materials
Historical master plans and data from the Global Human Settlement Layer (GHSL) of the case study city, Shenzhen, were used for evidence-based impact assessment analysis. The data for the master plans came from the archives of the Shenzhen Planning Bureau and the involved planning institutions, i.e., the Shenzhen Research Institute of Urban Planning and Design and the China Academy of Urban Planning and Design. The land use and population data of the Global Human Settlement Layer from 1975 to 2014/2015 served as base data for the investigation of physical and socio-economic changes. Both the BUILT-UP GRID (LDS) and the POPULATION GRID (LDS) from GHSL were used. The built-up data provided a multi-temporal information layer on built-up presence derived from Landsat image collections (GLS1975, GLS1990, GLS2000 and ad-hoc Landsat 8 collection 2013/2014) (cf. [53]). The population data depicts the distribution and density of the population, expressed as the number of people per cell. Residential population estimates for the target years, 1975, 1990, 2000 and 2015, were disaggregated from the census or administrative units to grid cells and informed the distribution and density of built-up areas, as mapped in the Global Human Settlement Layer (GHSL) per corresponding period [54].
2.3. Methodical Framework
The study drew on the generic methods and procedures provided by the Impact Assessment Guidelines of the European Commission [55]. The general workflow was as follows: First, a screening step aimed to select the most influential master plans for impact assessment from all comprehensive plans that have been drawn up for Shenzhen. Second, a scoping step identified the focus of this ex post impact assessment of the master plans, i.e., the desired common goal of a polycentric urban spatial structure. After screening and scoping, the impact assessment was divided into three steps, as illustrated in Figure 2:
- (1)
- The identification of development trends based on a comparison of the development goals of master plans and the actual spatial expansion in built-up areas using GIS time series mapping. This step is achieved by comparing the selected master plans and the expansion of built-up areas over time. A considerable period of time is required to prepare each master plan: For instance, while the master plan 2010–2020 for Shenzhen was finalized in August 2008 after two years of preparation, it was only officially approved by China’s State Council in August 2010. Therefore, the comparison did not seek to achieve complete consistency over time but rather aimed to compare similar time points and periods.
- (2)
- Visual inspection of polycentricity using time-specific categorization to map the spatial-temporal changes in population and intensity. Considering the diversity of the discourse in regard to polycentricity, we defined morphological polycentricity as places of spatial densification, in accordance with the notions of Riguelle et al. [43] and Taubenböck et al. [56]. In this latter study, polycentricity was defined as a spatial pattern featuring more than one centre within a defined area [56] (p. 42). Taking into account the consistency and comparability of data for the case study city of Shenzhen, which has undergone rapid urban development over a long period of time, the focus here was on two basic indicators: population density and built-up areas. We applied a set of intensity maps extracted from the GHSL data to describe the spatial distribution of the population intensity and the built-up intensity in respective time nodes, i.e., the years 1975, 1990, 2000 and 2014/2015.
- (3)
- The application of time and city specific thresholding to assess spatial-temporal changes in population concentrations. We considered locations of high population density as proxies to demarcate urban centres. In this paper, we used (sub-)centres as areas of high urban concentration (in short hUC) based on the availability, consistency and comparability of data. Here, we assumed that a (sub-)centre shows hUC—the greater the number of such areas, the higher the degree of polycentricity. The population densities were calculated on a grid with s cell size of 1 sq km. The quantitative assessment drew on the fundamental logic of Greene’s method [36] using a basic set of reference thresholds (cut-offs) specific to the case study city and at the same time, which reflect the temporality of different phases of urban development. Since Shenzhen has applied a unified urban planning regulation, Shenzhen Urban Planning Standards and Guidelines, since 1997, we adopted relevant indicators in this regulation to define our reference values. In this document, the floor space ratio was the main indicator for determining density. Hence, according to the index for the floor space ratio of residential areas in Shenzhen Urban Planning Standards and Guidelines, we defined the ratio of the upper limit (a floor space ratio of 6) and the reference value (a floor space ratio of 1.5) as the reference threshold (density-based cut-off), giving a value of 4 to define a high urban concentration (hUC). Considering the index for the floor space ratio of residential and other land uses as well as corrective factors, we defined three degrees of high urban concentration as follows: high urban concentration level I (abbr. hUCI) with a cut-off value of 4 times the mean population density; high urban concentration level II (abbr. hUCII) with a cut-off value of 6 times the mean population density; high urban concentration level III (abbr. hUCIII) with a cut-off value of 8 times the mean population density.
In the concluding chapter, recommendations are derived from the impact assessment analysis for the subsequent development of the case study city. Also, based on the Shenzhen case study, we analyze the suitability of the GSHL data for the ex post impact assessment of master plans.
3. Screening and Scoping
As mentioned above, Shenzhen has hitherto formulated twelve master plans. Since October 2017, a master plan for 2016–2035 has been under discussion. Since some of the master plans were merely revisions of previous plans that were quickly drawn up to take account of contemporary developments, only the following seven primary master plans were investigated for the screening, as follows:
- 1980 “Overall Plan for the Planning and Construction of Shenzhen City”: This plan designated an area of 327.5 sq km for the SEZ and 60 sq km for the built-up area of Shenzhen city. The plan forecast a population of 300,000 by the year 1990, rising to 600,000 by the year 2000. The plan’s focus for urban development was an industry-led, industrial and agricultural combined SEZ and a new type of border city.
- 1982 “Outline of the Social Economic Development Plan for Shenzhen Special Economic Zone”: This plan extended the 1980 plan in terms of urban development and positioned Shenzhen as a comprehensive special economic zone with a strong industrial base supported by commercial, agricultural, housing and tourism development. Population forecasts were adjusted upwards to 250,000 by the year 1985; 400,000 by the year 1990; and 800,000 by the year 2000. The plan was the first to propose a polycentric linear-clustering spatial structure for the Shenzhen SEZ. This plan was partly revised in 1983 based on developments at the time. However, the unexpectedly rapid development meant that the goals set out in the plan for 1985 were already far exceeded by 1984.
- 1986 “Master plan of Shenzhen Special Economic Zone 1986–2000”: The plan revised the projections of the previous plan to a population of 1.1 million by the year 2000 and an urban built-up area of 123 sq km. Although this plan still regarded the Shenzhen SEZ as the main focus of urban planning, it went beyond the scope of the designated SEZ to determine a more advanced framework for infrastructure construction. The polycentric linear-clustering spatial structure for the Shenzhen SEZ foreseen in the 1982 plan was extended in the revised plan. In addition, the 1982 development focus was enlarged to an industry-led, export-oriented, multi-functional, highly developed comprehensive economic zone.
- 1989 “The Urban Development Strategy of Shenzhen City”: Since the previous planning-led urban development was largely centred on the Shenzhen Special Economic Zone, this led to a problem of unbalanced development within and outside the SEZ. In view of the unbalanced development due to disparate property rights of urban vs. rural land as well as the contrasting conditions within and outside the SEZ, the plan, for the first time, considered the entire administrative area of Shenzhen. Correspondingly, the spatial development strategy was positioned as a city-wide development and progressive urban expansion. The urban built-up area was extended to 150 sq km, and the expected population was adjusted upwards to 1.5 million by the year 2000.
- 1996 “Shenzhen Master Plan 1996–2010”: This plan was concerned with the entire administrative area of Shenzhen city, i.e., 2020 sq km. By the year 2000, the urban built-up area was estimated to cover 380 sq km with a population of 4 million. By 2010, the urban built-up area was expected to be 480 sq km for a maximum population of 5.1 million. The plan proposed a polycentric clustering structure along axes and corridors.
- 2006 “Shenzhen Urban Development Strategy 2030”: This was the first strategic urban plan for Shenzhen. By identifying urban development problems, this goal-oriented plan aimed to “strengthen the city centre, stretch toward both wings, penetrate north and south, connect the west part and expand eastward” as a strategy to create a polycentric urban spatial structure.
- 2010 “Shenzhen Master Plan 2010–2020”: This plan’s objective was to limit the growing population to 11 million and the urban built-up area to 890 sq km by the year 2020. The polycentric urban spatial structure proposed by the previous plans was continued and refined into “polycentric development in accord with the three axes and two corridors”.
The ever-higher forecasts for the urban population and built-up area within the various master plans reflect Shenzhen’s explosive urban expansion over the last four decades. Generally, the city’s master plans can be divided into two categories: those drawn up before 1996, which tended to present a blueprint for urban development, and those drawn up after 1996, which have sought to identify problems of urban development in order to propose goal-oriented development strategies. In particular, the overall socio-economic contexts faced by Shenzhen’s master plan have varied greatly over the years. As the details of the master plans from the 1980s show, the development positions have changed from an industry-led, combined industrial and agricultural SEZ at the beginning of that decade to an industry-led, export-oriented, multi-functional, highly developed comprehensive economic zone in the late 1980s. Since the late 1990s, with the return of Hong Kong in 1997 and China’s accession to the World Trade Organization (WTO) in 2001, Shenzhen has had to face up another set of challenges. Against this background, Shenzhen’s master plans drawn up at different periods have shifted dramatically in terms of the focus and targets of planning. However, the pursuit of a polycentric urban spatial structure is a common thread running through the various urban master plans. Accordingly, our analysis aimed to assess the impacts of master plans for Shenzhen in shaping such a polycentric urban structure.
In discussions on the master plans of Shenzhen, it is generally recognized that the following three have been the most influential: the 1986–2000 master plan, the 1996–2010 master plan and the 2010–2020 master plan (cf. [52,57,58]). The first of these laid the basic spatial framework for urban development. The proposed “polycentric linear-clustering spatial structure” symbolized the conceptual role of the modernist “linear city” as representing openness to the instability of the market [59] (p. 129). Although this master plan merely dealt with the topographically flat SEZ, its ideological framework regarding the spatial structure laid the foundation for the integration of green spaces within urban built-up areas. The 1986–2000 master plan was highly praised by the domestic planning community and won first prize in the Outstanding Urban and Rural Planning and Design Award of China’s Ministry of Construction.
Deng Xiaoping’s Southern tour speech of 1992 broke a logjam in his reforms by advancing the policies of economic transformation and opening up the country. This triggered new opportunities and challenges for spatial development in Shenzhen, namely, how to transform planning for a pilot special economic zone into the development of a burgeoning city. The administrative status of areas previously located outside the Special Economic Zone was changed and the process of planned industrialization and urbanization was launched. In response to this situation, the 1996–2010 master plan was developed out of the SEZ master plan into a comprehensive city master plan. Naturally, the content of the city’s 1996–2010 master plan was radically different to the 1986–2000 master plan for the SEZ. However, the basic principles of the polycentric linear-clustering spatial structure set out in the 1986–2000 for the SEZ were preserved and extended to a polycentric structure for the entire city while taking account of the topographical conditions (e.g., mountains). This master plan was intelligently designed in terms of balancing built-up land with open spaces and proposing large-scale transportation networks and other infrastructures. This ensured that the city was able to cope with a much larger population than projected as well as a thriving economy while at the same time maintaining a good environmental quality in domestic comparison. This master plan won the 1999 International Union of Architects (UIA) Honors Award, the Outstanding Urban and Rural Planning and Design Award of China’s Ministry of Construction as well as the National Planning and Design Gold Award.
Nonetheless, the rapid development of Shenzhen did, in fact, lead to severe development bottlenecks around 2005. In particular, the city faced the challenges of a shortage of land, limited resources, a massive population and a highly stressed environment. The 2010–2020 master plan was the first in China to propose urban transformation. The focus of previous master plans on expansion was abandoned in favor of the consolidation and regeneration of existing urban districts. In September 2008, the Ministry of Housing and Urban-Rural Development invited 13 national ministries and commissions to visit Shenzhen and discuss the special report of the Shenzhen Municipal Government on the 2010–2020 master plan. The intelligent and forward-looking design of this master plan was affirmed at the meeting.
4. Analysis and Discussion
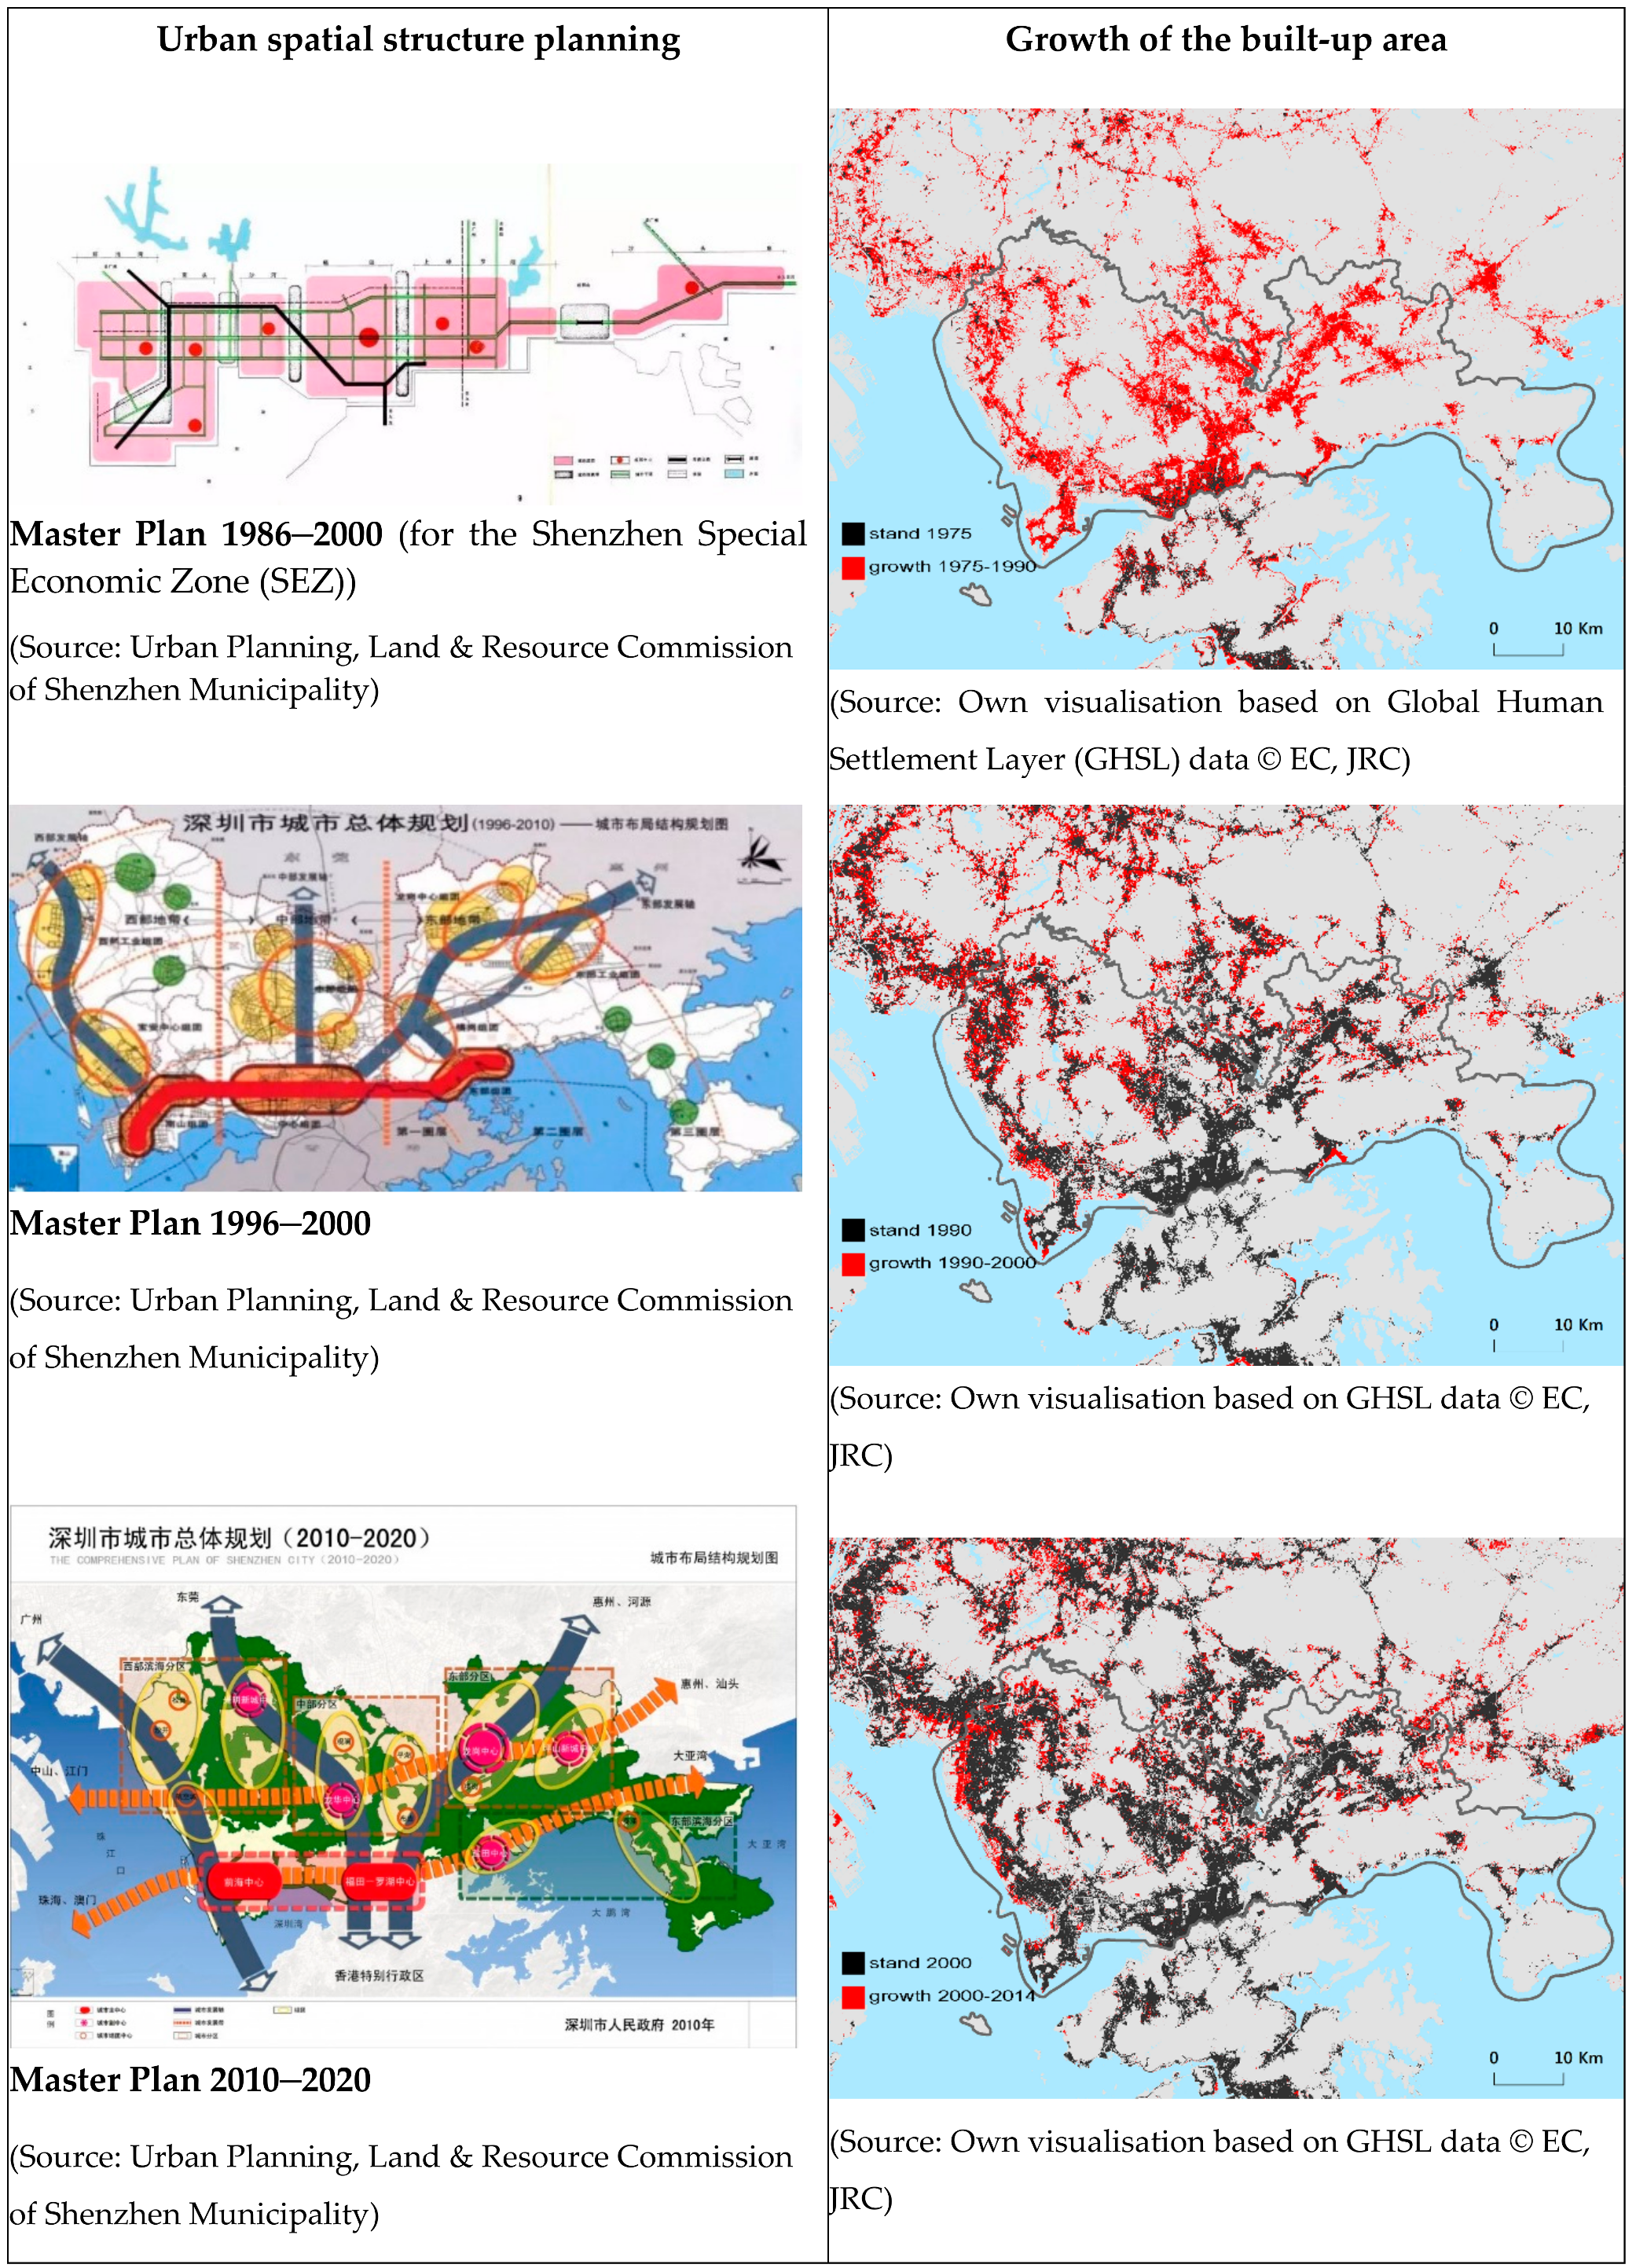
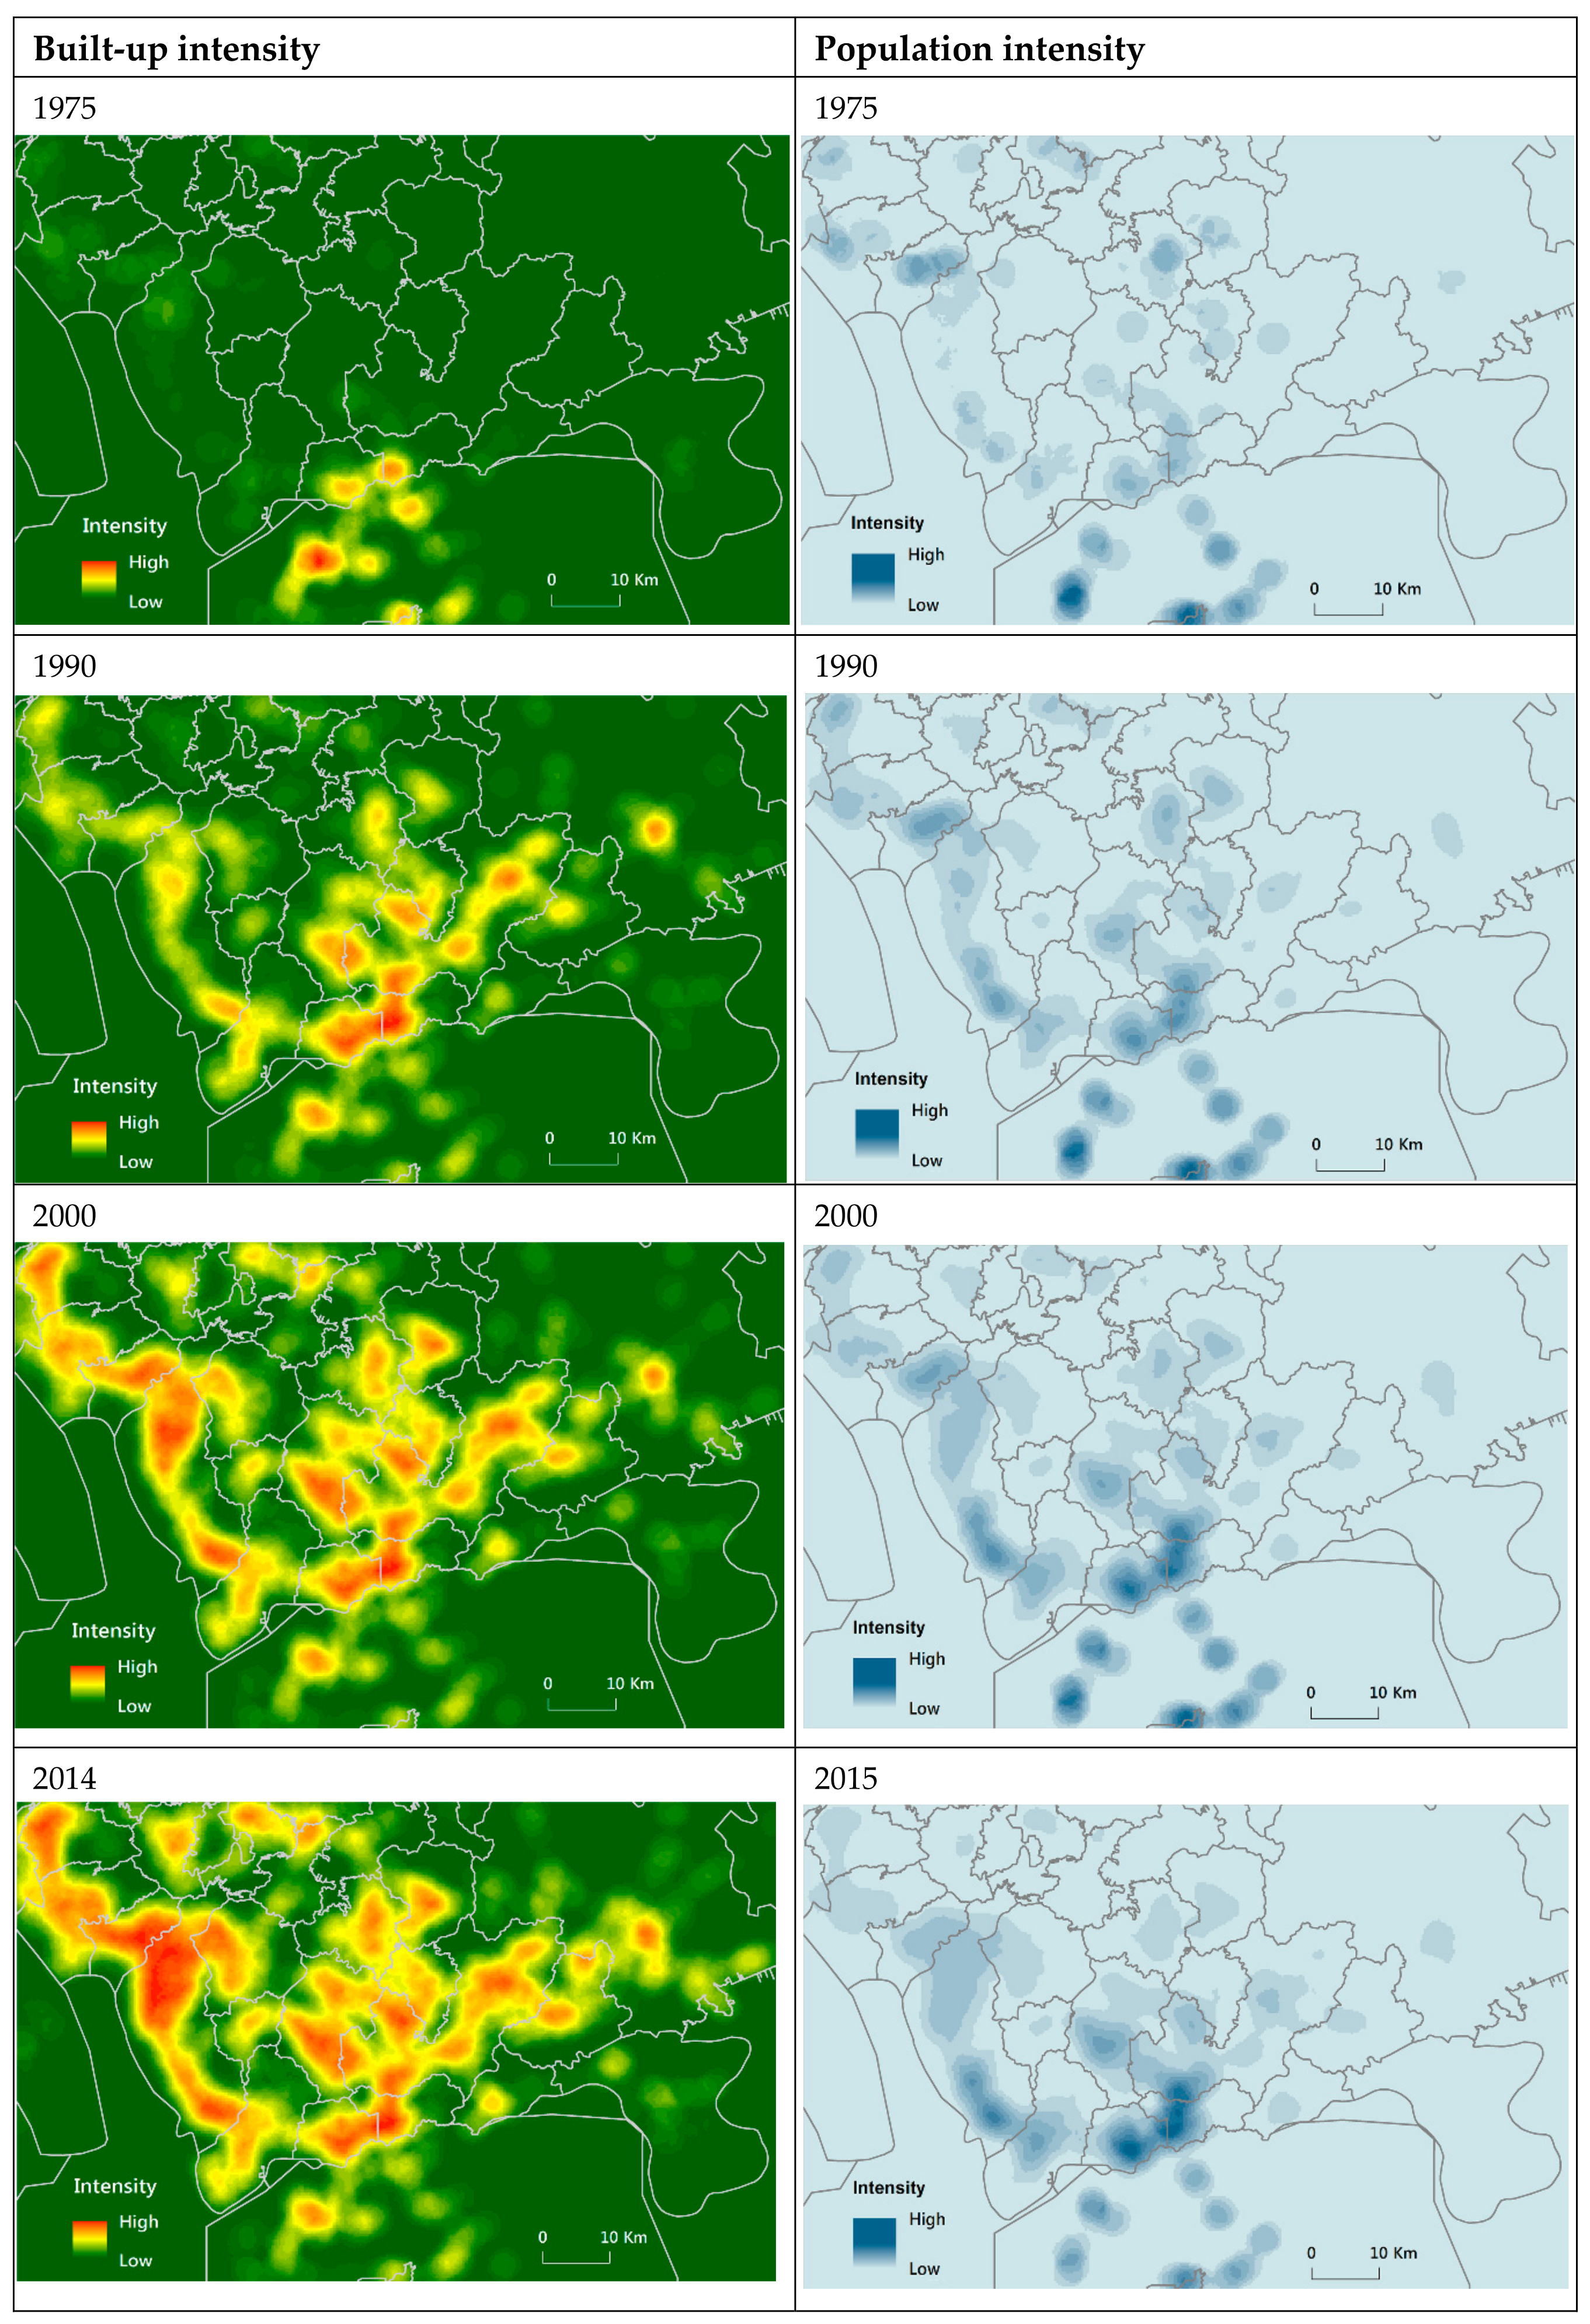
In this section, Figure 3 outlines the urban spatial structures foreseen by selected master plans and the growth of built-up areas in the corresponding time periods in Shenzhen. Figure 4 presents maps of the population and built-up intensity in Shenzhen for the years 1975, 1990, 2000 and 2014/2015. Table 1 shows the application of time- and city-specific thresholding to assess spatial-temporal changes in population concentrations, using both visualized and quantitative descriptions. The following impact assessment analyses were derived from the above three tables.
The polycentric linear-clustering spatial structure was developed in the 1986–2000 master plan for the Shenzhen Special Economic Zone based using the concept of the linear city as a way to organize the flow of capital in a reformed socialist market economy. By comparing the population and built-up intensities between 1975 and 1990, we can confirm that the plans have successfully guided the formation of a linear spatial structure with identifiable hUCs through the development of new built-up areas from 1975 to 1990. It is worth noting that this development trend is not only visible within the scope of the master plan (i.e., the SEZ), but can also be observed outside the SEZ. The shaping of a banded agglomerated area in the south is consistent with the clustering proposal of the master plan. By 1990, Shenzhen’s urban development had achieved a full range of high-density development: 28% of the built-up areas had four times the mean density, 19% of areas had a population density six times mean density and 13% had a population density eight times mean density.
The 1996–2010 master plan, which considered the whole administrative area of Shenzhen, proposed the extension of the polycentric structure longitudinally along specific spatial corridors based on the geographic conditions. A comparison of the population and built-up intensities between 1990 and 2000 confirmed the basic implementation of these objectives during the corresponding time period through the development of new areas. From 1990 to 2000, population densities rose considerably in the banded agglomerated area in the south, and other (sub-)centres formed in the previous development period. This was reflected in the fact that the time-specific threshold increased 4.2 times by 2000 compared to 1990. This is particularly true of three centres in the banded agglomerated area in the south. Compared with the banded agglomerated area, other (sub)centres are more strongly characterized by an extension of built-up areas into surrounding land rather than higher population densities.
The 2010–2020 master plan proposed the development of a second linear clustering in addition to the existing linear clustering at the coastline. The implementation of this proposal was confirmed by the newly built-up areas during the corresponding time period. From 2000 to 2014, the population density in the existing banded agglomerated area in the south, particularly in the three centres, continued to rise. Compared to 2000, the time specific threshold of 2015 increased by a factor of 1.6. In addition, we observed the formation of a second banded agglomeration on the Western coastline. Within this second banded agglomeration, the population density was higher in two (sub-)centres. The share of hUC area in 2015 remained at a similar proportion compared to the share in 2000. However, the number of cells below the time specific threshold increased in the period from 2000 to 2015. This quantitative development pattern indicates a forward extension of built-up areas into the surroundings of other (sub-)centres.
5. Conclusions and Recommendations
The above ex post impact assessment shows that the master plans of Shenzhen have successfully guided urban development towards a polycentric spatial structure. It can be observed that the master plans of the 1980s created a relatively balanced polycentric spatial development before 1990. Since 1990, population density in the banded agglomerated area (SEZ) in the south has increased significantly. At the same time, population densities in other centres have also risen. However, we note that the expansion of the built-up areas around the centres is more significant than their rising population densities after 1990s.
The polycentric spatial structure formed according to the master plans has created highly beneficial conditions in Shenzhen. Apart for the banded agglomerated areas, the city generally enjoys a well-balanced mix of urban built-up areas and adjacent green spaces. The 13th Five-Year Plan for Shenzhen foresees the city’s population to be growing annually by about 750,000 by the year 2020. This policy, which is contrary to the population brake introduced in Beijing and Shanghai, will serve to attract residents to Shenzhen. Clearly, urban development in Shenzhen in the years to come will have to accommodate the pressures of high population growth. In order to avoid the further expansion of the centres into surrounding areas (and hence, a reduction in open space), it is recommended that an impact assessment is integrated into the preparation of future master plans, for instance, the master plan to 2035, which is currently being drawn up. In particular, ex ante impact assessment is recommended as a way to assess the effects of potential spatiotemporal changes and how these changes can lead to desired goals, i.e., a further strengthening of the polycentric spatial structure in Shenzhen.
Regarding the data used in the study, GSHL is a valuable dataset that is generally suited for assessing the urban development pattern. The time series mapping of growth in built-up areas as well as the population and built-up intensity mapping based on time specific categorization, supplemented by the quantitative assessment of hUCs based on time specific thresholding, allow the identification of development patterns over a long period of time. Uncertainties arise from the population estimates calculated by the disaggregation of official census data based on the respective built-up area. Another source of uncertainty is the time lag between the issuing of master plans and the gathering of data for corresponding periods. However, the major advantages of GHSL over studies using local, remote-sensing data are its global availability, temporal scope (data available from 1975) and, most importantly, the global objectivity and comparability of the dataset. These characteristics pave the way for further assessment studies in other urban contexts and with even larger spatial scopes.
Author Contributions
X.X. conceived and designed the research. H.H. performed the data selection, curation and visualization. X.X. interpreted the data and wrote the paper. W.H. and H.H. did the reviewing and editing.
Funding
This research received no external funding.
Conflicts of Interest
The authors declare no conflict of interest.
References
- UN-Habitat III. New Urban Agenda. United Nations: Quito, Equador, 2017; ISBN 9789211327311. Available online: http://habitat3.org/wp-content/uploads/NUA-English.pdf (accessed on 20 June 2018).
- Lichfield, N.; Kettle, P.; Whitbread, M. Evaluation in the Planning Process, 1st ed.; Pergamon: Oxford, UK, 1975; ISBN 9781483137278. [Google Scholar]
- Alexander, E.R.; Faludi, A. Planning and plan implementation: Notes on evaluation criteria. Environ. Plan. B Plan. Des. 1989, 16, 127–140. [Google Scholar] [CrossRef]
- Khakee, A. Evaluation and planning: Inseparable concepts. Town Plan. Rev. 1998, 69, 359–374. [Google Scholar] [CrossRef]
- Guba, E.G.; Lincoln, Y.S. Fourth Generation Evaluation; Sage: Newbury Park, CA, USA, 1989. [Google Scholar]
- Baer, W.C. General plan evaluation criteria: An approach to making better plans. J. Am. Plan. Assoc. 1997, 63, 329–344. [Google Scholar] [CrossRef]
- Alexander, E.R. Where do we go from here: Evaluation in spatial planning in the post-modern future? In Evaluation in Planning: Facing the Challenge of Complexity; Lichfield, N., Barbanente, A., Borri, D., Khakee, A., Prat, A., Eds.; Kluwer: Dordrecht, The Netherlands, 1989; pp. 355–374. [Google Scholar]
- Alexander, E.R. Evaluation in Israeli spatial planning. In Evaluation in Planning: Facing the Challenge of Complexity; Lichfield, N., Barbanente, A., Borri, D., Khakee, A., Prat, A., Eds.; Kluwer: Dordrecht, The Netherlands, 1998; pp. 299–310. [Google Scholar]
- Lichfield, N.; Prat, A. Linking ex-ante and ex-post evaluation in British town planning. In Evaluation in Planning: Facing the Challenge of Complexity; Lichfield, N., Barbanente, A., Borri, D., Khakee, A., Prat, A., Eds.; Kluwer: Dordrecht, The Netherlands, 1998; pp. 283–298. [Google Scholar]
- Berke, P.R.; Conroy, M.M. Are we planning for sustainable development? An evaluation of 30 comprehensive plans. J. Am. Plan. Assoc. 2000, 66, 21–33. [Google Scholar] [CrossRef]
- Ng, K.M.; Xu, J. Development control in post-reform China: The case of Liuhua Lake Park, Guangzhou. Cities 2000, 17, 409–418. [Google Scholar] [CrossRef]
- Hoch, C.J. Evaluating plans pragmatically. Plann. Theory 2002, 1, 53–75. [Google Scholar] [CrossRef]
- Ng, K.M. Sustainable urban development issues in Chinese transitional cities: Hong Kong and Shenzhen. Int. Plan. Stud. 2002, 7, 7–36. [Google Scholar] [CrossRef]
- Ren, W.; Zhong, Y.; Meligrana, J.; Anderson, B.; Watt, E.W.; Chen, J.; Leung, H.L. Urbanization, land use and water quality in Shanghai, 1947 to 1996. Environ. Int. 2003, 39, 649–659. [Google Scholar] [CrossRef]
- Oliveira, V.; Pinho, P. Evaluation in Urban Planning: Advances and Prospects. J. Plan. Lit. 2010, 24, 343–361. [Google Scholar] [CrossRef]
- Wageningen University & Research. Available online: https://www.wur.nl/en/project/ex-post_evaluation.htm (accessed on 20 June 2018).
- Koomen, E.; Dekkers, J.; Broitman, D. Analyzing and Simulating Urban Density Exploring the Difference between Policy Ambitions and Actual Trends in the Netherlands. In Spatial Analysis and Location Modeling in Urban and Regional Systems; Thill, J.C., Ed.; Springer: Berlin, Germany, 2018; pp. 145–172. [Google Scholar]
- Royal Town Planning Institute. Why the New Urban Agenda Matters to Planning, Planners and Governments. Available online: http://www.rtpi.org.uk/media/2276458/trudi_elliott_article.pdf (accessed on 20 June 2018).
- Xie, Y.; Costa, F.J. Urban planning in socialist China: Theory and practice. Cities 1993, 10, 103–114. [Google Scholar] [CrossRef]
- UN Habitat. State of the World’s Cities Reports. Available online: https://unhabitat.org/collection/state-of-the-worlds-cities-report/ (accessed on 20 June 2018).
- Wei, Y.D. Planning Chinese cities: The limits of transitional institutions. Urban Geogr. 2005, 26, 200–221. [Google Scholar] [CrossRef]
- Friedmann, J. China’s Urban Transition, Minneapolis; University of Minnesota Press: Minneapolis, MN, USA, 2005. [Google Scholar]
- Meligrana, J.; Ren, W.; Zhang, Z.; Anderson, B. Planning a mega-city’s future: An evaluation of Shanghai’s municipal land-use plan. Town Plan. Rev. 2008, 79, 267–293. [Google Scholar] [CrossRef]
- Su, Z. Thoughts on the Problems of Urban Planning System in China. City Plan. Rev. 1995, 6, 31–36. [Google Scholar]
- Cui, G. Some contemporary considerations in urban and regional planning. City Plan. Rev. 2002, 26, 40–43. [Google Scholar]
- Zou, D. Towards Proactive Urban Planning: Reflections on Problems in Urban Planning in China. City Plan. Rev. 2005, 2, 20–22. [Google Scholar]
- Zhang, C. China Coordinates Planning Rules to Prevent Wasteful Growth. 2014. Available online: https://www.chinadialogue.net/blog/7548-China-co-ordinates-planning-rules-to-prevent-wasteful-growth/en (accessed on 20 June 2018).
- Duranton, G.; Puga, D. Urban land use. In Handbook of Regional and Urban Economics; Duranton, G., Henderson, J.V., Strange, W.C., Eds.; Elsevier: Amsterdam, The Netherlands, 2015; Volume 5, pp. 467–560. [Google Scholar]
- Meijers, E.J. Summing small cities does not make a large City: Polycentric urban regions and the provision of cultural, leisure and sports amenities. Urban Stud. 2008, 45, 2323–2342. [Google Scholar] [CrossRef]
- Burger, M.; Meijers, E. Form follows function? Linking morphological and functional polycentricity. Urban Stud. 2011, 49, 1127–1149. [Google Scholar] [CrossRef]
- Krehl, A. Urban spatial structure: An interaction between employment and built-up volumes. Reg. Stud. Reg. Sci. 2015, 2, 289–307. [Google Scholar] [CrossRef]
- Taubenböck, H.; Standfuß, I.; Wurma, M.; Krehl, A.; Siedentop, S. Measuring morphological polycentricity—A comparative analysis of urban mass concentrations using remote sensing data. Comput. Environ. Urban Syst. 2017, 64, 42–56. [Google Scholar] [CrossRef]
- McDonald, J.F. The identification of urban employment subcenters. J. Urban Econ. 1987, 21, 242–258. [Google Scholar] [CrossRef]
- Craig, S.G.; Ng, P.T. Using quantile smoothing splines to identify employment subcenters in a multicentric urban area. J. Urban Econ. 2001, 49, 100–120. [Google Scholar] [CrossRef]
- McMillen, D.P. Nonparametric employment subcenter identification. J. Urban Econ. 2001, 50, 448–473. [Google Scholar] [CrossRef]
- Greene, D.L. Recent trends in urban spatial structure. Growth Chang. 1980, 11, 29–40. [Google Scholar] [CrossRef]
- Giuliano, G.; Small, K.A. Subcenters in the Los Angeles region. Reg. Sci. Urban Econ. 1991, 21, 163–182. [Google Scholar] [CrossRef]
- McDonald, J.F.; Prather, P.J. Suburban employment centres: The case of Chicago. Urban Stud. 1994, 31, 201–218. [Google Scholar] [CrossRef]
- Cleveland, W.S. Robust locally-weighted regression and smoothing scatterplots. J. Am. Stat. Assoc. 1979, 74, 829–836. [Google Scholar] [CrossRef]
- Cleveland, W.S.; Devlin, S.J. Locally weighted regression: An approach to regression analysis by local fitting. J. Am. Stat. Assoc. 1988, 83, 596–610. [Google Scholar] [CrossRef]
- Múñiz, I.; Galindo, A.; García-López, M.A. Cubic spline density functions and satellite city delimitation: The case of Barcelona. Urban Stud. 2003, 40, 1303–1321. [Google Scholar] [CrossRef]
- Adolphson, M. Estimating a Polycentric Urban Structure. Case Study: Urban Changes in the Stockholm Region 1991–2004. J. Urban Plan. Dev. 2009, 135. [Google Scholar] [CrossRef]
- Riguelle, F.; Thomas, I.; Verhetsel, A. Measuring urban polycentricity: A European case study and its implications. J. Econ. Geogr. 2007, 7, 193–215. [Google Scholar] [CrossRef]
- International Labor Organisation. World Employment Social Outlook: Trends 2016; International Labour Office (ILO): Geneva, Switzerland, 2016; ISBN 978-92-2-129633-1. Available online: http://www.ilo.org/wcmsp5/groups/public/---dgreports/---dcomm/---publ/documents/publication/wcms_443480.pdf (accessed on 20 June 2018).
- Crowe, S.; Cresswell, K.; Robertson, A.; Huby, G.; Avery, A.; Sheikh, Z. The case study approach. BMC Med. Res. Methodol. 2011, 11, 100. [Google Scholar] [CrossRef] [PubMed] [Green Version]
- Ni, P.; Kamiya, M.; Wang, H. The Global Urban Competitiveness Report 2017–2018—Housing Prices: Changing World Cities. 2017. Available online: https://unhabitat.org/wp-content/uploads/2017/11/GUCR2017-2018-Short-Version.pdf (accessed on 20 June 2018).
- Liu, S.; Wang, Y. (Eds.) Contemporary Chinese Economic Policy and Practice; China Financial & Economic Publishing House: Beijing, China, 2014; ISBN 9787509554975/F4445. [Google Scholar]
- Shenzhen Statistics Bureau; NBS Survey Office in Shenzhen. Shenzhen Statistical Yearbook 2016; China Statistics Press: Beijing, China, 2016. Available online: http://www.sztj.gov.cn/sj/nj/201701/W020170120506125327799.pdf (accessed on 20 June 2018).
- China’s Ministry of Housing and Urban—Rural development. Statistical Yearbook of Urban Construction 2016. 2016. Available online: http://www.mohurd.gov.cn/xytj/tjzljsxytjgb/ (accessed on 20 June 2018).
- Shenzhen Development Planning Bureau. Crossing the Century: A Collection of Five Year Plans of the Shenzhen Municipality; Haitian Press: Shenzhen, China, 2002. [Google Scholar]
- Ng, M.K. City profile Shenzhen. Cities 2003, 20, 429–441. [Google Scholar] [CrossRef]
- Zhou, B. Evaluation of the development and implementation of master plans in Shenzhen city. China Urban Plan. 2016. Available online: http://chinaup.info/2016/08/11874.html (accessed on 20 June 2018).
- Pesaresi, M.; Ehrilch, D.; Florczyk, A.J.; Freire, S.; Julea, A.; Kemper, T.; Soille, P.; Syrris, V. GHS Built-Up Grid, Derived from Landsat, Multitemporal (1975, 1990, 2000, 2014). European Commission, Joint Research Centre (JRC): Brussels, 2015. Available online: http://data.europa.eu/89h/jrc-ghsl-ghs_built_ldsmt_globe_r2015b (accessed on 20 June 2018).
- European Commission, Joint Research Centre (JRC); Columbia University, Center for International Earth Science Information Network (CIESIN). GHS Population Grid, Derived from GPW4, Multitemporal (1975, 1990, 2000, 2015); European Commission, Joint Research Centre (JRC): Brussels, 2015. Available online: http://data.europa.eu/89h/jrc-ghsl-ghs_pop_gpw4_globe_r2015a (accessed on 20 June 2018).
- European Commission. Impact Assessment Guidelines, SEC (2009) 92, 2009. Available online: http://ec.europa.eu/smart-regulation/impact/commission_guidelines/docs/iag_2009_en.pdf (accessed on 20 June 2018).
- Wu, W.; Gao, X. Population Density Functions of Chinese Cities: A Review. Prog. Geogr. 2010, 29, 968–974. [Google Scholar]
- Li, B.; Wang, W. Historical study on the development and paradigm of urban planning in Shenzhen. Urban Hist. Stud. 2007, 3, 70–74. [Google Scholar]
- Huang, L. Research on changes in the Shenzhen city master plans and development strategies. Red Wide Angle 2016, 3, 35–39. [Google Scholar]
- Chung, C.J.; Inaba, J.; Koolhaas, R.; Leong, S.T. (Eds.) Great Leap Forward; Taschen GmbH: Köln, Germany, 2001; ISBN 3-8228-6048-4. [Google Scholar]
Figure 1.
Location of the case study city Shenzhen.

Figure 2.
Conceptual framework of impact assessment: input data, methods and respective workflow.
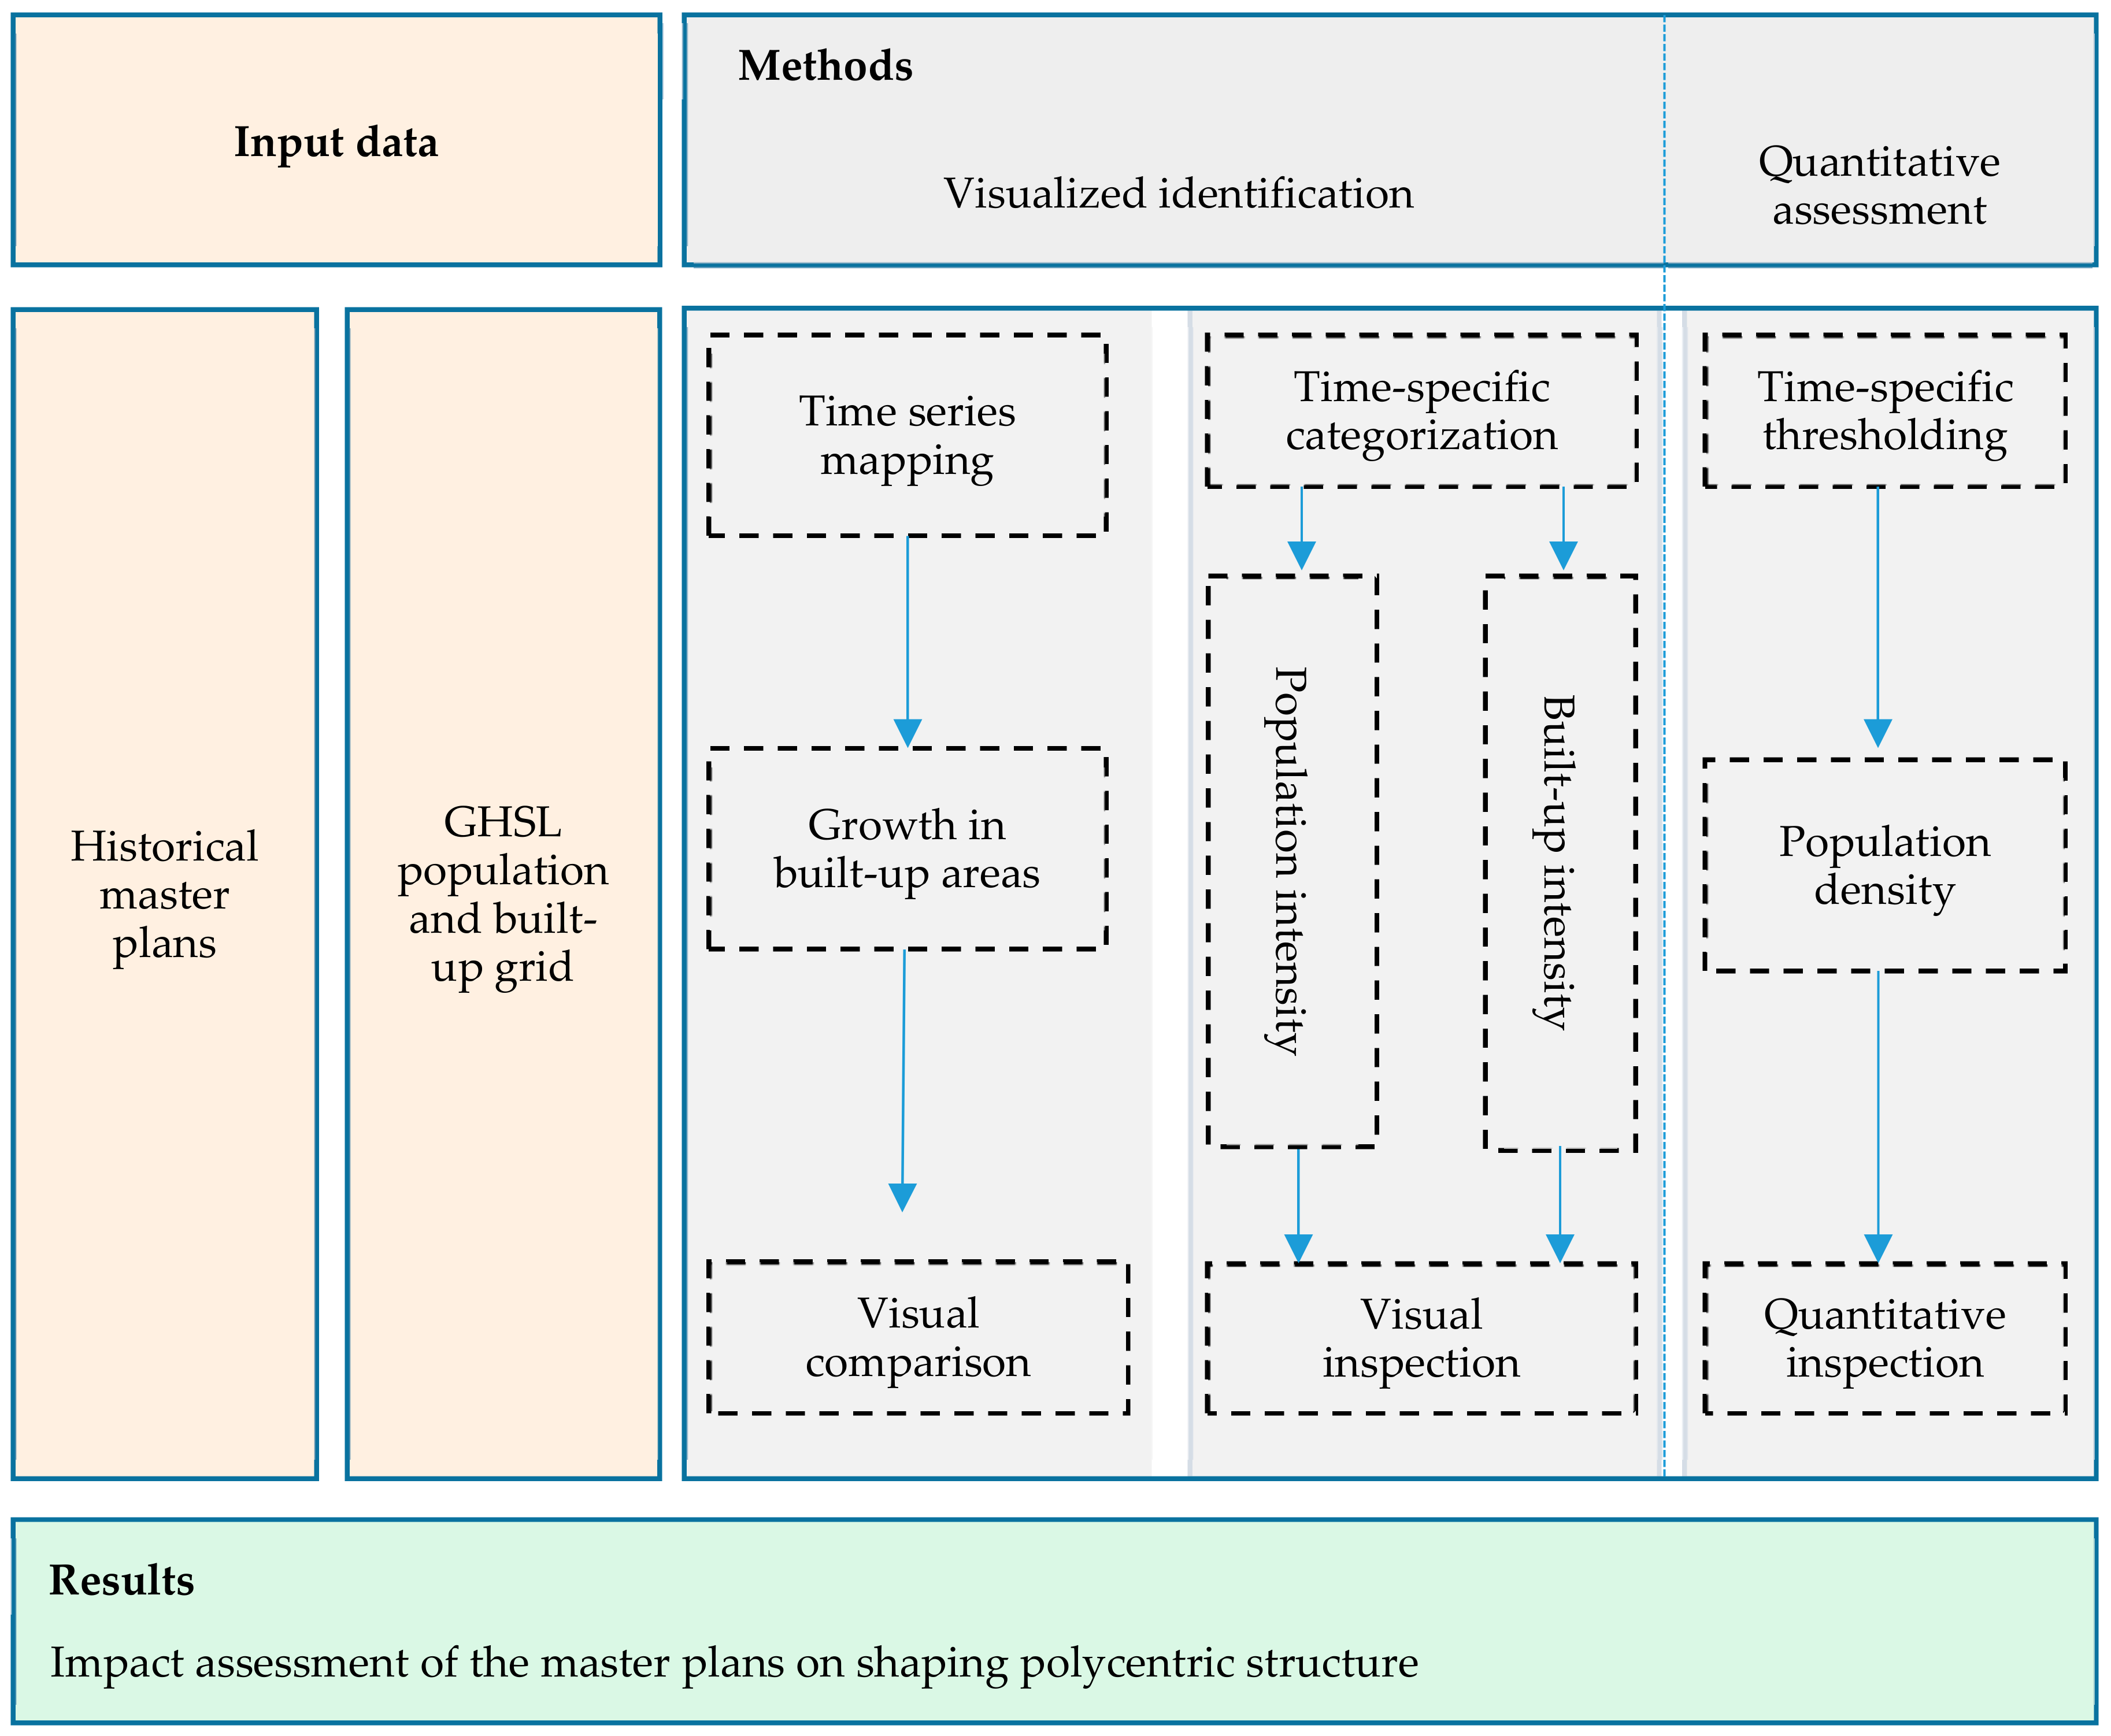
Figure 3.
The urban spatial structures foreseen by selected master plans and the growth of built-up areas in the corresponding time periods in Shenzhen.
Figure 3.
The urban spatial structures foreseen by selected master plans and the growth of built-up areas in the corresponding time periods in Shenzhen.

Figure 4.
Maps of built-up and population intensity in Shenzhen in the years 1975, 1990, 2000 and 2014/2015. (Source: Own calculation and visualisation based on GHSL data © EC, JRC)
Figure 4.
Maps of built-up and population intensity in Shenzhen in the years 1975, 1990, 2000 and 2014/2015. (Source: Own calculation and visualisation based on GHSL data © EC, JRC)


Table 1.
Quantitative assessment of polycentricity in Shenzhen in the years 1975, 1990, 2000 and 2014/2015. (Source: Own calculation and visualisation based on GHSL data © EC, JRC)
Table 1.
Quantitative assessment of polycentricity in Shenzhen in the years 1975, 1990, 2000 and 2014/2015. (Source: Own calculation and visualisation based on GHSL data © EC, JRC)
 | 1990 | |
| hUCI cut-off reference | 3370.8 | |
| hUCII cut-off reference | 5056.2 | |
| hUCIII cut-off reference | 6741.5 | |
| Share of hUCI (%) | 27.98 | |
| Share of hUCII (%) | 18.78 | |
| Share of hUCIII (%) | 13.01 | |
 | 2000 | |
| hUCI cut-off reference | 14,269.01 | |
| hUCII cut-off reference | 21,403.52 | |
| hUCIII cut-off reference | 28,538.02 | |
| Share of hUCI (%) | 5.93 | |
| Share of hUCII (%) | 2.46 | |
| Share of hUCIII (%) | 1.00 | |
 | 2015 | |
| hUCI cut-off reference | 22,860.27 | |
| hUCII cut-off reference | 34,290.41 | |
| hUCIII cut-off reference | 45,720.54 | |
| Share of hUCI (%) | 5.98 | |
| Share of hUCII (%) | 2.61 | |
| Share of hUCIII (%) | 1.02 | |
| Definition of time-specific hUCs (high urban concentrations) | ||
| i = number of grid cells PDiyear = population density in grid cell i in the respective time period (year) PDmeanyear = mean population density in the respective time period (year) Share of hUC area | ||
© 2018 by the authors. Licensee MDPI, Basel, Switzerland. This article is an open access article distributed under the terms and conditions of the Creative Commons Attribution (CC BY) license (http://creativecommons.org/licenses/by/4.0/).
Share and Cite
MDPI and ACS Style
Xie, X.; Hou, W.; Herold, H. Ex Post Impact Assessment of Master Plans—The Case of Shenzhen in Shaping a Polycentric Urban Structure. ISPRS Int. J. Geo-Inf. 2018, 7, 252. https://0-doi-org.brum.beds.ac.uk/10.3390/ijgi7070252
AMA Style
Xie X, Hou W, Herold H. Ex Post Impact Assessment of Master Plans—The Case of Shenzhen in Shaping a Polycentric Urban Structure. ISPRS International Journal of Geo-Information. 2018; 7(7):252. https://0-doi-org.brum.beds.ac.uk/10.3390/ijgi7070252
Chicago/Turabian StyleXie, Xiaoping, Wei Hou, and Hendrik Herold. 2018. "Ex Post Impact Assessment of Master Plans—The Case of Shenzhen in Shaping a Polycentric Urban Structure" ISPRS International Journal of Geo-Information 7, no. 7: 252. https://0-doi-org.brum.beds.ac.uk/10.3390/ijgi7070252
Note that from the first issue of 2016, this journal uses article numbers instead of page numbers. See further details here.