Article

Temporal Variations and Associated Remotely Sensed Environmental Variables of Dengue Fever in Chitwan District, Nepal

1
State Key Laboratory of Remote Sensing Science, Institute of Remote Sensing and Digital Earth, Chinese Academy of Sciences, Beijing 100094, China
2
University of Chinese Academy of Sciences, Beijing 100049, China
3
Kunming Institute of Zoology, Chinese Academy of Sciences, Kunming 650223, China
4
Central Department of Zoology, Institute of Science and Technology, Tribhuvan University, Kathmandu 44613, Nepal
5
Kanti Children’s Hospital Maharajgunj, Kathmandu 44616, Nepal
*
Author to whom correspondence should be addressed.
ISPRS Int. J. Geo-Inf. 2018, 7(7), 275; https://0-doi-org.brum.beds.ac.uk/10.3390/ijgi7070275
Submission received: 29 May 2018 / Revised: 3 July 2018 / Accepted: 7 July 2018 / Published: 12 July 2018
(This article belongs to the Special Issue Geoprocessing in Public and Environmental Health)

Abstract

:
Dengue fever is one of the leading public health problems of tropical and subtropical countries across the world. Transmission dynamics of dengue fever is largely affected by meteorological and environmental factors, and its temporal pattern generally peaks in hot-wet periods of the year. Despite this continuously growing problem, the temporal dynamics of dengue fever and associated potential environmental risk factors are not documented in Nepal. The aim of this study was to fill this research gap by utilizing epidemiological and earth observation data in Chitwan district, one of the frequent dengue outbreak areas of Nepal. We used laboratory confirmed monthly dengue cases as a dependent variable and a set of remotely sensed meteorological and environmental variables as explanatory factors to describe their temporal relationship. Descriptive statistics, cross correlation analysis, and the Poisson generalized additive model were used for this purpose. Results revealed that dengue fever is significantly associated with satellite estimated precipitation, normalized difference vegetation index (NDVI), and enhanced vegetation index (EVI) synchronously and with different lag periods. However, the associations were weak and insignificant with immediate daytime land surface temperature (dLST) and nighttime land surface temperature (nLST), but were significant after 4–5 months. Conclusively, the selected Poisson generalized additive model based on the precipitation, dLST, and NDVI explained the largest variation in monthly distribution of dengue fever with minimum Akaike’s Information Criterion (AIC) and maximum R-squared. The best fit model further significantly improved after including delayed effects in the model. The predicted cases were reasonably accurate based on the comparison of 10-fold cross validation and observed cases. The lagged association found in this study could be useful for the development of remote sensing-based early warning forecasts of dengue fever.

1. Introduction

Dengue fever is one of the most important public health problems of tropical and subtropical countries across the world. The disease has rapidly spread in recent years. The burden of disease has increased 30-fold during the last 50 years with geographic expansion from 9 to 125 countries in the last 40 years [1]. Studies have shown that around 3.9 billion people are under direct risk of dengue transmission and 390 million of them are infected each year globally [2]. Dengue fever is a mosquito-borne viral disease caused by any one of four different dengue virus serotypes (DENV 1–4) [3]. The disease is transmitted by the Aedes female mosquito which is endemic to the urban environment of many tropical and subtropical regions [2]. Due to global climate change and increasing international migration and trading, the dengue fever problem is likely to be more severe in the future [4].
Dengue transmission is seasonal worldwide except for the equatorial region [5] that peaks in hot-wet periods of the year and lowers with the onset of winter. This temporal fluctuation is dominantly driven by meteorological and environmental conditions according to the season. Temperature influences the occurrence and transmission of dengue fever via the survival and development of mosquito vectors, virus replication, and vector host interaction by affecting incubation period and biting rate [6]. Rainfall provides breeding sites and stimulates eggs hatching for mosquitoes [7]. Extremely higher or lower temperature and heavy rainfall are negatively associated with dengue fever [7,8]. Regional climate phenomena such as El Niño Southern Oscillation (ENSO) and Indian Ocean Dipole (IOD) also affect temporal dynamics of dengue transmission by affecting the local weather [9,10,11,12]. Vegetation dynamics affects mosquito survival by providing a resting place for adult mosquitoes and moisture needed for their breeding [13]. Vegetation canopy reduces wind speed and provides favorable environment for development of the mosquito population [14].
Previous studies have demonstrated the delayed effects of weather and environmental variables in the temporal pattern of dengue fever in different countries. The delayed effect is generally explained as the period necessary for the growth and development of mosquitoes and incubation period of the disease, which is affected by regional and local climates. In Malaysia, a 26–28 days delayed effect for precipitation and 51 days for minimum temperature were observed [15]. In Taiwan, rainfall was associated with dengue fever from its onset and lasted for at least three months [16]. The lagged association of dengue with normalized difference vegetation index (NDVI) is almost synchronous and extended up to 40 weeks [17]. The El Nino 3.4 index was associated to dengue incidence at 4 months lag in Bangladesh [11]. Therefore, site specific studies are necessary to understand the synchronous and delayed effect of weather for supporting the public health authority.
Previous studies largely relied on station-based weather data exploring the temporal association of dengue fever and other climate sensitive diseases. However, application of remote sensing data is increasing in the recent years. Remote sensing measures are sensitive to environmental conditions that may correspond to the occurrence and spread of the disease [18]. The availability of spatially extensive and temporally consistent data from earth observation offers sources of effective environmental information for the development of an epidemiological risk model [13]. The high temporal resolution data from the National Oceanic and Atmospheric Administration (NOAA) and Moderate Resolution Imaging Spectroradiometer (MODIS) satellites provide enormous opportunities for epidemiological time series analysis to understand the temporal epidemiology of dengue and other infectious diseases. NOAA Advanced Very High Resolution Radiometer (AVHRR) sea surface temperature [7], MODIS vegetation Index (NDVI and enhanced vegetation index (EVI)), Land Surface Temperature (LST) [13,19,20], and Tropical Rainfall Measuring Mission (TRMM) precipitation estimation are widely used data to explain temporal patterns of dengue and other climate sensitive diseases [13,20,21].
In Nepal, dengue fever has been reported every year since its emergence in 2004, especially in the southern lowland Tarai. This disease is normally reported from June/July, peaks in the post monsoon season (October/November), and declines with the arrival of winter. Recent evidences have shown big post monsoon outbreaks in the lowland districts such as Chitwan and Jhapa [22,23]. Recently, the disease has been reported even from higher elevated river valleys due to climate change and increased travel of people [22]. The knowledge of temporal variations of dengue fever and its associations with environmental variables is vital to support public health decision making for control and preventions of dengue epidemics. However, no study has yet been made in Nepal to understand temporal variations of dengue fever and associated weather and environmental variables therein.
The aim of this study was to explore temporal patterns of dengue fever and its association with five remotely sensed environmental variables in Chitwan district, one of the highest dengue prevalent districts in Nepal. This study hypothesized that variability and trends in precipitation, vegetation aspects, and land surface temperature are primary drivers of dengue transmission dynamics; and that satellite derived variables can explain the temporal patterns of dengue risk. An important element of this study is to support public health authorities by providing strategic recommendations to develop a remote sensing-based integrated early warning system.

2. Materials and Methods
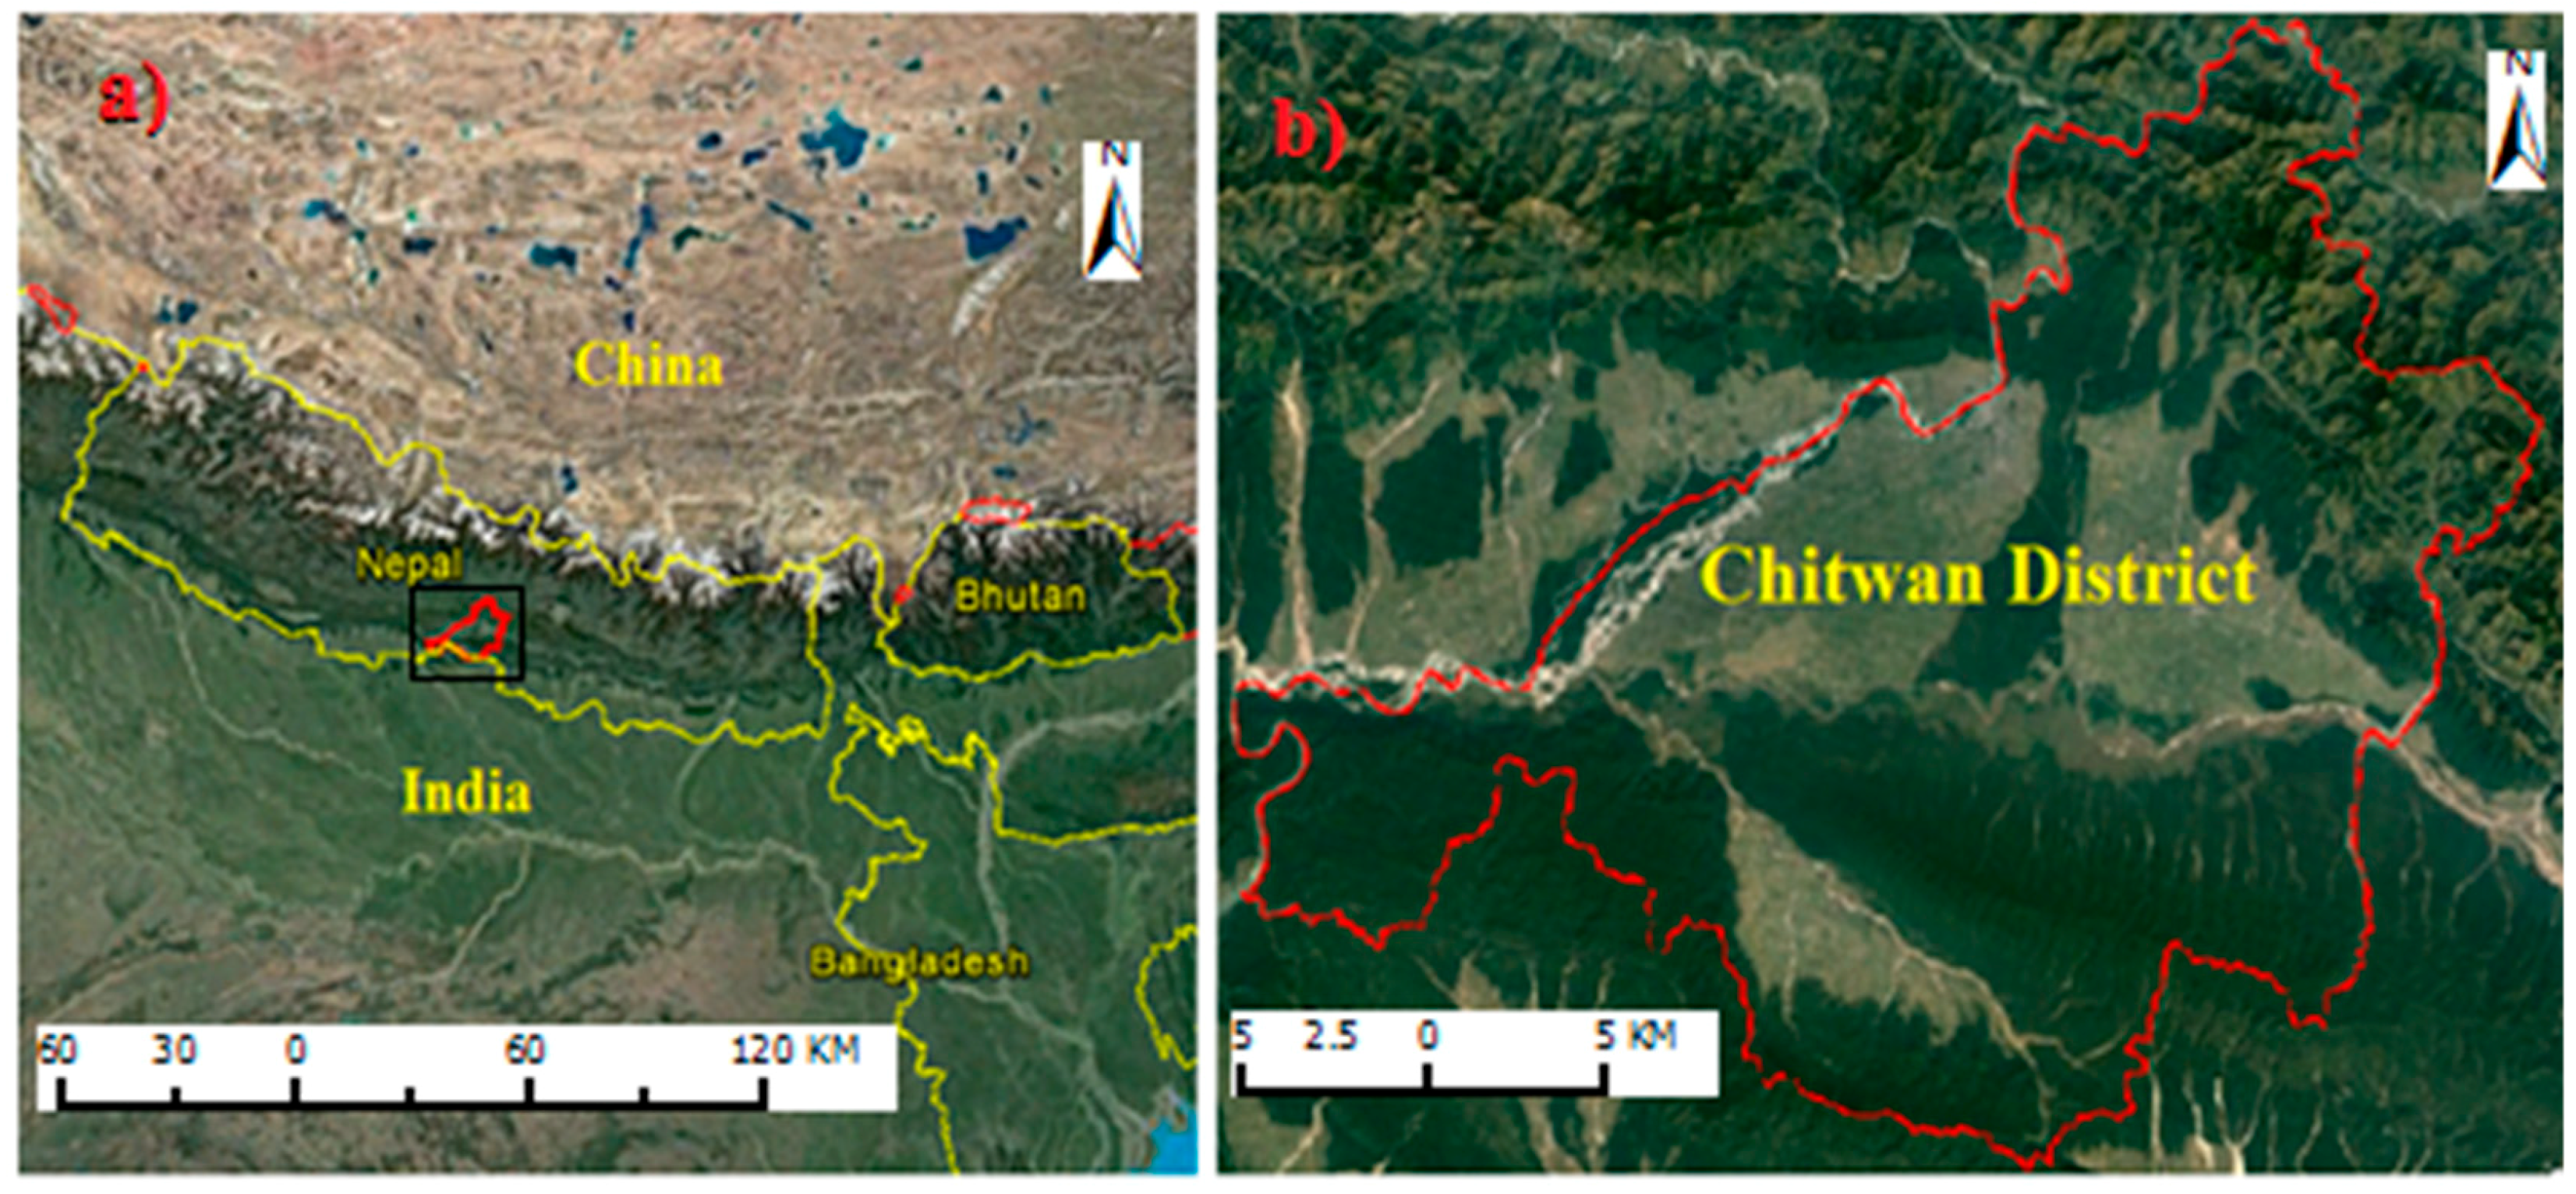
2.1. Study Area

Chitwan district is a central southern lowland district located at 83.92° E to 84.78°3′ E and 27.35° N to 27.88° N (Figure 1). Land topography of the district is generally plain. The climate of the Chitwan is subtropical monsoon with remarkable seasonal variation in temperature and precipitation. It is one of the most populated districts of Nepal with average population density of 800 person/km2, 4.44 times higher than that of national average (180 person/km2) [24]. The Chitwan district is the gateway to the capital, which connects east and west Nepal by the East-West highway. This is the district of first report of dengue fever in Nepal in the year 2004 [25], and has had the highest prevalence since then. The district has suffered from several of the worst outbreaks including the big outbreaks of 2010, 2013, and 2016.

2.2. Dengue Data

The number of monthly dengue fever cases between January 2010 and December 2016 were obtained from the Epidemiology and Disease Control Division (EDCD), Department of Health Services, Government of Nepal. The EDCD is the government agency responsible for developing and intervening with disease control strategies throughout the country based on the epidemiological data collected across the country. These dengue cases were confirmed by the Immunoglobulin (IgG) or Immunoglobulin M (IGM) test in the laboratory done from different levels of health facilities distributed in the district. No further classification of dengue data was available based on serological characteristics.

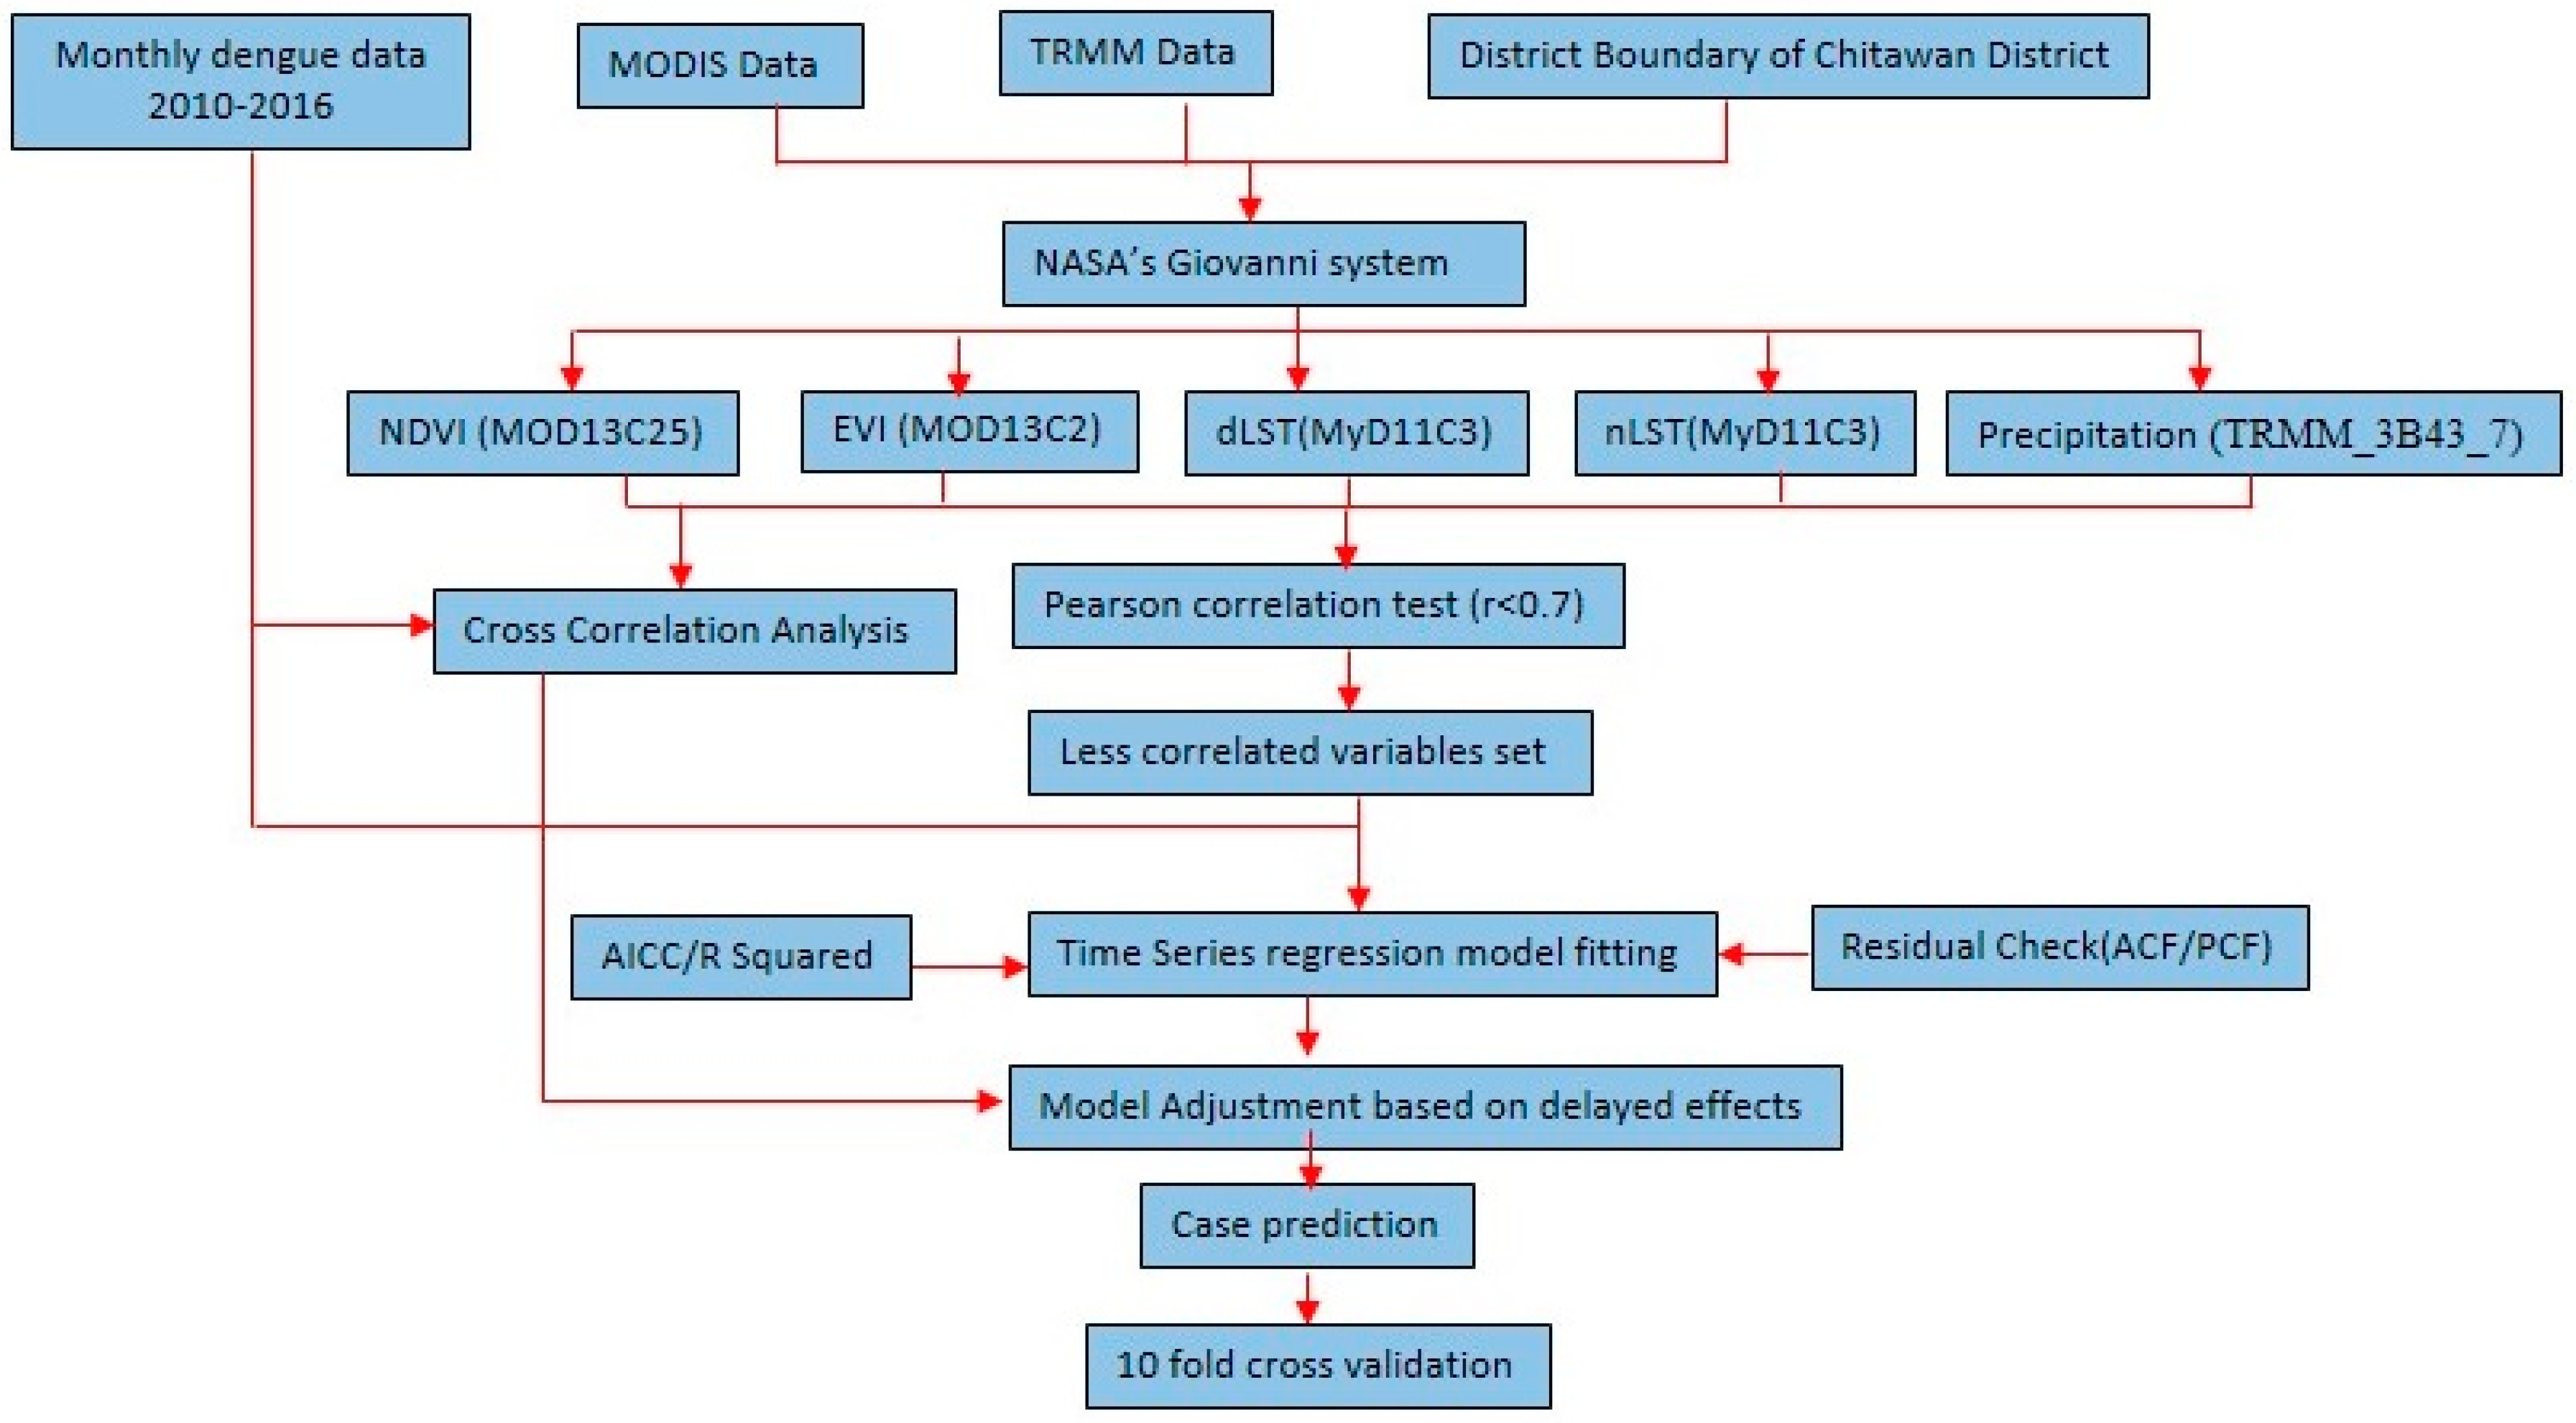
2.3. Remote Sensing Data

In this study, five remote sensing based environmental variables—precipitation (TRMM_3B43_7), NDVI (MOD13C25), EVI (MOD13C25), nighttime land surface temperature (nLST) (MYD11C3), and daytime land surface temperature (dLST) (MYD11C3)—from TRMM and MODIS satellites were used to understand temporal patterns and the associations of remotely sensed variables with monthly dengue fever cases in Chitwan district of Nepal. These variables have been used for analysis in many previous studies [20,26].
TRMM_3B43 [27] is monthly averaged (mm/month) precipitation derived from the radar sensor on board of the TRMM satellite [28]. This data set combines the microwave infrared measurement and gauge adjustment at an almost global scope (between 50 N and 50 S degrees in latitude) at 0.25 degree resolution. NDVI (MOD13C25) and EVI (MOD13C25) are the cloud-free 1 km spatial resolution product of the MODIS instrument aboard the Terra and Auqa Satellites, respectively. NDVI is a numerical quantity derived from reflectance measured in the red and near-infrared spectral bands that provides information about photosynthetic activity [29]. It provides information about the greenness of the vegetation canopy. EVI is similar to NDVI but corrects for atmospheric effects and is more sensitive to variations in canopy structure. Land surface temperature (LST) is the mean radiative skin temperature of an area of land resulting from the energy balance between solar heating and land-atmosphere cooling. MODIS LST is retrieved based on a split-window algorithm that corrects for atmospheric effects based on the differential absorption in MODIS’s two adjacent infrared bands, 31 and 32 [30]. The nLST (MYD11C3) and dLST (MYD11C3) products are monthly composite averages derived from the daily global product (MYD11C1) of land surface temperature. The details of remote sensing data used as explanatory variables is summarized in Table 1.
Area averaged mean monthly time series values of these respective variables from 2010 to 2016 (82 months) were extracted using the polygon of Chitwan district from the Online Visualization and Analysis Infrastructure (Giovanni) system in the NASA Goddard Earth Science Data and Information Service Center (GES DISC) (https://giovanni.gsfc.nasa.gov/giovanni/). The Giovanni system is a popular and widely used system to extract remotely sensed environmental variables in disease studies [13,31].

2.4. Statistical Analysis

At first, we computed descriptive statistics (Mean, Maximum, Minimum, and 25th, 50th, 75th, and 99th percentile) of monthly time series for both dengue fever cases and associated potential remotely sensed environmental risk factors. In the next step, these variables were plotted in the graph to understand their monthly distribution patterns.
The relationship between monthly dengue fever cases and remotely sensed environmental variables were assessed based on Pearson’s correlation metrics using the cross-correlation function (CCF), which is expressed mathematically as:
ρxy (t) = γxy (t)/(σxσy) t = 0, ±1, …, ±6
where ρ(t) is the cross-correlation coefficient at time lag t; σ is the standard deviation monthly dengue fever cases and remotely sensed variables; and γ is the co-deviance function.
The delayed effects were checked for up to 6 months based on previous studies [32]. The advantage of such long lags is that it may capture system memory effects over more than one wet season, since the eggs of A. aegypti may survive desiccation for four to six months [17]. However, most previous studies assessed the delayed effects up to three months, accounting for the period necessary for the growth and development of mosquitoes and the intrinsic incubation of dengue virus [15].
In the next step, Pearson correlation coefficient matrix was calculated for the explanatory variables. Highly correlated (r > |0.7|) explanatory variables were not included in the same regression model simultaneously to avoid multicollinearity effects [33] in the model. A Poisson generalized additive model (GAM) was used to examine temporal associations between remotely sensed environmental variables and monthly dengue fever cases accounting for its over dispersion [11,15,34]. Mathematically the model is expressed as
E ( Y t ) PoissonE ( Y t ) ,   t = 1 , , n
ln ( E ( Y i ) = β 0 + s ( T , timedf ) + X t + Y t + Z t + ε i
where E(Yt) is the expected number of dengue cases in month t, β 0 is the intercept, s ( T , timedf ) is smooth function of time with degree of freedom, Xt, Yt, and Zt are variables included in the model, and ε i is error terms.
The model was adjusted with a natural cubic spline of the time per year using 4 degree of freedom(df), and the year as categorical variables to control for seasonal and long-term trends [11]. The sensitivity of the smoothing function was assessed by small changes in the df on both sides. The best model was chosen with lowest AIC score [35], highest deviance explained, and highest adjusted R-squared value. The best-fit model was then adjusted based on the highest significant cross correlation to account for the delayed effects of the selected remotely sensed environmental variables. The model residual diagnosis was performed using graphical examinations autocorrelation function (ACF), and partial autocorrelation function (PACF). The best model was used to predict dengue cases and the validation was performed using 10-fold cross validation methods followed by comparison of cross validation with observed and predicted values. All the statistical analyses were performed using different packages including “mgcv” in the R software [36]. The overall methodological workflow is presented in Figure 2.

3. Results

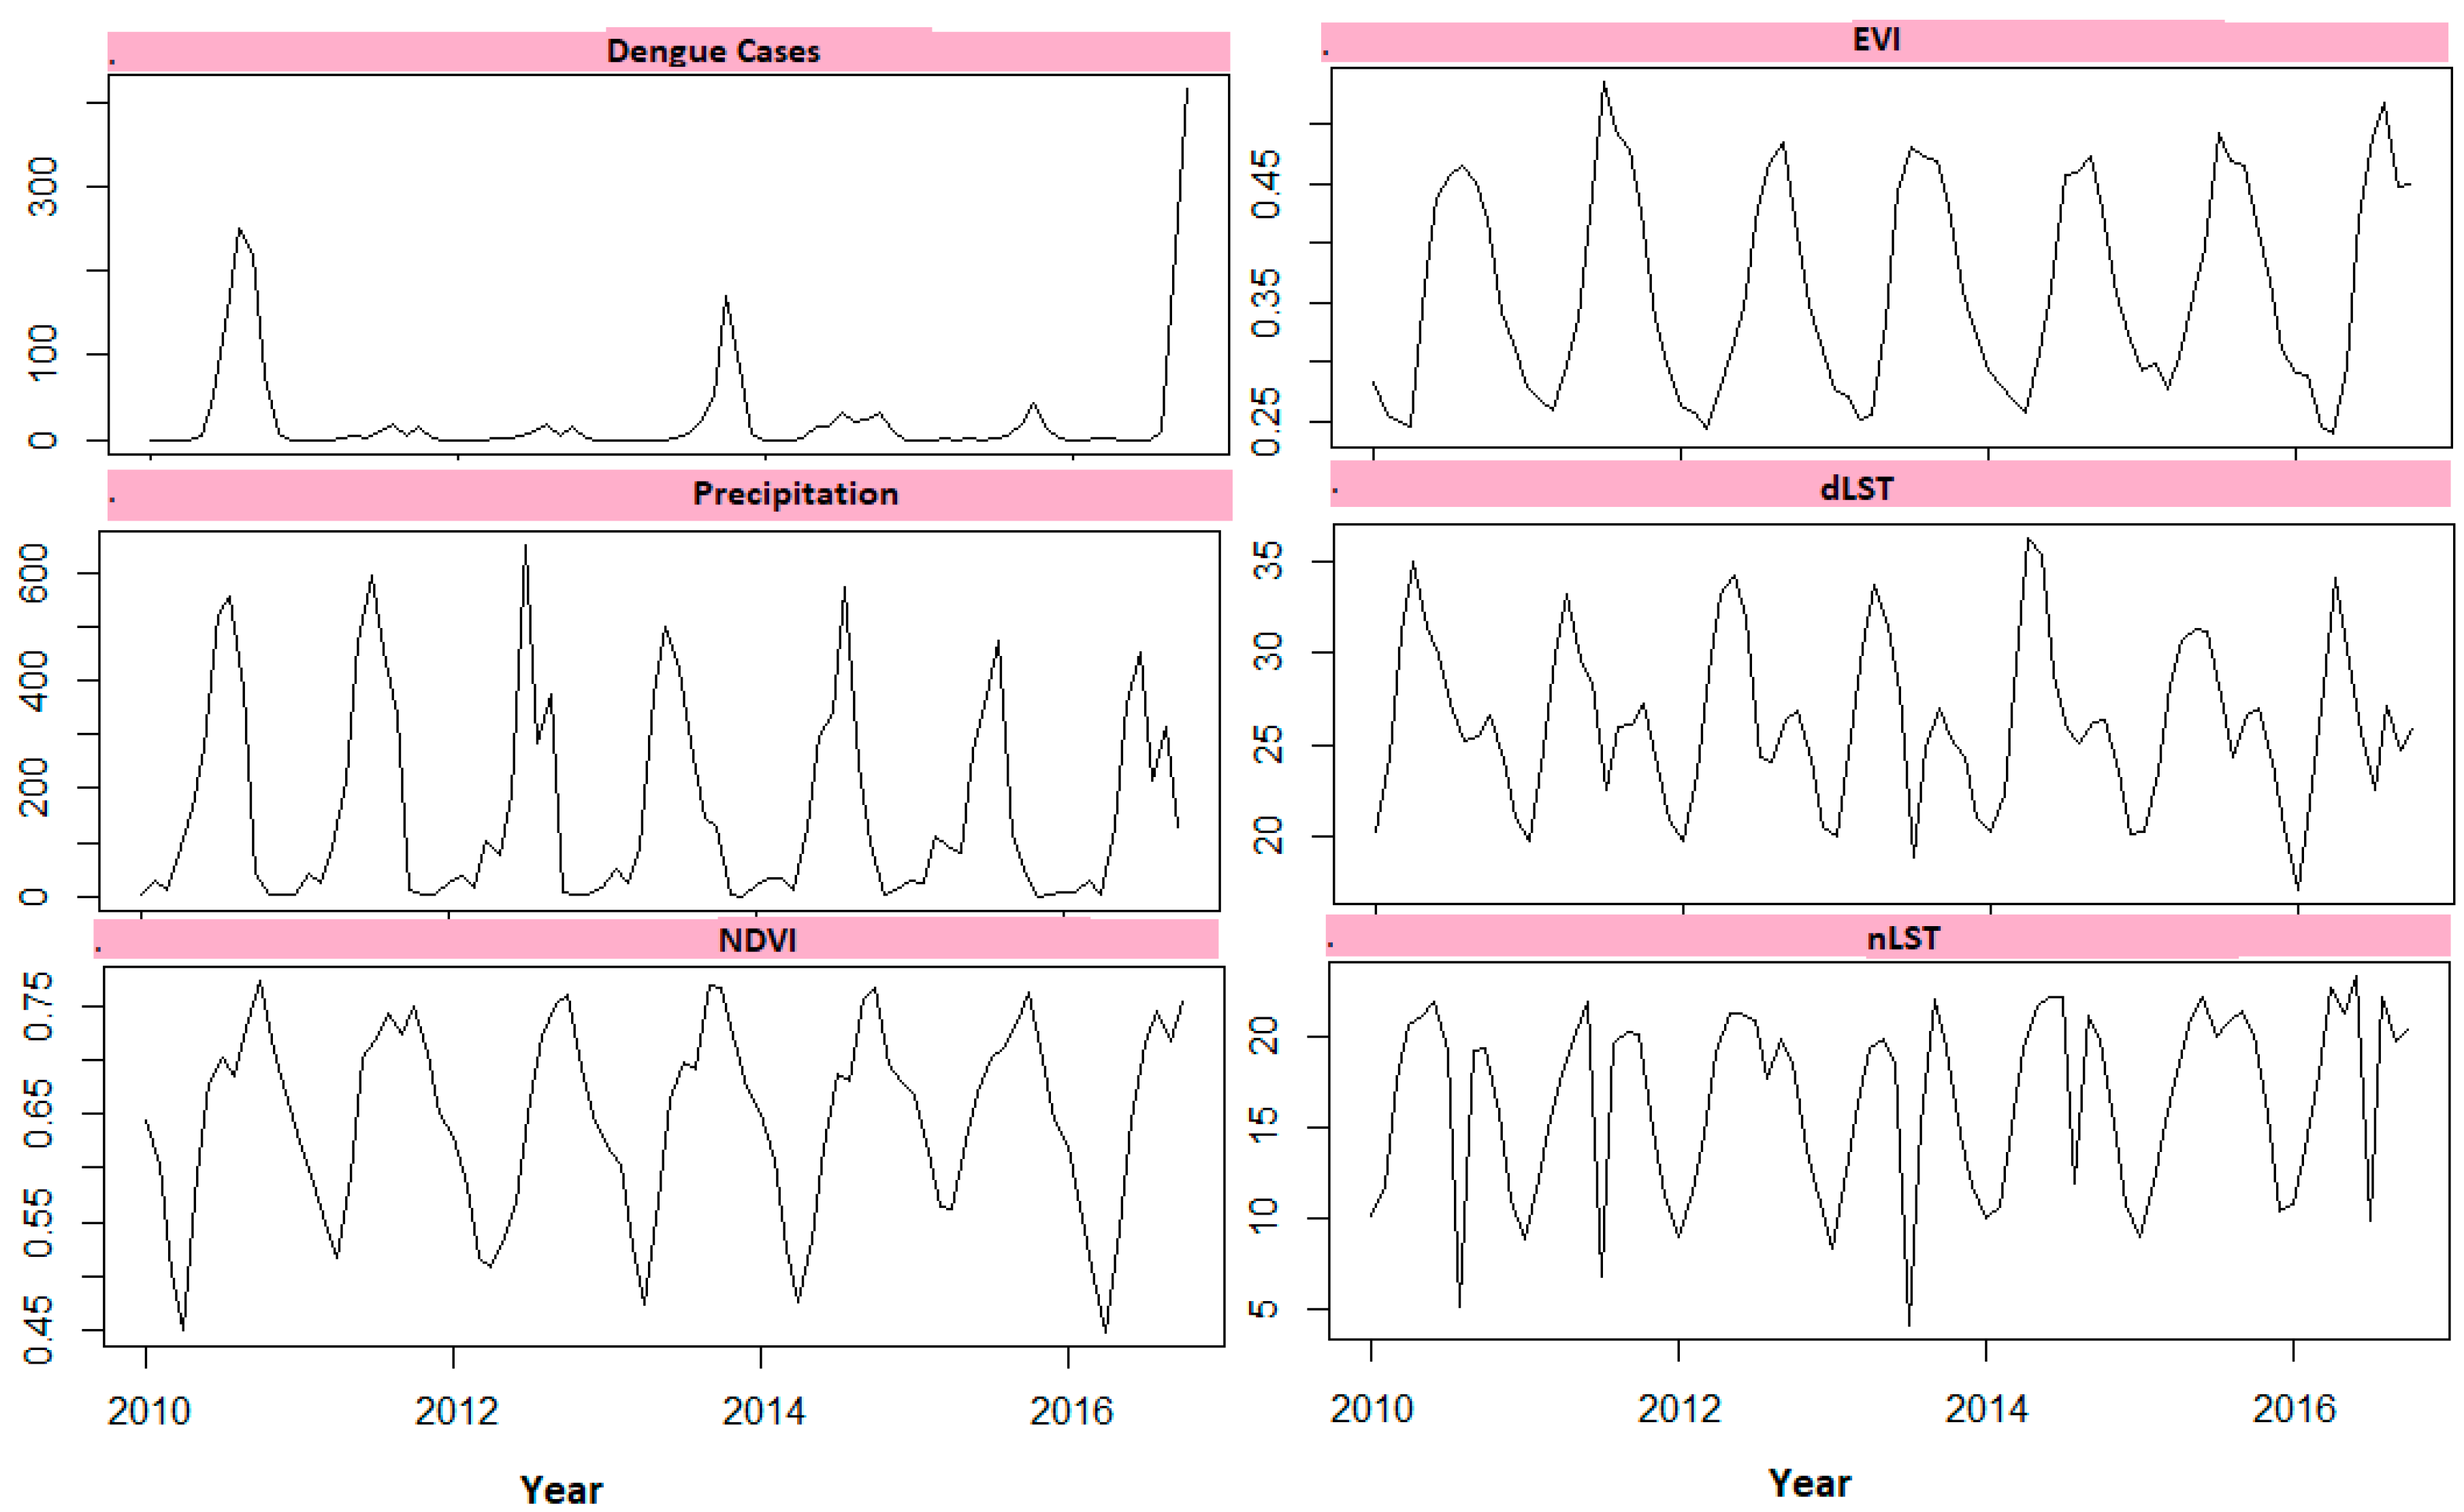
3.1. Descriptive Statistics

A total of 2099 laboratory confirmed dengue cases were reported in Chitwan district during the study period of 82 months. Descriptive statistics of dengue fever cases and remotely sensed explanatory environmental variables are presented in Table 2 and Figure 3. There was a mean average of 25 monthly dengue cases over the study period. The average value of monthly precipitation, NDVI, EVI, nLST, and dLST was 16.79, 0.64, 16.44, and 26.26, respectively. Figure 3 shows three major peaks in the monthly distribution of dengue fever cases indicating three major outbreaks of 2010, 2013, and 2016 during the study period. Explanatory independent variables clearly pronounced seasonality compared to the long-term trend.
Table 3 shows the Pearson’s correlation coefficients between various monthly remotely sensed environmental variables. There was a strong significant (p < 0.05) correlation of EVI with rainfall (r = 0.731) and NDVI (r = 0.78). Similarly, dLST and nLST were also significantly correlated. The correlation values of other variable pairs were lower than the selected threshold.

3.2. Cross Correlation Analysis and Lagged Association

Temporal association of dengue fever was assessed by computing the cross correlation between dengue and explanatory variables with up to six months lag. The result of cross correlation is presented in Table 4.
The correlative association of dengue and selected variable varied in strength and lag period. The association of EVI with dengue fever cases was significantly positive in the same month and the strength of association further increased in first and second month lag but decreased in the following months. Significant positive correlation was also observed with NDVI in lag 0 and lag 1. The strength of relationship was strong in lag 0. There was no significant correlation between dengue and dLST and nLST until lag 3. However, in lag 5 both dLST and nLST were positively associated with dengue fever. The significant correlation of dLST continued to lag 6, however, the nLST correlation was not significant in that period. Precipitation and dengue fever association was significantly positive from lag 0 to lag 3 with strong correlation in lag 1.

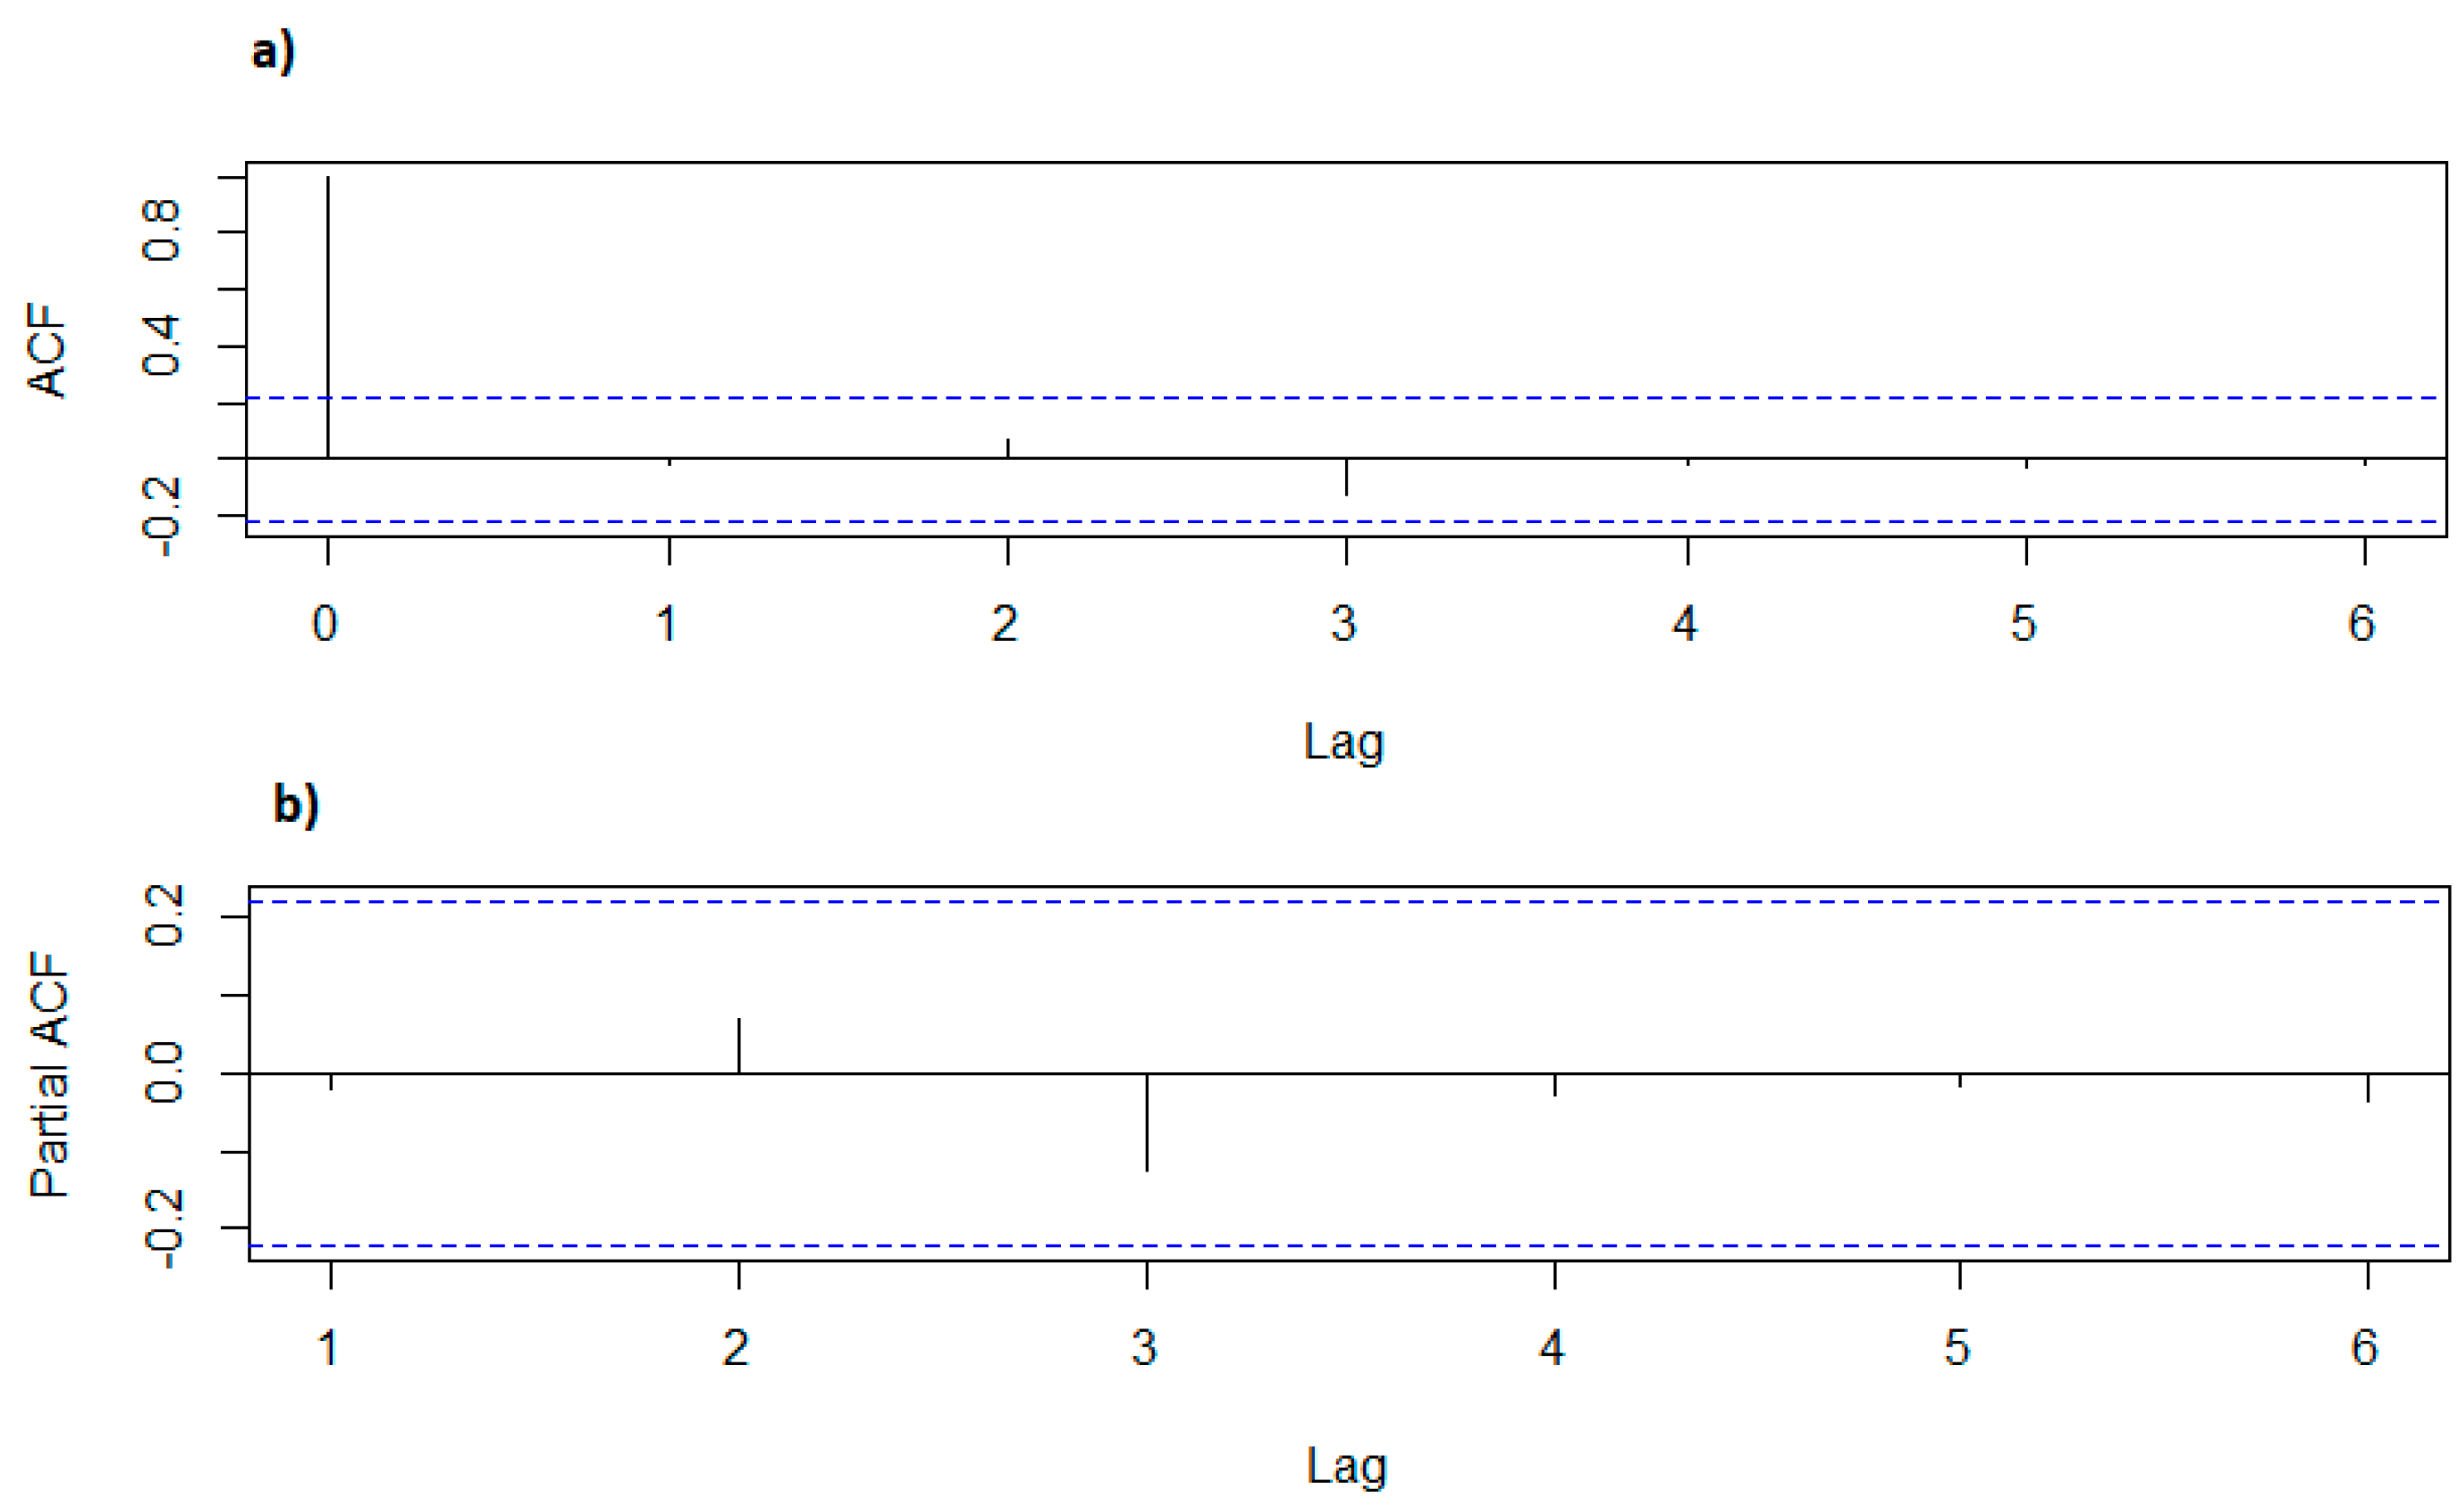
3.3. Model Fitting, Model Selection and Residual Diagnosis
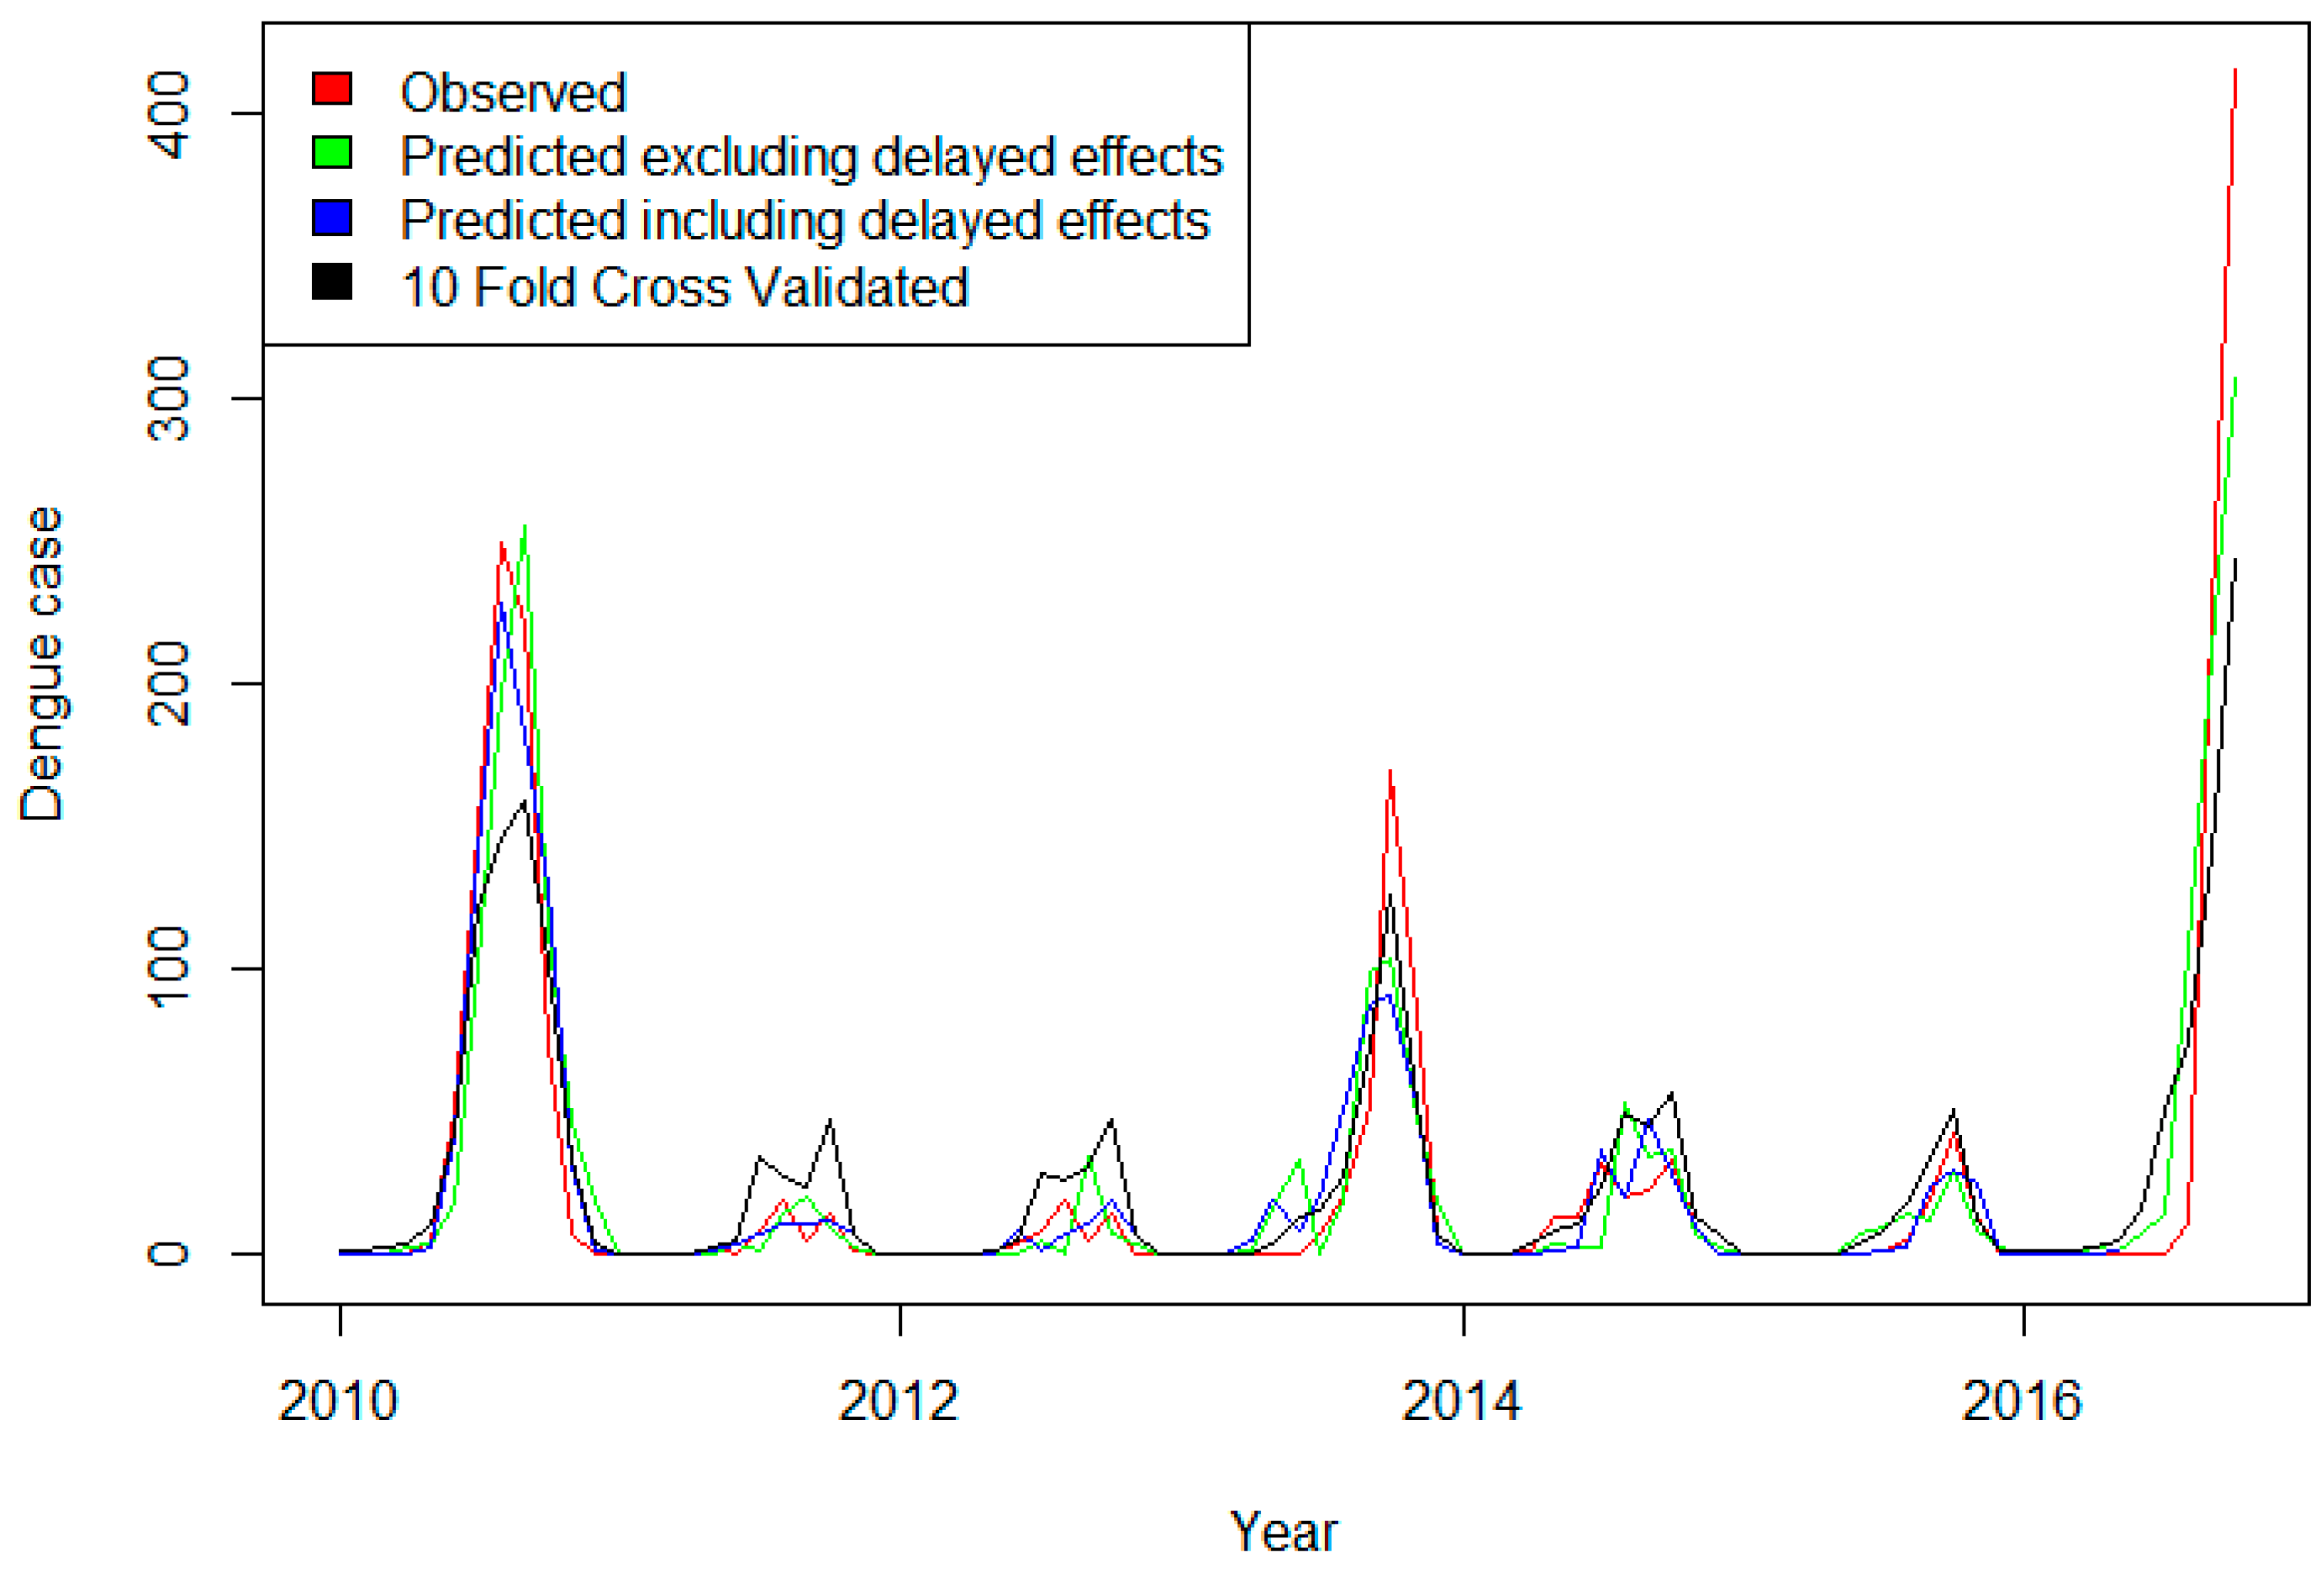
To assess the explanatory power of selected variables, a total 15 sets of models were fitted using a GAM-based Poisson regression model with different possible combinations of variables, of which five models were univariate and the remaining 10 were multivariate (Table 5). Univariate models were firstly fitted for each remotely sensed environmental variable, and then multivariate models were constructed adding each variable and observing the values of AIC, Adjusted R-squared, and Deviance Explained. Among the univariate model, precipitation explained the highest deviance (65.6%) with lowest AIC and adjusted R-squared. This model was better than the combination of NDVI with dLST and NDVI with nLST.
The other nine models were multivariate based on combinations of two or three variables. While fitting the multivariate model, highly correlated variables were not included in the same model simultaneously. For example, EVI was not included with NDVI and precipitation, and dLST were not included together with nLST.
The dLST and Precipitation combination explained the highest deviance (84.7%) with lowest AIC and adjusted R-squared with the best among bivariate models, whereas the dLST and NDVI resulted in the weakest model. By adding the NDVI to the best bivariate model, both the adjusted R-squared and deviance explained increased reduction in the AIC value. This model was the best fit multivariate model with the combination of the three variables. This model explained the highest deviance (65.6%) with lowest AIC and adjusted R-squared. Each of these models also included natural cubic spline function with 4 degree of freedom and year as categorical variable. Without temporal smoothing, our final model only explained about 44.8% of deviance.
Based on the lowest Akaike’s Information Criterion (AIC) score, highest deviance explained, and adjusted R-squared, the three variables included additive model (model14)—precipitation, dLST, and NDVI—was selected as the best fit model without consideration of delayed effects of the selected explanatory variables.
In the next step, the best fit model was adjusted using the highest significant cross correlation to account for the delayed effects of the selected remotely sensed environmental variables. As a result, the AIC value was significantly dropped from 1256.66 to 682.160, considerably increasing the adjusted R-squared and deviance explained. Residual diagnosis of the best fit model adjusted with delayed effect based on ACF and PACF plot (Figure 4) showed no significant autocorrelation in the residual. Natural cubic spline function with 4 df for month and representation of year as categorical variable had well captured seasonality and long-term trends in the model.

3.4. Prediction

The delayed effects adjusted best-fit model (model15) was used to predict dengue cases and assess the predictability of selected remote sensing variables. Figure 5 shows observed predicted and cross-validated temporal distribution of dengue fever cases over the study period. Prediction based on the selected model matched with observed values and was able to capture the majority of peaks, representing the major dengue outbreaks. The correlation coefficient between observed and predicted values is 0.93751, representing the well-spelled model. This shows strong association of remotely sensed meteorological and environmental variables with the dengue cases. Therefore, it can be said that NDVI, dLST, and precipitation together can predict dengue with reasonable accuracy through controlling the seasonality with spline function with 3 df for month and year as a categorical variable. The 10-fold cross validation also indicates that selected model had reasonable accuracy as the observed and predicted values mostly coincided with each other.

4. Discussion

The Chitwan district remained the highest dengue prevalent district in Nepal since its emergence in 2004, which is the first report of dengue in Nepal [37]. The district suffered three major outbreaks, in 2010, 2013, and 2016 with the three year cycle accounting for about 71, 33, and 52 percentage of total cases reported across the country [23]. The temporal pattern showed seasonality following the monsoon rainfall. This study examined the temporal variability of dengue fever and its association with remotely sensed environmental variables in Chitwan district Nepal. This study also intended to assess the delayed effects of environmental variables in the transmission of dengue fever. The temporal lagged associations identified in this study can be useful for predicting dengue fever cases in advance, which could support implementation of remote sensing-based early warning mechanisms to control the dengue fever [16].
The results revealed that selected remotely sensed environmental variables were significantly correlated synchronously or with delayed effects. Concurrent with previous research, satellite estimated precipitation showed significant lagged positive association with monthly aggregated dengue fever at a lag of 0 to 4 months [38]. The observed lagged association gradually weakens after the second month. Temporal association investigated by other researchers had around one to three months lagged association of dengue and precipitation based on in situ measurements. For instance, the time was approximately one month in Malaysia [15], two months in Sri Lanka [34], and three months in Brazil [39]. This lag time is justifiable with time necessary for the growth and development of vector; from egg-larva, pupa-adult mosquito lead time [40]. The current research demonstrated remotely sensed precipitation estimates can be used to model the temporal pattern of dengue cases. Synchronous positive temporal association of NDVI was found with dengue fever. The significant positive correlation was extended up to one month’s lag. Similar positive association was explored with EVI and from 0 to lag 3. This showed that increasing vegetation vigor with increasing NDVI provides the moisture necessary for the proliferation of mosquitoes by providing the breeding and resting site for the adult mosquito [41]. The time series analysis of other mosquito-borne diseases such as Malaria also showed the lagged positive association between MODIS NDVI and EVI. However, the delayed effects varies from place to place [13,17,21], showing complex local interaction between environment and disease transmission. No significant association was found for both temperature proxies (dLST and nLST) up to lag 3. However, the positive lagged association from lag 4 indicates system memory effects over more than one wet season, since the eggs of A. aegypti may survive desiccation for four to six months [17].
The results depicted that the selected remotely sensed environmental variables explained temporal variation and confirmed them as good predictors. Previous time series analyses have also shown high predictability of these variables in dengue [17,38], malaria [13,21], and Murray Valley encephalitis virus forecasting [42]. In our study, precipitation was found as the strongest predictor among the selected variables. However, all the variables were able to explain more than 77 percent variation in the monthly temporal patterns of dengue fever cases. The explanatory power of both vegetation indices, NDVI, and EVI was almost the same. Vegetation dynamics can be a good indicator that provides resting or feeding sites for mosquitoes or can serve as a proxy for the presence of breeding sites. The combination of precipitation, dLST, and NDVI explained the largest deviance with minimum AIC, which was therefore selected as the best fit model. Similar to previous studies on dengue fever the best fit model was significantly improved after including the delayed effect of selected environmental variables [17,38]. This indicates that inter annual variability of dengue transmission can be captured by remotely sensed variables. The deviance not explained by our selected model could be due to missing variables and nonlinear interaction of selected variables. The residual check suggested no significant autocorrelation. The high concordance among observed, predicted, and cross-validated values indicates the reasonable predictive performance of our finally selected model.
Remote sensing application is increasingly being used in health studies for monitoring, surveillance, or risk mapping, particularly of vector-borne diseases [18]. In the case of dengue fever, a number of studies have used remote sensing data [17,43]. Satellite-derived and vegetation and temperature proxies such as NDVI, EVI, and LST have already proven their importance in the study of infectious diseases [44,45]. However, such studies mostly focused on explaining the spatial variations of disease incidence [46,47,48,49]. Only a few studies have used remote sensing data to explore the temporal patterns of dengue fever [17,38], though more examples are available for malaria [13]. High temporal resolution NOAA, MODIS, and TRMM satellites provide immense opportunities for the application of remote sensing [50] in the temporal analysis of dengue and other infectious diseases. Our study could be one new illustration to further demonstrate the importance and applicability of remote sensing data in the study of the temporal pattern of dengue and other environmental sensitive diseases.
This study was subject to number of limitations. It utilized only 82 months observation, which is a relatively short dataset in time series analysis. Although systematic collection of dengue data was started from 2006 in Nepal, we could not acquire monthly aggregated dengue cases of the study area until 2010. Monthly aggregated data is coarse in the study of temporal dynamics on dengue transmission and may have missed weekly fluctuations and their association with selected environmental variables. Several researches have highlighted the importance of higher temporal resolution data in dengue forecasting [15,17]. Therefore, we warrant future research using weekly time series data rather than depending on coarse monthly averages. Possible under reporting of the disease could be another limitation. A previous study claimed huge under reporting of dengue fever in Nepal [51]. This study did not consider nonlinear effects of meteorological and environmental variables, which, in fact, has been implemented in various vector-borne diseases [15,16].
Despite these limitations, this study is very important for several reasons. This study has for the first time quantified temporal patterns of dengue fever and its association with the remotely sensed environmental variables in Nepal. The significant lagged association explored provides opportunities to a develop remote sensing-based early warning system [52]. The importance of early detection for infectious diseases has been acknowledged by many studies [53,54] as a powerful tool to lead governmental authorities on effectively managing interventions for the control and prevention of diseases. Secondly, this study utilized remotely sensed environmental variables to explain the temporal pattern of dengue fever. This also contributes to the scarce literatures on temporal patterns of dengue compared to that on malaria and other mosquito-borne diseases.

5. Conclusions

This study explored and analyzed temporal patterns of dengue fever and its associations with various remotely sensed environmental variables in the Chitwan district of Nepal. The research revealed that the temporal patterns of dengue fever are significantly associated with precipitation, NDVI, and EVI from the same months to three months lag period. The association between both dLST and nLST was weak up to three months lag. The Poisson generalized additive model based on precipitation, NDVI, and dLST with highest lagged correlation explained the highest deviance and R-squared with minimum AIC. The predicted monthly dengue fever cases captured major peaks in the observed temporal distribution of dengue fever. These findings promote a better understanding of temporal patterns of dengue fever and its association with remotely sensed environmental variables. The lagged association explored in this study can be used to develop an early warning system based on epidemiological and earth observation data.

Author Contributions

B.K.A. led this research. He conceptualized the research; collected, processed and analyzed data, and drafted the manuscript. S.N., L.K. and S.P. contributed in data processing and manuscript improvement. M.X. and L.K. helped in data analysis and write-up. C.C. supervised the research and contributed in manuscript improvement.

Funding

This research was funded by the National Key R&D Program of China “Research of Key Technologies for Monitoring Forest Plantation Resources” grant number 2017YFD060090.

Acknowledgments

The Chinese Academy of Sciences (CAS) and The World Academy of Sciences (TWAS) are acknowledged for awarding the CAS-TWAS President’s fellowship to Bipin Kumar Acharya, Shaid Naeem and Laxman Khanal for their PhD research. We acknowledge the support of the Epidemiology and Disease Control Division (EDCD), Department of Health Services, Government of Nepal for providing us dengue occurrence data for the Chitwan districts. We are equally grateful the anonymous reviewers for their invaluable feedback.

Conflicts of Interest

The authors declare no conflict of interest.

References

  1. Wilder-Smith, A.; Murray, N.A.E.; Quam, M.B. Epidemiology of dengue: Past, present and future prospects. Clin. Epidemiol. 2013, 5, 299–309. [Google Scholar] [CrossRef] [PubMed]
  2. Bhatt, S.; Gething, P.W.; Brady, O.J.; Messina, J.P.; Farlow, A.W.; Moyes, C.L.; Drake, J.M.; Brownstein, J.S.; Hoen, A.G.; Sankoh, O.; et al. The global distribution and burden of dengue. Nature 2013, 496, 504–507. [Google Scholar] [CrossRef] [PubMed] [Green Version]
  3. Messina, J.P.; Brady, O.J.; Pigott, D.M.; Golding, N.; Kraemer, M.U.G.; Scott, T.W.; Wint, G.R.W.; Smith, D.L.; Hay, S.I. The many projected futures of dengue. Nat. Rev. Microbiol. 2015, 13, 230–239. [Google Scholar] [CrossRef] [PubMed]
  4. Naish, S.; Dale, P.; Mackenzie, J.S.; McBride, J.; Mengersen, K.; Tong, S. Climate change and dengue: A critical and systematic review of quantitative modelling approaches. BMC Infect. Dis. 2014, 14, 167. [Google Scholar] [CrossRef] [PubMed]
  5. Regis, L.N.; Acioli, R.V.; Silveira, J.C.; de Melo-Santos, M.A.V.; da Cunha, M.C.S.; Souza, F.; Batista, C.A.V.; Barbosa, R.M.R.; de Oliveira, C.M.F.; Ayres, C.F.J.; et al. Characterization of the spatial and temporal dynamics of the dengue vector population established in urban areas of Fernando de Noronha, a Brazilian oceanic island. Acta Trop. 2014, 137, 80–87. [Google Scholar] [CrossRef] [PubMed]
  6. Morin, C.W.; Comrie, A.C.; Ernst, K. Climate and Dengue Transmission: Evidence and Implications. Environ. Health Perspect. 2013, 121, 1264–1272. [Google Scholar] [CrossRef] [PubMed] [Green Version]
  7. Méndez-Lázaro, P.; Muller-Karger, F.; Otis, D.; McCarthy, M.; Peña-Orellana, M. Assessing Climate Variability Effects on Dengue Incidence in San Juan, Puerto Rico. Int. J. Environ. Res. Public. Health 2014, 11, 9409–9428. [Google Scholar] [CrossRef] [PubMed] [Green Version]
  8. Gubler, D.J. Epidemic dengue/dengue hemorrhagic fever as a public health, social and economic problem in the 21st century. Trends Microbiol. 2002, 10, 100–103. [Google Scholar] [CrossRef]
  9. Eastin, M.D.; Delmelle, E.; Casas, I.; Wexler, J.; Self, C. Intra- and Interseasonal Autoregressive Prediction of Dengue Outbreaks Using Local Weather and Regional Climate for a Tropical Environment in Colombia. Am. J. Trop. Med. Hyg. 2014, 91, 598–610. [Google Scholar] [CrossRef] [PubMed] [Green Version]
  10. Gharbi, M.; Quenel, P.; Gustave, J.; Cassadou, S.; Ruche, G.L.; Girdary, L.; Marrama, L. Time series analysis of dengue incidence in Guadeloupe, French West Indies: Forecasting models using climate variables as predictors. BMC Infect. Dis. 2011, 11, 166. [Google Scholar] [CrossRef] [PubMed]
  11. Banu, S.; Guo, Y.; Hu, W.; Dale, P.; Mackenzie, J.S.; Mengersen, K.; Tong, S. Impacts of El Niño Southern Oscillation and Indian Ocean Dipole on dengue incidence in Bangladesh. Sci. Rep. 2015, 5, 16105. [Google Scholar] [CrossRef] [PubMed] [Green Version]
  12. Chuang, T.-W.; Chaves, L.F.; Chen, P.-J. Effects of local and regional climatic fluctuations on dengue outbreaks in southern Taiwan. PLoS ONE 2017, 12, e0178698. [Google Scholar] [CrossRef] [PubMed]
  13. Midekisa, A.; Senay, G.; Henebry, G.M.; Semuniguse, P.; Wimberly, M.C. Remote sensing-based time series models for malaria early warning in the highlands of Ethiopia. Malar. J. 2012, 11, 165. [Google Scholar] [CrossRef] [PubMed] [Green Version]
  14. Linthicum, K.J.; Anyamba, A.; Tucker, C.J.; Kelley, P.W.; Myers, M.F.; Peters, C.J. Climate and satellite indicators to forecast Rift Valley fever epidemics in Kenya. Science 1999, 285, 397–400. [Google Scholar] [CrossRef] [PubMed]
  15. Cheong, Y.; Burkart, K.; Leitão, P.; Lakes, T. Assessing Weather Effects on Dengue Disease in Malaysia. Int. J. Environ. Res. Public. Health 2013, 10, 6319–6334. [Google Scholar] [CrossRef] [PubMed] [Green Version]
  16. Chien, L.-C.; Yu, H.-L. Impact of meteorological factors on the spatiotemporal patterns of dengue fever incidence. Environ. Int. 2014, 73, 46–56. [Google Scholar] [CrossRef] [PubMed]
  17. Fuller, D.O.; Troyo, A.; Beier, J.C. El Niño Southern Oscillation and vegetation dynamics as predictors of dengue fever cases in Costa Rica. Environ. Res. Lett. 2009, 4, 014011. [Google Scholar] [CrossRef] [PubMed] [Green Version]
  18. Beck, L. Remote Sensing and Human Health: New Sensors and New Opportunities. Emerg. Infect. Dis. 2000, 6, 217–227. [Google Scholar] [CrossRef] [PubMed] [Green Version]
  19. Estallo, E.L.; Ludueña-Almeida, F.F.; Visintin, A.M.; Scavuzzo, C.M.; Lamfri, M.A.; Introini, M.V.; Zaidenberg, M.; Almirón, W.R. Effectiveness of normalized difference water index in modelling Aedes aegypti house index. Int. J. Remote Sens. 2012, 33, 4254–4265. [Google Scholar] [CrossRef]
  20. Sewe, M.O.; Ahlm, C.; Rocklöv, J. Remotely Sensed Environmental Conditions and Malaria Mortality in Three Malaria Endemic Regions in Western Kenya. PLoS ONE 2016, 11, e0154204. [Google Scholar] [CrossRef] [PubMed]
  21. Nygren, D.; Stoyanov, C.; Lewold, C.; Månsson, F.; Miller, J.; Kamanga, A.; Shiff, C.J. Remotely-sensed, nocturnal, dew point correlates with malaria transmission in Southern Province, Zambia: A time-series study. Malar. J. 2014, 13, 231. [Google Scholar] [CrossRef] [PubMed]
  22. Acharya, B.; Cao, C.; Xu, M.; Khanal, L.; Naeem, S.; Pandit, S. Present and Future of Dengue Fever in Nepal: Mapping Climatic Suitability by Ecological Niche Model. Int. J. Environ. Res. Public. Health 2018, 15, 187. [Google Scholar] [CrossRef] [PubMed]
  23. Department of Health Services. Government of Nepal Annual Health Report (2015/2016); Department of Health Services: Kathmandu, Nepal, 2017.
  24. Central Bureau of Statistics (CBS). National Population Census 2011 Household National Report; Central Bureau of Statistics (CBS): Kathmandu, Nepal, 2011.
  25. Pandey, B.D.; Rai, S.K.; Morita, K.; Kurane, I. First case of Dengue virus infection in Nepal. Nepal Med. Coll. J. NMCJ 2004, 6, 157–159. [Google Scholar] [PubMed]
  26. Midekisa, A.; Beyene, B.; Mihretie, A.; Bayabil, E.; Wimberly, M.C. Seasonal associations of climatic drivers and malaria in the highlands of Ethiopia. Parasit. Vectors 2015, 8, 339. [Google Scholar] [CrossRef] [PubMed]
  27. Huffman, G.J.; Bolvin, D.T.; Nelkin, E.J.; Wolff, D.B.; Adler, R.F.; Gu, G.; Hong, Y.; Bowman, K.P.; Stocker, E.F. The TRMM Multisatellite Precipitation Analysis (TMPA): Quasi-Global, Multiyear, Combined-Sensor Precipitation Estimates at Fine Scales. J. Hydrometeorol. 2007, 8, 38–55. [Google Scholar] [CrossRef]
  28. Kummerow, C.; Barnes, W.; Kozu, T.; Shiue, J.; Simpson, J. The Tropical Rainfall Measuring Mission (TRMM) Sensor Package. J. Atmos. Ocean. Technol. 1998, 15, 809–817. [Google Scholar] [CrossRef]
  29. Tucker, C.J. Red and photographic infrared linear combinations for monitoring vegetation. Remote Sens. Environ. 1979, 8, 127–150. [Google Scholar] [CrossRef] [Green Version]
  30. Wan, Z.; Dozier, J. A generalized split-window algorithm for retrieving land-surface temperature from space. IEEE Trans. Geosci. Remote Sens. 1996, 34, 892–905. [Google Scholar] [CrossRef]
  31. Acker, J.; Soebiyanto, R.; Kiang, R.; Kempler, S. Use of the NASA Giovanni Data System for Geospatial Public Health Research: Example of Weather-Influenza Connection. ISPRS Int. J. Geo-Inf. 2014, 3, 1372–1386. [Google Scholar] [CrossRef] [Green Version]
  32. Banu, S.; Hu, W.; Guo, Y.; Hurst, C.; Tong, S. Projecting the impact of climate change on dengue transmission in Dhaka, Bangladesh. Environ. Int. 2014, 63, 137–142. [Google Scholar] [CrossRef] [PubMed] [Green Version]
  33. Guo, C.; Yang, L.; Ou, C.-Q.; Li, L.; Zhuang, Y.; Yang, J.; Zhou, Y.-X.; Qian, J.; Chen, P.-Y.; Liu, Q.-Y. Malaria incidence from 2005–2013 and its associations with meteorological factors in Guangdong, China. Malar. J. 2015, 14, 116. [Google Scholar] [CrossRef] [PubMed] [Green Version]
  34. Talagala, T. Distributed Lag Nonlinear Modelling Approach to Identify Relationship between Climatic Factors and Dengue Incidence in Colombo District, Sri Lanka. Epidemiol. Biostat. Public Health 2015, 12. [Google Scholar] [CrossRef]
  35. Burnham, K.P. Multimodel Inference: Understanding AIC and BIC in Model Selection. Sociol. Methods Res. 2004, 33, 261–304. [Google Scholar] [CrossRef]
  36. R Core Team. R: A Language and Environment for Statistical Computing; R Foundation for Statistical Computing: Vienna, Austria, 2013. [Google Scholar]
  37. Pandey, B.D.; Nabeshima, T.; Pandey, K.; Rajendra, S.P.; Shah, Y.; Adhikari, B.R.; Gupta, G.; Gautam, I.; Tun, M.M.N.; Uchida, R.; et al. First Isolation of Dengue Virus from the 2010 Epidemic in Nepal. Trop. Med. Health 2013, 41, 103–111. [Google Scholar] [CrossRef] [PubMed] [Green Version]
  38. Buczak, A.L.; Koshute, P.T.; Babin, S.M.; Feighner, B.H.; Lewis, S.H. A data-driven epidemiological prediction method for dengue outbreaks using local and remote sensing data. BMC Med. Inform. Decis. Mak. 2012, 12, 124. [Google Scholar] [CrossRef] [PubMed]
  39. Silva, F.D.; dos Santos, A.M.; da Graça Carvalhal Frazão Corrêa, C.; de Jesus Mendes Caldas, A. Temporal relationship between rainfall, temperature and occurrence of dengue cases in São Luís, Maranhão, Brazil. Ciênc. Saúde Coletiva 2016, 21, 641–646. [Google Scholar] [CrossRef] [PubMed] [Green Version]
  40. Laureano-Rosario, A.E.; Garcia-Rejon, J.E.; Gomez-Carro, S.; Farfan-Ale, J.A.; Muller-Karger, F.E. Modelling dengue fever risk in the State of Yucatan, Mexico using regional-scale satellite-derived sea surface temperature. Acta Trop. 2017, 172, 50–57. [Google Scholar] [CrossRef] [PubMed]
  41. Qi, X.; Wang, Y.; Li, Y.; Meng, Y.; Chen, Q.; Ma, J.; Gao, G.F. The Effects of Socioeconomic and Environmental Factors on the Incidence of Dengue Fever in the Pearl River Delta, China, 2013. PLoS Negl. Trop. Dis. 2015, 9, e0004159. [Google Scholar] [CrossRef] [PubMed]
  42. Schuster, G.; Ebert, E.E.; Stevenson, M.A.; Corner, R.J.; Johansen, C.A. Application of satellite precipitation data to analyse and model arbovirus activity in the tropics. Int. J. Health Geogr. 2011, 10, 8. [Google Scholar] [CrossRef] [PubMed]
  43. Troyo, A.; Fuller, D.O.; Calderón-Arguedas, O.; Solano, M.E.; Beier, J.C. Urban structure and dengue incidence in Puntarenas, Costa Rica. Singap. J. Trop. Geogr. 2009, 30, 265–282. [Google Scholar] [CrossRef] [PubMed] [Green Version]
  44. Roslan, N.S.; Latif, Z.A.; Dom, N.C. Dengue Cases Distribution Based on Land Surface Temperature and Elevation. In Proceedings of the 2016 7th IEEE Control and System Graduate Research Colloquium (ICSGRC), Shah Alam, Malaysia, 8 August 2016; pp. 87–91. [Google Scholar]
  45. Herbreteau, V.; Salem, G.; Souris, M.; Hugot, J.-P.; Gonzalez, J.-P. Thirty years of use and improvement of remote sensing, applied to epidemiology: From early promises to lasting frustration. Health Place 2007, 13, 400–403. [Google Scholar] [CrossRef] [PubMed]
  46. Rotela, C.; Fouque, F.; Lamfri, M.; Sabatier, P.; Introini, V.; Zaidenberg, M.; Scavuzzo, C. Space–time analysis of the dengue spreading dynamics in the 2004 Tartagal outbreak, Northern Argentina. Acta Trop. 2007, 103, 1–13. [Google Scholar] [CrossRef] [PubMed]
  47. Arboleda, S.; Nicolas, J.-O.; Peterson, A.T. Mapping Environmental Dimensions of Dengue Fever Transmission Risk in the Aburrá Valley, Colombia. Int. J. Environ. Res. Public. Health 2009, 6, 3040–3055. [Google Scholar] [CrossRef] [PubMed] [Green Version]
  48. Bøgh, C.; Lindsay, S.W.; Clarke, S.E.; Dean, A.; Jawara, M.; Pinder, M.; Thomas, C.J. High spatial resolution mapping of malaria transmission risk in the Gambia, west Africa, using LANDSAT TM satellite imagery. Am. J. Trop. Med. Hyg. 2007, 76, 875–881. [Google Scholar] [PubMed]
  49. Nakhapakorn, K.; Tripathi, N.K. An information value based analysis of physical and climatic factors affecting dengue fever and dengue haemorrhagic fever incidence. Int. J. Health Geogr. 2005, 4, 13. [Google Scholar] [CrossRef] [PubMed] [Green Version]
  50. Estallo, E.L.; Benitez, E.M.; Lanfri, M.A.; Scavuzzo, C.M.; Almiron, W.R. MODIS Environmental Data to Assess Chikungunya, Dengue, and Zika Diseases Through Aedes (Stegomia) aegypti Oviposition Activity Estimation. IEEE J. Sel. Top. Appl. Earth Obs. Remote Sens. 2016, 9, 5461–5466. [Google Scholar] [CrossRef]
  51. Sharma, S.P. Dengue outbreak affects more than 7000 people in Nepal. BMJ 2010, 341, c5496. [Google Scholar] [CrossRef] [PubMed]
  52. Rahman, M.Z.; Roytman, L.; Kadik, A.; Rosy, D.A. Environmental data analysis and remote sensing for early detection of dengue and malaria. In Sensing Technologies for Global Health, Military Medicine, and Environmental Monitoring IV, Proceedings of the SPIE Sensing Technology and Applications, Baltimore, ML, USA, 5–9 MAY 2014; Southern, Š.O., Mentzer, M.A., Rodriguez-Chavez, I., Wotring, V.E., Eds.; SPIE: Baltimore, ML, USA, 2014; p. 91121C. [Google Scholar]
  53. Shi, Y.; Liu, X.; Kok, S.-Y.; Rajarethinam, J.; Liang, S.; Yap, G.; Chong, C.-S.; Lee, K.-S.; Tan, S.S.Y.; Chin, C.K.Y.; et al. Three-Month Real-Time Dengue Forecast Models: An Early Warning System for Outbreak Alerts and Policy Decision Support in Singapore. Environ. Health Perspect. 2015, 124, 1369. [Google Scholar] [CrossRef] [PubMed]
  54. Lowe, R.; Barcellos, C.; Coelho, C.A.S.; Bailey, T.C.; Coelho, G.E.; Graham, R.; Jupp, T.; Ramalho, W.M.; Carvalho, M.S.; Stephenson, D.B.; et al. Dengue outlook for the World Cup in Brazil: An early warning model framework driven by real-time seasonal climate forecasts. Lancet Infect. Dis. 2014, 14, 619–626. [Google Scholar] [CrossRef]
Figure 1. The geographical location of (a) Nepal and (b) Chitwan district.
Ijgi 07 00275 g001
Figure 2. Methodological workflow.
Ijgi 07 00275 g002
Figure 3. Monthly time series for dengue fever cases, and satellite derived variables:precipitation, normalized difference vegetation index (NDVI), enhanced vegetation index (EVI), daytime land surface temperature (dLST), and nighttime land surface temperature (nLST).
Ijgi 07 00275 g003
Figure 4. (a) Autocorrelation and (b) partial autocorrelation of residuals for the selected model.
Ijgi 07 00275 g004
Figure 5. Observed, predicted excluding delayed effects, predicted including delayed effects, and 10-fold cross validated dengue cases based on Poisson generalized additive model. Models also included a natural cubic spline using 4 degrees of freedom for a months and years as a categorical variable.
Ijgi 07 00275 g005
Table 1. MODIS and TRMM Satellite data used in this study.
SatelliteSensorProductIndicatorTemporal PeriodTotal Month
TerraMODISMOD13C25NDVIJanuary2010 to December 201682
TerraMODISMOD13C25EVIJanuary 2010 to December 201682
AcquaMODISMYD11C3nLSTJanuary 2010 to December 201682
AcquaMODISMYD11C3dLSTJanuary 2010 to December 201682
TRMMTRMMTRMM_3B43_7PrecipitationJanuary 2010 to December 201682
Table 2. Descriptive statistics for monthly dengue cases, and remotely sensed environment variables.
Percentiles
VariablesMin.MeanMax.5%25%50%75%95%99%
Dengue0.0025.59415.000.000.001.5014.75169.00401.63
Precipitation0.00160.70651.801.1612.4885.64285.66522.14647.28
EVI0.240.360.530.250.280.340.450.490.53
NDVI0.450.640.770.500.580.660.710.760.77
nLST4.1916.4423.228.9111.9217.9920.2822.1023.17
dLST17.1026.2636.2020.0623.6625.9029.2934.0736.13
Table 3. The Pearson correlation between the remotely sensed environmental variables in Chitwan, Nepal (2010–2016).
VariablesPrecipitationNDVIEVInLSTdLST
Precipitation1.000
NDVI0.3031.000
EVI0.7310.7891.000
nLST0.2130.0300.2951.000
dLST0.067−0.530−0.1220.7231.000
Table 4. Cross correlation analysis between dengue fever cases and selected remotely sensed environmental variables at different lag period, Chitwan, Nepal (* p < 0.05).
Lag MonthsLag 0Lag 1Lag 2Lag 3Lag 4Lag 5Lag 6
NDVI0.368 *0.296 *0.20.001−0.246−0.454−0.491
EVI0.365 *0.421 *0.41 *0.245 *−0.031−0.302−0.407
dLST−0.0410.0160.080.0810.258 *0.358 *0.268 *
nLST−0.0410.0160.080.0810.2580.358 *0.268
Precipitation0.23 *0.351 *0.33 *0.318 *0.137−0.087−0.222
Table 5. Diagnostics of dengue-environmental parameters models.
ModelVariables in the ModelAICAdjusted R-SquaredDeviance Explained (%)
Model1Precipitationt01604.890.6779.50
Model2NDVIt01750.270.5877.30
Model3EVIt01749.790.5777.30
Model4dLSTt01735.570.6177.50
Model5nLSTt01717.530.5577.80
Model6NDVIt0 + nLSTt01736.550.6077.50
Model7NDVIt0 + dLSTt01693.000.5478.20
Model8NDVIt0 + Precipitationt01540.6120.71380.5
Model9nLSTt0 + Precipitationt01601.1040.65679.6
Model10dLSTt0 + Precipitationt01263.0990.84584.7
Model11nLSTt0 + EVIt01737.4370.6477.5
Model12dLSTt0 + EVIt01699.1550.5378.1
Model13Precipitationt0 + nLSTt0 + NDVIt01542.570.7180.5
Model14 *Precipitationt0 + dLSTt0 + NDVIt01256.660.84884.8
Model15 **Precipitationt1 + dLSTt5 + NDVIt0682.1600.8789.3
* Indicates best fit model without considering delayed effects and ** indicates best fit model adjusted to account for delayed effects; t0, t1 and t5 are same month, one month delayed, and five months delayed, respectively.

