Satellite-Derived Bathymetry for Improving Canadian Hydrographic Service Charts

Canadian Hydrographic Service, 200 Kent Street, Ottawa, ON K1A 0E6, Canada
*
Author to whom correspondence should be addressed.
ISPRS Int. J. Geo-Inf. 2018, 7(8), 306; https://0-doi-org.brum.beds.ac.uk/10.3390/ijgi7080306
Submission received: 21 June 2018
/
Revised: 23 July 2018
/
Accepted: 25 July 2018
/
Published: 31 July 2018
Abstract
:Approximately 1000 Canadian Hydrographic Service (CHS) charts cover Canada’s oceans and navigable waters. Many charts use information collected with techniques that predate the more advanced technologies available to Hydrographic Offices (HOs) today. Furthermore, gaps in survey data, particularly in the Canadian Arctic where only 6% of waters are surveyed to modern standards, are also problematic. Through a Canadian Space Agency (CSA) Government Related Initiatives Program (GRIP) project, CHS is exploring remote sensing techniques to assist with the improvement of Canadian navigational charts. Projects exploring optical/Synthetic Aperture Radar (SAR) shoreline extraction and change detection, as well as optical Satellite-Derived Bathymetry (SDB), are currently underway. This paper focuses on SDB extracted from high-resolution optical imagery, highlighting current results as well as the challenges and opportunities CHS will encounter when implementing SDB within its operational chart production process. SDB is of particular interest to CHS due to its ability to supplement depths derived from traditional hydrographic surveys. This is of great importance in shallow and/or remote Canadian waters where achieving wide-area depth coverage through traditional surveys is costly, time-consuming and a safety risk to survey operators. With an accuracy of around 1 m, SDB could be used by CHS to fill gaps in survey data and to provide valuable information in dynamic areas.
1. Introduction
The Canadian Hydrographic Service (CHS) is responsible for the production and maintenance of approximately 1000 nautical charts and other hydrographic publications. With Canada being the country with the longest coastline, significant resources are needed to ensure that Canadian navigable waters are charted appropriately and to modern standards. This challenge is at its greatest in the Arctic as the remote geography and harsh climate increase the cost of hydrographic surveys and allow only a narrow period of time each year for surveying activities. The impacts of these factors directly contribute to the sparse coverage of modern hydrographic surveys, which account for only 6% of Canadian Arctic waters. To eliminate data gaps in the Arctic and across all Canadian waters, CHS, through a Canadian Space Agency (CSA) Government Related Initiatives Program (GRIP) project, is exploring remote sensing techniques to generate accurate and reliable hydrographic data. The datasets created from remote sensing will directly contribute to the improvement in quality of CHS navigational charts. Specifically, the project leverages hybrid optical/Synthetic Aperture Radar (SAR) shoreline extraction and change detection techniques, as well as optical Satellite Derived Bathymetry (SDB) methodologies. This paper focuses on the SDB portion of the project, highlighting current results as well as the challenges and opportunities CHS will face when implementing SDB within its operational chart production process.
In order to implement SDB in an operational way, CHS is undertaking research to understand the lowest level of error which can be achieved through SDB depth estimates and the degree to which SDB can benefit CHS charts relative to traditional hydrographic techniques. CHS is focusing on empirical SDB approaches due to the organization’s substantial archive of bathymetric data, the simplicity of implementation and the robust nature of empirical approaches as described in SDB literature [1,2,3,4,5,6,7]. Here, band ratio techniques and multiple-band statistical models were analyzed. Each technique was applied to several locations within Canadian waters. Comparisons between SDB techniques as well as accuracy assessments using available bathymetric data were completed in order to identify approaches which perform best given the environmental conditions of the study areas at the time of image acquisition.
2. Study Sites and Dataset
2.1. Study Sites
To test the empirical approaches and implementation of SDB into CHS products, three sites were selected to answer questions regarding SDB implementation in the Canadian context:
- (1)
- Cambridge Bay, Victoria Island, Nunavut to assess the potential of SDB in an Arctic environment;
- (2)
- Heath Point, Anticosti Island, Quebec to understand SDB potential for updating charts in Canada’s southern waters; and
- (3)
- Havre-aux-Maisons, Magdalen Islands, Quebec to evaluate the potential application of SDB in dynamic areas containing sediment-laden waters.
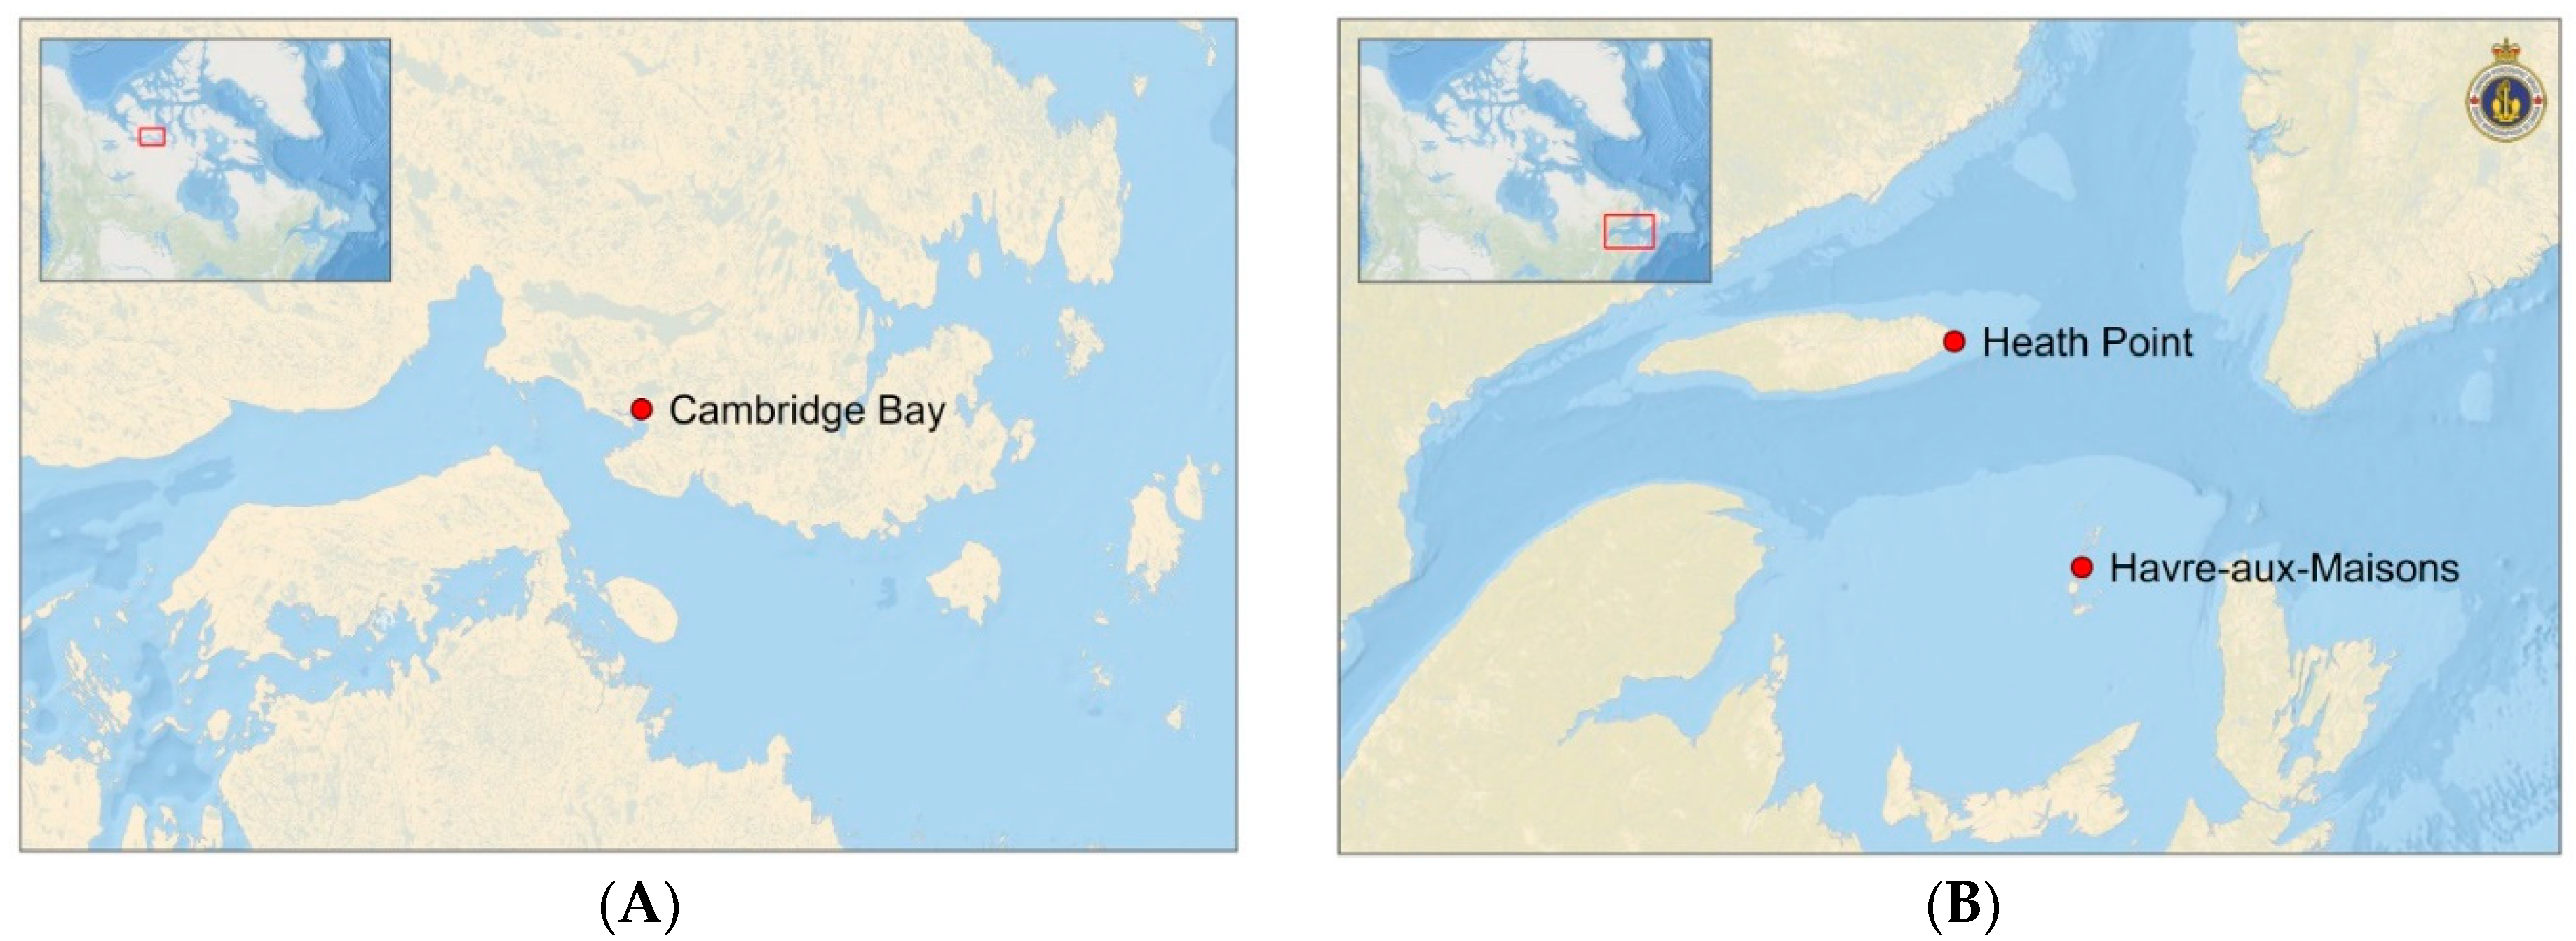
Cambridge Bay: Cambridge Bay is a hamlet situated on Victoria Island, Nunavut (Figure 1A). Water in Cambridge Bay is generally clear with a visibility of around 12 m. The bottom is composed of sand and rock interspersed with vegetation patches, making the site somewhat complex for SDB.
Heath Point: Anticosti is an island located in Gulf of Saint Lawrence, Quebec. Heath Point is located on the eastern point of the island (Figure 1B). The bottom is mainly composed of limestone which makes this site very stable in time, but the presence of some underwater vegetation creates challenges for SDB. Aside from a few locations near the shore, there is little sediment in surrounding waters, making visibility in the water column around 10 m.
Havre-aux-Maisons: The Magdalen Islands, Quebec, is a small archipelago located in the Gulf of Saint Lawrence. The study site is located between the islands of Havre-aux-Maisons and Cap-aux-Meules, near the southwest corner of the archipelago (Figure 1B). The bottom is mostly composed of sand with a few patches of underwater vegetation. The northern portion of the site contains a large area of algae, making it challenging for SDB. Visibility in the water column is less than 10 m.
2.2. Survey Data
One of the key factors for accurate application of empirical SDB approaches is to have high-quality in situ survey data for model calibration and accuracy assessment. Currently, the most accurate method to determine depth is through the use of a ship-based multibeam echosounder (herein referred to simply as multibeam). Additionally, especially in dynamic areas, the survey date must be as close as possible to the image acquisition date to ensure that sedimentation and erosion do not affect the results. The survey data should also contain water depths distributed across the desired range for SDB to improve model accuracy.
For Cambridge Bay, the best data available from CHS’s survey database were three multibeam surveys completed in 2014, 2015 and 2017. Two Light Detection and Ranging (LiDAR) surveys completed in 1985 and 1992 were also used in order to supplement minimal shallow water depth (i.e., 0–2 m) availability in the multibeam surveys. While less than ideal, the nature of Cambridge Bay’s substrate (i.e., rock) likely limited the amount of change in the seabed since the LiDAR surveys were acquired. For Heath Point, a multibeam survey completed in 2016 represented the only modern depth dataset, the only other available information being a leadline survey completed in 1892. For Havre-aux-Maisons, two multibeam surveys completed in 2015 and 2016 were available. All survey datasets were corrected for tidal influences, thereby removing the need for any additional tidal correction as the empirical SDB relationships are based on tide-corrected data. Table 1 summarizes the acquisition dates and number of measurement points available within 2 m depth ranges.
For each study site, 10% of the available survey data were randomly selected to develop empirical SDB models for each image. The remaining 90% were used to assess the accuracy of the derived SDB estimates. The only exceptions are represented by the 1892 leadline survey for Heath Point, as well as the 2015 survey for Havre-aux-Maisons, both of which were only used for independent accuracy assessments (see Section 5).
2.3. Imagery
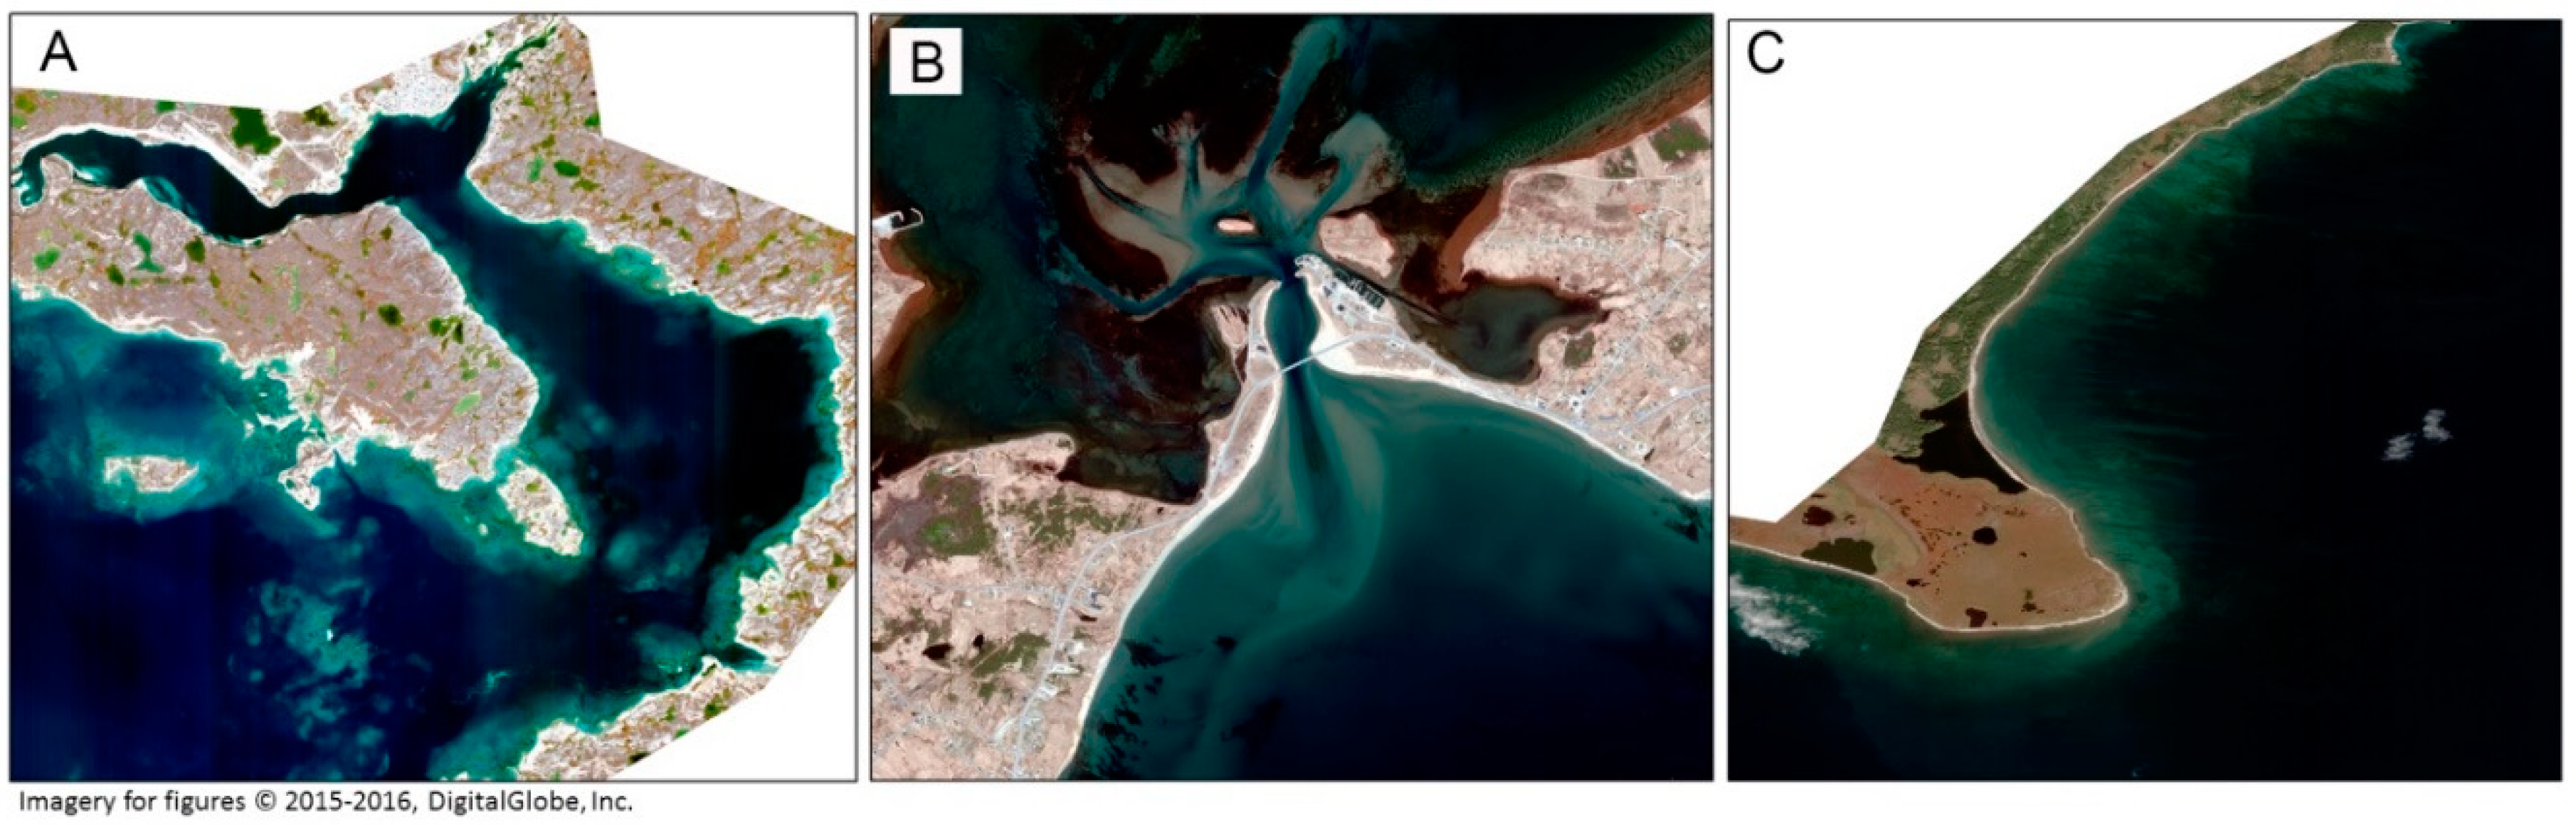
WorldView 8-band multispectral images were acquired for all study sites (Figure 2). For Cambridge Bay and Heath Point, WorldView-2 images from 26 September 2015 and 15 October 2016 were selected, while a WorldView-3 image from 29 April 2016 was selected for Havre-aux-Maisons. Table 2 provides specifications for each image. Table 3 lists the wavelength ranges for WorldView imagery.
Many factors can impact the results from SDB: sediment, waves, biomass, sun angles, image geometry, ice and clouds are all elements that are taken into consideration when selecting images for bathymetric extraction. Some factors, such as the sun angle, can be planned for with the image acquisition date and time. In order to obtain optimum light penetration through the water column, it is preferable to have a sun elevation angle that is as close as possible to nadir illumination, which at the Tropic of Cancer would be 90° on the summer solstice (21 June 12:00). For Cambridge Bay (69° N), Heath Point (49° N) and Havre-aux-Maisons (47° N), the optimum sun elevation angles are approximately 43°, 64° and 66° respectively. For the Cambridge Bay and Heath Point images, the sun elevation is only 22° and 31° respectively. These elevations are far from optimal; however, these images still offered the best overall conditions from the archive of available imagery for these locations.
In order to reduce sun reflection from the water’s surface in the direction of the sensor (i.e., sun glint), it is also preferable to have similar sun and satellite azimuth angles. When possible, opposite azimuth angles should be avoided. For the three sites, only Cambridge Bay had a sun/satellite azimuth which was not ideal. Additionally, the off-nadir angle should be as close to 0° as possible to reduce image distortion and ground sampling distance.
In some areas, compromises have to be made between different environmental conditions. In the Arctic for instance, there can be significant amounts of ice present through the end of July and into early August depending on latitude. By mid-August, the optimal sun elevation for Cambridge Bay has dropped to approximately 35°. Additionally, varying weather conditions such as clouds and wind causing shadows and waves reduce the usefulness of many images for SDB, further limiting the availability of quality data.
3. Methodology
3.1. Data Preprocessing
Geometric correction: Prior to the analysis of remotely sensed data, it is critical that all images are geometrically corrected with the highest accuracy possible. For this work, Toutin’s three-dimensional physical model [9] was used for the orthorectification of optical imagery. The physical model was applied using PCI Geomatica 2017 OrthoEngine software. Canadian Digital Elevation Model (CDEM) [10] rasters were used to provide elevation information for the orthorectification process. Each orthorectified image was compared with orthorectified RADARSAT-2 imagery in order to evaluate its positional accuracy.
Radiometric correction: High-resolution optical data were converted to Top of Atmosphere (ToA) radiance and reflectance. Digital number values were converted to ToA radiance using the absolute radiometric calibration factor and effective bandwidth values specific to the individual scene. An atmospheric correction process was attempted using the ATCOR module in PCI Geomatica 2017. However, it was found that correcting digital numbers to ground reflectance significantly reduced the accuracy of SDB estimates. This reduction in image quality after applying atmospheric correction over water reflects results presented by other studies [11,12,13]. As such, only the ToA correction was applied to each image in order to generate SDB results for this study. Further work will be required to determine if atmospheric correction can offer potential benefits for SDB in the context of CHS’s needs.
Applying a sun glint correction [14] was considered so as to reduce the noise created by the sun’s reflectance on waves. However, as the images did not display signs of disturbance by waves and initial testing did not show increased performance with the correction applied, subsequent analysis in this paper does not include glint corrected imagery. However, findings outside the scope of the present study did suggest that glint correction methodologies allow for increased SDB accuracy when images highlight noise from this effect.
3.2. Satellite-Derived Bathymetry
The underlying principle of SDB from passive multispectral imagery is fairly simple: as depth increases, the water leaving radiance () decreases until it reaches a point where contributions from bottom reflectance are no longer detectable [1,15,16,17], which is referred to as optically deep water. By using one band and several assumptions, namely that bottom reflectance and water attenuation is constant throughout the image, depth can be derived. Introducing additional bands allows for resolution of more parameters and therefore offers a more accurate assessment of depth [16]. Two main empirical models are tested in this study: first a band ratio model and second, a multi-band model. Each approach was used to develop separate empirical models for each image investigated in this work.
Band Ratio Model: The band ratio model is a method which compares band ratios with in situ data to obtain a mathematical relation between the ratio and depth [2]. Different bands of light will be absorbed to different degrees based on the water’s inherent optical properties. For example, in clear waters with low quantities of sediment, phytoplankton and dissolved organic matter, blue light will be less absorbed than green light. However, in coastal waters, where those elements are plentiful, green light will penetrate to greater depths than blue light [18]. This relationship can be leveraged to derive the depth of a pixel based on the ratio of different bands.
The exact mathematical representation of the depth-to-ratio relationship is identified empirically through the use of in situ depth measurements for each image. One of the most popular band ratios for SDB is the natural logarithm of the blue band to the natural logarithm of the green band (/) [16]. This is understandable as these bands can penetrate deeper than other colors (red for example) under most conditions. They are available with most sensors including Landsat (the blue band was introduced on Landsat 4), which represents one of the largest sources of free medium resolution imagery with archives spanning over 45 years. In addition to /, other band ratios are investigated using the WorldView imagery, namely with the coastal and yellow bands.
Multi-Band Model: The multi-band model [1] uses the same principles as the band ratio model in a slightly different manner. This method first identifies values of optically deep waters (). The assumption is that any pixels containing values above have contributions from the reflectance of the underwater surface which is exponentially attenuated by the water column. Therefore, constants can be empirically determined to link the log-corrected difference between and of multiple bands to the depth as shown in Equation (1):
where is depth, indicates band-specific parameters and are the empirically determined constants [1]. The multi-band model assumes that each band contains a linear relationship with water depth. To determine which bands were best to incorporate into the model for each study site, scatter plots of band values relative to survey depths were generated, allowing the degree of linearity of the relationship to be evaluated. For Cambridge Bay and Heath Point, the blue, green, red and yellow bands were found to contain a linear relationship with survey depth. For Havre-aux-Maisons, these bands were also used, in addition to the coastal band.
3.3. Survey Data Selection
As the band ratio and multi-band SDB approaches rely on the penetration of visible light to the seabed, it is critical to ensure that only survey depths which correspond with image pixels representing visible seabed features are used to develop and assess the accuracy of the SDB models. In this study, this was achieved by applying an object-based supervised classification approach to identify pixels where the seabed is clearly visible. This approach also has the advantage of allowing dark seabed features (e.g., vegetation and algae patches) to be removed. As SDB depths for these areas would be much deeper than the actual water depth (due to the dark colour), it is more appropriate to remove them from the analysis. Note that the number of measurement points for each survey listed in Table 1 reflects the quantity of points selected from the supervised classification areas.
3.4. Accuracy Assessment
The ability of the empirical SDB techniques for representing water depth at each study site was assessed by calculating differences between CHS survey depths and SDB estimated water depth (i.e., survey depth minus SDB depth). Root Mean Square Error (RMSE) statistics were then derived from these differences for the overall accuracy assessment dataset for each site, as well as for specific depth ranges (e.g., 0–2 m, 2–4 m, etc.). This approach allows for a better understanding of which depths the SDB models are able to estimate well, as well as those depths which contribute more to the model’s uncertainty.
Overall 90% confidence levels were then calculated for the techniques which produced the best RMSE statistics for each site, allowing for an understanding of the level at which 90% of SDB errors relative to survey data can be expected to occur (an important consideration for mapping applications). For SDB, CHS aims to have 90% of errors within 1 m of available survey data.
4. Results
Table 4 presents an accuracy assessment for each site for several band ratio models, as well as for the multi-band approach. Accuracies are calculated using 90% of available survey data at each site, as noted in Table 1. For some sites, SDB estimates can only be produced for depths of <10 m, due to limitations in available depths for survey points present over visible areas of the seabed. The ability of each model to estimate depths can be identified from these results.
4.1. Band Ratio Model
For the band ratio model, in shallow waters (0–4 m), the natural logarithm of the blue band to the natural logarithm of the yellow band (/) provided the greatest accuracy. For deeper water (>6 m), / generated a more accurate estimate of bathymetry. There were no advantages noticed with the natural logarithm of the coastal band to the natural logarithm of the green band (/).
Based on these results, the choice of the best band ratio to use appears to depend strongly on the characteristics of the study site. As noted above, sites containing shallow water (0–4 m) may perform better with /, while locations containing deeper water may achieve better results using /. Other factors such as turbidity will also affect the choice of the band ratio. Selection of an appropriate ratio can thus best be achieved by comparing the results of multiple ratios.
4.2. Multi-Band Model
For the comparison of the different empirical approaches, the multi-band model generally provided better results than the band ratio technique for all study sites. This could be explained by the use of more than two bands for SDB model development. The advantage of the yellow and red bands for shallow waters and blue and green bands for deeper waters are captured in this approach, improving overall model accuracy.
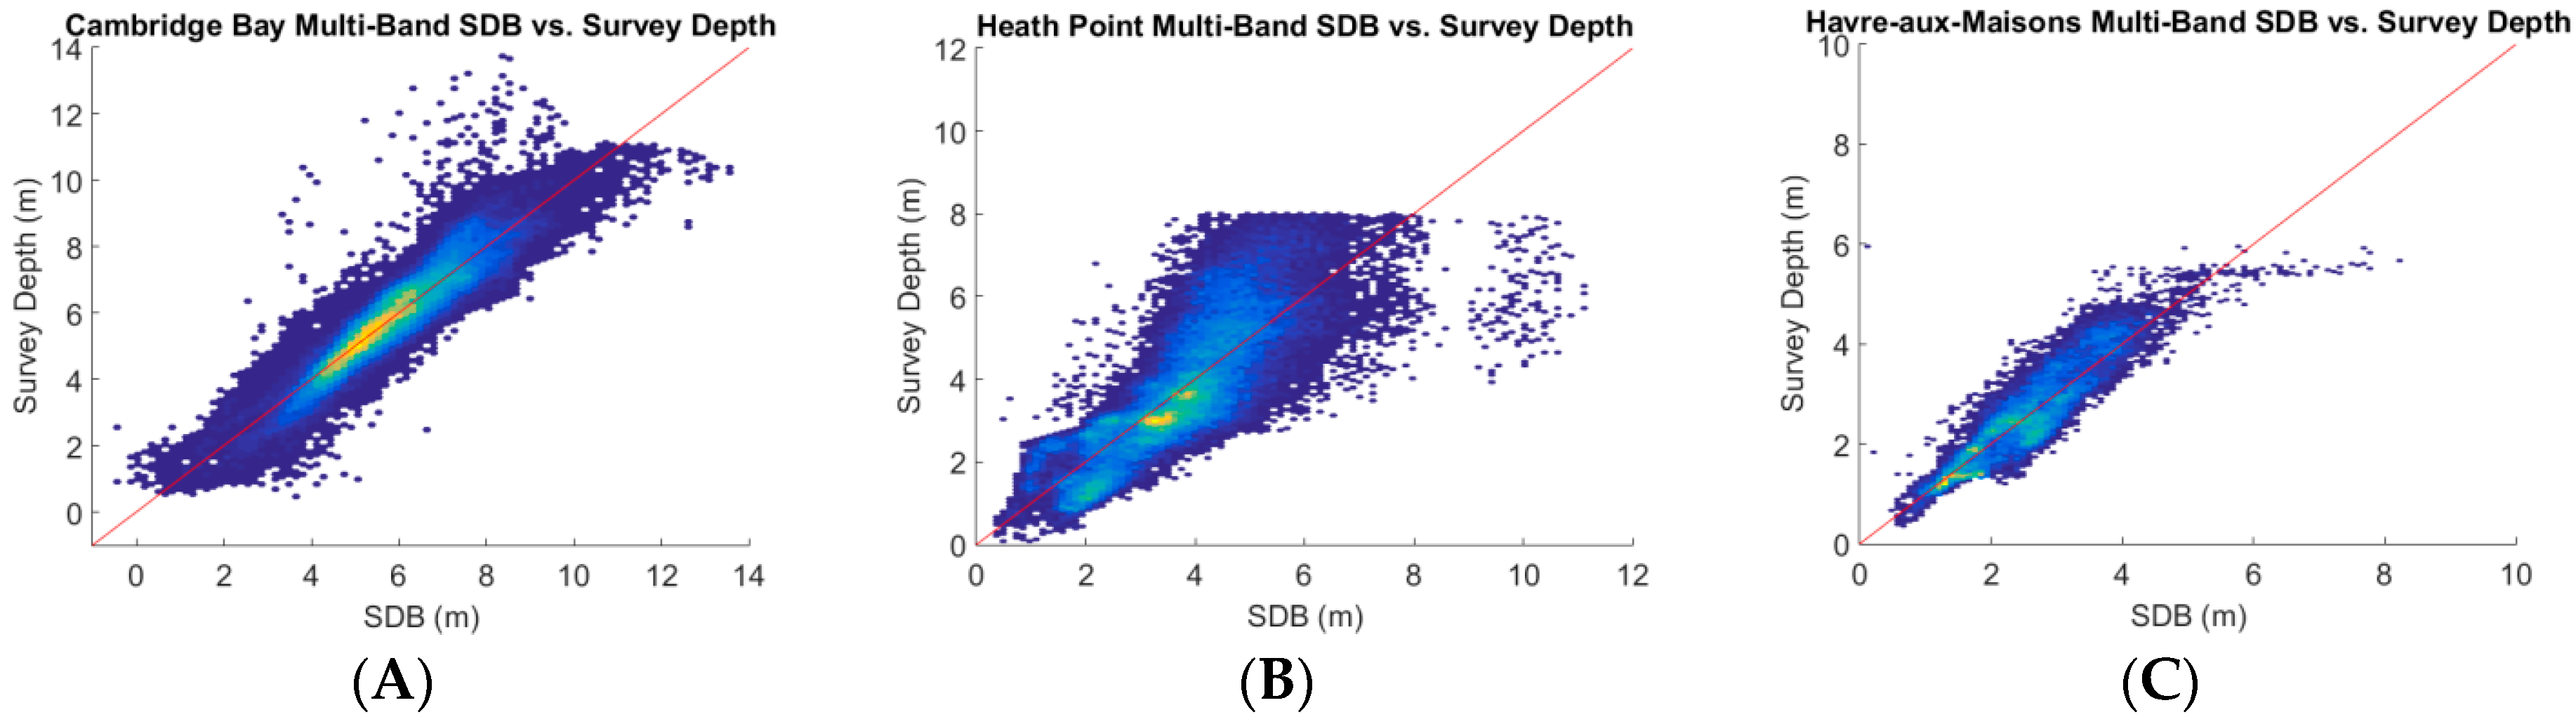
Due to the multi-band technique providing the greatest overall accuracy for each study site, the overall 90% confidence level was determined for these results (Table 5). The confidence level results show that the multi-band approach achieved CHS’s goal of a 1 m 90% confidence level for two of the three study sites. Scatterplots were also produced for the multi-band results in order to highlight trends between the survey and SDB depths for each site (Figure 3). As described in Table 4, agreement is generally better for shallow depths.
4.3. Band Ratio Combination
The success of the multi-band approach suggests an option for improving the band ratio technique. Through the combination of multiple ratios, the improved performance of certain ratios for specific depths (e.g., / for shallow depths combined with / for deeper depths) can be leveraged. To illustrate the potential of combining multiple band ratios, a test was completed for the Cambridge Bay site. In this test, an SDB model for water depths of 0–4 m was created using /. For water depths >4 m, a separate model was calculated using /. With an overall RMSE of 0.65 m (Table 6), the results of this test are very close to those for the multi-band approach (0.56 m), suggesting that if a band ratio approach is used it may be preferable to take advantage of combinations of different band ratios.
4.4. Water Depth vs. Accuracy
For all results, there is a correlation between water depths and accuracy, with accuracy tending to decrease as depth increases. Accuracies within the first 4 m are also generally lower than the accuracy of mid-range depths (i.e., 4 to 6 m), potentially a result of fewer survey points being present within these shallower depths for model development. As CHS aims to maintain an accuracy of ~1 m for SDB relative to survey data, these results show that while SDB estimates may be possible for depths >10 m, they may not be sufficiently reliable for inclusion on CHS charts for the examined study sites.
5. Discussion
Results from the three study sites showed that all of the examined SDB approaches are capable of estimating depth within an error range of ~0.5 to 1 m relative to traditional hydrographic survey data for depths up to 10 m. Comparisons of depth estimates between techniques also showed good similarities between the approaches, with average differences typically <1 m . While further work is required, the current results have reinforced the potential of empirical SDB for supplementing traditional chart data sources within operational CHS chart production activities. This discussion explores the SDB results in further detail, describes potential applications of SDB within the CHS context and also explores limitations of the results.
5.1. Independent Accuracy Assessment
As indicated in Section 2, accuracy assessment results were obtained using 90% of available survey data at each site. While random selections were performed to obtain training and accuracy assessment data, selecting this information from the same surveys could result in some bias within the accuracy assessment results. To further evaluate the appropriateness of the SDB estimates, an independent accuracy assessment was completed for the Havre-aux-Maisons multi-band SDB model using the 2015 survey (Table 7). Comparing the independent accuracy assessment results with the initial results presented in Table 4, it is clear that the accuracies are very similar. This indicates that limited bias is introduced when using subsets of the same survey for training and validation, providing a higher level of confidence in the SDB data that will be used to update CHS charts.
5.2. SDB Potential for Dynamic Areas Monitoring
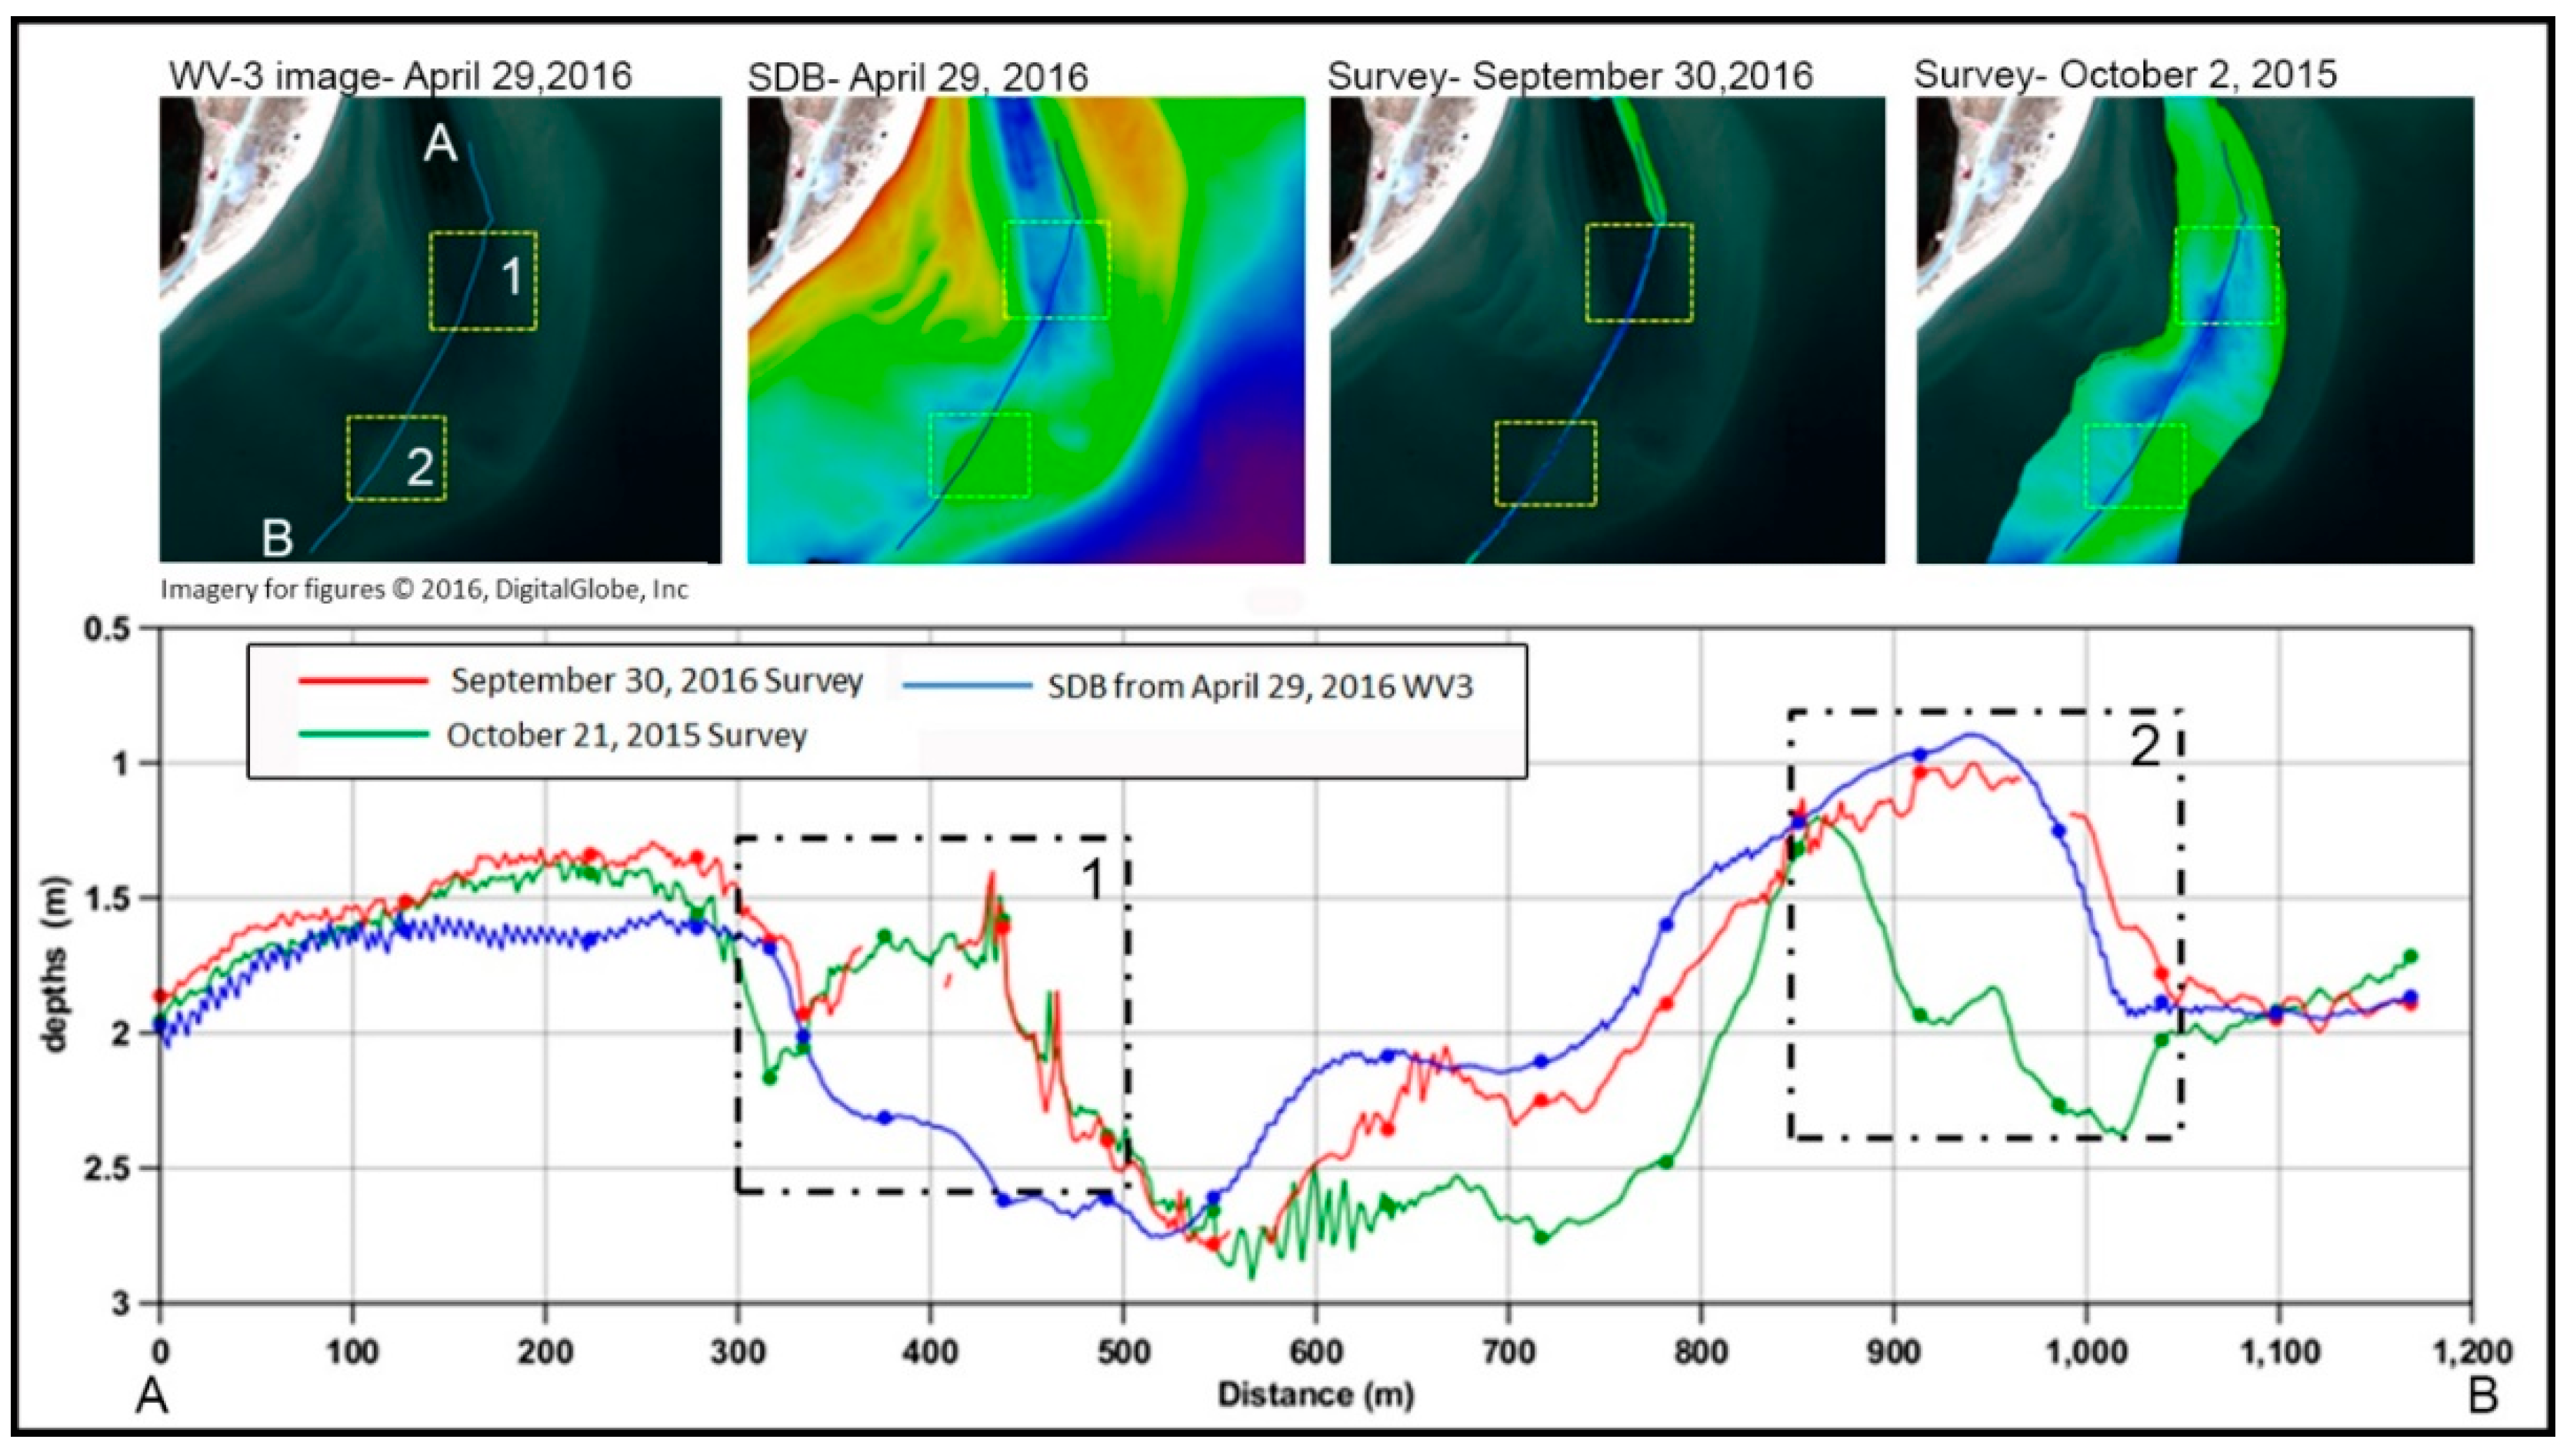
Results achieved for Havre-aux-Maisons demonstrated that in dynamic areas, SDB can be more reliable than recent survey information. Depths extracted over the transect line (blue line, A to B) in Figure 4 demonstrate that the 2016 SDB results are closer to the 2016 multibeam survey than the 2016 and 2015 multibeam surveys are to each other. The largest errors in the SDB results are located in zone 1, but the differences are within CHS’s 1 m tolerance threshold for SDB. Near the 600 m point of the transect, there is a clear indication of the changes which occurred from 2015 to 2016, especially in zone 2. These changes suggest that the 2015 survey is no longer reliable in this area. These results suggest another useful application of SDB for dynamic area monitoring and change detection. This approach could help determine if new survey information is required by highlighting locations of change for potential re-surveying. Such an approach would minimize the required geographic coverage of surveys, thus reducing survey costs. It would also support immediate improvements to safety to navigation as areas of change could be described to mariners well in advance of the completion of new surveys.
5.3. SDB Extrapolation
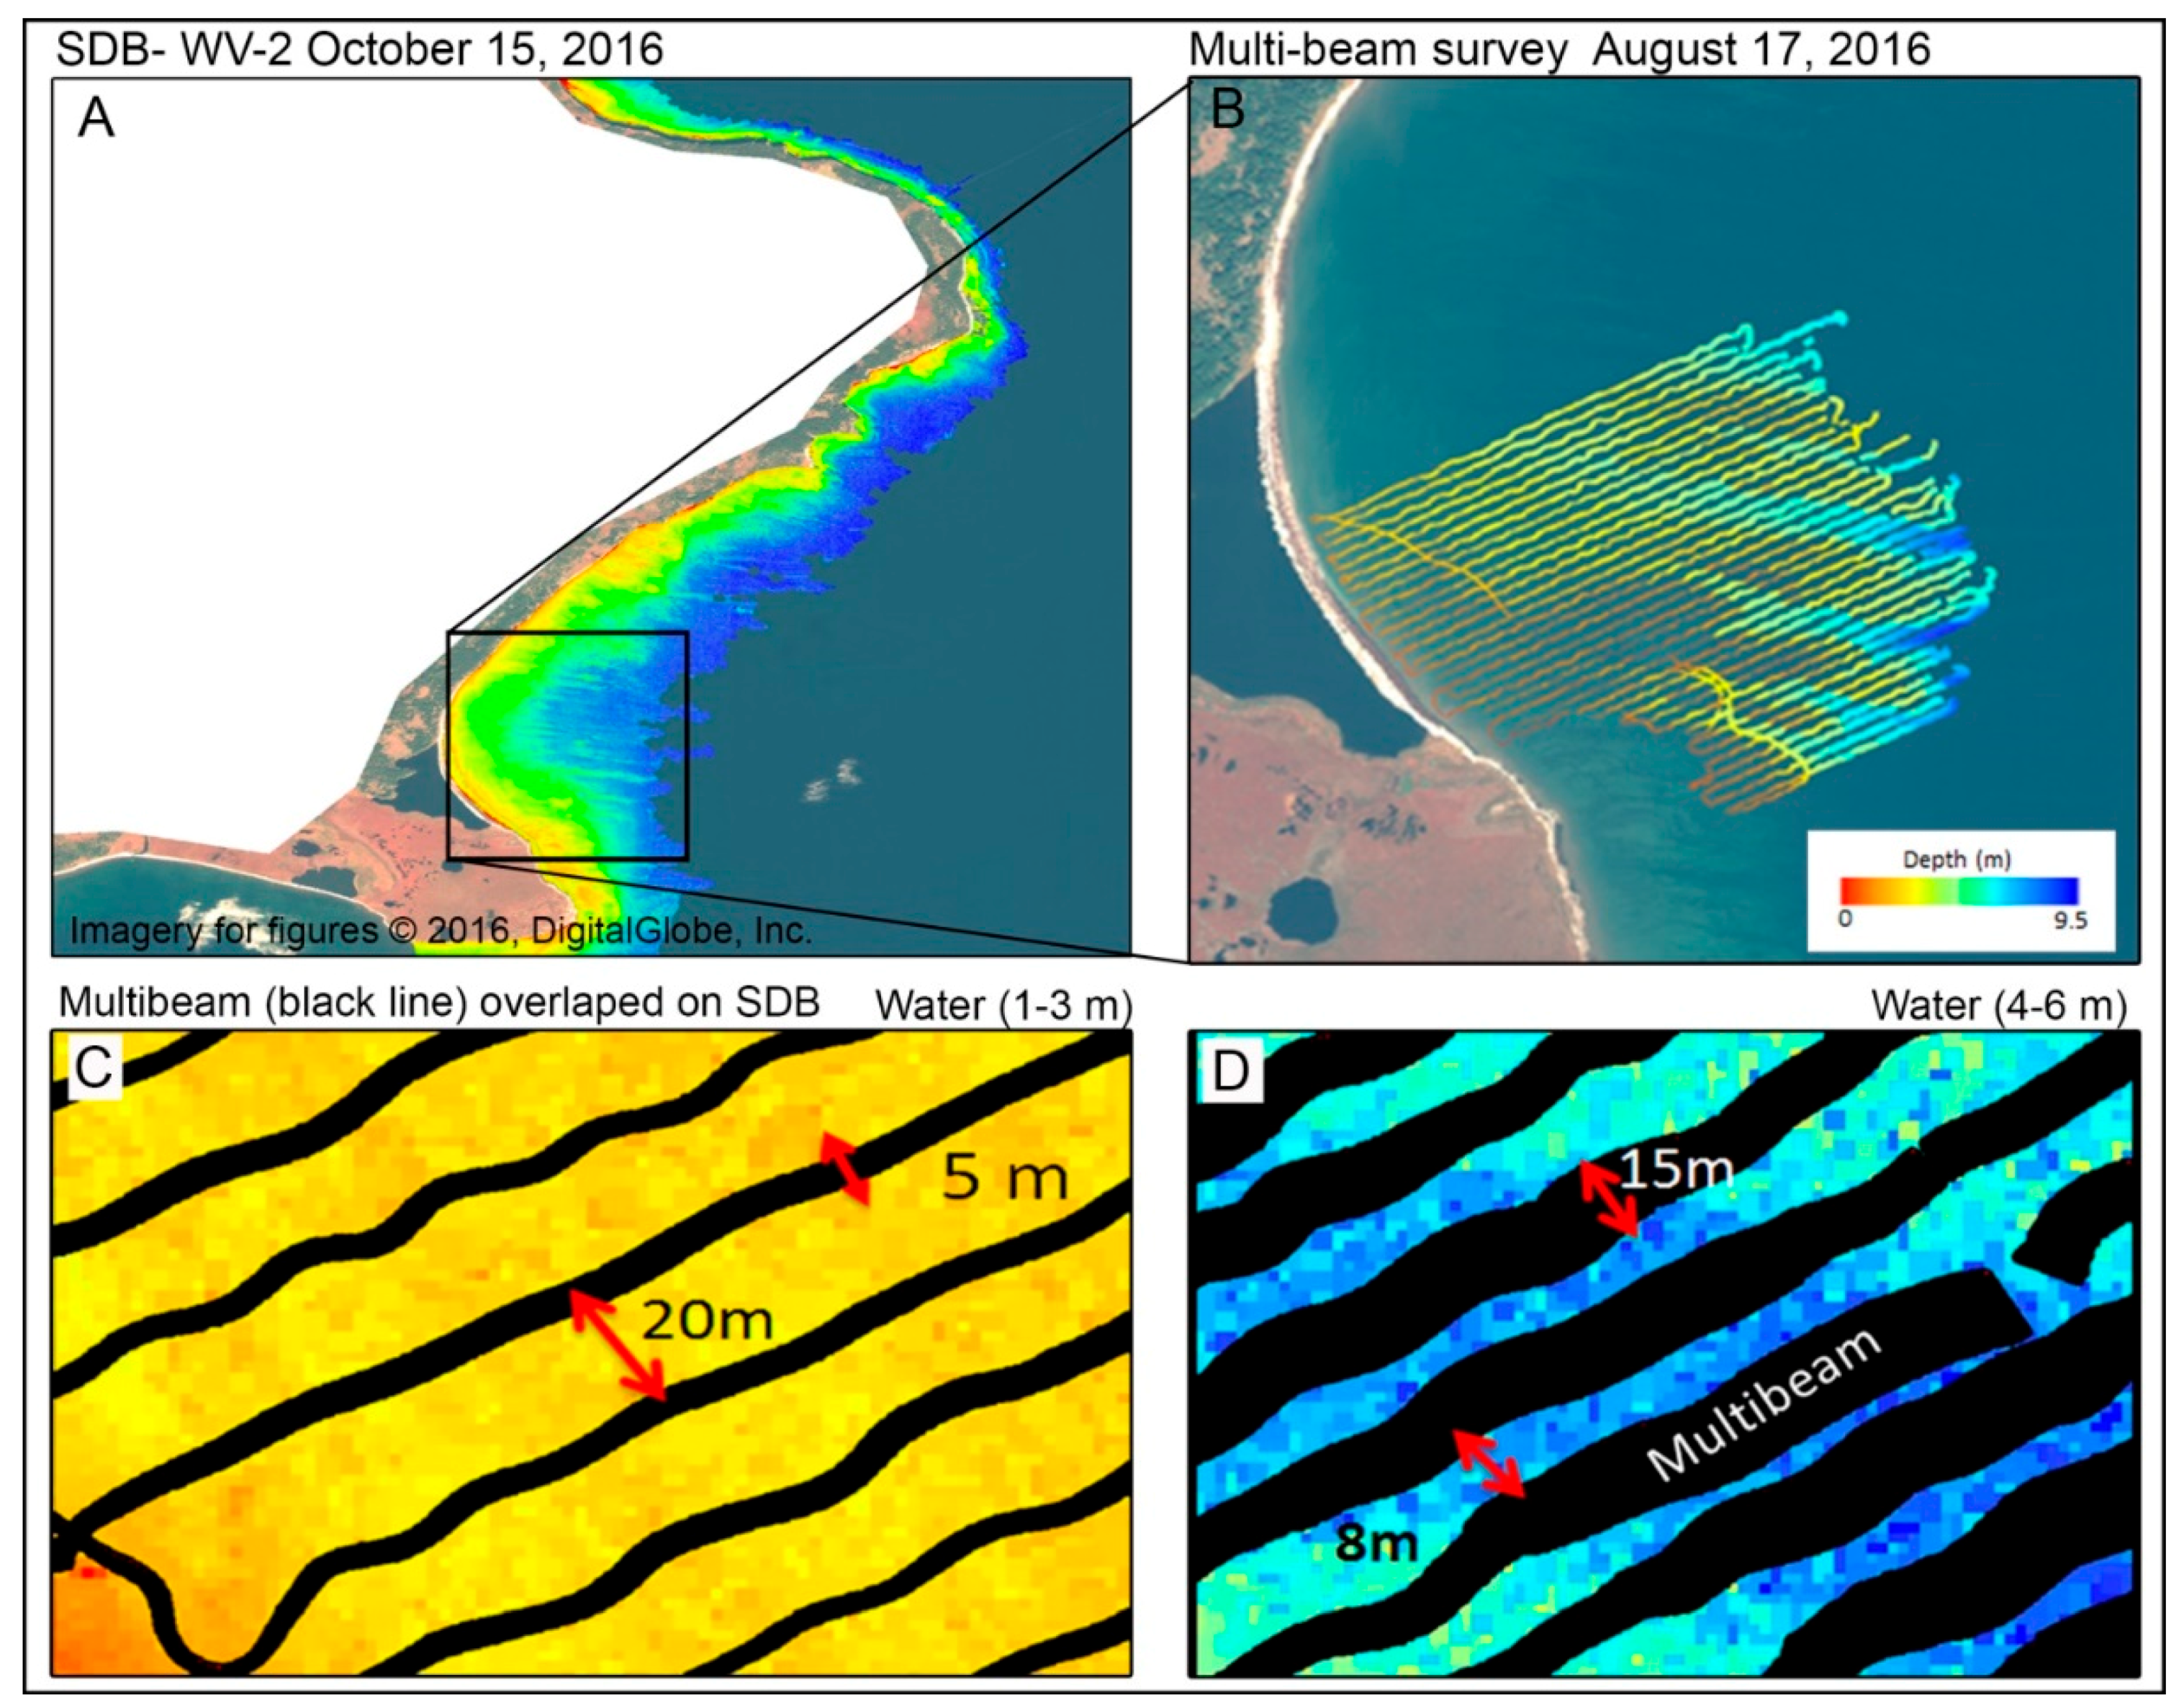
As satellite imagery generally covers a larger area than that captured by CHS multibeam and LiDAR surveys, SDB can be used to extrapolate a small survey zone to a wider area, if the water and environmental conditions are constant. Using the multibeam survey for the Heath Point site (~1 km2), SDB was extracted over an area 7 times that of the original survey. Figure 5A,B compares the coverage of the SDB results with the multibeam survey for Heath Point.
Another use of SDB extrapolation for CHS could be to fill gaps in survey data. Achieving full bottom coverage with shallow water multibeam systems can be time-consuming as the swath coverage is about three times the water depth. This requires ship tracks to be positioned very close together to allow for overlap between passes. Figure 5C,D shows the width of the multibeam data (black line) overlapped with the full coverage of SDB for two ranges of water depth: 1–3 m (Figure 5C) and 4–6 m (Figure 5D) for Heath Point. With water depths of 1–3 m, the swath of the multibeam survey covers ~5 m, creating gaps between survey lines of ~20 m. In waters of 4–6 m, the multibeam swath covers ~15 m with gaps between survey lines of ~8 m. These figures clearly illustrate the potential of SDB for reducing shallow water gaps within CHS survey data, an application which can reduce costs (through minimization of survey coverage) and improve safety to navigation (potential feature identification in gap regions).
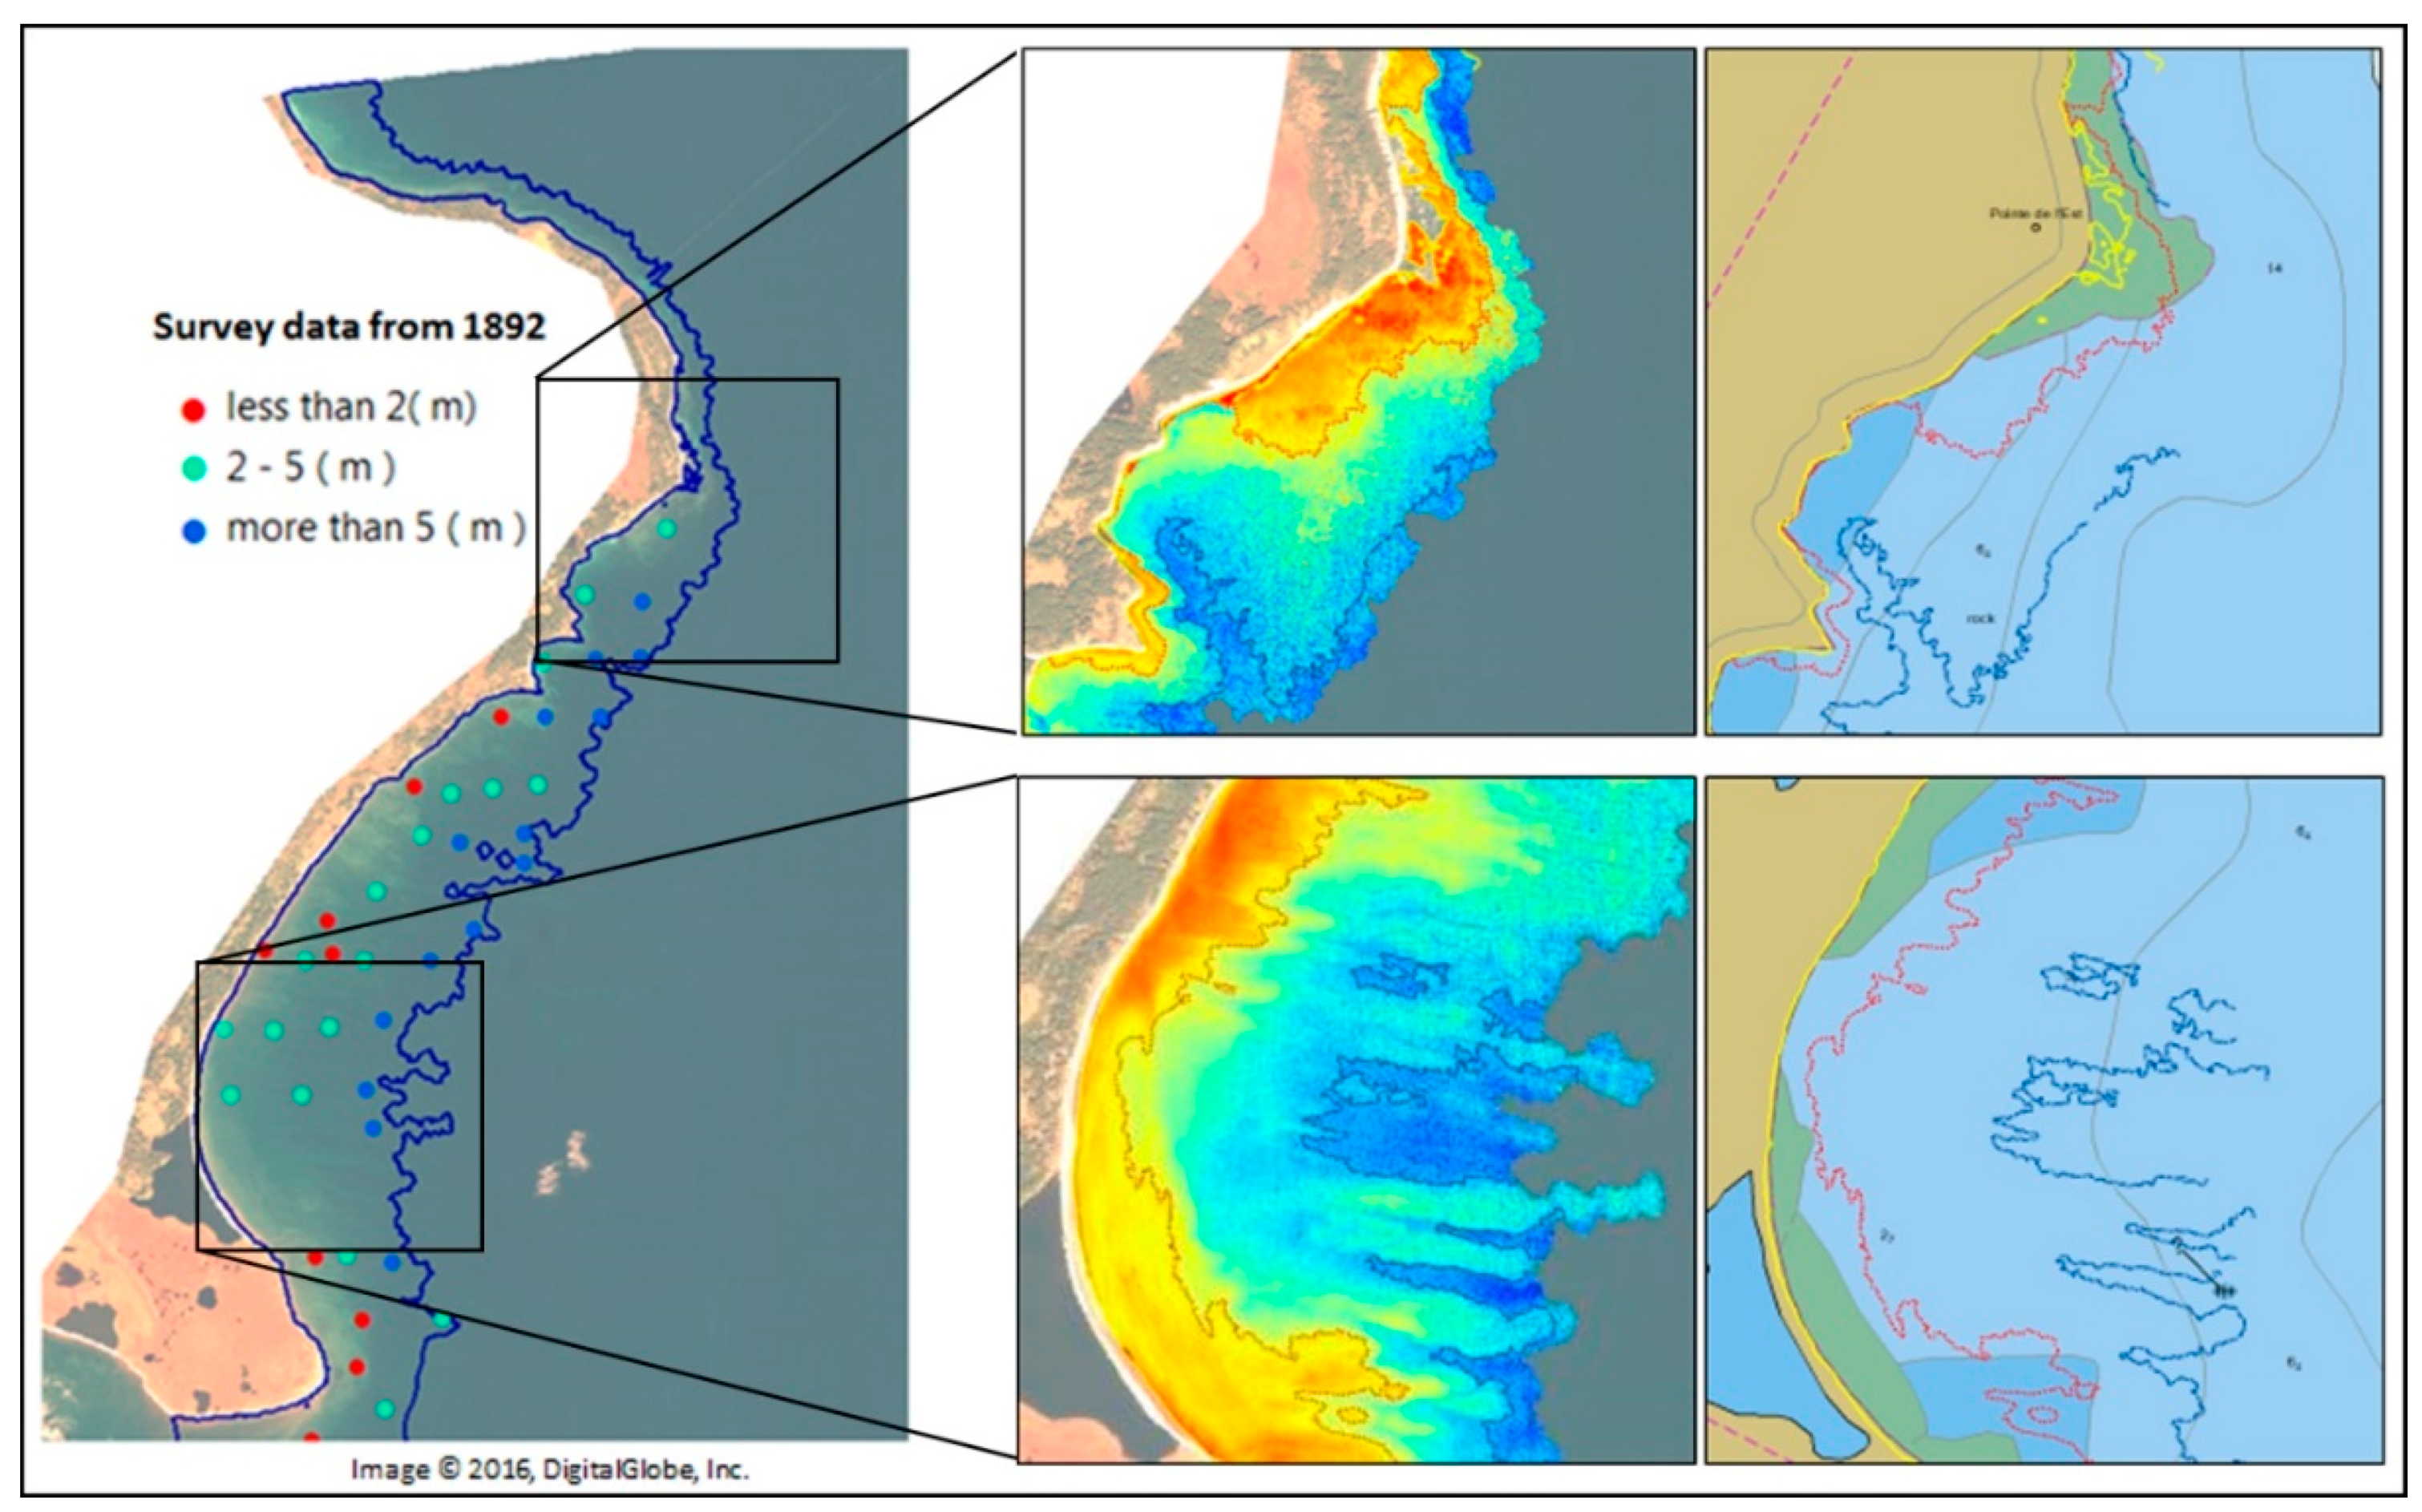
A further example of the potential for SDB extrapolation is presented by the 1892 leadline survey for Heath Point. Prior to the acquisition of the multibeam survey in 2016, this leadline survey provided the only source of bathymetry for the CHS chart covering this area. This is demonstrated through isobaths contained within the CHS Electronic Navigational Chart (ENC) for this site. Figure 6 compares the ENC isobaths with the SDB result, as well as with isobaths derived from the SDB information. The smooth, generalized ENC isobaths result from the minimal information content within the leadline survey. In comparison, the SDB dataset provides more extensive and precise information allowing for a better understanding of the nature of depth within this region. A small accuracy assessment of the SDB result completed using the leadline survey (Table 8) indicates general good agreement between the datasets, even 100 years after the acquisition of the leadline data. These results suggest a potential opportunity for improving CHS charts trough SDB in other areas where only historical bathymetry is available, until such time as modern survey data can be acquired.
5.4. International Standard Compatibility
The appropriateness of CHS LiDAR and ship-based surveys for specific charting applications are determined using the International Hydrographic Organization (IHO) S-57 standard [19]. This standard defines CATegory of Zone of Confidence (CATZOC) levels which contain depth accuracy specifications for specific depth ranges. Table 9 presents a summary of the accuracy requirements for each CATZOC level for depths up to 30 m.
To be incorporated into CHS navigational products, SDB estimates will need to be assigned a CATZOC level. Comparison of the CATZOC definitions with SDB results derived for each study site shows that all SDB estimates meet the CATZOC C level, with some meeting A2 and B requirements. These results suggest that CHS can safely apply a CATZOC C classification to SDB results for incorporation into the organization’s products. However, as SDB is strongly dependent on local environmental conditions and image acquisition characteristics (refer to Section 2.3), further investigation will be required at additional study sites using other satellite data in order to formulate appropriate SDB methodologies for incorporation into CHS’s operating procedures. The SDB results presented here, along with the analysis of CATZOC compatibility, recently led to the publication of a new edition of CHS’s navigational chart for Havre-aux-Maisons (chart 4955). This represents the first inclusion of bathymetry extracted from satellite data as source information within a Canadian navigational chart and further highlights the potential of SDB to support IHO level navigational products.
Additional consultation amongst Hydrographic Offices (HOs) is also required at the international level as SDB is not widely incorporated into IHO standards. Currently, the IHO S-4 standard (specification B424.7) recognizes the use of satellite imagery for representing isobaths (e.g., drying line, 5 or 10 m) when little or unreliable survey data exists within a geographical area [20]. While this represents an excellent beginning for incorporating SDB into navigational products internationally, further agreement amongst IHO members will be required for regular application of SDB information within navigational products.
5.6. Limitations
While the results shown in this paper illustrate the potential of empirical SDB approaches for estimating water depth in Canadian waters, some important limitations are apparent which will impact CHS’s ability to fully utilize the capabilities of SDB for charting purposes.
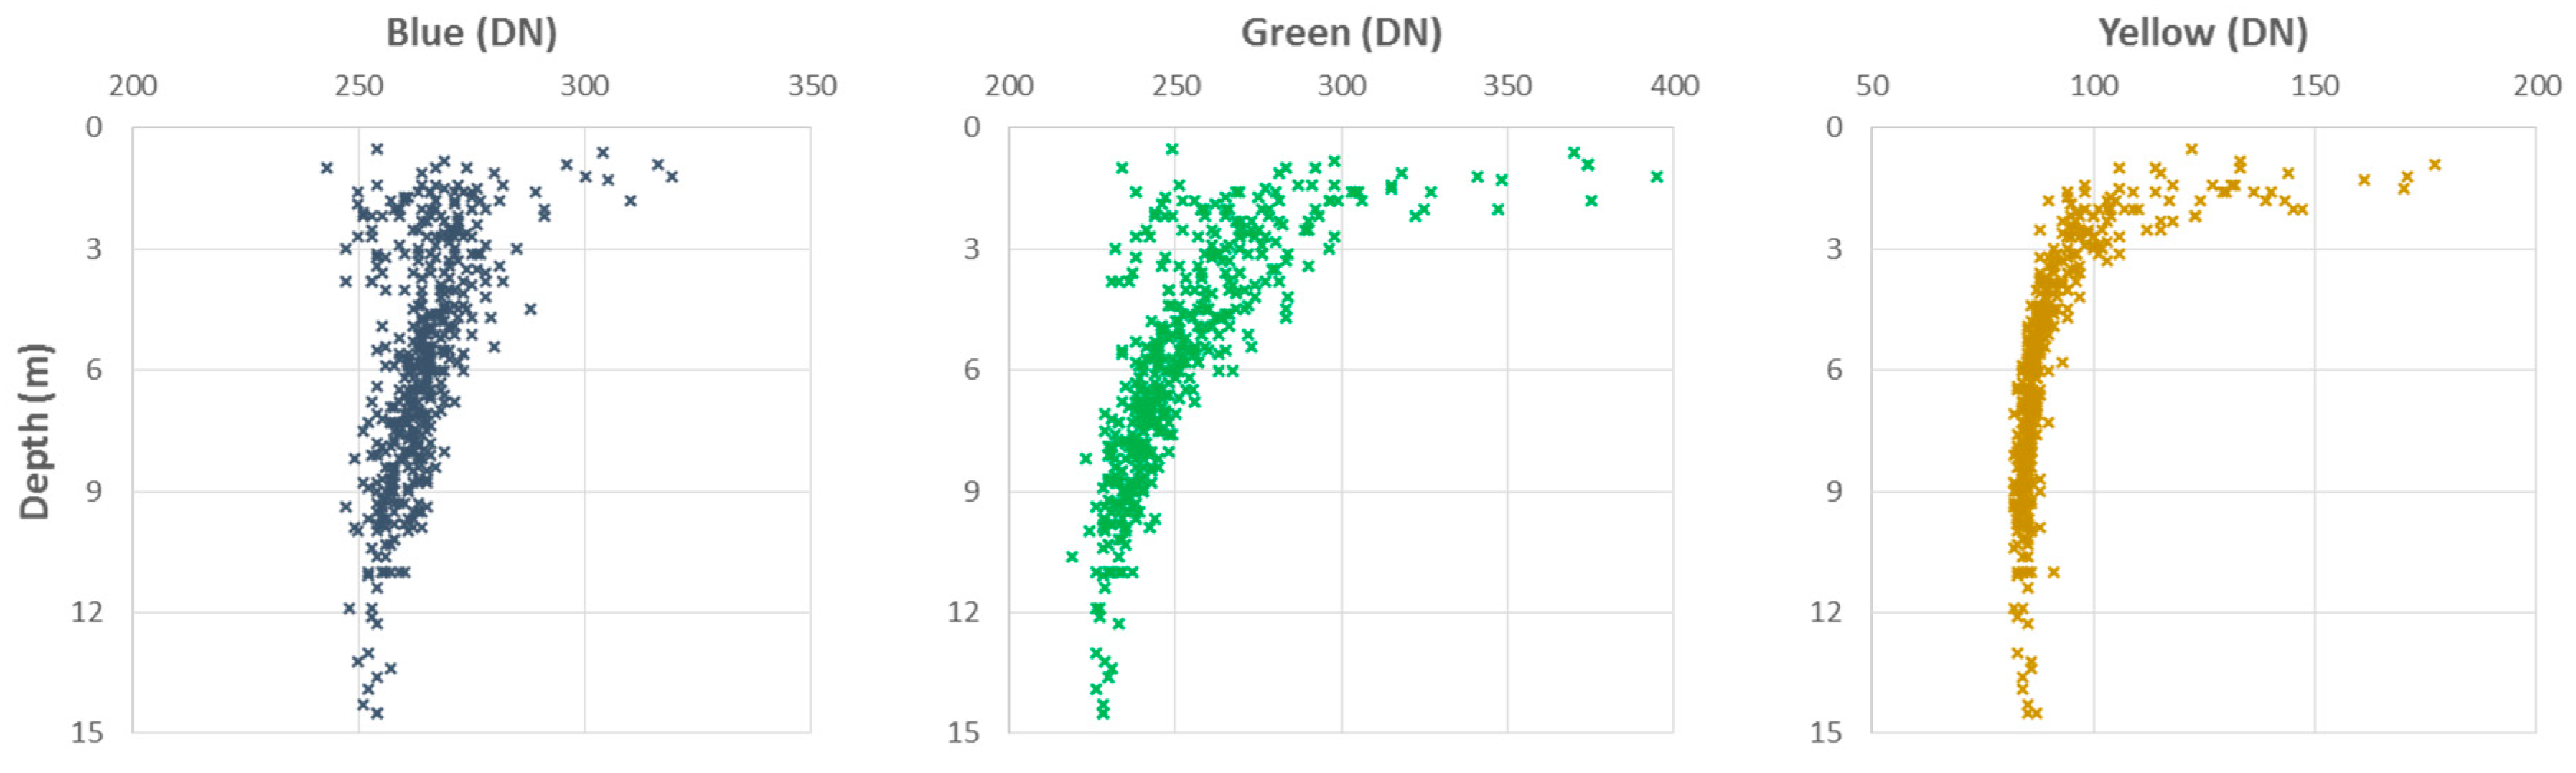
Depth and Survey Limitations: As noted in Table 4, RMSE values increased substantially for water depths >10 m for the Cambridge Bay site. It is expected that the model’s accuracy will decrease as it gets closer to optically deep waters. Considering the poor illumination conditions present at this northern location, the extinction depth is achieved around 12 m (Figure 7). Thus, it is not surprising that depths extracted via SDB beyond 12 m are less reliable. This may limit the capability of SDB for representing greater depths in northern Canadian waters. However, as shallow waters present a greater risk to navigation, the potentially limited ability of SDB to estimate greater depths in Canadian waters is less of a concern for CHS.
Another potential limitation of various areas within Canada is limited survey availability, which may reduce the accuracy of SDB for specific depths to a point where they cannot accurately be used. The age of some surveys is also a concern as older data may not accurately reflect temporal environmental changes. While this is a concern, CHS must balance the goal of obtaining accurate information with gaining some understanding of depth in areas where no other information may be present, a topic for further discussion and research.
Model Transfer: As empirical SDB techniques must be generated on an image-by-image basis, it is not possible to apply previously generated models to different sensors, locations or acquisitions obtained over the same location at a different time. This is of particular concern for situations where multiple images are required to allow for SDB estimates to be created for large geographic areas. Further research is required by CHS to better understand this limitation and the impacts it will present for operational implementation of empirical SDB techniques.
6. Conclusions
With more than 7 million km2 of water, with close to 4 million km2 located in the Arctic, surveying Canadian waters to modern standards remains a challenging task for CHS. With recent investments under the World-Class Tanker Safety System Initiative (WCTSS) and the Canadian Oceans Protection Plan (OPP), CHS has accelerated the acquisition of hydrographic survey data (multibeam and LiDAR) in critical navigational areas. Under these initiatives, CHS is also investing in the acquisition of remote sensing data to help reduce gaps in areas where CHS does not have adequate survey information. This imagery will also be used in support of shoreline extraction, survey planning and the evaluation of coastal changes (locations and rates). As such, understanding the potential of remote sensing for contributing to improved nautical products is critical for CHS to ensure that its WCTSS and OPP investments have the greatest possible impact.
In this study, CHS has investigated the potential of empirical band ratio and multi-band SDB techniques for estimating water depth in Canadian waters as part of a CSA GRIP project. Results obtained for the Cambridge Bay, Heath Point and Havre-aux-Maisons study sites have shown the following:
- SDB estimates can be obtained with overall RMSEs of ~1 m for band ratio and multi-band techniques, allowing SDB to meet the IHO CATZOC C survey classification.
- The multi-band approach generally exceeds the performance of band ratio technique, but either approach can be used to generate reasonable estimates of water depth.
- Results for Havre-aux-Maisons demonstrate the potential of SDB for dynamic area monitoring, with SDB estimates out-performing a year-old multibeam survey.
- Extrapolation of SDB information shows excellent potential for increasing the value of CHS surveys containing limited geographic coverage and for removing gaps between multibeam survey tracks, particularly in shallow waters.
These findings present CHS with an exciting opportunity to supplement its LiDAR and ship-based surveying techniques with SDB information, leading to many potential new and improved applications for the organization, such as:
- Identifying risks to navigation in shallow waters prior to the deployment of in situ surveying operations to reduce the risk of grounding and to target areas for survey collection.
- Acting as the main source of bathymetric data in very shallow waters (0–6 m), where risks to navigation and survey cost are highest.
- Monitoring changes in dynamic areas to support timing of survey planning activities.
- Providing up-to-date depth information to mariners, particularly in dynamic regions, to support safe navigation between in situ surveying activities.
Even if less accurate than multibeam surveys, the results presented in this study show that SDB can provide valuable information to help ensure safe navigation in Canadian waters. Under research projects like the CSA-supported GRIP project, CHS is accelerating the integration of remote sensing into hydrographic applications, helping it meet its current OPP obligations and positioning it to improve the delivery of its mandate in the future. Through further work in Canada and amongst international hydrographic partners, the potential for SDB to benefit HOs worldwide is substantial.
Author Contributions
Conceptualization, Supervision, Project Administration and Funding Acquisition, R.C.; Methodology, Formal Analysis, Writing—Original Draft Preparation, Writing—Review & Editing and Visualization, R.C., M.-A.F. and R.A.; Investigation and Validation, M.-A.F. and R.A.
Funding
CHS received support through the Canadian Space Agency’s Government Related Initiatives Program to complete this work.
Acknowledgments
The authors would like to thank Xianfeng Jiao for processing the data and Loretta Abado, Mesha Sagram and Adam Jirovec for reviewing the document. The authors would also like to extend sincere thanks to the Canadian Space Agency for their continued support, without which this work would not have been possible.
Conflicts of Interest
The authors declare no conflict of interest.
References
- Lyzenga, D.R. Shallow-water Bathymetry using combined LiDAR and Passive Multispectral Scanner Data. Int. J. Remote Sens. 1985, 6, 115–125. [Google Scholar] [CrossRef]
- Stumpf, R.P.; Holderied, K.; Sinclair, M. Determination of Water Depth with High-Resolution Imagery over Variable Bottom Types. Limnol. Oceanogr. 2003, 48, 547–556. [Google Scholar] [CrossRef]
- Mishra, D.; Narumalani, S.; Lawson, M.; Rundquist, D. Bathymetric Mapping using IKONOS Multispectral Data. GISci. Remote Sens. 2004, 41, 301–321. [Google Scholar] [CrossRef]
- Pe’eri, S.; Azuike, C.; Parrish, C. Satellite-Derived Bathymetry: A Reconnaissance Tool for Hydrography. Hydro Int. 2003, 17, 16–19. [Google Scholar]
- Su, H.; Liu, H.; Heyman, W.D. Automated Derivation of Bathymetric Information from Multi-Spectral Satellite Imagery using a Non-Linear Inversion Model. Mar. Geodesy 2008, 31, 281–298. [Google Scholar] [CrossRef]
- Lyons, M.; Phinn, S.; Roelfsema, C. Integrating Quickbird Multi-Spectral Satellite and Field Data: Mapping Bathymetry, Seagrass Cover, Seagrass Species and Change in Moreton Bay, Australia in 2004 and 2007. Remote Sens. 2011, 3, 42–64. [Google Scholar] [CrossRef] [Green Version]
- Hamylton, S.M.; Hedley, J.D.; Beaman, R.J. Derivation of High-Resolution Bathymetry from Multispectral Satellite Imagery: A Comparison of Empirical and Optimization Methods through Geographical Error Analysis. Remote Sens. 2015, 7, 16257–16273. [Google Scholar] [CrossRef]
- DigitalGlobe. Standard Imagery Data Sheet. 2017. Available online: https://dg-cms-uploads-production.s3.amazonaws.com/uploads/document/file/21/Standard_Imagery_DS_10-7-16.pdf (accessed on 5 June 2018).
- Toutin, T. Three-Dimensional Geometric Correction of Earth Observation Satellite Data. In Advances in Environmental Remote Sensing: Sensors, Algorithms, and Applications; Weng, Q., Ed.; CRC Press: Boca Raton, FL, USA, 2011; pp. 177–222. ISBN 9781138072916. [Google Scholar]
- Natural Resources Canada. GeoBase Canadian Digital Elevation Model Technical Specifications. 2014. Available online: http://ftp.geogratis.gc.ca/pub/nrcan_rncan/elevation/cdem_mnec/doc/CDEM_en.pdf (accessed on 5 June 2018).
- Kallio, K.; Attila, J.; Härmä, P.; Sampsa, K.; Pulliainen, J.; Hyytiäinen, U.; Pyhälahti, T. Landsat ETM+ Images in the Estimation of Seasonal Lake Water Quality in Boreal River Basins. Environ. Manag. 2008, 42, 511–522. [Google Scholar] [CrossRef] [PubMed]
- Kutser, T. The Possibility of using the Landsat Image Archive for Monitoring Long Time Trends in Coloured Dissolved Organic Matter Concentration in Lake Waters. Remote Sens. Environ. 2012, 123, 334–338. [Google Scholar] [CrossRef]
- Monteys, M.; Harris, P.; Caloca, S.; Cahalane, C. Spatial Prediction of Coastal Bathymetry based on Multispectral Satellite Imagery and Multibeam Data. Remote Sens. 2015, 7, 13782–13806. [Google Scholar] [CrossRef]
- Hedley, J.D.; Harborne, A.R.; Mumby, P.J. Simple and Robust Removal of Sun Glint for Mapping Shallow-Water. Int. J. Remote Sens. 2005, 26, 2107–2112. [Google Scholar] [CrossRef]
- Polcyn, F.C.; Brown, W.L.; Sattinger, I.J. The Measurement of Water Depth by Remote Sensing Techniques; Report No. 8973-26-F; Willow Run Laboratories of the Institute of Science and Technology, The University of Michigan: Ann Arbor, MI, USA, 1970. [Google Scholar]
- Lyzenga, D.R. Passive Remote Sensing Techniques for Mapping Water Depth and Bottom Features. Appl. Opt. 1978, 17, 379–383. [Google Scholar] [CrossRef] [PubMed]
- Lyzenga, D.R. Remote Sensing of Bottom Reflectance and Water Attenuation Parameters in Shallow Water using Aircraft and LANDSAT Data. Int. J. Remote Sens. 1981, 2, 71–82. [Google Scholar] [CrossRef]
- Morel, A.; Maritorena, S. Bio-optical Properties of Oceanic Waters: A Reappraisal. J. Geophys. Res. 2001, 106, 7163–7180. [Google Scholar] [CrossRef]
- International Hydrographic Organization (IHO). S-57 Supplement No. 3—Supplementary Information for the Encoding of S-57 Edition 3.1 ENC Data. International Hydrographic Organization: Monaco, 2014. Available online: https://www.iho.int/iho_pubs/standard/S-57Ed3.1/S-57_e3.1_Supp3_Jun14_EN.pdf (accessed on 5 June 2018).
- International Hydrographic Organization (IHO). Regulations of the IHO for International (INT) Charts (S-4), Edition 4.7.0—July 2017. International Hydrographic Organization: Monaco, 2017. Available online: https://www.iho.int/iho_pubs/standard/S-4/S-4%20Ed%204.7.0%20July%202017%20EN.pdf (accessed on 5 June 2018).
Figure 1.
Study sites of (A) Cambridge Bay, Nunavut and (B) Heath Point, Quebec, and Havre-aux-Maisons, Quebec. Background map © ESRI.
Figure 1.
Study sites of (A) Cambridge Bay, Nunavut and (B) Heath Point, Quebec, and Havre-aux-Maisons, Quebec. Background map © ESRI.

Figure 2.
WorldView imagery for (A) Cambridge Bay, Nunavut; (B) Havre-aux-Maisons, Quebec; and (C) Heath Point, Quebec.
Figure 2.
WorldView imagery for (A) Cambridge Bay, Nunavut; (B) Havre-aux-Maisons, Quebec; and (C) Heath Point, Quebec.

Figure 3.
Scatterplots comparing multi-band SDB and survey depths for (A) Cambridge Bay, (B) Heath Point and (C) Havre-aux-Maisons. Red and yellow colours indicate higher concentrations of survey points.
Figure 3.
Scatterplots comparing multi-band SDB and survey depths for (A) Cambridge Bay, (B) Heath Point and (C) Havre-aux-Maisons. Red and yellow colours indicate higher concentrations of survey points.

Figure 4.
Transect showing a comparison between SDB and the 2015 and 2016 surveys for Havre-aux-Maisons. Transect begins at point A, ending at point B.
Figure 4.
Transect showing a comparison between SDB and the 2015 and 2016 surveys for Havre-aux-Maisons. Transect begins at point A, ending at point B.

Figure 5.
(A) Coverage of extrapolated SDB relative to (B) multibeam survey coverage for Heath Point. (C) Illustration of SDB potential for reducing gaps in multibeam coverage for water depths of 1–3 m and (D) 4–6 m for Heath Point. Black lines represent multibeam coverage.
Figure 5.
(A) Coverage of extrapolated SDB relative to (B) multibeam survey coverage for Heath Point. (C) Illustration of SDB potential for reducing gaps in multibeam coverage for water depths of 1–3 m and (D) 4–6 m for Heath Point. Black lines represent multibeam coverage.

Figure 6.
Left panel shows locations of 1892 leadline soundings which provided source information for the creation of ENC isobaths (gray lines in right panels). Centre panels show SDB coverage and isobaths for 2 (red) and 5 m (blue) depths. Right panels compare SDB and ENC isobaths. Note the significant differences between the isobaths locations.

Figure 7.
Plot of Digital Number (DN) values from the Cambridge Bay WorldView-2 image with associated depths from the 2014 multibeam survey. Left, center and right panels respectively show the blue, green and yellow bands.
Figure 7.
Plot of Digital Number (DN) values from the Cambridge Bay WorldView-2 image with associated depths from the 2014 multibeam survey. Left, center and right panels respectively show the blue, green and yellow bands.


Table 1.
Acquisition dates and number of available measurement points within 2 m depth ranges for survey datasets used at each study site.
Table 1.
Acquisition dates and number of available measurement points within 2 m depth ranges for survey datasets used at each study site.
| Site | Survey Year & Type 1 | Number of Survey Points | ||||||
|---|---|---|---|---|---|---|---|---|
| Overall | 0–2 m | 2–4 m | 4–6 m | 6–8 m | 8–10 m | 10–15 m | ||
| Cambridge Bay | L 1985 | 2309 | 434 | 691 | 744 | 354 | 82 | 4 |
| L 1992 | 469 | 140 | 169 | 117 | 34 | 9 | NA | |
| MB 2014 | 63,330 | 729 | 8035 | 32,770 | 18,909 | 2729 | 158 | |
| MB 2015 | 24,311 | NA | 439 | 10,409 | 9762 | 3266 | 435 | |
| MB 2017 | 10,811 | NA | NA | 1465 | 7712 | 1627 | 7 | |
| Heath Point | MB 2016 | 57,949 | 7471 | 26,722 | 17,126 | 6630 | NA | NA |
| LL 1892 * | 38 | 12 | 17 | 4 | 5 | NA | NA | |
| Havre-aux-Maisons | MB 2015 * | 115,702 | 46,429 | 61,956 | 7317 | NA | NA | NA |
| MB 2016 | 19,347 | 5937 | 11,290 | 2120 | NA | NA | NA | |
1 “L” indicates a LiDAR survey. “MB” indicates a multibeam survey. “LL” indicates a leadline survey. * Survey only used for independent accuracy assessment.
Table 2.
Specifications, viewing geometry and sun angles for each WorldView image. Acquisition times are reported in Universal Time Coordinated (UTC).
Table 2.
Specifications, viewing geometry and sun angles for each WorldView image. Acquisition times are reported in Universal Time Coordinated (UTC).
| Location | Sensor | Acquisition Date | Acquisition Time (UTC) | Off-Nadir View Angle (°) | Satellite Azimuth Angle (°) | Sun Azimuth Angle (°) | Sun Elevation Angle (°) |
|---|---|---|---|---|---|---|---|
| Cambridge Bay | WorldView-2 | 20 September 2015 | 18:37 | 28 | 49 | 176 | 22 |
| Havre-aux-Maisons | WorldView-3 | 29 April 2016 | 15:21 | 25 | 177 | 161 | 56 |
| Heath Point | WorldView-2 | 15 October 2016 | 03:59 | 23 | 149 | 166 | 31 |
Table 3.
WorldView band wavelength ranges (nm) [8].
Table 3.
WorldView band wavelength ranges (nm) [8].
| Bands | ||||||||
|---|---|---|---|---|---|---|---|---|
| Sensor | Coastal | Blue | Green | Yellow | Red | Red Edge | Near-Infrared 1 | Near-Infrared 2 |
| WorldView-2 | 396–458 | 442–515 | 506–586 | 584–632 | 624–694 | 699–749 | 756–901 | 856–1043 |
| WorldView-3 | 400–450 | 450–510 | 510–580 | 630–625 | 630–690 | 705–745 | 770–895 | 860–1040 |
Table 4.
RMSE statistics for band ratio and multiple-band SDB approaches. Statistics are provided for all accuracy assessment points, as well as for specific depth ranges.
Table 4.
RMSE statistics for band ratio and multiple-band SDB approaches. Statistics are provided for all accuracy assessment points, as well as for specific depth ranges.
| Site | Approaches | RMSE (m) for Depth Ranges | ||||||
|---|---|---|---|---|---|---|---|---|
| Overall | 0–2 m | 2–4 m | 4–6 m | 6–8 m | 8–10 m | 10–15 m | ||
| Cambridge Bay | / | 0.70 | 1.31 | 0.85 | 0.55 | 0.69 | 0.96 | 1.95 |
| / | 0.81 | 1.67 | 1.09 | 0.65 | 0.74 | 1.14 | 2.02 | |
| / | 1.04 | 0.95 | 0.76 | 0.89 | 0.85 | 1.98 | 3.95 | |
| Multi-Band 1 | 0.56 | 1.01 | 0.65 | 0.42 | 0.54 | 0.87 | 1.72 | |
| Heath Point | / | 1.24 | 1.15 | 1.09 | 0.41 | 0.95 | NA | NA |
| / | 1.29 | 1.35 | 1.05 | 0.99 | 2.34 | NA | NA | |
| / | 0.89 | 0.59 | 0.78 | 0.75 | 1.71 | NA | NA | |
| Multi-Band 1 | 0.86 | 0.47 | 0.79 | 0.66 | 1.69 | NA | NA | |
| Havre-aux-Maisons | / | 0.48 | 0.44 | 0.50 | 0.41 | NA | NA | NA |
| / | 0.54 | 0.51 | 0.57 | 0.34 | NA | NA | NA | |
| / | 0.44 | 0.30 | 0.43 | 0.73 | NA | NA | NA | |
| Multi-Band 2 | 0.35 | 0.30 | 0.61 | 0.70 | NA | NA | NA | |
1 Blue, Green, Red and Yellow Bands. 2 Coastal, Blue, Green, Red and Yellow Bands.
Table 5.
90% level of confidence for the multi-band approach.
| Site | Overall 90% Level of Confidence (m) |
|---|---|
| Cambridge Bay (0–15 m) | 0.88 |
| Heath Point (0–8 m) | 1.50 |
| Havre-aux-Maisons (0–6 m) | 0.63 |
Table 6.
RMSE statistics for the multiple-band ratio test applied to the Cambridge Bay study site. / was used for depths from 0 to 4 m, while / was used for depths >4 m.
Table 6.
RMSE statistics for the multiple-band ratio test applied to the Cambridge Bay study site. / was used for depths from 0 to 4 m, while / was used for depths >4 m.
| Depth Range (m) | ||||||||
|---|---|---|---|---|---|---|---|---|
| / | / | |||||||
| Overall | 0–2 | 2–4 | 4–6 | 6–8 | 8–10 | 10–12 | 12–14 | |
| RMSE | 0.65 | 0.69 | 0.44 | 0.55 | 0.67 | 0.99 | 1.82 | 3.74 |
Table 7.
Independent assessment of the Havre-aux-Maisons, Quebec multi-band approach.
| Surveys | Assessment Techniques | RMSE (m) | ||||
|---|---|---|---|---|---|---|
| Overall | 90% Confidence | 0–2 m | 2–4 m | 4–6 m | ||
| MB 2016 | 10% used for Training & 90% for Assessment | 0.35 | 0.63 | 0.30 | 0.61 | 0.70 |
| MB 2015 | Independent Assessment | 0.39 | 0.64 | 0.34 | 0.35 | 0.75 |
Table 8.
Comparison between the 1892 leadline survey and SDB for Heath Point.
| Survey Depths (m) | RMSE (m) | # of Survey Points |
|---|---|---|
| <2 | 0.9 | 12 |
| 2–5 | 1.3 | 21 |
| >5 | 3.6 | 5 |
| Overall | 2.07 | 38 |
Table 9.
Required accuracies for depth ranges for IHO CATZOC levels [19].
Table 9.
Required accuracies for depth ranges for IHO CATZOC levels [19].
| CATZOC Level | Depth Range (m) | Required Accuracy (±m) |
|---|---|---|
| A1 | 0–10 | 0.6 |
| 10–30 | 0.8 | |
| A2 & B | 0–10 | 1.2 |
| 10–30 | 1.6 | |
| C | 0–10 | 2.5 |
| 10–30 | 3.5 |
© 2018 by the authors. Licensee MDPI, Basel, Switzerland. This article is an open access article distributed under the terms and conditions of the Creative Commons Attribution (CC BY) license (http://creativecommons.org/licenses/by/4.0/).
Share and Cite
MDPI and ACS Style
Chénier, R.; Faucher, M.-A.; Ahola, R. Satellite-Derived Bathymetry for Improving Canadian Hydrographic Service Charts. ISPRS Int. J. Geo-Inf. 2018, 7, 306. https://0-doi-org.brum.beds.ac.uk/10.3390/ijgi7080306
AMA Style
Chénier R, Faucher M-A, Ahola R. Satellite-Derived Bathymetry for Improving Canadian Hydrographic Service Charts. ISPRS International Journal of Geo-Information. 2018; 7(8):306. https://0-doi-org.brum.beds.ac.uk/10.3390/ijgi7080306
Chicago/Turabian StyleChénier, René, Marc-André Faucher, and Ryan Ahola. 2018. "Satellite-Derived Bathymetry for Improving Canadian Hydrographic Service Charts" ISPRS International Journal of Geo-Information 7, no. 8: 306. https://0-doi-org.brum.beds.ac.uk/10.3390/ijgi7080306
Note that from the first issue of 2016, this journal uses article numbers instead of page numbers. See further details here.