Automation of Building Permission by Integration of BIM and Geospatial Data


1
Department of Physical Geography and Ecosystem Science, Lund University, Sölvegatan 12, SE-223 62 Lund, Sweden
2
Sweco Position, Drottningtorget 14, SE-201 22 Malmö, Sweden
*
Author to whom correspondence should be addressed.
ISPRS Int. J. Geo-Inf. 2018, 7(8), 307; https://0-doi-org.brum.beds.ac.uk/10.3390/ijgi7080307
Submission received: 31 May 2018
/
Revised: 1 July 2018
/
Accepted: 25 July 2018
/
Published: 31 July 2018
(This article belongs to the Special Issue Building Information Modeling and 3D GIS Integration: From the Theoretical to the Practical)
Abstract
:The building permission process is to a large extent an analogue process where much information is handled in paper format or as pdf files. With the ongoing digitalisation in society, there is a potential to automate this process by integrating Building Information Models (BIM) of planned buildings and geospatial data to check if a building conforms to the building permission regulations. In this study, an inventory of which regulations in the (Swedish) detailed development plans that can be automatically checked or supported by 3D visualisation was conducted. Then, two of these regulations, the building height and the building footprint area, were studied in detail to find to which extent they can be automatically checked by integration of BIM and geospatial data. In addition, a feasibility study of one visual criterion was conducted. One concern when automating the building permission process is the variability of content within the Industry Foundation Classes (IFC) data model. Variations in modelling methods and model content leads to differences in IFC models’ content and structure; these differences complicate automated processes. To facilitate automated processes, requirements on the production of IFC models for building permission applications could be defined in the form of model view definitions or delivery specifications.
1. Introduction
Digitalisation is currently one of the major driving forces in society. Digitalisation is manifesting itself in many process-oriented fields including urban planning and building permission processes. The planning and building permission processes are characterised by a large number of involved actors both from industry and authorities. To make these processes efficient, in a digital society, there is a need to exchange and integrate digital information between actors as well as between processes. To realise this exchange technical, legal as well as business aspects must be considered. In this study, the technical issues associated with the building permission process are in focus.
In many countries, the building permission process is still a rather long and analogical process. In the application stage, the applicant often sends in documents such as design drawings and site plans in paper format or as pdf files. The information rich Building Information Models (BIM) that are commonly created by the building designer are hence, not yet fully utilised in the building permission process. In addition, digital geospatial data, such as the municipality’s city plans, topographical maps and digital elevation models are not yet fully utilised; this utilisation could hopefully improve when more data producing organisations adopt an open data policy. Furthermore, the building permission process is slow, and also somewhat unpredictable with ambiguous regulations, hence occasionally perceived as a risky process by investors. This calls for automated methods that could improve the efficiency on the authority side as well as enable investors to carry out their own automated checks before sending in the permission applications.
In this study, we developed, implemented and evaluated methods for increased automation of the building permission processes by utilising BIM and geospatial data together with quantitative data from local planning regulations and construction technical standards. The study is a part of a national Swedish planning project (Får Jag Lov? [1]) coordinated by the National Board of Housing, Building and Planning (swe: Boverket). One objective of the planning project is to increase the building construction productivity in Sweden by developing digital services for handling detailed development plans and for the building permission process. To realise this, proper detailed delivery specifications for both designers and authorities are required as well as methods for handling and integrating BIM and geospatial data.
The practical parts of our study were concerned with the Swedish building permission process. The methods for handling and integrating BIM and geospatial data can, however, be generally applicable even though the legal systems between countries vary. In Sweden, the assessment processes of the building permits are based on the Planning and Building Act (swe: SFS 2010:900 Plan-och bygglagen) the detailed development plan (swe: detaljplanen: legally determined by the local municipality) and technical building regulations (defined by the National Board of Housing, Building and Planning). The more technical building regulations stated in the Planning and Building Act were not evaluated. Compliance with such technical standards could be checked using BIM models and proprietary model checking tools such as Solibri Model Checker (Solibri Inc., Helsinki, Finland) and the integration with geospatial data is generally not necessary. Instead this study is concentrated on the regulations in the detailed development plan. These regulations can be categorised into quantitative, visual and qualitative criteria. The qualitative criteria concern the suitability of a building in a larger context and are typical criteria that are inherently difficult to automate. The visualisation criteria are supported digitally, e.g., by viewing an imported BIM model (of a planned building) in a digital city model. The quantitative criteria are the regulations in the detailed development plan that can be checked automatically. These criteria define, e.g., the highest building height and largest building footprint area allowed in a specified area.
The purpose of this study is to increase the efficiency of the building permission process. To provide an overview of what is possible, we distilled an inventory of the detailed development plan regulations which could be automated by analysing and visualising BIM and geospatial data. Based on this inventory, two quantitative criteria were selected (building height and building footprint area) and one visual criterion (general maintenance of the character in a built-up area) to study more in detail.
The paper is organised as follows; following this Introduction is a survey of related studies in Section 2. Section 3 includes the inventory of the detailed development plan regulations in Sweden and, in Section 4, Section 5 and Section 6, the selected quantitative and visual criteria are studied. Finally, the paper concludes with a discussion in Section 7 and conclusions in Section 8.
2. Related Studies
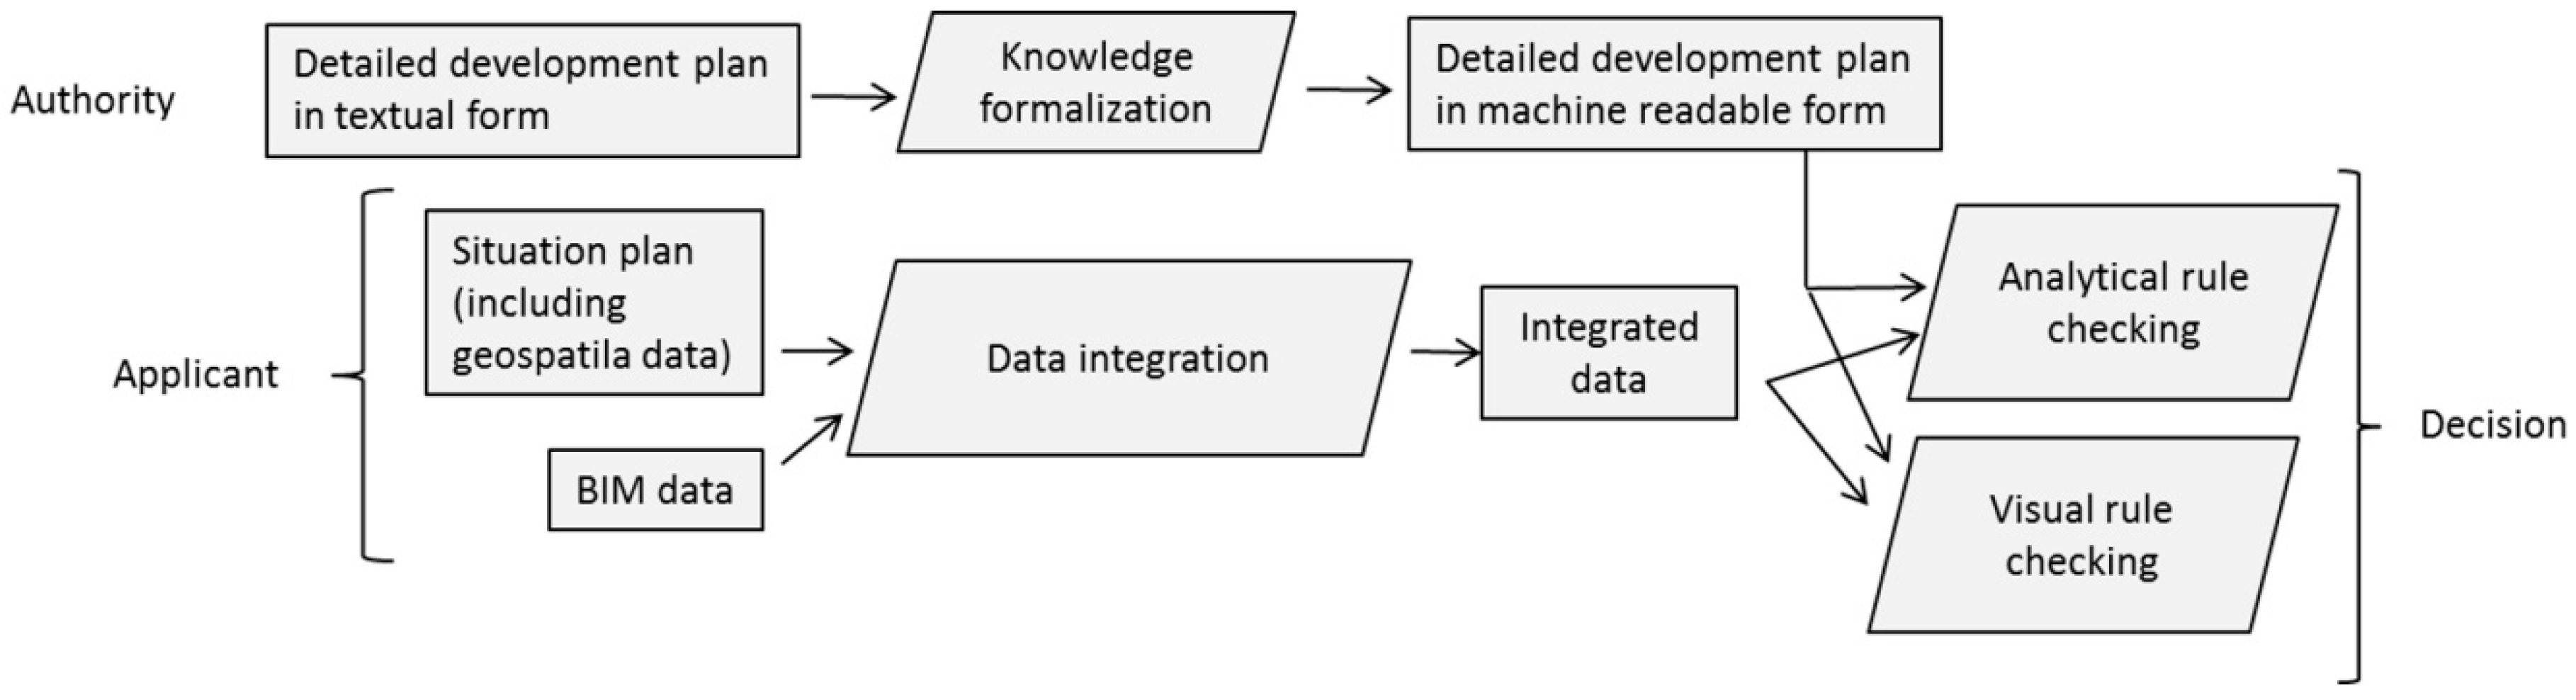
Figure 1 outlines the main steps in the automation of the building permission process. The permission applicant provides a BIM model and a digital situation plan (geospatial data that, among others, shows the location of the building(s) and the parking/transport facilities as well as a digital elevation model for the ground elevation of the construction area after the project is finalised). When the application involves alterations to an existing building, BIM models defining both current conditions and proposed changes are required. The task is then to check the building proposal against the detailed development plan. To enable this, two steps are required. Firstly, it is required that the detailed development plan is formalised into a computer readable form which in turn often requires knowledge formalisation of textual plans. Secondly, it is required to integrate the BIM data and the geospatial data. When these two steps are performed, the rule checking can be performed using analytical and visual methods. Finally, a decision is made based on the rule checking. In the sections below, we review some previous work in all of these steps.
2.1. Formalisation of the Detailed Development Plans
Formalisation of the detailed development plans is a main obstacle, from a practical perspective, since most plans have not been developed in a computer readable format. Since the plans have legal status, the conversion to computer readable form is difficult not only from a technical but also from a legal perspective. This paper concentrates on the technical perspective of the plans which has been studied in several articles. Hjelseth and Nisbet [2] presented a method to mark-up regulations based on four operators, namely Requirement, Applies, Select, and Exception (RASE), as an initial step to facilitate the design of computer readable formats. Beach et al. [3] utilised the RASE method to extract semantics from regulations and mapped these to semantics of the data format (BIM models) to enable a conversion into Semantic Web Rule Language (SWRL) rules. Lee et al. [4] described a method to digitise building requirements in the Korean Building Act. To perform this, they stored 15,000 building law-related sentences from the Korean Building Act in a database as well as created a methodology to filter and classify the sentences into computer readable form. Another example of formalising building regulations is provided by Malsane et al. [5] who developed a formalisation process based on three steps: (1) Select an appropriate building regulation sample belonging to a specific building-related aspect; (2) Classify building regulation based on whether they are clauses which are computer interpretable (denoted quantitative in our study) or clauses which are not (denoted qualitative in our study); (3) Decompose the quantitative regulations to extract semantics. Apart from methods to quantify the text description, there is also a need for defining the information model for the detailed development plan. In this study, we used the Swedish standard for digital development plans (SS 637040:2016; see Section 3 below) but there are several other models proposed. For example, Brasebin et al. [6] developed a model for the French regulations for local urban planning (Plan Local d’Urbanisme). Their model is based on CityGML (an open standard for 3D city models developed by the Open Geospatial Consortium (OGC) [7,8,9]), Inspire specifications for cadastral parcel [10], and COVADIS (a French standard, compliant with Inspire specifications for Land Use [11]).
2.2. Integration of BIM and Geospatial Data
Many regulations in detailed development plans require analysis and/or visualisation of integrated BIM and geospatial data. These analyses can be facilitated by conversion of BIM models in the standardised Industry Foundation Classes (IFC) format to geospatial building models in CityGML. There are, however, challenges in the transformation. Donkers et al. [12], among others, pointed out that different semantic properties are attached to the geometric primitives in IFC and CityGML. Furthermore, different geometric representations are employed, where IFC is using solids, such as constructive solid geometry (CSG) or sweep volumes, while CityGML uses boundary representation (B-Rep) (for description of these representations, see, e.g., [13]). Another challenge is that IFC allows for many different ways of modelling, which implies that it is not straight-forward to find a solution that can handle all IFC models (see, e.g., [14]).
Isikdag and Zlatanova [15] provided a framework of how IFC objects (IfcWall, IfcWindow, etc.) can be used to generate CityGML objects in different Levels Of Detail (LODs) on the semantic level. Laat and van Berlo [16] described the development of a CityGML ADE (application domain extension), to enrich CityGML with semantics from IFC data. A method, focusing on the semantics, for unidirectional transformation between IFC and CityGML with the aid of a unified building model was suggested by El-Mekawy et al. [17]. Donkers et al. [12] develop an automatic transformation from IFC models to CityGML LOD3 models based on three steps: (1) filtering and mappings of the semantics; (2) 3D geometric transformations to extract the exterior envelope of a building; and (3) refinements that ensure that the output is a valid CityGML file also from a geometric perspective. GeoBIM is a research project in the Netherlands aiming at developing an interface to reuse BIM data in the GIS domain and vice versa and to create guidelines on the modelling process to facilitate the transformation between CityGML and IFC [18].
There are some implementations for transforming BIM models to 3D geospatial data building models available. One example is IfcExplorer CityGML Export (http://www.ifcwiki.org/index.php/IFCExplorer_CityGML_-_IFC_Converter), an extension to the open source BIMserver (http://bimserver.org/). The extract, transform and load (ETL) tool Feature Manipulation Engine (FME) from SAFE Software, Vancouver, Canada (https://www.safe.com/) also provides capabilities to handle both BIM and geospatial data. Examples of studies that have used the FME framework for transformation of BIM and geospatial data are [19,20,21]. In this study, we extended the implementation in [21] that was available in an FME environment. Since the main aim was to study the ability to automate parts of the building permission process by integrating BIM and geospatial data (see Section 4), and the transformation of an IFC model is more of a preparation process, no further comparison between transformation methods was conducted.
One alternative to import the BIM data to the geospatial environment, or vice versa, is to define a conceptual mapping between the two data models. Kang [14] described the BIM-to-GIS conceptual mapping B2GM standard (ISO N19166) which defines the requirement and logical mapping for implementation of the two heterogeneous data models in the BIM and geospatial domain. By using the conceptual mapping between the two data models it is possible for a user to interrogate the data (e.g., building regulation checking) as if the BIM and geospatial data had been integrated into the same environment.
2.3. Analytical Rule Checking
The rule checking could be performed in a BIM environment that has imported geospatial data. An example was provided by van Berlo et al. [22], who proposed and tested a method where the architects import the 3D detailed development plan into a BIM environment by transforming the plan to the IFC format. In the BIM environment, they then checked building regulations such as maximum allowed building volume, the maximum percentage of built-up area on the site (densification level) and maximum allowed noise impact on each facade. Van Berlo et al. [22] argued that one advantage with this approach is that the architects can perform early model checks in a familiar environment (e.g., Solibri Model Checker) already during the design process. In addition, Brasebin et al. [6] worked with rule checking in their detailed development plan. They formalised this rule checking using the Object Constraint Language (OCL, [23]) where they among others checked the building heights. In their study, they also developed a tool for visualisation where the new building is visualised together with the current city model (in LOD1 and LOD2).
Benner et al. [24] presented a concept where they aim to check BIM and geospatial data for a new building against a detailed development plan in the German standard XplanGML. They proposed to convert the BIM data to CityGML format and then import the building data to a city model where the rule checking is performed.
There have been extensive studies of rule checking in the field of construction validation. Eastman et al. [25] divided the checking process into four phases: (1) rule interpretation (natural language to machine processable format); (2) preparation of building model (extract info, create enriched objects, etc.); (3) code checking; and (4) reporting. In the checking process, there is a balance between how much information that is explicitly added by designers and how much is derived from the models. For the first phase, there have been several studies of formalising natural language of building rules, e.g., using logic based representations [26] and semantic web techniques [27]. For the third step, there are products such as Solibri model checker and web services such as the Singapore CORENET system (http://www.corenet.gov.sg/) available. Many of the techniques developed for model validation should also be possible to apply or customise for the building permission process. However, one vital difference is that the building permission process relies more on geospatial data than other types of model validation, hence an integration of BIM and geospatial data is required.
Analytical rule checking requires control of the quality of the input data and the error propagation to the analyses results. The BIM model provided by the applicant could be regarded as error free (deviations from the model in the realised building are not a concern in the building permission process) but in case the model is converted to geospatial data there will be uncertainties. There are also uncertainties in the geospatial data and situation plan; these uncertainties are both representation-induced (dependent on the LOD used) and acquisition-induced (cf. [28]).
2.4. Visual Rule Checking
There have been several empirical studies of decision making based on maps and 3D visualisation. One issue, relevant for the visual rule checking of building permits, is photorealistic versus symbolic representation. Intuitively, one could think that photorealistic representation would be preferable because the users are familiar with how things look (see, e.g., [29]). However, even though users generally prefer photorealistic representations, it is not certain that they perform better with such representations [30]. Some studies have shown that domain experts generally prefer symbolic representations. For example, Häberling et al. [31] interviewed expert users about 3D landscape maps. One issue that was discussed was the Degree of abstraction, where most experts preferred a map-like symbolisation (more symbolic than photorealistic). One disadvantage with photorealistic representations is that they provide the users with too much information that obscures the main message. Furthermore, there are results from the field of psychology stating that users have a too strong belief in highly realistic displays [32]. This belief might result in users putting a higher trust in photorealistic representations. For example, Zanola et al. [33] found that novice users infer significantly more quality in 3D urban data if the data are more photorealistic. Whether this (too) high belief in data affects the building permit administrators negatively in their decision making is, at least for us, an open question. For a building permit rule checking system, it could also be interesting to combine a photorealistic and symbolic representation (for description of this combination (see, e.g., [34,35]).
If symbolic representation is used for the rule checking, there is the additional question of which level of detail (LOD) to use. There have been studies of improving visualisation of building objects realised by simplifying building data in CityGML from a higher level of detail (e.g., LOD3) to a lower (e.g., LOD2) [36,37,38,39]. The argument for this simplification is both performance (less data needed to be transmitted, etc.) and visual quality (remove clutter). Besides the issue of LOD, there is also an issue of which visualisation technique (visual variables) to use. In a recent study, Neuville et al. [40] defined a set of graphic design guidelines for specific tasks using a mathematical formalism; the aim of the guidelines are, among others, to define the degree of transparency, shadow, shading, etc. as well as colour hue of objects. To adopt this formalism to the building permit process would require some work to identify the critical elements in the 3D visualisation for the decision making.
3. Inventory and Methodology for Checking Detailed Development Requirements
In this study, detailed development plans were used in a Swedish standard for computer readable plans (SS 637040:2016), denoted below as the digital plan standard. This standard is partly based on the international standard Land Administration Domain Model (LADM; [41,42]) where some classes inherit from corresponding classes in LADM. However, the digital plan standard does not contain the classes for legal rights, etc. as included in LADM, instead it has classes for regulations in the detailed development plan. As a complement to the digital plan standard the National Board of Housing, Building and Planning provides a list of criteria that are allowed to be used within the standard. The list includes, among others, property criteria which are rules based on spatial units in the detailed development plan. In total, there are around 270 property criteria that should be used for new plans. It should be noted that many of these criteria are similar, it can for example be building heights in two types of areas (e.g., residential and industrial); this implies that, when implementing criteria checking, there are far fewer unique criteria that need to be considered.
To identify the property criteria suitable for automated checking, we classified them into the categories quantitative, visual, and qualitative. The quantitative and visual criteria were further classified into subclasses dependent on whether BIM and/or geospatial data (including the situation plan) are required. Table 1 includes the result of this classification and Table 2 includes example criteria for each category. In the classification, it is assumed that:
- (1)
- There is no specific BIM object for calculating the building footprint area (i.e., a method similar to Area Method A1 in Section 5.2 should be used).
- (2)
- There are digital models of roads, bridges, tunnels, etc. available as BIM models and/or geospatial data.
- (3)
- The BIM models contain information about the usage of the buildings.
Based on Table 1, it can be concluded that there is a significant potential in integrating BIM and geospatial data to streamline the process of checking building designs against the rules in the detailed development plan. To further investigate this, two quantitative criteria were studied, the building height and the building footprint area (related to densification level of a specific area defined as the total building footprint area divided by total area of a specific region). In the forthcoming two sections, we describe methodologies and implementations for automated checking of these two criteria as well as include evaluations of the results obtained. Furthermore, we include one study of the visual criterion “general maintenance of the character in a built-up area”.
It is, however, not possible to quantify the level of automation that can be achieved based on Table 1 alone. Firstly, no information about how common each type of criteria is in the detailed development plan is included, nor is any information about the working load to investigate them included. Secondly, the classification is not perfect; for example, some criteria would benefit from a combined quantitative and visual inspection.
4. Study of Building Height
4.1. Legal Rules for Building Height
The highest permitted height of a building in an area is legally decided by the municipalities and defined in the detailed development plan. It can be given as building height, height of roof-ridge or total height (highest point). The most commonly used measure is building height [43] which is also the focus in this study. The Planning and Building Act and the Planning and Building Regulation (swe: SFS 2011:338 Plan-och byggförordningen) state basic rules on how to calculate the building height but does not provide a strict definition of the height. The rules are ambiguous and several legal disputes related to building heights have resulted in court cases [43]. Similar buildings can have different calculated heights in different municipalities and different actors can calculate different building heights for the same building [43].
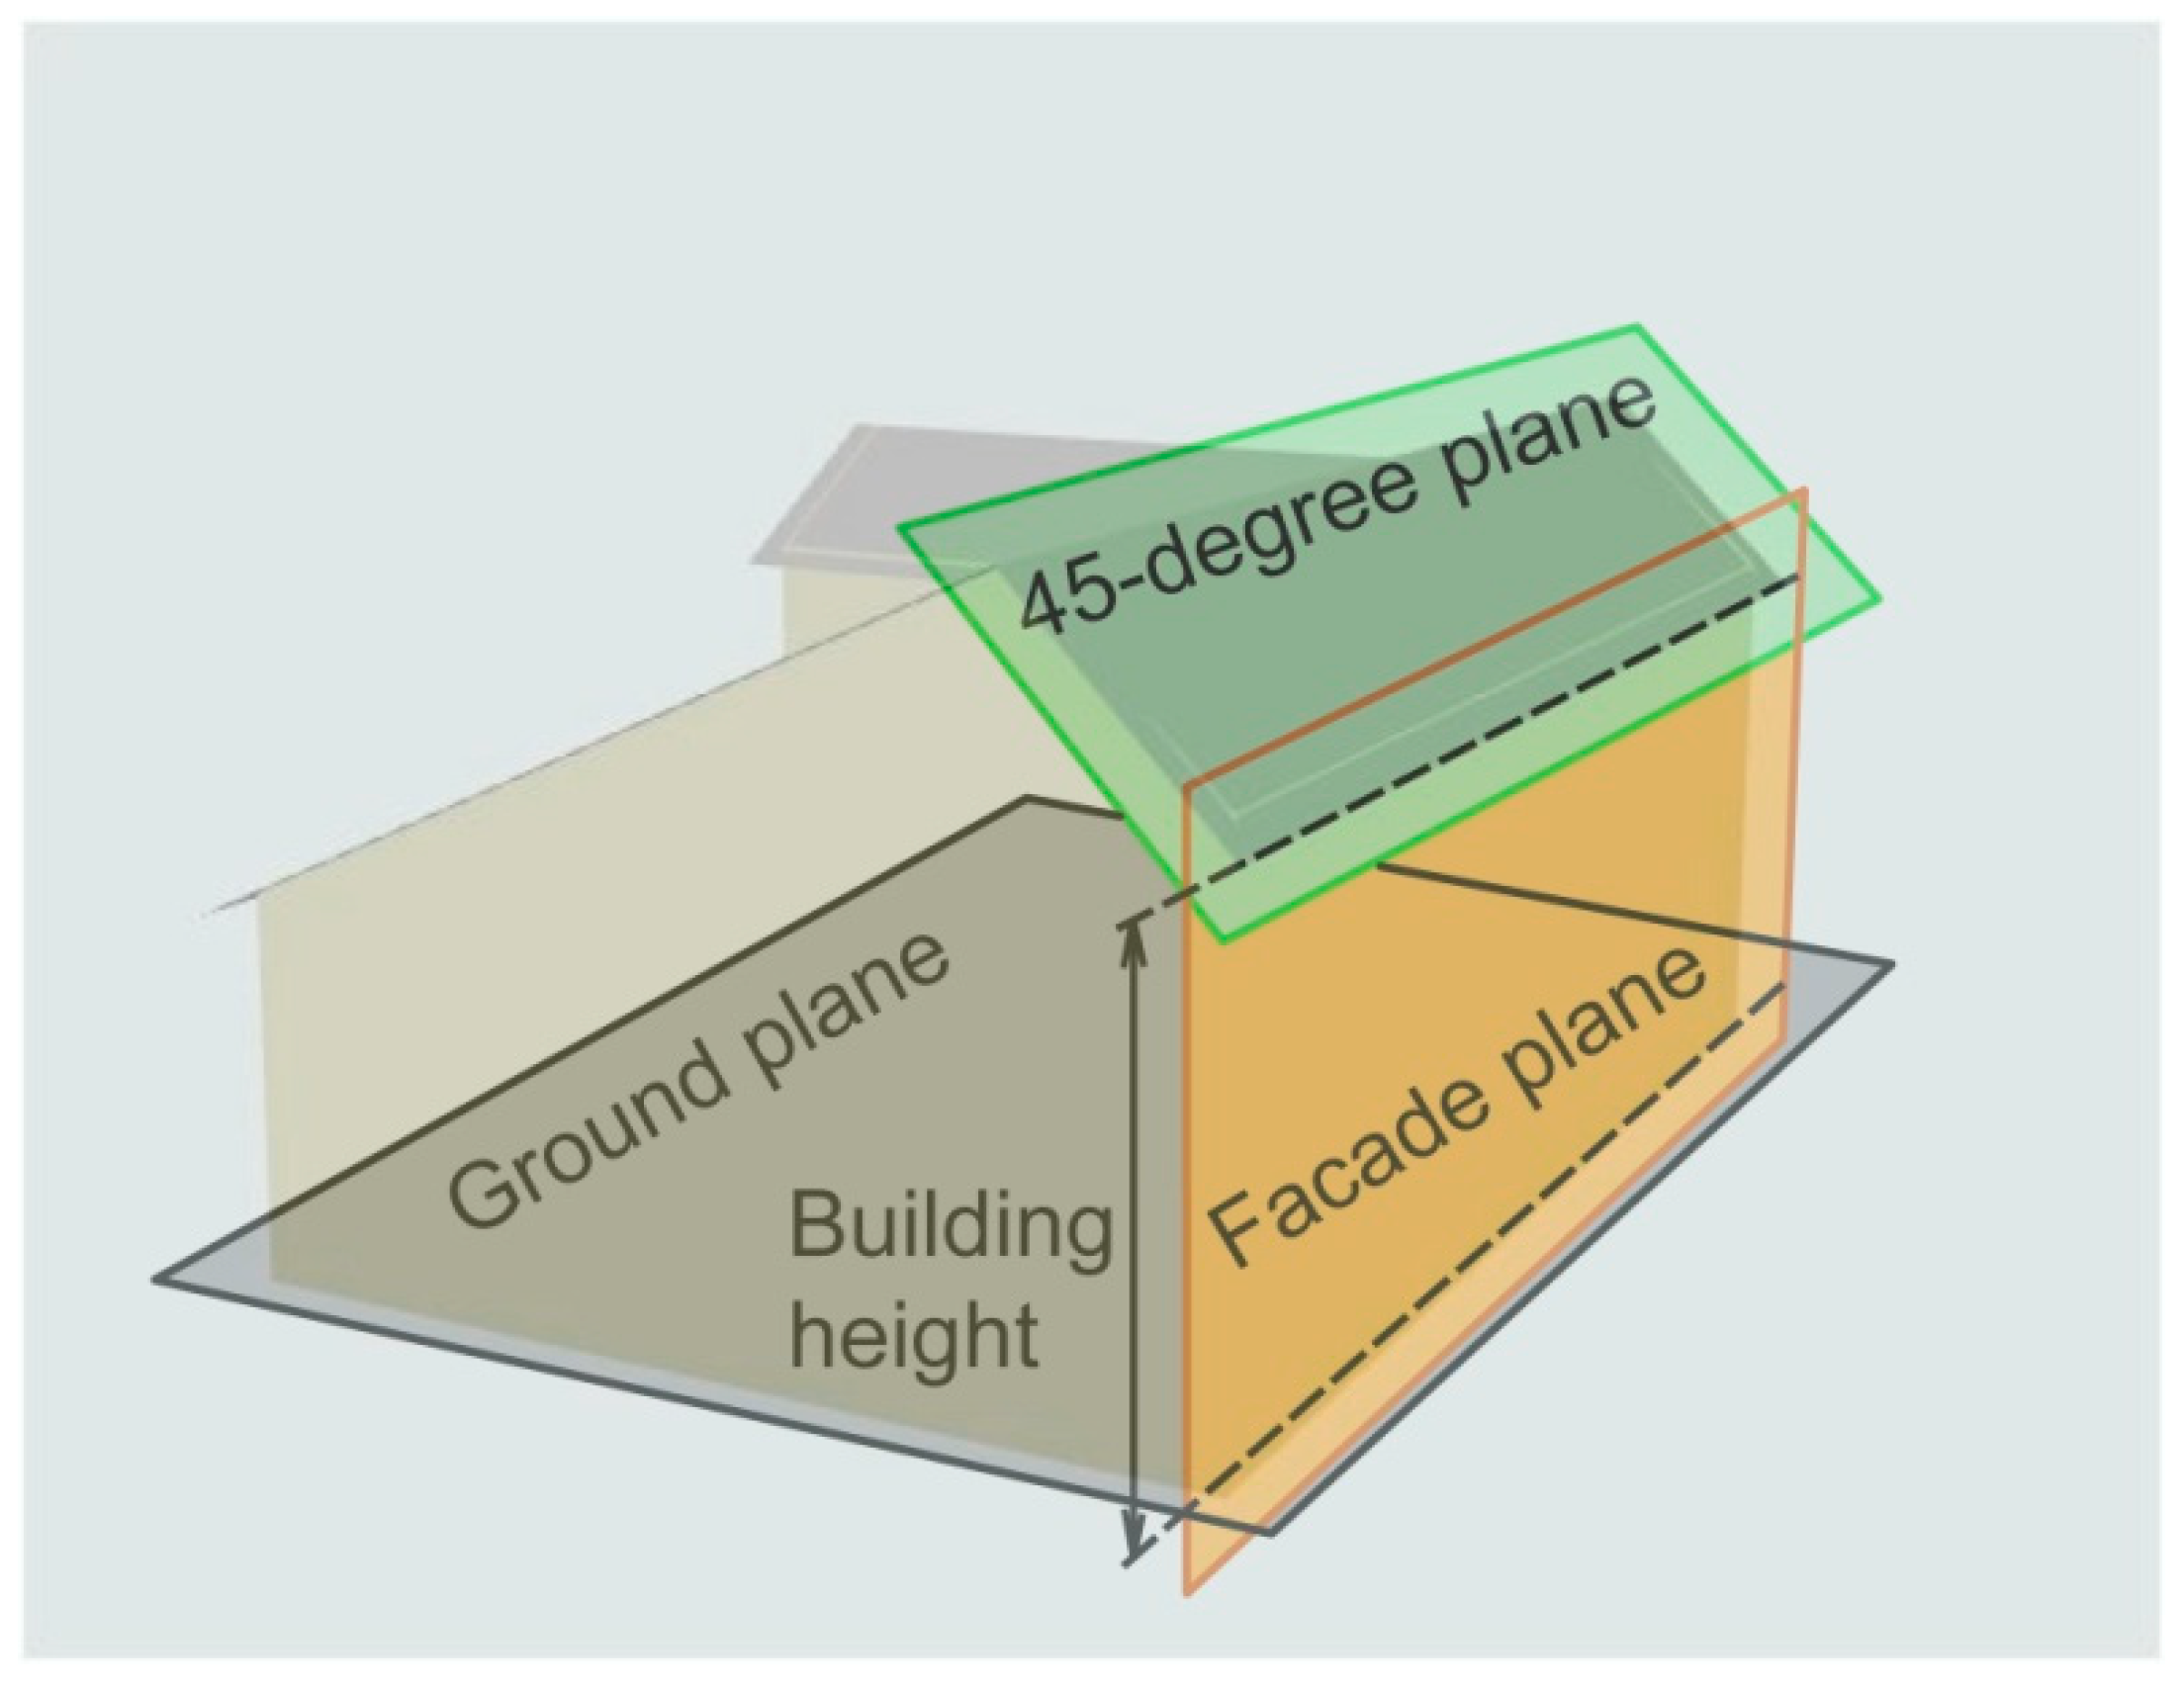
The basic rules for calculation of the building height are based on three planes (Figure 2): (1) a plane representing the main facade of the building; (2) a 45-degree plane touching the highest part of the building’s roof; and (3) a ground plane (a horizontal plane representing the mean ground elevation). The building height is defined as the height of the intersection line between the 45-degree plane and the façade plane above the ground plane.
There are some ambiguities in these basic rules. The main facade is defined as the facade that has the greatest visual impact for the public. The facade should be one of the longer sides of the building and normally be located parallel to a street. There can, however, be more than one side of a building facing public areas and the orientation of a building in a parcel can result in different building heights. When defining the 45-degree plane touching the roof, it is not clearly stated what to include as part of the roof. Large dormers shall be included and the 45-degree plane lifted to touch the highest point of such dormers, but it is not defined what a “large” dormer is. This leaves room for varying interpretations. The ground plane representing the mean ground level can be derived from the corners of a building in areas with flat terrain. In hilly areas, more ground points are required to get an accurate estimate of the mean elevation, but it is not defined how many ground points should be used or where to place them which may result in different elevation values of the ground. Furthermore, if the building is less than 6 m from a public area, the ground elevation of the public area shall be considered as the mean ground elevation.
The uncertainties in the interpretation of building heights have resulted in the government appointing the National Board of Housing, Building and Planning to provide new rules that support automated procedures and that can be legally implemented. The appointment resulted in Boverkets Report [44] which provides examples of how rules for calculating building height could be defined:
- (1)
- The facade plane is derived from the side of the building that gives the highest building height regardless of orientation. This has the advantage that the orientation of the building does not influence the calculated building height.
- (2)
- For the 45-degree plane, dormers with a width of one third, or more, of the roof’s width are considered as large and shall be considered as parts of the roof. Dormers reaching the highest part of the roof are always included.
- (3)
- The ground plane is calculated from 16 points along the sides of the building. The points with the highest and lowest elevations are included and the remaining 14 points are evenly distributed along the sides of the building.
4.2. Methods and Implementation
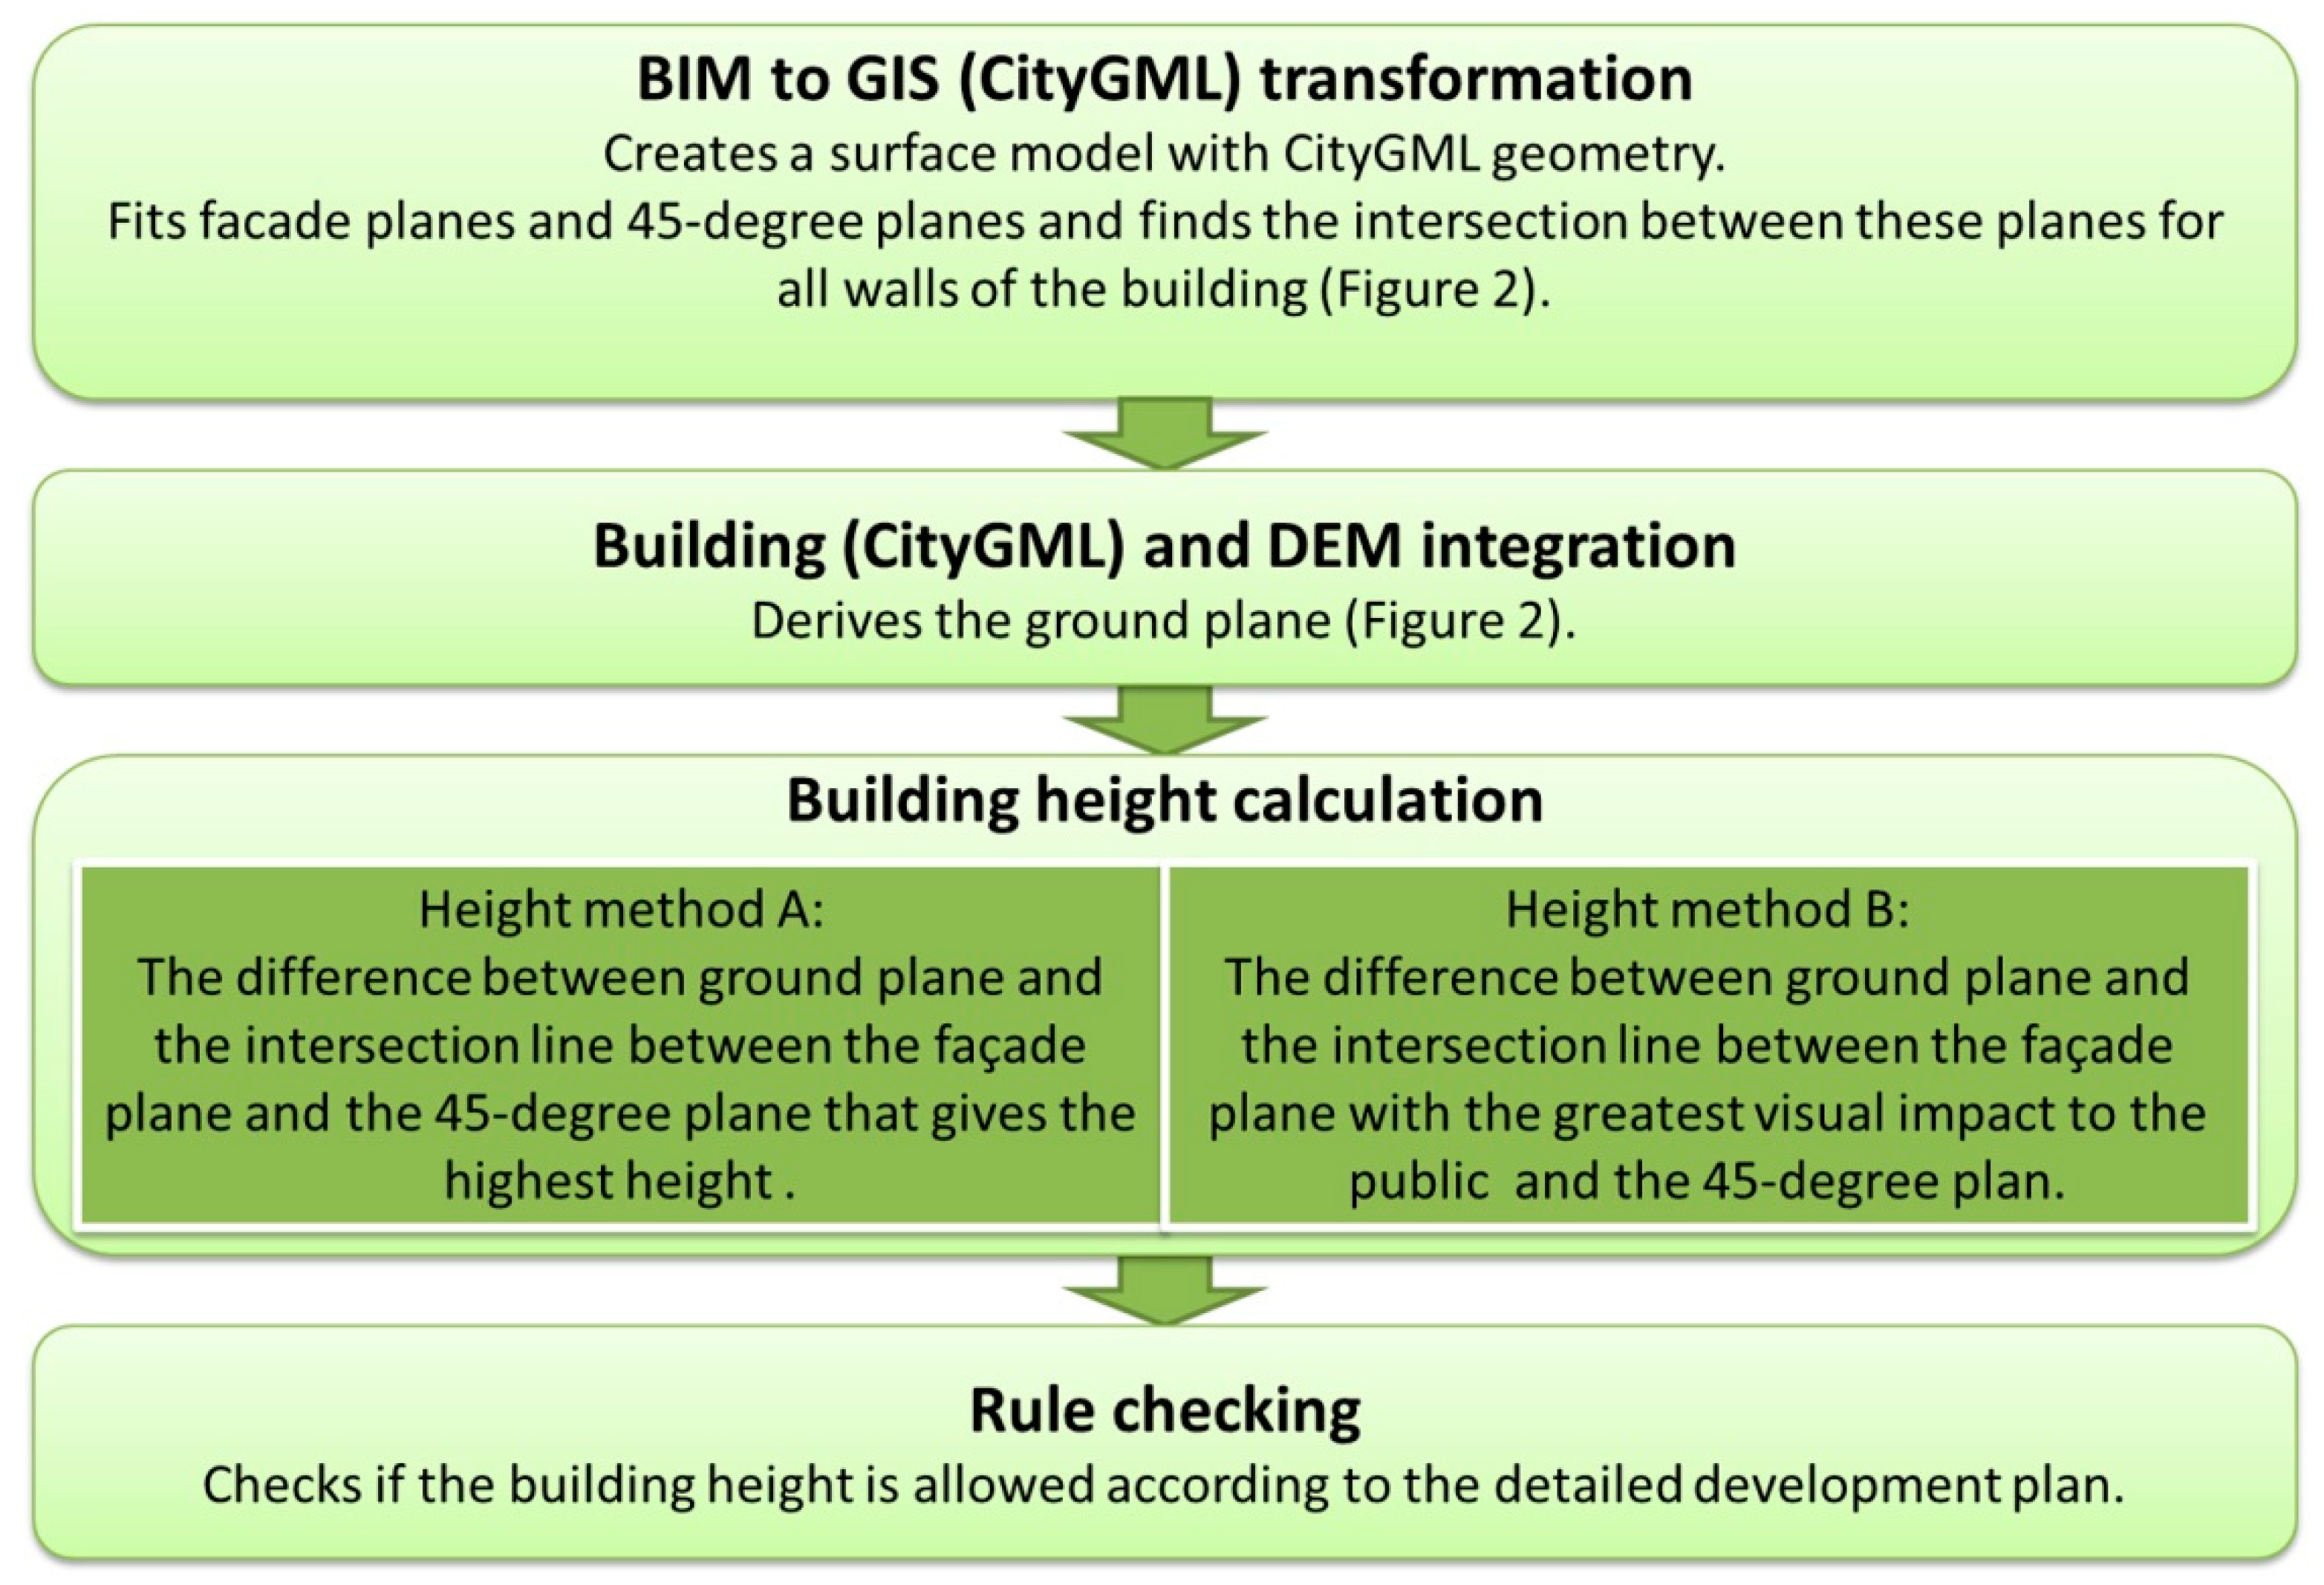
In this study, it was evaluated whether the example rules in Boverket’s Report [44], here denoted as Height Method A, facilitate automated checking of building heights by integration of BIM and geospatial data. The workflow of the method is illustrated in Figure 3: first the BIM model was transformed from IFC to a LOD3 building model with CityGML surface geometries but with attributes tailored for the building height calculations; then the ground plane was derived by integrating the LOD3 building model and a Digital Elevation Model (DEM); in the next step the building height was calculated; and finally the building height was compared with the maximum allowed building height according to the detailed development plan.
4.2.1. Test Data
A detailed development plan according to the digital plan standard was obtained from the municipality of Höganäs in southern Sweden. A DEM with a spatial resolution of 2 m was obtained from the National Survey of Sweden (Lantmäteriet; https://www.lantmateriet.se/). The DEM was converted to a 3D point dataset with the elevation assigned as attribute to the points. Here, we used the existing national DEM and assumed that no modifications of the ground will be conducted around the building. Since the method to identify the ground plane will be the same regardless of what DEM is used, this will not influence how the method is implemented. Lastly, we created a suitable IFC model of a single dwelling with a dormer to use in the test cases.
4.2.2. Method Implementation
As a first step, the IFC model was transformed to a LOD3 building model with CityGML surface geometries but with attributes tailored for the building height calculations where the transformation employed a method described in [21]. In short, the conversion method transforms the solid wall elements in the IFC-model to surfaces and identifies one outer wall surface with a ray-casting method. The method then finds the adjacent outer wall surface in clockwise direction until all outer wall surfaces are identified. The wall surfaces are then extended in vertical direction to touch the upper roof surfaces, and doors and windows are identified as dependents of the outer walls. Additionally, in this study, the 45-degree plane was applied to the roof according to the rules in Boverket’s Report [44], and for all walls of the building, the intersection line between the 45-degree plane and facade plane was derived and the height of the intersection line from the lower part of the walls was added as attribute for each wall.
In the next step, the building model and the detailed planning map were imported into FME by hard-coded rotation and translation to place the building in the desired locations. To import the detailed development plan to FME, we developed our own reader of the plans according to the national digital plans standard. The results of this import procedure are line and polygon objects which have attributes that describe property criteria that are present in the region of interest. The ground plane, for each location where the building was placed, was calculated from 16 points evenly distributed along the perimeter of the building. The elevation at each of the 16 points was derived from the DEM with a nearest neighbour interpolation and the method confirmed that the highest and lowest elevations were included before the mean value of the 16 points was calculated. The building heights at the chosen locations for the building were then calculated as the difference between the height of the ground plane and the height of the intersection line between the 45-degree plane and the façade plane (stored as attribute in the simplified building model). Finally, the calculated building height was compared to the highest allowed building height according to the detailed development plan, for each location.
To enable a comparison with current regulations a method to calculate building heights according to current rules was implemented, here denoted Height Method B. We did, however, define certain rules in the implementation to enable an automated calculation of the building height: (1) The façade plane was derived from the outer wall located closest to a public street (car, bike or pedestrian). (2) The mean ground elevation is estimated based on 16 points i.e., the same method as with Height Method A. In addition, the building heights were calculated both with and without including a dormer when defining the 45-degree plane. The workflow was similar to Height Method A with the addition that the main facade i.e., the facade having the greatest visual impact for the public had to be identified. The main facade was found by creating straight lines starting from the centre of the walls and with the direction of the surface normal of each wall. These lines were intersected with the public roads and the point of intersection closest to a wall was used to identify the main facade. We also studied how the derived building height varied with orientation and position of the building according to the current regulations (Height Method B). For this purpose, the building model was placed in different locations and with different orientations. In addition, the building heights including and excluding the dormer were calculated.
All methods were implemented as scripts in the extract, transform and load (ETL) tool FME. The scripts are released (github.com/TestbedLU) under the open source license Berkley Software Distribution BSD (https://opensource.org/licenses/BSD-3-Clause).
4.3. Result and Evaluation
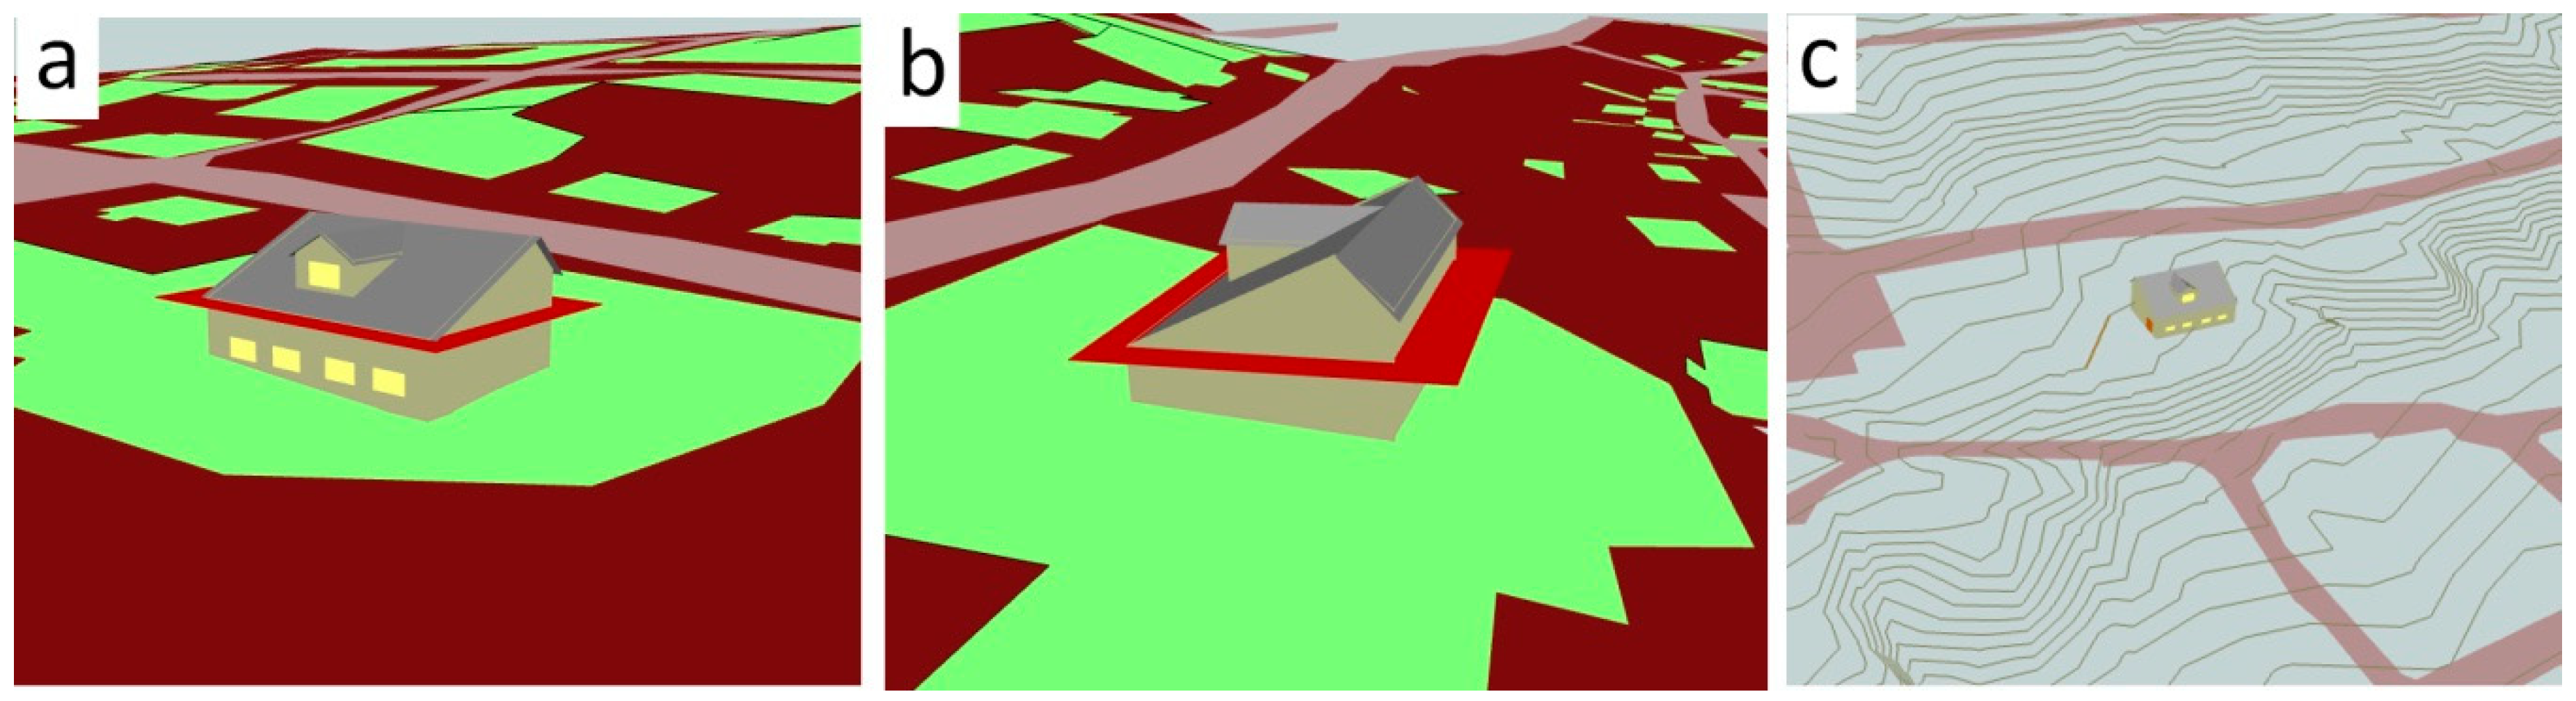
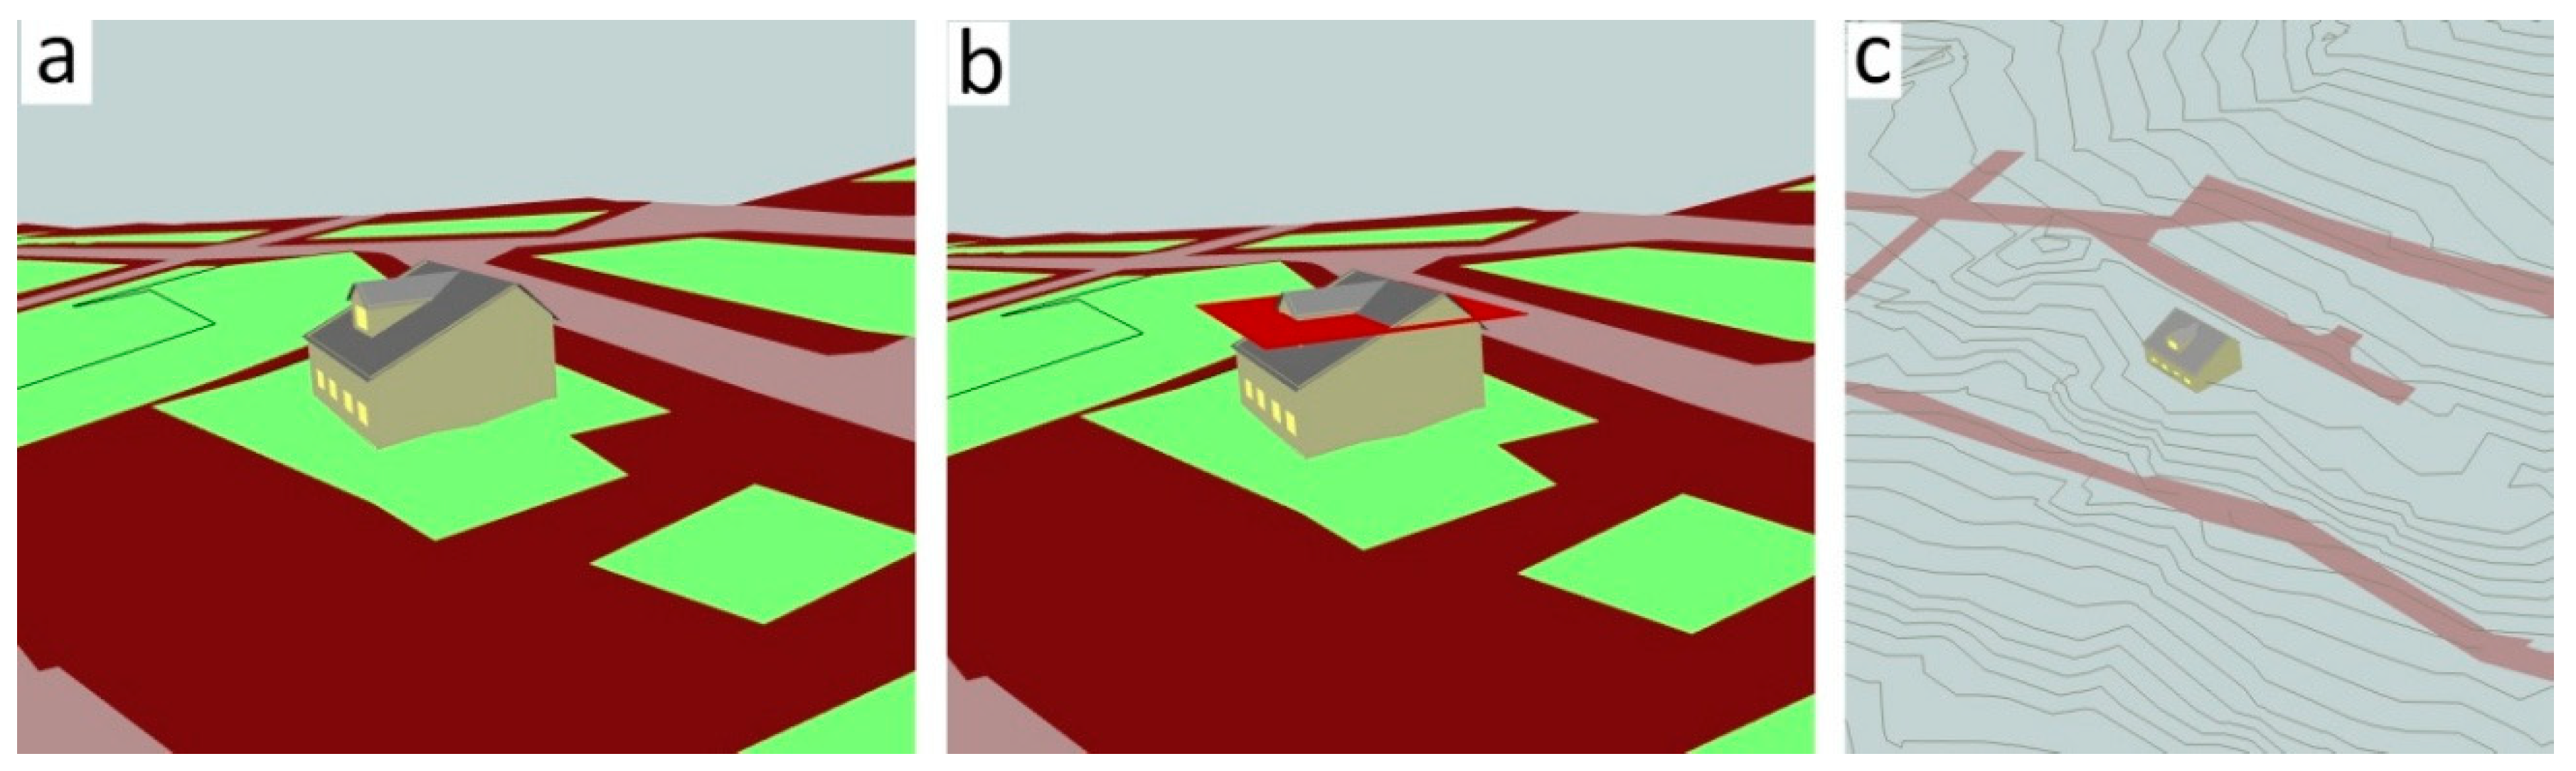
This study showed that it is possible to automate the process of calculating building height from an IFC model and a DEM and check if the height is allowed according to a detailed development plan in digital format. Figure 4 shows the tested building located with different orientations in a detailed development plan. The green areas represent areas that one is allowed to build and the horizontal red plane shows the highest allowed building height. When the building height is calculated according to Height Method A, the building will be too high regardless of orientation since the building height is always based on the highest façade. With the current regulations (Height Method B), the building would be allowed to be built if it was oriented with the lower façade facing the closest public road (b), and if the dormer is not included.
The results also show that strict definitions are required to enable an automated check of building heights given in a detailed development plan. In Figure 5b the building would only be allowed to be built if the dormer is not included when deriving the 45-degree plane. If there is no strict definition stating when a dormer is considered as large, i.e., shall be included in the building height calculation, a manual check would be required.
5. Study of Building Area
In this sub-study, the potential of automated area calculation was investigated using eight BIM models as test cases.
5.1. Legal Rules for Building Area (Densification)
The extent of a building is often regulated by limiting the permissible building area and/or the densification level; both are regulated in the detailed development plan created by municipalities. The measurement of building area is defined in Sweden by the Swedish standard SS 21054:2009 Area and Volume of House Buildings—Terminology and Measurement Rules (below denoted the area standard). The building area is the footprint of the building including protruding building components that affect the use of the ground below. A protruding building component is considered measurable if the lowest point of the building component is less than 3.0 m above the ground and protrudes more than 0.5 m from the façade. If the lowest point is located 3–5 m above the ground and the building part protrudes more than 1.5 m from the façade, it is also considered in the building area calculation.
5.2. Methods and Implementations
Today, a building permission application is normally assessed by a building permission administrator and the building area is manually checked. In this section, the manual method is described, followed by three methods developed for automated calculation of building areas. All methods were implemented as scripts in the extract, transform and load (ETL) tool FME. The scripts are released (github.com/TestbedLU) under the open source license Berkley Software Distribution BSD (https://opensource.org/licenses/BSD-3-Clause).
5.2.1. Manual Calculation of Building Area (Area Method M1)
The most common method to calculate the building area is to manually measure areas from plan drawings submitted with the building permission application. If the drawings are paper based, they are measured using a scale-ruler and if they are digital, typically as pdf, measurement tools in programs such as those within Adobe Acrobat Pro are used. If necessary, one also looks at facade and section drawings to determine if there are measurable protruding building parts that shall be included in the building area calculation. The building area is then manually checked against the regulations in the detailed development plan.
5.2.2. Automated Area Calculation without Object Representing Footprint Area (Area Method A1)
The building area is estimated based on the IFC elements: IfcBuildingStorey, IfcWall, IfcStandardWallCase, IfcMember (if the wall consists of large glass sections), IfcSlab (mainly floor constructions but also other horizontal objects such as stairs, ramps and roofs) and IfcRoof that represents the roof extents. An area geometry is generated automatically based on the modelled IFC objects, visualised and quantified. The script finds the objects and creates the base of the building area in accordance with the area standard. This base area is then used to find the protruding parts. Figure 6 shows the architecture of the script.
5.2.3. Automated Area Calculation with Object Representing Footprint Area (Area Method A2)
The second automated method requires that the BIM model author has created an area or volume object that represents the correct building footprint area in the IFC model. This area representation must comply with the area standard to ensure that the area calculated is correct. The area or volume is designated within a single IfcSpace object. The FME script reads the IFC-file and the IfcSpace object is selected and the relevant footprint area properties visualised and quantified.
5.2.4. Automated Area Calculation with IfcSpace Object and External Envelop Objects (Area Method A3)
The third automated method is applied when the proposed building design has protruding parts that overhang the footprint. The method is a hybrid combination of Area Methods A1 and A2 and uses the base geometry (IfcSlab) of the footprint, protruding building parts (e.g., IfcWalls) and IfcSpace objects. This method can be used to calculate the aggregated building area in accordance with the area standard where building models contain IfcSpace objects that represent the base of the building’s footprint area.
5.3. Tested BIM Models
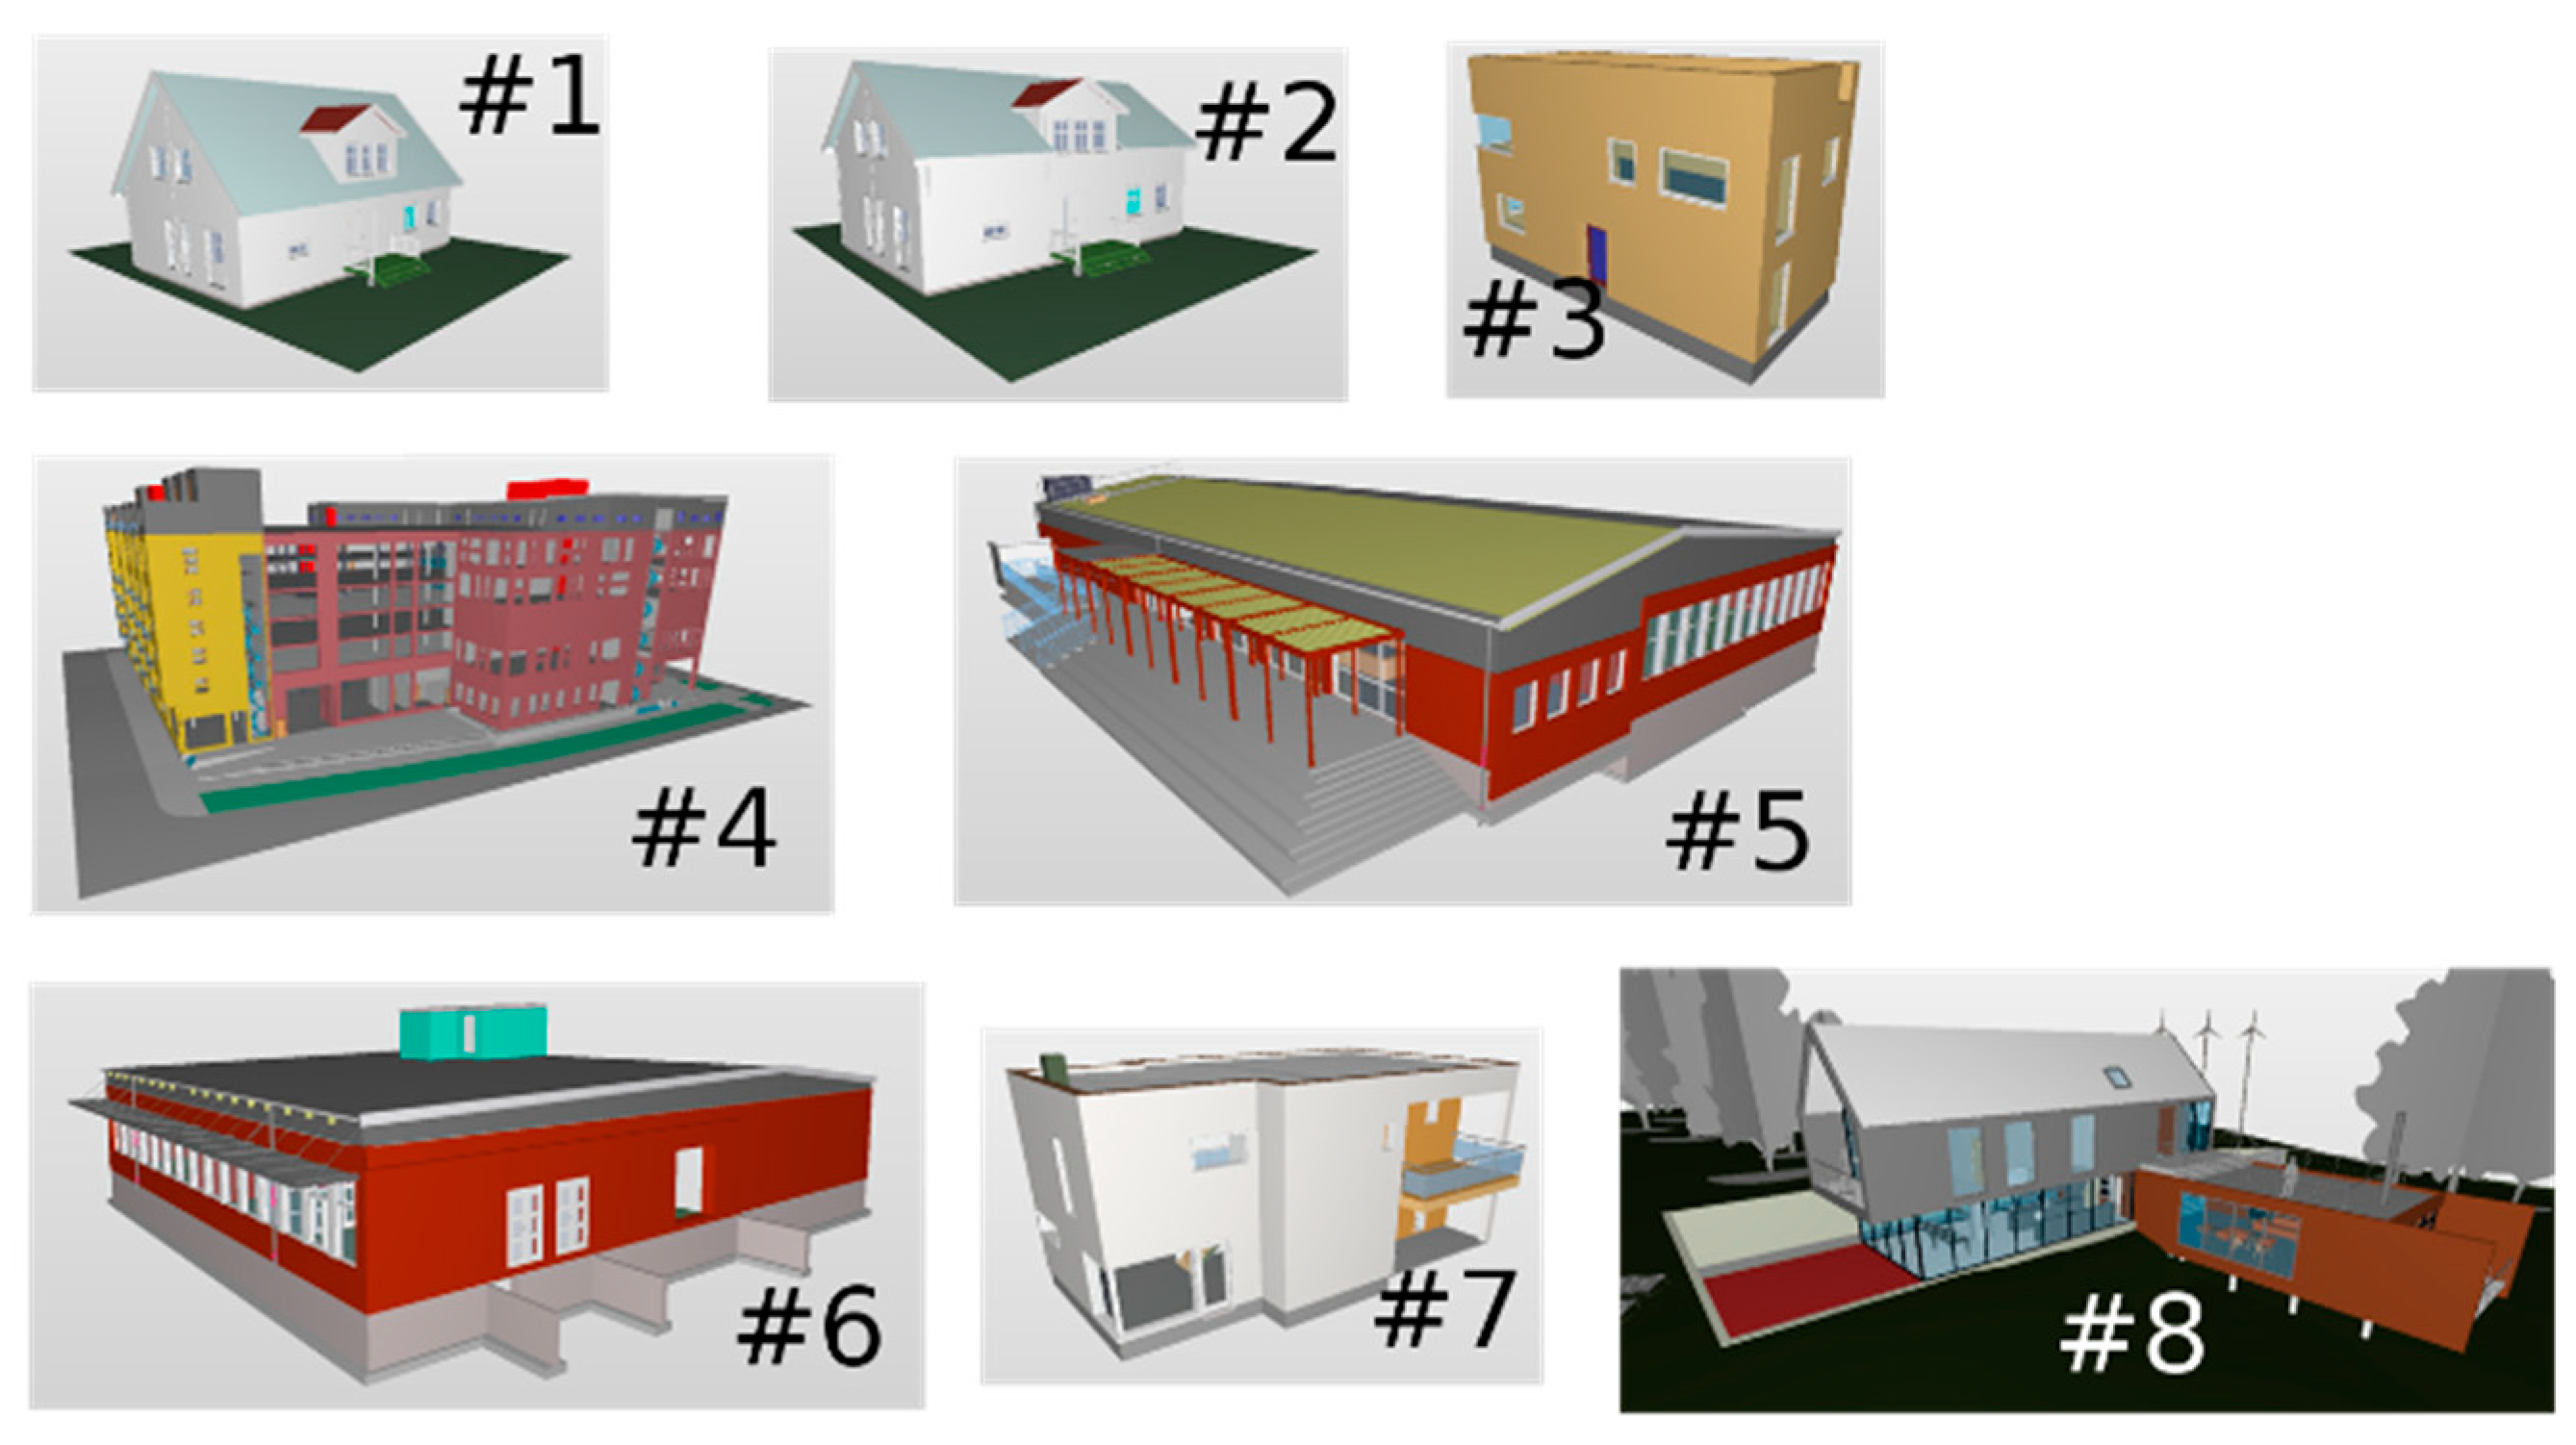
In this study eight BIM models in the IFC-format were used (Figure 7). The building models that were tested were created for different purposes and have varying level of detail and degree of complexity. Models #1 and #2 are standardised prefabricated house from a house builder; Model #3 is a simple rectilinear house; Model #4 a multi-storey residential building; Models #5 and #6 school buildings; and Models #7 and #8 demonstration models. The selection was based on the prerequisite to have a diversity of models both in terms of building use (residential buildings, municipality buildings, and commercial buildings) and in terms of sources (prefabricated house companies, architect companies and software companies).
None of the IFC models had specific sites, elevation levels or defined coordinate systems. Therefore, we had to first define the ground level around the building models which was done by visual estimation.
5.4. Result and Evaluation
Table 3 contains the manual and automated estimations of the footprint area for the eight BIM models described in Figure 7. The different automated area calculation methods enabled assessment of models with varying complexity in design and varying IFC object content. Automated Area Method A1 was employed for all eight buildings. For the remaining automated methods, we could only estimate the footprint area where the designer had added an IfcSpace object for estimating the footprint area. For manual estimations, we relied on figures from the municipality responsible for the building permission application or the company that produces the prefabricated residence buildings.
Models #1 and #2, both 1.5 storey dwellings, were measured manually and with automated Area Method A1. The results differ by 0.8%, likely due to difficulties in filtering and subtracting the area associated with open entrance canopies that should not be included in the building footprint. Model #3, a simple two-storey dwelling, produced consistent results when tested with Area Methods A1 and A2. Model #4, a complex seven-storey flatted residential building, was tested manually and with Area Method A1. For this model, it was required that the relevant IfcSlab objects were filtered out from other slab objects in the model. Furthermore, the model has a basement storey and the ground level around the building needed to be approximated for the measurement of the footprint area. Both the approximation of the ground level and the filtering of building objects may have affected the difference between manual and automatic calculation (0.4%). For Models #5 and #6, both single-storey school buildings, the ground level had to be approximated to find the lowest point of the wall elements. A filtered selection of IfcSlab objects had to been done for Model #6. Model #7, a two-storey dwelling, was tested with Area Methods A2 and A3. Both delivered the same result (110.10 m2). Model #8, a complex villa with multiple levels and open underbuilding, presented a unique challenge. Area Method A1 was utilised with the area geometry automatically generated based on IFC envelop objects. Various IfcSlab objects and IfcWall objects not representing the building area had to be filtered out.
The calculation of area with the different FME scripts and with the manually calculated area differs by no more than 1%. The difference between the area calculations made by the different scripts does not differ more than 1% for any of the models. This tells us that the automated methods tested are robust and within a low tolerance margin. Automation in checking compliance of proposed building areas against those permissible can speed up building permission application assessment.
6. Study of General Maintenance of the Character in a Built-Up Area
6.1. Legal Rules for Maintaining the Area Characteristics
One property criterion for the detailed development plan is “Design provisions for construction work, facade decorations, materials and colours on construction works and types of buildings. The design may be linked to a desire for a particular expression on buildings or areas”. This criterion is difficult to check with automated methods; however, by integrating BIM and geospatial data, planned buildings can be visualised in a 3D city model to aid decisions related to visual criteria in the building permission process. It should, however, be noted that there are criteria related to visual impact that can be classified as quantitative criteria and checked with automated methods. One example is when facades must have a specific colour or material.
6.2. Feasibility Study and Evaluation
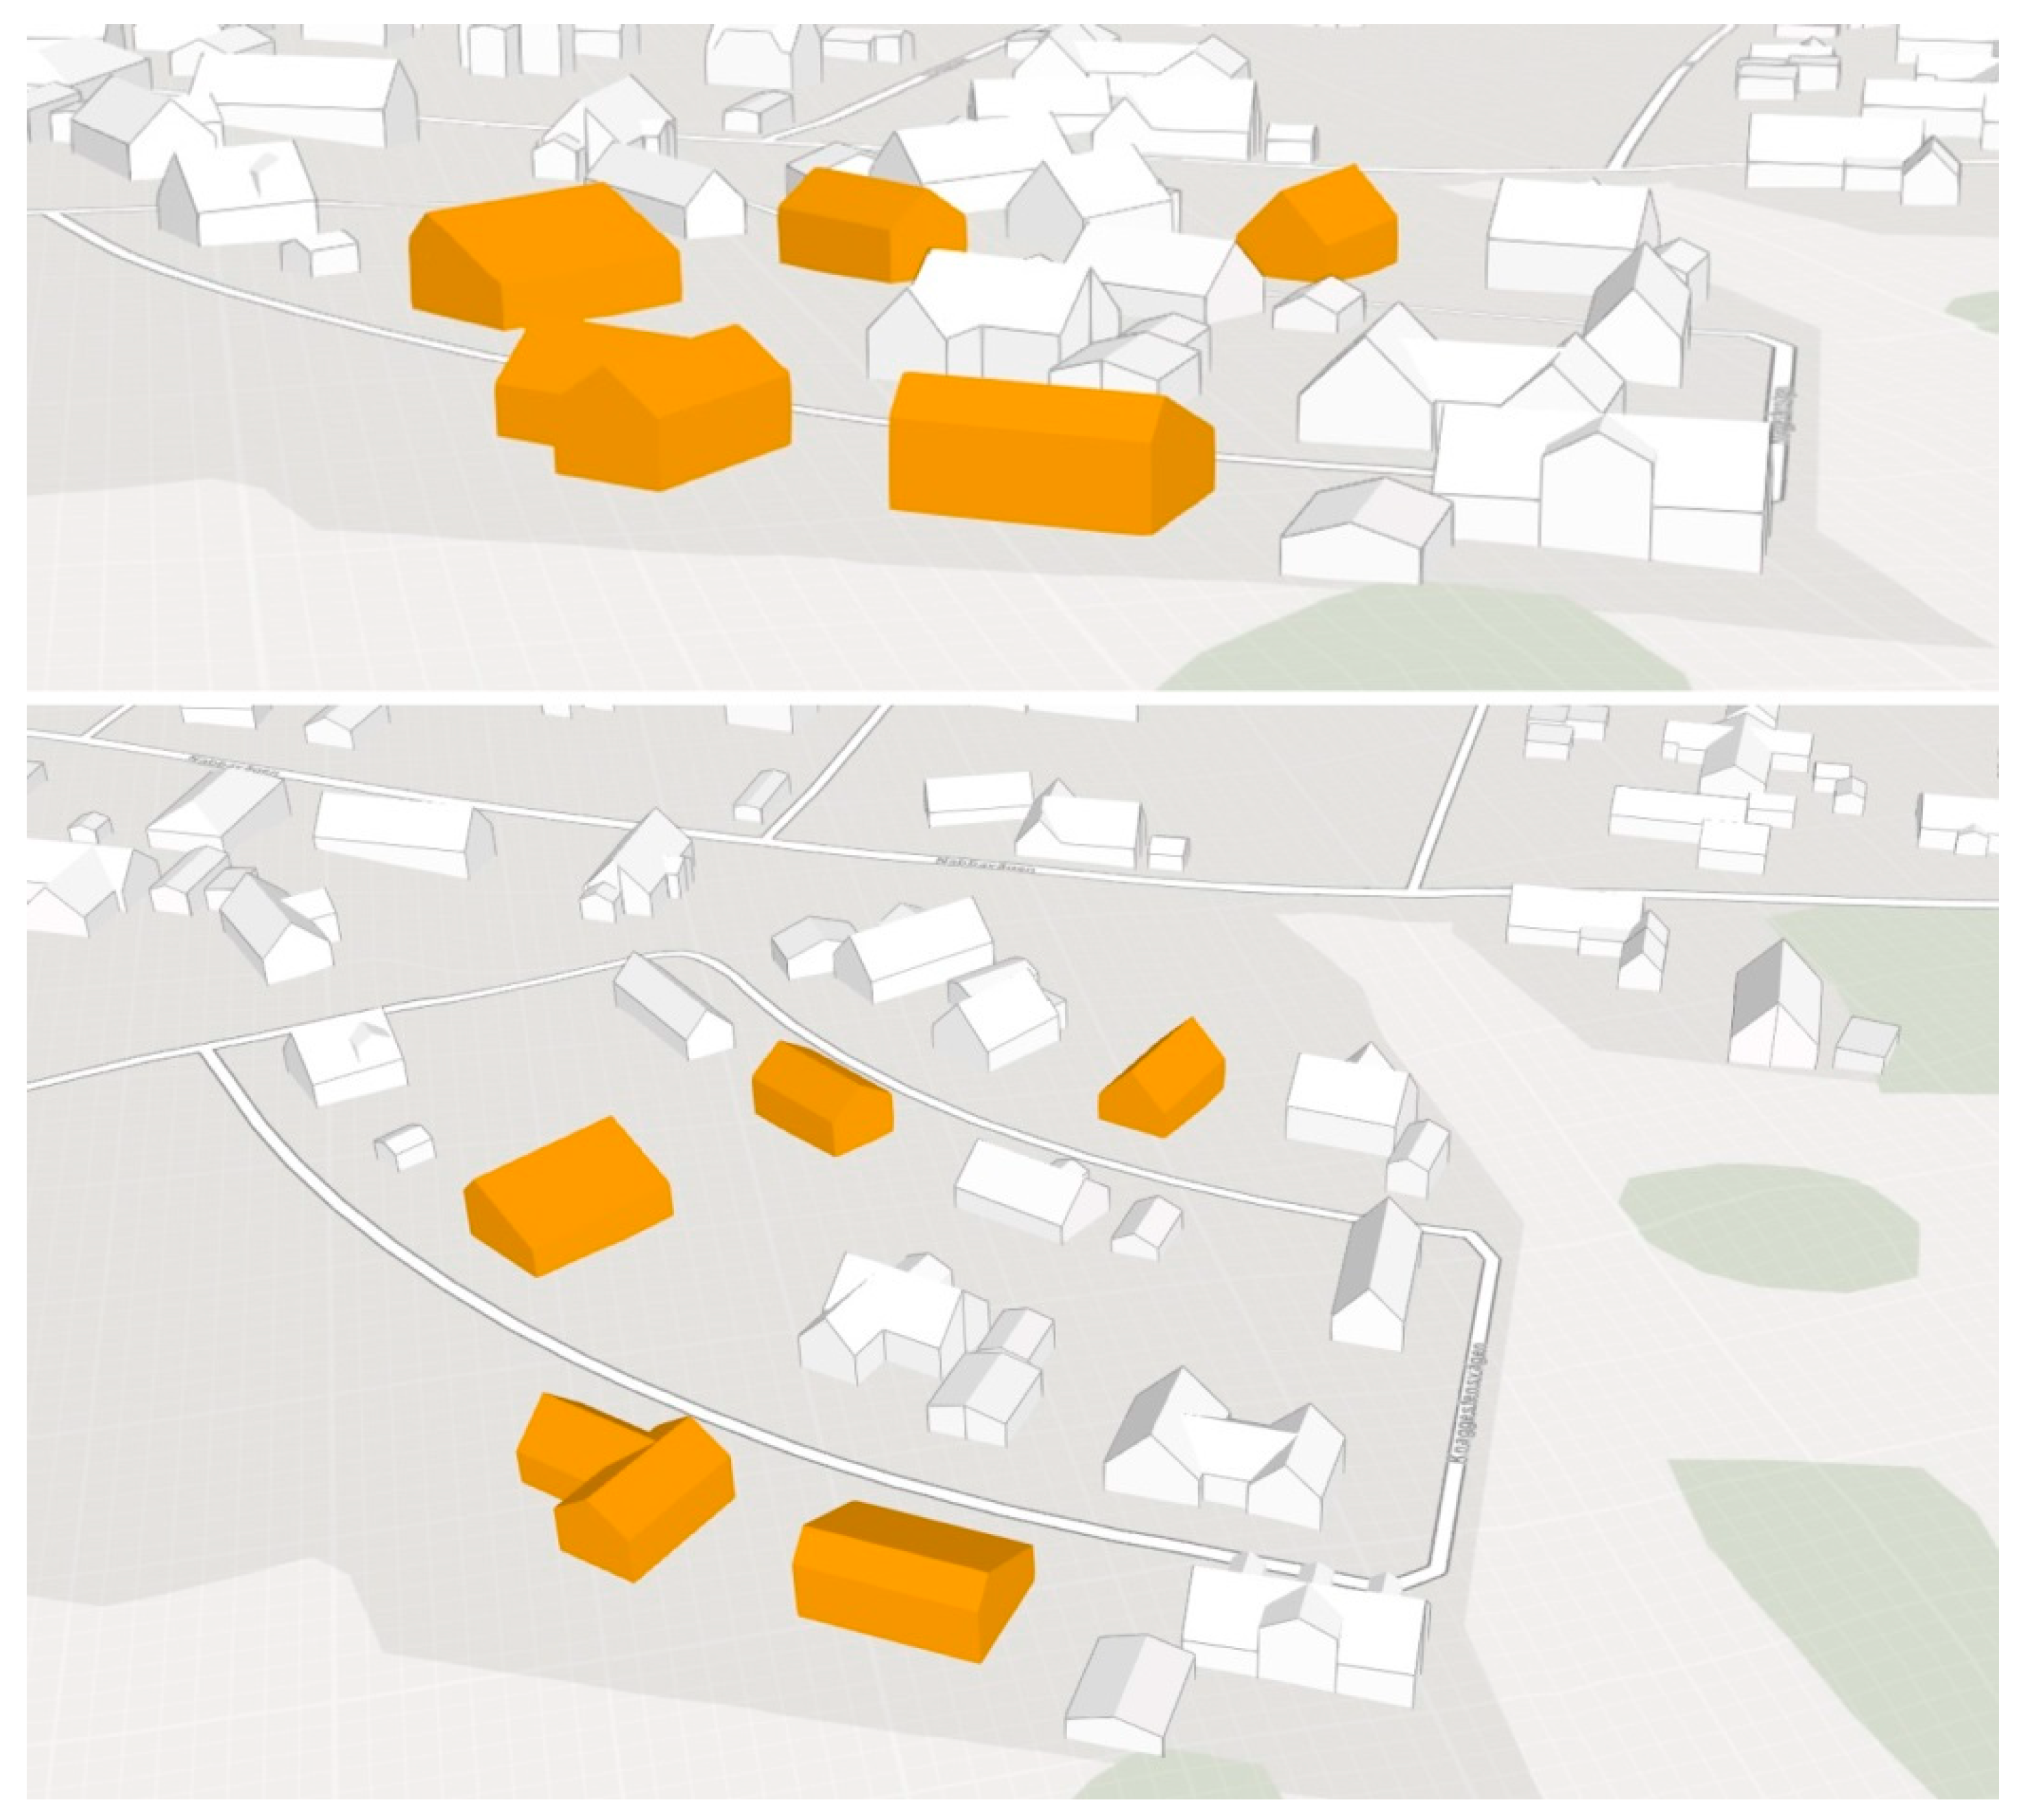
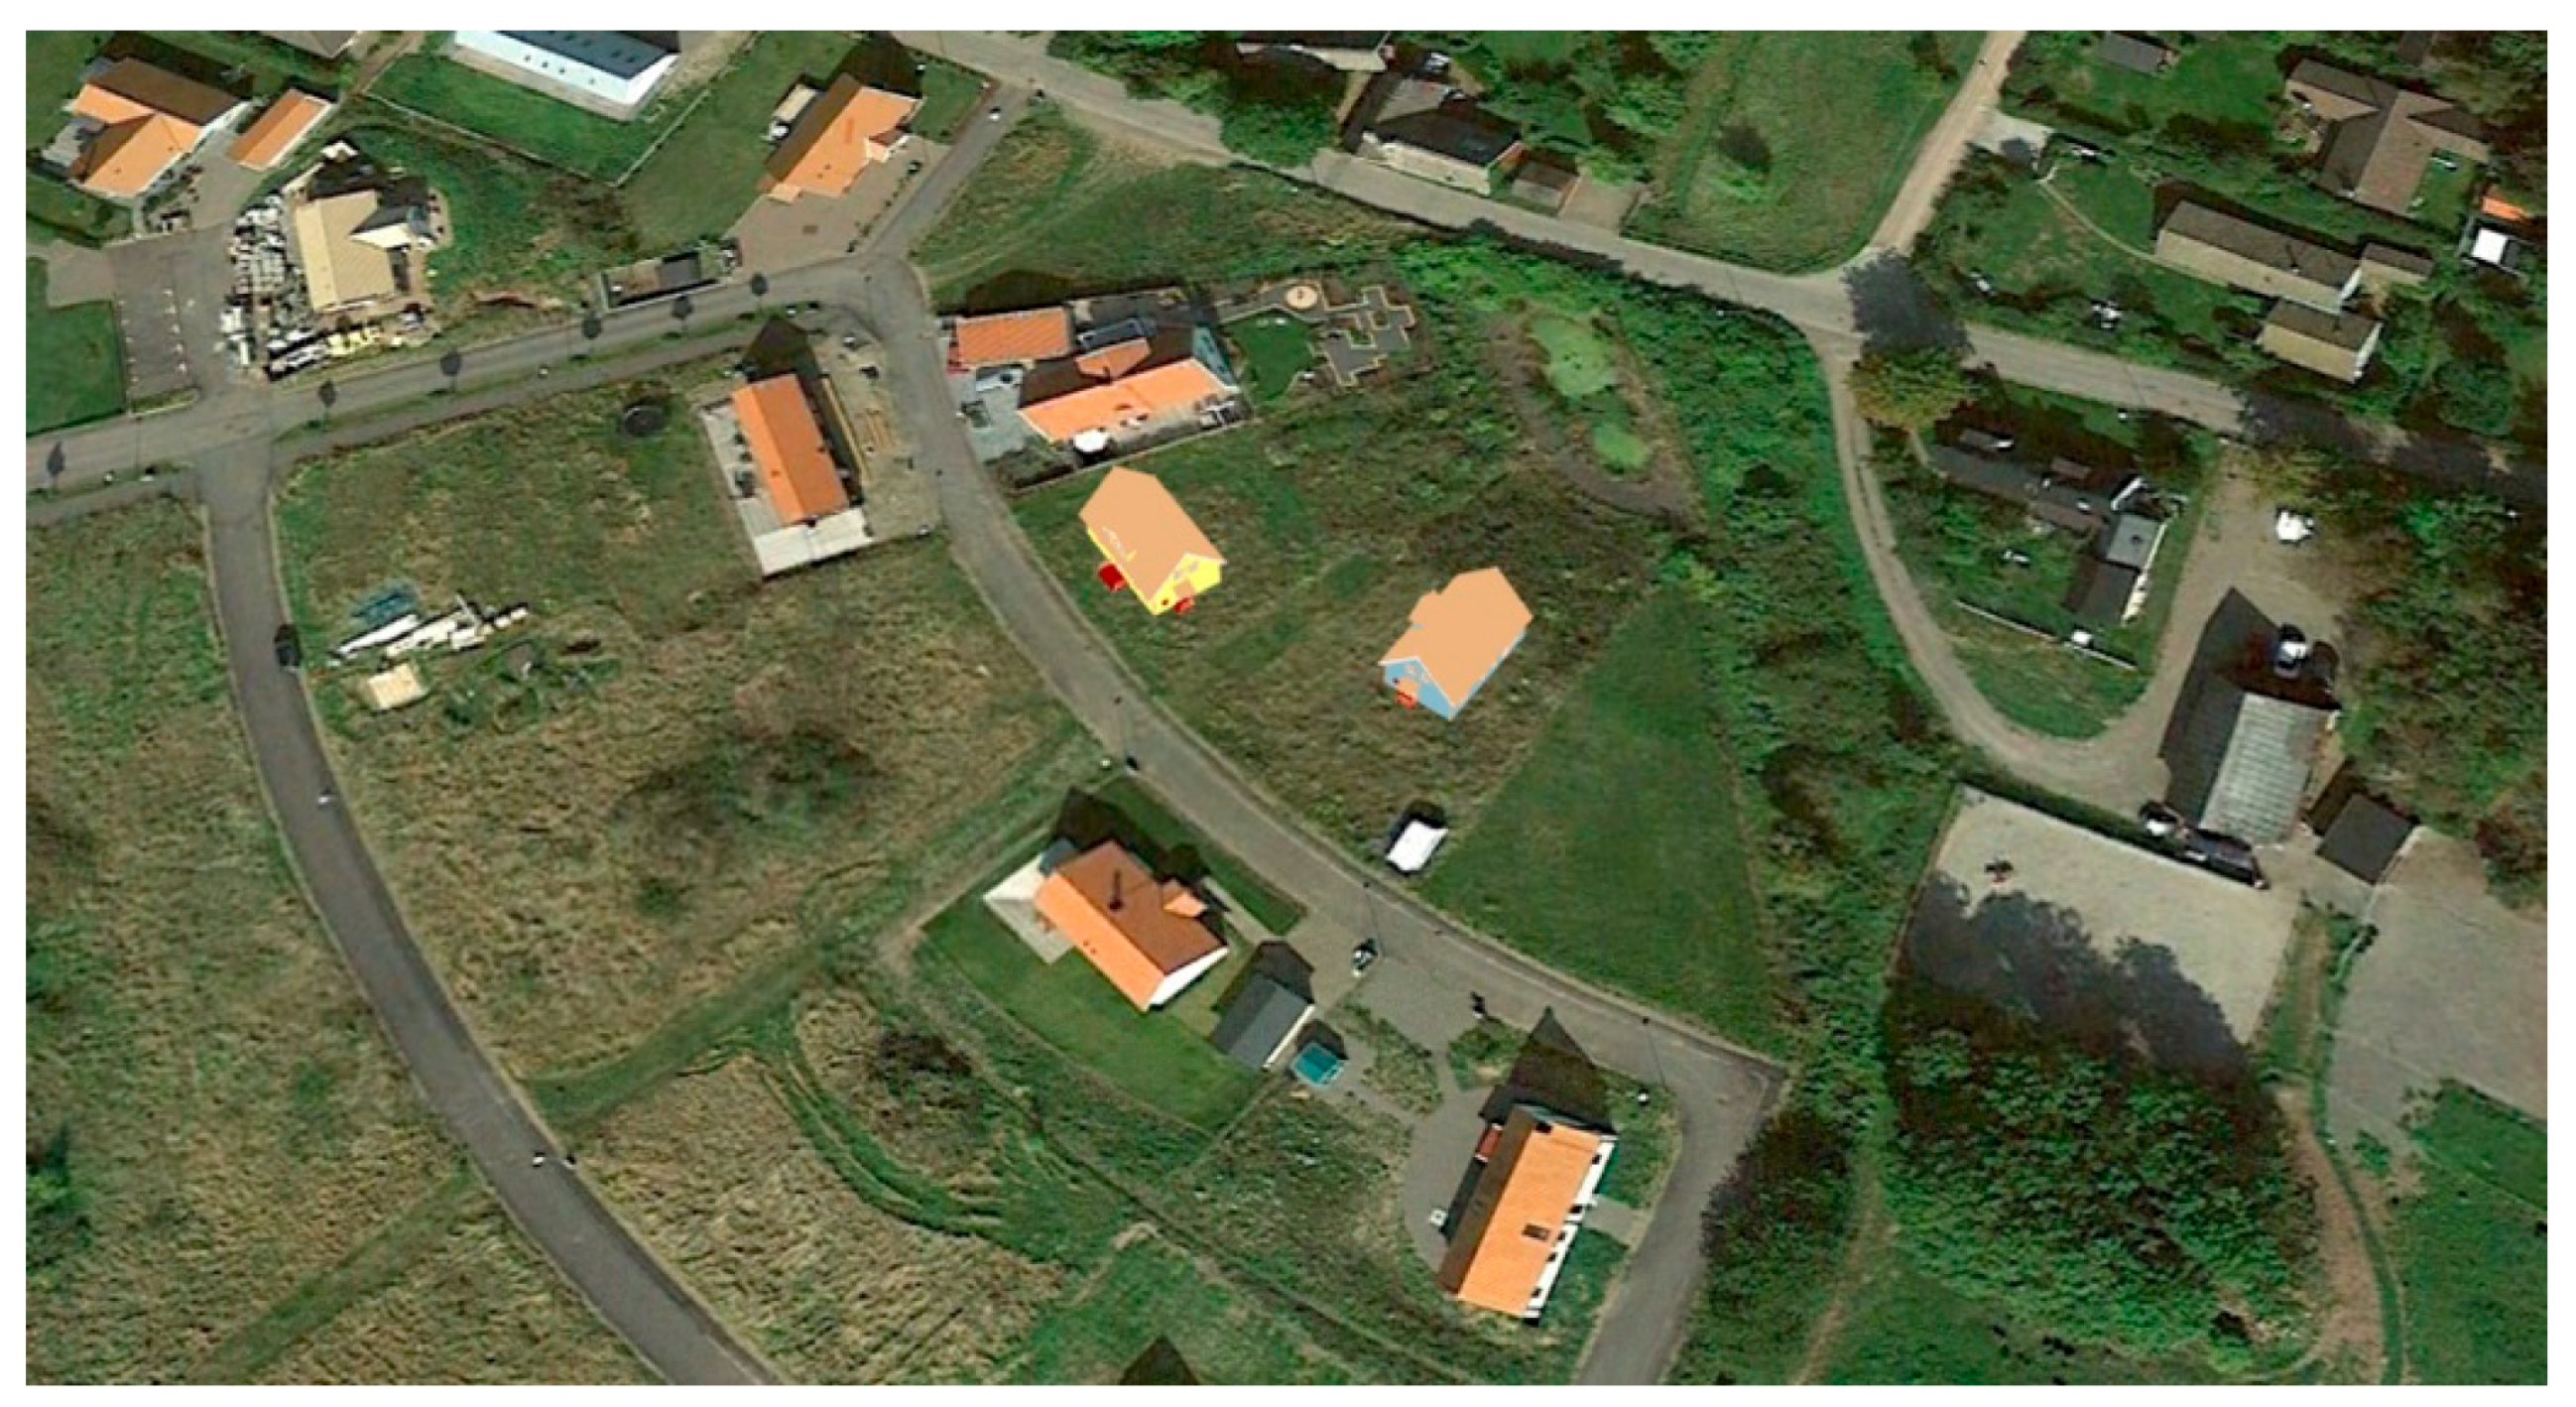
For the visual rule checking, we did not have access to good photorealistic models of our study area. Therefore, this part was only a feasibility study. In the test, we used a municipality service for a 3D city model in symbolic representation (LOD2) (Figure 8) and the photorealistic city model was from Google Earth (Figure 9). The BIM model in Section 4 was used as well as BIM Models #1 and #2 in Section 5 (Figure 7 and Figure 8). These building models were simplified to a geodata representation (solid LOD2 CityGML) and imported and visualised in the two city models. In addition, two buildings were combined into a t-shaped building to increase the variability between building models.
The main question is which type of visualisation, symbolic or photorealistic, that best supports the visual rule checking. The example studied here concerns the general maintenance of the character in a built-up area. For this requirement, the symbolic representations used in Figure 8 are not completely sufficient (but still have the advantage of viewing 2D drawings which is often used today). What is missing is e.g., colour of the buildings and roofs, materials, etc.; this type of information is lacking in the city model and the new building objects used in this study. The photorealistic example in Figure 8 has the shortcoming that it does not support a ground-based view and is therefore hard to evaluate.
7. Discussion
In this study, we demonstrate the potential to automate parts of the building permission process by integrating BIM and geospatial data to check if a planned building complies with quantitative regulations given in a detailed development plan (in accordance with Figure 1). The large number of quantitative criteria identified in the list of allowed criteria for detailed development plans (Table 1) suggests that there is a great potential to automate large parts of the building permission process.
The main focus in the study was the analytical rule checking step. In the first test case, it is demonstrated how the building height of a planned building can be derived by integrating a BIM model and a DEM, and automatically check whether the derived height is within the maximum height according to a detailed development plan in digital form. Complete and comprehensive definitions of the building height are, however, required to enable a fully automated check. In the first location tested, the building was too high according to the regulations in the detailed development plan when the height was calculated according to Height Method A (Figure 4) regardless of orientation since the height is always derived from the highest facade. With current regulations (Height Method B; Figure 5), the orientation of the building determines if it is allowed to be built or not on the tested site. The main limitation with Height Method B from an automation point of view is, however, that the decision to include or exclude the dormer when defining the 45-degree plane is what decides if the building complies to the rules or not. This means that a manual check has to be performed to decide whether the dormer should be included, which increases the risk of inconsistent decisions.
This study also shows that automated methods could be applied to calculate the building footprint area with high accuracy for all tested BIM models which is also directly linked to calculations of the level of densification in urban areas. Calculations of building footprint area of less complex BIM models only require the basic IFC elements (IfcBuildingStorey, IfcWall, IfcWallStandardCase and IfcSlab) representing the storeys, walls and floors of a building. For buildings with protruding building parts additional IFC elements might be required. Furthermore, area calculations often require information about the ground level where the building will be situated, which could be provided by integrating the BIM model with geospatial data.
Furthermore, a minor feasibility study is performed of visual rule checking. It is shown how integration of BIM and geospatial data for visualisation purposes can assist decisions related to visual criteria in the building permission process. A major advantage with a 3D visualisation is that such models can be used to visualise planned buildings, or larger projects, to the general public where it is likely that viewers are less experience in reading 2D maps and drawings. A main question is what type of city model that would be required for the visual rule checking. The symbolic representation used in Figure 8 is not sufficient for checking the general maintenance of the character in a built-up area. To support checking of this type of requirement, a photorealistic, or combined symbolic and photorealistic, representation would be required. However, such visualisation is not always feasible. The situation in Sweden today is that municipalities have symbolic LOD2 for central parts of the cities (LOD1 for remaining parts). In some cases, there are façade images, but this is not the general case. Some municipalities complement their city model with their own street view images. These images can be used to see the general character of an area without field visit (see, e.g., [45] for possible usage of these images), but this data material does not allow the inclusion of new buildings. To conclude, most Swedish municipalities do not have sufficiently good data (for most regions) to support all visual rule checking required in the building permit process.
The rule checking in our studies has resemblance with some previous work especially with [6] and [22]. The main difference with the work by Brasebin et al. [6] is that they work with a simple building model (somewhat simplified, an extruded building footprint) while our studies work with complete BIM models. It would be interesting to combine our approach with the BIM models with their use of more formalised rule checking (using the Object Constraint Language, OCL, [23]). The rule checking in van Berlo [22] is proposed to be performed in a BIM environment (using tools such as Solibri Model Checker). This approach requires that the situation plan as well as the digital development plan are converted to a BIM environment (e.g., in the IFC format). Our study is based on the approach to import the BIM models, of the new buildings, into a geospatial data environment (the ETL tool Feature Manipulation Engine, FME). The advantage with performing the rule checking in a BIM environment is that the architects could more easily perform their own rule checking before they submit the building permission application, since the architects are familiar with the BIM environments. The advantage with our approach is that the municipalities that perform the legal check of the regulations are more familiar with the geospatial data environments than with BIM environments (at least this is the case in Sweden). Whether it is better to perform the rule checking in a BIM or geospatial environment is also dependent on quality considerations. The question is whether there are more uncertainties induced when converting BIM data to the geospatial environment or vice versa. We have not studied this issue in our study and leave this to further studies.
Another related report is Kalantari [46], where a system architecture based on open standards with functionality to convert an IFC model to CityGML and with OGC Web Processing Services (WPS) for calculating and checking, e.g., building height and building footprint area as a web service, is described. In the report, the building height calculations are not described and no DEM is included to derive the building height. The concept of utilising open standards and web services for the rule checking process is, however, interesting and can be utilised both by the building designers at an early stage and by the municipalities during the building permission process.
One difficulty when integrating BIM and geospatial data is the flexibility of the IFC data model. This flexibility allows designers to create IFC models for a wide range of applications across industry domains and locations worldwide [47]. At the same time, the flexibility results in large differences in how buildings can be modelled (e.g., Zhang et al. [48]). As an example, to facilitate the identification of external walls the property, IsExternal can be set to True for external walls, but this is not required. If the property is missing, the value of, e.g., the attribute Name, might help to identify external walls but, this might be given in a local language, and there are also models where there is no indication if walls are external or internal. Furthermore, walls are modelled and connected differently from a geometric perspective in different IFC models making it difficult to implement a general method to extract external walls.
To support an automated building permission process, rules on how to create the IFC model should be defined. This could, e.g., be realised with validated Model View Definitions (MVD; [47]) for the building permission process. The MVD defines the IFC sub-set of relevant IFC objects and property sets required to check all quantitative and visual aspects relevant to the building permission process. The requirements of the MVD can be described as Exchange Requirements (ER) in an Information Delivery Manual, IDM [49]. Studies have been conduction on how to design MVDs from requirements and how to test if an IFC model is valid according to an MVD. Lee el al. [50] suggested a method to include ontologies to create an MVD, and Zhang et al. [48] implemented a prototype to validate IFC models against MVDs. Solihin et al. [51] developed a methodology to estimate the quality of an IFC model, including suggested rules for estimating completeness and correctness of an IFC model. To facilitate an automated process a building permission MVD with strict requirements about how to create the IFC model could be defined. If only IFC models that conform to the building permission MVD are accepted for fully automated processing of the building permit it could act as an incentive for building designers to follow the MVD specifications.
For the calculations of the building height, the major limitation in this study was the currently ambiguous regulations. However, it would be a major advantage for the height calculations if the outer walls can be easily identified, which could be fulfilled by requiring that the property IsExternal (mentioned above) is set. For the area calculations, on the other hand, the differences between how the IFC models were modelled were a major limitation. Hence, it would be desirable that instructions are available to ensure that IFC models are created according to the measurement rules in the standard area and volume for house buildings. On a more detailed level, a requirement could be that the IfcSlab objects that represent the building foundation are identifiable. In Area Method A1, it is assumed that all IfcSlab objects connected to the first building storey are the slabs representing the building foundation. However, IfcSlab can represent other building parts besides floors and foundations. In addition, it is not certain that the slabs connected to the first storey are the correct representation of the ground floor which introduces uncertainties in the area calculations. Another requirement could be that items that are not considered as measurable protruding parts according to area standard can be easily distinguished from other objects in the IFC model. An alternative would be to require that the models include information in terms of variables or objects that represent the building area. However, this requires that the person who creates the model knows which rules apply to the calculation of the building area and that responsibility of data correctness is legally defined. In addition, for visualisation purposes, requirement on appearances on an IFC model could be defined to create more realistic visualisations.
All rule checking in this study could be performed on a building model of LOD3. This implies that a BIM model is not required. An alternative to including a BIM model with the building permission process would be to include a CityGML LOD3 model. To ensure that such an LOD3 model contains sufficient details for the rule checking it must be defined how to design the model since the LOD levels in CityGML are somewhat ambiguous [52]. More technical building regulations must still be checked against a BIM model but that could be performed with proprietary model checking tools such as Solibri Model Checker (Solibri Inc., Helsinki, Finland) in a separate process before the building is checked against regulations in the detailed development plan.
In our study, we present deviations in footprint areas derived with different methods. For the building height calculations, on the other hand, no estimates of uncertainties were done. In a future study, it would be interesting to study how the spatial resolution of the DEM influences the height calculations but, in this study, only the DEM with 2 m spatial resolution from the National Survey of Sweden was available. We did, however, calculate the mean ground level based on different numbers of points along the walls of the building to get an indication on how spatial resolution influences the result. Figure 10 shows the points used to calculate the mean ground level when 16 points were evenly distributed along the perimeter of the building as stated in [44]. We calculated the mean ground level based on 10–22 points, in intervals of two points. The difference between the lowest and highest mean ground levels was 4 cm indicating that the spatial resolution of the DEM would have low influence in this area. However, for larger buildings and in areas with larger differences in ground elevation it is likely that the spatial resolution of the DEM has a larger impact on the result.
Another concern when integrating BIM and geospatial data is the transformation from the local Cartesian coordinate system (engineering system) of the BIM model to the geodetic reference system (projected) of the geospatial data. The current version IFC 4 [53] supports georeferencing of BIM models by defining a point and a direction in the geodetic reference system. This information support simple translation and rotation of BIM models for georeferencing. This transformation is often sufficient for buildings (since they have a small spatial extent and the regulations about, e.g., building heights, allows uncertainties up to 10 cm [44]) but is insufficient for larger constructions with higher data quality demands (cf. [54]). In a broader perspective, it has been shown that for spatial analyses performed on entire cities the geometric accuracy of the building models has a larger impact on the result than the level of detail of the buildings [28].
We foresee two types of practical usage of automatic rule checking. One usage group is the building permit applicants who can do their own tests if the new building fulfils the requirements of the detailed development plan. The second usage group is the building permission administrators at the municipalities. For both cases, an intuitive human-cantered tool (see example in [55]) would be required. One thing that we think would be necessary is that the result is visually presented. For example, instead of only presenting the result of the building height calculation, the user should also be informed, e.g., which is the main façade in the computations, and if any dormer is included in the height calculation.
8. Conclusions
This study demonstrates how parts of the building permission process in Sweden, and in a wider context, can be automated by integrating BIM and geospatial data. In addition, the inventory performed shows that the majority of the criteria for detailed development plans are quantitative, suggesting that the building permission process to a large extent can be automated.
However, a fully automated permission process requires comprehensive definitions of the regulations which was demonstrated in the calculations of the building height where the decision to include or exclude the dormer when calculating the building height could be the difference between approval and rejection of a building permit. Furthermore, to support the visual rule checking there is a need for good photorealistic city models.
Another important conclusion is that comprehensive rules for how to create and validate optimal IFC models would facilitate an automated building permission process, which was demonstrated in the calculations of the building footprint area. Such rules could be realised with model view definitions for IFC models used for building permission processes.
Furthermore, it is illustrated how BIM and geospatial data can be integrated to support decisions in the building permission process related to visual criteria.
Author Contributions
L.H and P.O. led the writing of the manuscript; L.H. and J.A. performed the inventory in Section 3; P.O. implemented the methods in Section 4 (building height) and wrote the section; J.A. implemented the methods in Section 5 (building area) and wrote the section together with M.H.; P.O. simplified the building models in Section 6 (visualisation) and wrote the section together with L.H.; and M.H. created the IFC model used in Section 4 and Section 6, supervised J.A. in the area calculations (Section 5) and was active in the writing of the manuscript including language improvements.
Funding
This research was funded by Vinnova through the project Får Jag Lov (grant number 2016-03836); Vinnova, Formas and Energimyndigheten through the project Smarta plan-, bygg-och förvaltning-och nyttjandeprocesser över hela livscykeln (grant number 2016-01997); and Lund University.
Acknowledgments
Höganäs kommun (with support from Geosecma) provided the detailed development plan as well as assisted us with the import of the buildings into their 3D city model. We also thank Hjältevadshus, KTH, Lunds kommun and NCC for providing BIM models and Lantmäteriet for providing the DEM (Dnr: I2014/00579). Ideas and comments from Boverket are acknowledged. Financial support from Vinnova through the project Får Jag Lov? (2016-03836) and Lund University are acknowledged.
Conflicts of Interest
The authors declare no conflict of interest.
References
- Boverket. Får Jag Lov? 2018. Available online: https://www.boverket.se/sv/byggande/uppdrag/far-jag-lov/ (accessed on 27 May 2018).
- Hjelseth, E.; Nisbet, N. Capturing Normative Constraints by Use of the Semantic Mark-Up RASE Methodology (Proc., CIB W78 2011). Rotterdam, The Netherlands 2011: Conseil International du Bâtiment (CIB). Available online: http://2011-cibw078-w102.cstb.fr/papers/Paper-45.pdf (accessed on 30 May 2018).
- Beach, T.H.; Rezgui, Y.; Li, H.; Kasim, T. A rule-based semantic approach for automated regulatory compliance in the construction sector. Expert Syst. Appl. 2015, 42, 5219–5231. [Google Scholar] [CrossRef] [Green Version]
- Lee, H.; Lee, J.-K.; Park, S.; Kim, I. Translating building legislation into a computer-executable format for evaluating building permit requirements. Autom. Constr. 2016, 71, 49–61. [Google Scholar] [CrossRef]
- Malsane, S.; Matthews, J.; Lockley, S.; Love, P.E.D.; Greenwood, D. Development of an object model for automated compliance checking. Autom. Constr. 2015, 49, 51–58. [Google Scholar] [CrossRef]
- Brasebin, M.; Perret, J.; Mustière, S.; Weber, C. A Generic Model to Exploit Urban Regulation Knowledge. ISPRS Int. J. Geo-Inf. 2016, 5, 14. [Google Scholar] [CrossRef]
- Gröger, G.; Kolbe, T.H.; Nagel, C.; Häfele, K.-H. OGC City Geography Markup Language (CityGML) Encoding Standard, Version 2.0; OGC Doc No. 12-019; Open Geospatial Consortium. Available online: http://www.opengeospatial.org/standards/citygml (accessed on 30 May 2018).
- Gröger, G.; Plümer, L. CityGML—Interoperable semantic 3D city models. ISPRS J. Photogramm. Rem. Sens. 2012, 71, 12–33. [Google Scholar] [CrossRef]
- Kolbe, T.H. Representing and exchanging 3D city models with CityGML. In 3D Geo-Information Sciences; Zlatanova, S., Lee, J., Eds.; Springer: Berlin/Heidelberg, Germany, 2009; pp. 15–31. [Google Scholar]
- INSPIRE. D2.8.I.6 INSPIRE Data Specification on Cadastral Parcels—Guidelines; INSPIRE Thematic Working Group Cadastral Parcels; European Union: Brussels, Belgium, 2009. [Google Scholar]
- INSPIRE. D2.8.III.4 Data Specification on Land Use—Draft Guidelines; NSPIRE Thematic Working Group Land Use; European Union: Brussels, Belgium, 2012. [Google Scholar]
- Donkers, S.; Ledoux, H.; Zhao, J.; Stoter, J. Automatic conversion of IFC datasets to geometrically and semanticaly correct CityGML LOD3 buildings. Trans. GIS 2016, 20, 547–569. [Google Scholar] [CrossRef]
- Abdul-Rahman, A.; Pilouk, M. Spatial Data Modelling for 3D GIS, 2D and 3D Spatial Data Representations; Springer: Berlin, Germany, 2007. [Google Scholar]
- Kang, T. Development of a Conceptual Mapping Standard to Link Building and Geospatial Information. ISPRS Int. J. Geo-Inf. 2018, 7, 162. [Google Scholar] [CrossRef]
- Isikdag, U.; Zlatanova, S. Towards Defining a Framework for Automatic Generation of Buildings in CityGML Using Building Information Models. In 3D Geo-Information Sciences; Lee, J., Zlatanova, S., Eds.; Springer: Berlin, Germany, 2009; pp. 79–97. [Google Scholar]
- De Laat, R.; van Berlo, L. Integration of BIM and GIS: The Development of the CityGML GeoBIM Extension. In Advances in 3D Geo-Information Sciences. Lecture Notes in Geoinformation and Cartography; Kolbe, T., König, G., Nagel, C., Eds.; Springer: Berlin/Heidelberg, Germany, 2011. [Google Scholar]
- El-Mekawy, M.; Östman, A.; Hijazi, I. An Evaluation of IFC-CityGML Unidirectional Conversion. Int. J. Adv. Comput. Sci. Appl. 2012, 3, 159–171. [Google Scholar] [CrossRef]
- Arroyo Ohori, K.; Biljecki, F.; Diakité, A.; Krijnen, T.F.; Ledoux, H.; Stoter, J. Towards an integration of GIS and BIM data: What are the geometric and topological issues? ISPRS Ann. Photogramm. Remote Sens. Spat. Inf. Sci. 2017, 4, 1–8. [Google Scholar] [CrossRef]
- Jusuf, S.K.; Mousseau, B.; Godfroid, G.; Hui, V.S. Integrated modeling of CityGML and IFC for city/neighborhood development for urban microclimates analysis. Energy Proc. 2017, 122, 145–150. [Google Scholar] [CrossRef]
- Floros, G.; Pispidikis, I.; Dimopoulou, E. Investigating integration capabilities between IFC and citygml LOD3 for 3D city modelling. Int. Arch. Photogramm. Remote Sens. Spat. Inf. Sci. 2017, 4, 1–6. [Google Scholar] [CrossRef]
- Olsson, P.-O. Conversion of an IFC-model to a lod2-3 3D-GIS building model. In Proceedings of the AGILE Conference, Lund, Sweden, 12–15 June 2018. [Google Scholar]
- Van Berlo, L.; Dijkmans, T.; Stoter, J. Experiment for Integrating Dutch 3D Spatial Planning and BIM for Checking Building Permits. ISPRS Ann. Photogramm. Remote Sens. Spat. Inf. Sci. 2013, II-2/W1, 279–284. [Google Scholar] [CrossRef]
- Warmer, J.; Kleppe, A. The Object Constraint Language: Precise Modeling with UML; Addison-Wesley Longman Publishing Co., Inc.: Boston, MA, USA, 1999. [Google Scholar]
- Benner, J.; Geiger, A.; Häfele, K.-H. Concept for Building Licensing Based on Standardized 3D Geo Information. In Proceedings of the 5th International 3D GeoInfo Conference, Berlin, Germany, 3–4 November 2010. [Google Scholar]
- Eastman, C.; Lee, J.-M.; Jeong, Y.-S.; Lee, J.-K. Automatic rule-based checking of building designs. Autom. Constr. 2009, 18, 1011–1033. [Google Scholar] [CrossRef]
- Zhang, J. A logic-based representation and tree-based visualization method for building regulatory requirements. Vis. Eng. 2017, 5, 2. [Google Scholar] [CrossRef]
- Pauwels, P.; De Farias, T.M.; Zhang, C.; Roxin, A.; Beetz, J.; De Roo, J.; Nicolle, C. A performance benchmark over semantic rule checking approaches in construction industry. Adv. Eng. Inform. 2017, 33, 68–88. [Google Scholar] [CrossRef]
- Biljecki, F.; Heuvelink, G.B.M.; Ledoux, H.; Stoter, J. The effect of acquisition error and level of detail on the accuracy of spatial analyses. Cartogr. Geogr. Inf. Sci. 2018, 45, 156–176. [Google Scholar] [CrossRef]
- Collinson, A. Virtual Worlds. Cartogr. J. 1997, 34, 117–124. [Google Scholar] [CrossRef]
- Wilkening, J.; Fabrikant, S.I. How do decision time and realism affect map-based decision making? In Spatial Information Theory, Proceedings of the 10th International Conference, COSIT 2011, Belfast, ME, USA, 12–16 September 2011; Egenhofer, M., Ed.; Springer: Berlin/Heidelberg, Germany, 2011; pp. 1–19. [Google Scholar]
- Häberling, C.; Bär, H.; Hurni, L. Proposed Cartographic Design Principles for 3D Maps: A Contribution to Extended Cartographic Theory. Cartographica 2008, 43, 175–188. [Google Scholar] [CrossRef]
- Smallman, H.S.; St John, M. Naïve realism: Misplaced faith in realistic displays. Ergon. Des. 2005, 13, 6–13. [Google Scholar] [CrossRef]
- Zanola, S.; Fabrikant, S.I.; Cöltekin, A. The effect of realism on the confidence in spatial data quality in stereoscopic 3D displays. In Proceedings of the 24th International Cartographic Conference, Santiago, Chile, 15–21 November 2009. [Google Scholar]
- Semmo, A.; Trapp, M.; Jobst, M.; Döllner, J. Cartography-Oriented Design of 3D Geospatial Information Visualization—Overview and Techniques. Cartogr. J. 2015, 52, 95–106. [Google Scholar] [CrossRef]
- Peters, S.; Jahnke, M.; Murphy, C.E.; Meng, L.; Abdul-Rahman, A. Cartographic Enrichment of 3D City Models—State of the Art and Research Perspectives. In Advances in 3D Geoinformation. Lecture Notes in Geoinformation and Cartography; Abdul-Rahman, A., Ed.; Springer: Cham, Switzerland, 2017. [Google Scholar]
- Mao, B.; Harrie, L. Methodology for the efficient progressive distribution and visualization of a 3D city model 3D building objects. ISPRS Int. J. Geo-Inf. 2016, 5, 418–446. [Google Scholar] [CrossRef]
- Kada, M. Generalisation of 3D Building Models by Cell Decomposition and Primitive Instancing. In Proceedings of the Joint ISPRS Workshop on Visualization and Exploration of Geospatial Data, Stuttgart, Germany, 29–30 June 2007. [Google Scholar]
- Fan, H.; Meng, L. A three-step approach of simplifying 3D buildings. Int. J. Geoinf. Sci. 2012, 26, 1091–1107. [Google Scholar] [CrossRef]
- Baig, S.U.; Abdul-Rahman, A. Generalization of buildings within the framework of CityGML. Geo-Spat. Inf. Sci. 2013, 16, 247–255. [Google Scholar] [CrossRef] [Green Version]
- Neuville, R.; Pouliot, J.; Poux, F.; de Rudde, L.; Billen, R. A Formalized 3D Geovisualization Illustrated to Selectivity Purpose of Virtual 3D City Model. ISPRS Int. J. Geo-Inf. 2018, 7, 194. [Google Scholar] [CrossRef]
- Lemmen, C.; van Oosterom, P.; Bennett, R. The Land Administration Domain Model. Land Use Policy 2015, 49, 535–545. [Google Scholar] [CrossRef]
- Kalogianni, E.; Dimopoulou, E.; Quak, W.; Germann, M.; Jenni, L.; van Oosterom, P. INTERLIS Language for Modelling Legal 3D Spaces and Physical 3D Objects by Including Formalized Implementable Constraints and Meaningful Code Lists. ISPRS Int. J. Geo-Inf. 2017, 6, 319. [Google Scholar] [CrossRef]
- Boverket. Rapport 2014:4, Uppdrag Att Utreda Definitioner på Byggnadshöjd, Nockhöjd, Totalhöjd, Vind, Suterrängvåning Och Källare. Available online: http://www.regelradet.se/wp-content/files_mf/14043797672014_137_Definitioner.pdf (accessed on 27 May 2018).
- Boverket. Rapport 2016:30, Regeringsuppdrag. Exempel på Reglering av Byggnadsverks Höjder Och Våningsantal. Uppdrag Att ta fram Förslag till Författningsreglering Avseende Vissa Centrala Termer Som Behövs vid Tillämpningen av Plan-Och Bygglagen (2010:900). Available online: https://www.boverket.se/contentassets/f92bd42827524152bf66e6fbb7c75351/exempel-pa-reglering-av-byggnadsverks-hojder-och-vaningsantal.pdf (accessed on 27 May 2018).
- Li, X.; Zhang, C.; Li, W.; Ricard, R.; Meng, Q.; Zhang, W. Assessing street-level urban greenery using Google Street View and a modified green view index. Urban For. Urban Green. 2015, 14, 675–685. [Google Scholar] [CrossRef]
- Kalantari, M. Future City Pilot 1—Automating Urban Planning Using Web Processing Service Engineering Report. Open Geospatial Consortium, 20 October 2017. Available online: http://docs.opengeospatial.org/per/16-099.html (accessed on 26 June 2018).
- BuildingSMART, MVD Overview Summary. Available online: http://www.buildingsmart-tech.org/specifications/mvd-overview/mvd-overview-summary (accessed on 27 May 2018).
- Zhang, C.; Beetz, J.; Weise, M. Model view checking: Automated validation for IFC building models. In eWork and eBusiness in Architecture, Engineering and Construction: ECPPM, 2014; Mahdavi, A., Ed.; CRC Press: Vienna, Austria, 2014. [Google Scholar]
- BuildingSMART, Information Delivery Manuals. Available online: http://iug.buildingsmart.org/idms/ (accessed on 27 May 2018).
- Lee, Y.-C.; Eastman, C.M.; Solihin, W. An ontology-based approach for developing data exchange requirements and model views of building information modeling. Adv. Eng. Inform. 2016, 30, 354–367. [Google Scholar] [CrossRef]
- Solihin, W.; Eastman, C.; Lee, Y.-C. Toward robust and quantifiable automated IFC quality validation. Adv. Eng. Inform. 2015, 29, 739–756. [Google Scholar] [CrossRef]
- Biljecki, F.; Ledoux, H.; Stoter, J. An improved LOD specification for 3D building models. Comput. Environ. Urban Syst. 2016, 59, 25–37. [Google Scholar] [CrossRef] [Green Version]
- BuildingSMART, Industry Foundation Classes Release 4 (IFC4). Available online: http://www.buildingsmart-tech.org/ifc/IFC4/final/html/ (accessed on 27 May 2018).
- Uggla, G.; Horemuz, M. Geographic Capabilities and Limitations of IFC. Autom. Constr. 2018, in press. [Google Scholar]
- Rauschert, I.; Agrawal, P.; Sharma, R.; Fuhrmann, S.; Brewer, I.; MacEachren, A. Designing a human-centered, multimodal GIS interface to support emergency management. In Proceedings of the 10th ACM International Symposium on Advances in Geographic Information Systems, McLean, VA, USA, 8–9 November 2002; ACM: New York, NY, USA, 2002; pp. 119–124. [Google Scholar]
Figure 1.
Outline of the main steps in an automated building permission process.

Figure 2.
The three planes used to calculate the building height.

Figure 3.
Workflow of the building height calculation.

Figure 4.
The tested building placed in the same location in a detailed planning map but with different orientation (a,b). Green areas are areas where one is allowed to build, brown areas do not allow building, grey are roads and the red horizontal plane crossing the building is the maximum building height. (c) Contour lines with 1 m contour interval are included to give an overview of the topography in the area.

Figure 5.
The tested building placed in a location where it is lower than the highest allowed building height (a). Green areas are areas where building is allowed, brown areas do not allow building and grey are roads. The maximum allowed building height is added as a red horizontal plane crossing the building in (b) as an illustration. (c) Contour lines with 1 m contour interval are included to give an overview of the topography in the area.

Figure 6.
Architecture of the script developed to calculate building area.

Figure 7.
The eight BIM models used for area calculations: #1 Hjältevadshus Spira 168; #2 Hjältevadshus Spira 175; #3 Kamakura House; #4 Multihuset; #5 Nyvångsskolan F; #6 Nyvångsskolan H; #7 KTH demobuilding; and #8 Revit House.
Figure 7.
The eight BIM models used for area calculations: #1 Hjältevadshus Spira 168; #2 Hjältevadshus Spira 175; #3 Kamakura House; #4 Multihuset; #5 Nyvångsskolan F; #6 Nyvångsskolan H; #7 KTH demobuilding; and #8 Revit House.

Figure 8.
The CityGML LOD2 building models of new buildings (orange) placed in not-yet built parcels in a residential area in a 3D model over Höganäs municipality, Sweden. White buildings are existing buildings. The 3D city model is prepared and visualised with ArcGIS PRO 2.1.3 and ArcGIS Online/ArcGIS Portal.

Figure 9.
Photorealistic visualisation of two BIM models in Google Earth.

Figure 10.
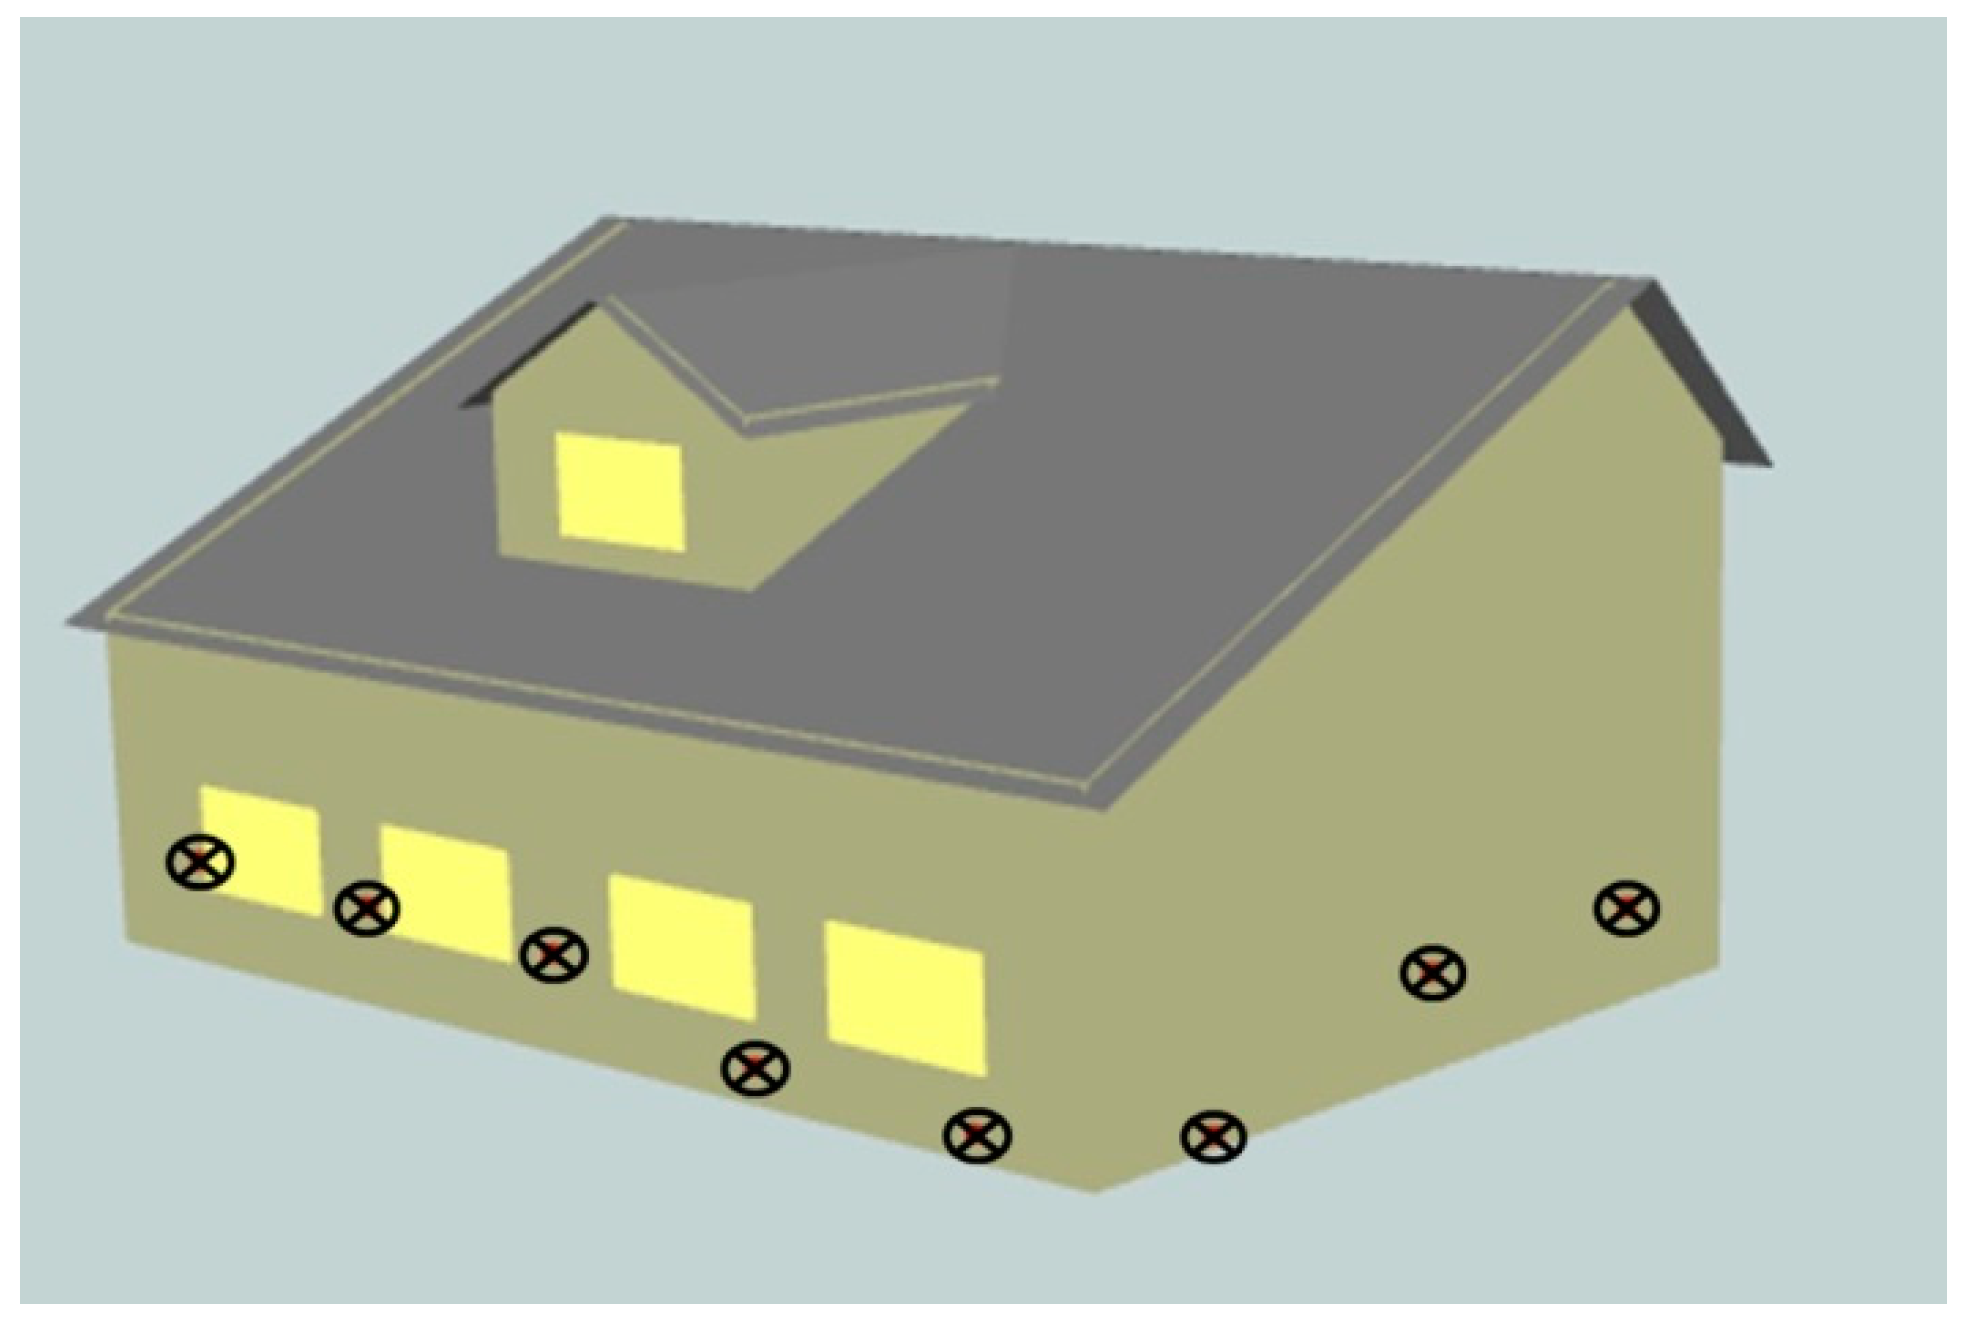
Two walls of the test building for the building height calculation where 8 of the 16 points used to calculate the mean ground elevation around the building are shown (black crosses).
Figure 10.
Two walls of the test building for the building height calculation where 8 of the 16 points used to calculate the mean ground elevation around the building are shown (black crosses).


Table 1.
Classification of the property criteria in the list of allowed values. The values correspond to the proportion of the total number of property criteria.
Table 1.
Classification of the property criteria in the list of allowed values. The values correspond to the proportion of the total number of property criteria.
| BIM Data | Geospatial Data | BIM & Geospatial Data | Total | |
|---|---|---|---|---|
| Quantitative | 25% | 30% | 30% | 85% |
| Visual | 2% | 1% | 2% | 5% |
| Qualitative | - | - | - | 10% |
Table 2.
Examples of property criteria in the detailed development plan for each category.
| Quantitative—BIM data | Roof pitch (degree) |
| Quantitative—Geospatial data | Slope of the ground (gradient) |
| Quantitative—BIM and geospatial data | Building heights (m) and densification levels (total building footprint area divided by real estate area) |
| Visual BIM data | Configuration of windows should follow certain characteristics |
| Visual Geospatial data | Configuration of property units |
| Visual BIM and geospatial data | General maintenance of the character in a built-up area |
| Qualitative | Maintenance of specific historical and artistic values |
Table 3.
Compilation of calculated footprint areas. Areas presented in m2.
| Model | Manual Calculation | Without Object Representing Footprint Area | With Object Representing Footprint Area | Calculation with IfcSpace Object |
|---|---|---|---|---|
| #1 Spira 168 | 111.3 | 113.5 | ||
| #2 Spira 175 | 111.3 | 113.5 | ||
| #3 Kamakura House | 57.7 | 57.7 | 57.7 | |
| #4 Multihuset | 3438.5 | 3424 | ||
| #5 Nyvångsskolan F | 996.5 | 998.8 | ||
| #6 Nyvångsskolan H | 547.3 | 544.5 | ||
| #7 KTH demobuilding | 110.1 | 110.1 | ||
| #8 Revit house | 248.3 |
© 2018 by the authors. Licensee MDPI, Basel, Switzerland. This article is an open access article distributed under the terms and conditions of the Creative Commons Attribution (CC BY) license (http://creativecommons.org/licenses/by/4.0/).
Share and Cite
MDPI and ACS Style
Olsson, P.-O.; Axelsson, J.; Hooper, M.; Harrie, L. Automation of Building Permission by Integration of BIM and Geospatial Data. ISPRS Int. J. Geo-Inf. 2018, 7, 307. https://0-doi-org.brum.beds.ac.uk/10.3390/ijgi7080307
AMA Style
Olsson P-O, Axelsson J, Hooper M, Harrie L. Automation of Building Permission by Integration of BIM and Geospatial Data. ISPRS International Journal of Geo-Information. 2018; 7(8):307. https://0-doi-org.brum.beds.ac.uk/10.3390/ijgi7080307
Chicago/Turabian StyleOlsson, Per-Ola, Josefine Axelsson, Martin Hooper, and Lars Harrie. 2018. "Automation of Building Permission by Integration of BIM and Geospatial Data" ISPRS International Journal of Geo-Information 7, no. 8: 307. https://0-doi-org.brum.beds.ac.uk/10.3390/ijgi7080307
Note that from the first issue of 2016, this journal uses article numbers instead of page numbers. See further details here.