Article

Mapping Rural Road Networks from Global Positioning System (GPS) Trajectories of Motorcycle Taxis in Sigomre Area, Siaya County, Kenya

Department of Geoinformatics, University of Salzburg, Schillerstrasse, 30-5020 Salzburg, Austria
ISPRS Int. J. Geo-Inf. 2018, 7(8), 309; https://0-doi-org.brum.beds.ac.uk/10.3390/ijgi7080309
Submission received: 25 June 2018 / Revised: 17 July 2018 / Accepted: 30 July 2018 / Published: 1 August 2018

Abstract

:
Effective transport infrastructure is an essential component of economic integration, accessibility to vital social services and a means of mitigation in times of emergency. Rural areas in Africa are largely characterized by poor transport infrastructure. This poor state of rural road networks contributes to the vulnerability of communities in developing countries by hampering access to vital social services and opportunities. In addition, maps of road networks are incomplete, and not up-to-date. Lack of accurate maps of village-level road networks hinders determination of access to social services and timely response to emergencies in remote locations. In some countries in sub-Saharan Africa, communities in rural areas and some in urban areas have devised an alternative mode of public transport system that is reliant on motorcycle taxis. This new mode of transport has improved local mobility and has created a vibrant economy that depends on the motorcycle taxi business. The taxi system also offers an opportunity for understanding local-level mobility and the characterization of the underlying transport infrastructure. By capturing the spatial and temporal characteristics of the taxis, we could design detailed maps of rural infrastructure and reveal the human mobility patterns that are associated with the motorcycle taxi system. In this study, we tracked motorcycle taxis in a rural area in Kenya by tagging volunteer riders with Global Positioning System (GPS) data loggers. A semi-automatic method was applied on the resulting trajectories to map rural-level road networks. The results showed that GPS trajectories from motorcycle taxis could potentially improve the maps of rural roads and augment other mapping initiatives like OpenStreetMap.

1. Introduction

Transport accessibility in rural areas is a critical determinant of human mobility, accessibility to vital services [1,2], regional connectivity, economic growth [3], and timely mitigation during emergencies [4]. Lack of adequate transport accessibility can worsen the vulnerability of disadvantaged members of community including children, the elderly, the sick and people living with disabilities. In most rural areas in sub-Saharan Africa, transport services are still largely inadequate and unregulated, which has contributed to negative health outcomes, including injuries and diseases that are attributable to transport-related air and noise pollution [5]. Moreover, even in cases where roads exist, the focus of their design and construction is usually on improving physical connectivity between major centers without much thought on accessibility to these roads [6] from rural homesteads and villages. Furthermore, rural travel is sometimes considered “invisible” [7] because of inadequate up-to-date maps of rural transport infrastructure. This invisibility can hamper local navigation by visitors and lead to erroneous estimation and representation accessibility to services and mobility patterns.
A major impediment to the design of accurate and up-to-date maps of rural transport infrastructure and mobility has been the potential high cost of implementing large-scale field data collection [8] for the mapping exercise. Additionally, most official mapping agencies in Africa face legal and technical barriers [9] on how to integrate data from Volunteer Geographic Information (VGI) into official geodatabases of transport infrastructure. Consequently, data to map rural road networks have traditionally been digitized and updated from aerial photogrammetry (which lately include data from Unmanned Aerial Vehicles (UAV)) [10] and from satellite image analysis [11]. Because of the relatively high cost of using the traditional methods, their implementation has mainly been restricted to urban areas or to major road networks that link major centers in a country. In order to circumvent the high costs that are associated with traditional methods of mapping, Van der Molen [12] suggested that practitioners should master and take advantage of the emerging geospatial tools and techniques as an alternative to mapping in a rapidly changing environment.
In recent decades, the emergence of methods for participatory geographic information systems (PGIS) [13] and volunteered geographic information (VGI) [14], together with the advances in telecommunication, sensor and Global Navigation Satellite Systems (GNSS) technology have boosted global mapping efforts. This is more so because it is now possible to involve a large cross-section of citizens in capturing spatial data, validating geographic information, and in labelling features on maps. Some of the common web-mapping initiatives that rely on volunteered geographic information include Google maps, OpenStreetMap (OSM), Geocommons, and Wikimapia.
While citizen-focused web mapping initiatives have been largely successful in the developed world and in big urban centers, poor mobile communication signals compounded with costly and unreliable internet in the developing countries continues to hamper the adoption of the approaches in deprived rural areas. Geographic coverage of web-based, crowdsourced data remains a challenge for global and continental observations, particularly in sparsely populated [15] or underserved areas. In these underserved areas, only a relatively small number of volunteers and moderators may have access internet through which to contribute to mapping and verification spatial information in their remote neighborhoods. Consequently, coverage of crowdsourced spatial information of infrastructure in rural areas is still too small [16], with large proportions of rural infrastructure, including transport networks remaining unmapped.
To improve the geographic coverage of spatial data and maps of rural infrastructure, it is advisable to develop mechanisms that can motivate [17] residents of the rural areas to continually be involved and to participate in the mapping exercise. Additionally, it is advisable for practitioners to adopt appropriate enabling tools and technologies [18] that may not be significantly constrained by socio-economic circumstances of the rural locations of interest. For instance, tools that are not entirely reliant on access to internet, electricity and mobile communication may be the most appropriate for resource-deprived rural areas in Africa. Furthermore, tools and methods that can capture not only the location but also the mobility patterns of rural residents in space and time can provide invaluable data for mapping rural infrastructure and for understanding and representing human mobility patterns and the accessibility to social amenities at the local level.
With the advances in sensor and Global Positioning System (GPS) tracking technology, it is now possible to record accurate locational information about entities in their environment. The entities may include humans, animals, vehicles, motorcycles, ships, etc. Sensors and GPS trackers have been applied to address questions in a number of fields including environmental pollution [19], human health [20], vehicle navigation [21], and sustainable energy management [22], among others. Furthermore, a combination of methods from VGI and sensor/GPS tracking technology have been applied to study human mobility patterns in geographic space [23], to implement a geocitizen approach to urban planning [24], animal monitoring [25,26], and disaster management [27]. GPS-derived VGI does not only provide positional information about the entity of interest, but also leaves spatial and temporal traces that could be used to map infrastructure and activities in the environment. For instance, big data, comprising of traces of mobile users have been used to map footprints of urban activities [28]. Similarly, GPS trajectories have been used for routing [29] and for lane detection in highways [30]. Gaps remain on how community generated data emerging from GPS trajectories of movements in rural areas can be harnessed and used to improve maps of rural infrastructure. In particular, there is limited evidence in literature on how to map routes and tracks in rural areas where residents largely depend on unconventional means of public transport, like motorcycles, bicycles, or even animal drawn carts.
Poor transport infrastructure in rural areas render most roads impassable during rainy seasons. Consequently, it is costly to maintain and manage public service vehicles in the rural areas. As a result, there are only a few vehicles, (mainly vans and mini buses) that link passengers from rural areas to commercial and administrative centers. As an alternative, local populations in most rural areas in sub-Saharan Africa have adopted motorcycle taxis as a means of public transport. This is particularly because the motorcycles are affordable, cheap to maintain and capable of accessing areas that would otherwise not be accessible using conventional vehicles or on feet. In some cases, motorcycle taxis, commonly referred to as “bodaboda” in Kenya and Uganda, have become the dominant mode of transport in rural areas. Within cities, similar motorcycle taxis provide public transport in informal settlements and for delivery services within urban areas. Unfortunately, there has been limited research on the influence of motorcycle taxi transport service on road/track design to support safe motorcycle use [31].
Inadequacies in the understanding of the infrastructure that the motorcycle taxis use in rural areas has made it difficult to regulate the sector. Unfortunately, this has led to an increase in motorcycle accidents [32] and a surge in insecurity [33] when criminals use the same mode of transport to access remote areas and to escape from crime scenes. In this study, we posit that recording the spatial and temporal characteristics of these motorcycle taxis can provide rich data with which to analyze and represent rural transport networks, mobility, and accessibility to vital services. Moreover, it can be assumed that in view of this new reality, previous research on accessibility that have largely relied on official or publicly available data on transport infrastructure may be missing crucial information on motorcycle taxi-based mobility patterns. Consequently, analysis that is based on incomplete and out-of-date official or publicly available data of road networks may not provide a true reflection of rural accessibility patterns.
To demonstrate the potential use of GPS data from the motorcycle taxi transport system in mapping rural transport infrastructure, we set out an experiment to track motorcycle taxis in a rural area in Kenya by tagging volunteer motorcycle taxi riders with GPS data loggers and to use the resulting data to design maps of rural transport infrastructure. The specific aims in this study included: (a) to identify suitable volunteer motorcycle taxi riders, and to tag and track the riders in the course of their daily routines. (b) To translate the trajectories into road networks. (c) To evaluate the influence of new road network in estimating accessibility in the study area.
In the last decade, raw GPS data have routinely been applied to map routable road networks [34,35]. In particular, clustering or aggregation methods have been used to build clusters of same roads from GPS trajectories. For instance, Zhang et al. [36] applied a clustering method that used variation in velocity to differentiate and classify GPS traces. Similarly, Schroedl et al. [37] used clusters in dedicated distance in the GPS data to separate different lanes of a road section. Further, Liu et al. [38] introduced an algorithm to map urban roads from course-grained vehicular GPS traces.
For areas in which satellite imagery are unavailable, Chen & Cheng [39] used multi-track GPS data to generate accurate road data and observed that multi-tracks could potentially reduce the errors in the GPS data. Moreover, pedestrian route networks have also been designed from self-reported GPS traces of walkers [40]. GPS data of this type have not only been used for mapping purposes, but also to detect the behavior of different road users [41] and to infer travel modes [42]. Furthermore, GPS traces from smartphones have been used to map informal public transport systems in Kampala, Uganda [43]. Similarly, GPS traces from smartphones of users of semi-formal buses “matatus” have been used to design route maps for the city of Nairobi [44] and to recognize stoppages in developing regions where there are no official bus schedules [45].
In rural areas, data from GPS data loggers have been used to assess mobility patterns and to calibrate the data from self-reports [46]. In a related study, GPS data loggers were used to assess the mobility pattern of residents of a rural area in Zambia and to evaluate the impact of the mobility on the spread of malaria [47]. Additionally, GPS travel diaries have been used to investigate mobility characteristics of elderly people in rural areas [48]. From our analysis of literature, we did not find specific examples of the application of GPS traces of motorcycles to map rural road networks.

2. Materials and Methods

This study was carried out in a rural setting covering an area of approximately 5 km radius around Sigomre market in Siaya County Kenya. The geographic coordinates of the central location of the study area were 34.3613° E in longitude and 0.2016° N in latitude. This area was chosen because it is at least 8 km from tarmacked roads relies mainly on motorcycle taxis as the main mode of transport. All of the roads and tracks to and from the market are dirt roads. Additionally, Sigomre market serves as the main market and administrative center for Sigomre ward. The location therefore provided a good setting for simulating local mobility to various social services in the ward. Figure 1 is a map of the area of study depicting the central location and the main road networks as capture by the official road data and superimposed on an OpenStreetMap (OSM) in the background.

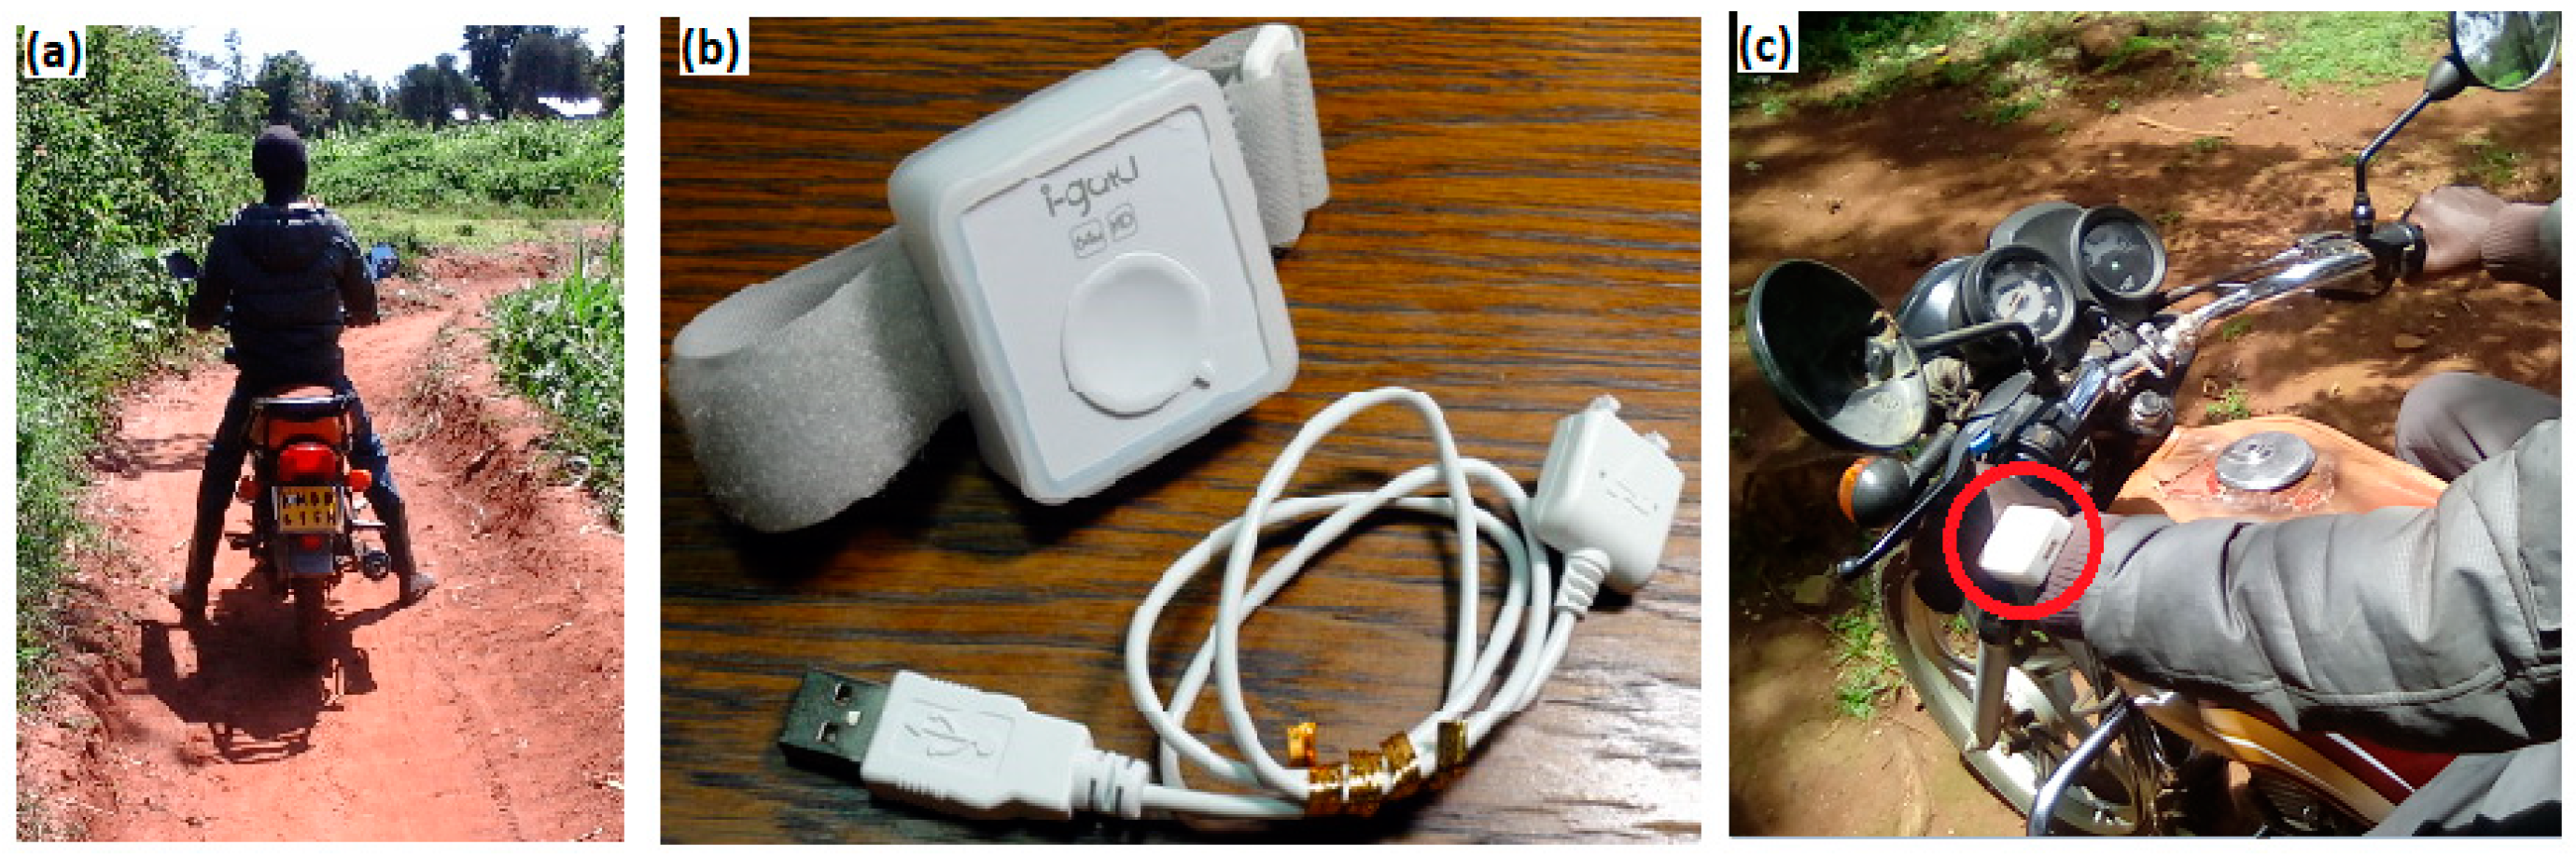
2.1. Data Collection

Three main data sources were used in this work including, official road networks from national mapping agency in Kenya, roads and tracks from OSM, and GPS tracks and points that were collected as part of the motorcycle tracking experiment.
At the time of the experiment, there were approximately 400 motorcycle taxi riders in and around Sigomre market. Commonly, riders organize themselves into groups of about 100 riders who make up a self-help group. In Sigomre market, there are four groups. Ten (10) volunteer riders were selected from market center to participate in the experiment. The volunteer riders were tagged on their wrists and tracked on a daily basis from 6 a.m.–9 p.m. for a duration of two weeks. At the end of each week, data loggers were retrieved from the riders and the data recorded by each logger within the week downloaded and archived. Additionally, in each day of the week, we interacted with the group of volunteer riders to confirm that the data loggers were adequately charged and in good working condition. Figure 2 represents, (a) typical village tracks that were traversed by the motor cycle taxis, (b) the particular logger that we used in this experiment together with the wrist strap and the charging and data download cable, and (c) an example of a volunteer riding a motorcycle taxi while recording GPS locations through a GPS data logger strapped on his wrist.
In this experiment, i-gotU GT-600 GPS travel and sports data loggers from MobileAction, Taiwan were deployed for the tracking exercise. The devices which could be strapped on the wrist could auto record GPS data in logger mode and had a capacity of approximately 262,000 waypoints. Each data logger was preprogrammed to record data at an interval of 30 s from 6:00 a.m. to 21:00 p.m. local time. The devices were also preprogrammed to detect motion, so that, if a rider was immobile or stayed in the same position for more than 30 s, then the devices would go to a hibernation mode and be reactivated only by the next instance of motion. We downloaded the data through the @trip PC GPS receiver software that came with the GPS data loggers. At the end of the two weeks period, 233,066 data points had been captured.
The data from GPS data loggers was compared against the official government data on roads to evaluate the proximity of the GPS data points to the official road data. In particular, 5381 points of collected were selected along a straight section of the road of approximately 1.5 km in length. To estimate the shortest distance from the GPS points to the nearest road section, the Generate Near Tool in ArcGIS 10.4.1 was used. We then evaluated the statistics for the variation in distance between the GPS locations and the sections of the road that were nearest to each point. Figure 3 represents the points and line segment that we used in the validation.

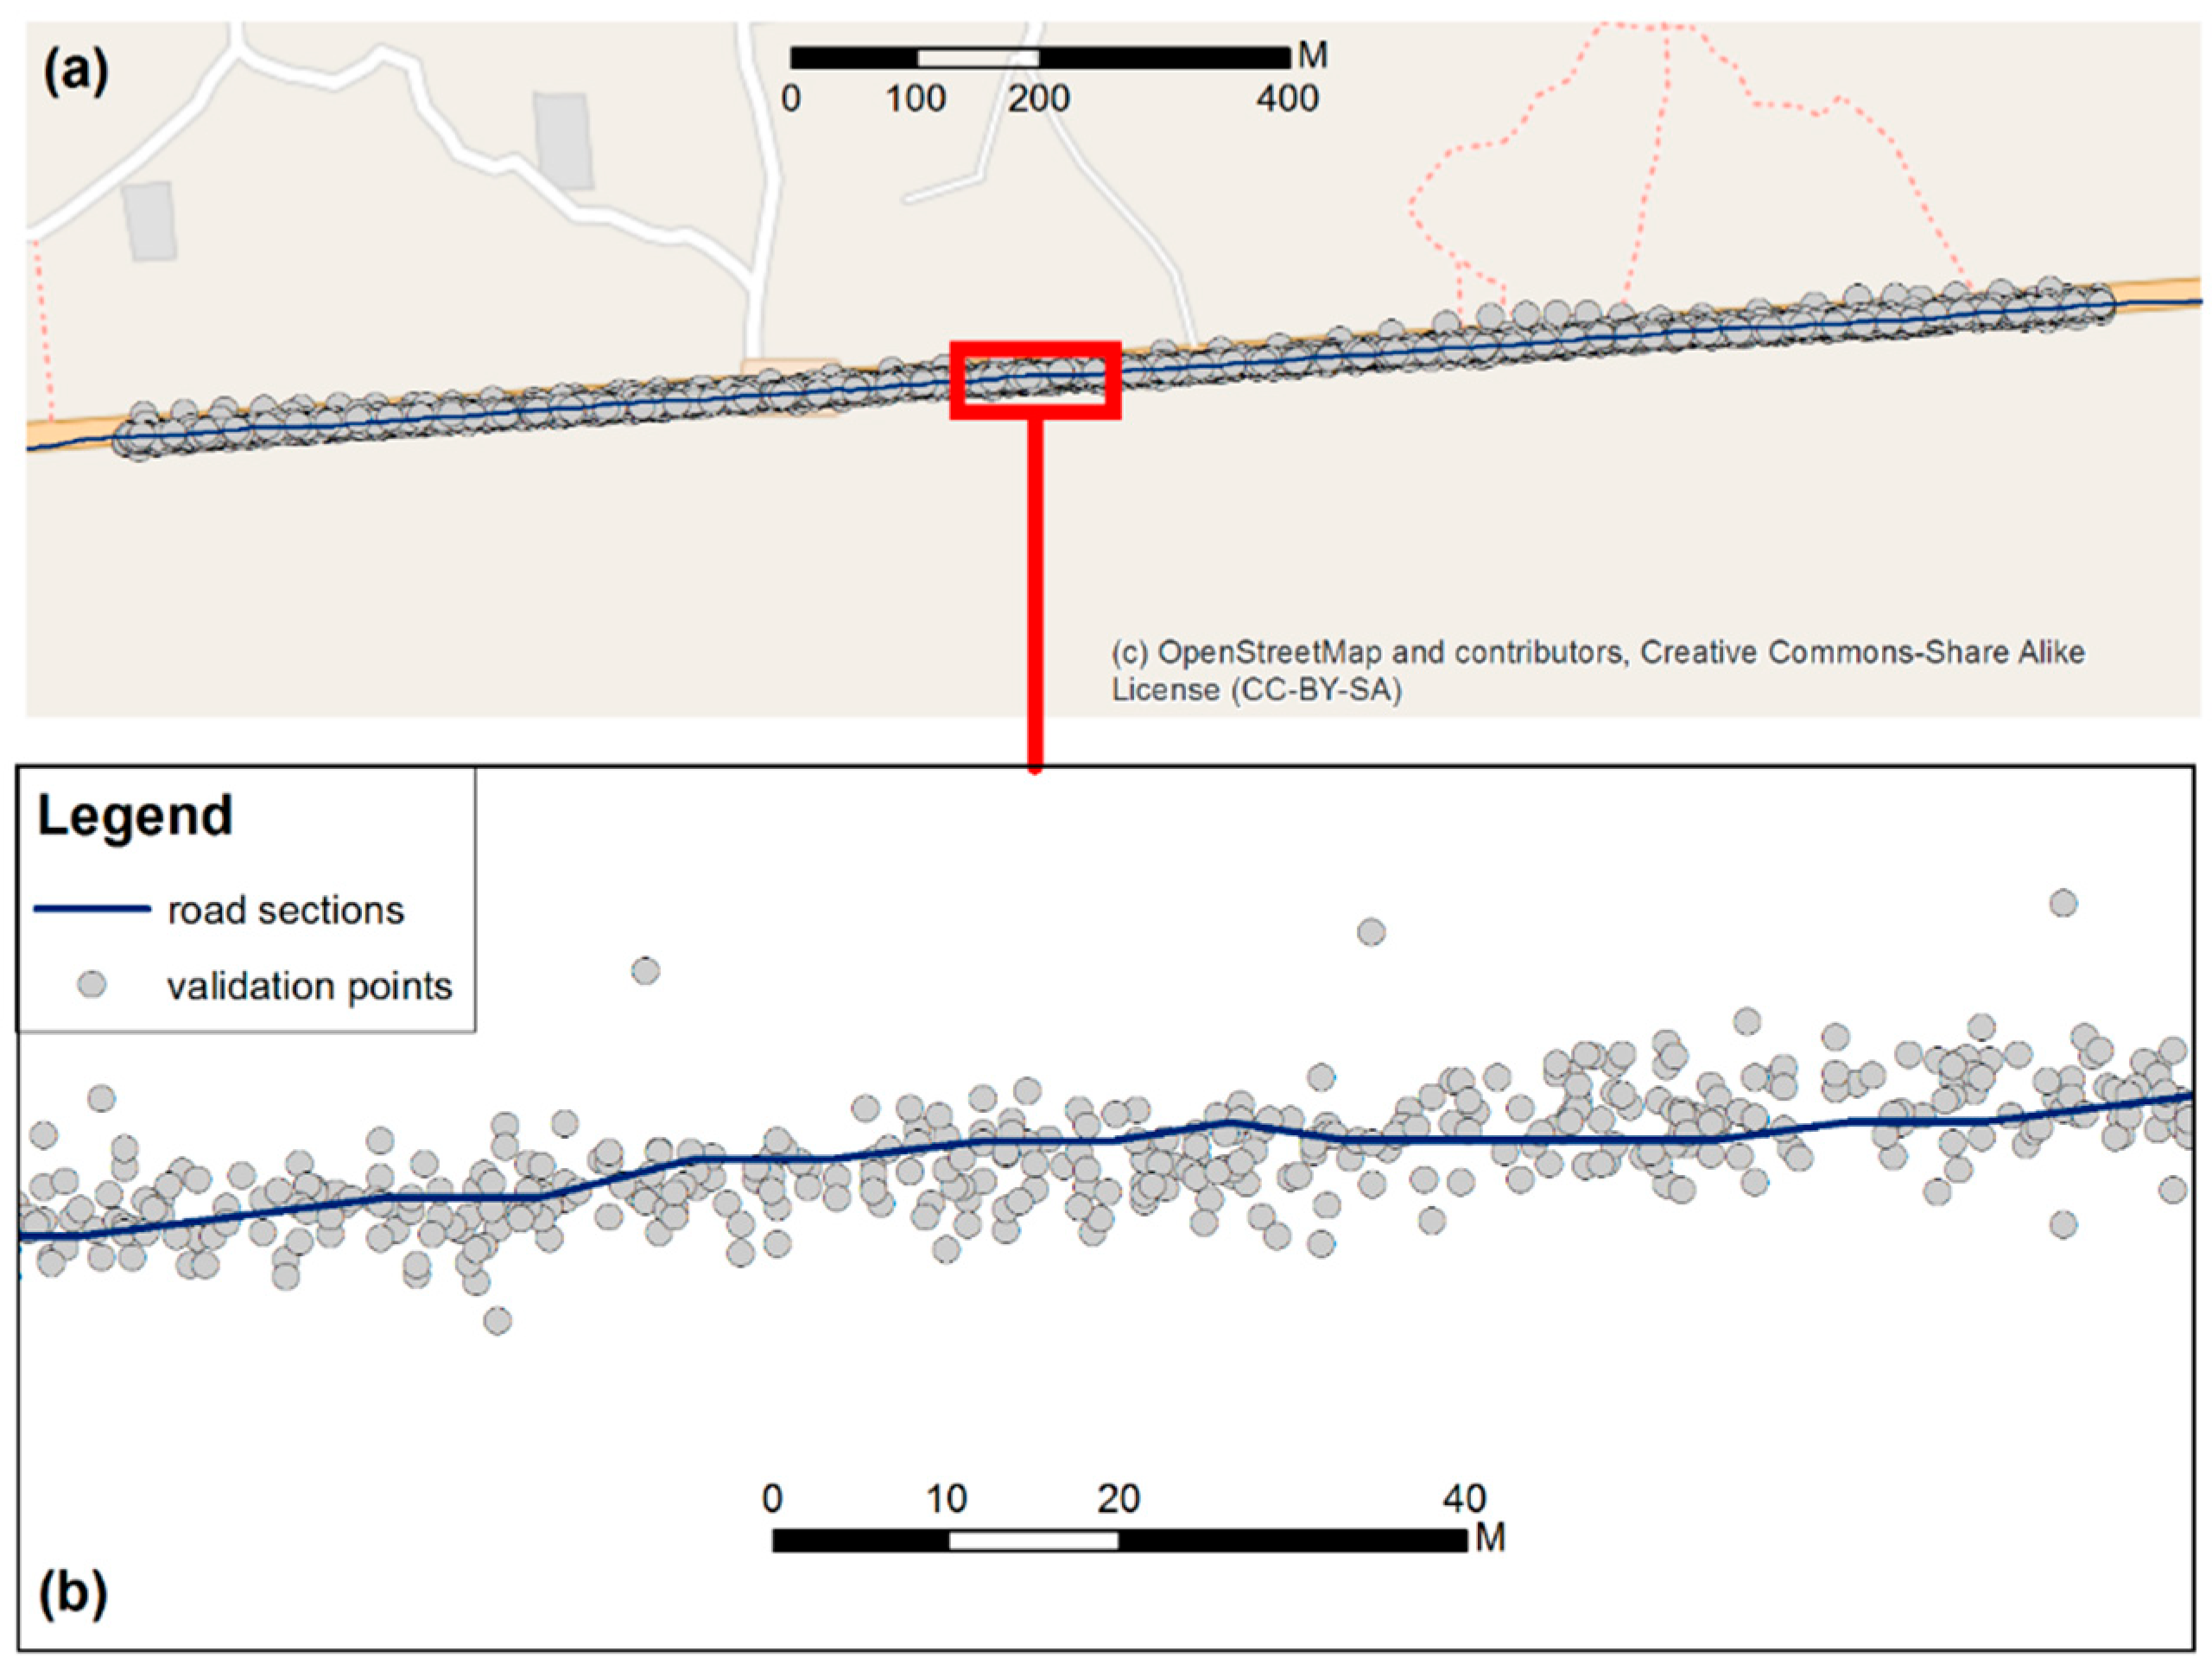
2.2. Mapping Motorcycle Tracks

Prior to using the data to map transport infrastructure, GPS locations which were recorded when the riders were moving at less than 5 km/h were removed. In total, these were 77,511 data points. An assumption was made that these locations signified instances when the riders were either walking or not riding. Thereafter, a heat map of the GPS data points was created at a spatial resolution of 5 m and for a radius of 20 m to represent spatial variability in the relocated tweets. Initially, heat maps had been generated at 50 m, 30 m, 20 m, and 10 m cell size. However, it was evident that beyond a radius of 20 m, the resulting heat maps were too wide to aid in digitizing accurate road centerlines while at 10 m, the resulting heat map surface was not adequately contiguous. A radius of 20 m was chosen because it resulted in surfaces on which it was easier to digitize road centerlines. In addition, it was sensible because dirt roads in Kenya are at most 6 m wide on each side of the centerline and in some instances have road shoulders, which are 4 m wide on each side. In rainy seasons when the roads become muddy or when the road surfaces become impassable, motorcycle riders and other road users occasionally use road shoulders when the road surfaces are impassable. The resulting heat map revealed linear traces of motorcycle tracks from which traces of rural road networks were digitized. The linear features, which were digitized from heat maps of GPS traces, provided the input with which new road networks were mapped. In addition, the resulting road networks were used in the subsequent analysis to estimate accessibility in the study area.

2.3. Simulating Accessibility Surfaces

By assuming that people in rural areas walk directly to the nearest road network before embarking on a journey on motorcycle taxis or on vehicles, the Euclidean distance analysis method was used to determine the straight-line accessibility from the road networks to different locations in the study area. In particular, accessibility to three sets of road data was estimated and compared. Specifically, accessibility was estimated to the official road networks, to OSM road networks and to new road networks from the GPS tracking experiment. To identify the influence or the improvement in the accuracy of estimating accessibility by considering the motorcycle taxi tracks, the accessibility surface, which was estimated from the new road networks was subtracted from the accessibility surfaces from official data and from OSM data.

3. Results

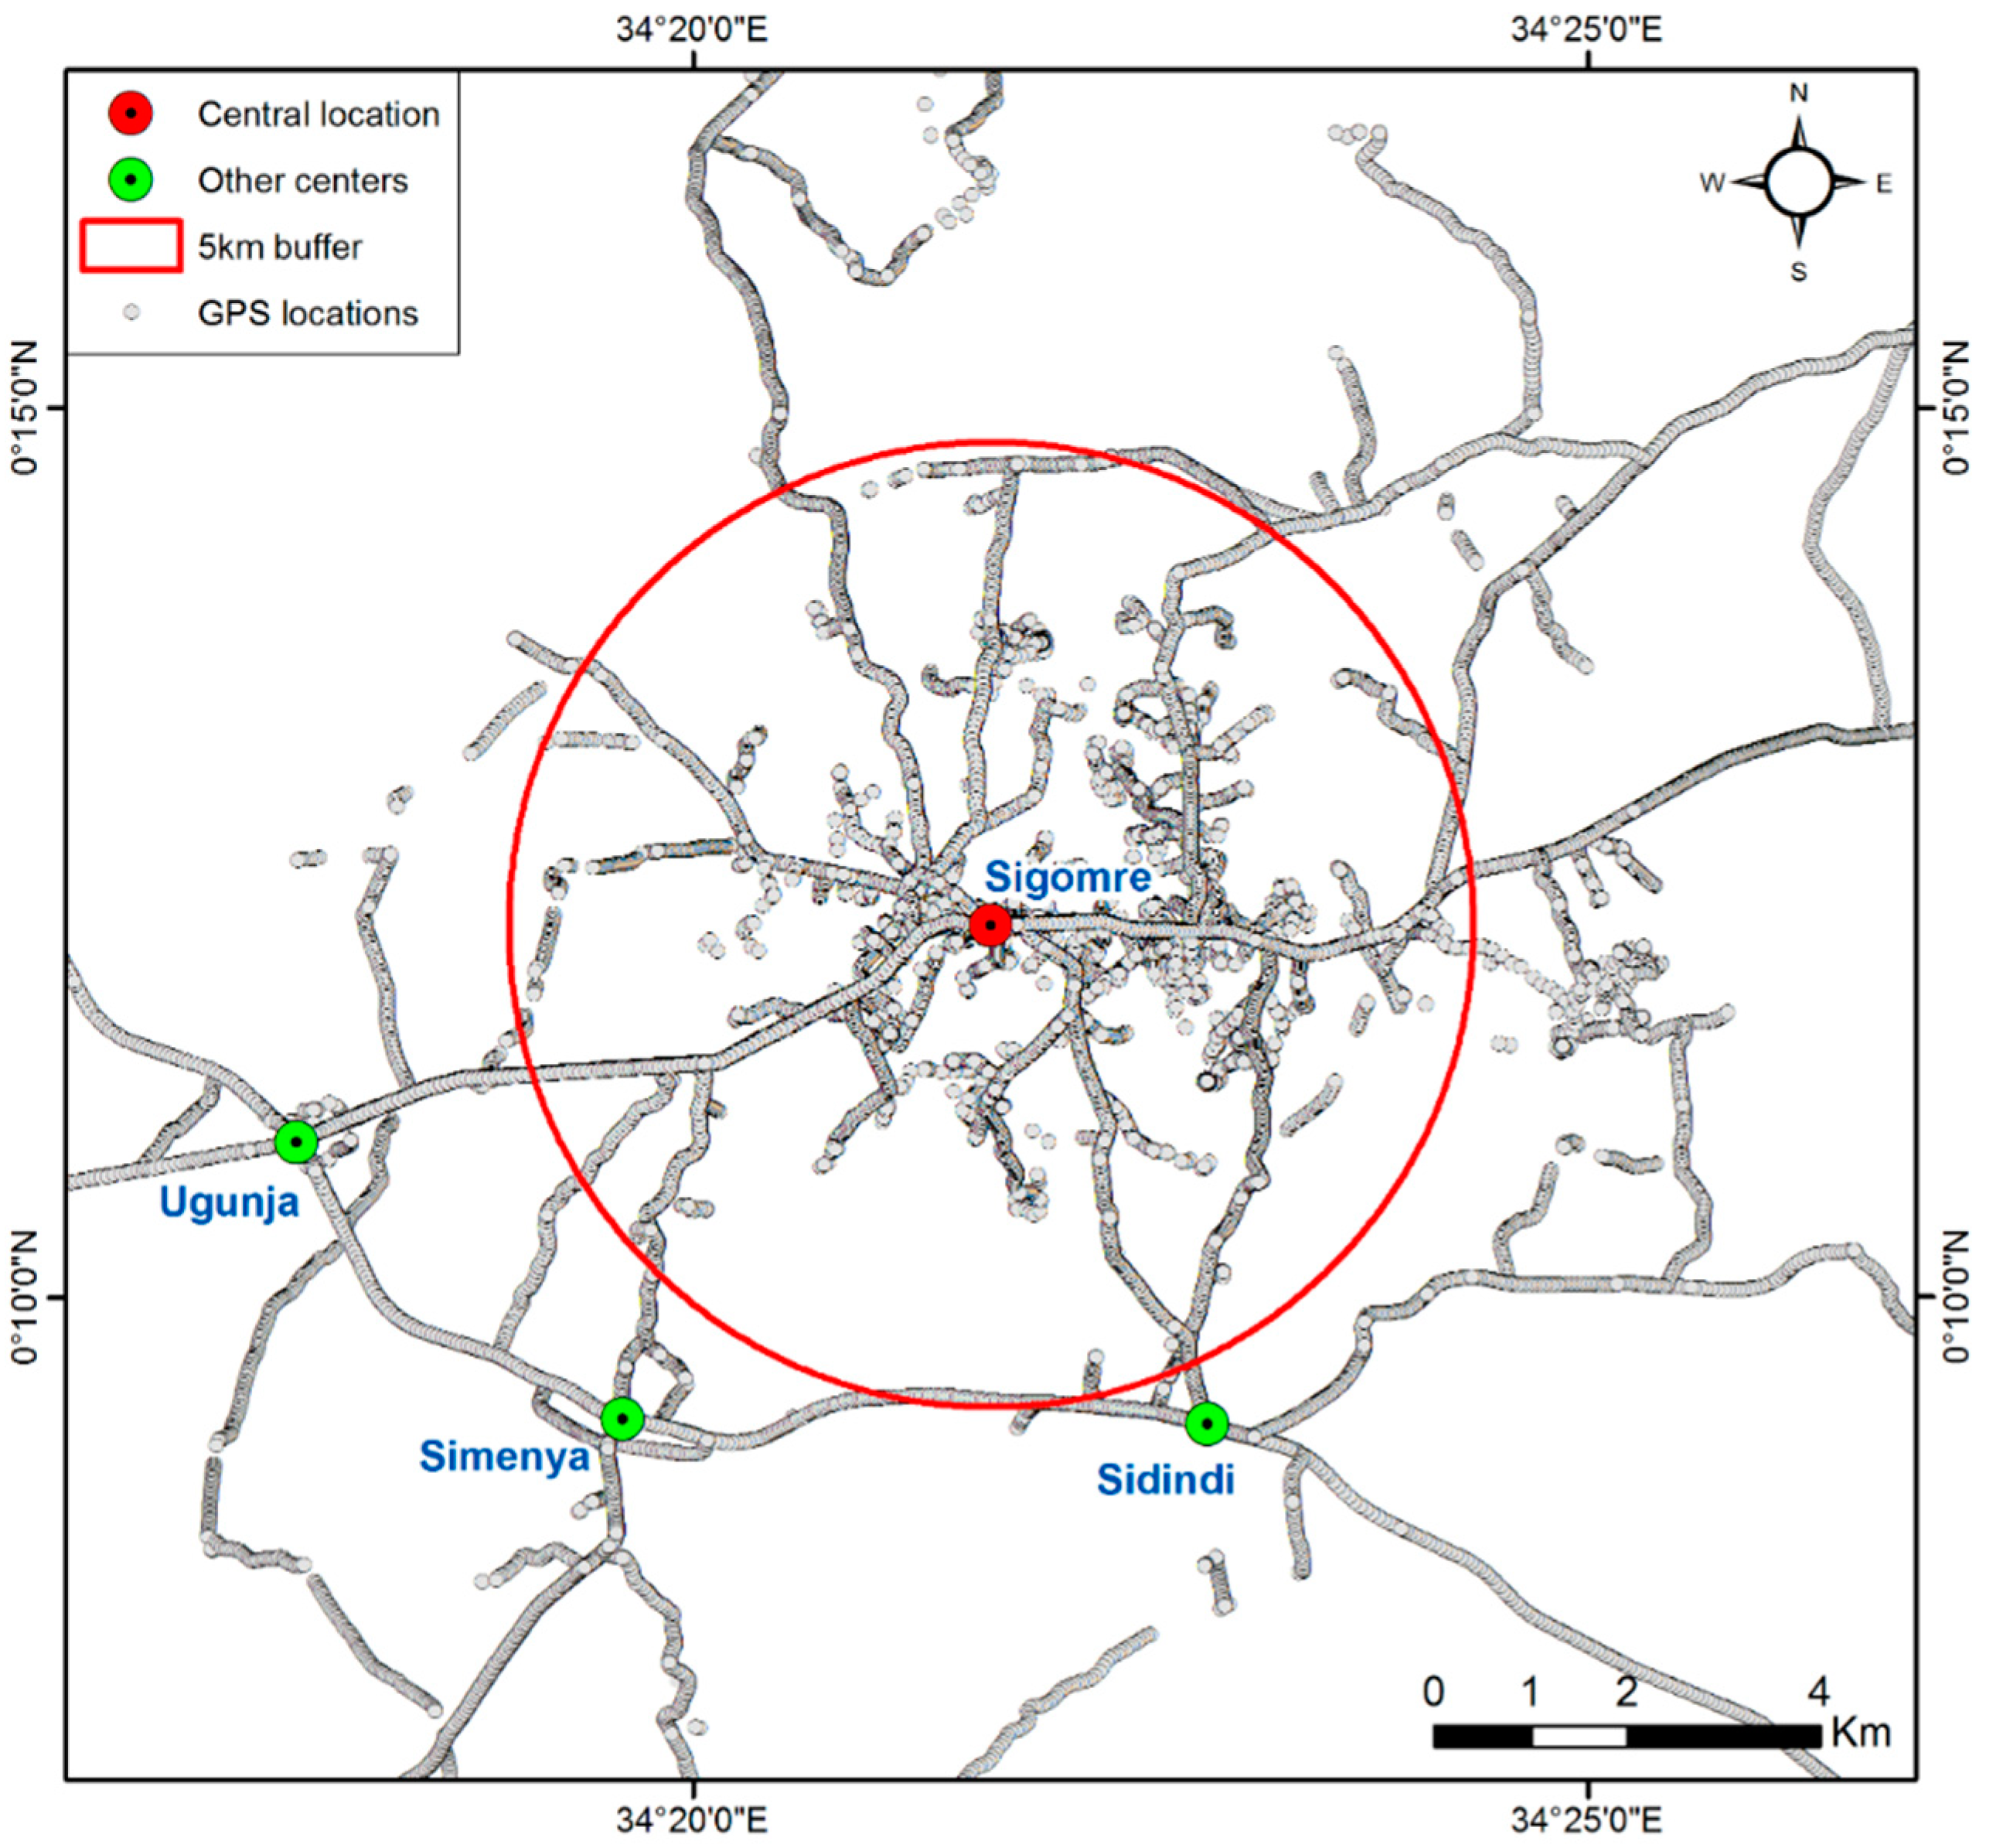
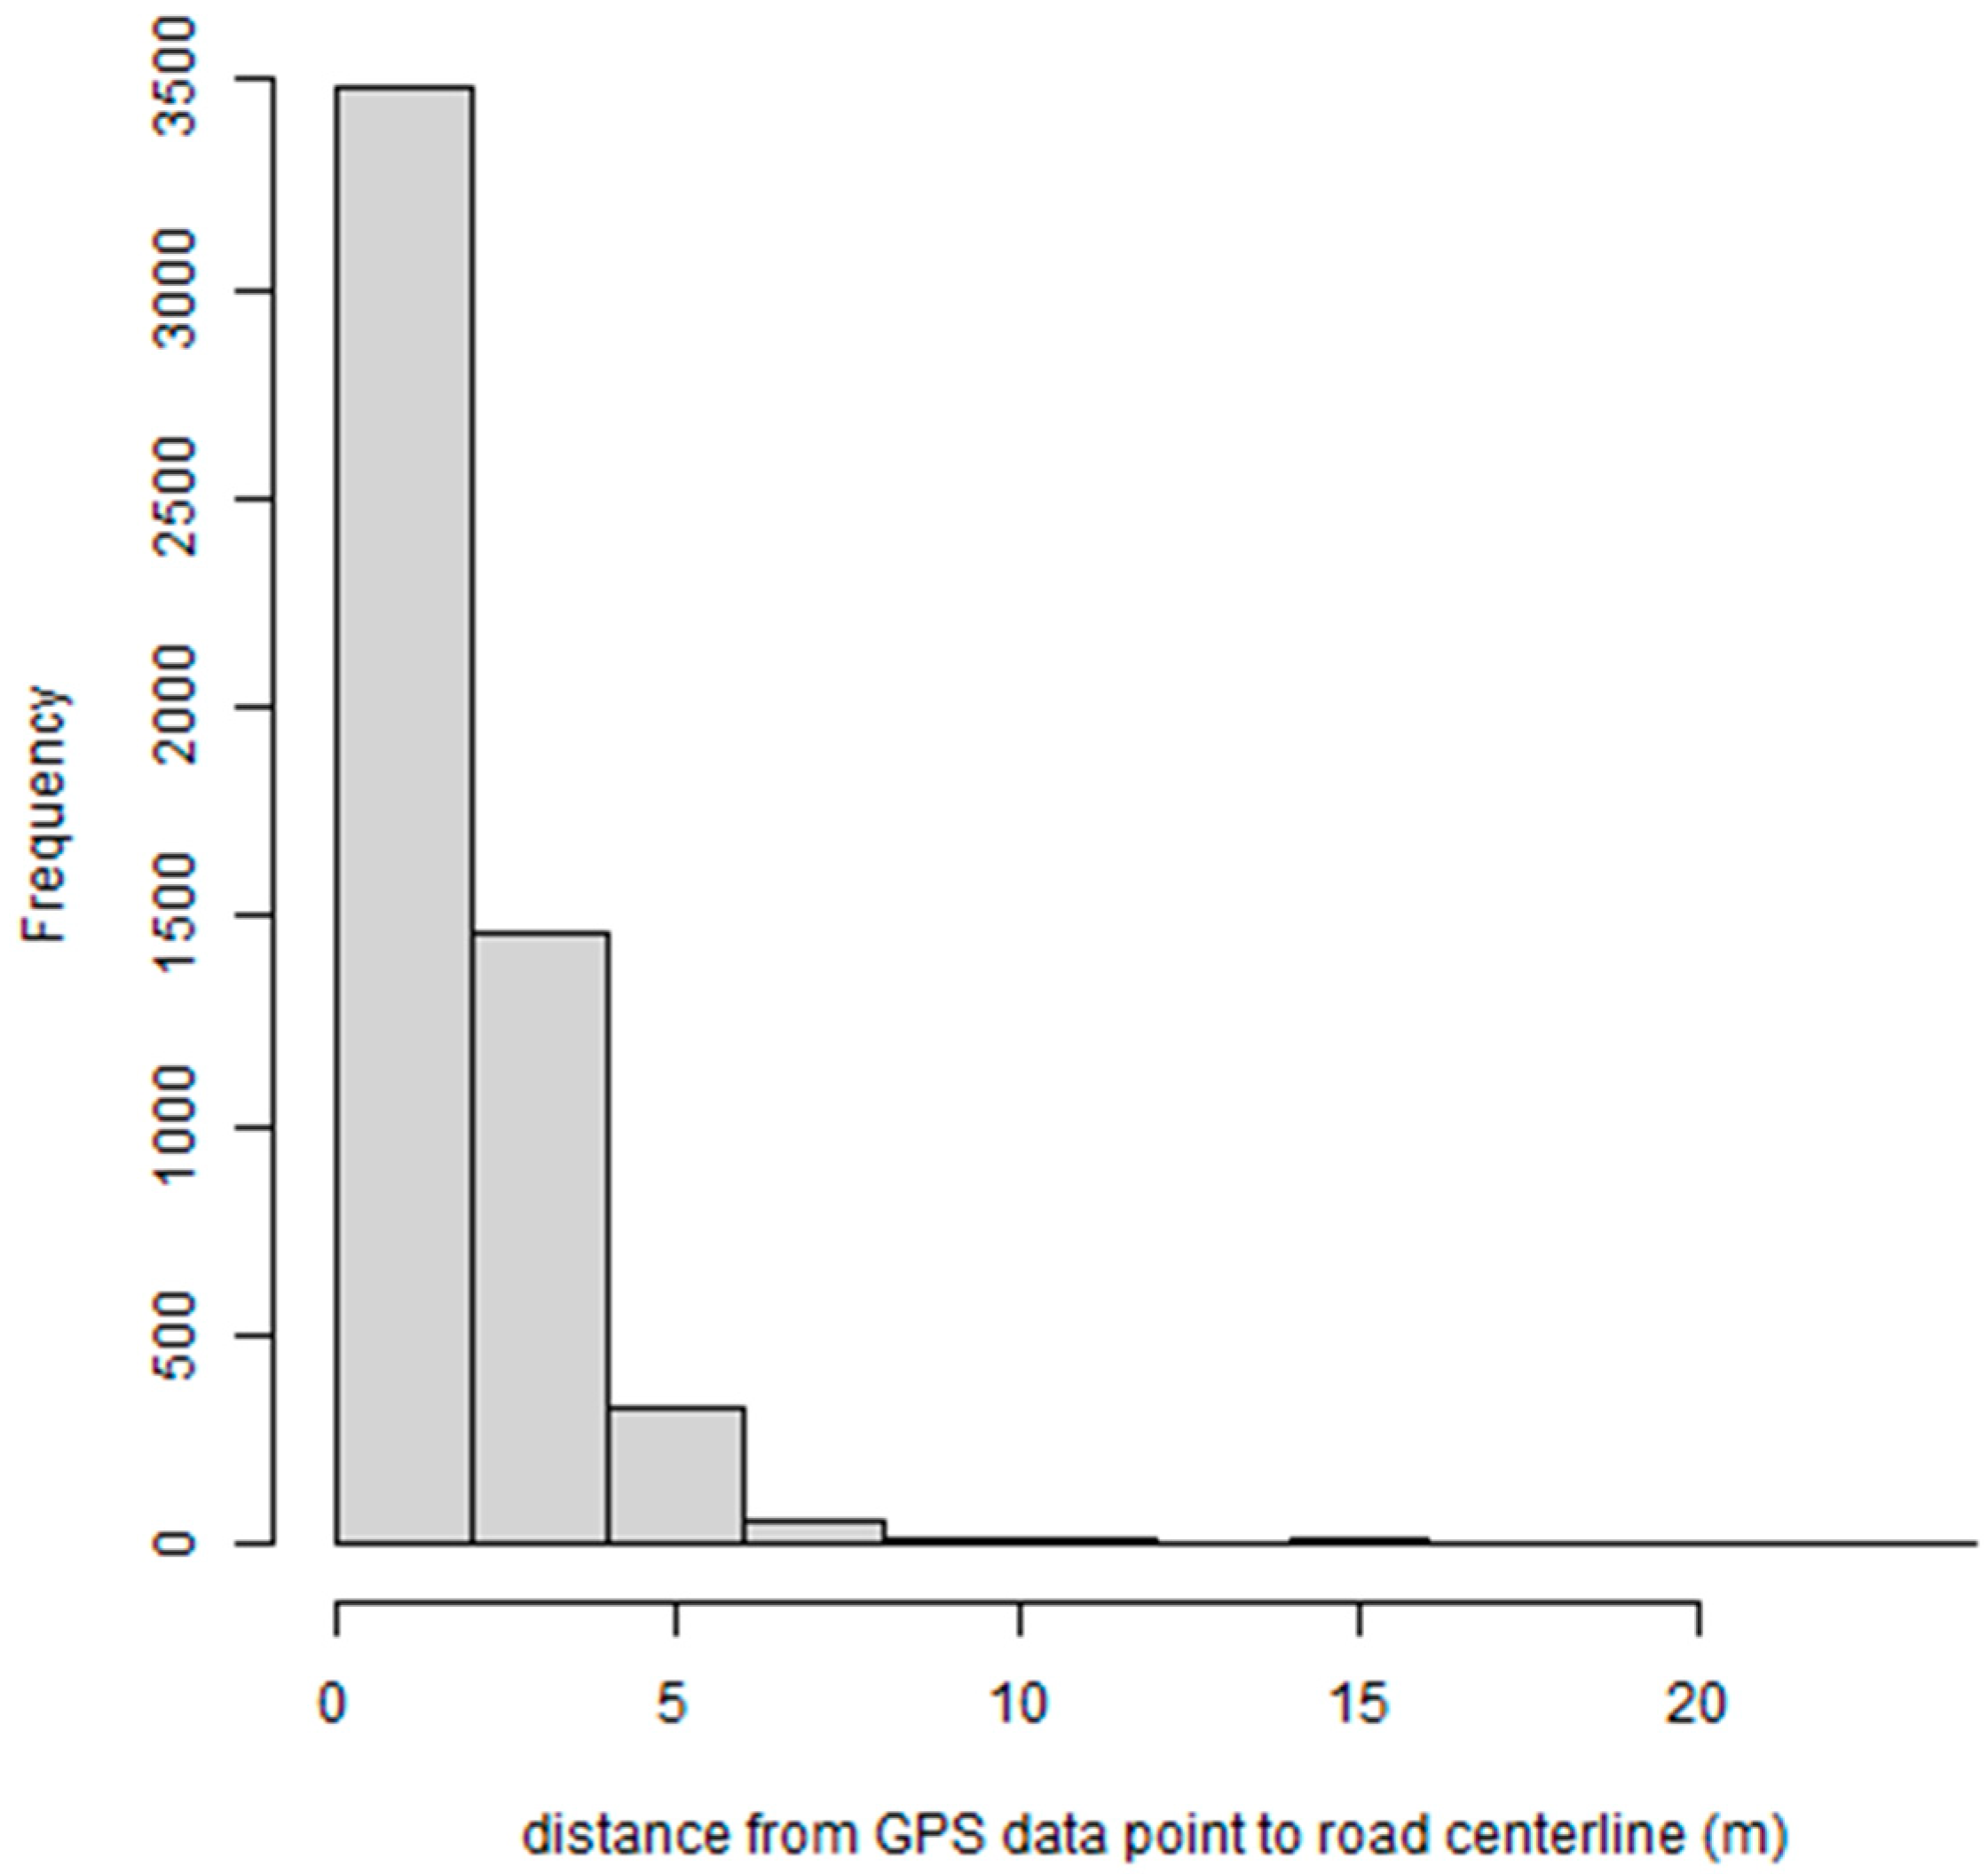
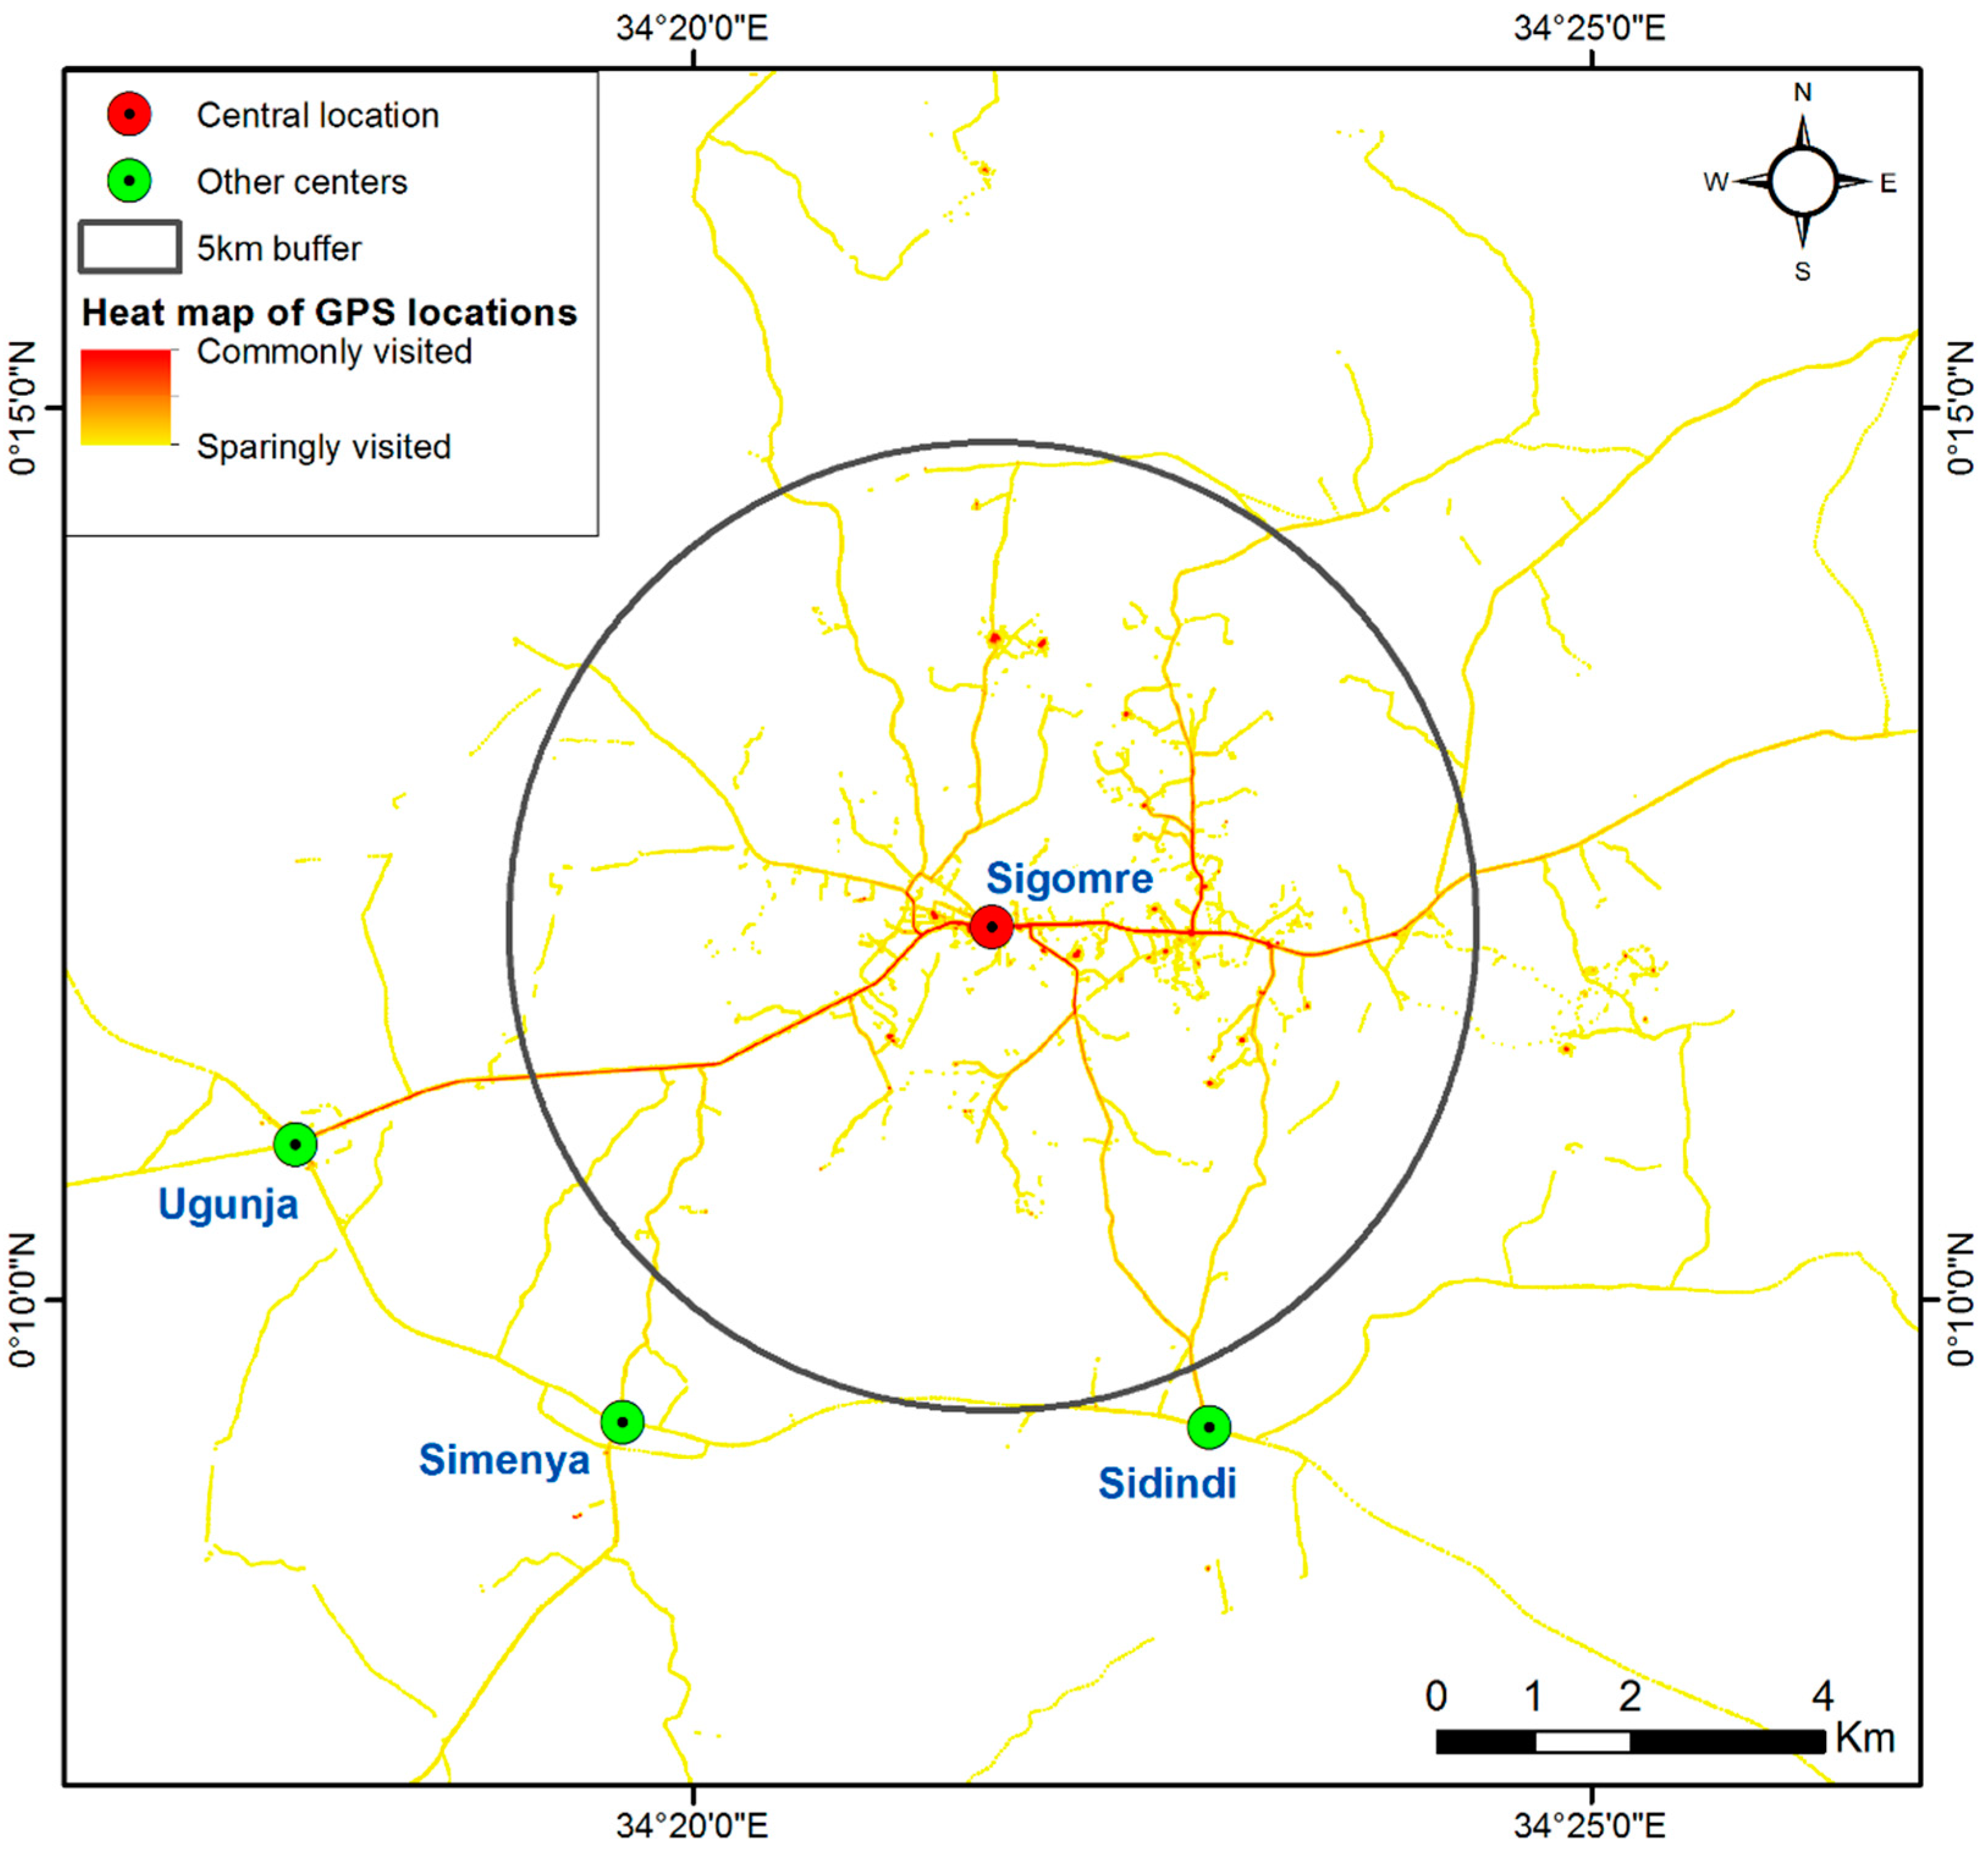
3.1. Spatial Characteristics of GPS Trajectories of Motorcycle Taxis

The area of study was at least 5 km away from the main trunk road that from Kisumu to Busia. The trunk road is the only paved vehicular road near the study area and it passes through Sidindi, Simenya, and Ugunja market centers (Figure 4). From the map, it is apparent that, although the riders had their central location at the Sigomre market, their trips were commonly connected to the other major centers at Ugunja and Sidindi on the tarmacked road. In addition, there were multiple traces to the surrounding villages, which was of most interest to this work were well captured.
From the comparison of the proximity of a subset the GPS traces to the closest sub-section of official road data, on average, the GPS points we approximately 1.9 m from the respective road centerline. The overall distribution of the distance of the points from the road centerline were, as shown in Figure 5, signifying that along the straight segment considered in the validation, a majority of the GPS points were likely to be within 5 m of the official road centerline.

3.2. Road Networks from GPS Traces

The first methodological step in the process of conversion of the GPS traces to representative road networks was the creation of a heat map representing the variation in visitation to various road sections and tracks by the motor cycle taxi riders (Figure 6). From the field data, it was evident that the section of road that was commonly traversed by the motorcycle taxis was the Sigomre to Ugunja section. In addition, the heat map revealed a popular road junction, which was approximately 2 km from Sigomre market in the eastern part of the area of study and branching from the main Ugunja-Mumia road towards Luru. The GPS locations were not only limited to the main road links, but they also showed minor tributaries that could potentially be the links between homesteads and the roads or tracks. The linear footprint emerging from heat map provided the basis for manually digitizing the road networks.

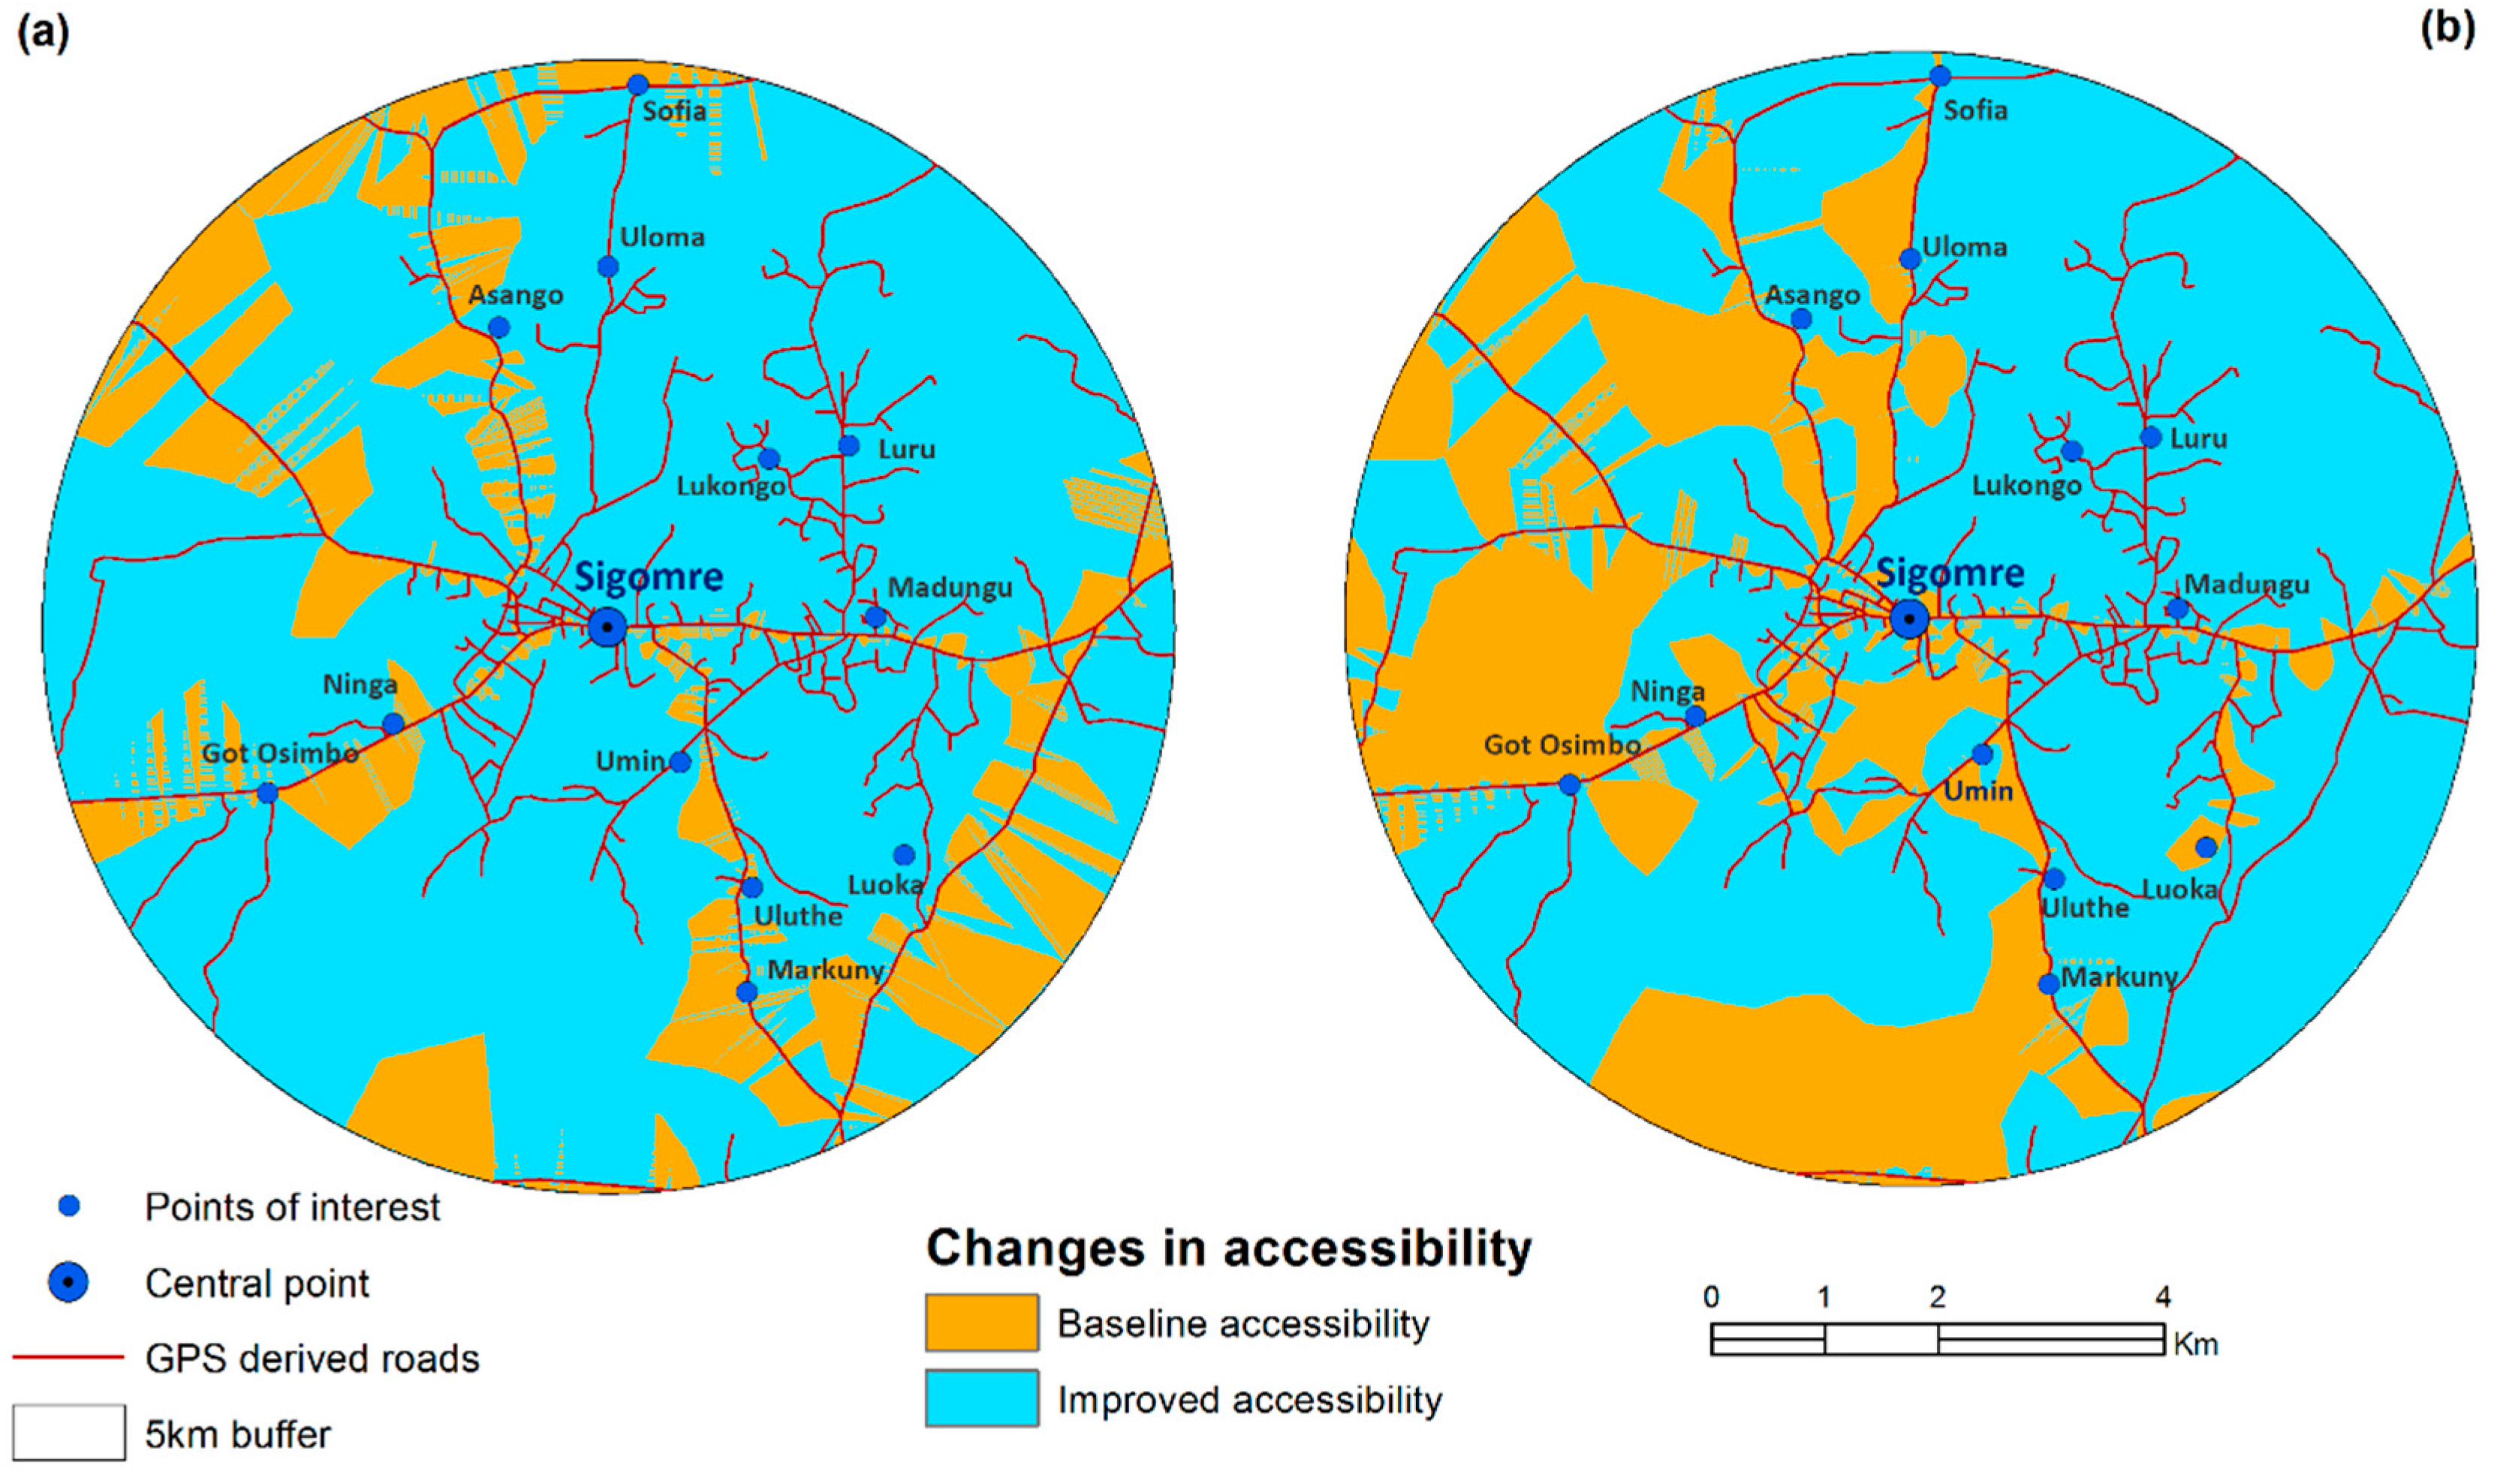
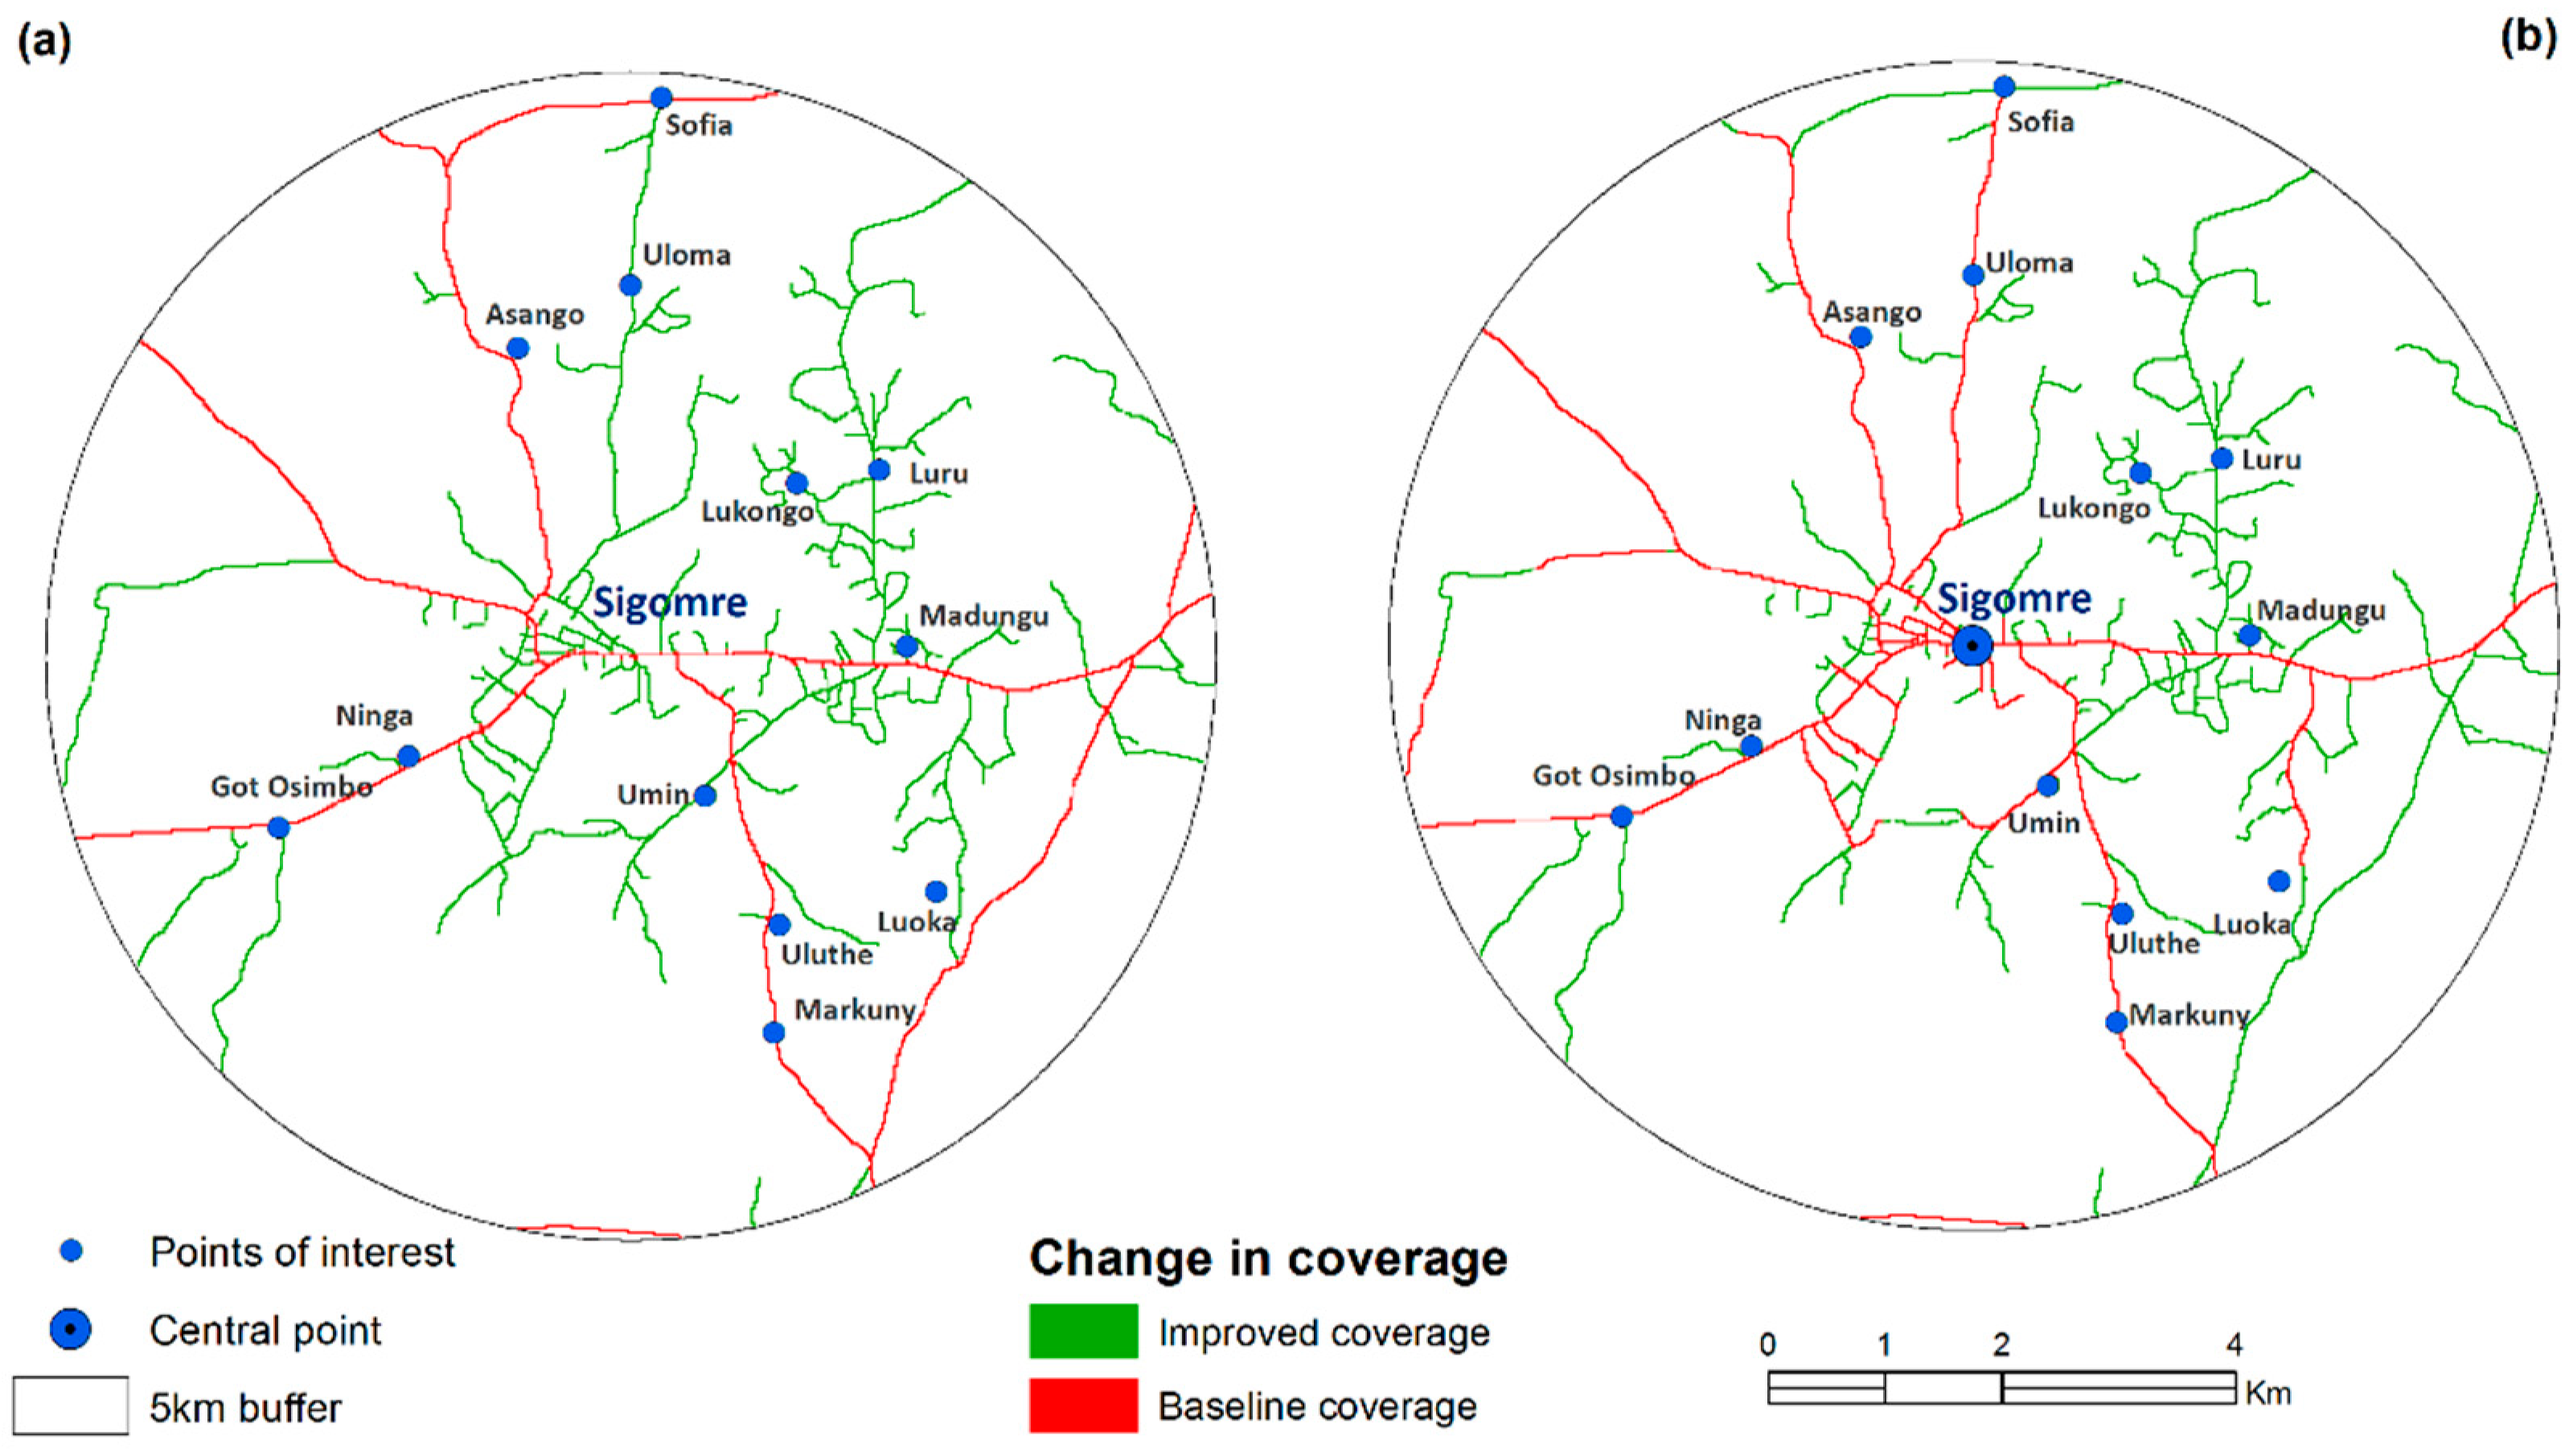
3.3. Estimation of Road-Based Accessibility

Based on the digitized road networks, accessibility from each road data was estimated by calculating the Euclidean distance from the road networks. In Figure 7, represents the straight-line accessibility as calculated against the three road datasets in this study. The particular road network data were the new road network, as digitized from the heat maps of GPS traces, road networks from official government data, and road network from OSM data.
The accessibility surface from GPS-derived road network (Figure 7a) showed that motorcycle tracks were highly accessible from most locations within the study area. Most locations in the area of study were within 500 m from the motorcycle tracks. On the other hand, the official government road networks captured only the main roads types and access roads, which linked the main market centers. Consequently, the accessibility surface from the official data (Figure 7b) depicts large sections of the area of study, which could inadvertently be assumed as inaccessible. These areas were particularly around Luru, Lukongo, and Luru regions on the northeastern sections and in the south eastern part of the area of study to the left of Umin, Uluthe, and Markuny regions. Finally, the accessibility surface from OSM (Figure 7c) data showed that the main areas that were accessible are those that were near major roads, and areas that were close to the central market in Sigomre. It was evident that village-level roads and tracks were yet to be mapped extensively on OSM.
From the accessibility surfaces, areas that could potentially exhibit improved estimated accessibility were motorcycle taxi tracks to be considered as the basis for accessibility assessment were highlighted (Figure 8). By comparing the accessibility surface from the motorcycle tracks against the surface of accessibility that was generated from the official road network, it was estimated that combining official roads with the GPS tracks of motorcycle taxis could probably improve the accuracy of accessibility estimation in up to 76% of the area of study. Similarly, integrating GPS-derived road networks with OSM derived road networks could potentially improve the estimation of accessibility in approximately 57% of the area of study. This implies that relying on official data and on publicly available data for estimation of accessibility in rural areas may potentially lead to inaccurate estimates of accessibility. The influence of inaccurate estimation of accessibility may be particularly relevant when modeling fine-scaled mobility and interaction patterns at local or village-level.
In order to quantify whether the GPS-derived routes coincided with the OSM and official routes, a 20 m × 20 m polygon fishnet was used to identify the cells through which GPS-derived routes, OSM tracks, and official roads traversed. The intersection method was then used to identify the cells in which GPS-derived routes intersected with OSM tracks and official roads, respectively. Out of the 7236 (20 m × 20 m) cells through which GPS-derived roads traversed, OSM routes were located in 2830 (approximately 39%) of the cells. On the other hand, official road networks intersected with 2316 (approximately 32%) of the 20 m × 20 m cells containing GPS-derived routes. Figure 9 represents the intersection between GPS-derived routes and the baseline data, as captured in the (a) official and OSM data.

4. Discussion

The aim of the work that is presented here was to tag volunteer motorcycle taxi drivers and to track the movement patterns of the motorcycle taxis as a proxy for collecting the data for mapping rural transport routes. By tracking 10 volunteer riders for a period of two week; approximately 0.23 million data points were collected used in the mapping exercise. Specifically, a semi-automatic method was applied to digitize road networks and to estimate distance-based accessibility in the study are. The output of main objectives in this task can be summarized in the following ways.
Firstly, this study demonstrated that GPS tracking of motorcycle taxis could provide vital and accurate information for mapping transport infrastructure in remote rural areas (Figure 4). Moreover, motorcycles do not only use the main and official roads but move within the villages. The GPS traces within the villages provide spatial information on important tracks and pathways that could come in handy in times of emergencies. For instance, maps resulting from such GPS tracks could be used when planning for vaccination and medical campaigns that target vulnerable members of the rural communities, who may not be able to walk for long distances.
Secondly, accessibility surfaces, which were generated from GPS tracks of motorcycle taxis were visually and mathematically more detailed and accurate when compared against estimated accessibility based on official road network data or on publicly available data like OSM. In particular, when considering the motorcycle taxi-derived road networks in the estimation of accessibility improved the results by approximately 76% when compared against accessibility surface from official government data and by 57% when compared against OSM data. Additionally, GPS-derived data could potentially improve the coverage of official road maps in rural areas by up to 70% and OSM data by up to 60% (Figure 9). It is therefore plausible to conclude that data on GPS trajectories of motor cycle taxis, as captured by GPS data loggers, could potentially augment other mapping initiatives and hasten the process of mapping rural transport routes.
Moreover, the motorcycle taxi riders were not constrained to the area of study; hence, we collect data for large areas by only tagging a small group of volunteers. For instance, GPS data from this study showed that, in some cases, riders traversed more than one administrative county in a single day. In fact, the entire data that we collected in this short experiment covered four different counties in western Kenya region. The counties included Siaya (where the area of study is located) and the neighboring counties of Busia, Kakamega, and Kisumu. It is therefore plausible to assume that, data from tracking of motorcycle taxis, could potentially be applied to model and to represent inter-regional mobility of people and goods.
Apart from locational data, GPS data loggers, which were deployed in this study could record the time of travel, speed of motion, altitude, and course of the journey. These additional data variables could provide the necessary parameters [49] for simulating the behavior of motorcycle riders. There are potential applications of GPS data of the kind collected in this experiment in data-driven models of taxi behavior [50], human mobility, in simulation of motorcycle-related accidents, and in representation of socio-economic interaction between different interconnected rural areas. Additionally, an understanding the mobility characteristics of motorcycle taxis, which are increasingly becoming major providers of transport services in rural areas within sub-Saharan Africa could provide the necessary data for simulating the contribution of the taxis to pollution and to health-related problems. This may be particularly relevant since, the passengers who use the taxis may be exposed to dust, noise, and adverse weather conditions [51], which may be linked to the increase of pneumonia cases and chest problems among riders and passengers.
The main limitations of this work included the fact that the candidate GPS data loggers that were deployed in the experiment could not transfer the recorded data to a centralized server in real-time. It was therefore necessary for the riders to hand in their loggers at the end of each week, and sometimes during the week for charging. This disrupted the data collection exercise as the riders could not be tracked continuously throughout the duration of the experiment. Sensors or trackers with the capability to routinely transfer the collected data to a centralized database management system would potentially improve the workflow and facilitate problem detection during the data collection process. Such an automated workflow could also facilitate the specification of real-time data-driven models by enabling a bi-directional communication between the data management system or models and the GPS sensors in the field. Secondly, we implemented a semi-automatic method of road network extraction. By manually digitizing the final roads, this could potentially slow down the process particularly if the area of interest is large. Moreover, the semi-automatic procedure could limit the replicability of the road extraction process. Finally, but not least, the number of loggers deployed in this experiment and the area of study were small. While these did not adversely influence the outcome of the experiment, a larger number volunteers and large area of study in different rural communities would probably reveal more interesting results, particularly as the data is to be applied to modeling mobility patterns and behaviors of a diverse group of riders. Further, to improve the validation of the data and output from this kind of experiment, a comparison of the GPS-derived data more accurate post-processing kinematic trajectories could be performed in limited test areas with geodetic GNSS receivers [52].
Future work could implement an automated sensor-to-maps strategy with an entirely automated workflow. We see potential application of such workflows in most rural areas in developing countries. Additionally, a direct link between the GPS-derived motorcycle taxi data collection efforts and web-based mapping platforms, like the OpenStreetMap could also improve the visibility of the mapping exercise and expose the data to a wider audience for timely validation and labeling. Such a framework could also find application during emergencies and in rural road infrastructure planning by revealing commonly traverse road networks that could be prioritized. Specifically, trajectories of riders could provide information on the accessible areas and the shortest routes to use for navigation. Finally, the maps emerging from GPS tracks of motorcycle taxis could be used to develop software apps for route planning by the riders and to regularize transportation charges that are levied on the users of the motor cycle taxis.

Funding

This research is supported by the Austrian Science Fund (FWF) through the Doctoral College GIScience at the University of Salzburg (DK W1237-N23).

Acknowledgments

The authors wish to appreciate most sincerely, the very important role of the volunteers who agreed to participate this experiment. In addition, the author wished to thank the anonymous reviewers of this manuscript for accepting to enrich the manuscript by providing very valuable comments. In addition, the authors is very grateful for the generous research funding from the Austrian Science Fund (FWF) and to the PhD advisory committee for providing very useful input for this work.

Conflicts of Interest

The author declares no conflict of interest.

References

  1. Velaga, N.R.; Beecroft, M.; Nelson, J.D.; Corsar, D.; Edwards, P. Transport poverty meets the digital divide: Accessibility and connectivity in rural communities. J. Transp. Geogr. 2012, 21, 102–112. [Google Scholar] [CrossRef] [Green Version]
  2. Iezzoni, L.I.; Killeen, M.B.; O’Day, B.L. Rural Residents with Disabilities Confront Substantial Barriers to Obtaining Primary Care. Health Serv. Res. 2006, 41, 1258–1275. [Google Scholar] [CrossRef] [PubMed]
  3. Banjo, G.; Gordon, H.; Riverson, J. Rural Transport: Improving Its Contribution to Growth and Poverty Reduction in Sub-Saharan Africa; Work Bank Group: Washington, DC, USA, 2012. [Google Scholar]
  4. Atuoye, K.N.; Dixon, J.; Rishworth, A.; Galaa, S.Z.; Boamah, S.A.; Luginaah, I. Can she make it? Transportation barriers to accessing maternal and child health care services in rural Ghana. BMC Health Serv. Res. 2015, 15, 333. [Google Scholar] [CrossRef]
  5. Downing, A.; Sethi, D. Health Issues in Transport and the Implications for Policy; Department for International Development: London, UK, 2001.
  6. Jones, S.; Tefe, M.; Zephaniah, S.; Tedla, E.; Appiah-Opoku, S.; Walsh, J. Public transport and health outcomes in rural sub-Saharan Africa—A synthesis of professional opinion. J. Transp. Health 2016, 3, 211–219. [Google Scholar] [CrossRef]
  7. Starkey, P. A Methodology for Rapid Assessment of Rural Transport Services; Work Bank Group: Washington, DC, USA, 2007. [Google Scholar]
  8. Popp, L.; McCole, D. Understanding tourists’ itineraries in emerging rural tourism regions: The application of paper-based itinerary mapping methodology to a wine tourism region in Michigan. Curr. Issues Tour. 2016, 19, 988–1004. [Google Scholar] [CrossRef]
  9. Haklay, M. How good is volunteered geographical information? A comparative study of OpenStreetMap and Ordnance Survey datasets. Environ. Plan. B 2010, 37, 682–703. [Google Scholar] [CrossRef]
  10. Koeva, M.; Muneza, M.; Gevaert, C.; Gerke, M.; Nex, F. Using UAVs for map creation and updating. A case study in Rwanda. Surv. Rev. 2018, 50, 312–325. [Google Scholar] [CrossRef]
  11. Ottichilo, W.; Khamala, E. Map Updating Using High Resolution Satelite Imagery—A Case of the Kingdom of Swaziland. Int. Arch. Photogramm. Remote Sens. 2002, 34, 89–92. [Google Scholar]
  12. Van der Molen, P. Rapid urbanisation and slum upgrading: What can land surveyors do? Surv. Rev. 2015, 47, 231–240. [Google Scholar] [CrossRef]
  13. Dunn, C.E. Participatory GIS—A people’s GIS? Prog. Hum. Geogr. 2007, 31, 616–637. [Google Scholar] [CrossRef]
  14. Elwood, S.; Goodchild, M.F.; Sui, D.Z. Researching Volunteered Geographic Information: Spatial Data, Geographic Research, and New Social Practice. Ann. Assoc. Am. Geogr. 2012, 102, 571–590. [Google Scholar] [CrossRef]
  15. Newman, G.; Wiggins, A.; Crall, A.; Graham, E.; Newman, S.; Crowston, K. The future of citizen science: Emerging technologies and shifting paradigms. Front. Ecol. Environ. 2012, 10, 298–304. [Google Scholar] [CrossRef]
  16. Mooney, P.; Corcoran, P.; Winstanley, A.C. Towards quality metrics for OpenStreetMap. In Proceedings of the 18th SIGSPATIAL International Conference on Advances in Geographic Information Systems, San Jose, CA, USA, 3–5 November 2010. [Google Scholar]
  17. Baruch, A.; May, A.; Yu, D. The motivations, enablers and barriers for voluntary participation in an online crowdsourcing platform. Comput. Hum. Behav. 2016, 64, 923–931. [Google Scholar] [CrossRef]
  18. Massung, E.; Coyle, D.; Cater, K.F.; Jay, M.; Preist, C. Using crowdsourcing to support pro-environmental community activism. In Proceedings of the SIGCHI Conference on Human Factors in Computing Systems, Paris, France, 27 April–2 May 2013; ACM: Paris, France, 2013; pp. 371–380. [Google Scholar]
  19. Ma, Y.; Richards, M.; Ghanem, M.; Guo, Y.; Hassard, J. Air pollution monitoring and mining based on sensor grid in London. Sensors 2008, 8, 3601–3623. [Google Scholar] [CrossRef] [PubMed]
  20. Reis, S.; Seto, E.; Northcross, A.; Quinn, N.W.; Convertino, M.; Jones, R.L.; Maier, H.R.; Schlink, U.; Steinle, S.; Vieno, M. Integrating modelling and smart sensors for environmental and human health. Environ. Model. Softw. 2015, 74, 238–246. [Google Scholar] [CrossRef] [PubMed] [Green Version]
  21. Bevly, D.M.; Ryu, J.; Gerdes, J.C. Integrating INS Sensors with GPS Measurements for Continuous Estimation of Vehicle Sideslip, Roll, and Tire Cornering Stiffness. IEEE Trans. Intell. Transp. Syst. 2006, 7, 483–493. [Google Scholar] [CrossRef]
  22. Agarwal, Y.; Balaji, B.; Gupta, R.; Lyles, J.; Wei, M.; Weng, T. Occupancy-driven energy management for smart building automation. In Proceedings of the 2nd ACM Workshop on Embedded Sensing Systems for Energy-Efficiency in Building, Zurich, Switzerland, 3–5 November 2010; ACM: Zurich, Switzerland, 2010; pp. 1–6. [Google Scholar]
  23. Jiang, B. Volunteered geographic information and computational geography: New perspectives. In Crowdsourcing Geographic Knowledge; Springer: Berlin, Germany, 2013; pp. 125–138. [Google Scholar]
  24. Atzmanstorfer, K.; Resl, R.; Eitzinger, A.; Izurieta, X. The GeoCitizen-approach: Community-based spatial planning—An Ecuadorian case study. Cartogr. Geogr. Inf. Sci. 2014, 41, 248–259. [Google Scholar] [CrossRef] [PubMed]
  25. Kays, R.; Crofoot, M.C.; Jetz, W.; Wikelski, M. Terrestrial animal tracking as an eye on life and planet. Science 2015, 348, aaa2478. [Google Scholar] [CrossRef] [PubMed]
  26. Schieltz, J.M.; Okanga, S.; Allan, B.F.; Rubenstein, D.I. GPS tracking cattle as a monitoring tool for conservation and management. Afr. J. Range Forage Sci. 2017, 34, 173–177. [Google Scholar]
  27. Roche, S.; Propeck-Zimmermann, E.; Mericskay, B. GeoWeb and crisis management: Issues and perspectives of volunteered geographic information. GeoJournal 2013, 78, 21–40. [Google Scholar] [CrossRef]
  28. Nadai, M.D.; Staiano, J.; Larcher, R.; Sebe, N.; Quercia, D.; Lepri, B. The Death and Life of Great Italian Cities: A Mobile Phone Data Perspective. In Proceedings of the 25th International Conference on World Wide Web, Montreal, QC, Canada, 11–15 April 2016; pp. 413–423. [Google Scholar]
  29. He, W.; Hwang, K.; Li, D. Intelligent carpool routing for urban ridesharing by mining GPS trajectories. IEEE Trans. Intell. Transp. Syst. 2014, 15, 2286–2296. [Google Scholar] [CrossRef]
  30. Bar Hillel, A.; Lerner, R.; Levi, D.; Raz, G. Recent progress in road and lane detection: A survey. Mach. Vis. Appl. 2014, 25, 727–745. [Google Scholar] [CrossRef]
  31. Porter, G. Transport Services and Their Impact on Poverty and Growth in Rural Sub-Saharan Africa: A Review of Recent Research and Future Research Needs. Transp. Rev. 2014, 34, 25–45. [Google Scholar] [CrossRef] [Green Version]
  32. Barbosa, K.G.; Lucas-Neto, A.; Gama, B.D.; Lima-Neto, J.C.; Lucas, R.S.C.; d’Ávila, S. Injuries and absenteeism among motorcycle taxi drivers who are victims of traffic accidents. J. Forensic Legal Med. 2014, 26, 15–18. [Google Scholar] [CrossRef] [PubMed]
  33. Qian, J. No right to the street: Motorcycle taxis, discourse production and the regulation of unruly mobility. Urban Stud. 2015, 52, 2922–2947. [Google Scholar] [CrossRef]
  34. Cao, L.; Krumm, J. From GPS traces to a routable road map. In Proceedings of the 17th ACM SIGSPATIAL International Conference on Advances in Geographic Information Systems, Seattle, WA, USA, 4–6 November 2009. [Google Scholar]
  35. Wang, J.; Rui, X.; Song, X.; Tan, X.; Wang, C.; Raghavan, V. A novel approach for generating routable road maps from vehicle GPS traces. Int. J. Geogr. Inf. Sci. 2015, 29, 69–91. [Google Scholar] [CrossRef]
  36. Zhang, L.; Thiemann, F.; Sester, M. Integration of GPS traces with road map. In Proceedings of the Third International Workshop on Computational Transportation Science, San Jose, CA, USA, 3–5 November 2010. [Google Scholar]
  37. Schroedl, S.; Wagstaff, K.; Rogers, S.; Langley, P.; Wilson, C. Mining GPS Traces for Map Refinement. Data Min. Knowl. Discov. 2004, 9, 59–87. [Google Scholar] [CrossRef]
  38. Liu, X.; Zhu, Y.; Wang, Y.; Forman, G.; Ni, L.M.; Fang, Y.; Li, M. Road Recognition Using Coarse-Grained Vehicular Traces; Hp Labs: Palo Alto, CA, USA, 2012. [Google Scholar]
  39. Chen, C.; Cheng, Y. Roads Digital Map Generation with Multi-track GPS Data. In Proceedings of the 2008 International Workshop on Education Technology and Training & 2008 International Workshop on Geoscience and Remote Sensing, Shanghai, China, 21–22 December 2008. [Google Scholar]
  40. Kasemsuppakorn, P.; Karimi, H.A. A pedestrian network construction algorithm based on multiple GPS traces. Transp. Res. Part C 2013, 26, 285–300. [Google Scholar] [CrossRef]
  41. Liu, L.; Andris, C.; Ratti, C. Uncovering cabdrivers’ behavior patterns from their digital traces. Comput. Environ. Urban Syst. 2010, 34, 541–548. [Google Scholar] [CrossRef]
  42. Feng, T.; Timmermans, H.J. Transportation mode recognition using GPS and accelerometer data. Transp. Res. Part C 2013, 37, 118–130. [Google Scholar] [CrossRef]
  43. Ndibatya, I.; Coetzee, J.; Booysen, M. Mapping the informal public transport network in Kampala with Smartphones: Making sense of an organically evolved chaotic system in an emerging city in Sub-Saharan Africa. In Proceedings of the Southern African Transport Conference, Pretoria, South Africa, 4–7 July 2016. [Google Scholar]
  44. Williams, S.; White, A.; Waiganjo, P.; Orwa, D.; Klopp, J. The digital matatu project: Using cell phones to create an open source data for Nairobi’s semi-formal bus system. J. Transp. Geogr. 2015, 49, 39–51. [Google Scholar] [CrossRef]
  45. Mandal, R.; Agarwal, N.; Das, P.; Pathak, S.; Rathi, H.; Nandi, S.; Saha, S. A system for stoppage pattern extraction from public bus GPS traces in developing regions. In Proceedings of the Third ACM SIGSPATIAL International Workshop on Mobile Geographic Information Systems, Dallas, TX, USA, 4–7 November 2014; pp. 72–75. [Google Scholar]
  46. Klous, G.; Smit, L.A.M.; Borlée, F.; Coutinho, R.A.; Kretzschmar, M.E.E.; Heederik, D.J.J.; Huss, A. Mobility assessment of a rural population in the Netherlands using GPS measurements. Int. J. Health Geogr. 2017, 16, 30. [Google Scholar] [CrossRef] [PubMed]
  47. Searle, K.M.; Lubinda, J.; Hamapumbu, H.; Shields, T.M.; Curriero, F.C.; Smith, D.L.; Thuma, P.E.; Moss, W.J. Characterizing and quantifying human movement patterns using GPS data loggers in an area approaching malaria elimination in rural southern Zambia. R. Soc. Open Sci. 2017, 4, 170046. [Google Scholar] [CrossRef] [PubMed] [Green Version]
  48. Hildebrand, E.; Gordon, M.; Hanson, T. Understanding the Travel Behaviour of the Rural Elderly. In Proceedings of the 39th Annual Conference of the Canadian Transportation Research Forum: Revolutions in Transportation, Calgary, AB, Canada, 9–12 May 2004. [Google Scholar]
  49. Vazquez-Prokopec, G.M.; Bisanzio, D.; Stoddard, S.T.; Paz-Soldan, V.; Morrison, A.C.; Elder, J.P.; Ramirez-Paredes, J.; Halsey, E.S.; Kochel, T.J.; Scott, T.W. Using GPS technology to quantify human mobility, dynamic contacts and infectious disease dynamics in a resource-poor urban environment. PLoS ONE 2013, 8, e58802. [Google Scholar] [CrossRef] [PubMed]
  50. Ranjit, S.; Witayangkurn, A.; Nagai, M.; Shibasaki, R. Agent-Based Modeling of Taxi Behavior Simulation with Probe Vehicle Data. ISPRS Int. J. GeoInf. 2018, 7, 177. [Google Scholar] [CrossRef]
  51. Olvera, L.D.; Guézéré, A.; Plat, D.; Pochet, P. Earning a living, but at what price? Being a motorcycle taxi driver in a Sub-Saharan African city. J. Trans. Geogr. 2016, 55, 165–174. [Google Scholar] [CrossRef]
  52. Fastellini, G.; Radicioni, F.; Schiavoni, A.; Stoppini, A. Comparison of kinematic parameters of a moving vehicle by GNSS measurements and inertial/GPS navigation system. In Proceedings of the 5th International Symposium on Mobile Mapping Technology (MMT), Padua, Italy, 29–31 May 2007; pp. 28–31. [Google Scholar]
Figure 1. Map of the study area representing official roads as captured in the data by national mapping agency superimposed on OpenStreetMap (OSM).
Ijgi 07 00309 g001
Figure 2. Illustration of (a) Typical rural motorcycle tracks (b) i-gotU GT-600 Global Positioning System (GPS) travel and sports data logger (c) A motor cycle rider strapping a GPS data logger on the wrist while riding a motorcycle taxi.
Ijgi 07 00309 g002
Figure 3. Validation data (a) Locations of the full extent of 5381 data points that were used in the verification process. (b) A subsection of the datasets.
Ijgi 07 00309 g003
Figure 4. GPS traces of motorcycle taxis in Sigomre area showing a higher concentration of the points closer to the market center and in the surrounding villages.
Ijgi 07 00309 g004
Figure 5. Distribution of distances between GPS data points and the centerline of official road sections in the validation section.
Ijgi 07 00309 g005
Figure 6. Traces of road network as visualized from the heat map resulting from the GPS traces of motorcycle taxis.
Ijgi 07 00309 g006
Figure 7. Accessibility surfaces as computed from Euclidean distance from (a) GPS-derived road networks (b) official road networks and (c) Open Street Map road networks.
Ijgi 07 00309 g007
Figure 8. Potential improvement in estimation of accessibility were the GPS data from motorcycle taxis to be combined with (a) official roads and (b) OSM data. The orange parts depict the areas whose accessibility was estimated accurately based on baseline data, while the areas in blue color shows areas whose accessibility improved when estimated from the GPS-derived road networks.
Ijgi 07 00309 g008
Figure 9. Potential improvement in map coverage of GPS-derived roads when compared against (a) data from official sources and (b) OSM tracks.
Ijgi 07 00309 g009

