1. Introduction
The intersection is a basic element of the urban road network. Setting up an auxiliary through lane effectively relieves traffic congestion by increasing the number of lanes at intersections [
1,
2,
3,
4,
5]. However, the number of lanes at intersections continually changes due to alterations in urban construction, traffic control, and lane functions. The timely detection of information on intersection auxiliary through lanes is therefore necessary to facilitate the rapid updating of navigation data. Traditional methods for lane information extraction, such as professional measurements and the interpretation and recognition of road features from images and videos, are characterized by high data acquisition costs and long update cycles, which result in update lag and obsolete road data [
6].
A high-speed differential global positioning system (DGPS) can be used to extract lane information rapidly from current ubiquitous and massive space-time trajectory data containing abundant road information. Although this system can extract information on lane level [
7,
8], lane centerline [
9], lane boundary line [
10], and lane position and width [
11], its implementation requires sophisticated data acquisition equipment and complicated processes. Moreover, its sampling area is limited.
By contrast, the use of floating car data (FCD) is characterized by large data volume, strong real-time capability, wide coverage, and low cost. The timely detection of road information using the trajectory data of floating cars is a hot research topic [
12,
13,
14,
15,
16]. Tang et al. [
17] used low-frequency FCD to identify the intersections of urban road networks automatically and to extract the detailed structure of the intersection. These methods show that FCD can enable rapid access to information on urban road intersections and lanes.
Road construction generally widens intersections on the side of the stop line to relieve traffic pressure based on the space-for-time principle. Existing research on auxiliary through lanes have mainly focused on the analysis of lane selection models and capacity. Video recording, intersection monitoring, and manual survey methods are commonly used in these studies [
1,
2]. These methods have the disadvantages of high data collection cost and limited data coverage as well as the inability to obtain timely access to changes in the number of auxiliary through lanes at intersections due to traffic control, urban construction, and lane function changes. Although lane information can be obtained through low-cost FCD, related research has mainly focused on detecting the number of lanes on the road segment and the structure of the intersection [
18]. Thus, a new approach based on FCD for exploring auxiliary through lane information at intersections must be explored.
In this study, a road is divided into different regions (intersection and non-intersection) in accordance with the Urban Road Intersection Planning Specification [
19], and the spatial distribution characteristics of the FCD covered by the regions are analyzed. The regions are segmented in intervals using a vector map of the city road network, and an improved amplitude-limiting average filtering method is used to eliminate gross errors and obtain the characteristic parameters of the target data. Subsequently, a classifier is constructed using sections with a known number of lanes and an FCD coverage state as the training samples, and the number of lanes is confirmed using a gradient-boosted decision tree (GBDT). Finally, the different regions of the road are compared and analyzed, and road intersection information, especially the number of lanes at the intersection, is then effectively acquired. This method compensates for the inadequacies of traditional road detection technology in the extraction of intersection lane information using FCD to improve the accuracy rate of lane detection. Furthermore, it promptly and efficiently detects the number of auxiliary through lanes at an intersection and enables the updating of road network navigation data.
2. Related Works
This research is mainly aimed at detecting auxiliary through lanes at intersections based on floating car data (FCD). So far, research on the timely detection of road information using FCD have focused on the calculation of number of road lanes and the detection of the geometric structure of intersections; there is a lack of research on methods and techniques for the detection of auxiliary through lanes at intersections. The existing related research work can be divided into two major parts according to the research content: road intersection structure and road lane information detection methods.
Research on road intersections in the field of traffic control have mainly focused on lane model selection and lane capacity analysis, and field surveys have been generally used to obtain experimental data. Ma et al. [
1] used a combination of field investigation and statistical analysis to study the traffic characteristics of the auxiliary through lane at the intersection. Guo [
2] adopted the research method of lane selection model and traffic capacity analysis to simulate and analyze the canalization and traffic capacity of the auxiliary through lane. Tarawneh et al. [
4] used field data to analyze the length and utilization rate of auxiliary through lanes and then studied the effect of auxiliary through lanes on utilization of downstream right-turn volume. The above research methods have limited data coverage and cannot describe the overall situation of auxiliary through lanes at full time.
Detection of road lane information has become a research hotspot in the realm of geo-information, with the increase in lane-level navigation requirements. Existing road information acquisition technologies mainly include the use of professional measurement, images and videos, high-quality Global Positioning System (GPS) data, and FCD, as shown in
Table 1.
Extracting road information using dedicated high-quality GPS, Rogers [
7] combined spatial-temporal GPS trajectory data with a hierarchical agglomerative clustering algorithm to extract road centerlines and lane boundary lines. Relevant scholars have done a lot of research in the use of space-time GPS trajectory data on this basis to detect lane information of urban roads and the geometry structure of complex intersections. Chen et al. [
8] used a Gaussian mixture model (GMM) to model the distribution of GPS trajectory data of a shuttle vehicle across multiple traffic lanes and automatically computed the number and locations of driving lanes on a road. Edelkamp et al. [
9] used hierarchical clustering algorithms to cluster DGPS trajectories, treating the number of clusters as the number of lanes and using the cluster center as the center of the lane. Wagstaff et al. [
10] proposed to use the K-means clustering algorithm to cluster high-precision DGPS trajectories, analyze the number of lanes from the results, and obtain lane boundaries. Liu [
20] used the high-precision trajectory data obtained by the measurement vehicle to construct a detailed structure of urban intersections and generate urban traffic networks. Although the use of high-quality GPS data to extract lane information has the advantages of high quality and reliable accuracy, its data coverage in time and space is limited and cannot describe the changes in the whole urban road information.
Li and Huang [
13] proposed a GPS global map-matching method that combines the restrictions of urban road network traffic with the geometric connectivity of roads to extract road information based on FCD. Uduwaragoda et al. [
21] proposed a method that statistically mines GPS trajectory data obtained from vehicles to generate a lane-level digital map of roads that is independent of lane width and lane parallelism and can handle lane splits and merges. Tang et al. [
22] analyzed the characteristics of FCD and used the density clustering method based on Delaunay triangulation to optimize the data and built a naive Bayes classifier by detecting the coverage width of the floating car data and its distribution in the cross section of a road. The naive Bayes classification method was used to determine the number of lanes in the target road section. Subsequently, Tang et al. [
23] further used the constrained Gaussian mixture model to simulate the distribution of FCD on the road surface, compared the advantages and disadvantages of the model under different Gaussian component combinations, and selected the number of Gaussian components corresponding to the optimal model for the number of lanes. This improved the overall extraction accuracy of the number of lanes in the experiment to 82.3%. Wang et al. [
24] used high-sampling-frequency FCD to extract lane information from urban road network data and focused on a method for detecting intersections in complex road networks from low-precision FCD. Tang et al. [
17] identified the turning point pairs in the low-frequency FCD trajectory data, identified intersections by spatial clustering of distances and angles, and used the range of the intersection and turning point pairs to extract urban road network intersections and their detailed structure. The above methods all used FCD to achieve rapid acquisition of information on urban road intersections and road lanes. However, there is not yet any detailed study on the identification of an auxiliary through lane at intersections. The next section of this paper proposes a technical process using FCD to detect auxiliary through lanes at intersections.
3. Detection Method
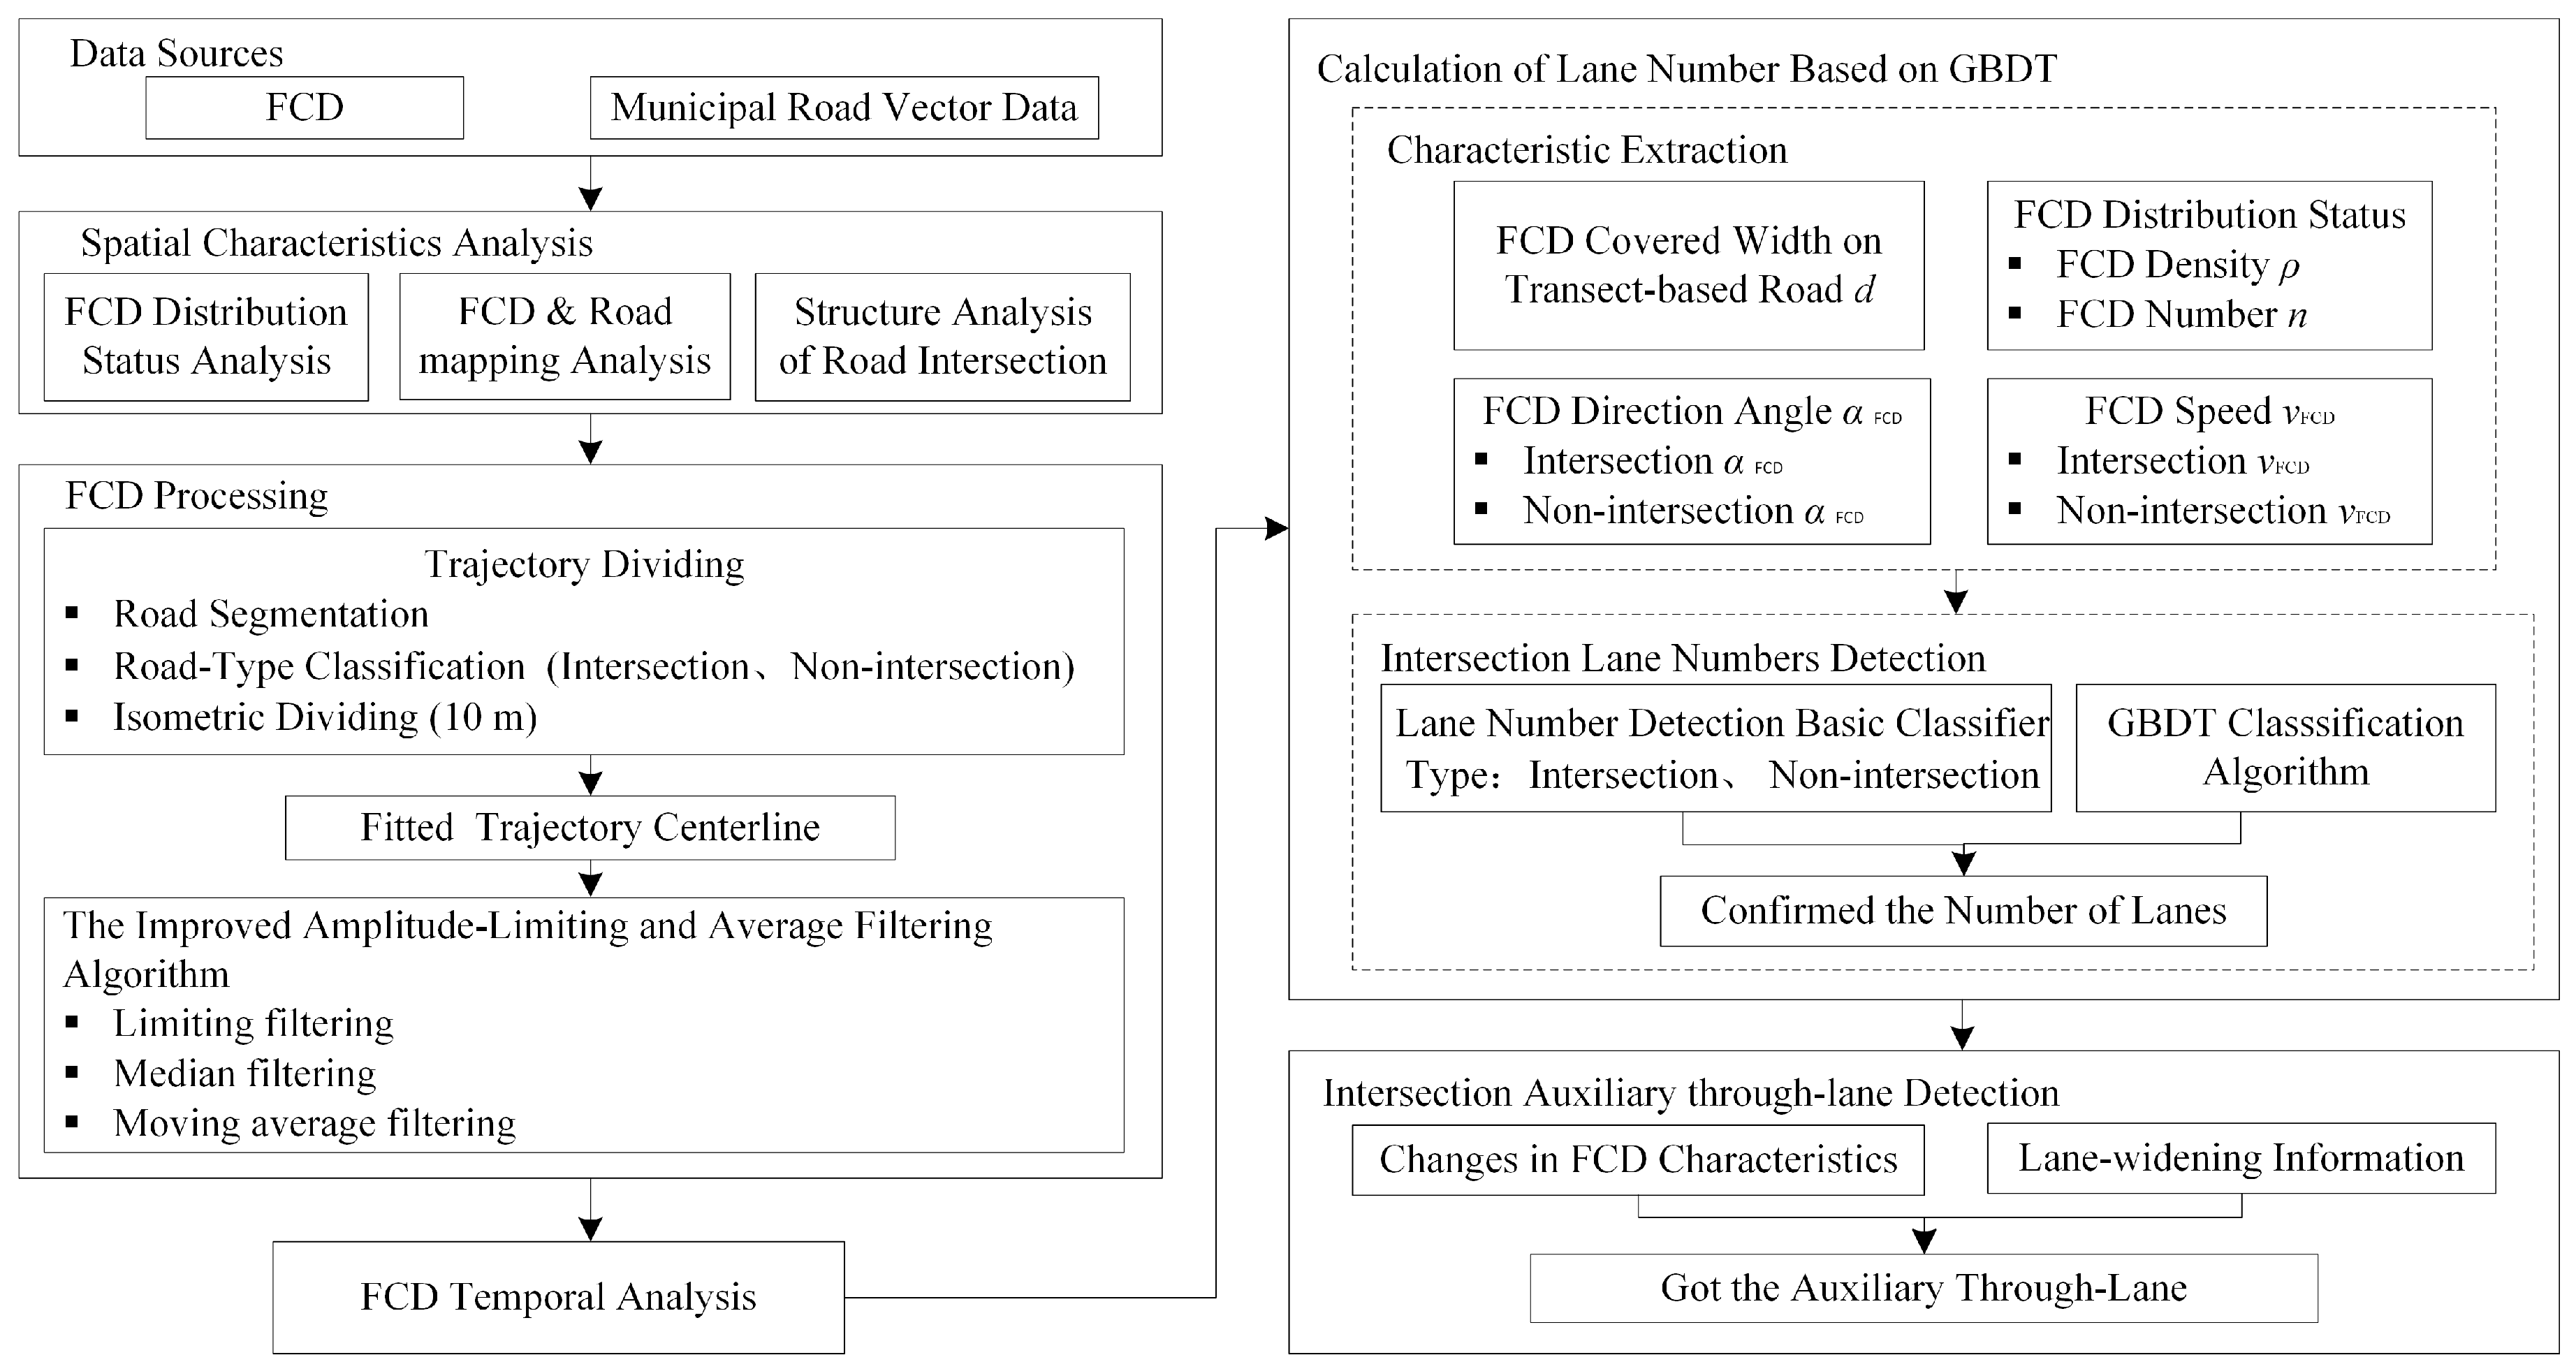
A specific data processing and calculation process for the detection of the intersection auxiliary through lane from FCD is established. First, the spatial distribution characteristics of the FCD on the lanes at the intersection are analyzed based on the four characteristic parameters of the distribution of FCD for GBDT classification. These characteristics are: (1) the road coverage width of the FCD, the distribution status of the FCD in a road cross section, the direction angle of the floating car front, and the speed of the floating car; (2) the mapping relationship between the FCD and the road network; (3) the time cycles of the FCD; and (4) the structure of road intersections. Second, the FCD is segmented, and the improved amplitude-limiting average filtering method is used to eliminate gross errors. Concurrently, the Eigenvalues required for GBDT classification, such as standardized datasets, are acquired. Finally, the auxiliary through lane at the intersection is identified through a GBDT-based classification method. The technical process of the detection method is shown in
Figure 1.
3.1. Analysis of the Spatial Distribution Characteristics of FCD
At present, auxiliary through lanes are established at the upstream and downstream of intersections [
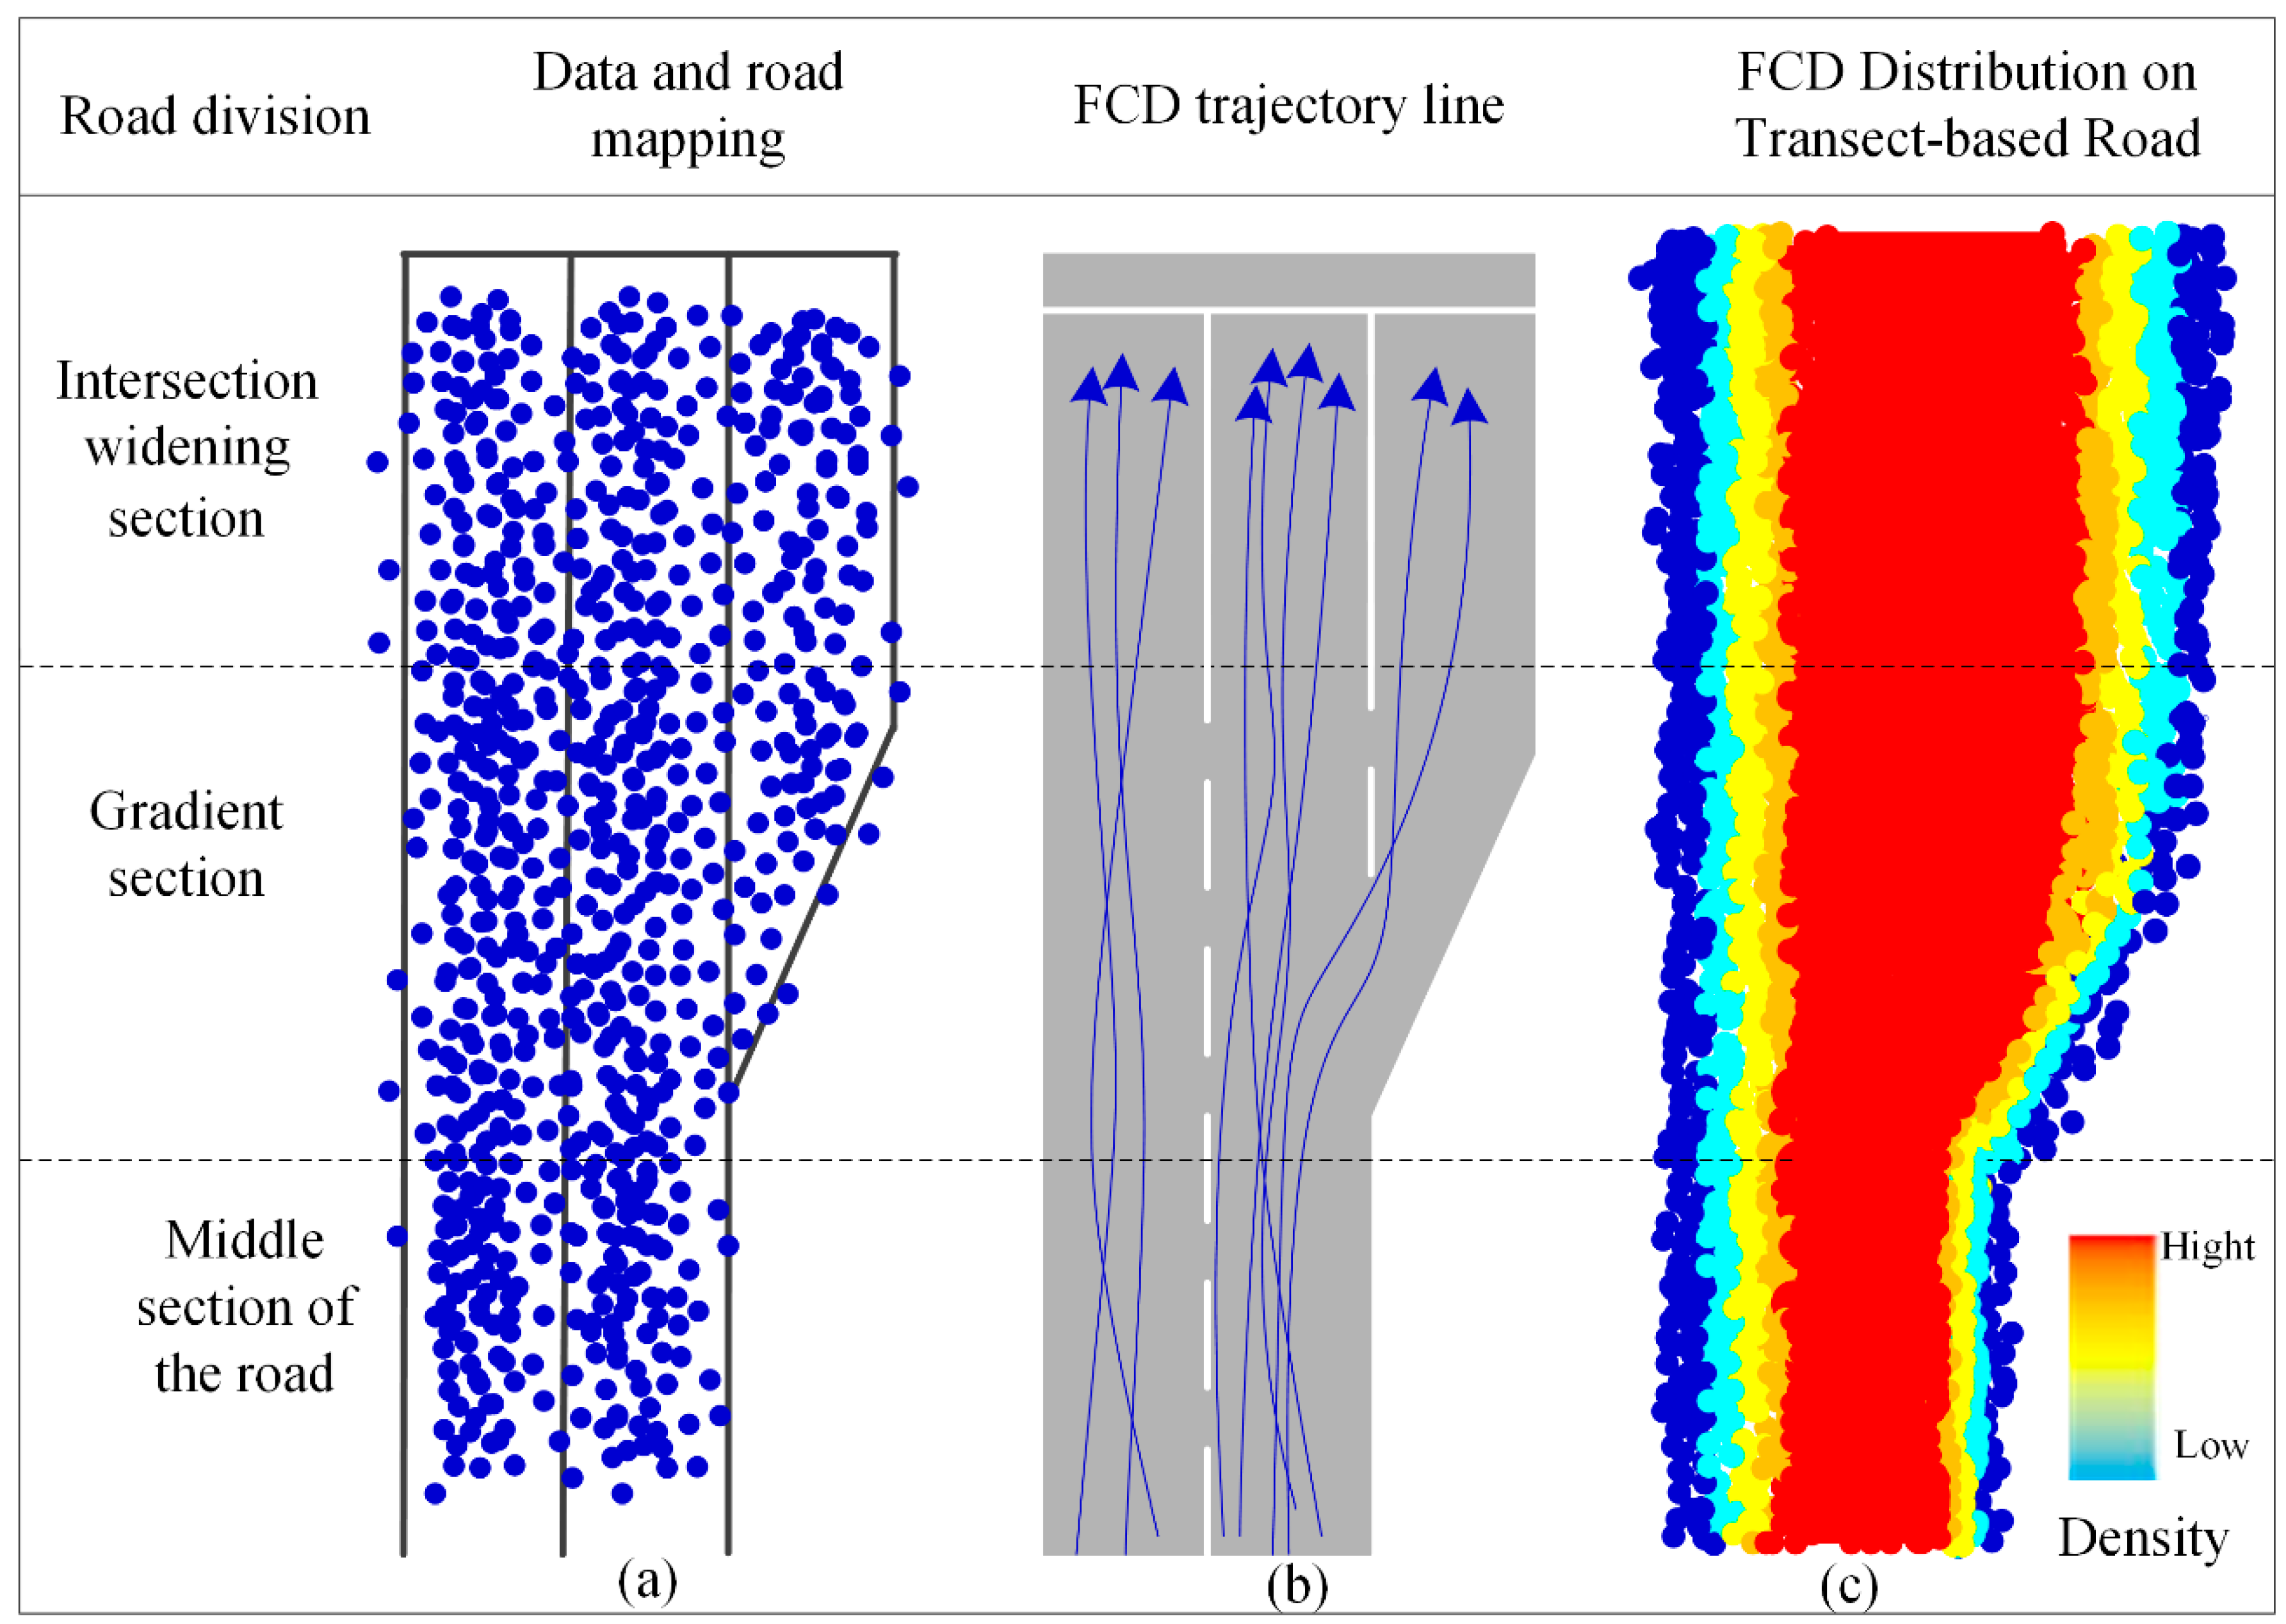
1]. However, floating car trajectories have different characteristics in different road sections due to road traffic regulations. According to existing intersection design and construction specifications [
19], roads are divided into three sections: intersection widening section, gradient section, and road middle section. The spatial distribution characteristics of the floating car trajectory in different sections of the road are mainly reflected by the mapping relationship between the FCD and road network, the influence of road constraints, the situation of trajectory changes, and the distribution of the FCD at the road intersection, as shown in
Figure 2.
The GPS coordinates of the floating car are continually updated at an observation frequency of approximately 40 s; thus, the data completely encompasses all the lanes of the road middle sections and intersections in the city, as shown in
Figure 2a. The distribution of the floating car trajectory on the road surface can reflect the situation of road lanes; thus, the change in the lanes can be observed from the road gradient section and compared with that of the middle section of the road.
Figure 2b shows that the number of lanes at the intersection has increased. The trajectory data are unclear on the boundary lines of each lane of the road. Owing to the driving habit of selecting the middle lane and the normal distribution of GPS errors, the density of the trajectory data at the centerline of the road is the highest on the road cross section and decreases toward both sides of the road, as shown in
Figure 2c.
3.2. FCD Preprocessing
The data preprocessing methods in References [
18,
19] do not consider the different FCD spatial distribution characteristics caused by different driving behaviors at intersections and non-intersection road sections and only divide the FCD equidistantly along the driving direction. The Delaunay triangulation method is used to remove drift coordinates, and the FCD coverage width is then calculated. This processing method can eliminate the abnormal distribution coordinate points of the FCD on the cross section of the middle section of the road. However, the presence of auxiliary through lanes at some intersections, such as in the road cross section near the intersection, increases FCD coverage width and decreases FCD distribution density compared with that in the middle section of the road. The Delaunay triangulation method is unsuitable for the FCD covered in the area near the road intersection. Thus, the authors used the improved amplitude-limiting average filtering method [
25,
26] to eliminate gross errors and obtain relevant attributes, such as trace coverage width and density distribution, from the FCD queue, thereby reducing data retrieval time and costs. The advantages of this method include ease of operation and efficiency of use.
The authors preprocessed the original FCD after analyzing the improved amplitude-limiting average filtering method and the FCD spatial distribution characteristics at the intersection with the auxiliary through lane. Data preprocessing is mainly divided into the following three steps: (1) Referring to the vector map, two types of road areas are divided in accordance with the distance between the road node and the distance from the node. The intersection area is defined as the area within 100 m from the intersection node, and the remaining areas are considered as non-intersection areas [
19]. Next, one-way equidistant basic FCD research units are obtained by dividing the FCD covered by the road segments in each area by 10 m and combining with the direction of the GPS trajectory; (2) Principal component analysis [
27] is used to obtain the main direction of the FCD segment, the centerline of the FCD covered by each road segment is fitted, and the distance from each FCD point to the centerline is then detected; (3) The improved amplitude-limiting average filtering method is used to eliminate drift points based on the maximum width of the road design [
19] and FCD coverage width and density. The experience threshold of amplitude-limiting filtering of the distance
from the FCD point to the trajectory centerline is set to 15 m. Subsequently, the average distance
between the trajectory points and the trajectory centerline in the FCD segment, the average velocity
of the FCD trajectory, and the average direction angle
are used as constraint conditions, and the improved amplitude-limiting average filtering method is used to eliminate the drift points contained in the original FCD.
3.3. FCD Temporal Analysis
As the incidence sampling rate of the low-frequency FCD used in the experiment is 40 s, in the inversion of road information, the coverage density of FCD on the road surface is sparse in a single day. It is difficult to meet the road detection requirements, thus the temporal fusion of the FCD is needed. The principle of this is to add the cleaned FCD on a day-by-day basis, and carry out superposition analysis, and calculate the width of FCD covered on the road surface after daily superposition until the coverage width does not change. This will allow the number of days to be used as the time for extracting lane information using FCD.
3.4. Auxiliary Through Lane Detection Based on GBDT
GBDT is a widely used nonlinear classification model [
28,
29,
30,
31]. Based on the principle of boosting algorithms, a new decision tree in the gradient direction is established to reduce the residual error in each iteration, and classification accuracy is improved through iteration. During actual situations, the error of locating a taxi in the city causes drift in the coordinates of the collected trajectory point. The distribution of the trajectory points on the road surface cannot directly describe the specific number of lanes, but the law that each trajectory point falls on the lane follows geometric distribution. Thus, a reasonable model can be established using trajectory point distribution characteristics to obtain the number of lanes.
3.4.1. Characteristic Selection
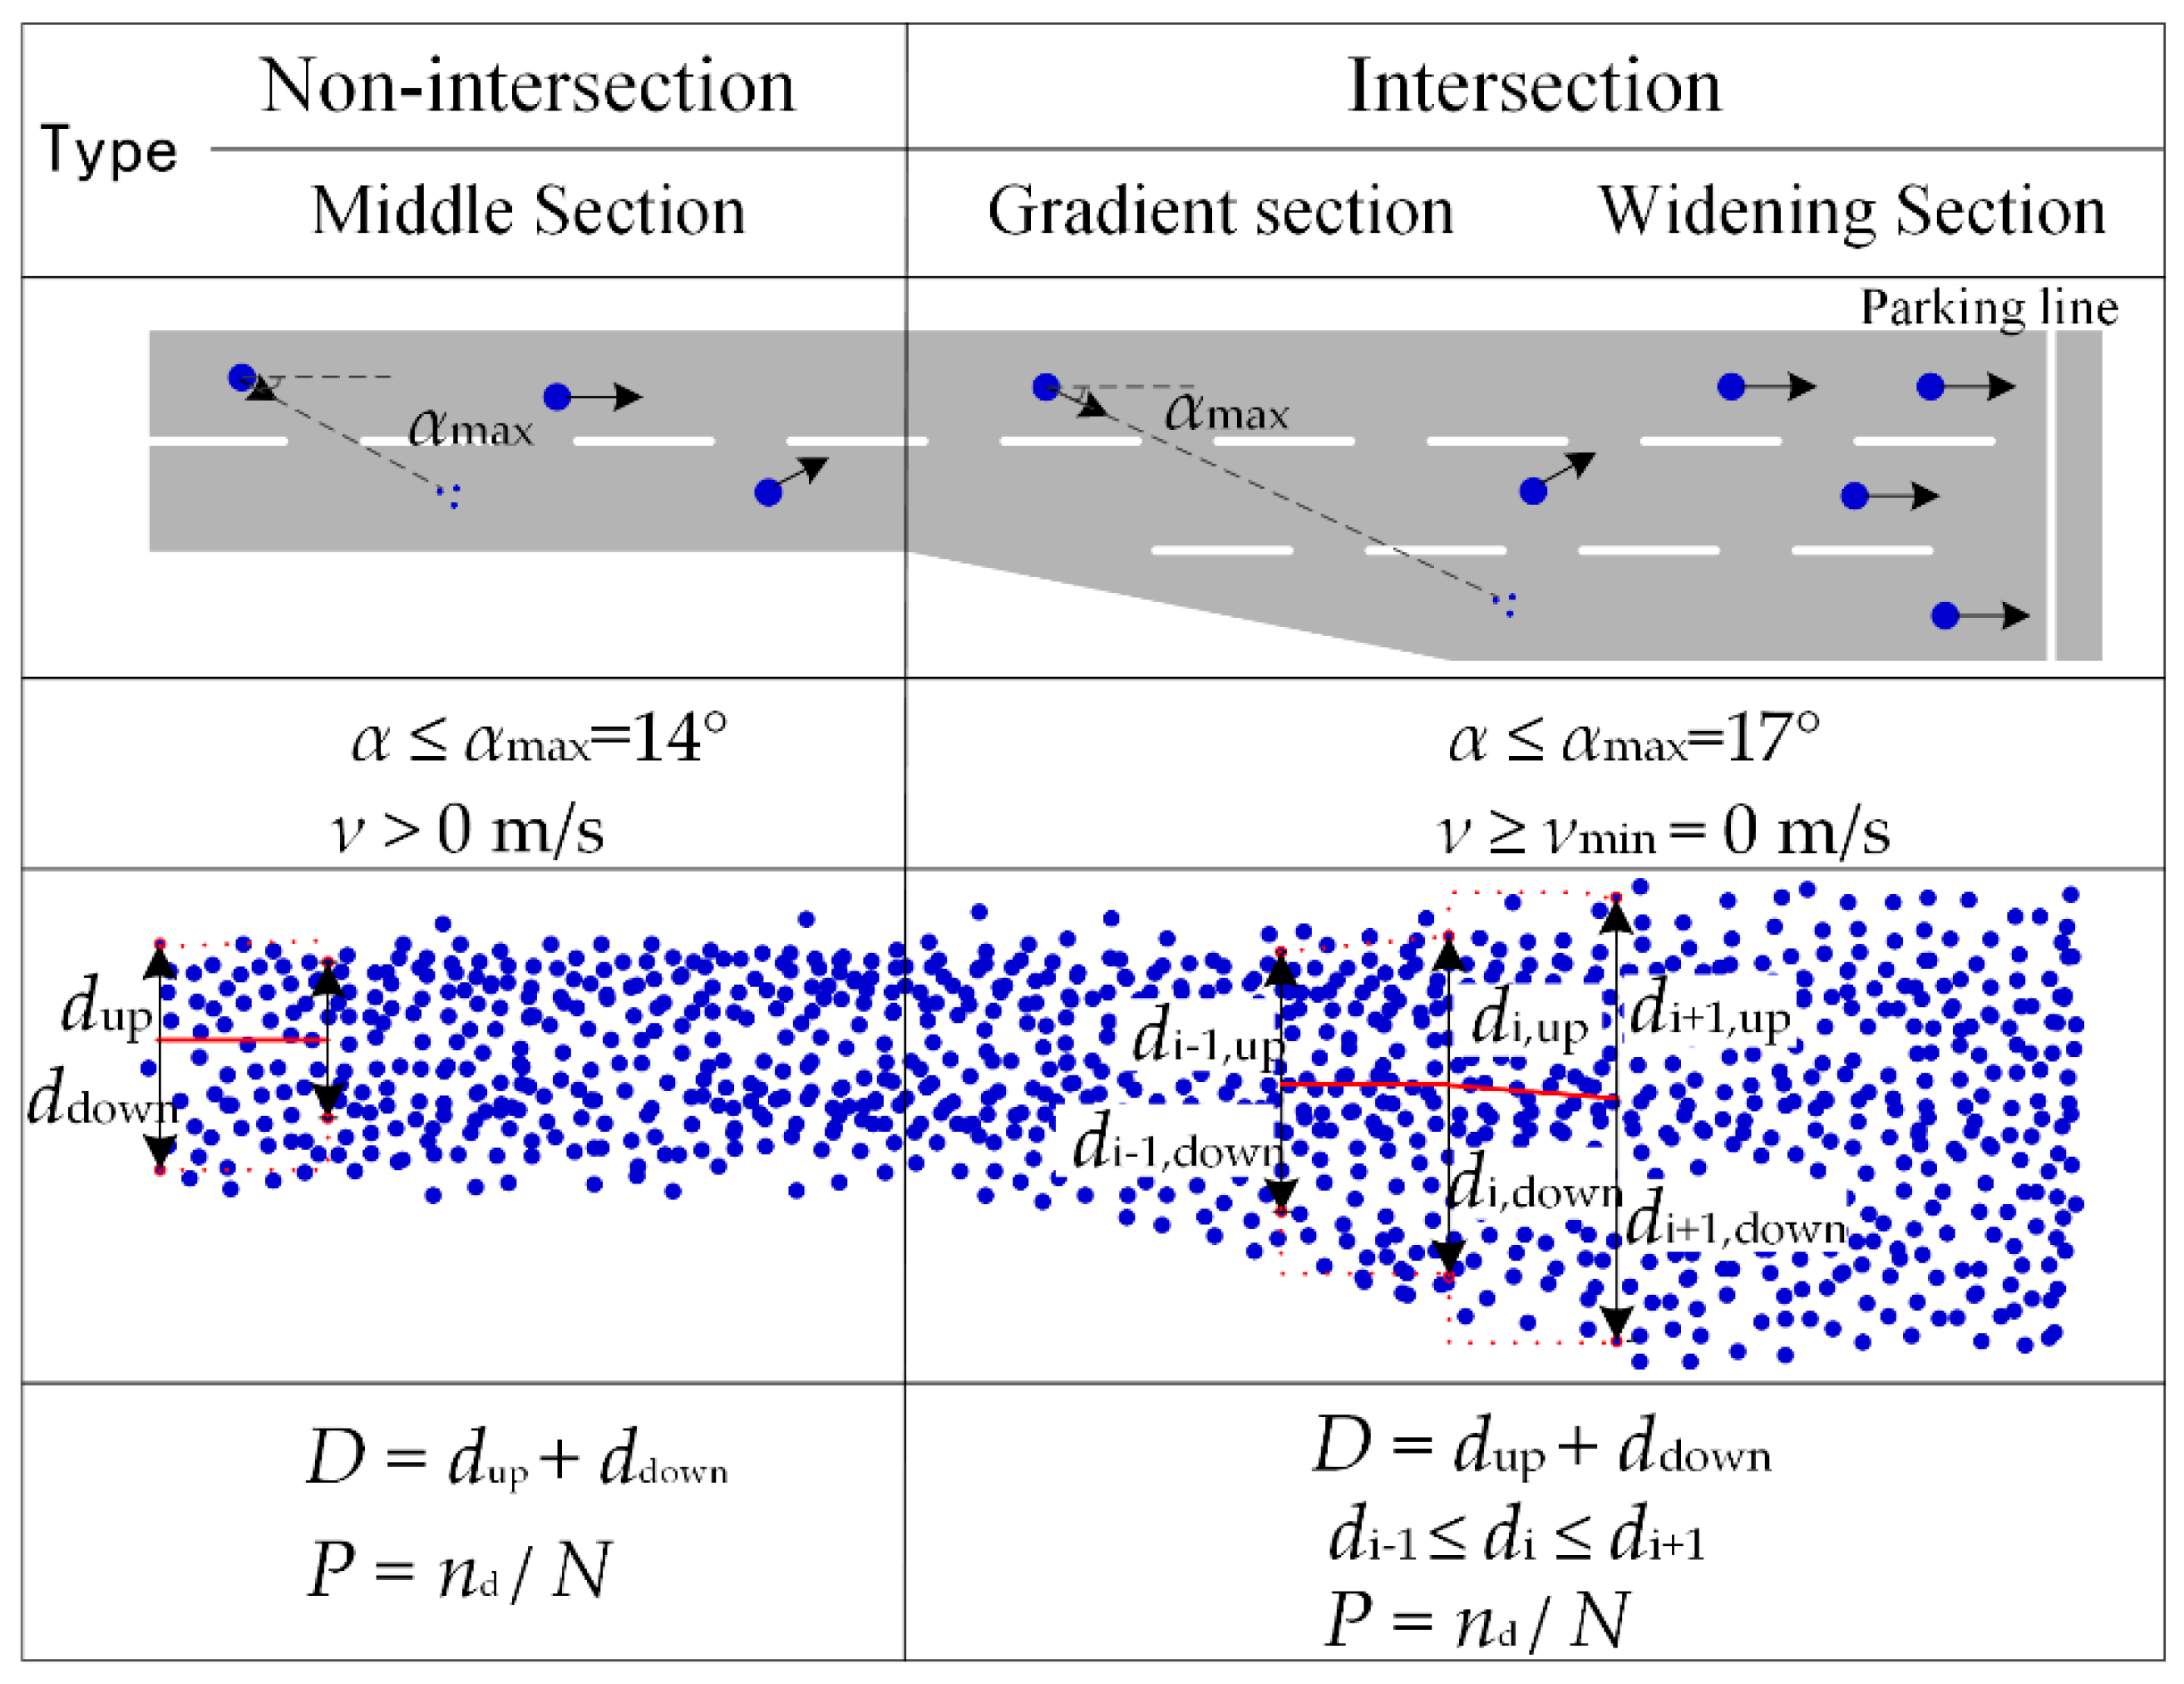
Four characteristic parameters of FCD distribution on the road segment must be obtained before the number of lanes can be detected. These parameters are the coverage width D of the FCD on the road cross section, the distribution density P, the direction angle of FCD A, and the velocity V.
Figure 3 uses
as the angle between the front direction of each FCD trajectory point and the main direction of the trajectory. According to the Urban Road Intersection Planning Specification [
19] and the inverse trigonometric function solution, the segment is the intersection-type when
and the non-intersection type when
. According to the general rule of vehicle driving and the influence of traffic signals, the driving speed of each FCD trajectory point
is >0 when the segment is the non-intersection-type and ≥0 when the segment is the intersection-type. Regarding the
Jth FCD segment,
is the distance from the centerline of the FCD point above the trajectory centerline;
is the distance from the centerline of the FCD point below the trajectory centerline;
is the coverage width of the FCD on the road cross section;
P is the trajectory point density in each unit width, i.e. the trajectory centerline of the segment equidistantly divides 100 units by the distance
d’, the ratio of the number
n of trajectory points in each segmentation unit to the total number
N in the segment, where
.
3.4.2. Basic Classifier Construction
GBDT is a supervised learning algorithm. When GBDT is used to classify FCD samples, the number of classifications must be given. The road segments with a known number of lanes (such as class labels) and FCD spatial characteristics
are used as training samples to establish a classifier containing the corresponding relationship between the number of lanes and the spatial characteristics of FCD (
Table 2) for convenience and efficiency. According to the FCD spatial characteristics of the segment and the basic classifier, the possible number of lanes of the sample to be tested (the segment number of the unknown lane) is estimated and then the GBDT model is used to confirm the final number of lanes. The GPS error obeys a normal distribution [
19] and follows the 3
σ2 principle. The widths of the FCD under
σ2, 2
σ2, and 3
σ2 are selected as the Eigenvalues of the FCD coverage width on the road cross section. The geometric structure and traffic characteristics of the road intersection are different from those of the middle of the road; thus, the basic classifier of the number of lanes based on the probability density of FCD is divided into two categories—intersection-type and non-intersection-type—to ensure the representativeness of the sample data.
3.4.3. Lane Acquisition Based on GBDT Classification
The FCD segment with a known number of lanes is used as the training sample, and the GBDT model is trained in accordance with the FCD spatial characteristics of the training sample to divide the sample effectively and allow its measurement. Finally, the number of lanes of the sample to be measured is determined.
The training sample
X contains
n FCD trajectory points:
. The road surface with
k lanes is covered with
n points,
is the
ith trajectory point characteristic, and
is the type of lane where the
ith point is located (for example, Lane 1). The loss function is defined as
,
is the lane type identified by GBT model [
28,
31],
m is the number of iterations (such as
m trees), and
k is the number of categories.
The 0th iteration (initialization) of the GBT model,
, is a fixed value with the following formula:
where
x is the FCD spatial characteristic,
is the lane type initialized by this iteration, and
is the
mth decision tree divided from the
mth iteration. The best residual fitted value for the division result is
, the fitted value for the division result of
m-1th decision tree is
, residual
is:
A new training set
is obtained from Formula (2). When the
m + 1th decision tree
is trained, the corresponding leaf node region is
, and the best fitting value of the leaf region
is calculated.
where
, The
mth updated model obtained from decision trees
and
is:
The final GBT model
is obtained after
m (the maximum number of) iterations. The FCD of the known number of lanes is selected as the training sample, then the corresponding GBDT models are obtained for different classification numbers (such as the number of lanes,
k). The number of lanes of the road segment to be measured is obtained by estimating the candidate number of lanes belonging to the road segment by comparing the FCD characteristics of the segment and the basic classifier
(for example, the segment may have two or three lanes). The FCD in the segment is divided into different numbers of lanes using the GBDT models of different classification combinations and the FCD in each segment can provide multiple lane number division results. Based on the statistics of the different classification results and the model entropy [
8,
30], the authors selected the number of classifications for which the distribution of FCD on each lane is relatively uniform and the model entropy is as small as the number of lanes in the segment.
3.5. Intersection Auxiliary Through Lane Detection
Auxiliary through lane acquisition involves two processes: lane number acquisition and auxiliary through lane detection. Regarding auxiliary through lane detection, the variations in the number of lanes across different road segments are analyzed. Lane numbers in the same types of segments and different types of segments also are analyzed comparatively.
3.5.1. Analysis of Changes in FCD Characteristics
Owing to the differences in the units of measurement of the four characteristic parameters of the FCD, minimum-maximum normalization must be used to nondimensionalize each characteristic parameter for the analysis of FCD space distribution characteristics at intersections and non-intersections in the same value range (between 0 and 1).
A road is divided into n segments where the first i segments are denoted by , and the characteristic variables of the segment are normalized, then: .
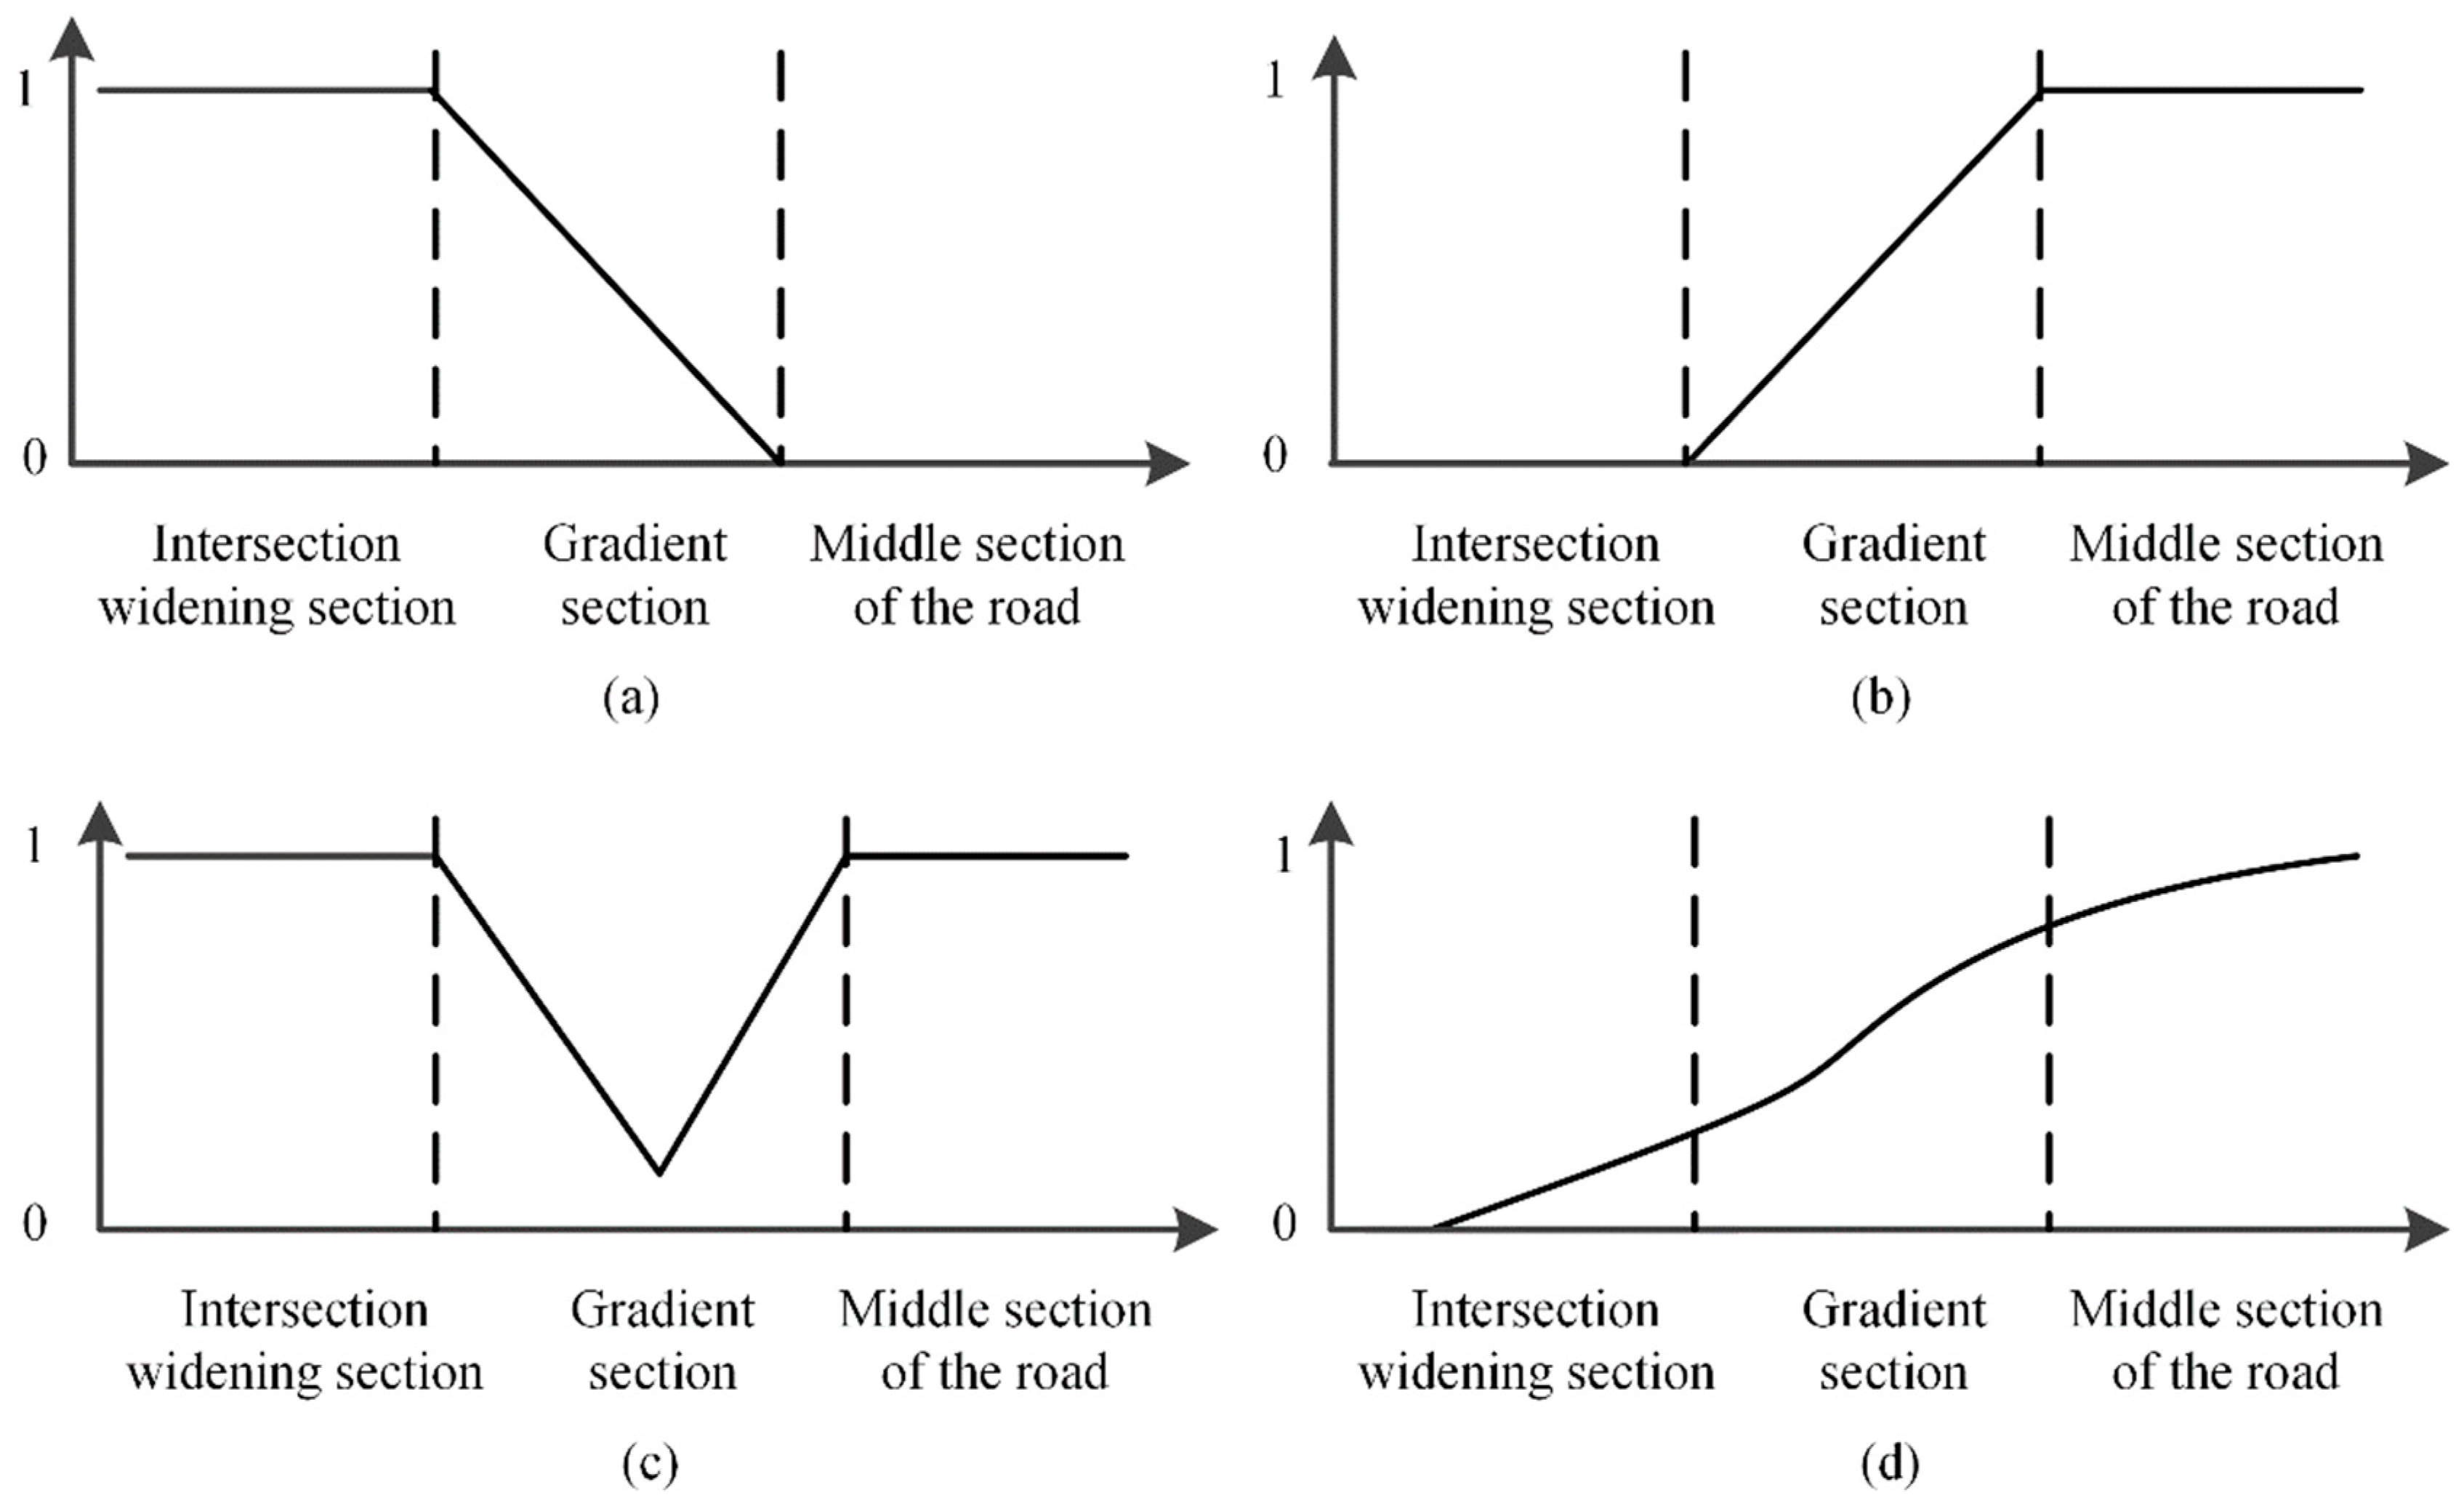
Considering the continuous segmentation of an entire road, the change trend of the four characteristic parameters of the FCD is analyzed. Taken from the intersection widening section to the middle section of the road, the density of the trajectory points of each lane decreases, then the trajectory coverage width increases, as shown in
Figure 4a,b. The angle
A of the direction of the FCD in the gradient segment shows a trend of decreasing first and then increasing, as shown in
Figure 4c. Regarding the speed characteristic
V of the FCD, the speed from the middle section to the intersection division is gradually reduced. Following normalization, the speed gradually approaches 0 at the intersection portion, as shown in
Figure 4d.
3.5.2. Analysis of Lane-Widening Information
The number of road lanes is obtained through GBDT classification, and the numbers of lanes in different areas (intersections/non-intersections) on the same road are compared.
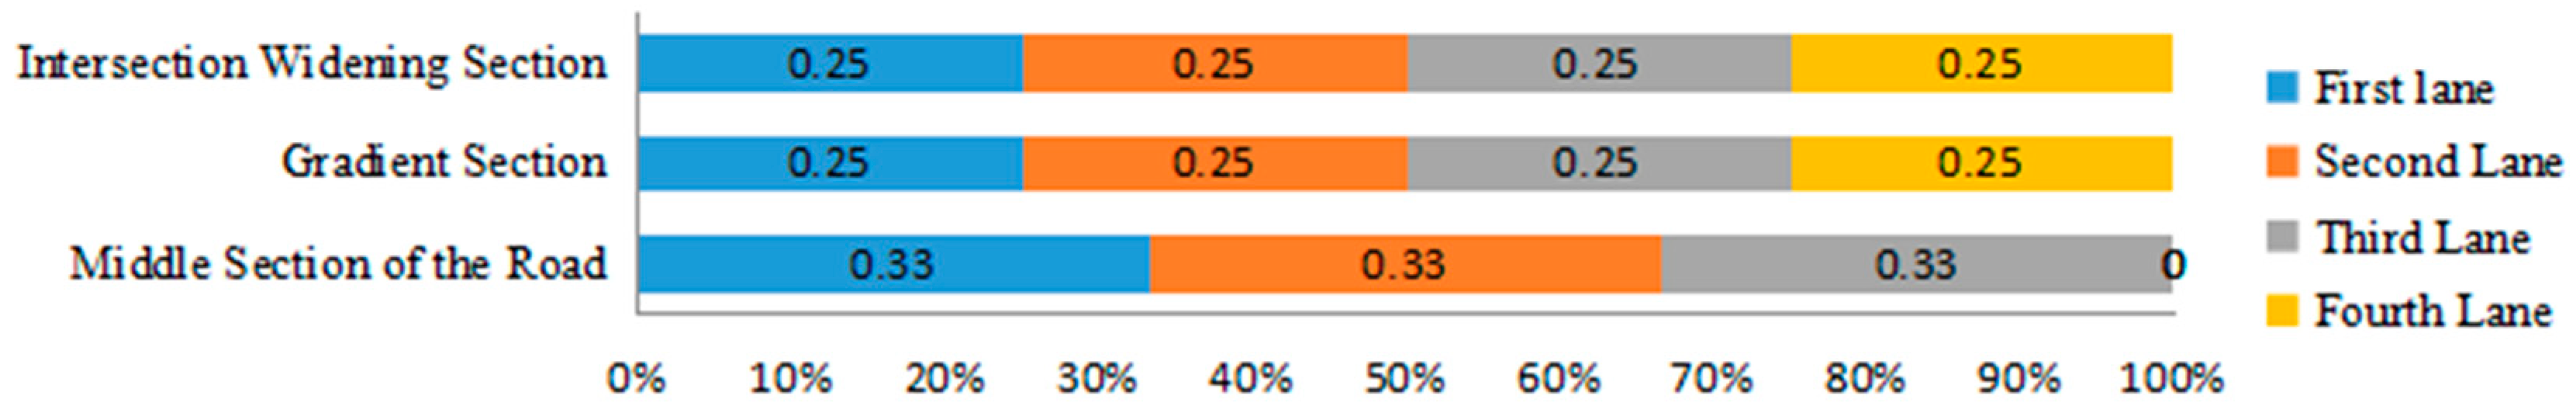
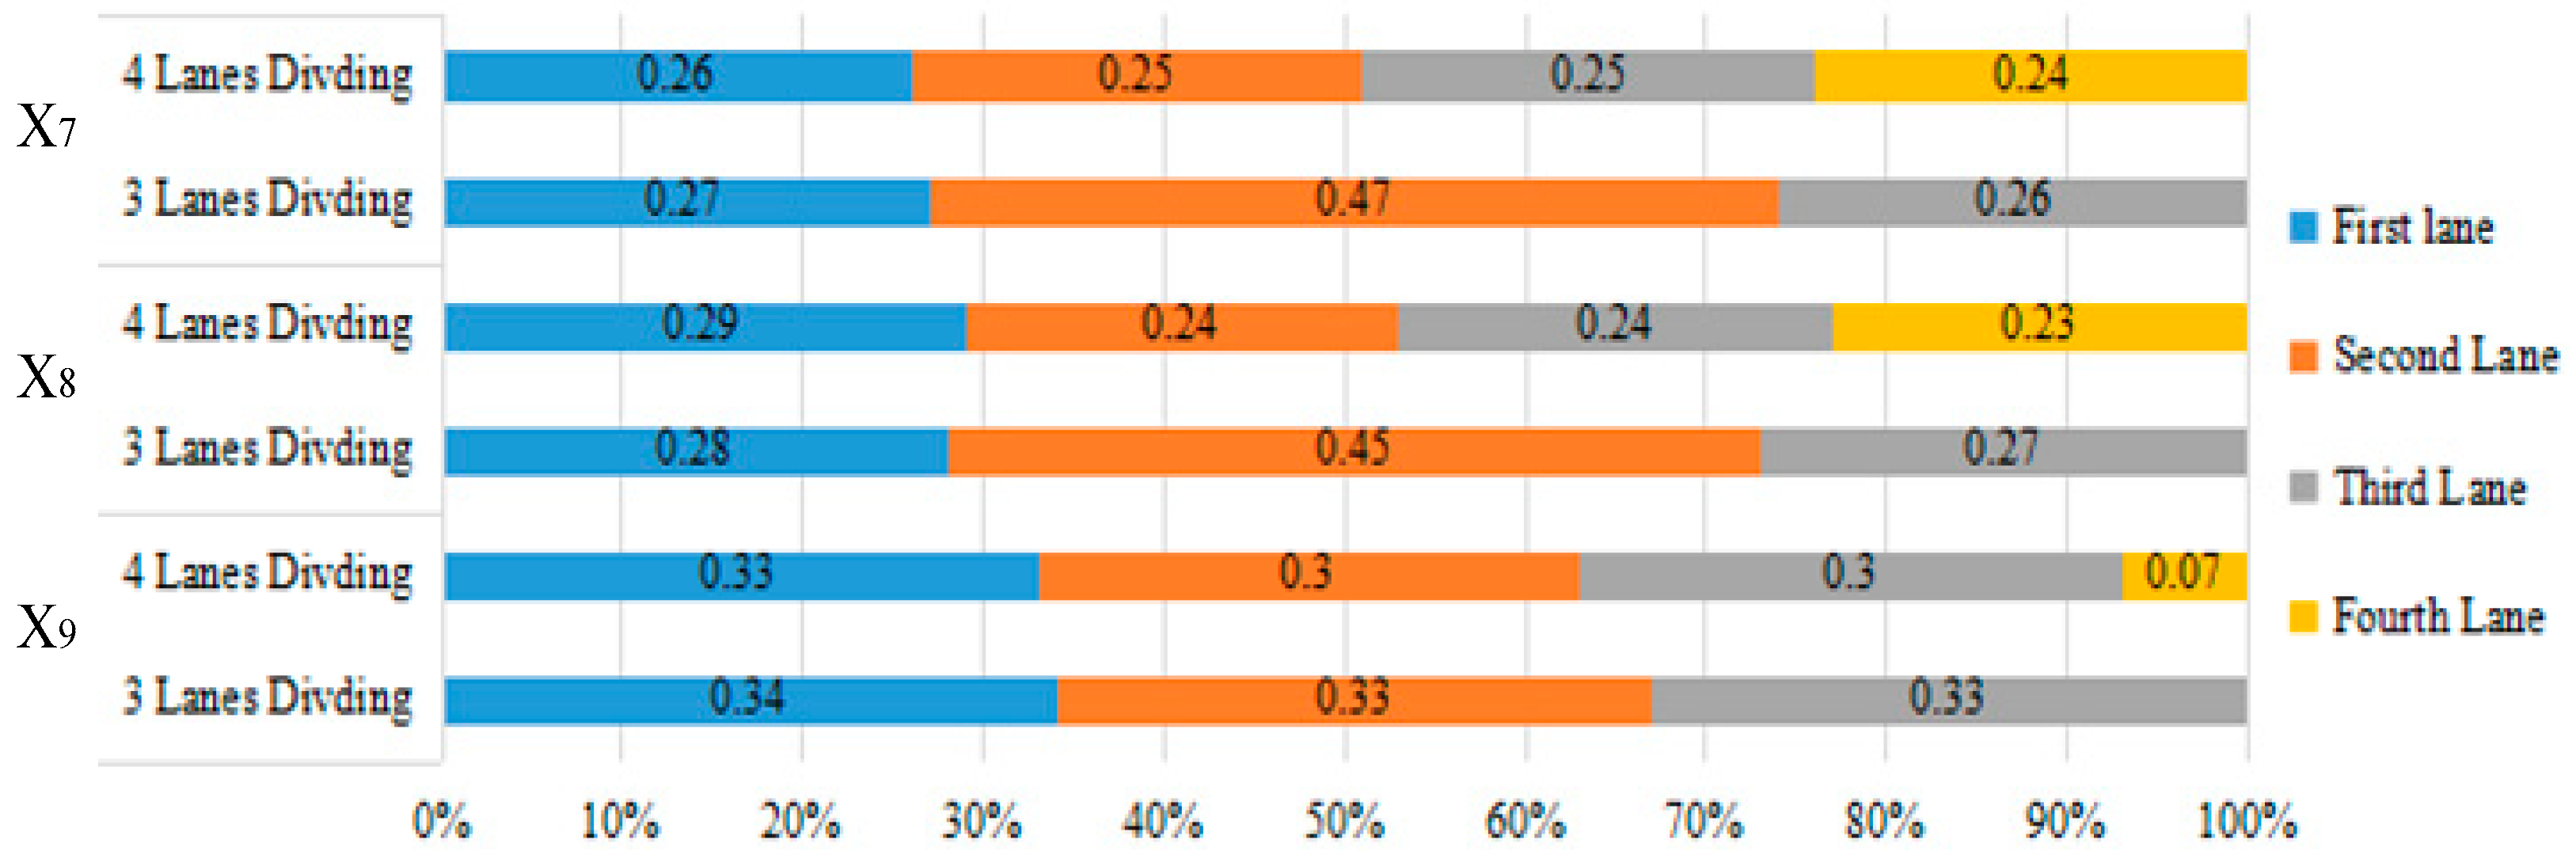
Generally, the distribution of the FCD on each lane of a one-way, two-lane section is approximately 50% and that of a one-way, three-lane section is approximately 33%. Variations in the lane traffic volume result in the variation in the number of floating cars distributed on each lane of a road with different numbers of lanes, but the FCD distribution continues to float around a fixed value.
Figure 5 demonstrates that on the same road, the number of lanes in the middle section of the road is three lanes, and the FCD distribution on each lane is approximately 33%. Where the intersection widens, the number of lanes obtained is four, and the FCD distribution is approximately 25%. Regarding the gradient section, the number of lanes is between three and four but is closer to four. Lane widening at the intersection can be detected based on the change in the number of lanes when another lane is added to the intersection.
4. Experimental Test
4.1. Study Area and Data Sources
Twenty-one plane intersections of four typical roads in Wuchang District, Wuhan City, China were used as training samples. The trajectory data were taxi GPS trajectory data generated by taxis in Wuhan City over the period of 3 July 2013 to 17 July 2013 (a total of 15 days). The trajectory data included vehicle identification, observation time, GPS latitude and longitude, and other information. The trajectory point sampling frequency was 40 s and collected additional data once when taxiing on or off. The road network data were the 2012 Wuhan standard road vector data. The coordinate system of the data source was WGS-84.
The authors used SPSS software for data timing fusion and illegal value rejection, ArcGIS software for data projection transformation, and Matlab software for data-filtering calculations and FCD coverage width detection during the period. The Python with SciKit-Learn package interface was used for GBDT classification.
4.2. Data Processing
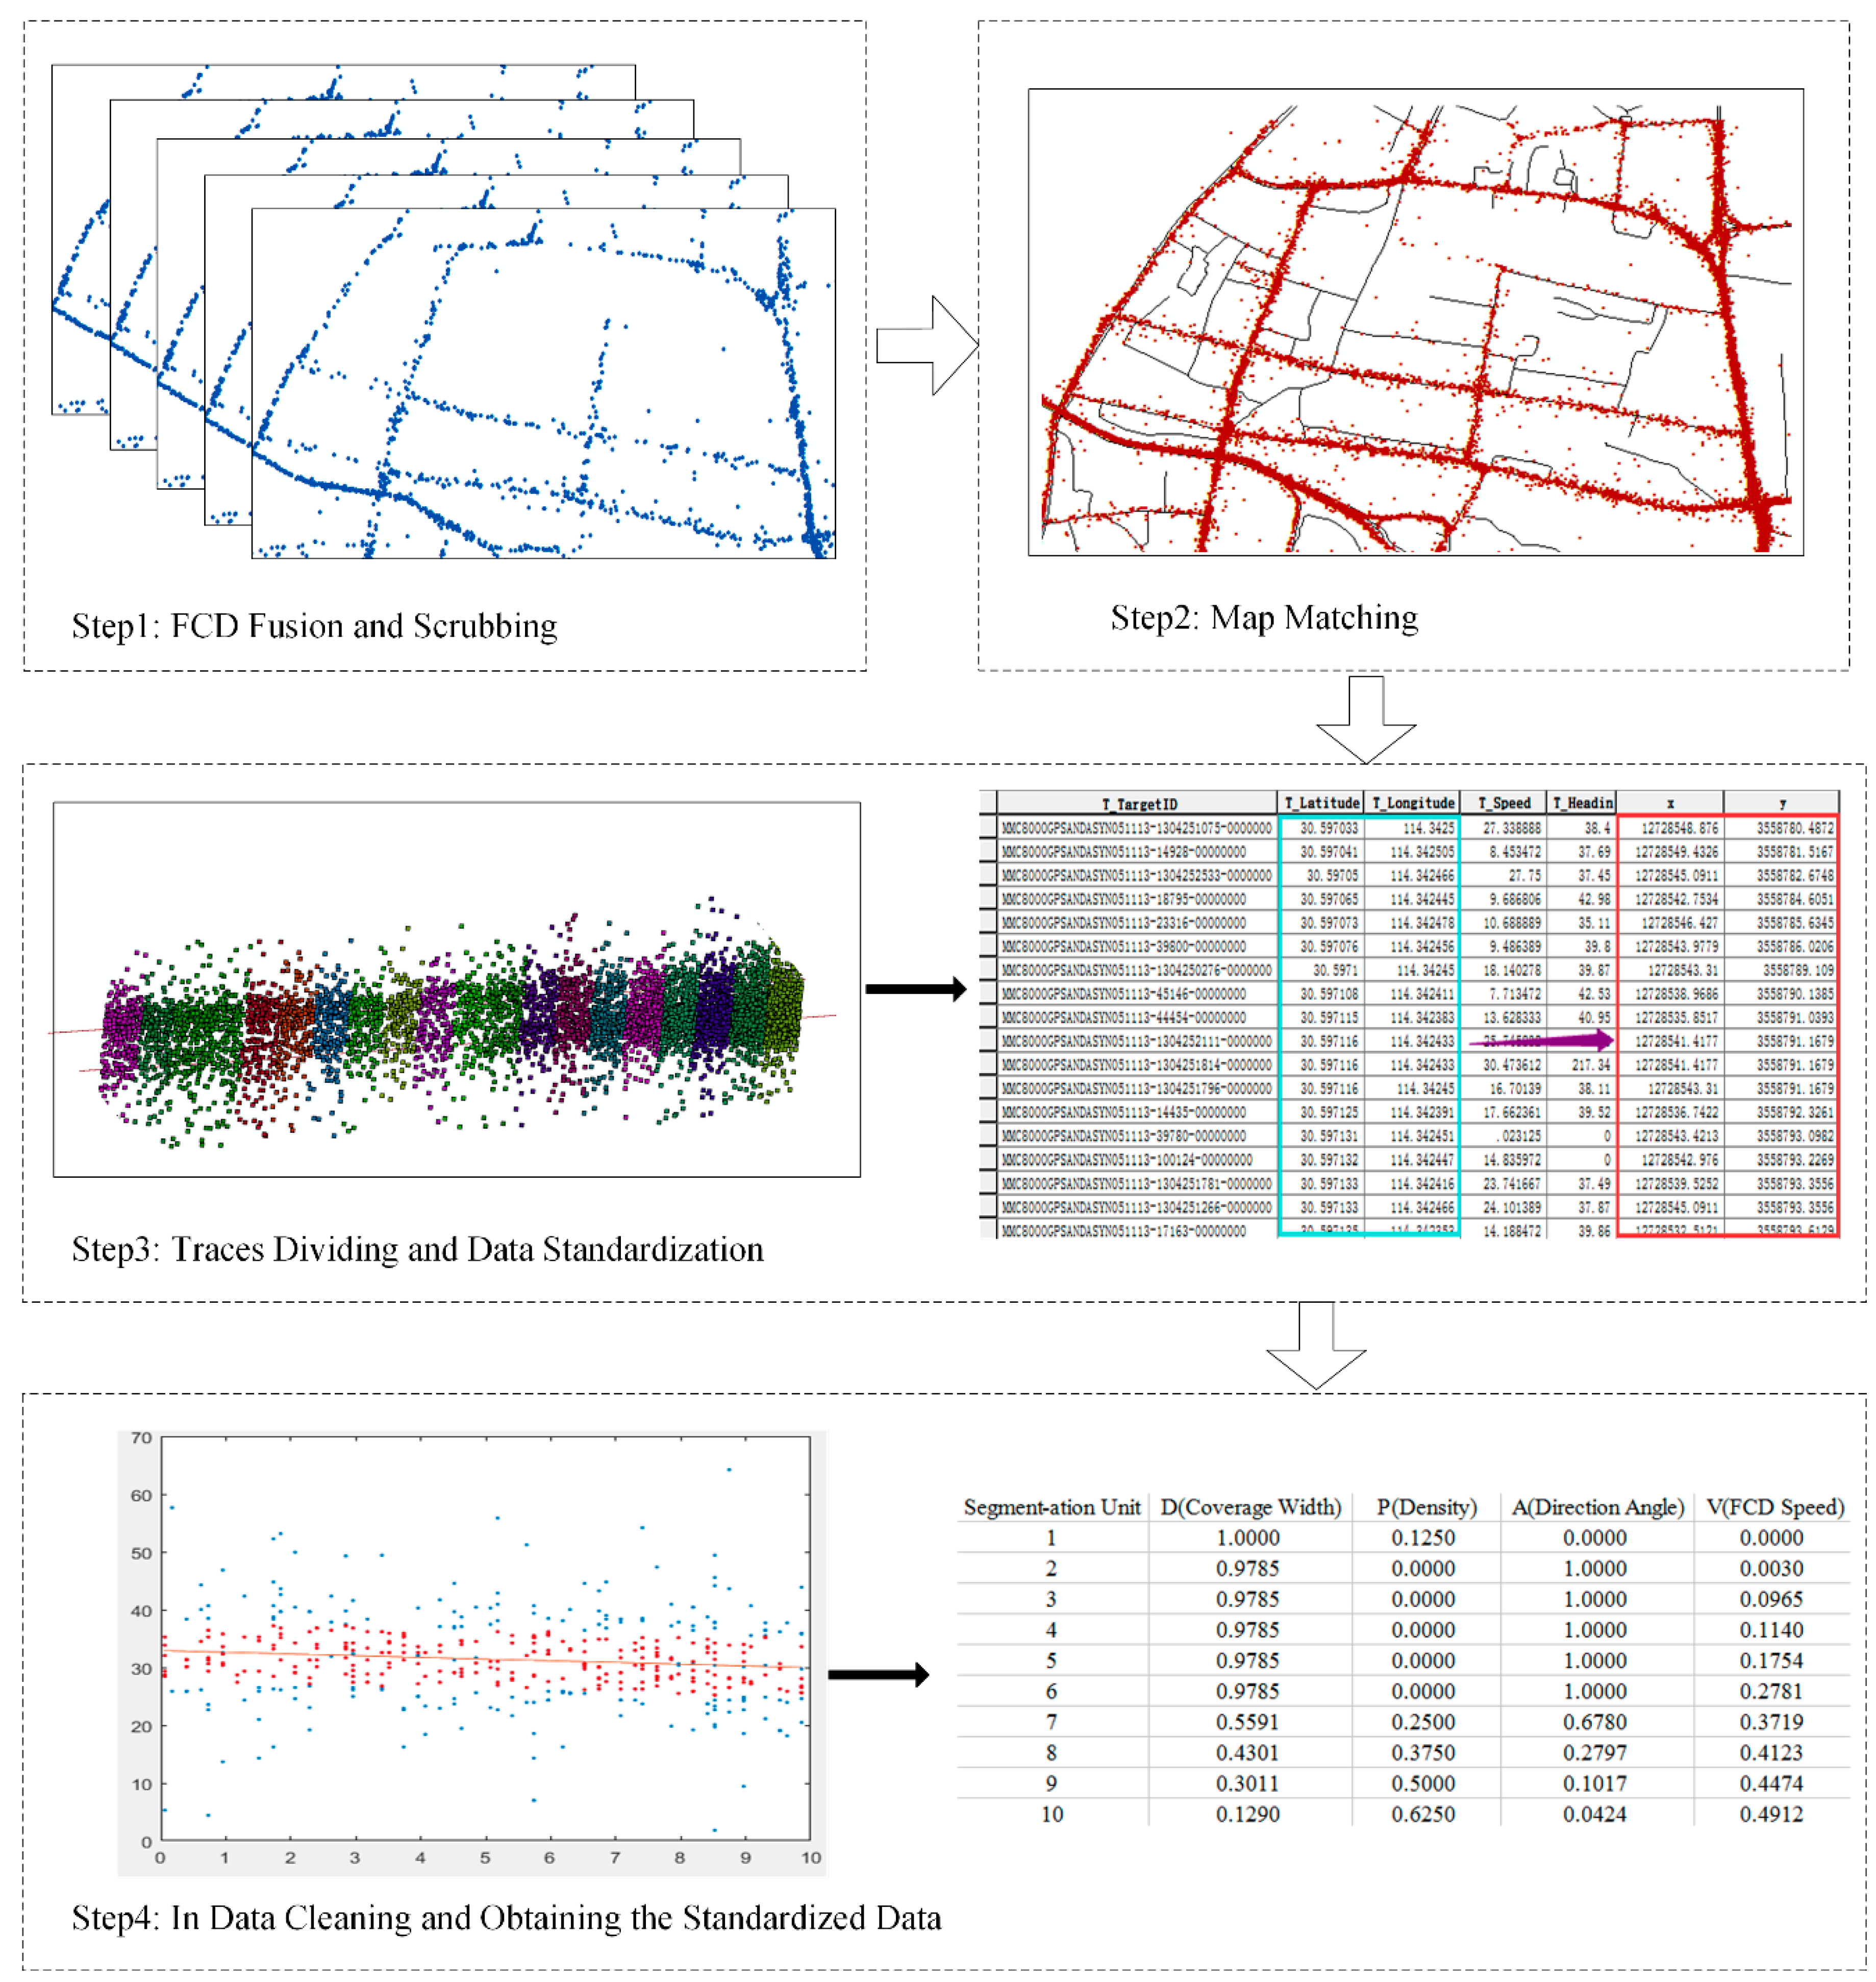
Given that the general positioning accuracy of vehicular GPS equipment is not high, the effectiveness of trajectory data preprocessing directly affects the detected number of intersection lanes. The specific steps for preprocessing experimental data were as follows: (1) During data fusion, the data for a certain period (7 days/10 days, denoted as 7 d/10 d) were cumulatively superimposed, and illegal points in the data were eliminated; (2) Regarding road-network matching, the coordinates of the trajectory sampling point were converted from the WGS-84 coordinate system into the same coordinate system as the road network, so that they fall on the correct driving lane; (3) For trajectory segmentation and data standardization, the FCD in the segment was converted to a rectangular coordinate through Mercator transformation to establish mathematical models and derive quantitative statistics and calculations; (4) During data cleaning, the cleaned data were summarized and homogenized to obtain the standardized data set of the overall FCD in the segment
. The data processing results are shown in
Figure 6.
The experimental results showed the following:
The trajectory data at the intersections and non-intersections for different traffic characteristics and different driving behaviors (mainly considering roadside parking and normal parking under the control of traffic lights) were cleaned using the improved amplitude-limiting average filtering method. When the data-filtering rates were 46.51–61.37% and 58.24–68.72% for the intersection area and non-intersection areas, respectively, FCD could satisfactorily detect the number of road lanes.
4.3. Analysis of the Sampling Period of Floating Cars
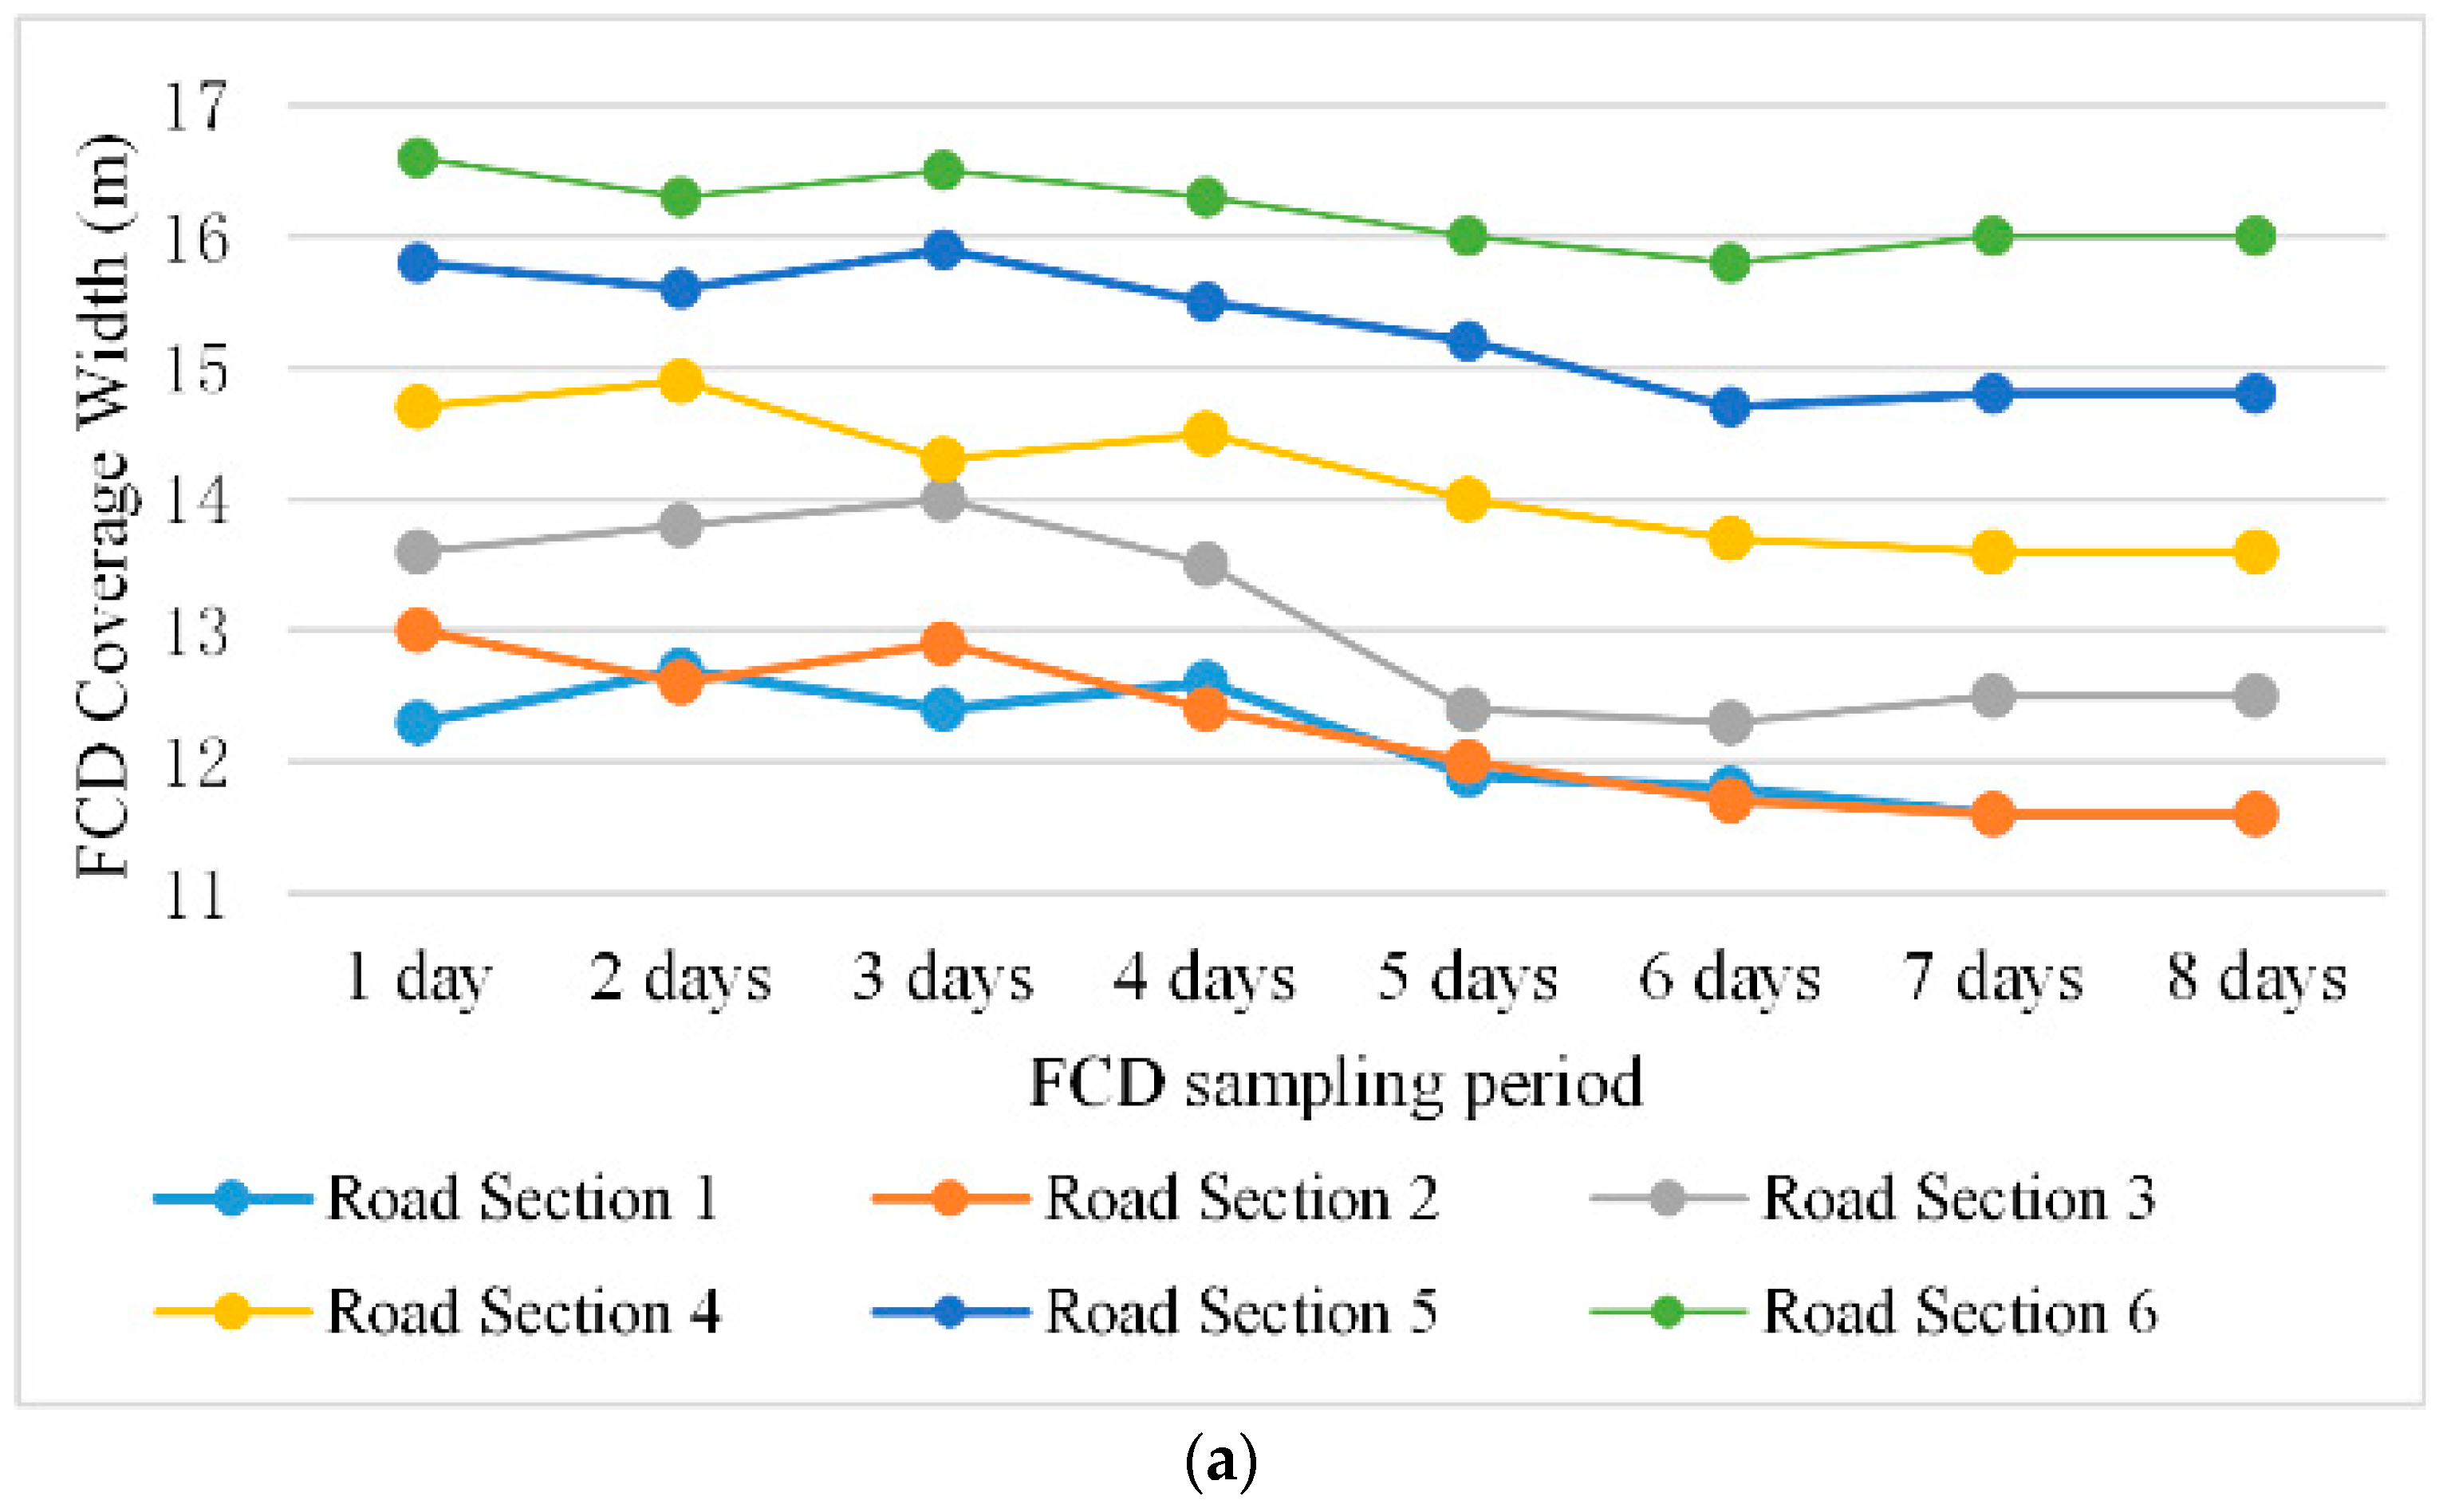
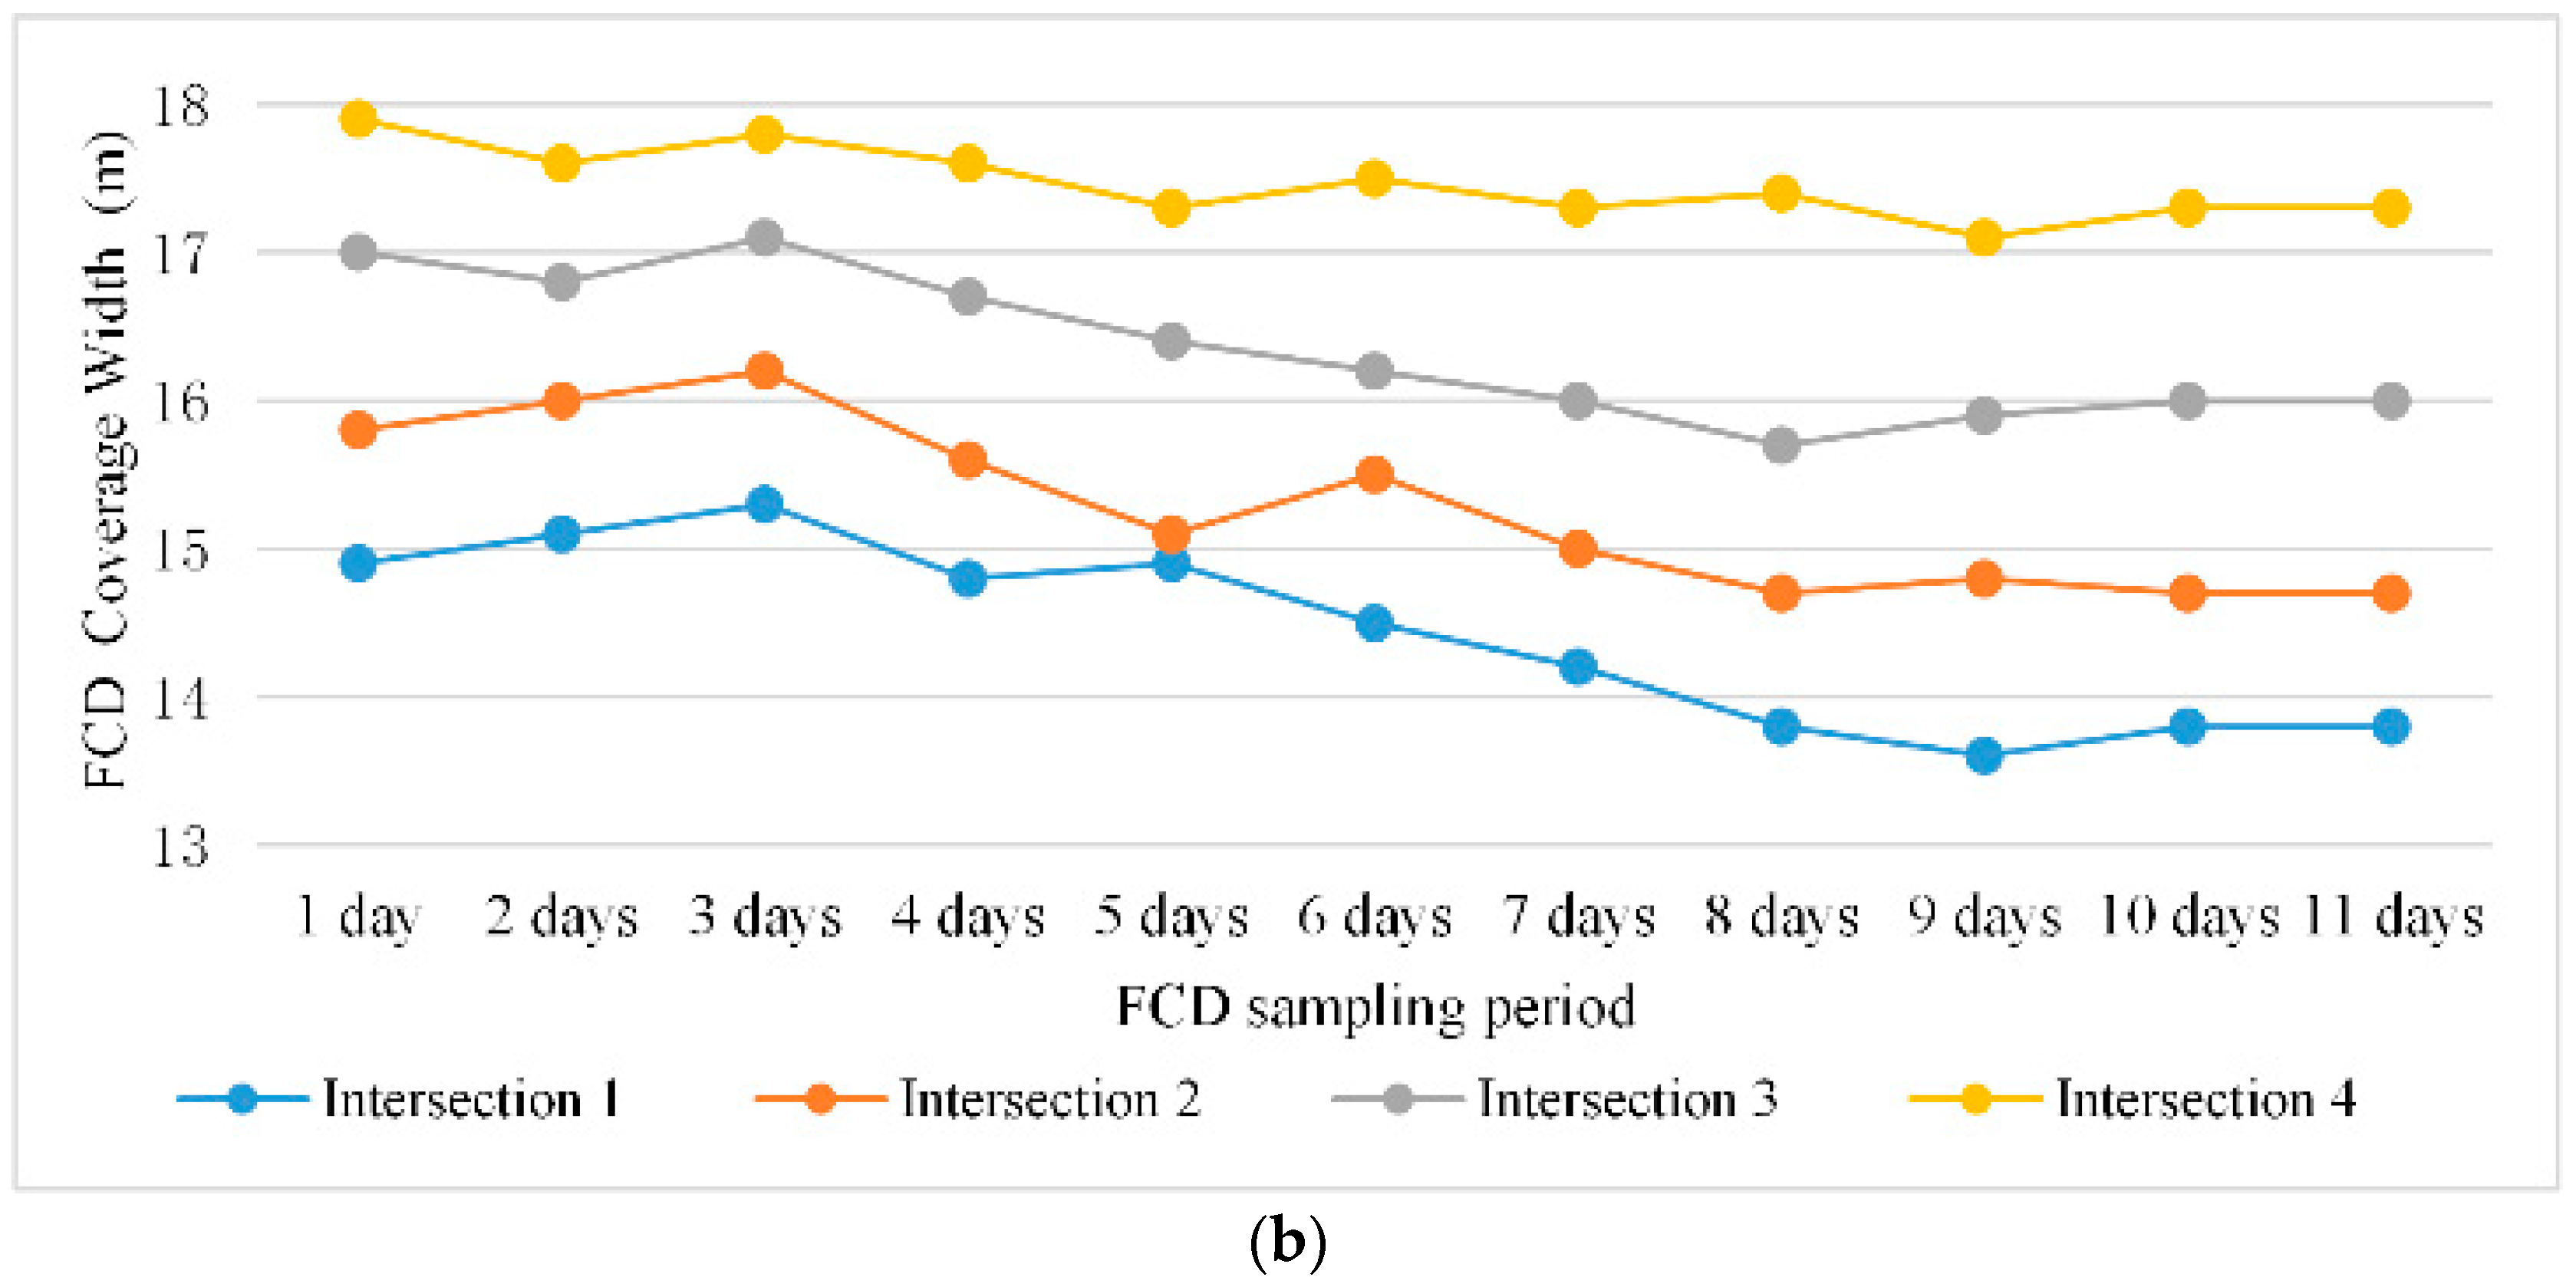
The data used here had low density given the sampling frequency of FCD was 40 s. Furthermore, FCD experienced difficulty meeting road detection requirements on one of the experiment days, so FCD had to be accumulated daily until the detected road width remained unchanged. A comparison of the detection results of the coverage widths of the trajectory data at different periods of distinct trajectory segments showed that the trajectory data coverage width of the middle segment of the road remained unchanged after seven days. This result is consistent with those of previous studies [
10,
11]. However, the width of trajectory data coverage at intersections did not change after 10 days, as shown in
Figure 7. Therefore, when using the current method to detect the lane number at a road intersection, a data collection period of 10 days is reasonable.
4.4. Auxiliary Through Lane Detection and Discussion
4.4.1. FCD Characteristic Variables Transformation Analysis
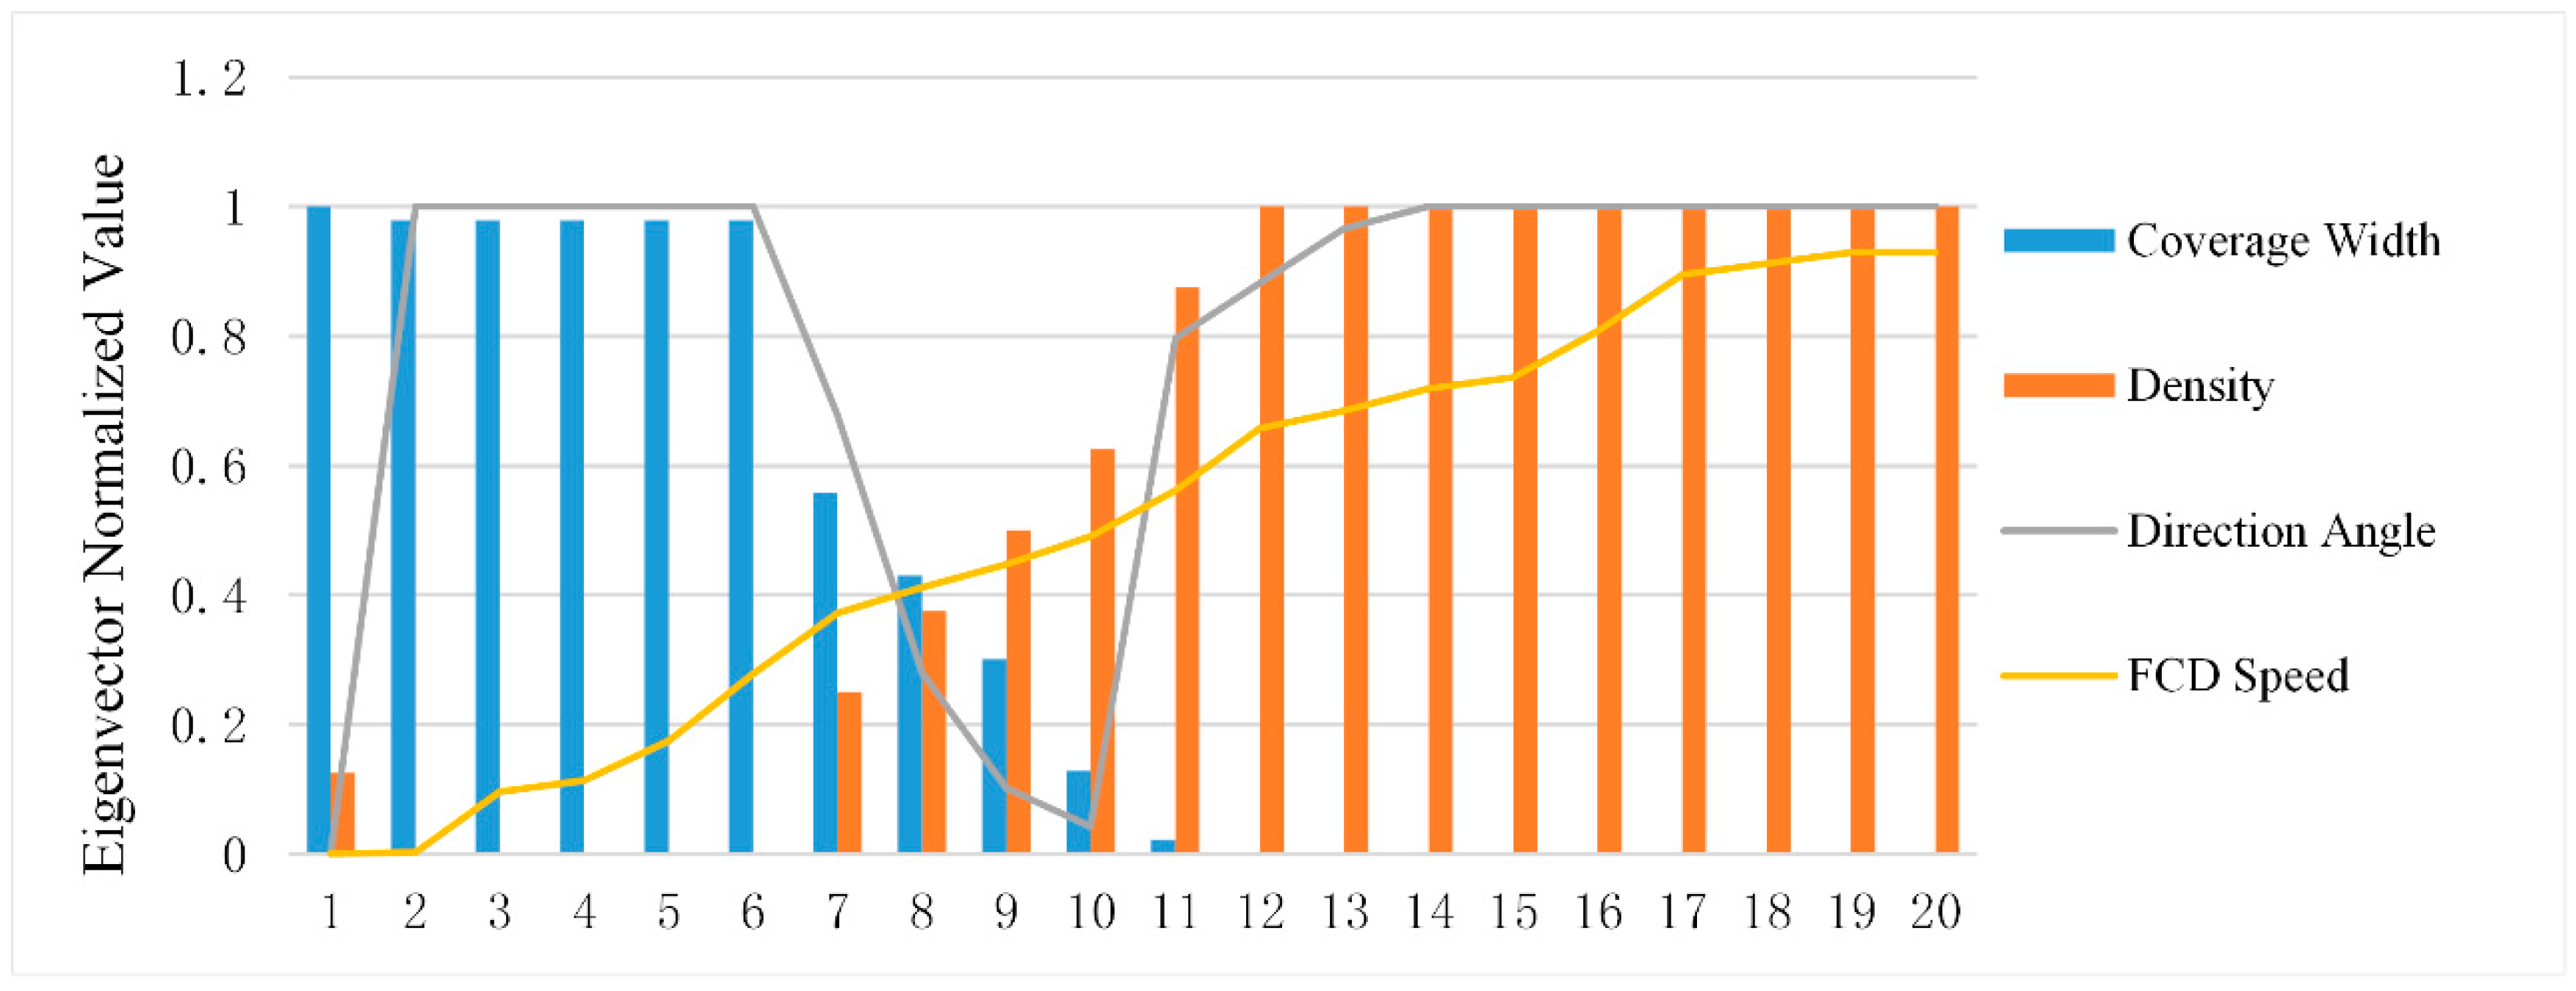
A road was divided into n segments where the first 20 segments were denoted by
and the segment characteristic variables
were normalized. The normalized calculation was
, where
. The authors found that the density of trajectory points in each lane decreased with the increment in the coverage width of the trajectory points at the intersection, as shown in
Figure 8.
Sections 1–6 in the actual road constituted the intersection widening segment, Sections 7–10 constituted the intersection gradient unit, and the remaining sections constituted the middle portion. Regarding Sections 1–20, the normalized values of FCD coverage width tended to decrease, whereas the normalized values of the FCD coverage density and average velocity tended to increase (
Figure 4). These results were consistent with the actual situation.
4.4.2. Lane Number Detection in the FCD Experimental Area
The FCD coverage width and its distribution (such as normal distribution) on the cross section of the road of Wuchang District were detected. The experimental detection results and the number of lanes corresponding to the experimental road were combined to construct a basic classifier for the number of lanes in the FCD experimental area, as shown in
Table 3.
The authors randomly selected a segment X4 of a certain sample X′ for measurement. Its FCD distribution width was 15.2 m. The segment was a road intersection. The basic classifier of the number of lanes in the experimental area showed that the selected segment might have belonged to a one-way, three-lane section or a one-way, four-lane section. The parameters of the GBDT model when k = 3 and k = 4 were calculated.
The calculation results showed that the model entropy was
F(3) = 0.0073 when
k = 3 and that the model entropy was
F(
4) = 0.051 when
k = 4. Thus, the model is optimal when
k = 3.
Figure 8 shows that when four-lane segmentation was adopted for segment
X4, the proportions of the FCD on the fourth lane were considerably lower than 25%, whereas the three-lane segmentation was closer to the actual situation. Therefore, segment
X4 was a one-way segment with three lanes. Subsequently, the remaining segments were calculated individually following the same calculation procedure, and the test results are shown in
Table 4.
Regarding
Table 5, the non-intersection section was the middle section of the road. Given that the scale of the intersection area was not unique in existing intersection design specifications, the inaccurate first segment should be removed. Thus, segment
X1 was used only for reference. The coverage width of the FCD was 13.2 m from segment
X2 to segment
X16, and the coverage width of the trajectory point in each segment was relatively close. The classification results obtained by the current method indicated a one-way, three-lane section. Considering the target intersection
X′, the trajectory point coverage widths and candidate results of segments
X1,
X2,
X3,
X4, and
X5 were analyzed, and the number of lanes at each intersection segment were detected. The classification results showed that intersection segments
X1,
X2, and
X3 were one-way and had four lanes, whereas segments
X4 and
X5 were one-way and had three lanes. An analysis of the classification results for intersection
X′ showed that the lane detection results for each intersection section were inconsistent. A comparison of the distribution characteristics of the FCD in each segment (
Figure 5) demonstrated that the data for the FCD distribution width of the intersection were discrete and the variation in the trajectory point coverage width gradually decreased. Combined with the result of lane classification, this result suggested that the road at the intersection had been widened, that is, a lane had been added.
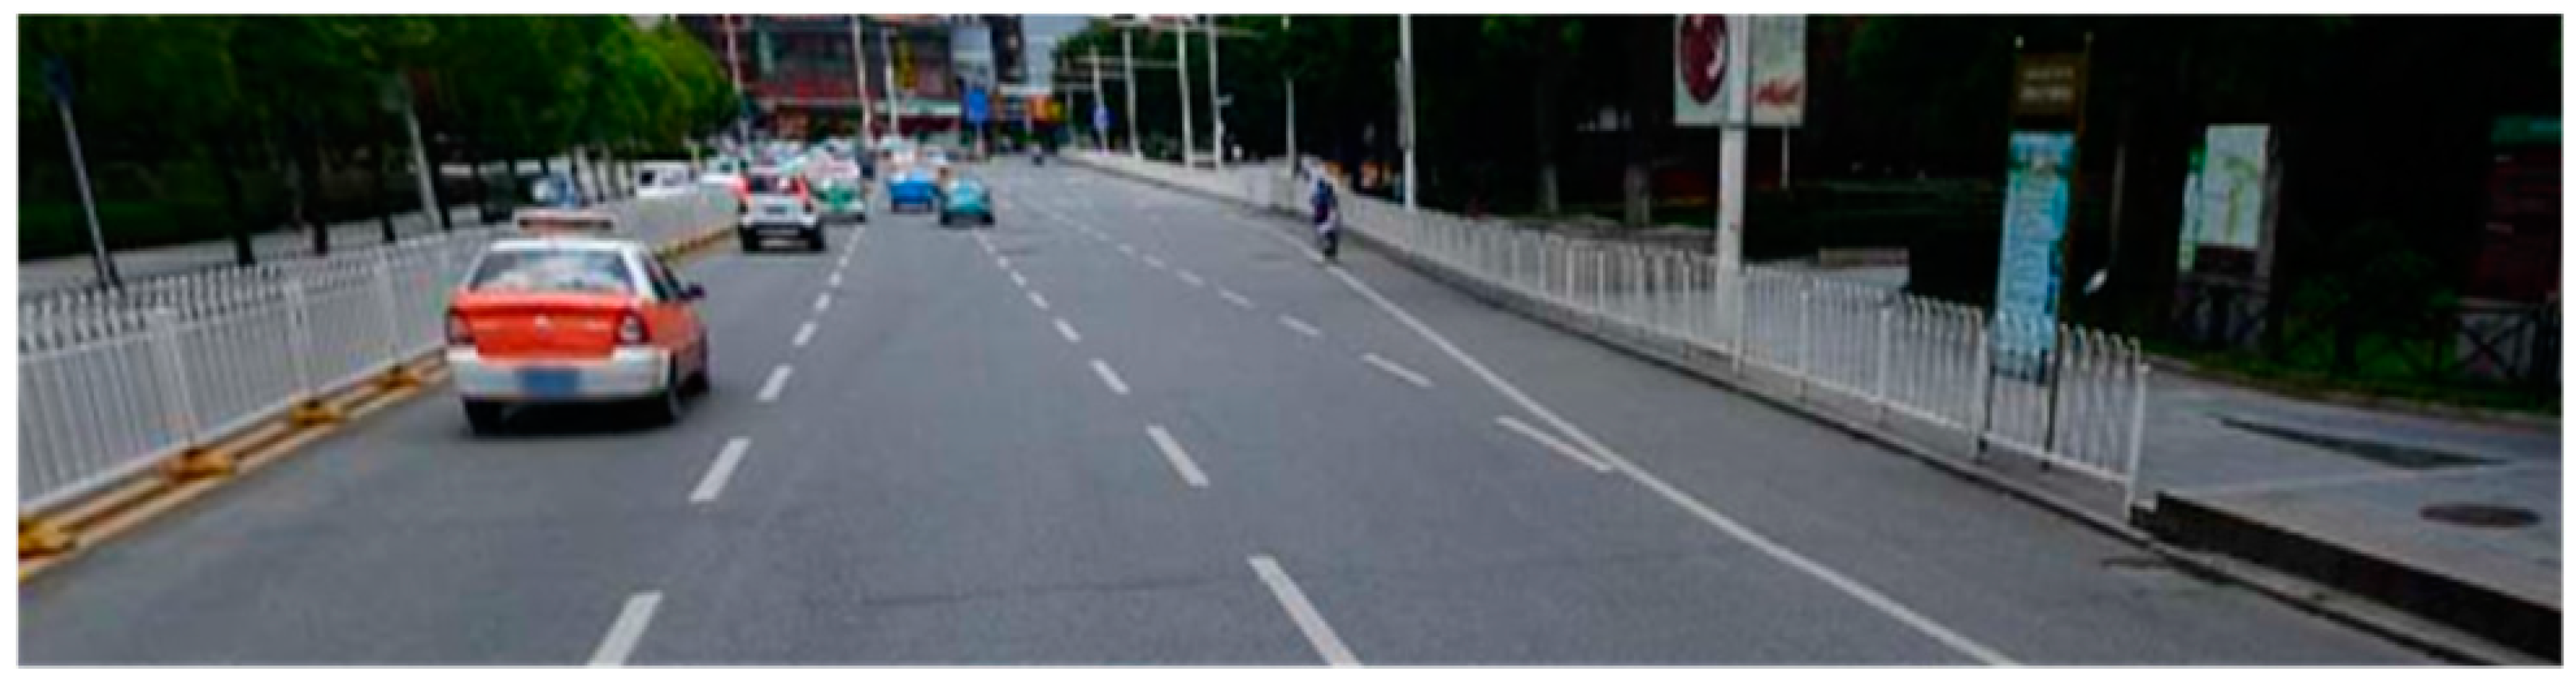
Furthermore, the actual image corresponding to section x and intersection
X′ verified that a lane had been added at the intersection but not at the middle road section. Therefore, the results obtained by dividing floating car trajectory at non-intersection
X and intersection
X′ of the road (
Figure 9) showed that the width of FCD coverage increased and the distribution density decreased. The actual image of the road was the street view (
Figure 10).
4.5. Quantitative Analysis of Intersection Lane Detection
The accuracy of the FCD-based method for detecting the number of intersection lanes was studied intensively, beginning with the unique geometric structure of the intersection. The number of lanes at intersections and non-intersections were extracted using three methods. Actual images were used to calculate the accuracy of each method. The results are shown in
Table 6.
The overall accuracy of the proposed method for detecting the number of lanes at intersections was 81.86%, and its overall accuracy for detecting the number of lanes at non-intersections was 83.89%. The detection accuracy of the current model was superior to those of the two other methods. The analysis results showed that (1) the road was divided into intersection areas and non-intersection areas. The GBDT classification model was constructed based on the spatial characteristics of the FCD in different research areas, thereby improving the FCD simulation results of the road sections to be measured and the accuracy of detecting the number of intersection lanes. (2) The number of lanes exhibited a large deviation when a single variable (d) assessment was used in the intersection gradient section. This deviation was reduced by adding the attributes v and α of the GPS trajectory data to the FCD as classification characteristics. Consequently, the overall accuracy for detecting the number of road lanes was improved.
5. Conclusions
This study analyzed the shortcomings of existing domestic and international detection methods for intersection auxiliary through lanes. Moreover, it applied FCD to establish a new method for detecting the change in the number of lanes at road intersections. The trajectory data were preprocessed through the improved amplitude-limiting average filtering method among other methods. The GBDT classification method was used to detect the number of lanes in each road area and to subsequently infer whether an auxiliary through lane existed at the intersection. This method was tested using information for a road in Wuchang District, Wuhan City. The experimental results showed that the proposed method can rapidly obtain lane widening information from low-precision FCD, and the validity of the method was verified.
The proposed method presents several advantages. First, this method has a shorter data update cycle time and lower cost compared to traditional methods for lane information detection. Second, the ability of the method to detect the number of lanes at intersections has been intensively studied, beginning with the unique geometric structure of the intersection. The method can detect the change in lane numbers and enables the rapid updating of navigation data. Third, the proposed method has improved accuracy relative to that of existing associated methods.
However, the proposed method presents two limitations. First, its calculation accuracy is not particularly high. Future works will attempt to improve the calculation accuracy of the method by integrating deep learning algorithms or other data sources. Second, the data processing and analysis process of the method involves numerous steps; the software operation is cumbersome, and the calculation speed is slow. Future works will attempt to reduce the number of steps and increase the speed of calculation of the proposed method through the integration of automation tools.


