An INS/Floor-Plan Indoor Localization System Using the Firefly Particle Filter


School of Information Science and Engineering, Xiamen University, Xiamen 361001, China
*
Author to whom correspondence should be addressed.
ISPRS Int. J. Geo-Inf. 2018, 7(8), 324; https://0-doi-org.brum.beds.ac.uk/10.3390/ijgi7080324
Submission received: 26 June 2018
/
Revised: 28 July 2018
/
Accepted: 28 July 2018
/
Published: 10 August 2018
Abstract
:Location-based services for smartphones are becoming more and more popular. The core of location-based services is how to estimate a user’s location. An INS/floor-plan indoor localization system, using the Firefly Particle Filter (FPF), is proposed to estimate a user’s location. INS includes an attitude angle module, a step length module and a step counting module. In the step length module, we propose a hybrid step length model. The proposed step length algorithm reasonably calculates a user’s step length. Because of sensor deviation, non-orthogonality and the user’s jitter, the main bottleneck for INS is that the error grows over time. To reduce the cumulative error, we design cascade filters including the Kalman Filter (KF) and FPF. To a certain extent, KF reduces velocity error and heading drift. On the other hand, the firefly algorithm is used to solve the particle impoverishment problem. Considering that a user may not cross an obstacle, the proposed particle filter is proposed to improve positioning performance. Results show that the average positioning error in walking experiments is 2.14 m.
1. Introduction
Location services using smartphones have attracted more and more attention in recent years. How to estimate the location of a user is the core of a location service. Satellite navigation systems provide reliable outdoor positioning. Due to the obstruction of obstacles, such as walls, satellite signals are severely degraded in an indoor environment, leading to unreliable indoor positioning that relies on satellite signals. With smartphone sensors, some indoor positioning technologies have received the endorsement of many scholars [1,2,3,4]. Unlike mature outdoor satellite positioning schemes, indoor positioning techniques, using smartphones, cannot provide real-time, long-term meter-level positioning accuracy.
Using fingerprints for indoor positioning is a popular method [5,6,7,8]. Commonly-used fingerprints include magnetic fields and radio frequency signals (e.g., WiFi, Bluetooth, radio frequency identification). In the off-line phase, a surveyor needs to collect the fingerprint signals of a predefined trajectory in advance. To build a position fingerprint database, a constant speed assumption is necessary. In the online phase, the position of a user is estimated by calculating the similarity between the measured signals and the fingerprint in the database. Single-point matching [9] and sequence matching [10] are commonly-used techniques for computing two sequence similarities. Different positioning accuracy depends on different positioning environments, sensors and testers. RADAR [11] obtained a positioning accuracy of 2–5 m on the second floor of a three-story building. WLS [10] obtained a positioning accuracy of 2.03 m under calling, dangling, handheld and pocket gestures. MaLoc [3] obtained a positioning accuracy of 1–2 m in four scenes (hall, conference, corridor and library). The premise of fingerprint matching is that the signal is affected by the spatial position, resulting in different signal strengths at different positions. Taking into account that the changes in the indoor environment have a great impact on fingerprint positioning, researchers need to update the fingerprint database within a certain period of time. Another bottleneck is that fingerprint matching costs excessive computation. Limited smartphone battery power poses a challenge for continuous positioning over an extended period.
Unlike for fingerprint matching, INS is less affected by the environment. INS depends on an accelerometer and a gyroscope to collect a user’s data. The user’s position is estimated by integrating acceleration and angular velocity [12]. Considering the relatively inexpensive sensors of smartphones, direction drift is the biggest obstacle to the development of INS. Zheng et al. [12,13] designed KF to estimate vertical velocity error when zero velocity update was detected. To improve indoor positioning accuracy, Yu et al. [14] combined the two-layer KF/auxiliary Particle Filter (PF) with a map. In an auxiliary PF technique, particle weights are set to zero when the particles cross the wall. Zero-weighted particles reduce the diversity of particles and easily cause a reduction in the number of particles. To increase the diversity of particles, a Firefly Algorithm (FA) [15] is integrated into PF. FA shows that fireflies with high brightness attract fireflies with low brightness. By attracting low light fireflies, they move to high brightness fireflies. Combined with a floor plan, an INS/floor-plan indoor localization system using FPF is proposed.
Compared with a fingerprint matching algorithm, our system does not need to construct the fingerprint database in advance. Our system is robust to changes in the environment. Likewise, the computational burden is relatively small, thereby saving a limited amount of phone power. In general, the main innovation points are as follows:
(1) The horizontal displacement in a smartphone is estimated by using a pure INS algorithm without using a foot-mounted attachment. Meanwhile, the system does not require the installation of infrastructure, greatly reducing the time and economic costs of indoor positioning systems.
(2) FA is used to modify the crossing-wall particles, and the improved particle filter (FPF) is presented to improve the indoor positioning accuracy.
(3) Using handheld motion gesture, we performed the walking experiments in three scenarios at a local university. An average positioning accuracy of 2.14 m was obtained.
2. Related Work
Many scholars have used inertial sensors for indoor positioning for many years [16,17]. By integrating the acceleration and angular velocity of the inertial sensor, the position of a pedestrian is obtained. As indicated by Foxlin et al. [18], to correct navigation errors, the NavShoe system used a zero velocity update as a pseudo-measurement integrated into the extended KF. The NavShoe system is suitable only for the inertial sensor module tied to the shoe. To accurately estimate the location of a user, Zhang et al. [19] designed an inertial pedestrian navigation system, including dead reckoning and device pose recognition algorithms. Because inertial sensor drift is not completely eliminated, the navigation system slowly diverges over a lengthy navigation period. According to Borenstein et al. [20], when a user must be located in a rectangular-shaped building, the user’s heading is divided into four main directions. A heuristic drift elimination system, although only for some special shapes of indoor pedestrian positioning, gradually adjusts the direction to the closest dominant directions. In [21], an improved heuristic drift elimination with magnetically-assisted dominant headings was used to reduce the direction drift. Considering the interference of the complex indoor environment to magnetic field readings, many scholars do not recommend the use of magnetic field correction direction.
Combined with the fingerprint, the cumulative error of the inertial sensor is effectively reduced [22,23]. Using the magnetometer of a smartphone and an inertial sensor, a practical magnetic fingerprinting algorithm was used to improve indoor localization accuracy [24]. Some improved techniques for the motion model, the measurement model and the resampling model were designed to minimize localization errors. Experimental results show that the localization system achieved an average error of 1–3 m in a large building. In an integrated system, including WiFi fingerprinting positioning and pedestrian dead-reckoning, Chen et al. [25] used an unscented KF algorithm and an improved k-mean clustering algorithm to improve the indoor positioning performance and reduce the cost time. The use of a fingerprint database requires two prerequisites: first, fingerprints need to be collected in advance; second, the database needs to be updated regularly, which adds excessive maintenance costs. In [26], a fusion technique that integrates map information, pedestrian dead-reckoning and WiFi fingerprinting localization was used to locate the smartphone user. The WiFi signal can correct the heading drift of the inertial navigation system. However, the WiFi signal fluctuates over time, which increases the positioning error. On the other hand, the number and distribution of the signal access points have a large impact on positioning accuracy. The cost of installing complex infrastructure is also a barrier to large-scale WiFi business.
With pedestrians unable to cross obstacles (e.g., walls, seats), indoor maps can be used to limit direction drift. To reduce sensor drift, Tian et al. [27] proposed, based on PF, a hybrid indoor positioning system combined with map matching. When particles crossed the wall, their weights were set to zero. Through a resampling process, particles that crossed the wall did not participate in the next generation of particles. Similar particle weight processing methods are found in [14,28,29]. To keep the total number of particles constant, Pinchin et al. [30] proposed to resample multiple particles without crossing the wall. Another way, according to Li et al. [31], is that particles that cross the wall are generated near the living particles. Using map constraints, particles are divided into crossing-wall particles and non-crossing-wall particles. Crossing-wall particles do not participate in the next generation of particles, which reduces the diversity of particles and is prone to generate the particle impoverishment problem.
Yang et al. [32] designed FA to solve multi-objective nonlinear problems. Gao et al. [33] used FA to track an arbitrary target in various challenging conditions. Experimental results show that, regarding target tracking, FA is superior to PF and a particle swarm optimization algorithm. Based on a more in-depth study of FA, Gao et al. [34] used an FA-based PF method for visual tracking and, to mitigate the particle impoverishment problem, used FA to increase the diversity of particles. So far, FA is used mainly in the field of target tracking and multi-objective optimization.
Inspired by the above work, we propose FPF for an INS/floor-plan indoor localization system. Combined with a floor plan, an improved firefly operation is designed to move low-weight particles to high-weight particles. In addition, a novel particle weight updating algorithm is designed. Finally, the indoor localization system performance is greatly improved.
3. System Model
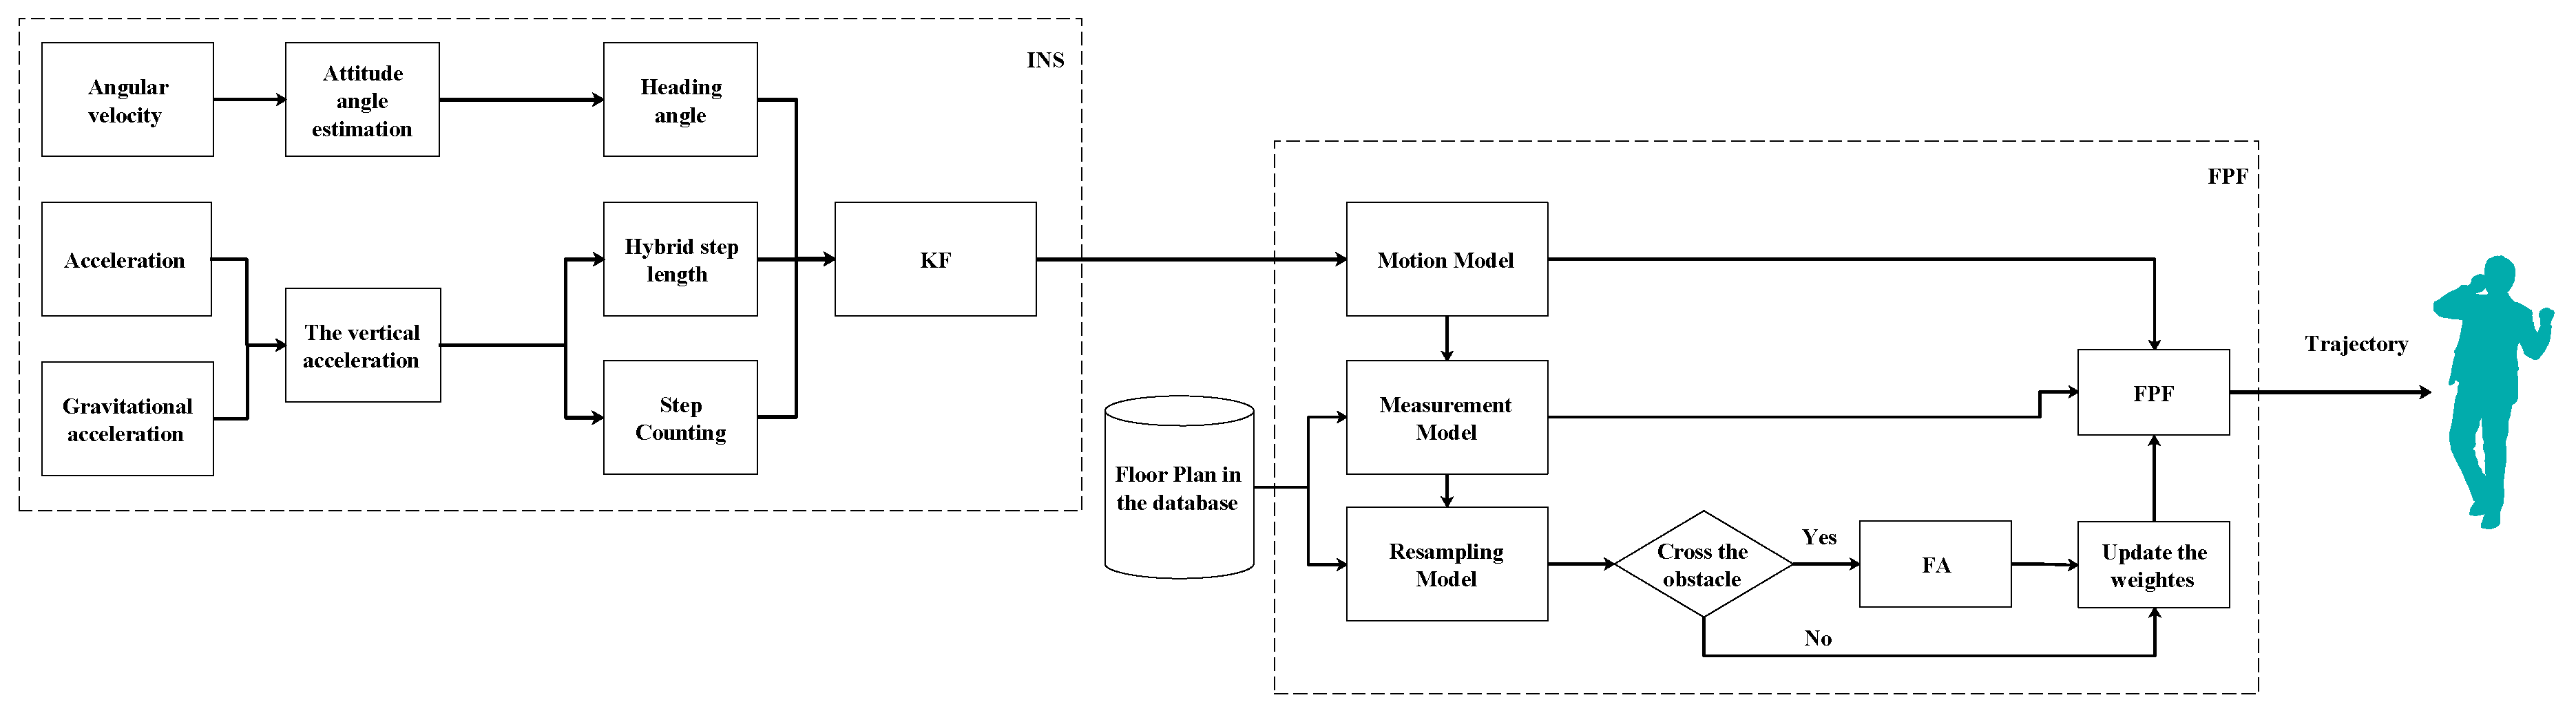
As shown in Figure 1, an INS module and an FPF module compose the indoor positioning system. In an INS module, angular velocity is used to estimate the user’s gesture through a quaternion vector and a direction cosine matrix. Vertical acceleration is extracted from the acceleration and gravitational acceleration. If zero vertical velocity is detected, we construct KF using a pseudo-observed value with zero vertical velocity and zero change in heading. The estimated error is used to compensate for the hybrid step length and heading angle. Dead-reckoning is often used to calculate the user’s position. In an FPF module, heading angle and step length are used to construct a PF motion model. The floor plan in the database is designed to construct the measurement model. In the resampling model, the floor plan is designed to detect the effectiveness of the particles. If the particles cross the obstacle, FA is used to move particles that have crossed an obstacle to particles that have not crossed an obstacle. Subsequently, the particle weights are updated based on an exponential function. Finally, FPF is used to estimate the user’s position.
3.1. INS for an Indoor Positioning System
INS is composed of three parts: attitude angle estimation, a hybrid step length module and a step counting module. We will introduce these three modules in detail.
3.1.1. Attitude Angle Estimation
The attitude of the smartphone is usually estimated using gyroscope readings. The main techniques include Direct Cosine Matrix (DCM), quaternion and Euler angle. We update the quaternion vector using the angular rate measurements from gyroscope readings. After that, we use the update quaternion to get the attitude of the navigation system in terms of Euler angle. In [35], the relationship between DCM and quaternion was expressed as Equation (1).
The attitude angle in terms of DCM can be calculated as follows [35]:
where , and are the pitch, roll and yaw from the smartphone, respectively.
3.1.2. Hybrid Step Length Module
A simple strategy is to assume that a user’s step length is a constant when walking. However, this is not practical. Different users have different step lengths. Even the step length of the same user changes over time. The triangle model [10] is designed to calculate the step length. L represents the height of the smartphone from the ground when the pedestrian is stationary, as shown in Figure 2. represents the height of the smartphone from the ground when the pedestrian is walking. The vertical displacement of the smartphone is H, which is calculated as follows:
where and represent the start and end times of each step; is the vertical acceleration. According to the Pythagorean theorem, the step length is calculated as follows:
The main drawback of the triangle model is that the double integral easily enlarges the error of the step length. Another drawback is that the triangle model does not take into account the influence of the walking frequency on the step length. Taking into account the influence of the walking frequency and the acceleration variance, the step length based on training model is calculated as follows:
where , and are weighting parameters for step length estimation. f denotes the walking frequency. a and denote acceleration and the mean value, respectively.
Different step length models contain errors due to the user’s mobility and sensing capability. It is very important to determine the appropriate step length in order to improve the positioning accuracy. Therefore, we establish a new algorithm that uses two different measurements to find a reasonable step length for a user. The core idea of the algorithm is to select the appropriate step length based on the correlation of the two step length models and the fluctuation of the step length of a triangular model. The proposed algorithm is expressed as follows:
where:
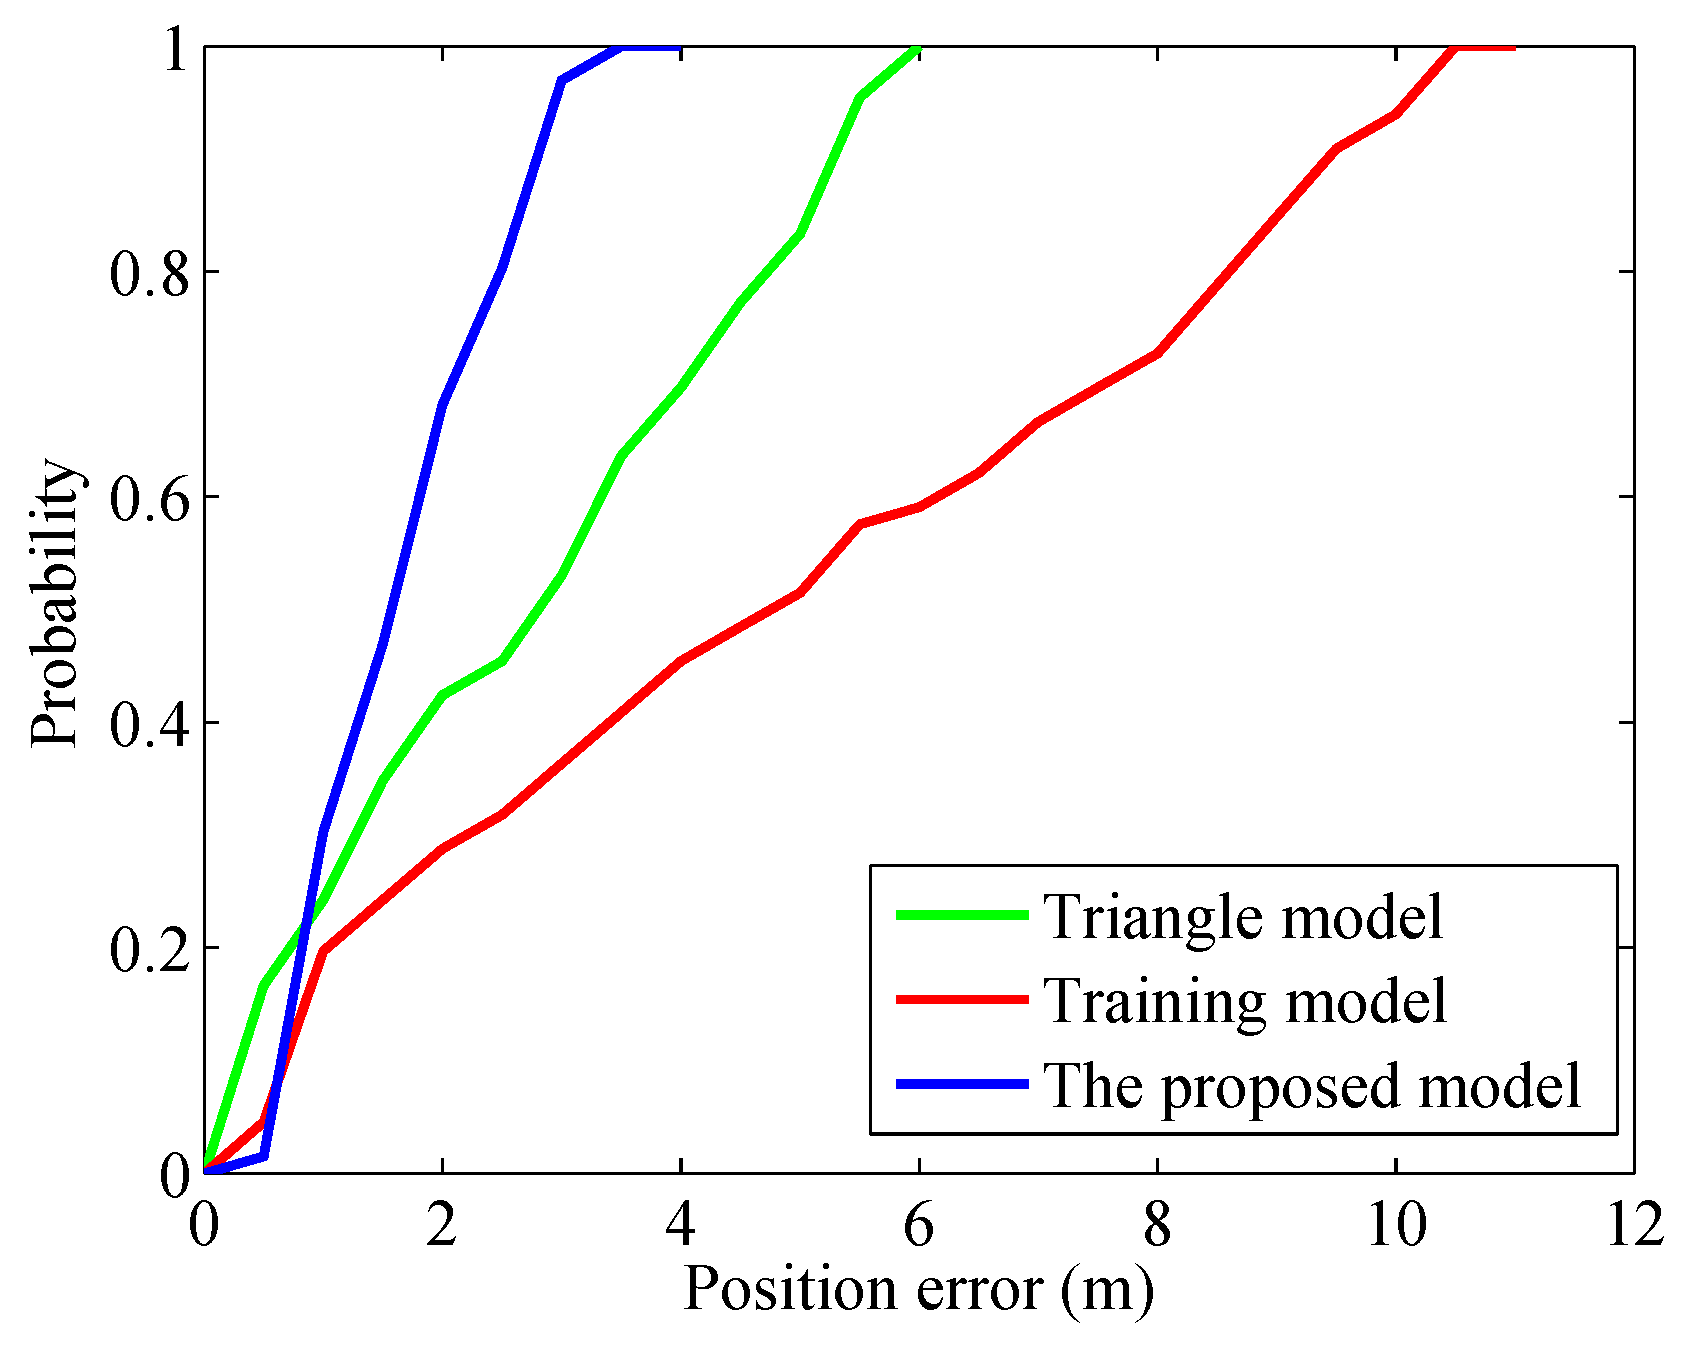
Note that , and represent weighting factors on , and , respectively. The thresholds and are designed to determine the correlation and variation , respectively. Figure 3 shows the cumulative distribution function (CDF) of positioning results with different step length models. The improved step length algorithm combines the advantages of different step length models and reasonably uses the triangular model and training model in different stages. Therefore, the improved step length algorithm is obviously superior to the other two step length models.
3.1.3. Step Counting Module
When a user walks, vertical acceleration has a certain periodicity. The steps are counted by detecting the peak of the vertical acceleration. Two peaks are taken as a step. Vertical acceleration is calculated as follows:
where and represent acceleration and gravitational acceleration, respectively. When a vertical acceleration is the maximum in the local area, we regard it as a peak. One problem is that, due to noise, there are many false peaks, which lead to overload statistics. A variance threshold is used to remove false peaks. Therefore, two detection conditions, defined as follows, are presented to improve the performance of the step counting model:
where and denote the vertical acceleration and the vertical acceleration variance at time k, respectively. is a threshold. If both detection results are “1”, we believe that the real peak is detected.
3.2. KF for Indoor Positioning Systems
KF has been successfully applied in indoor localization systems to improve positioning accuracy [12,13,36]. In a handheld smartphone positioning system, KF is often used to estimate the vertical velocity error [12]. When zero vertical velocity is detected, pseudo-observations are used to construct a KF. A nine-element error state vector is defined as:
where represent the vertical displacement and the vertical velocity, respectively; denote the user’s attitude angle; represents the bias for the vertical velocity; represent the bias for the attitude angle.
During a user’s walking, the inertial sensors collect the user’s acceleration and angular velocity at a predetermined sampling frequency. The motion equation for the inertial sensor error model is constructed as follows [37]:
where is the system state error vector at time . represents the transition noise vector with covariance matrix . The state transition matrix is calculated as follows:
where is the rotation matrix from the body frame to the navigation frame. is the zero element matrix. is the sampling interval. The function returns an n-by-n identity matrix with “ones” on the main diagonal and “zeros” elsewhere. denotes the anti-symmetric matrix of the specific force vector, as expressed by Equation (16).
where denotes the acceleration in the navigation frame.
In the process of walking, when a smartphone is at the highest or lowest point in the vertical direction, a moving platform is stationary relative to the Earth. Therefore, the vertical velocity and the change of direction should be zero. If zero vertical velocity is detected, the measurement equation for the inertial sensor error model is constructed as follows [29]:
where is the measurement noise vector with covariance matrix . The observation matrix is defined as:
The KF calculation process consists of two parts: time update and measurement update. The time update begins when the inertial sensors collect acceleration and angular velocity. The measurement update is triggered when the zero vertical velocity is detected; otherwise, the measurement update does nothing. To improve localization accuracy, KF is applied to estimate the inertial sensor error. The calculation sequence for KF is shown as Algorithm 1.
3.3. FPF for Indoor Positioning Systems
PF is independent of the system model, which is used for a variety of non-linear and non-Gaussian models. PF plays an important role in many fields [38,39,40], such as pedestrian tracking, robot navigation and process monitoring. The main bottleneck of PF is the particle impoverishment problem, caused by a reduction in particles. Increasing the number of particles is one way to solve this problem. However, the computational complexity is also increased significantly. For an INS/floor-plan indoor localization system, too many crossing-obstacle particles fail to estimate the real location of a user. FA points out that high brightness fireflies attract the low brightness fireflies. With FA as an inspiration, the main idea of this paper is to move crossing-obstacle particles to non-crossing-obstacle particles.
| Algorithm 1 KF. |
| Input: Acceleration and angular velocity from the inertial sensor 1. Extract the vertical acceleration. 2. Detect zero vertical velocity point. 3. Loop KF 4. Use estimated sensor error to compensate measurements. 5. Update the quaternion based on the angular velocity. 6. Use the update quaternion to calculate the attitude of the navigation system. 7. Update the state transition matrix. 8. Calculate KF gain when zero vertical velocity is detected. 9. Update the filter state covariance matrix. 10. End KF 11. Calculate the step length. 12. Calculate a user’s position using dead-reckoning. |
3.3.1. The Basic Principle of PF
The conventional PF system is defined as [40]:
where and denote the known state and measurement functions, respectively.
Let and represent the state sequence and observation sequence, respectively. In PF, the key problem to be solved is the posterior density function. To solve this problem, Park et al. [41] proposed the following two popular choices: posterior function and prior function . For a nonlinear system, it is difficult to solve the analytical solution of a posterior distribution for PF. An effective method is to use an approximate solution instead of an analytic solution. We use a large number of particles to approximate posterior distribution. The recurrence formula for importance weight from each generation of particle is calculated as follows:
is normalized to . Therefore, the posterior distribution is approximately calculated as:
3.3.2. Motion Model
Because of sensor bias, non-orthogonality and temperature drift, heading drift cannot be avoided. KF reduces a part of the error when zero vertical velocity is detected. However, the positioning error still accumulates over time without boundaries. The step length and direction for a user, which include noise during walking, satisfy the Gaussian distribution with zero mean. Step length and direction are designed as follows:
where and represent the direction and step length at time k, respectively. and represent the estimated direction and step length at time k, respectively. and represent Gaussian noise. According to the previous position, the current position of a user is recursively calculated as follows:
where denotes a user’s estimated position at time k.
3.3.3. Measurement Model
Because when users walk indoors, it is impossible to cross obstacles, a floor plan is used to check whether the particles, which represent the location of a user, are effective. When particles do not cross an obstacle, we think the particles are effective and have high weights; if they cross an obstacle, the particles are invalid and have low weights.
3.3.4. Resampling Model
Based on the principle of particle resampling, particles with high weights have high sampling probability. On the contrary, particles with low weights have low sampling probability, suggesting that the particles with high weights are closer to the real location of the user. Increasing the number of particles, in addition to improving positioning accuracy, also increases the computational burden. To reduce computational complexity and improve positioning accuracy, we designed FPF.
FA, derived from simulating the natural phenomenon of fireflies in nature at night, was first proposed by Yang [32] in 2009. FA shows that fireflies with high brightness attract fireflies with low brightness. By attracting low light fireflies, they move toward high brightness fireflies. In firefly activity, each firefly searches for food through the distribution of fluorescein. In general, the brighter the firefly, the stronger the appeal. Eventually, many fireflies are gathered around some brighter fireflies. In the artificial firefly optimization algorithm, each firefly is regarded as a solution of the solution space. The firefly population is randomly distributed in the search space as the initial solution. Three basic principles for FA are as follows: (1) ignore gender; a high brightness firefly attracts a low brightness firefly; (2) firefly attraction is proportional to brightness; for any two fireflies, the brighter one attracts the other; however, brightness decreases as the distance increases; (3) if no one is brighter than a given firefly, it moves randomly.
The brightness, I, and attraction, , of fireflies are defined as follows:
where and represent the initial brightness intensity and initial attraction, respectively. represents a fixed optical absorption coefficient. r is the distance between two fireflies. Low brightness firefly, i, is attracted by high brightness firefly, j, according to the following [33]:
where and represent the location of two fireflies before FA is performed. denotes the position of the new firefly. The second term of Equation (25) represents the attraction of the brightness fireflies. The third term is random.
Through floor plan detection, particles are divided into crossing-obstacle particles and non-crossing-obstacle particles, which are stored in and , respectively.
We assume and are from crossing-obstacle particles, , and non-crossing-obstacle particles, , respectively. represents the modified particles. When a crossing-obstacle particle is detected, FA is triggered. FA is calculated as follows:
where the parameter is a constant. The parameter, , is a random value and is limited in . represents the average of non-crossing-obstacle particles. The calculation method for is as follows:
where is a symbol function. denotes the Euclidean distance.
After FA is performed, we use a floor plan to detect the particles. The particle weights are updated as follows:
where denotes a configuration parameter. represents the i-th particle weight after FA is performed. FA flow is shown in Algorithm 2.
| Algorithm 2 FPF. |
| 1. Collect acceleration and angular velocity. 2. Load a floor plan information in the database. 3. FPF initialization. 4. Particle state transition. 5. According to the position relationship between the particles and a floor plan, the particles are divided into crossing-obstacle particles and non-crossing-obstacle particles. 6. Use FA to modify the crossing-obstacle particles. 7. Update the particle weights. 8. Resampling. 9. Estimate the location of a user. 10. If the condition is not finished, go to Step 4; otherwise, end FPF. |
4. Experiments and Discussion
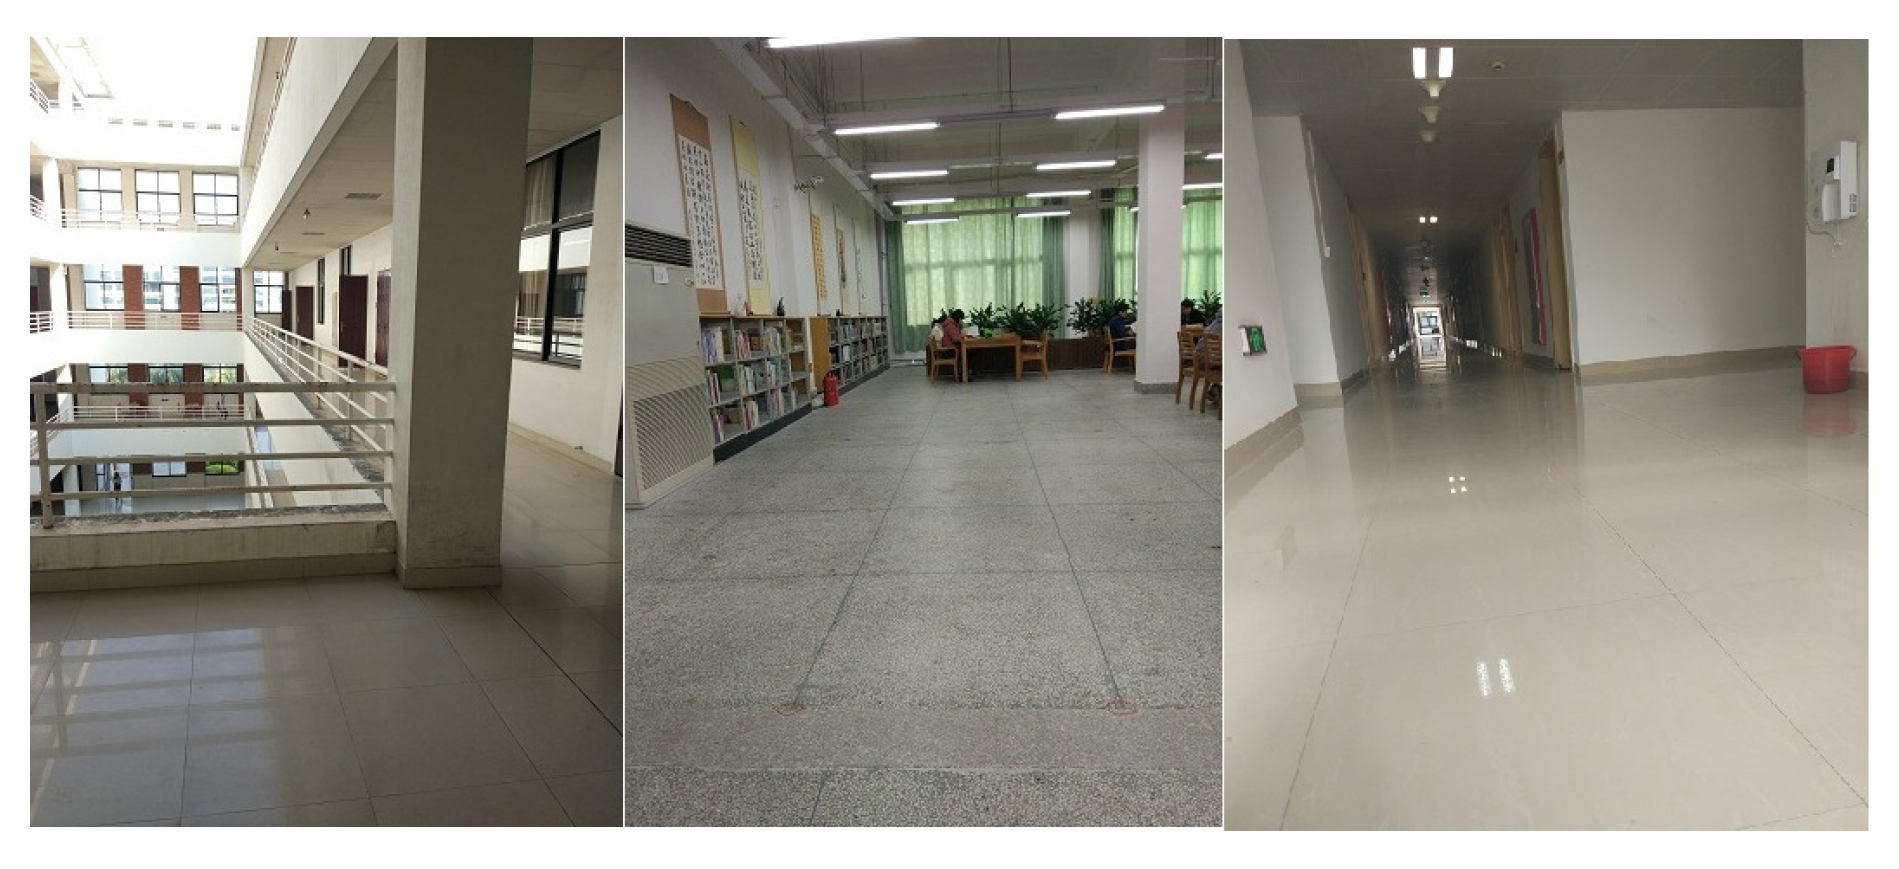
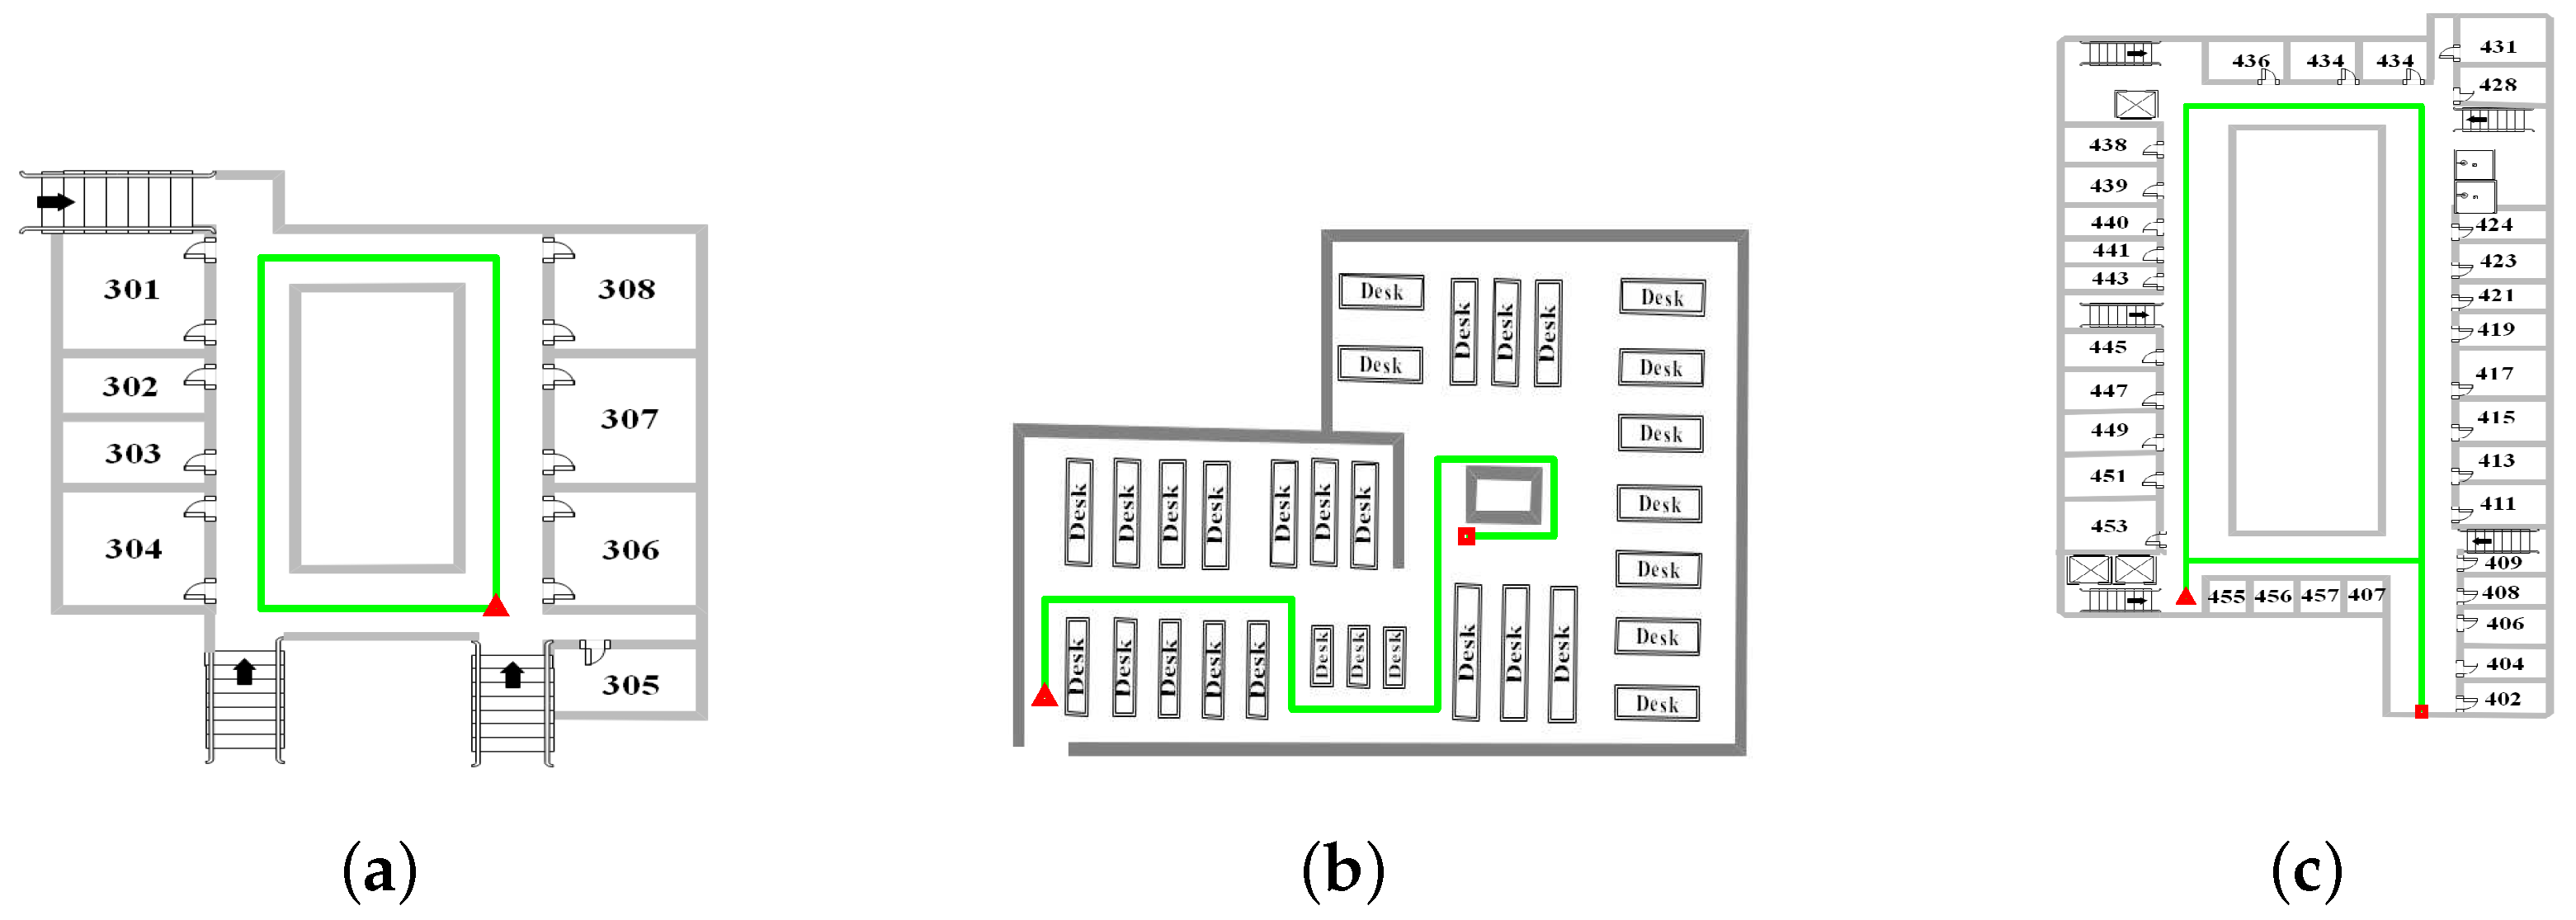
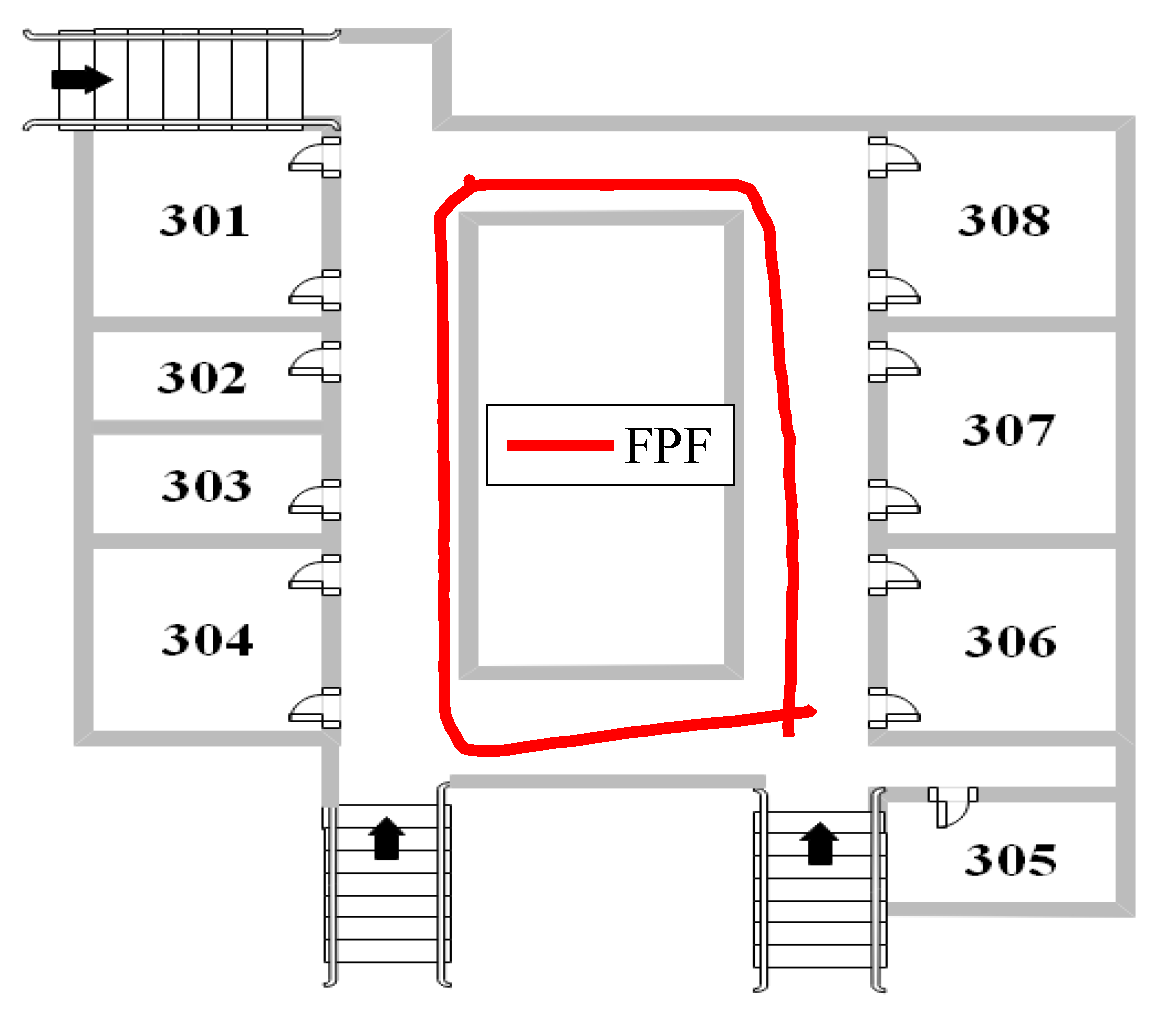
To verify the effectiveness of the proposed algorithm, we conducted walking experiments at a local university. The commonly-used smartphone gesture is handheld. A smartphone was used to test indoor positioning system performance. A floor plan was constructed from simple line segments. The real trajectory was measured by a laser rangefinder. Based on the ISO/IEC 18305 suggestion [42], teaching building, study room and office building were selected as the walking site, as shown in Figure 4. In Figure 5, the green line denotes the true test track. The red triangle and red square represent the initial and end points of the test, respectively. The initial and end points overlap each other in Figure 5a, which requires an explanation. The tester carried the smartphone from the initial to the end points. The inertial sensor sampling frequency was set to 100 Hz. In FPF, was set to 0.1 and set to one.
4.1. Weights Experiment
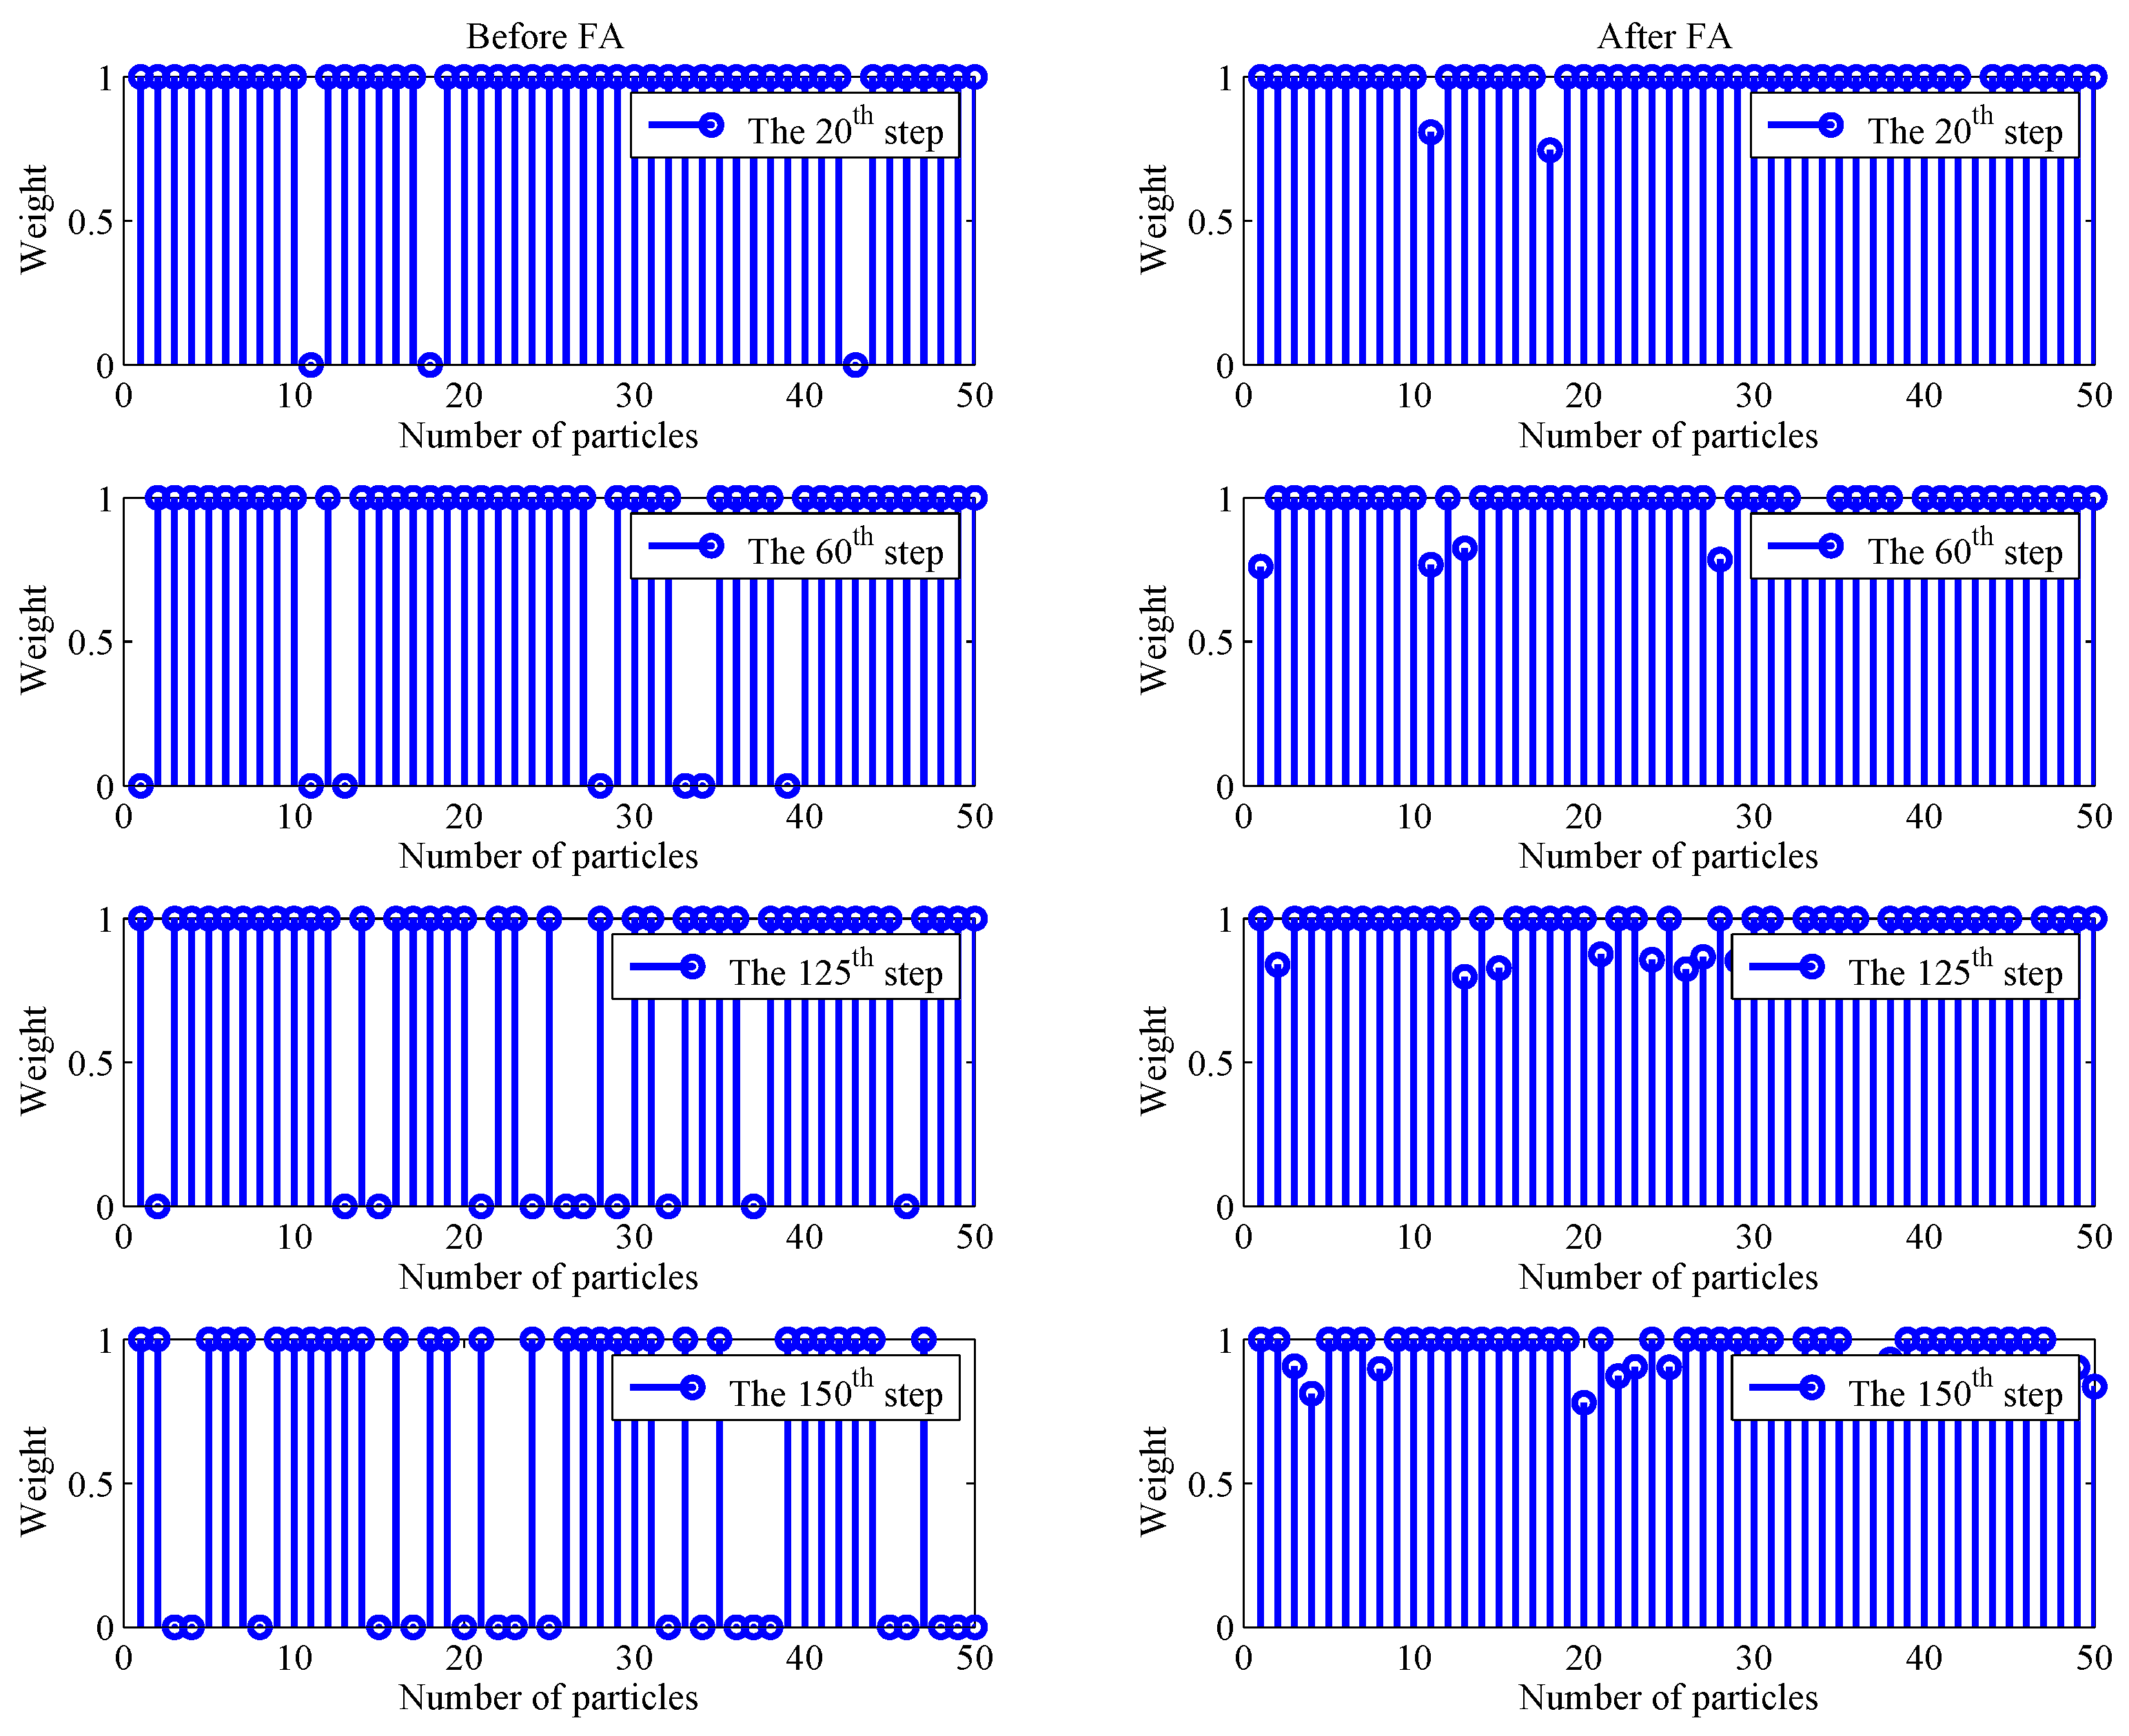
When particles cross an obstacle, we set their weight to zero. Otherwise, we set the weight to one. Crossing-obstacle particles are treated as low-weight particles. High-weight particles and low-weight particles are resampled with high and low probabilities, respectively. When too many low-weight particles participate in resampling, conventional PF often suffers from the particle impoverishment problem. To mitigate the particle impoverishment problem, we use FA to modify the particles. To illustrate the effectiveness of the modified operations, the weights before and after performing FA are shown in Figure 6. As the tester walked along the teaching hallway, we selected the 20th, 60th, 125th and 150th steps for analysis. The left and right subfigures in Figure 6 denote the particle weights before and after performing FA, respectively. There are 3, 7, 11 and 19 zero-weight particles in the left subfigures. There are 0, 0, 0 and 0 zero-weight particles in the right subfigures. After FA is performed, the crossing-obstacle particles are greatly reduced, demonstrating that the particle impoverishment problem is mitigated.
4.2. Walking Experiment at the Teaching Building
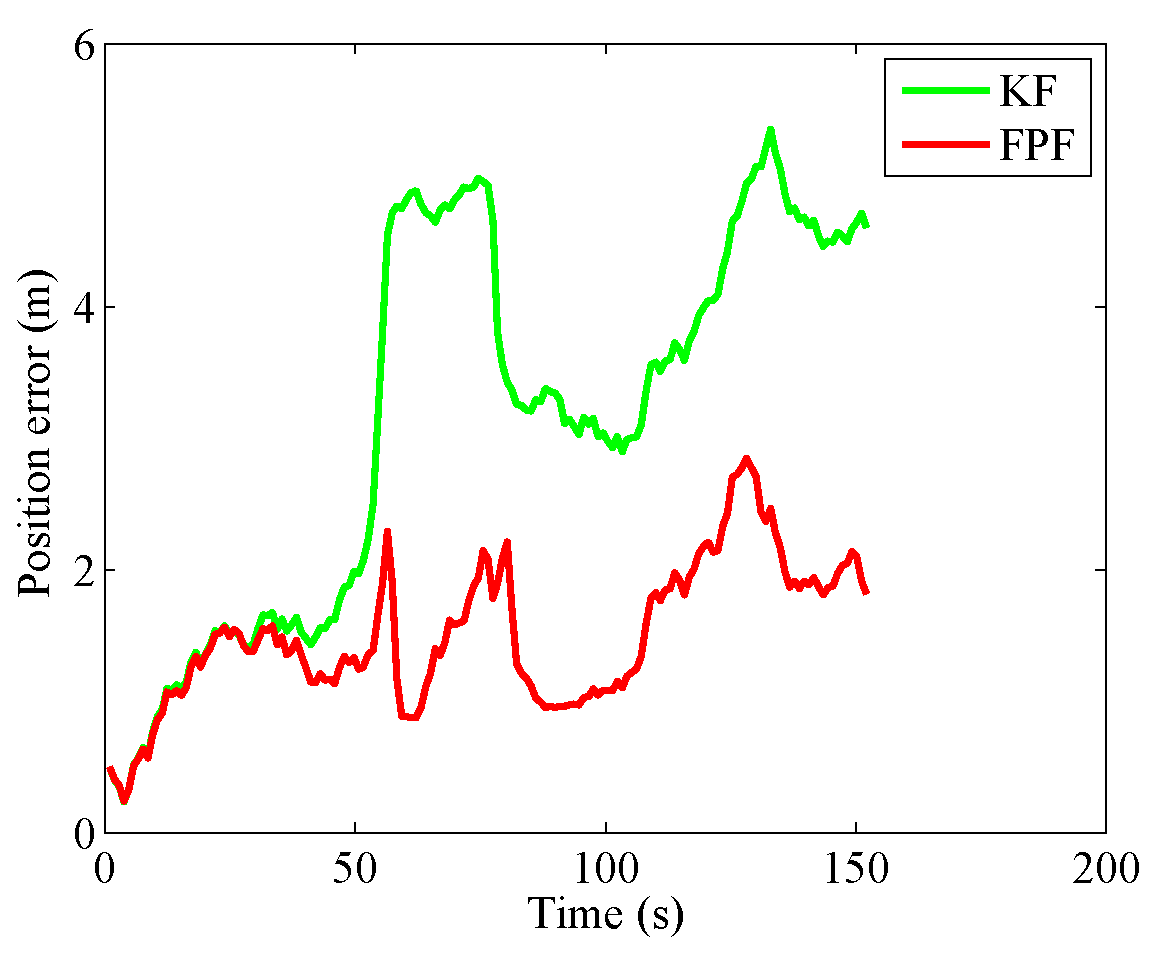
The first walking experiment was conducted in the hallway on the third floor of the teaching building. The walking distance was about 90 m. With the handheld gesture, the trajectories of the tester are shown in Figure 7 and Figure 8. In INS, sensor bias, temperature drift and the tester’s jitters all caused positioning errors to increase over time. According to the characteristic that vertical velocity and heading change of the tester should be zero at a particular moment, KF was used to reduce the position error. As seen from Figure 7, although KF reduced the position error, the accumulated error of INS still grew over time. The walking experiment, illustrated in Figure 7, suggests that additional information is needed to reduce the INS error. Combined with the floor plan, an indoor localization system using FPF was proposed to reduce the position error. In FPF, through the FA operation, crossing-obstacle particles migrated to particles that do not cross an obstacle. As seen in Figure 8, the tester’s locations are in the hallway. Compared with KF, FPF greatly improved the positioning accuracy.
The position errors and corresponding CDF are shown in Figure 9 and Figure 10. Indoor positioning system errors were related to walking time. The position errors of FPF were fewer than those for KF for the duration of most uses (e.g., 30–150 s). When the position errors were smaller than 3 m, the probabilities of error for KF and FPF were 62.26% and 0%, respectively, as shown in Figure 10. Compared with KF, FPF greatly reduced the position error.
In order to evaluate the performance of the improved algorithm, four performance metrics (the average error, Root Mean Square Error (RMSE), maximum error and Circular Error Probability (CEP)) are defined as follows:
where , , and are the average error, RMSE, maximum error and CEP (95%), respectively. R denotes the radius of the smallest circle. For detailed instructions, please refer to [42]
KF reduced the position error to some extent. However, because there was no additional information to constrain the cumulative error of the inertial sensors, INS error using KF still grew unbounded along with the walking time. Combined with the floor plan, the indoor positioning system using FPF effectively constrained the particle range and reduced the positioning errors. Shown in Table 1 are the average error, RMSE, maximum error and CEP for KF and FPF. The reductions in the errors between KF and FPF were as follows: 52.08% for the average error; 53.76% for RMSE; 46.73% for maximum error; and 50.91% for CEP (95%).
4.3. Walking Experiment at the Study Room
In a teaching building experiment, we showed that FPF combined with a floor plan can effectively constrain the heading drift of INS. PF [13,43] and a map-matching algorithm [44] were used to perform a comprehensive comparison. The walking distance was about 110 m.
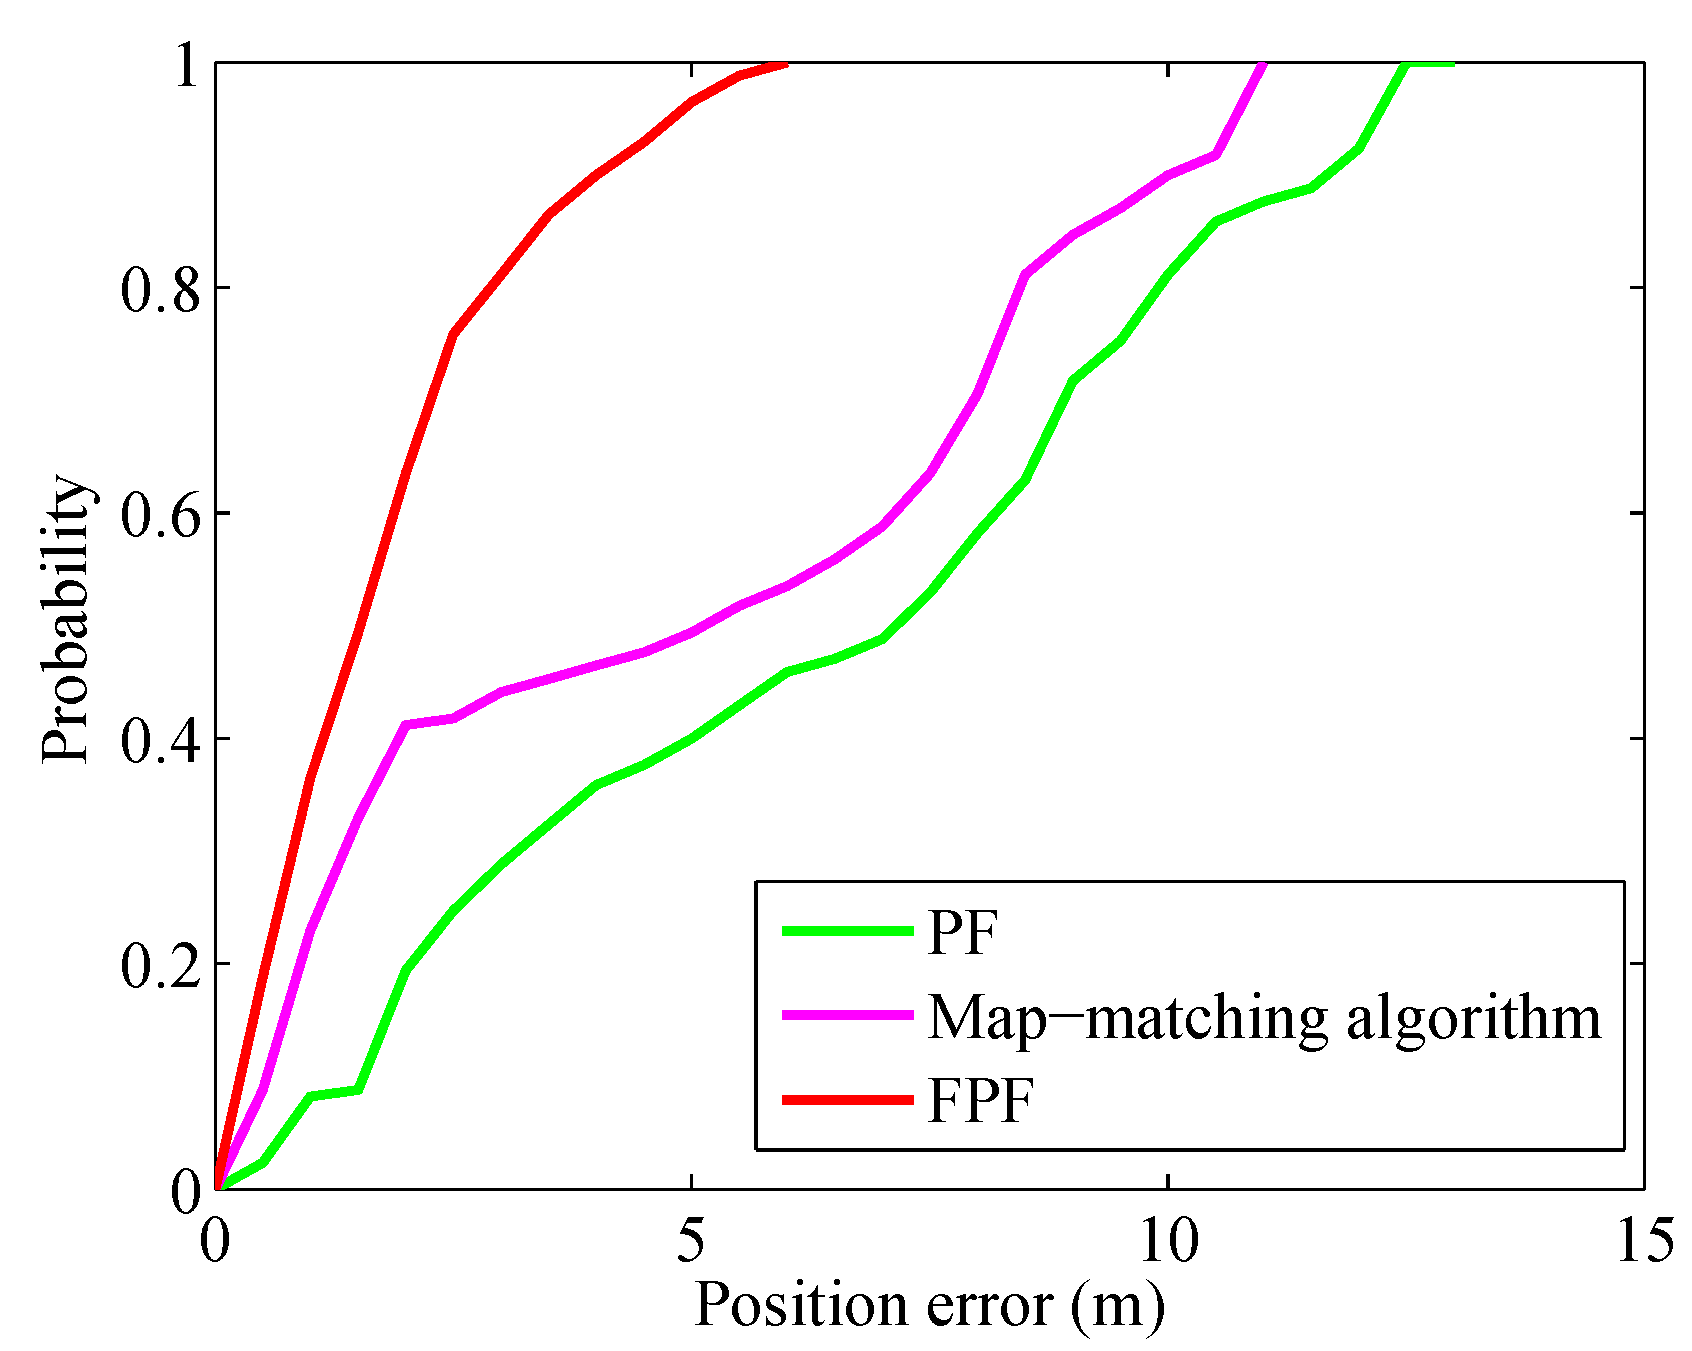
In [13,43], after KF was performed, a PF was used to further reduce the position error. As no additional information was used, PF was relatively limited in improving positioning accuracy. To further improve positioning accuracy, a map-matching algorithm was proposed in [44]. Inspired by [13,43,44], we further propose FPF to improve positioning accuracy. Based on the fact that a tester cannot cross an obstacle, we divided the particles into two types: crossing-obstacle particles and non-crossing-obstacle particles. Using FA, the crossing-obstacle particles migrated toward non-crossing-obstacle particles. Figure 11 shows the positioning result for the handheld gesture. As seen in Figure 12, using FPF significantly reduced the probability of positioning error. When the position error is less than 3 m, the probabilities of error for PF, the map-matching algorithm and FPF were 71.18%, 55.88% and 18.82%, respectively.
The average error, RMSE, maximum error and CEP (95%) for PF, the map-matching algorithm and FPF are shown in Table 2. The errors in FPF, compared to those in PF and the map-matching algorithm, are reduced as follows: 71.65% and 63.19%, respectively, for the average error; 69.2% and 63.03%, respectively, for RSME; 54.81% and 47.95%, respectively, for maximum error; 60.87% and 55.27%, respectively, for CEP (95%). Therefore, FPF is superior to PF and the map-matching algorithm.
4.4. Walking Experiment at the Office Building
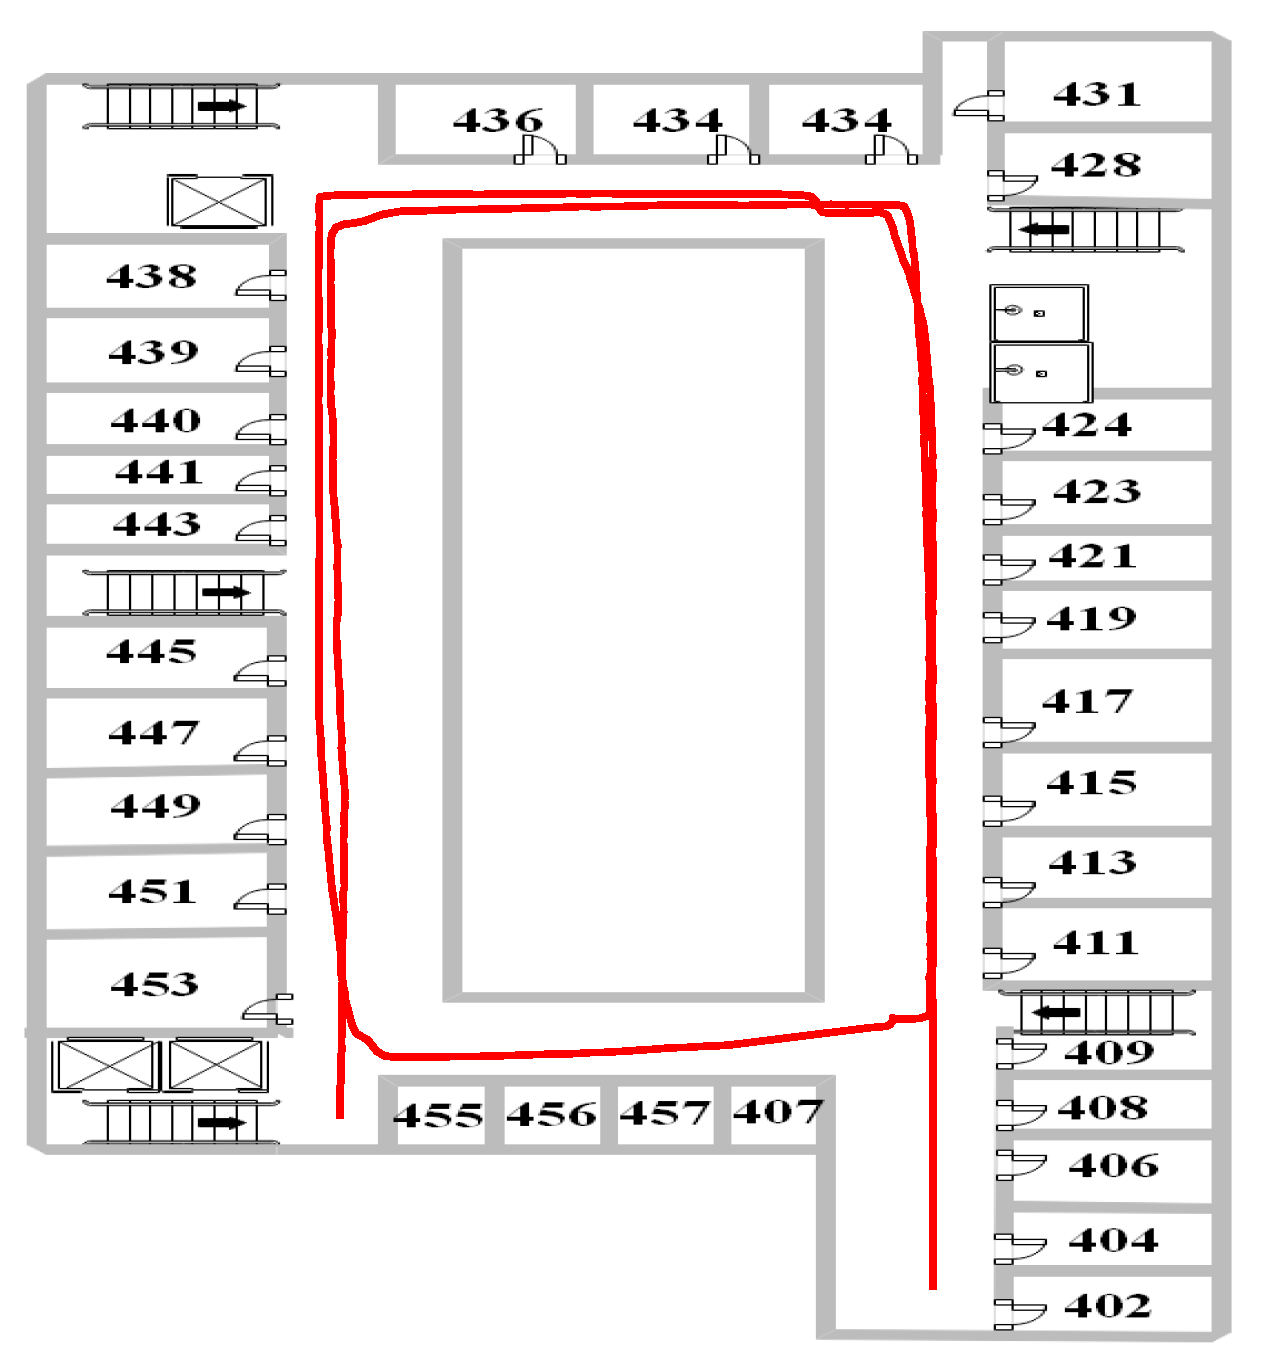
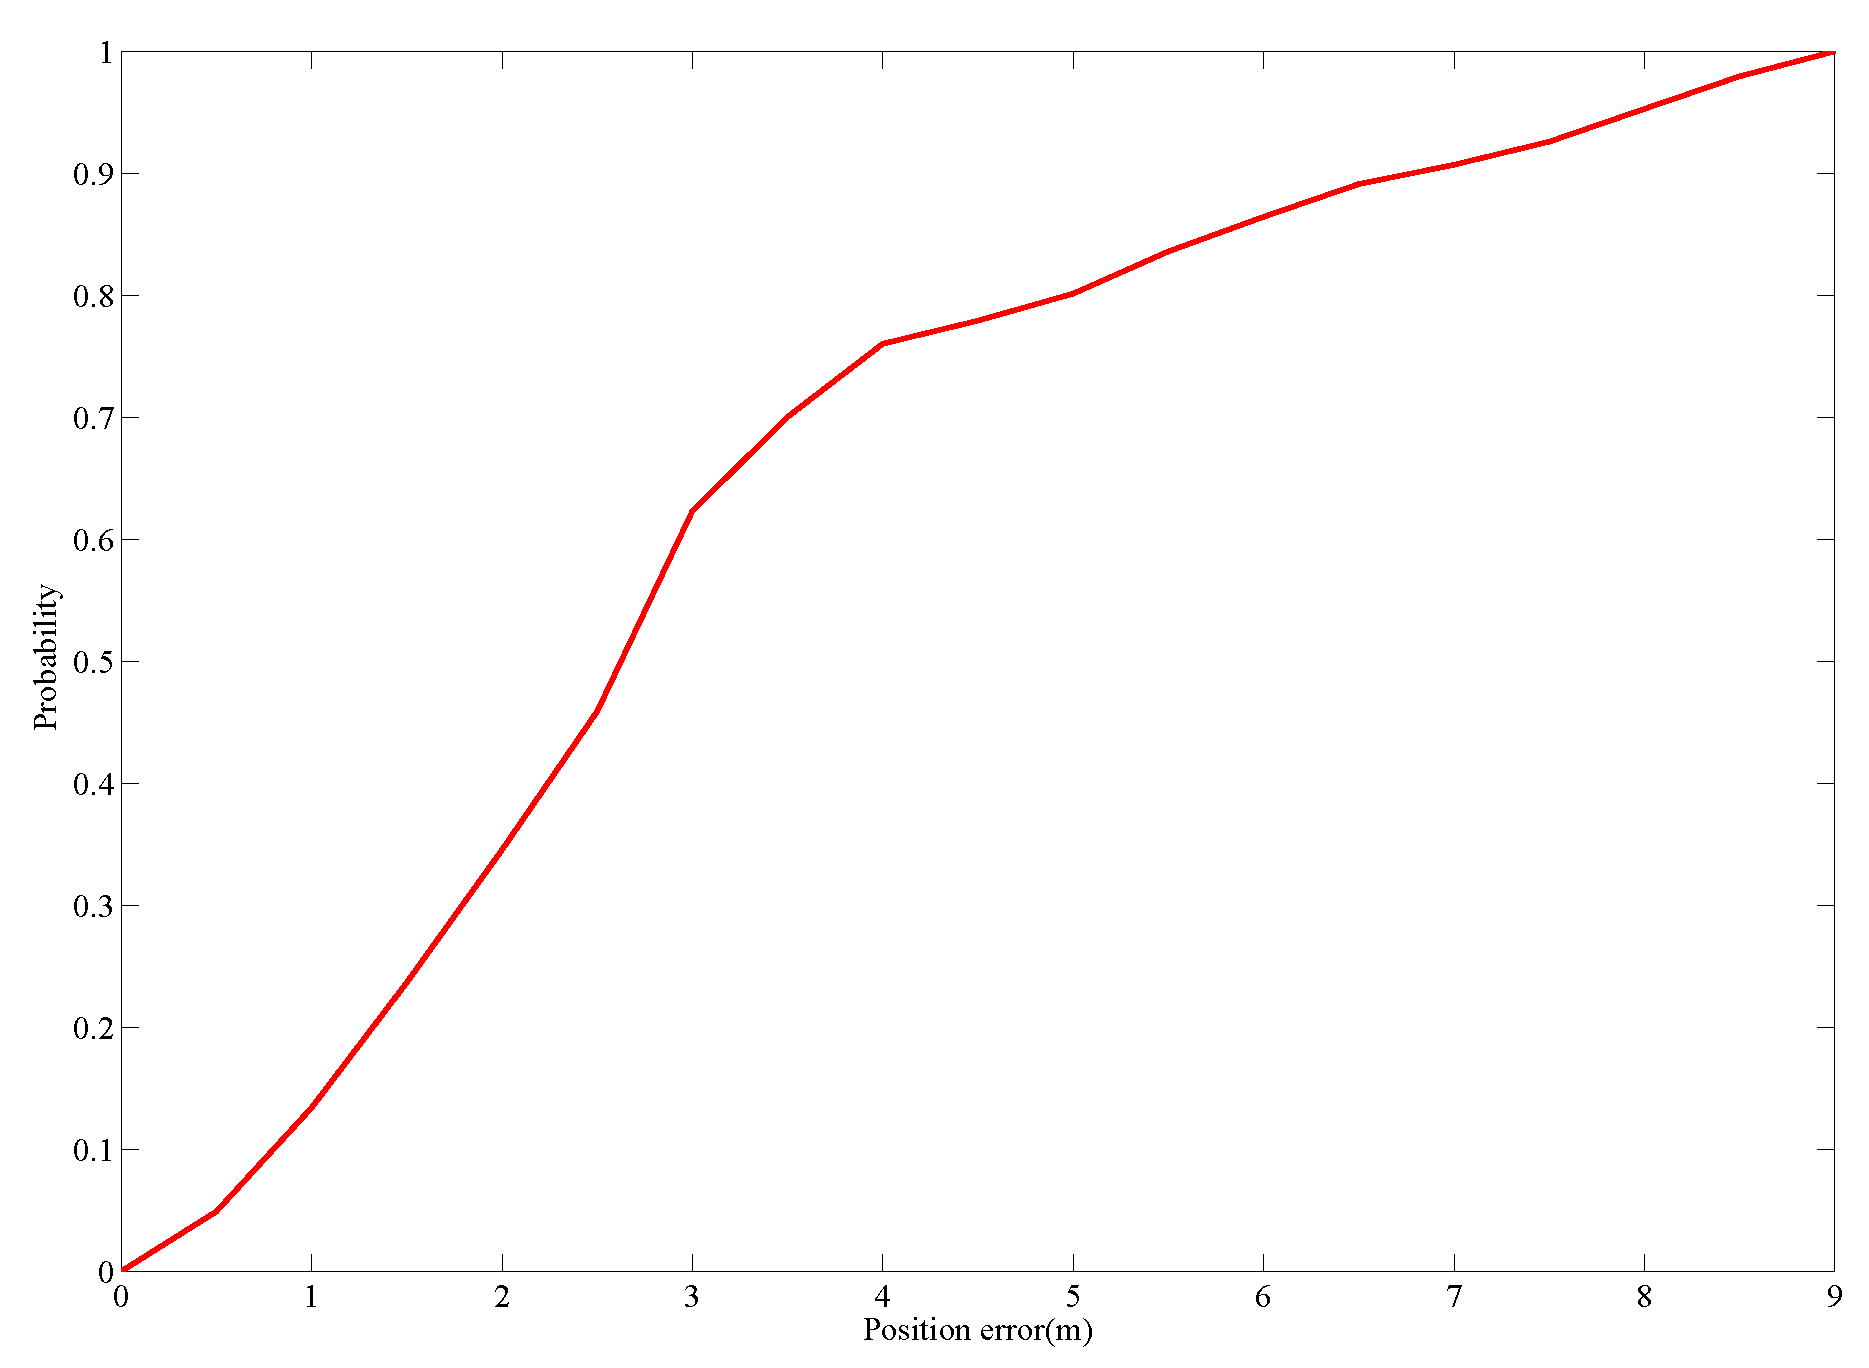
In order to further prove the feasibility of the improved algorithm, a more complex experiment was carried out. The walking distance was about 400 m. The positioning result and CDF are shown in Figure 13 and Figure 14. The experimental results show that the problem of directional drift was well solved. The average error, RMSE, maximum error and CEP(95%) were 3.12, 3.81, 8.97 and 7.97 m, respectively. When the position error was less than 3 m, the probability of error for the proposed algorithm was 37.7%. From the results of the walking experiment, it can be seen that the performance of the indoor positioning system had been improved.
5. Conclusions and Future Work
In this paper, two innovations were proposed to improve the accuracy of indoor positioning. The first was that the hybrid step length model improved the accuracy of step length estimation. The core of the algorithm was to choose the appropriate step length at different times. The second was that the improved particle filter improved the indoor positioning performance. Through experimentation, the performance of our proposed algorithm was demonstrated. Three walking experiments were performed in a teaching building, a study room and an office building. The errors for three walking experiments are listed as follows: 1.5, 1.8 and 3.12 m, respectively, for the average error; 1.6, 2.27 and 3.81 m, respectively, for RMSE; 2.85, 5.59 and 8.97 m, respectively, for maximum error; 2.44, 4.75 and 7.97 m, respectively, for CEP (95%). The four performance metrics imply that the improved algorithm improves the performance of the indoor positioning system and can meet the needs of most users.
However, some problems must still be addressed. Combined with a floor plan and FA, our proposed PF adds an external procedure, which increases the computational burden. In addition, how to improve positioning accuracy in harsh environments warrants further consideration.
Author Contributions
All authors have made a contribution to this paper. J.C., G.O. and A.P. proposed the main idea. J.C. performed the walking experiments and drafted the paper. A.P., L.Z. and J.S. were involved in the algorithm design.
Funding
This research was funded by the National Key Research and Development Program under Grant Number 2018YFB0505200.
Acknowledgments
We would like to express our great gratitude to Jiangfeng, as she helped us revise our paper by correcting some grammar mistakes and improving the level of language.
Conflicts of Interest
All authors declare no conflict of interest.
Abbreviations
| INS | Inertial Navigation System |
| KF | Kalman Filter |
| FPF | Firefly Particle Filter |
| MaLoc | Magnetic fingerprint-based indoor Localization |
| WLS | Weighted Least Squares |
| PF | Particle Filter |
| FA | Firefly Algorithm |
| CDF | Cumulative Distribution Function |
| RMSE | Root Mean Square Error |
| CEP | Circular Error Probability |
References
- Chiang, K.W.; Liao, J.K.; Huang, S.H.; Chang, H.W.; Chu, C.H. The Performance Analysis of Space Resection-Aided Pedestrian Dead Reckoning for Smartphone Navigation in a Mapped Indoor Environment. ISPRS Int. J. Geo-Inf. 2017, 6, 43. [Google Scholar] [CrossRef]
- Li, Z.; Liu, C.; Gao, J.; Li, X. An Improved WiFi/PDR Integrated System Using an Adaptive and Robust Filter for Indoor Localization. ISPRS Int. J. Geo-Inf. 2016, 5, 224. [Google Scholar] [CrossRef]
- Xie, H.; Gu, T.; Tao, X.; Ye, H.; Lu, J. A reliability-augmented particle filter for magnetic fingerprinting based indoor localization on smartphone. IEEE T. Mobile. Comput. 2016, 15, 1877–1892. [Google Scholar] [CrossRef]
- Sheinker, A.; Ginzburg, B.; Salomonski, N.; Frumkis, L.; Kaplan, B.Z.; Moldwin, M.B. A method for indoor navigation based on magnetic beacons using smartphones and tablets. Measurement 2016, 81, 197–209. [Google Scholar] [CrossRef]
- Gozick, B.; Subbu, K.P.; Dantu, R.; Maeshiro, T. Magnetic maps for indoor navigation. IEEE T. Instrum. Meas. 2011, 60, 3883–3891. [Google Scholar] [CrossRef]
- Subbu, K.P.; Gozick, B.; Dantu, R. LocateMe: Magnetic-fields-based indoor localization using smartphones. ACM Trans. Intell. Syst. Technol. 2013, 4, 73:1–73:27. [Google Scholar] [CrossRef]
- Fang, S.H.; Lin, T.N. A dynamic system approach for radio location fingerprinting in wireless local area networks. IEEE Trans. Commun. 2010, 58, 1020–1025. [Google Scholar] [CrossRef]
- Khalajmehrabadi, A.; Gatsis, N.; Akopian, D. Modern WLAN fingerprinting indoor positioning methods and deployment challenges. IEEE Commun. Surv. Tutor. 2017, 19, 1974–2002. [Google Scholar] [CrossRef]
- Li, H.; Chen, X.; Jing, G.; Wang, Y.; Cao, Y.; Li, F.; Zhang, X.; Xiao, H. An indoor continuous positioning algorithm on the move by fusing sensors and Wi-Fi on smartphones. Sensors 2015, 15, 31244–31267. [Google Scholar] [CrossRef] [PubMed]
- Chen, J.; Ou, G.; Peng, A.; Zheng, L.; Shi, J. An INS/WiFi Indoor Localization System Based on the Weighted Least Squares. Sensors 2018, 18, 1458. [Google Scholar] [CrossRef] [PubMed]
- Bahl, P.; Padmanabhan, V.N. RADAR: An in-building RF-based user location and tracking system. In Proceedings of the Nineteenth Annual Joint Conference of the IEEE Computer and Communications Societies, Tel Aviv, Israel, 26–30 March 2000; pp. 775–784. [Google Scholar]
- Zheng, L.X.; Wu, Z.H.; Zhou, W.C.; Weng, S.L.; Zheng, H.R. A Smartphone Based Hand-Held Indoor Positioning System. In Frontier Computing; Springer: Singapore, 2016; pp. 639–650. [Google Scholar]
- Zheng, L.X.; Zhou, W.C.; Tang, W.W.; Zheng, X.C.; Peng, A.; Zheng, H.R. A 3D indoor positioning system based on low-cost MEMS sensors. Simul. Model Pract. Th. 2016, 65, 45–56. [Google Scholar] [CrossRef]
- Yu, C.; Lan, H.; Liu, Z.; El-Sheimy, N.; Yu, F. Indoor map aiding/map matching smartphone navigation using auxiliary particle filter. In Proceedings of the China Satellite Navigation Conference (CSNC) 2016 Proceedings, Changsha, China, 18–20 May 2016; Sun, J., Liu, J., Fan, S., Wang, F., Eds.; Springer: Singapore, 2016; Volume 1. [Google Scholar]
- Ali, N.; Othman, M.A.; Husain, M.N.; Misran, M.H. A review of firefly algorithm. ARPN J. Eng. Appl. Sci. 2014, 9, 1732–1736. [Google Scholar]
- Kang, X.; Huang, B.; Qi, G. A Novel Walking Detection and Step Counting Algorithm Using Unconstrained Smartphones. Sensors 2018, 18, 297. [Google Scholar] [CrossRef] [PubMed]
- Song, J.W.; Park, C.G. Enhanced pedestrian navigation based on course angle error estimation using cascaded Kalman filters. Sensors 2018, 18, 1281. [Google Scholar] [CrossRef] [PubMed]
- Foxlin, E. Pedestrian tracking with shoe-mounted inertial sensors. IEEE Comput. Graph. 2005, 25, 33–46. [Google Scholar] [CrossRef]
- Zhang, H.; Yuan, W.; Shen, Q.; Li, T.; Chang, H. A handheld inertial pedestrian navigation system with accurate step modes and device poses recognition. IEEE Sens. J. 2015, 15, 1421–1429. [Google Scholar] [CrossRef]
- Borenstein, J.; Ojeda, L. Heuristic drift elimination for personnel tracking systems. J. Navig. 2010, 63, 591–606. [Google Scholar] [CrossRef]
- Jiménez, A.R.; Seco, F.; Zampella, F.; Prieto, J.C.; Guevara, J. Improved heuristic drift elimination with magnetically-aided dominant directions (MiHDE) for pedestrian navigation in complex buildings. J. Locat. Based Serv. 2012, 6, 186–210. [Google Scholar] [CrossRef] [Green Version]
- Li, Y.; Zhuang, Y.; Lan, H.; Niu, X.; El-Sheimy, N. A profile-matching method for wireless positioning. IEEE Commun. Lett. 2016, 20, 2514–2517. [Google Scholar] [CrossRef]
- Li, Y.; Zhuang, Y.; Lan, H.; Zhang, P.; Niu, X.; El-Sheimy, N. Self-Contained Indoor Pedestrian Navigation Using Smartphone Sensors and Magnetic Features. IEEE Sens. J. 2016, 16, 7173–7182. [Google Scholar] [CrossRef]
- Xie, H.; Gu, T.; Tao, X.; Ye, H.; Lv, J. MaLoc: A practical magnetic fingerprinting approach to indoor localization using smartphones. In Proceedings of the 2014 ACM International Joint Conference on Pervasive and Ubiquitous Computing, New York, NY, USA, 13–17 September 2014; pp. 243–253. [Google Scholar]
- Chen, G.; Meng, X.; Wang, Y.; Zhang, Y.; Tian, P.; Yang, H. Integrated Wifi/PDR/Smartphone Using an Unscented Kalman Filter Algorithm for 3d Indoor Localization. Sensors 2015, 15, 24595–24614. [Google Scholar] [CrossRef] [PubMed]
- Lee, M.S.; Ju, H.; Park, C.G. Map assisted PDR/Wi-Fi fusion for indoor positioning using smartphone. Int. J. Control. Autom. 2017, 15, 627–639. [Google Scholar] [CrossRef]
- Tian, Q.; Salcic, Z.; Wang, K.I.K.; Pan, Y. A hybrid indoor localization and navigation system with map matching for pedestrians using smartphones. Sensors 2015, 15, 30759–30783. [Google Scholar] [CrossRef] [PubMed]
- Bao, H.; Wong, W.C. A novel map-based dead-reckoning algorithm for indoor localization. J. Sens. Actuator Netw. 2014, 3, 44–63. [Google Scholar] [CrossRef]
- Yu, C.; El-Sheimy, N.; Lan, H.; Liu, Z. Map-Based Indoor Pedestrian Navigation Using an Auxiliary Particle Filter. Micromachines 2017, 8, 225. [Google Scholar] [CrossRef]
- Pinchin, J.; Hide, C.; Moore, T. A particle filter approach to indoor navigation using a foot mounted inertial navigation system and heuristic heading information. In Proceedings of the 2012 International Conference on Indoor Positioning and Indoor Navigation (IPIN), Sydney, Australia, 13–15 November 2012; pp. 1–10. [Google Scholar]
- Li, F.; Zhao, C.; Ding, G.; Gong, J.; Liu, C.; Zhao, F. A Reliable and Accurate Indoor Localization Method Using Phone Inertial Sensors. In Proceedings of the 2012 ACM Conference on Ubiquitous Computing, Pittsburgh, PA, USA, 5–8 September 2012; pp. 421–430. [Google Scholar]
- Yang, X.S. Firefly algorithms for multimodal optimization. In Stochastic Algorithms: Foundations and Applications, Proceedings of the 5th International Symposium on Stochastic Algorithms (SAGA 2009), Sapporo, Japan, 26–28 October 2009; Springer: Berlin/Heidelberg, Germany, 2009; pp. 169–178. [Google Scholar]
- Gao, M.L.; He, X.H.; Luo, D.S.; Jiang, J.; Teng, Q.Z. Object tracking using firefly algorithm. IET Comput. Vis. 2015, 7, 227–237. [Google Scholar] [CrossRef]
- Gao, M.L.; Li, L.L.; Sun, X.M.; Yin, L.J.; Li, H.T.; Luo, D.S. Firefly algorithm (FA) based particle filter method for visual tracking. Optik 2015, 126, 1705–1711. [Google Scholar] [CrossRef]
- Shin, E. Estimation Techniques for Low-Cost Inertial Navigation. Ph.D. Thesis, University of Calgary, Calgary, AB, Canada, 2005. [Google Scholar]
- Chung, H.Y.; Hou, C.C.; Chen, Y.S. Indoor intelligent mobile robot localization using fuzzy compensation and Kalman filter to fuse the data of gyroscope and magnetometer. IEEE Trans. Ind. Electron. 2015, 62, 6436–6447. [Google Scholar] [CrossRef]
- Jiménez, A.R.; Seco, F.; Prieto, J.C.; Guevara, J. Indoor pedestrian navigation using an INS/EKF framework for yaw drift reduction and a foot-mounted IMU. In Proceedings of the 2010 7th Workshop on Positioning Navigation and Communication (WPNC), Dresden, Germany, 11–12 March 2010; pp. 135–143. [Google Scholar]
- Zhou, T.; Peng, D.; Xu, C.; Zhang, W.; Shen, J. Adaptive particle filter based on Kullback–Leibler distance for underwater terrain aided navigation with multi-beam sonar. IET Radar. Sonar. Nav. 2018, 4, 433–441. [Google Scholar] [CrossRef]
- Jo, H.; Cho, H.M.; Jo, S.; Kim, E. Efficient Grid-Based Rao–Blackwellized Particle Filter SLAM With Interparticle Map Sharing. IEEE-ASME Trans. Mechatron. 2018, 23, 714–724. [Google Scholar] [CrossRef]
- Yin, S.; Zhu, X. Intelligent particle filter and its application to fault detection of nonlinear system. IEEE Trans. Ind. Electron. 2015, 62, 3852–3861. [Google Scholar] [CrossRef]
- Park, S.; Hwang, J.P.; Kim, E.; Kang, H.J. A new evolutionary particle filter for the prevention of sample impoverishment. IEEE Trans. Evol. Comput. 2009, 13, 801–809. [Google Scholar] [CrossRef]
- ISO/IEC 18305:2016. Information Technology—Real Time Locating Systems—Test and Evaluation of Localization and Tracking Systems. Available online: https://www.iso.org/standard/62090.html (accessed on 10 May 2018).
- Zheng, L.; Zhou, W.; Tang, W.; Zheng, X.; Yang, H.; Pu, S.; Li, C.; Tang, B.; Chen, Y. A foot-mounted sensor based 3D indoor positioning approach. In Proceedings of the 2015 IEEE Twelfth International Symposium on Autonomous Decentralized Systems (ISADS), Taichung, Taiwan, 25–27 March 2015; pp. 145–150. [Google Scholar]
- Davidson, P.; Collin, J.; Takala, J. Application of particle filters for indoor positioning using floor plans. In Proceedings of the 2010 Ubiquitous Positioning Indoor Navigation and Location Based Service (UPINLBS), Kirkkonummi, Finland, 14–15 October 2010; pp. 1–4. [Google Scholar]
Figure 1.
System model.

Figure 2.
Step length model.

Figure 3.
Step length model.

Figure 4.
Different scenarios.

Figure 5.
The walking trajectory: (a) teaching building; (b) study room; (c) office building.

Figure 6.
Weights at the 20th, 60th, 125th and 150th steps.

Figure 7.
Positioning results for EKF.

Figure 8.
Positioning results for FPF.

Figure 9.
Position errors with different algorithms.

Figure 10.
CDF with different algorithms.

Figure 11.
Positioning result for FPF.

Figure 12.
CDF for PF, the map-matching algorithm and FPF.

Figure 13.
Positioning result for FPF.

Figure 14.
CDF for FPF.


Table 1.
Position errors for KF and FPF (m).
| Error | The Average Error | RMSE | Maximum Error | CEP (95%) |
|---|---|---|---|---|
| KF | 3.13 | 3.46 | 5.35 | 4.97 |
| FPF | 1.5 | 1.6 | 2.85 | 2.44 |
Table 2.
Position errors for PF, the map-matching algorithm and FPF (m).
| Error | The Average Error | RMSE | Maximum Error | CEP (95%) |
|---|---|---|---|---|
| PF | 6.35 | 7.37 | 12.37 | 12.14 |
| Map-matching algorithm | 4.89 | 6.14 | 10.74 | 10.62 |
| FPF | 1.8 | 2.27 | 5.59 | 4.75 |
© 2018 by the authors. Licensee MDPI, Basel, Switzerland. This article is an open access article distributed under the terms and conditions of the Creative Commons Attribution (CC BY) license (http://creativecommons.org/licenses/by/4.0/).
Share and Cite
MDPI and ACS Style
Chen, J.; Ou, G.; Peng, A.; Zheng, L.; Shi, J. An INS/Floor-Plan Indoor Localization System Using the Firefly Particle Filter. ISPRS Int. J. Geo-Inf. 2018, 7, 324. https://0-doi-org.brum.beds.ac.uk/10.3390/ijgi7080324
AMA Style
Chen J, Ou G, Peng A, Zheng L, Shi J. An INS/Floor-Plan Indoor Localization System Using the Firefly Particle Filter. ISPRS International Journal of Geo-Information. 2018; 7(8):324. https://0-doi-org.brum.beds.ac.uk/10.3390/ijgi7080324
Chicago/Turabian StyleChen, Jian, Gang Ou, Ao Peng, Lingxiang Zheng, and Jianghong Shi. 2018. "An INS/Floor-Plan Indoor Localization System Using the Firefly Particle Filter" ISPRS International Journal of Geo-Information 7, no. 8: 324. https://0-doi-org.brum.beds.ac.uk/10.3390/ijgi7080324
Note that from the first issue of 2016, this journal uses article numbers instead of page numbers. See further details here.