Correction

Correction: Dawson, T.; et al. A Spatial Analysis of the Relationship between Vegetation and Poverty. Int. J. Geo-Inf. 2018, 7, 83

1
Department of Sociology and Anthropology, Saint Louis University, St. Louis, MO 63108, USA
2
Department of Earth and Atmospheric Sciences, Saint Louis University, St. Louis, MO 63108, USA
3
Department of Geography, Virginia Tech, 220 Stanger Street, Blacksburg, VA 24061, USA
*
Author to whom correspondence should be addressed.
ISPRS Int. J. Geo-Inf. 2018, 7(8), 329; https://0-doi-org.brum.beds.ac.uk/10.3390/ijgi7080329
Submission received: 30 July 2018 / Accepted: 7 August 2018 / Published: 16 August 2018
The authors wish to make the following corrections to their paper [1]:

1. Change in Main Body

The paragraph, formula, and citations in Section 3, page 5 of 26, reported in their recently published paper [1] were incorrect. Currently it reads:
“We used the pixel level regression Curve Fit tool, an extension in ArcMap (ArcGIS). This allowed for us to run regression trend analysis on a series of 72 cities using AVHRR raster datasets for temporal analysis (1990, 1991, 1995, 1996, 1997, 1998, and 2001 to 2010), taken in consideration that vegetation can be impacted by the climate during the years i.e., really hot, dry, wet, etc. The approach is similar to Geographically Weighted Regression (GWR), (Fotheringham, Brunsdon et al. 2003).
Y m = a + b t + e
where
  • Y m = M A X N .
  • b t = t i m e
  • e = r a n d o m   e r r o r
Due to an undetected mistake in Section 3: Methods, certain errors appeared in the formula and we omitted some citations and references; for this reason, we would like to replace the above with:
“We used the pixel level regression Curve Fit tool [44–46] an extension in ArcMap (ArcGIS) [31]. This allowed us to run regression trend analysis on 72 cities using AVHRR raster datasets for temporal analysis (1990, 1991, 1995, 1996, 1997, 1998, and 2001 to 2010).
Y = aX + b
where:
  • Y = MAXN
  • a = C o e f f i c i e n t
  • X = T i m e
  • b = I n t e r c e p t

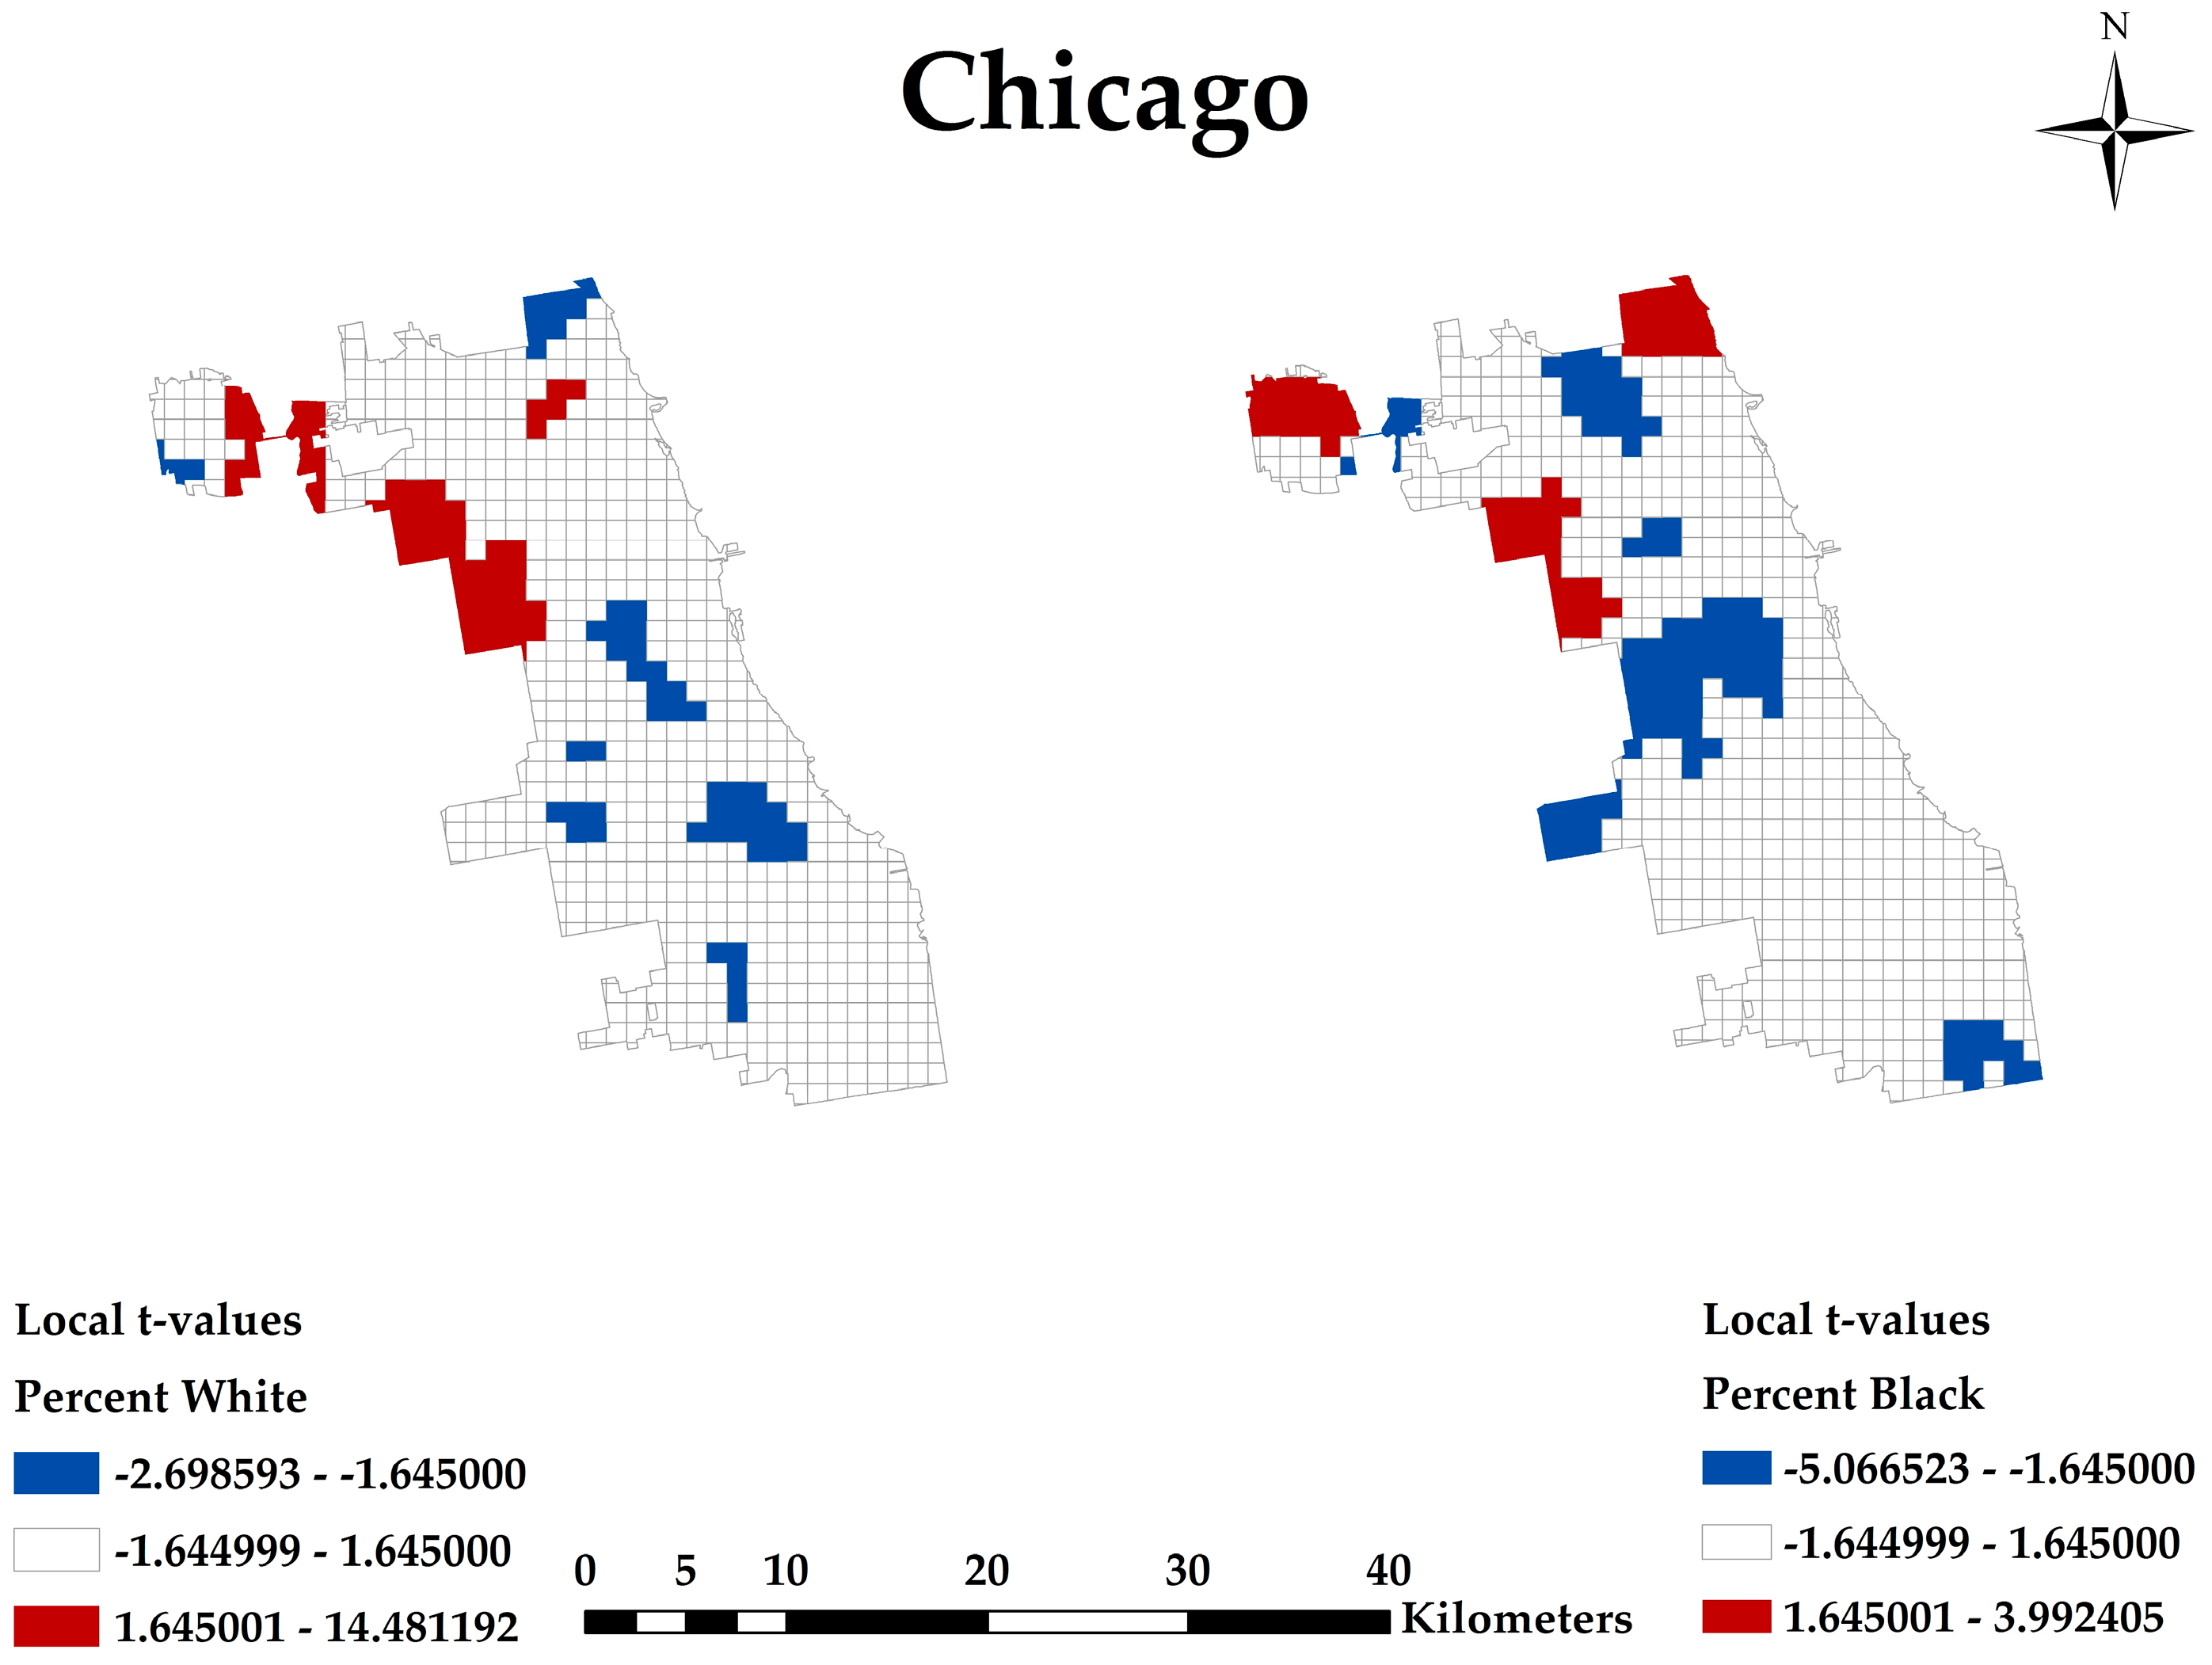
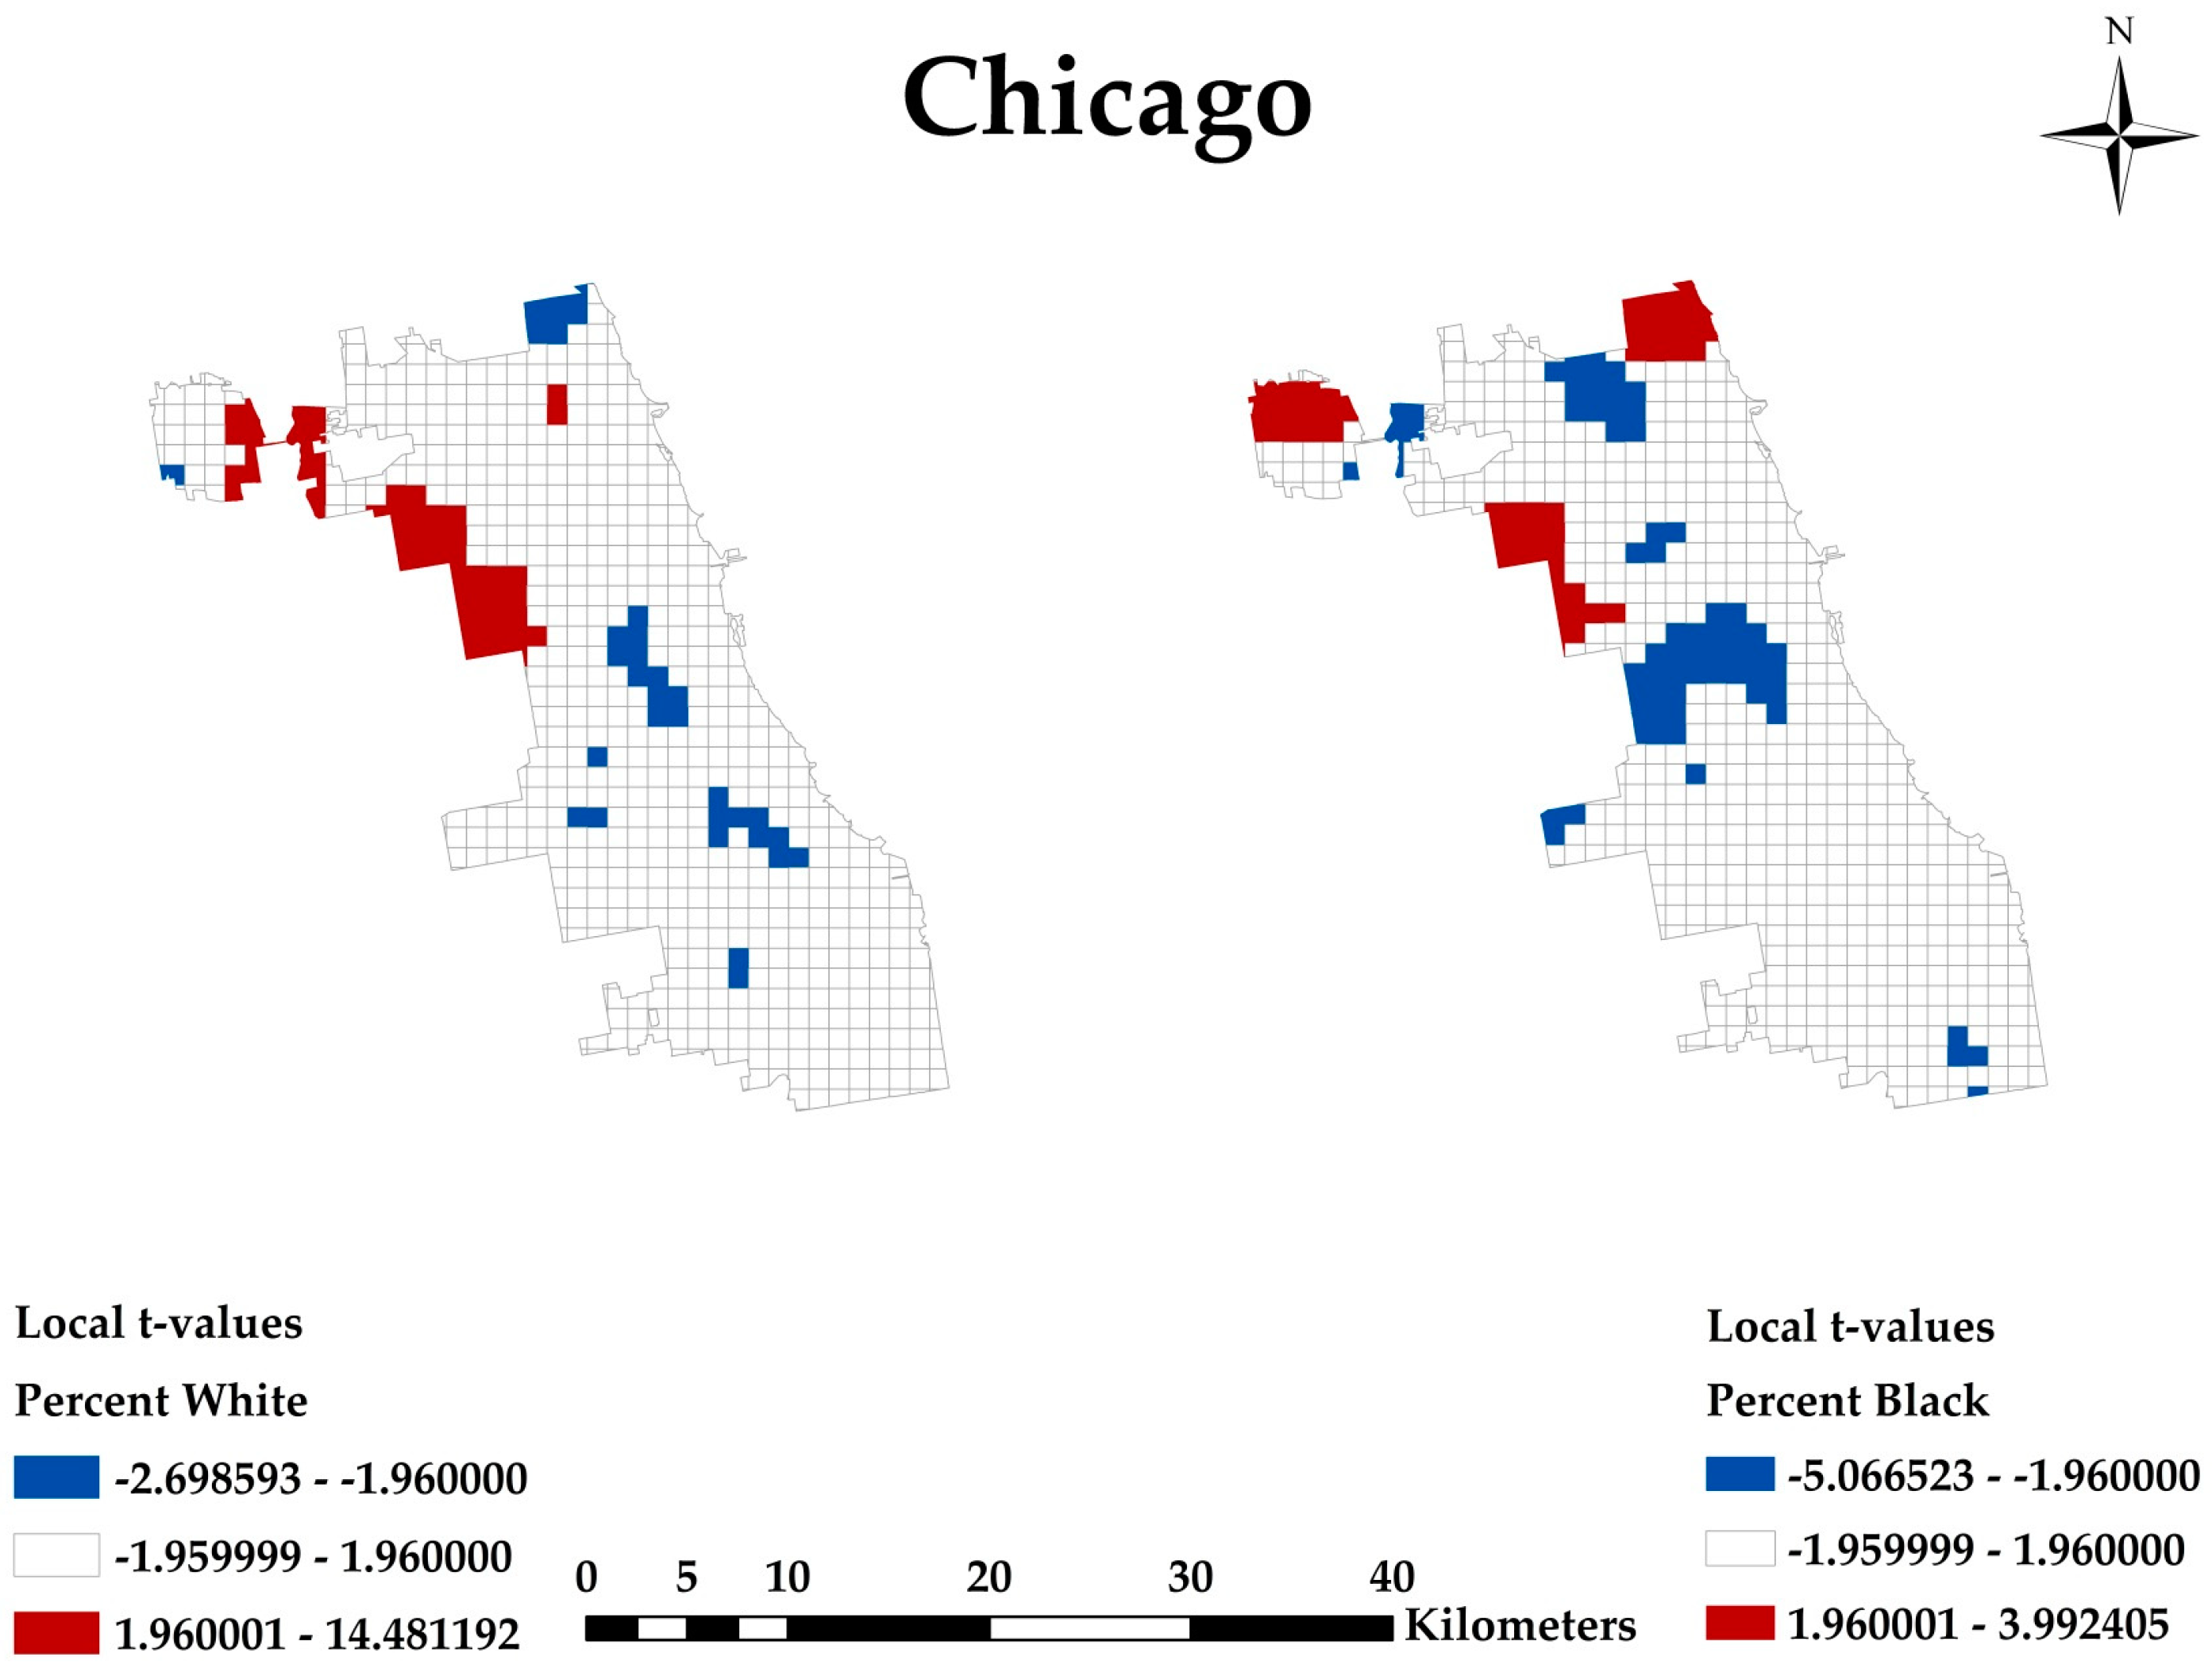
2. Changes in Figure 8

Please note that Figure 8, page 15 of 26, contains a mistake. Figure 8 should state (−1.96:1.96) instead of (−1.64:1.64). Please replace Figure 8:
Figure 8. Chicago shrinking city Percent White and Percent Black: 95% two-tailed test (−1.96:1.96).
Ijgi 07 00329 g001
with the following corrected figure:
Figure 8. Chicago shrinking city Percent White and Percent Black: 95% two-tailed test (−1.96:1.96).
Ijgi 07 00329 g002

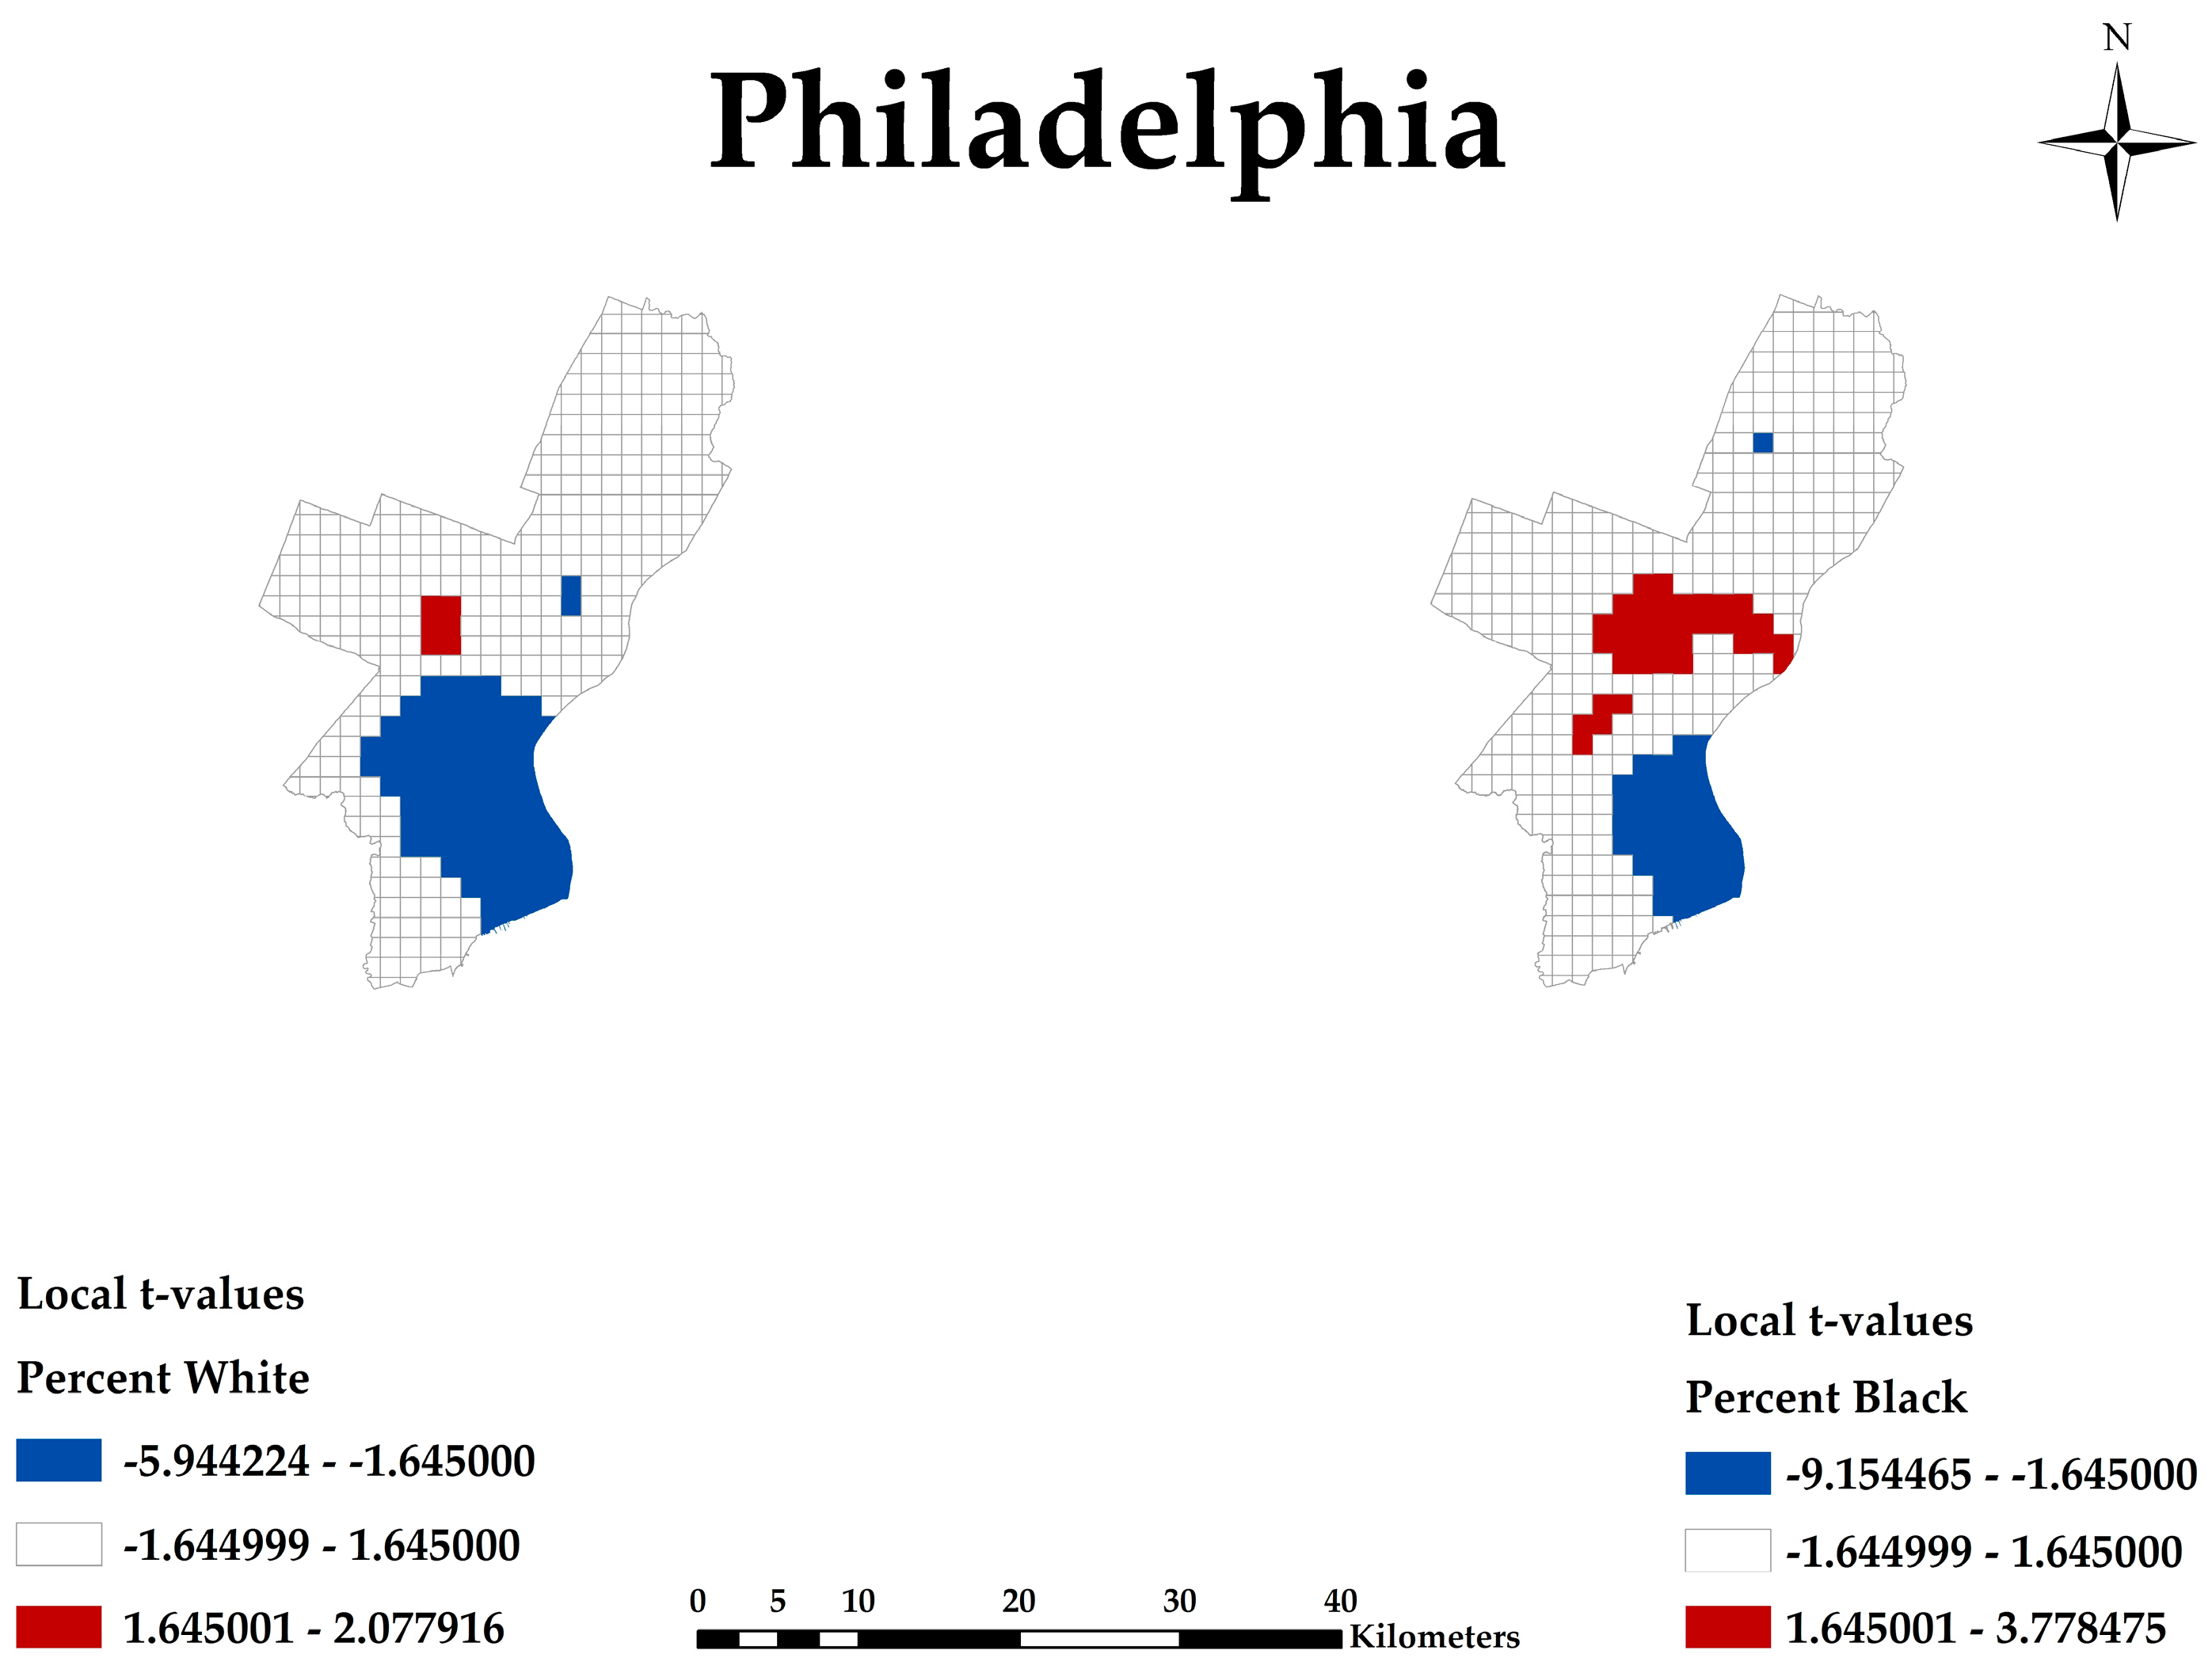
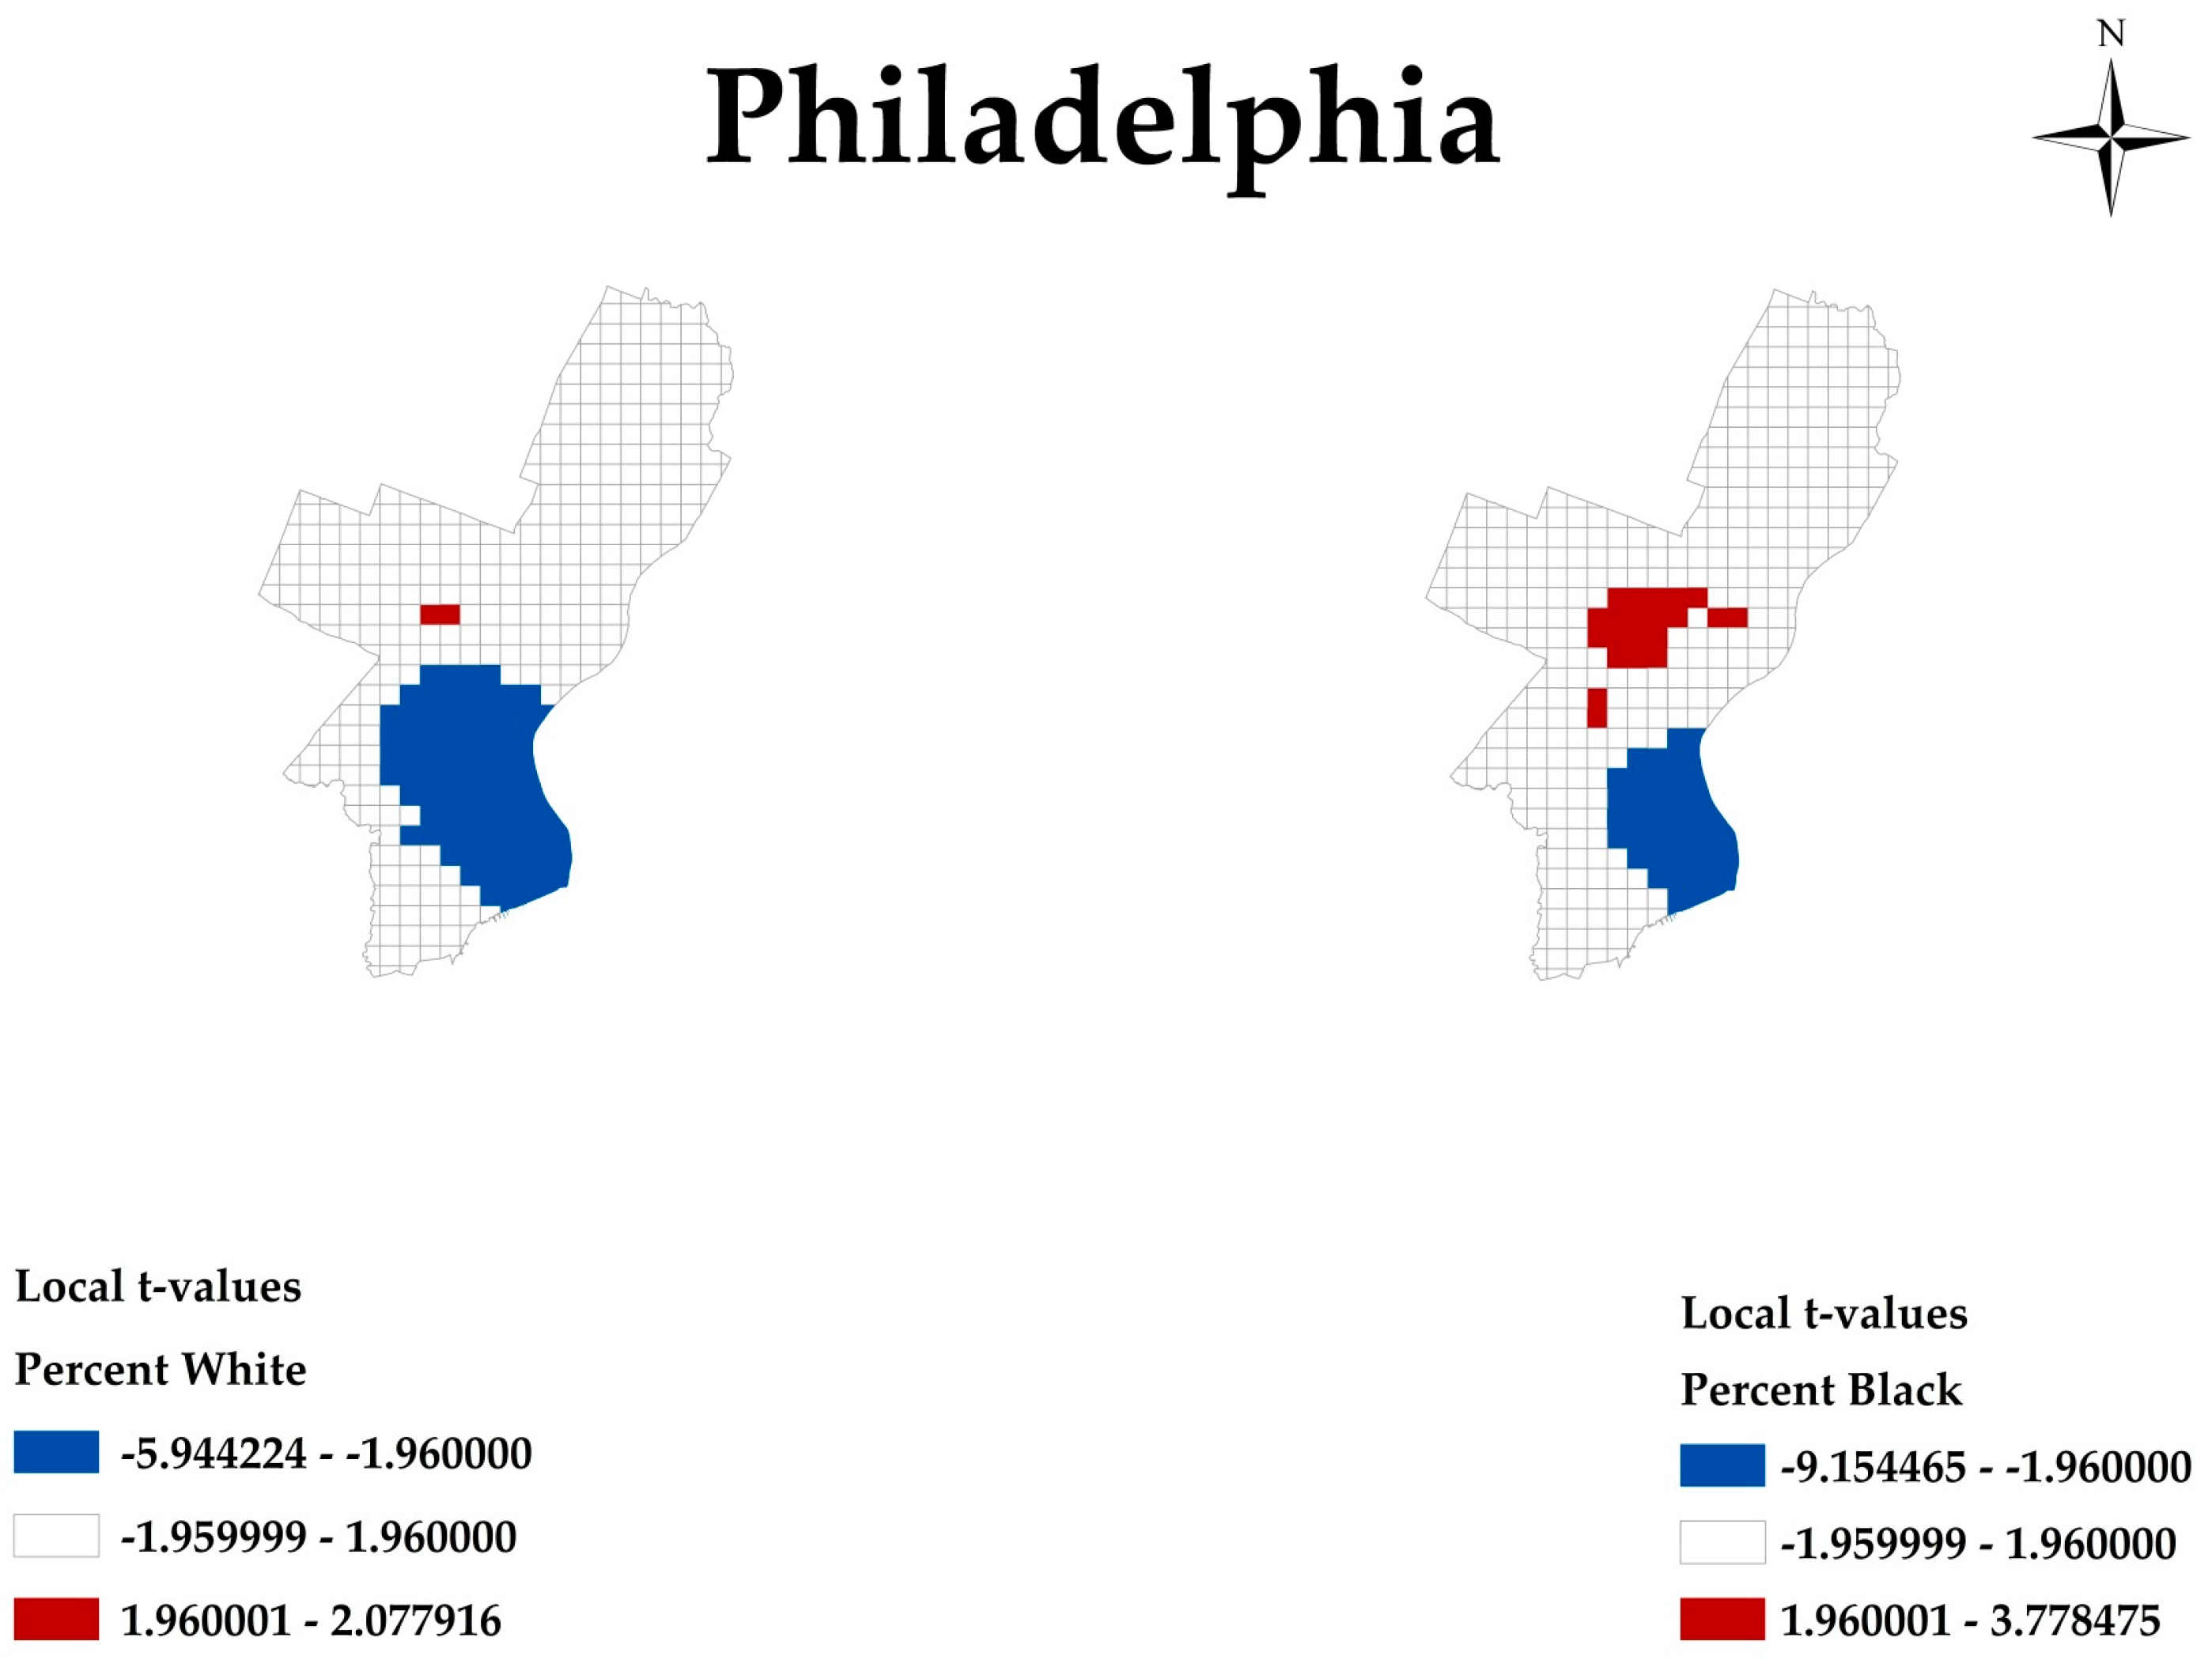
3. Changes in Figure 12

Please note that Figure 12, page 17 of 26 contains a mistake. Figure 12 should state (−1.96:1.96) instead of (−1.64:1.64). Please replace Figure 12:
Figure 12. Philadelphia shrinking city Percent White and Percent Black: 95% two-tailed test (−1.96:1.96) for 2010.
Ijgi 07 00329 g003
with the following corrected figure:
Figure 12. Philadelphia shrinking city Percent White and Percent Black: 95% two-tailed test (−1.96:1.96).
Ijgi 07 00329 g004

4. Changes in References

The citations [44–46] in Section 3, page 5 of 26, were missing. These references are early studies that used the linear curve method and coefficient of variation. We cited representative studies for the method used. Please add the following new references [44–46].
44.
Jordan, Y.C.; Ghulam, A.; Herrmann, R.B. Floodplain ecosystem response to climate variability and Land cover and Land use change in Lower Missouri River basin. Landsc. Ecol. 2012, 27, 843–857.
45.
Ghulam, A. Monitoring Tropical Forest Degradation in Betampona Nature Reserve, Madagascar Using Multisource Remote Sensing Data Fusion. IEEE J. Sel. Topics Appl. Earth Obs. Remote Sens. 2014, 7, 4960–4971, doi:10.1109/JSTARS.2014.2319314.
46.
Shahabfar, A.; Ghulam, A.; Conrad, C. Understanding hydrological repartitioning and shifts in drought regimes in central and south-west Asia using MODIS derived perpendicular drought index and TRMM data. IEEE J. Sel. Topics Appl. Earth Obs. Remote Sens. 2014, 7, 983–993.
Due to this correction, reference numbers were adjusted to follow a numerical order. In [1], the previous References [44–53] are now [47–56].
These changes have no material impact on the conclusions of our paper. The authors would like to apologize for any inconvenience caused to the readers by these changes. The manuscript will be updated and the original will remain online on the article webpage, with a reference to this Correction.

References

  1. Dawson, T.; Sandoval, J.S.O.; Sagan, V.; Crawford, T. A Spatial Analysis of the Relationship between Vegetation and Poverty. ISPRS Int. J. Geo-Inf. 2018, 7, 83. [Google Scholar] [CrossRef]

