On the Risk Assessment of Terrorist Attacks Coupled with Multi-Source Factors
by
 ,
,
Xun Zhang
1,2 ,
,
Min Jin
1,
Jingying Fu
2,3,*,
Mengmeng Hao
2,3,*,
Chongchong Yu
1 and
Xiaolan Xie
1 1
Beijing Key Laboratory of Food Safety Big Data Technology, School of Computer and Information Engineering, Beijing Technology and Business University, No. 11, Fucheng Road, Haidian District, Beijing 100048, China
2
Key Laboratory of Resources utilization and Environmental Remediation, Institute of Geographical Sciences and Natural Resources Research, Chinese Academy of Sciences, 11A Datun Road, Chaoyang District, Beijing 100101, China
3
University of Chinese Academy of Sciences, Beijing 100049, China
*
Authors to whom correspondence should be addressed.
ISPRS Int. J. Geo-Inf. 2018, 7(9), 354; https://0-doi-org.brum.beds.ac.uk/10.3390/ijgi7090354
Submission received: 31 July 2018
/
Revised: 20 August 2018
/
Accepted: 23 August 2018
/
Published: 27 August 2018
(This article belongs to the Special Issue GIS for Safety & Security Management)
Abstract
:Terrorism has wreaked havoc on today’s society and people. The discovery of the regularity of terrorist attacks is of great significance to the global counterterrorism strategy. In this study, we improve the traditional location recommendation algorithm coupled with multi-source factors and spatial characteristics. We used the data of terrorist attacks in Southeast Asia from 1970 to 2016, and comprehensively considered 17 influencing factors, including socioeconomic and natural resource factors. The improved recommendation algorithm is used to build a spatial risk assessment model of terrorist attacks, and the effectiveness is tested. The model trained in this study is tested with precision, recall, and F-Measure. The results show that, when the threshold is 0.4, the precision is as high as 88%, and the F-Measure is the highest. We assess the spatial risk of the terrorist attacks in Southeast Asia through experiments. It can be seen that the southernmost part of the Indochina peninsula and the Philippines are high-risk areas and that the medium-risk and high-risk areas are mainly distributed in the coastal areas. Therefore, future anti-terrorism measures should pay more attention to these areas.
1. Introduction and Related Works
1.1. Introduction
Terrorism is one of the most important threats in today’s society and has caused great harm to people from all over the world [1]. Southeast Asia is not only a key node in the “One Belt and One Road” development initiative, but also an area of frequent terrorist attacks. The spatial risk assessment of the terrorist attacks in Southeast Asia is of great significance to the implementation of both the One Belt One Road Initiative and the counterterrorism strategy. According to the statistics of the Global Terrorism Database (GTD), 1078 terrorist attacks occurred in Southeast Asia in 2016 alone, resulting in 533 deaths and causing great panic within the society. A large number of scholars at home and abroad have made great efforts to solve various problems related to the threat of terrorism [2,3,4,5,6,7,8,9,10,11,12,13,14]. However, the risk assessment of terrorist attacks remains a complex and uncertain problem. On the one hand, the existence of the Internet has brought the global community closer together in all corners, in all sectors, and in all fields; as a result, the number of sensitive variables and disturbance variables related to terrorist attacks has increased unprecedentedly. On the other hand, because of the unprecedented advancement of the global digitization and the application of various advanced material collection methods, the terrorist attack assessment can obtain more types and larger volumes of related data from various angles than ever before, requiring researchers to have smarter, more efficient complex data processing capabilities. With the achievements of artificial intelligence in many fields, Sivasamy et al., Minu et al., and Gohar et al. have introduced machine learning methods into the evaluation of terrorist attacks and have conducted a series of fruitful works [15,16,17]. Dong believes that the machine learning method can focus on extracting factor vectors from known information, forming pattern recognition and classification, and then use the data outside the sample to perform pattern verification and prediction [18]. Moreover, machine learning can be used to automatically re-identify factor vectors, reconstruct conflict modes, and adjust predictive output results based on different data inputs. In addition, the machine learning-based terrorist attack assessment model can also be widely accommodated and integrated with unstructured data, and we have the ability to find discernable patterns from clutter and mixed data [18].
1.2. Related Works
The previous related studies primarily involved research from three aspects, as shown in Table 1. A terrorist attack prediction project led by Blair et al. used a neural network to successfully predict the conflict in Liberia in 2010 with the data in 2008; the accuracy was between 0.65 and 0.74 [19]. Dong used the 2010–2016 forecast of terrorist attacks in India as an example to empirically examine the effectiveness of machine learning based on back propagation (BP) neural networks in real-life terrorist attacks. It was found that machine learning-based terrorist attack prediction paradigms, even without the support of specific social theories, have a certain ability to anticipate terrorist attacks and can discover new knowledge regarding conflicts [18]. However, these studies are only aimed at individual countries and predictions on a national scale. Sheehan used time-series methods to investigate the relationship between the number of global strategic armed forces-related incidents and the frequency of transnational terrorist attacks, the type of attacks, and the type of victims of terrorist attacks with data from transnational terrorism incidents from 1993 to 2004 [20]. Sivasamy et al. proposed a new prediction method that uses the mixed average model (MABM) to fit the civilian casualty data resulting from terrorist attacks in South Asia and predicted civilian casualties in 2014 [15]. Minu et al. used the wavelet neural network (WNN) for prediction and applied it to the nonstationary nonlinear time-series of the terrorist attack time-series (time-series of the monthly number of world terrorist attacks from February 1968 to January 2007); the results revealed that the WNN is the best model for analyzing the time-series of terrorist attacks [16]. These studies were based on the time-series of terrorist attacks. Faryal et al. proposed a new classification and prediction framework to predict terrorist organizations. This framework consisted of four basic classifiers: naive Bayes (NB), K nearest neighbour (KNN), Iterative Dichotomiser 3 (ID3), and decision stump (DS); Compared with a separate classifier, this method was found to achieve a fairly good accuracy and a lower classification error rate [17]. Raghavan et al. used the hidden Markov model to establish a model for a terrorist organization’s activity and detect the sudden situation of the organization [21]. Adam et al. used a power-law distribution based on observations to calculate the likelihood of a single event [22]. These studies focused on the terrorist attack itself. Scheffran’s study showed that many connections and feedbacks exist among the climate system, natural resources, human security, and social stability [6]. Nevertheless, previous studies on terrorist attacks have seldom considered the multi-source factors that affect terrorist attacks; most studies have been conducted at national or regional scales, and the research has been generally conducted from the time-series of the occurrence of an attack or the incident itself and has ignored the spatial distribution of the occurrence of terrorist attacks. To assess the risk of terrorist attacks in the places where terrorist attacks have not occurred, we combine the clustering algorithm and the location recommendation algorithm from the grid scale and conduct research using terrorist data from 1970 to 2016 in Southeast Asia. Based on a comprehensive analysis of the factors of the terrorist attack, we conduct a spatial risk assessment of terrorist attacks.
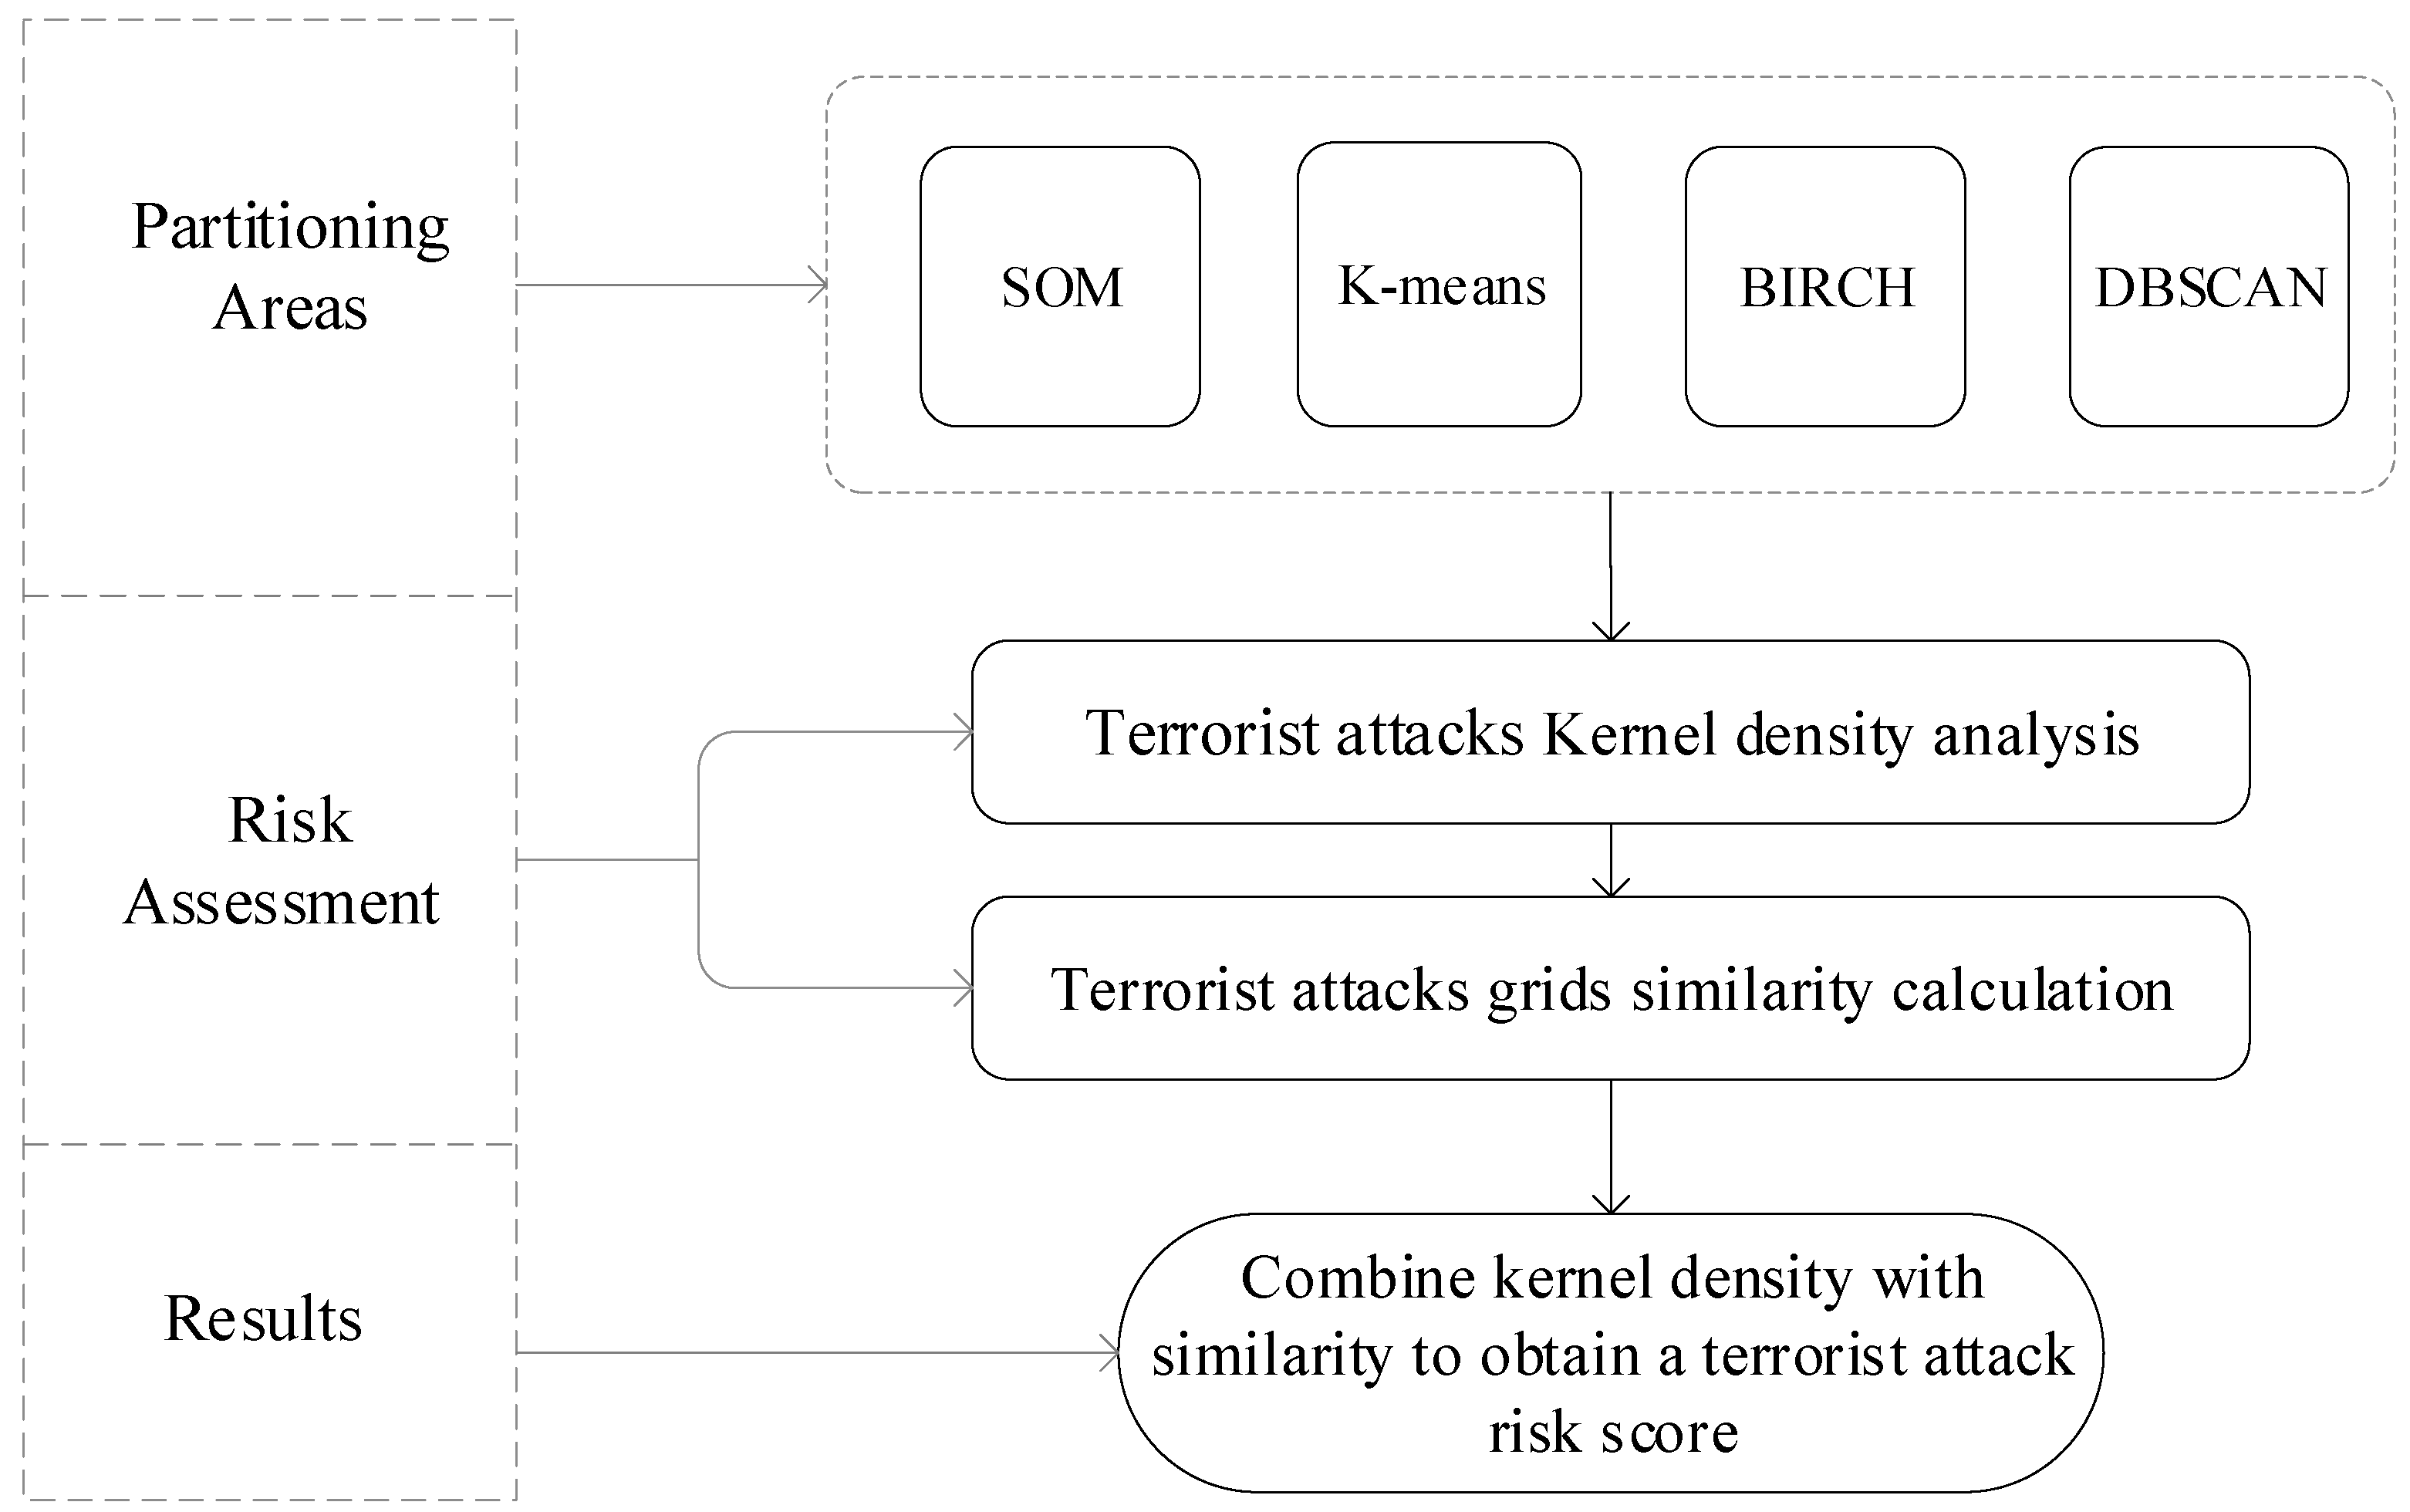
In our study, the assessment process mainly includes two parts: partitioning areas and risk assessment. Partitioning areas refers to the regional division of the study area in space according to the influencing factors. In the machine learning algorithm, this method belongs to unsupervised learning, and the clustering algorithm is a typical unsupervised machine learning algorithm. We have selected four classical clustering algorithms, including K-means, Balanced Iterative Reducing and Clustering using Hierarchies (BIRCH), Density-Based Spatial Clustering of Applications with Noise (DBSCAN), and Self-Organizing Maps (SOM). Through experimental comparison, we obtained the most suitable method for partitioning areas and obtained the weighted grid. The risk assessment part is mainly divided into three steps. First of all, the data of the weighted factor are used for the location recommendation algorithm to calculate the similarity between each grid and then build a kernel density function based on the severity of terrorist attacks. Then, combining the similarity with the kernel density, a score between 0–1 is calculated for each grid where no terrorist attack occurred. Finally, we conducted a validity test of the risk assessment model of terrorist attacks established by the research.
2. Method
2.1. Data Processing
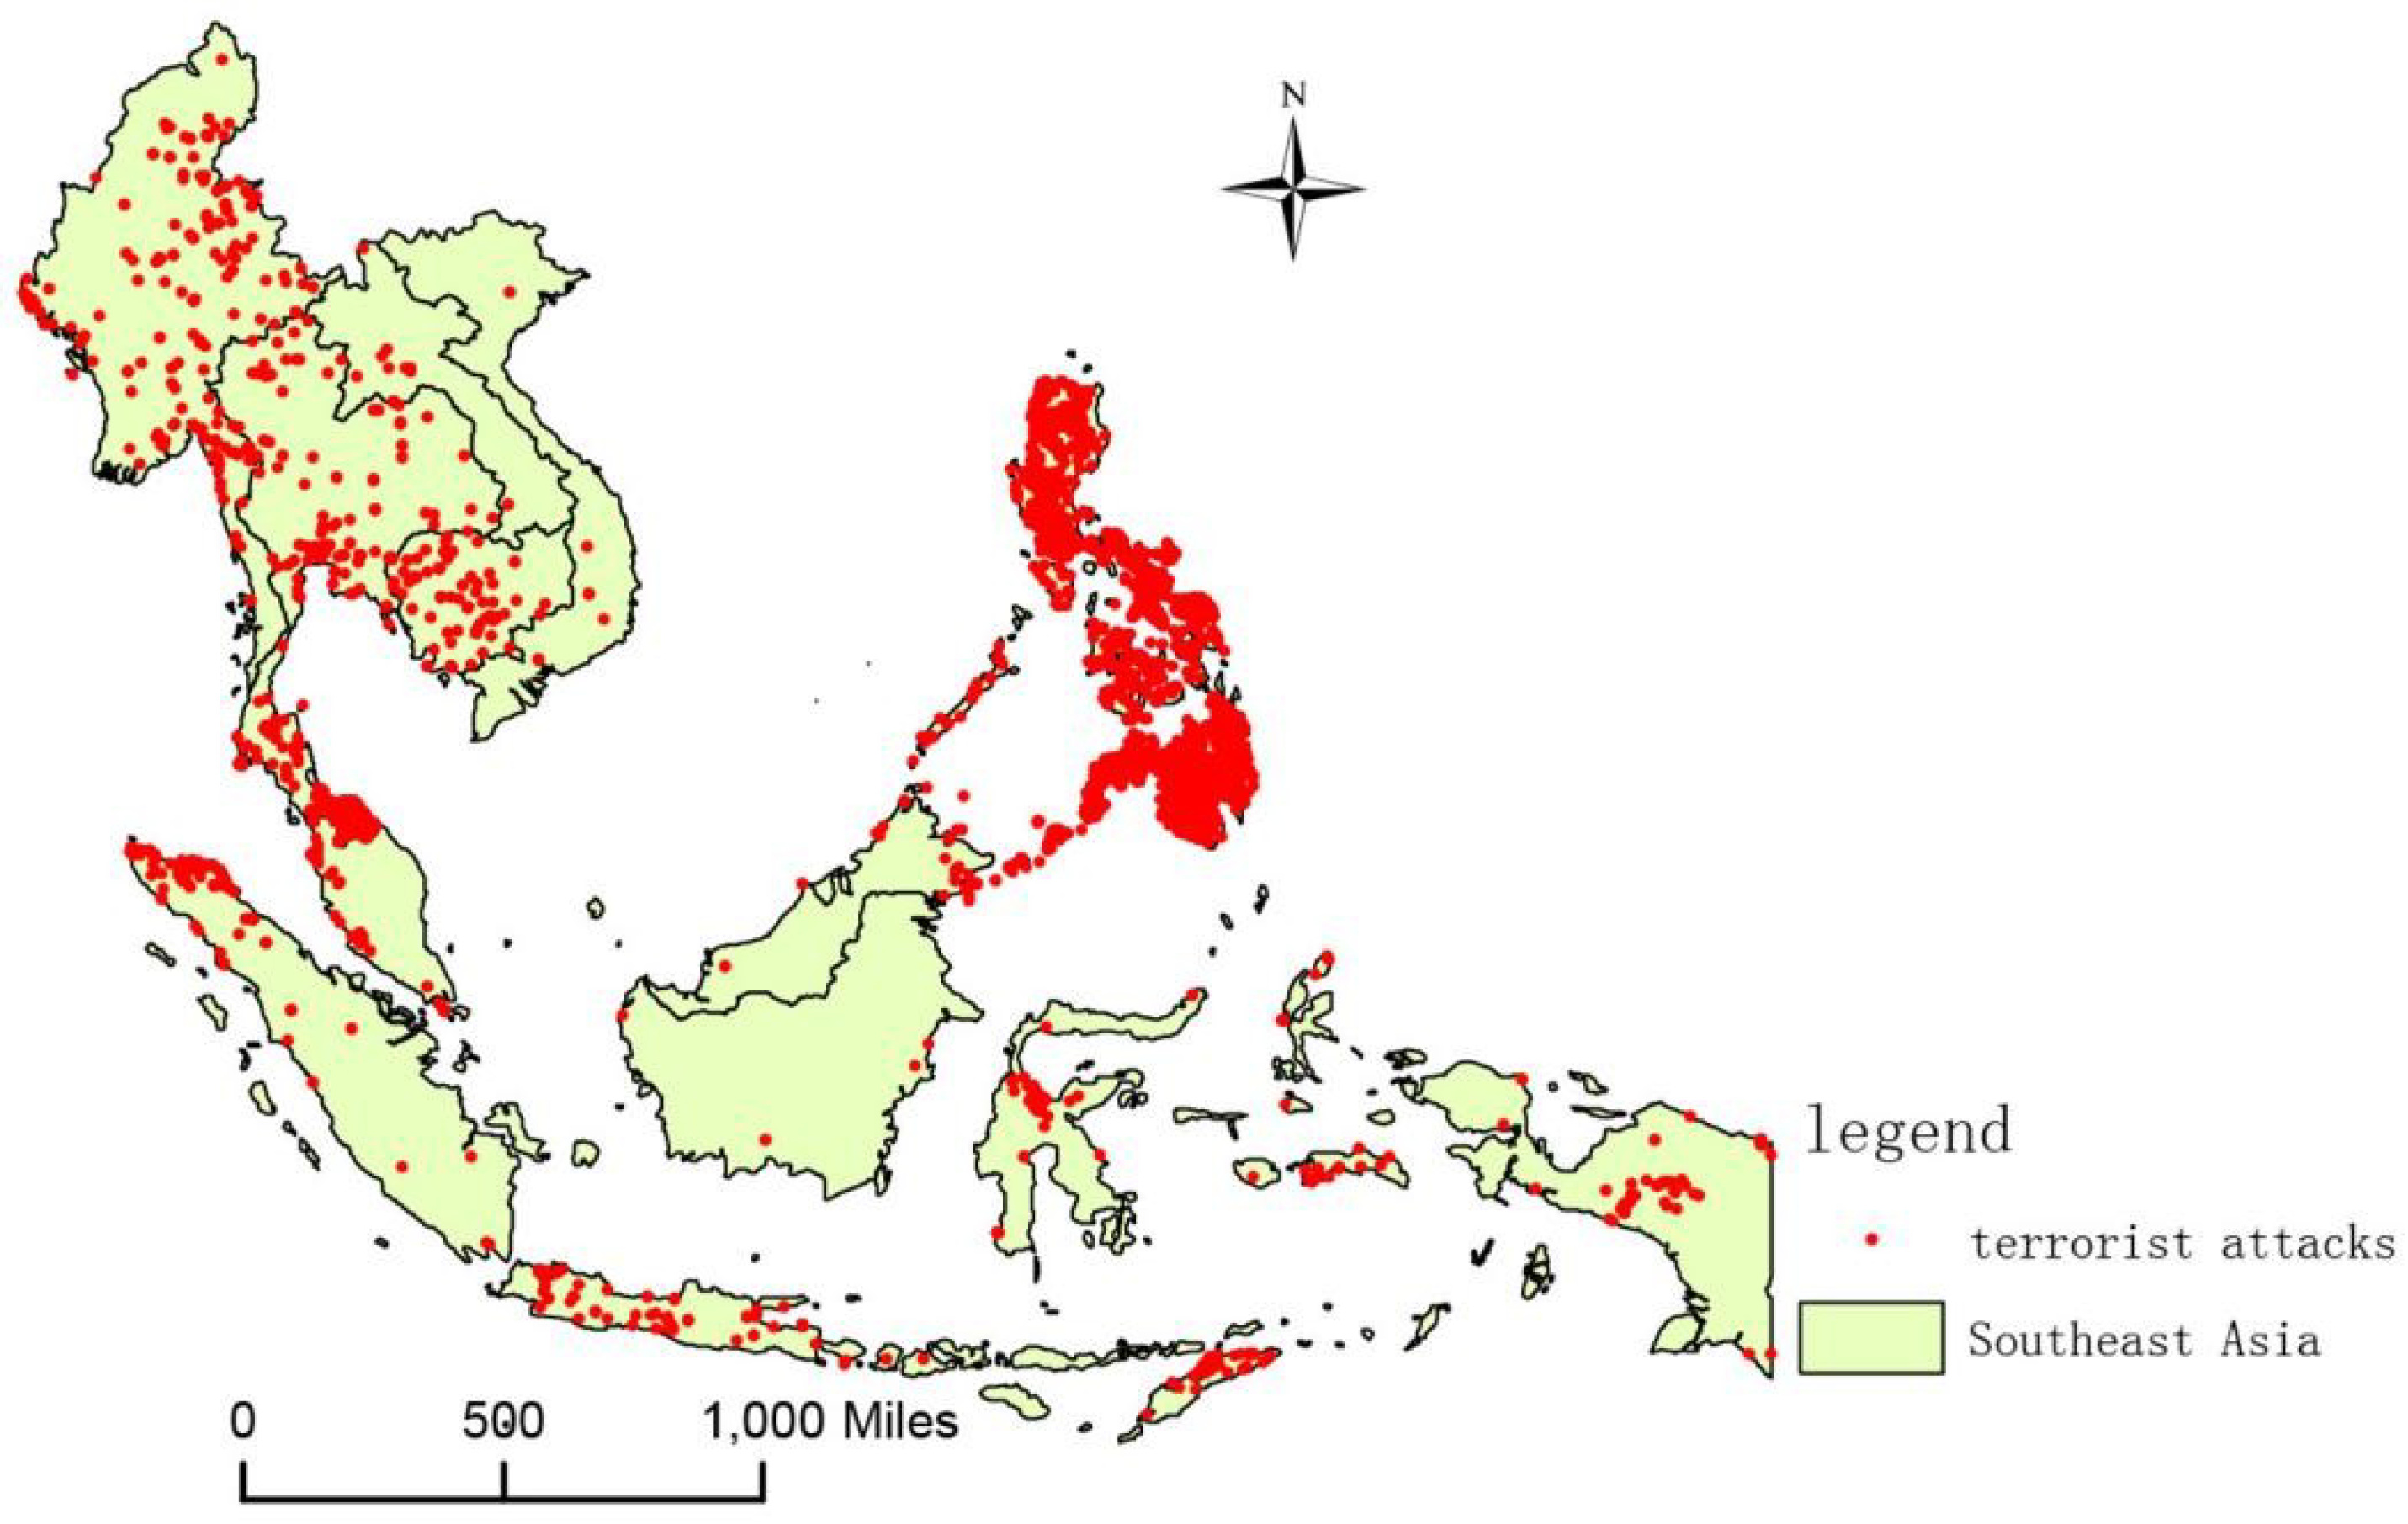
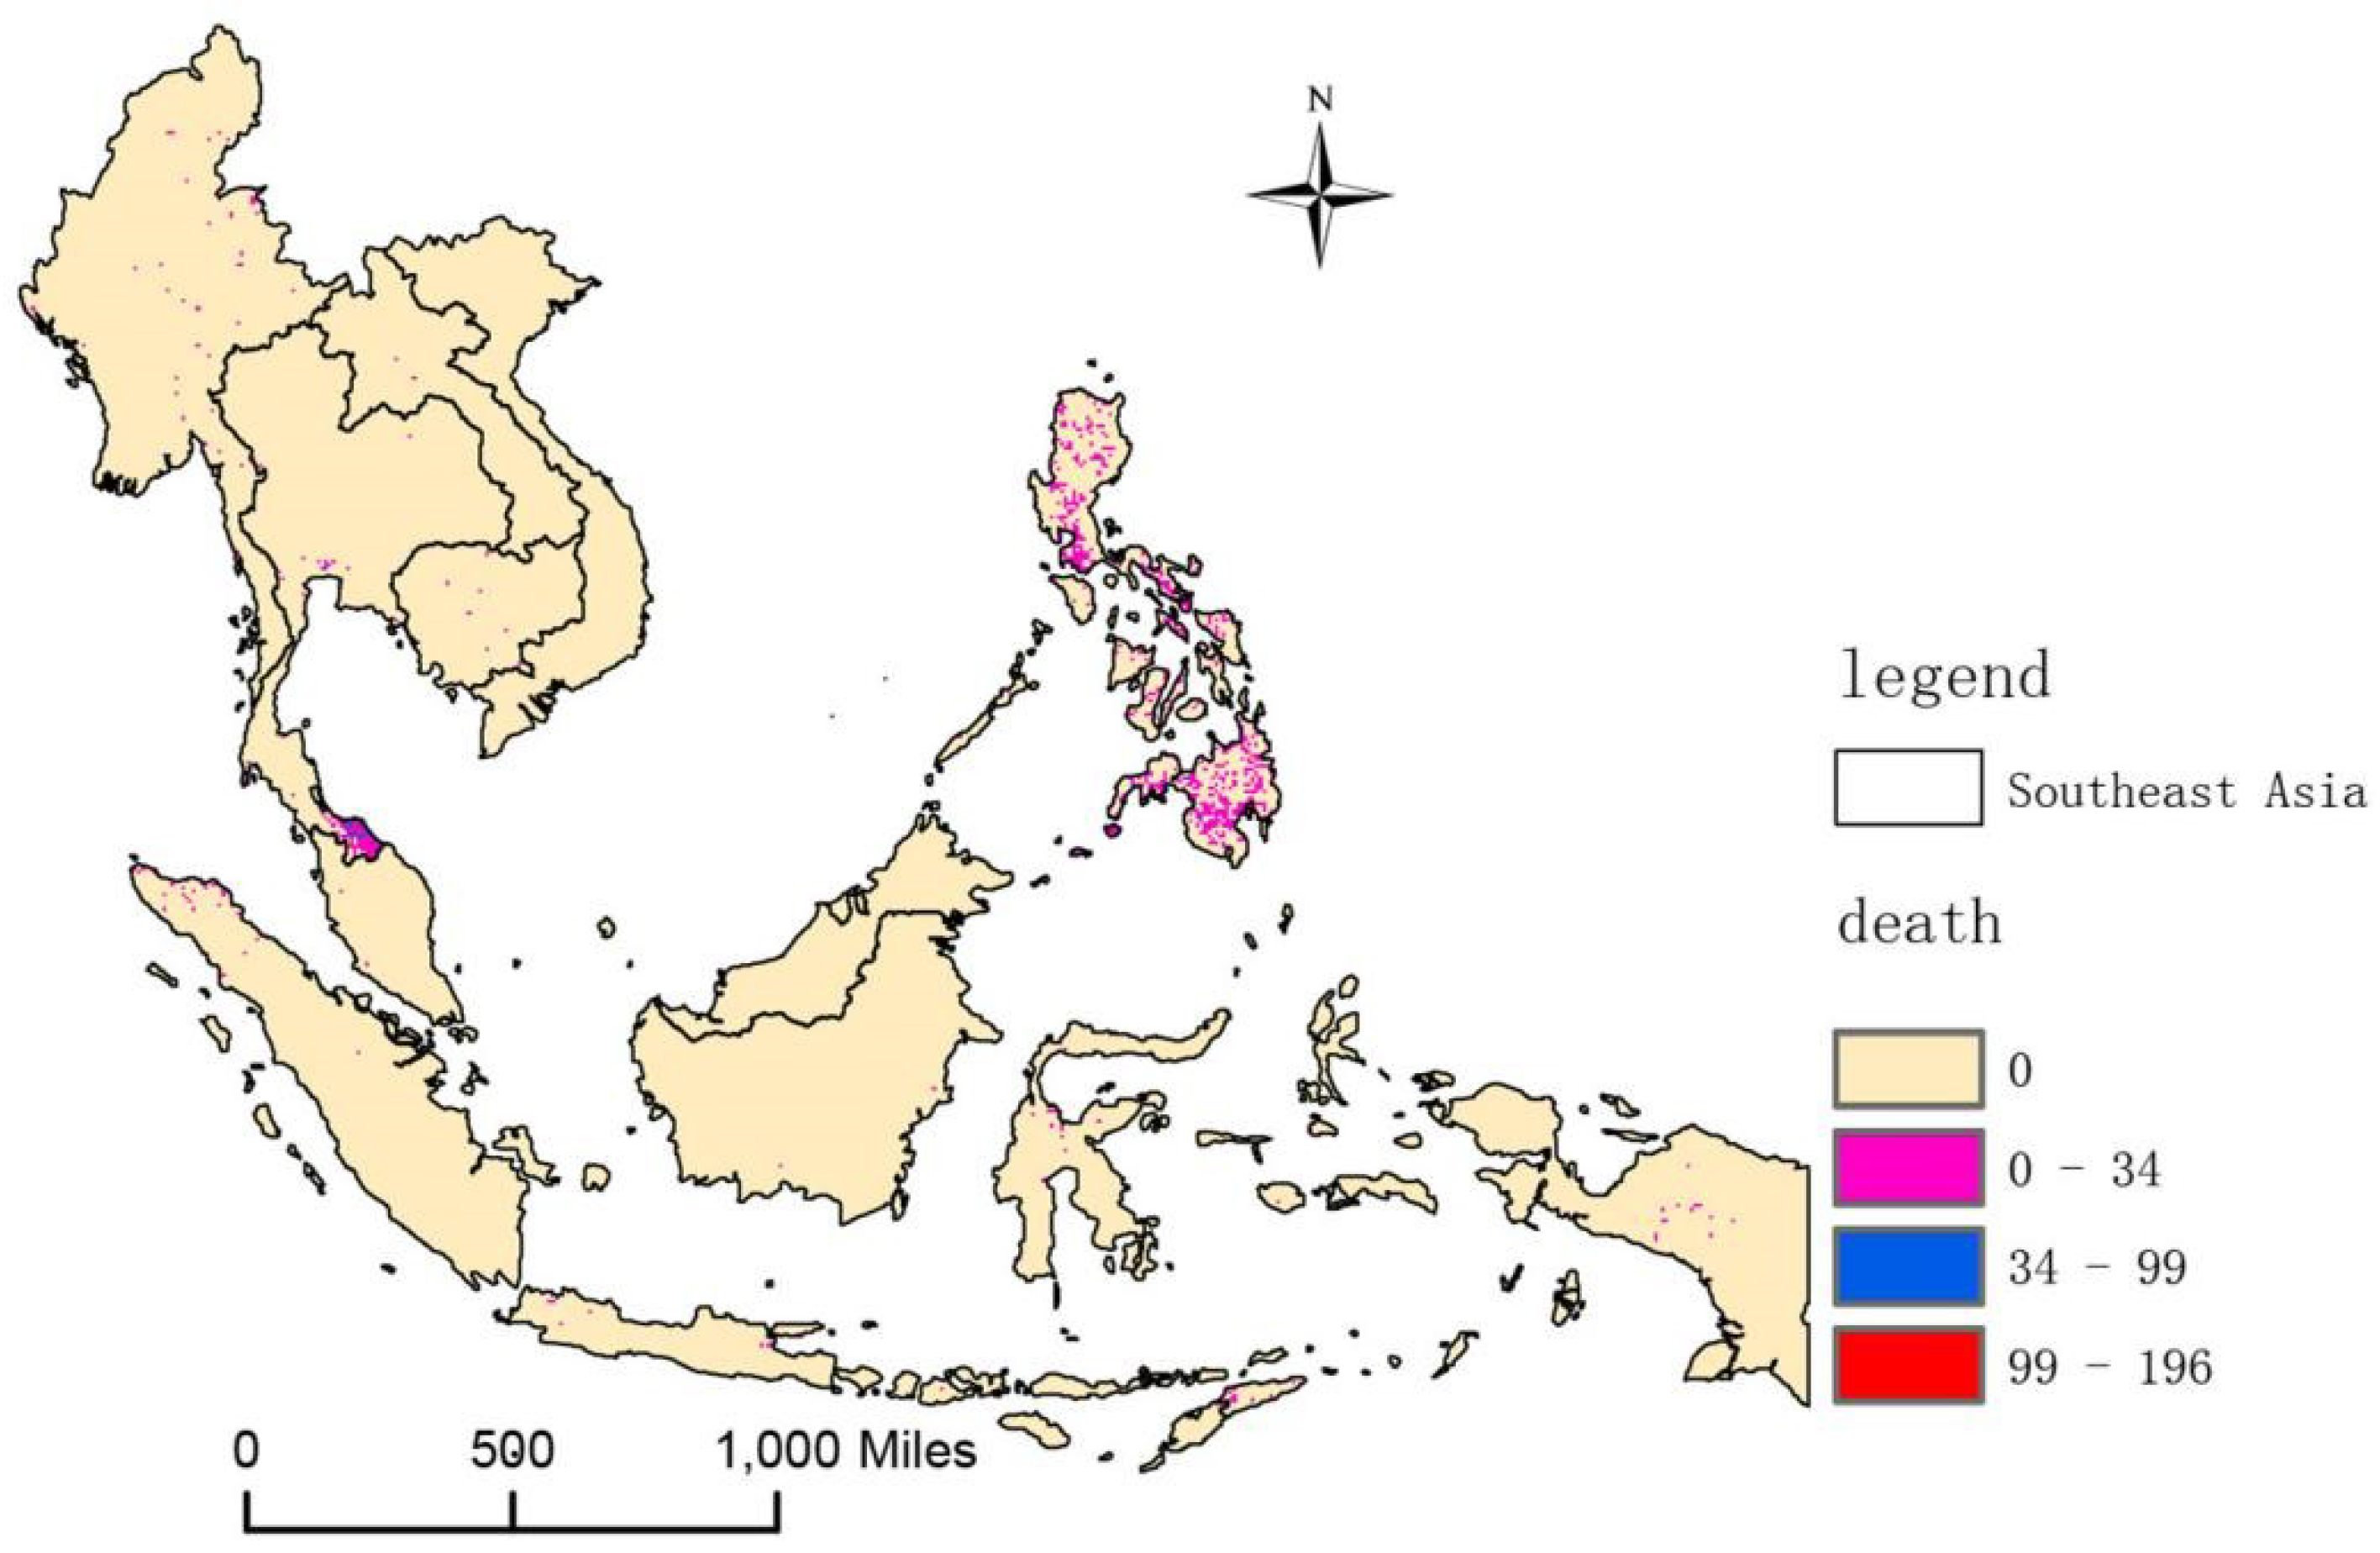
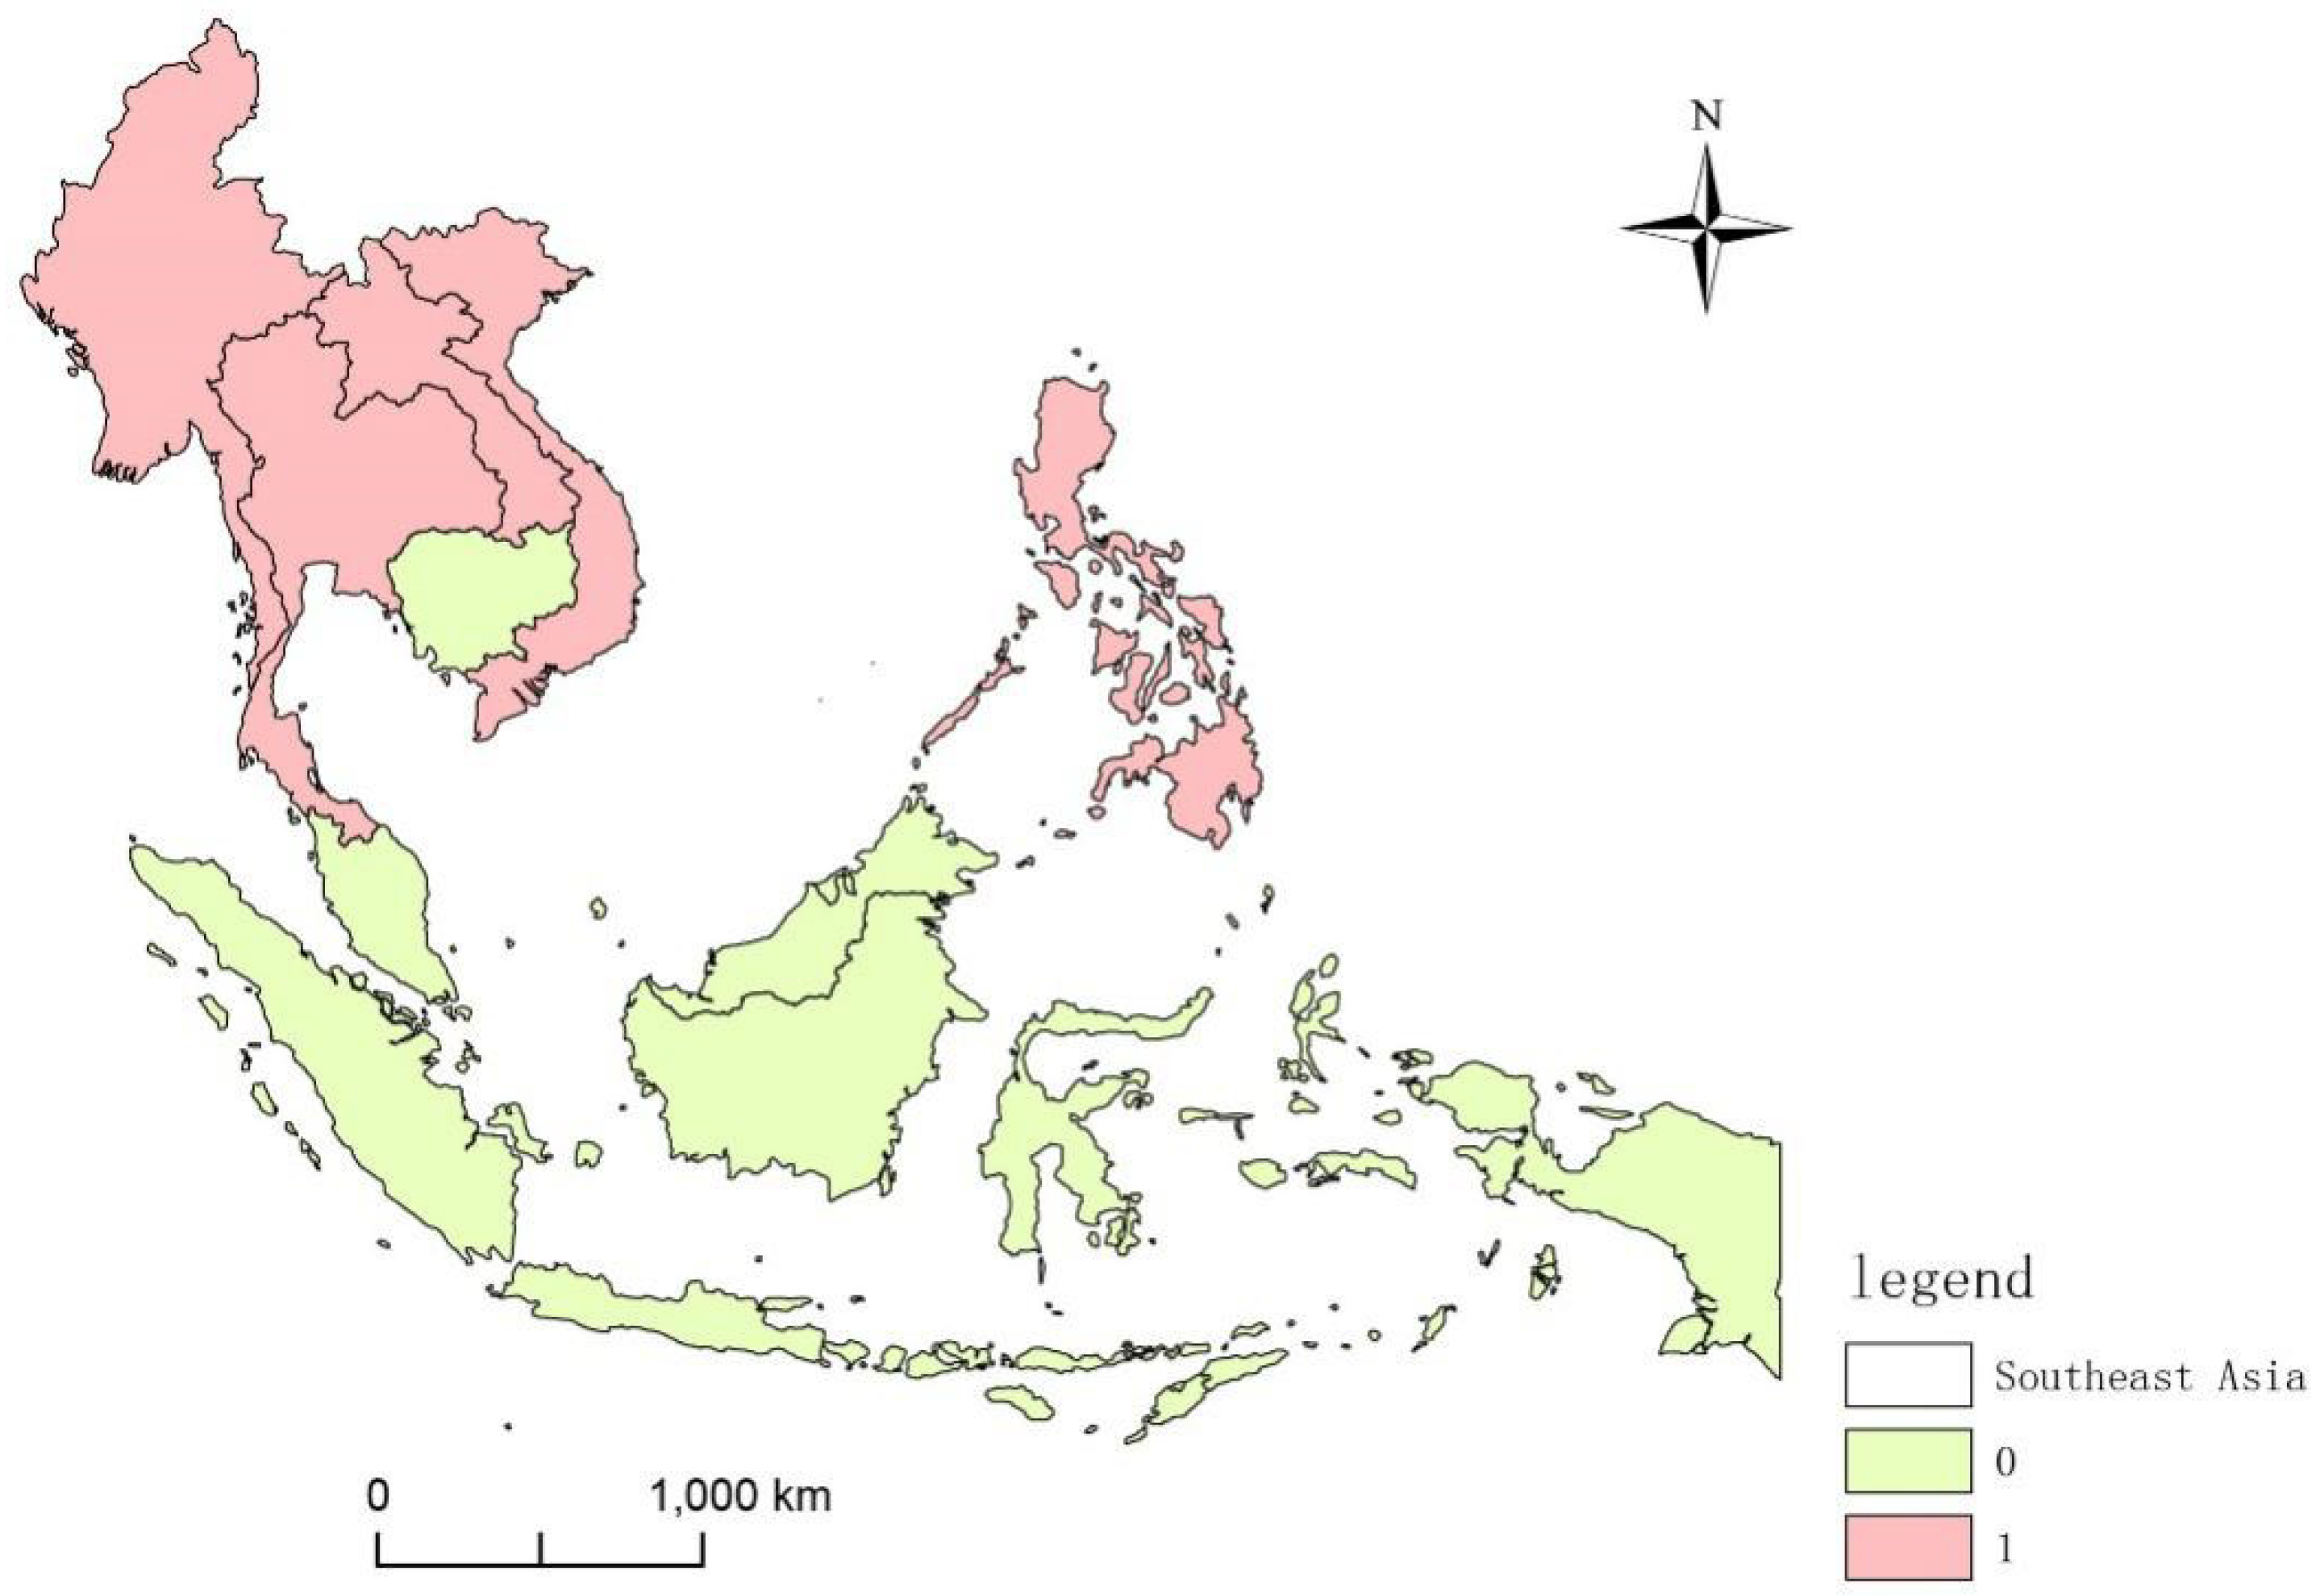
Southeast Asia was chosen as the research area to conduct a spatial risk assessment of terrorist attacks. There are 11 countries in the study area, covering an area of 4.57 × 10⁶ km2: Vietnam, Laos, Cambodia, Thailand, Myanmar, Malaysia, Singapore, Indonesia, Brunei, the Philippines, and Timor-Leste. Among these countries, Laos is the only landlocked country in Southeast Asia, and Vietnam, Laos, and Myanmar border the People’s Republic of China by land. Southeast Asia is a frequent area of terrorist attacks, as shown in Figure 1 and Figure 2. From the figures, we can see that the southernmost part of Thailand and Philippine are high-risk density areas for terrorist attacks. These regions have long displayed an imbalance of political and economic development, and ethnic and religious conflicts are more serious, which is likely to lead to the breeding of terrorism. Therefore, the spatial risk assessment of terrorist attacks in Southeast Asia is of great significance. A risk assessment is a quantitative evaluation of the impact or loss potential of an event or thing [23]. The spatial risk assessment of terrorist attacks assesses the location and occurrence of a terrorist attack from a spatial perspective, including, but not limited to, the use of locations where terrorist attacks have occurred, to assess the risk of not having a terrorist attack. We conducted our research from the perspective of location recommendation methods.
For data, we collected 17 types of influencing factor data from two aspects of socioeconomic factors and natural resource factors, which are shown in Table 2. Among these factors, socioeconomic factors include ethnic diversity, major drug areas, population density and nighttime lighting, accommodation outlets, catering outlets, transportation sites, religious sites, and political sites; natural resource factors include average precipitation, average temperature, terrain, the distance to the main navigable lake, the distance to the ice-free ocean, and the distance to the main navigable river. Then, standard grid spatial processing (0.1° × 0.1°) of the 17 factors and the terrorist attack data was performed, by which we can get 36,978 standard grids to allow them to be analyzed at the same scale. To unify the measurement scale, this study normalizes the influencing factor.
We mainly use GIS software and Python programming language for data processing, including ArcMap10.3 (http://pro.arcgis.com/) and Python 3.6 (https://www.python.org/).
- (1)
- Based on GTD, the location of terrorist attacks in Southeast Asia, as well as the numbers of casualties, can be obtained, and the information on the terrorist attacks is converted into raster data, selecting a grid with a 0.1° × 0.1° resolution. The grid serves as a spatial unit to facilitate the statistical determination of the number of terrorist incidents and the total number of casualties.
- (2)
- The raster data of five factors can be obtained by G-Econ 4.0 (a dataset of world economic activity): the distance from the main sailing lake (km), the distance from the main sailing river (km), the distance from the ice-free sea, the average precipitation (mm/a), and the average temperature (°C); subsequently, ArcMap 10.3 is used to sample the above raster data in a 0.1° × 0.1° grid.
- (3)
- Ethnic diversity is based on the GeoEPR (National Relations Dataset); the main drug area is based on the World Drug Report and the national administrative border; nighttime lighting is based on the Earth Observation Organization; population density; and topography is based on NASA’s Earth Observatory. We use ArcMap 10.3 to sample the above data in a 0.1° × 0.1° grid.
- (4)
- With respect to points of interest (POIs), we use the Google Places API to get POI data of Southeast Asia, and then use ArcMap 10.3 to sample it in a 0.1° × 0.1° grid.
In addition, because the 17 factors have different units, to unify the measurement scale and avoid the differences between different units, we normalize the 17 influencing factors, and the normalized formula is given below:
where is the normalized value, is the minimum value of the factor, is the maximum value of the factor, and n is the number of factors.
2.2. Algorithm
The spatial risk assessment of terrorist attacks is used to assess the location and the occurrence risk of terrorist attacks from the perspective of spatial analysis, including, but not limited to, the use of locations where terrorist attacks have occurred, to assess the risk of locations where no terrorist attacks have occurred. The location recommendation algorithm can spatially extract the relationship between the terrorist attack and the location of the attack, thereby scientifically conducting a risk assessment. The traditional location recommendation algorithm mainly focuses on single-source factors, such as sign-in; in contrast, the algorithm has rarely been used for multi-source factors. In research, multiple regions are usually considered as a whole. However, factors such as economy and population often have different influences in different regions. The study found some factors of spatial factors but did not integrate them into the position recommendation process for in-depth research. Based on this research, the multi-source factors, spatial factors, and regional divisions are integrated into the location recommendation algorithm.
First, the Southeast Asian region is divided into regions by a clustering method, and the weights of each factor are obtained by correlation analysis. Next, the location recommendation algorithm is improved by using the factor that the activities in the geographical location are clustered, and the spatial risk assessment of the terrorist attack is completed through the partitioned terrorist attack location factors and the terrorist attack attribute data. The evaluation process of this paper mainly includes two parts: partitioning areas and risk assessment. The flow chart is shown in Figure 3.
2.2.1. Partitioning Areas
Because the influence of various factors on the terrorist attacks in different regions is not the same, we first consider the spatial division of the study area according to the factor data and then use the correlation analysis method to determine the degree of impact of each influencing factor on the terrorist attacks in each sub-area. The extent of the impact of a terrorist attack is weighted. The spatial division involves dividing the study area spatially according to the factors. According to the machine learning algorithm, this method belongs to unsupervised learning, and the clustering algorithm is a typical unsupervised machine learning algorithm. Clustering refers to a large number of unknown datasets. According to the inherent similarity of data, the dataset is divided into multiple clusters. The entities in clusters are similar, and the entities of different clusters are not similar. A cluster is the convergence of points in the test space. The distance between any two points of the same cluster is less than the distance between any two points of different clusters [24]. We will select four classical clustering algorithms. Through the experimental comparison, the method that is most suitable for the spatial division of this study is obtained.
a. K-means algorithm
K-means is a partition-based clustering method. The K-means algorithm calculates the similarity based on the average value of the data objects in the cluster and takes the average (or the centroid) of the objects in the cluster as the center of the cluster. The algorithm first randomly selects k objects among n data objects. Each object represents the average of a cluster. For each remaining object, according to its distance from the center of each cluster and the principle of minimum distance, it is assigned to the nearest cluster. On this basis, the average of each cluster is recalculated. This process is repeated until the sum of squared errors is minimized. The formula is as follows (at this point, the members in the cluster no longer change):
where is the given data object and is the average value of cluster [25].
b. BIRCH algorithm
BIRCH is a comprehensive hierarchical clustering method that is commonly used for large-scale data sets. This algorithm introduces two concepts: the clustering factor (CF) and clustering factor tree (CF-tree). These two concepts are used to summarize the clusters, and the distances between clusters are used. The equilibrium iteration of the hierarchical method is used to reduce the size and cluster of data sets. The BIRCH method saves memory and calculates quickly, with only a simple scan of the data set required to build a tree and identify noise points. However, BIRCH does not cluster well for non-spherical clustering and high-dimensional data clustering. In addition, the order of data input affects the results of the algorithm [26].
c. DBSCAN algorithm
DBSCAN is a more representative density-based clustering algorithm. DBSCAN defines a cluster as the largest set of points connected by density and can divide a region having a sufficiently high density into clusters. The algorithm requires the user to input two parameters: one parameter is the radius (Eps), which represents the extent of a circular neighborhood centered at a given point P; the other parameter is the number of minimum points within the neighborhood centered on the point P (MinPts). These two parameters are difficult to set because they require the user to have a general understanding of the cluster dataset and to set it empirically [27].
d. SOM algorithm
The SOM algorithm is an unsupervised learning algorithm for clustering and high-dimensional visualization, which is an artificial neural network developed by simulating the characteristics of the human brain for signal processing. After the model was proposed by Professor Kohonen of the University of Helsinki in Finland in 1981, it became the most widely used self-organizing neural network method. The SOM network structure consists of an input layer and a competition layer (output layer). The number of input layer neurons is n, and the competition layer is a one-dimensional or two-dimensional planar array composed of m neurons. The network is fully connected, and each input node is connected with all output nodes. The SOM network can map arbitrary dimensional input patterns in the output layer into one-dimensional or two-dimensional graphics and keep its topology unchanged. The “competitive learning” approach is used in training. Each input sample finds a node in the hidden layer that best matches it, called its activation node of the “winning neuron”, followed by a random gradient descent method to update the parameters of the activation node. At the same time, the points adjacent to the active node are also updated appropriately according to their distance from the active node. Excitatory feedback is sent to neighboring neurons, and inhibitory feedback is sent to distant neurons. In other words, neighbors encourage each other, and distant neighbors suppress each other [28].
We use the clustering quality indicator called the Calinski-Harabaz (CH) index to evaluate the clustering effect. The CH indicator is the ratio of the degree of separation and compactness of the data set. Tightness is measured by the sum of the squares of the distances between the data points in each class and the representative points, and the degree of separation is measured by the square of the distance between each representative point and the center point of the data set. The larger the CH indicator value is, the closer the class itself is, the more dispersed the classes are, and the better the clustering effect is.
where K represents the number of clusters, represents the number of data points in the i-th class, d(, c) represents the distance between the representative point of the i-th class and the data center c, d(x, ) denotes the distance between data point x and its representative point in class i, and n represents the total number of data points in the dataset [29].
With regard to the factor weights, this study uses the maximum information coefficient (MIC) to calculate correlations and assign weights to factors. The maximum information coefficient is developed on the basis of mutual information. The maximum information coefficient is suitable for exploring the potential relationship between variable pairs in the data set, and it is fair and extensive.
where X, Y denote the variables; n denotes the sample size; i × j < B(n) represents the division dimension of the grid G; G indicates that the pairs of variables are divided into i × j grids; and denotes the characteristic matrix of X and Y [30]. In this study, B(n) = ; obviously, 0 ≤ MIC ≤ 1.
2.2.2. Risk Assessment
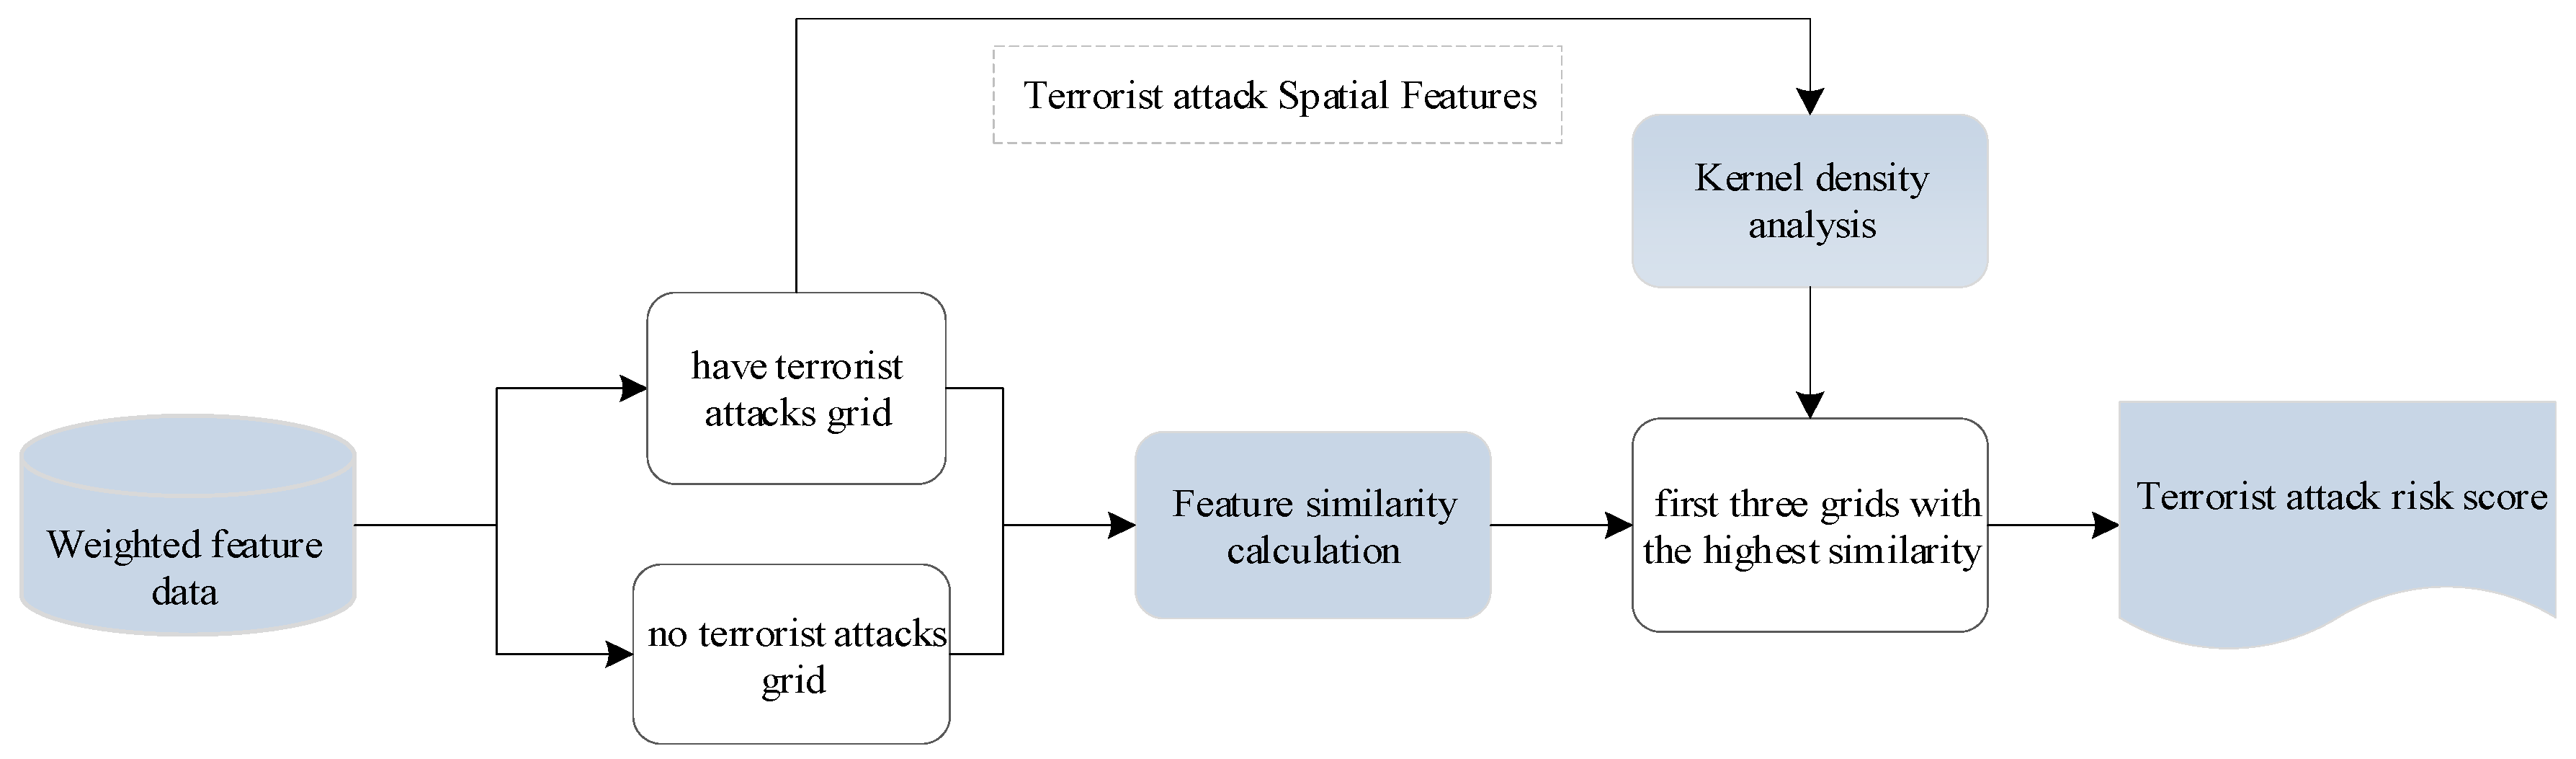
The data of weighted factor are used as the input for the location recommendation algorithm to calculate the similarity between each grid and then build a kernel density function based on the severity of terrorist attacks. Finally, combining the similarity with the kernel density, a score between 0–1 is calculated for each grid where no terrorist attack has occurred. This score indicates the probability of a terrorist attack on the grid.
(1) Similarity Calculation
The Euclidean metric (also called the Euclidean distance) is a commonly used distance definition, which refers to the true distance between two points in an m-dimensional space, or the natural length of a vector (that is, the point to the origin distance). The Euclidean distance in 2D and 3D space is the actual distance between two points.
(2) Spatial Characteristic Analysis
Kernel density analysis is used in spatial analysis to calculate the density of elements in their surrounding neighborhoods; it considers the neighborhood of each element as a smooth surface. The position of the element has the highest value, and with the increase in the point distance, the value gradually decreases, reaching 0 when the search radius is reached [31]. With the analysis of kernel density, it is possible to vividly and intuitively show hot spots where geographical phenomena are distributed. The formula for the kernel density method is given by
where f(s) is the kernel density calculation function at the spatial position s; h is the distance attenuation threshold, which is the bandwidth; n is the number of element points whose distance from the position s is less than or equal to h; and the K function is the kernel function. The study of the kernel function is based on the quadratic kernel function described in the work of Silverman. The geometric meaning of this equation is that the density value is largest at each core element xi and decreases continuously during the distance xi until the kernel density value drops to 0 when the distance from the core xi reaches the bandwidth h.
(3) Spatial Risk Assessment
We use the data of the weighted factor to calculate the similarity between the grid of land where no terrorist attack has occurred and the grid of the terrorist attack; we then select the three grids with the highest similarity to the grids without terrorist attacks; and then, we weight the average of the kernel density values and their corresponding similarity values for the three grids. The calculated score is the degree of possibility of an assault incident occurring in a grid where no terrorist attacks have occurred. The calculation process is shown in Figure 4.
(4) Evaluation index
We use precision, recall, and the combined F-Measure of the two to evaluate the space risk of terrorist attacks. The precision rate represents the proportion of actual terrorist attacks in the grids that the model assessed as high risk. The recall rate indicates the proportion of high-risk grids assessed by the model in the actual terrorist attack grids. The F-Measure is a comprehensive consideration of both rates and can comprehensively reflect the evaluation performance of the model.
In Equation (7), Precision was used for the prediction result; it indicates how many samples in the positive prediction are true positive samples. There are two possibilities for the prediction to be positive: One possibility is to predict the true positive class as a positive class (TP); the other possibility is to predict the negative class as a positive class (FP).
In Equation (8), Recall was used for the original sample. It indicates how many positive examples in the sample are correctly predicted. There are two possibilities for being correctly predicted: One is to predict the true positive class as a positive class (TP); the other is to predict the original positive class as a negative class (FN).
In Equation (9), P means Precision and R means Recall. There are occasions when contradictory situations exist between P and R indicators. Therefore, a comprehensive calculation formula F-Measure (F) of P and R was selected in this study for the overall evaluation of the model.
3. Results and Analysis
3.1. Regional Division Results
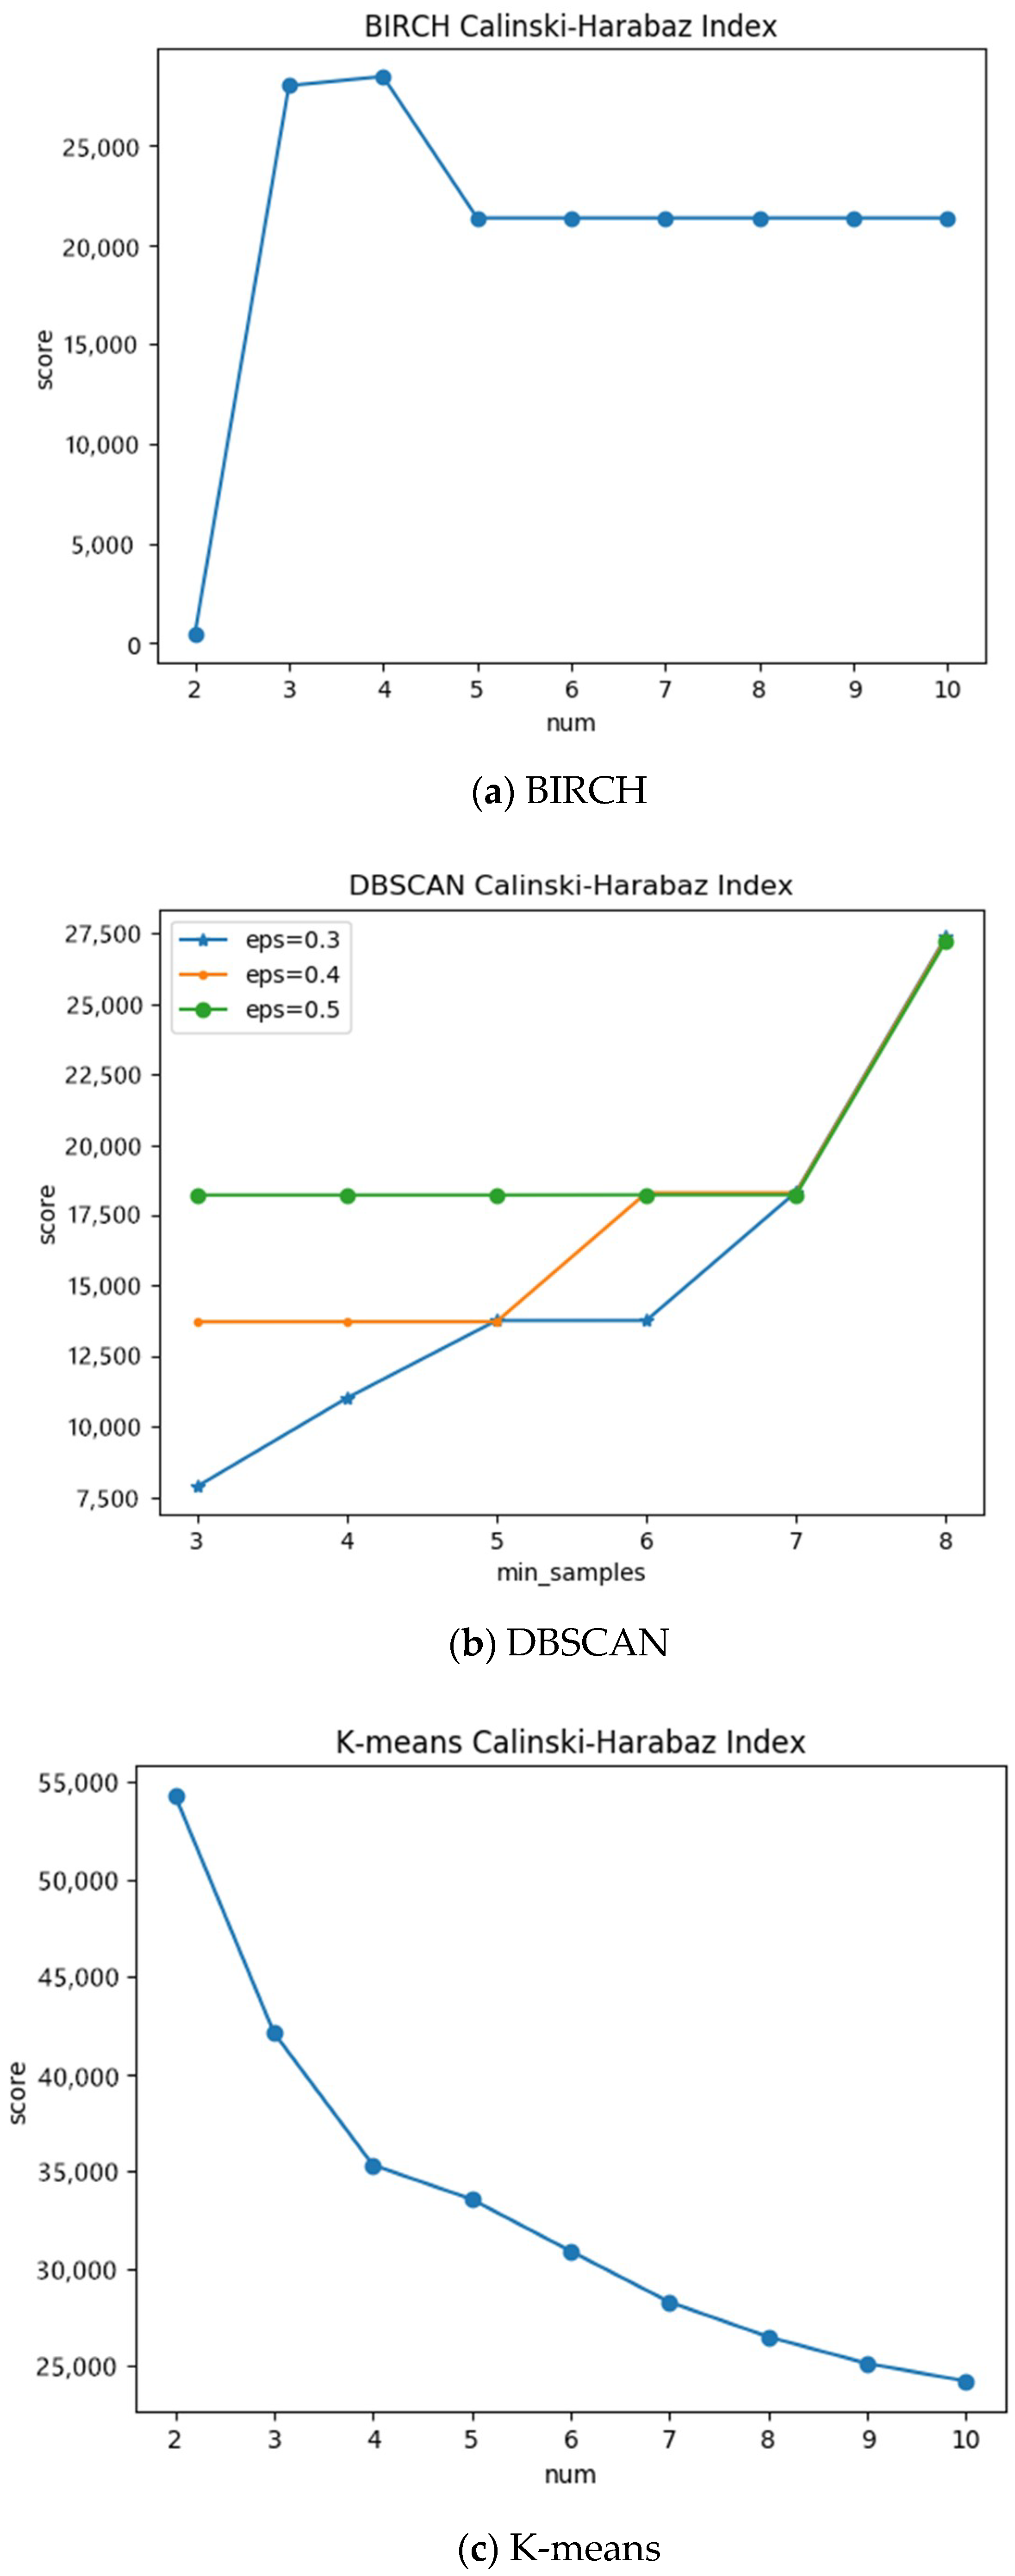
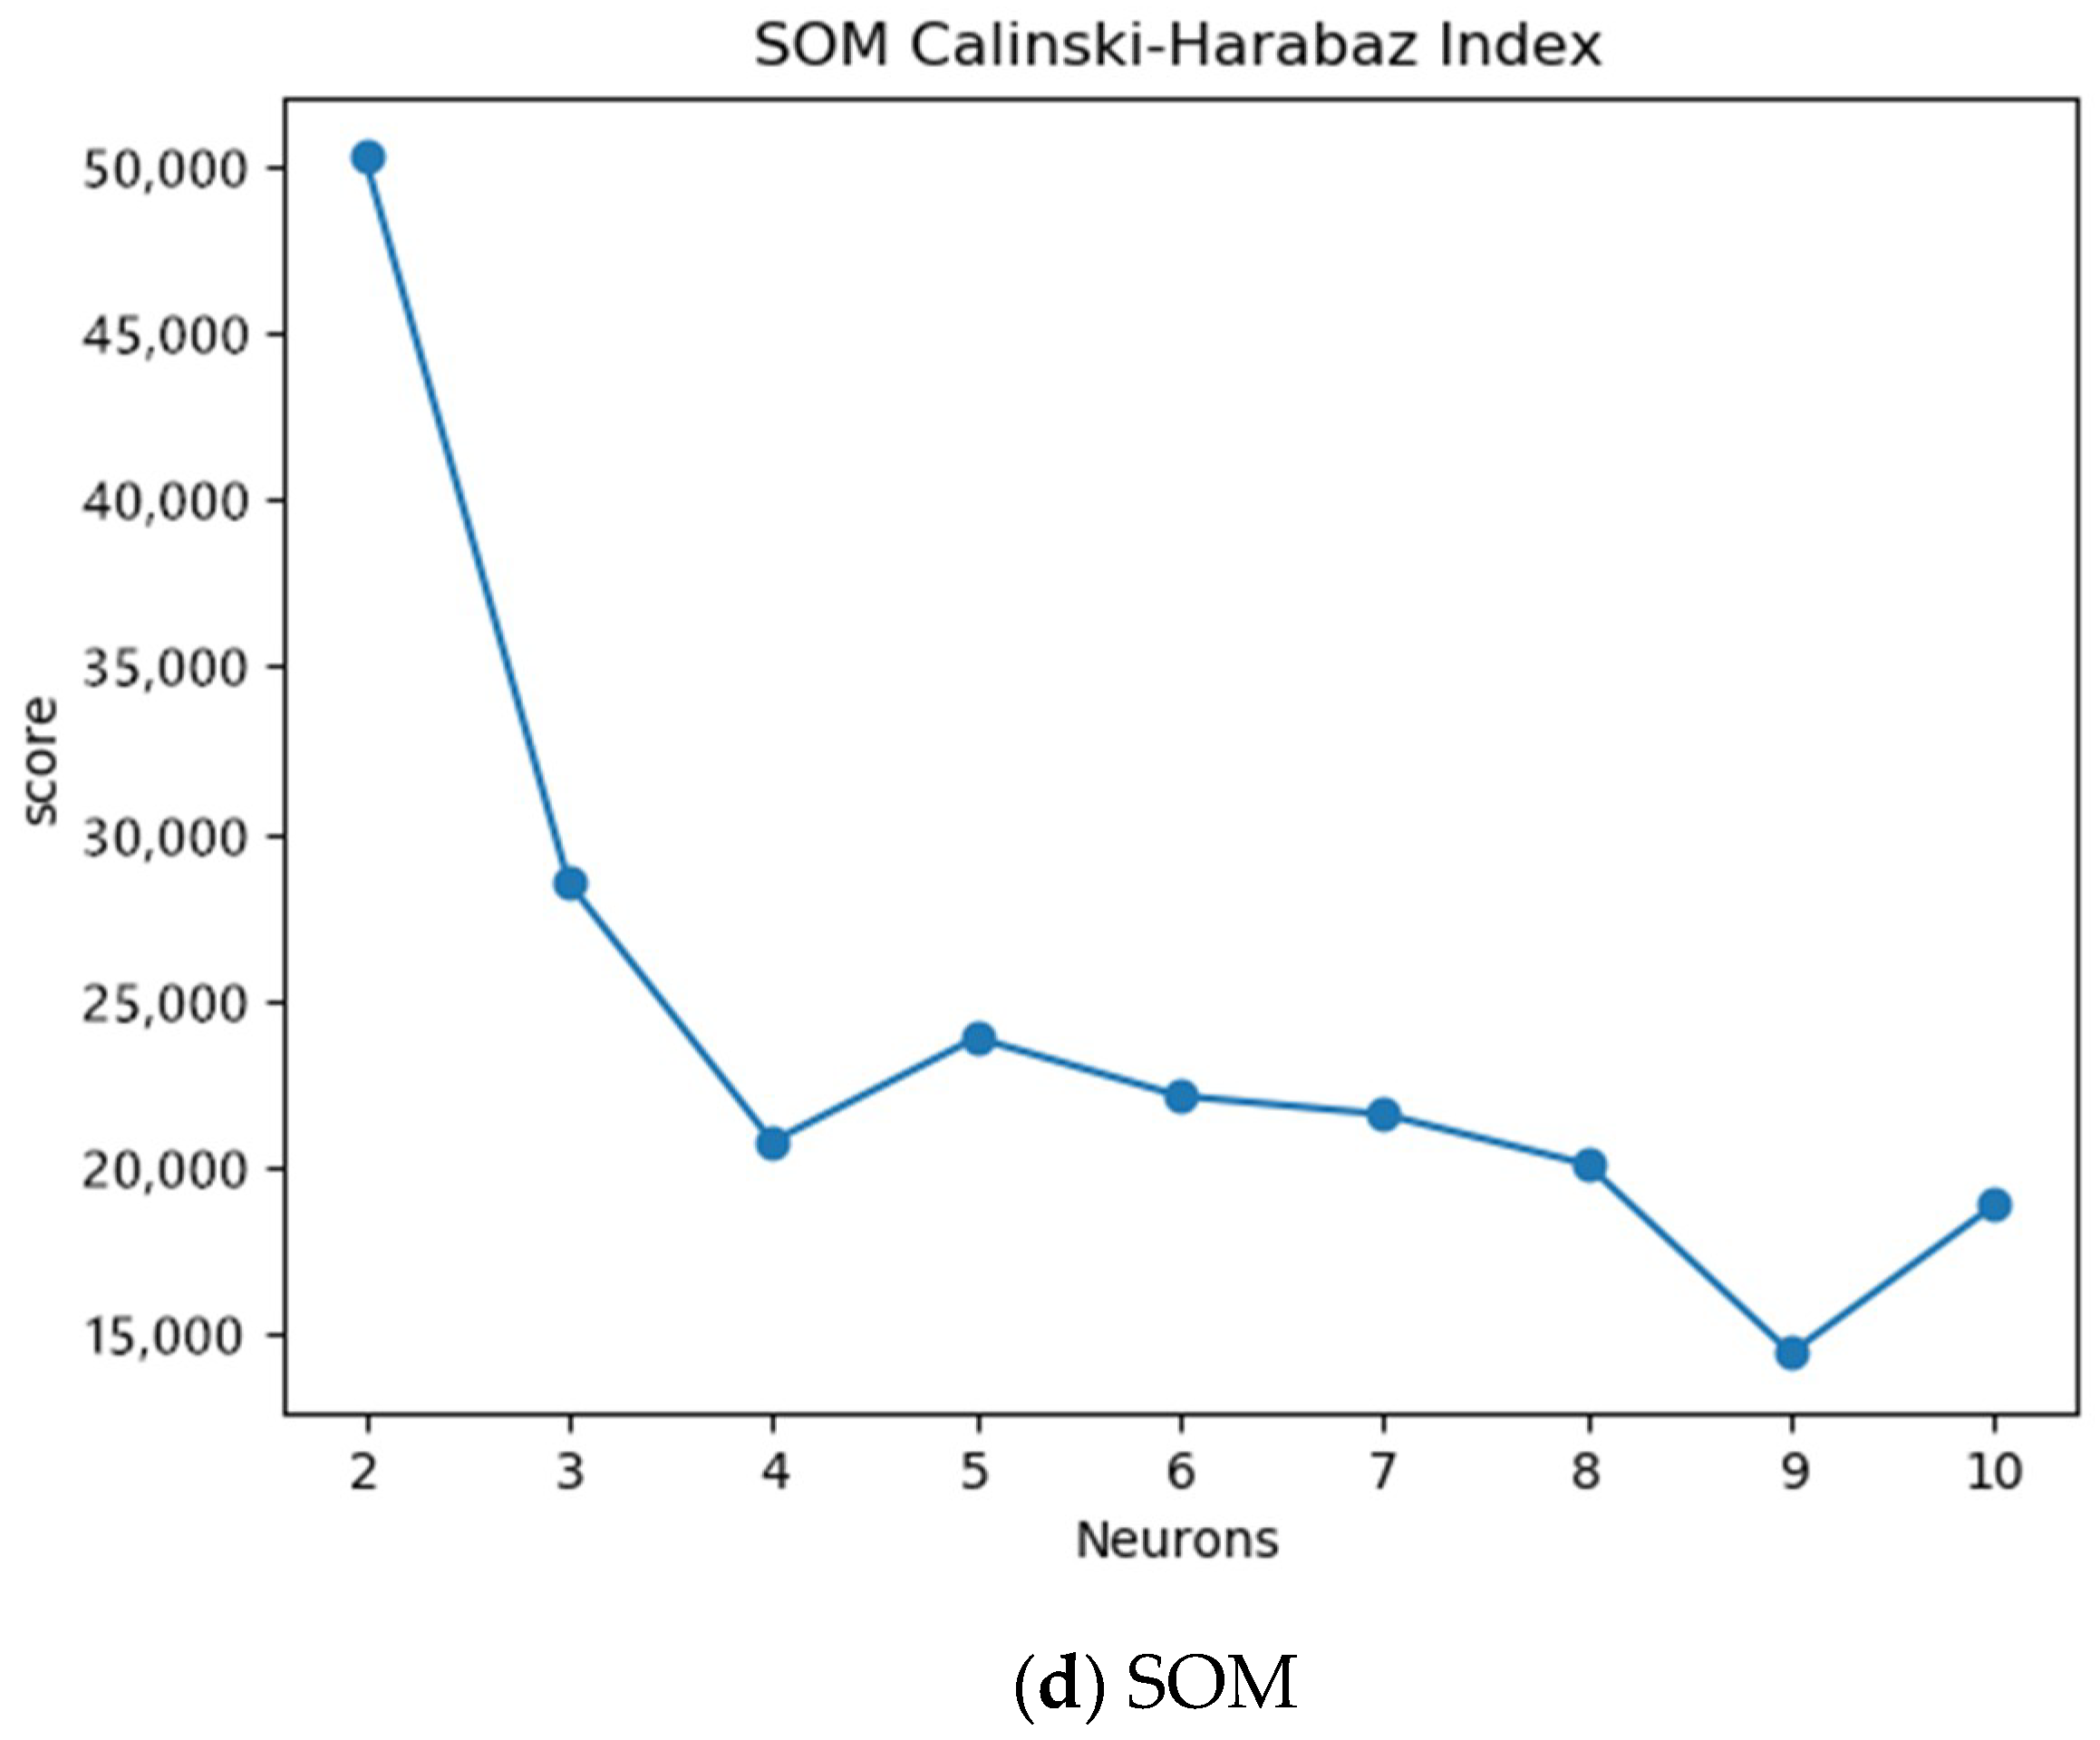
According to the collected data of 17 multi-source factors, the clustering algorithm in the machine learning method is used to partition the Southeast Asian region. For the BIRCH and K-means algorithm, the number of clusters 2 to 10 is selected to adjust the parameters. It is found that the BIRCH clustering effect is the best when the number of clusters is 4 and that the K-means algorithm works best when the number of clusters is 2. For the DBSCAN clustering algorithm, eps (ε-neighborhood distance threshold) and min samples (ε-neighborhood threshold) were used to adjust the parameters. It is found that, when eps is 0.5 and min samples is 8, the clustering effect is best. For the SOM algorithm, select the number of neurons to adjust the parameters; the best effect is found when the number is 2. The tuning parameters of the four clustering algorithms are shown in Figure 5.
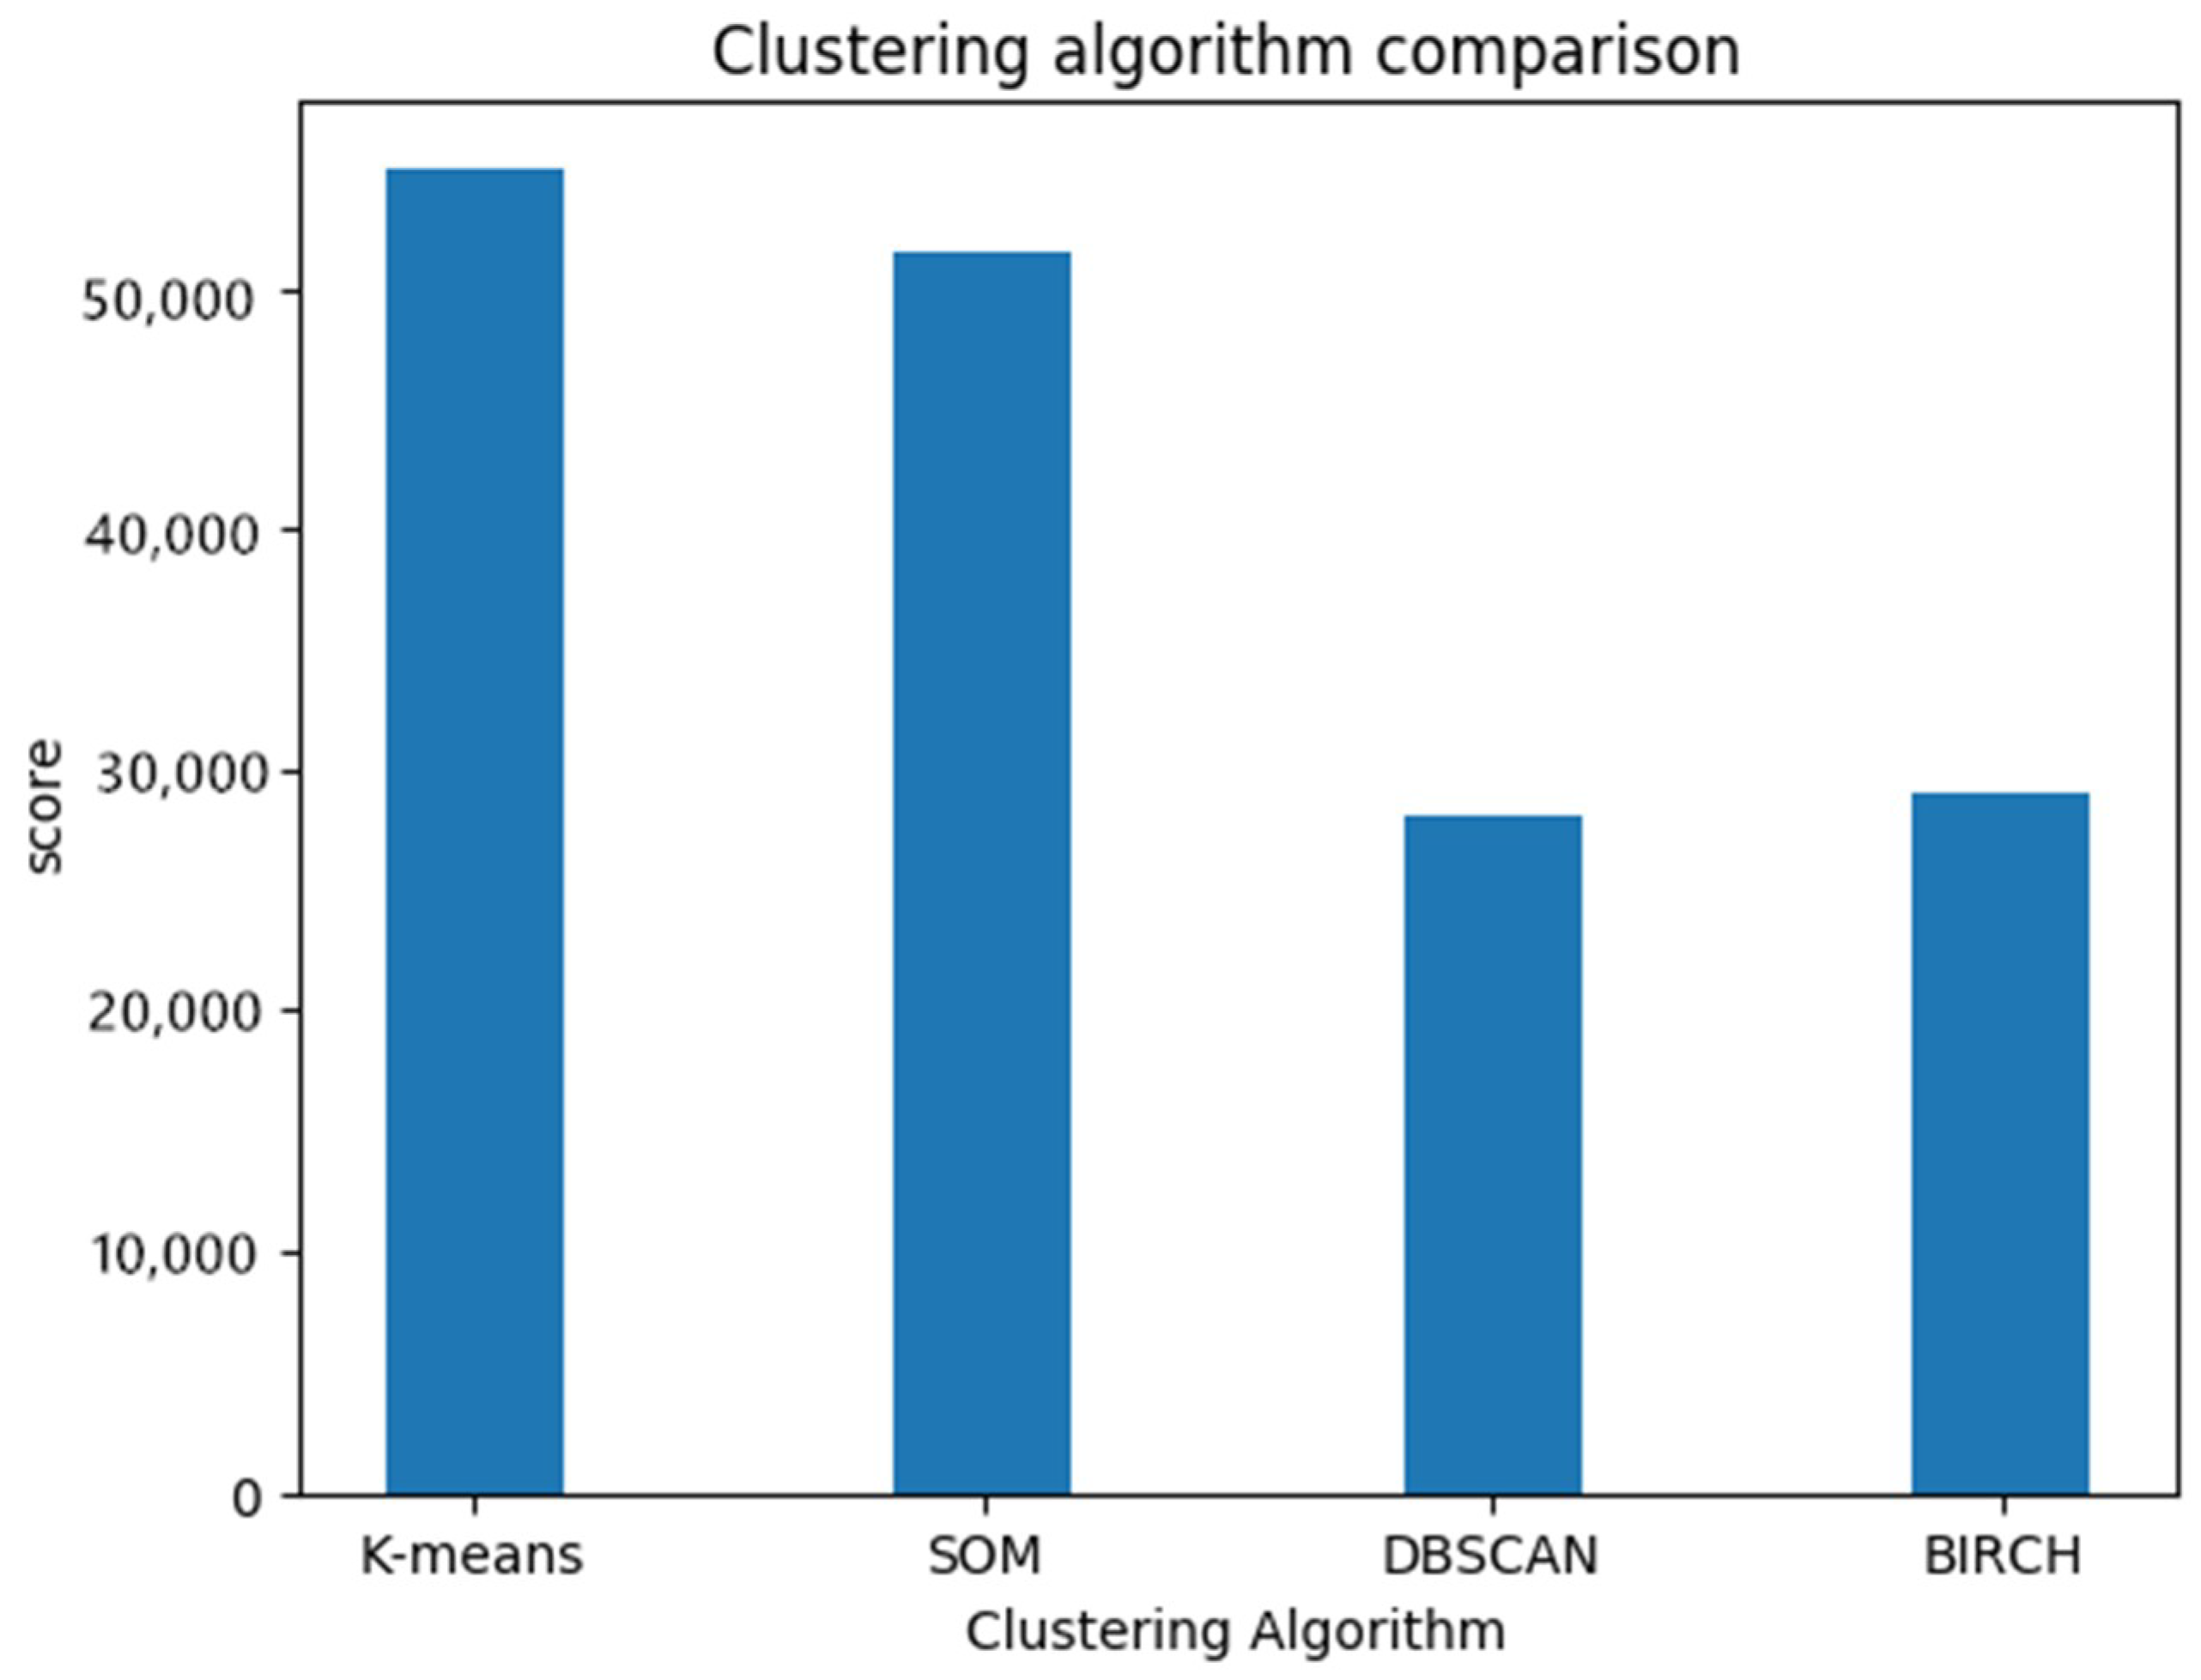
By comparing the optimal parameter states of the four clustering algorithms, we found that the K-means algorithm has the highest clustering quality score. Therefore, K-means was selected for spatial division. The comparison of the four algorithm clustering effects is shown in Figure 6, and the result of the spatial area division is shown in Figure 7.
3.2. Spatial Characteristics
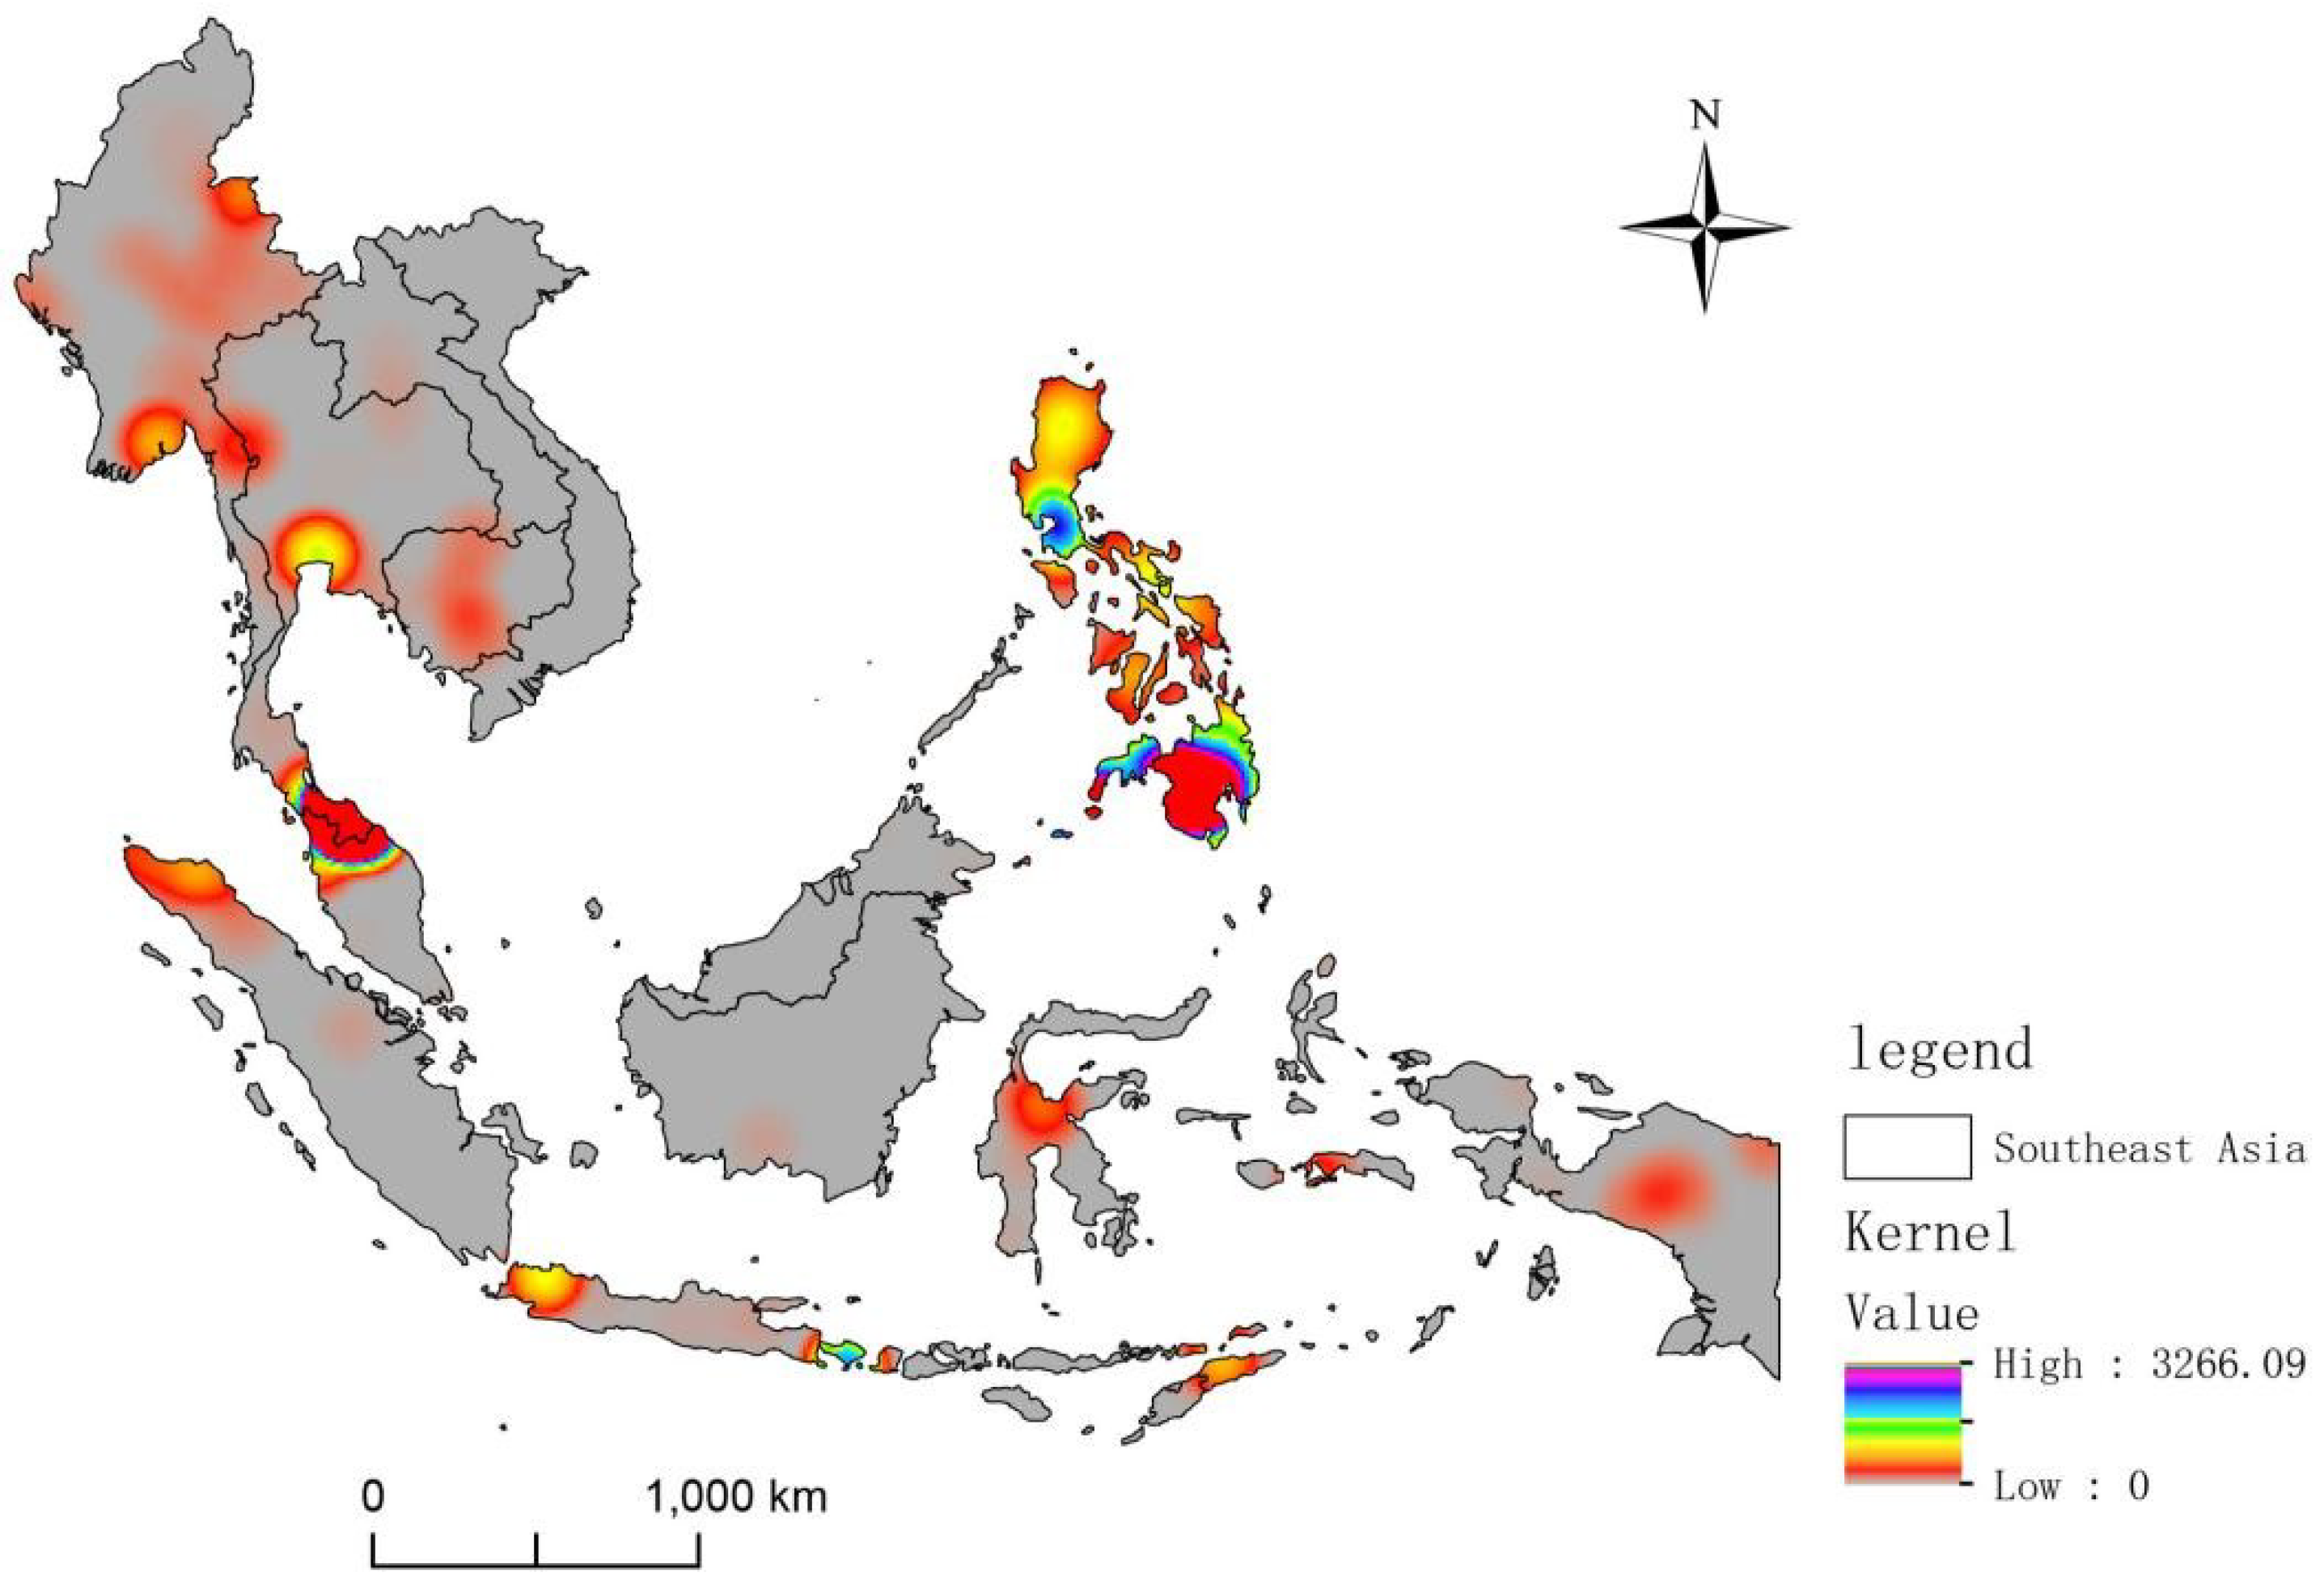
Kernel density analysis is used to calculate the density of elements in their surrounding neighborhoods. In the kernel density analysis tool of ArcMap 10.3, the Population field indicates counts or quantities that are distributed throughout the landscape used to create a continuous surface. This study uses ArcMap 10.3 for kernel density analysis and sets the Population field value to the severity of the terrorist attack represented by this point (combining the number of deaths, the number of injured, and property losses). The kernel density of each grid based on the severity of the terrorist attack is shown in Figure 8.
3.3. Assessment Results
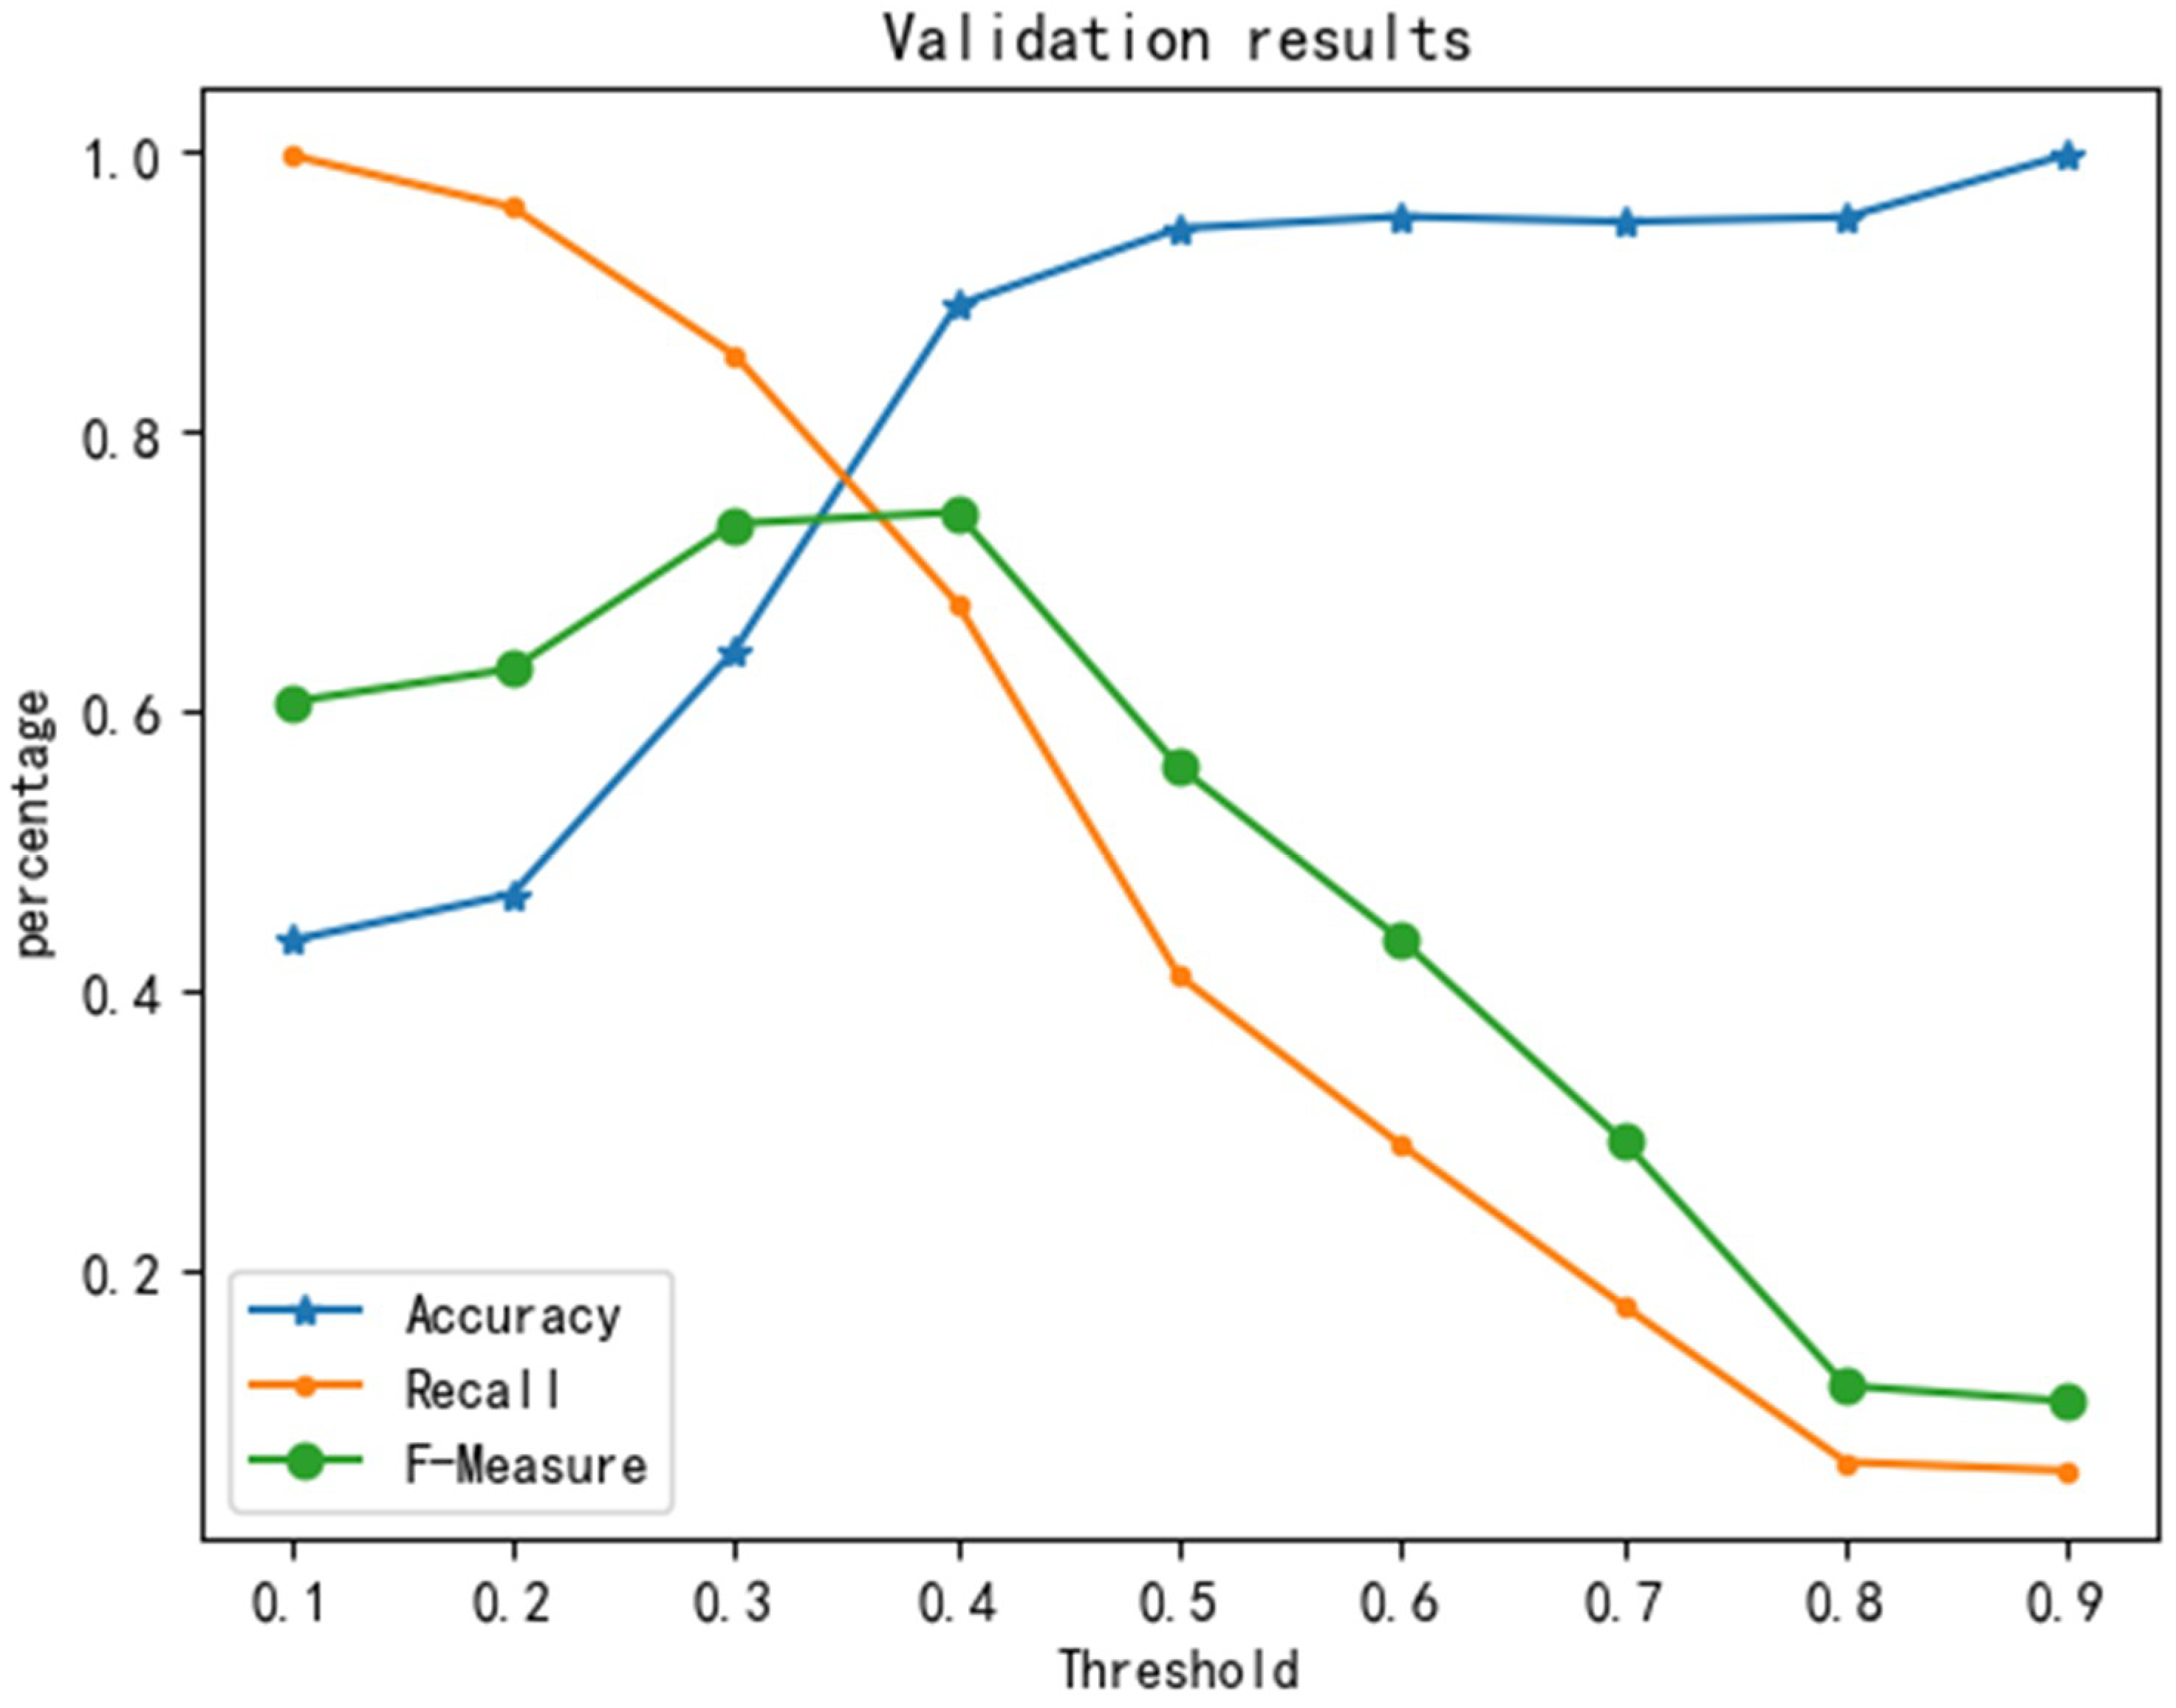
The data set was divided into two parts: one for training the evaluation model and the other for testing the model. To train and test the performance of the spatial risk assessment model, a 10-fold cross-validation method was used. Divide the data set into ten and take nine of them as training data and one of them as test data. The sample data in each test set will get a score between 0 and 1, which is verified by taking the threshold value from 0.1 to 0.9, and the evaluation index selection precision rate, recall rate, and F-Measure. We conducted ten 10-fold cross-validations and sought the average value as an estimate of the final model accuracy, as shown in Figure 9.
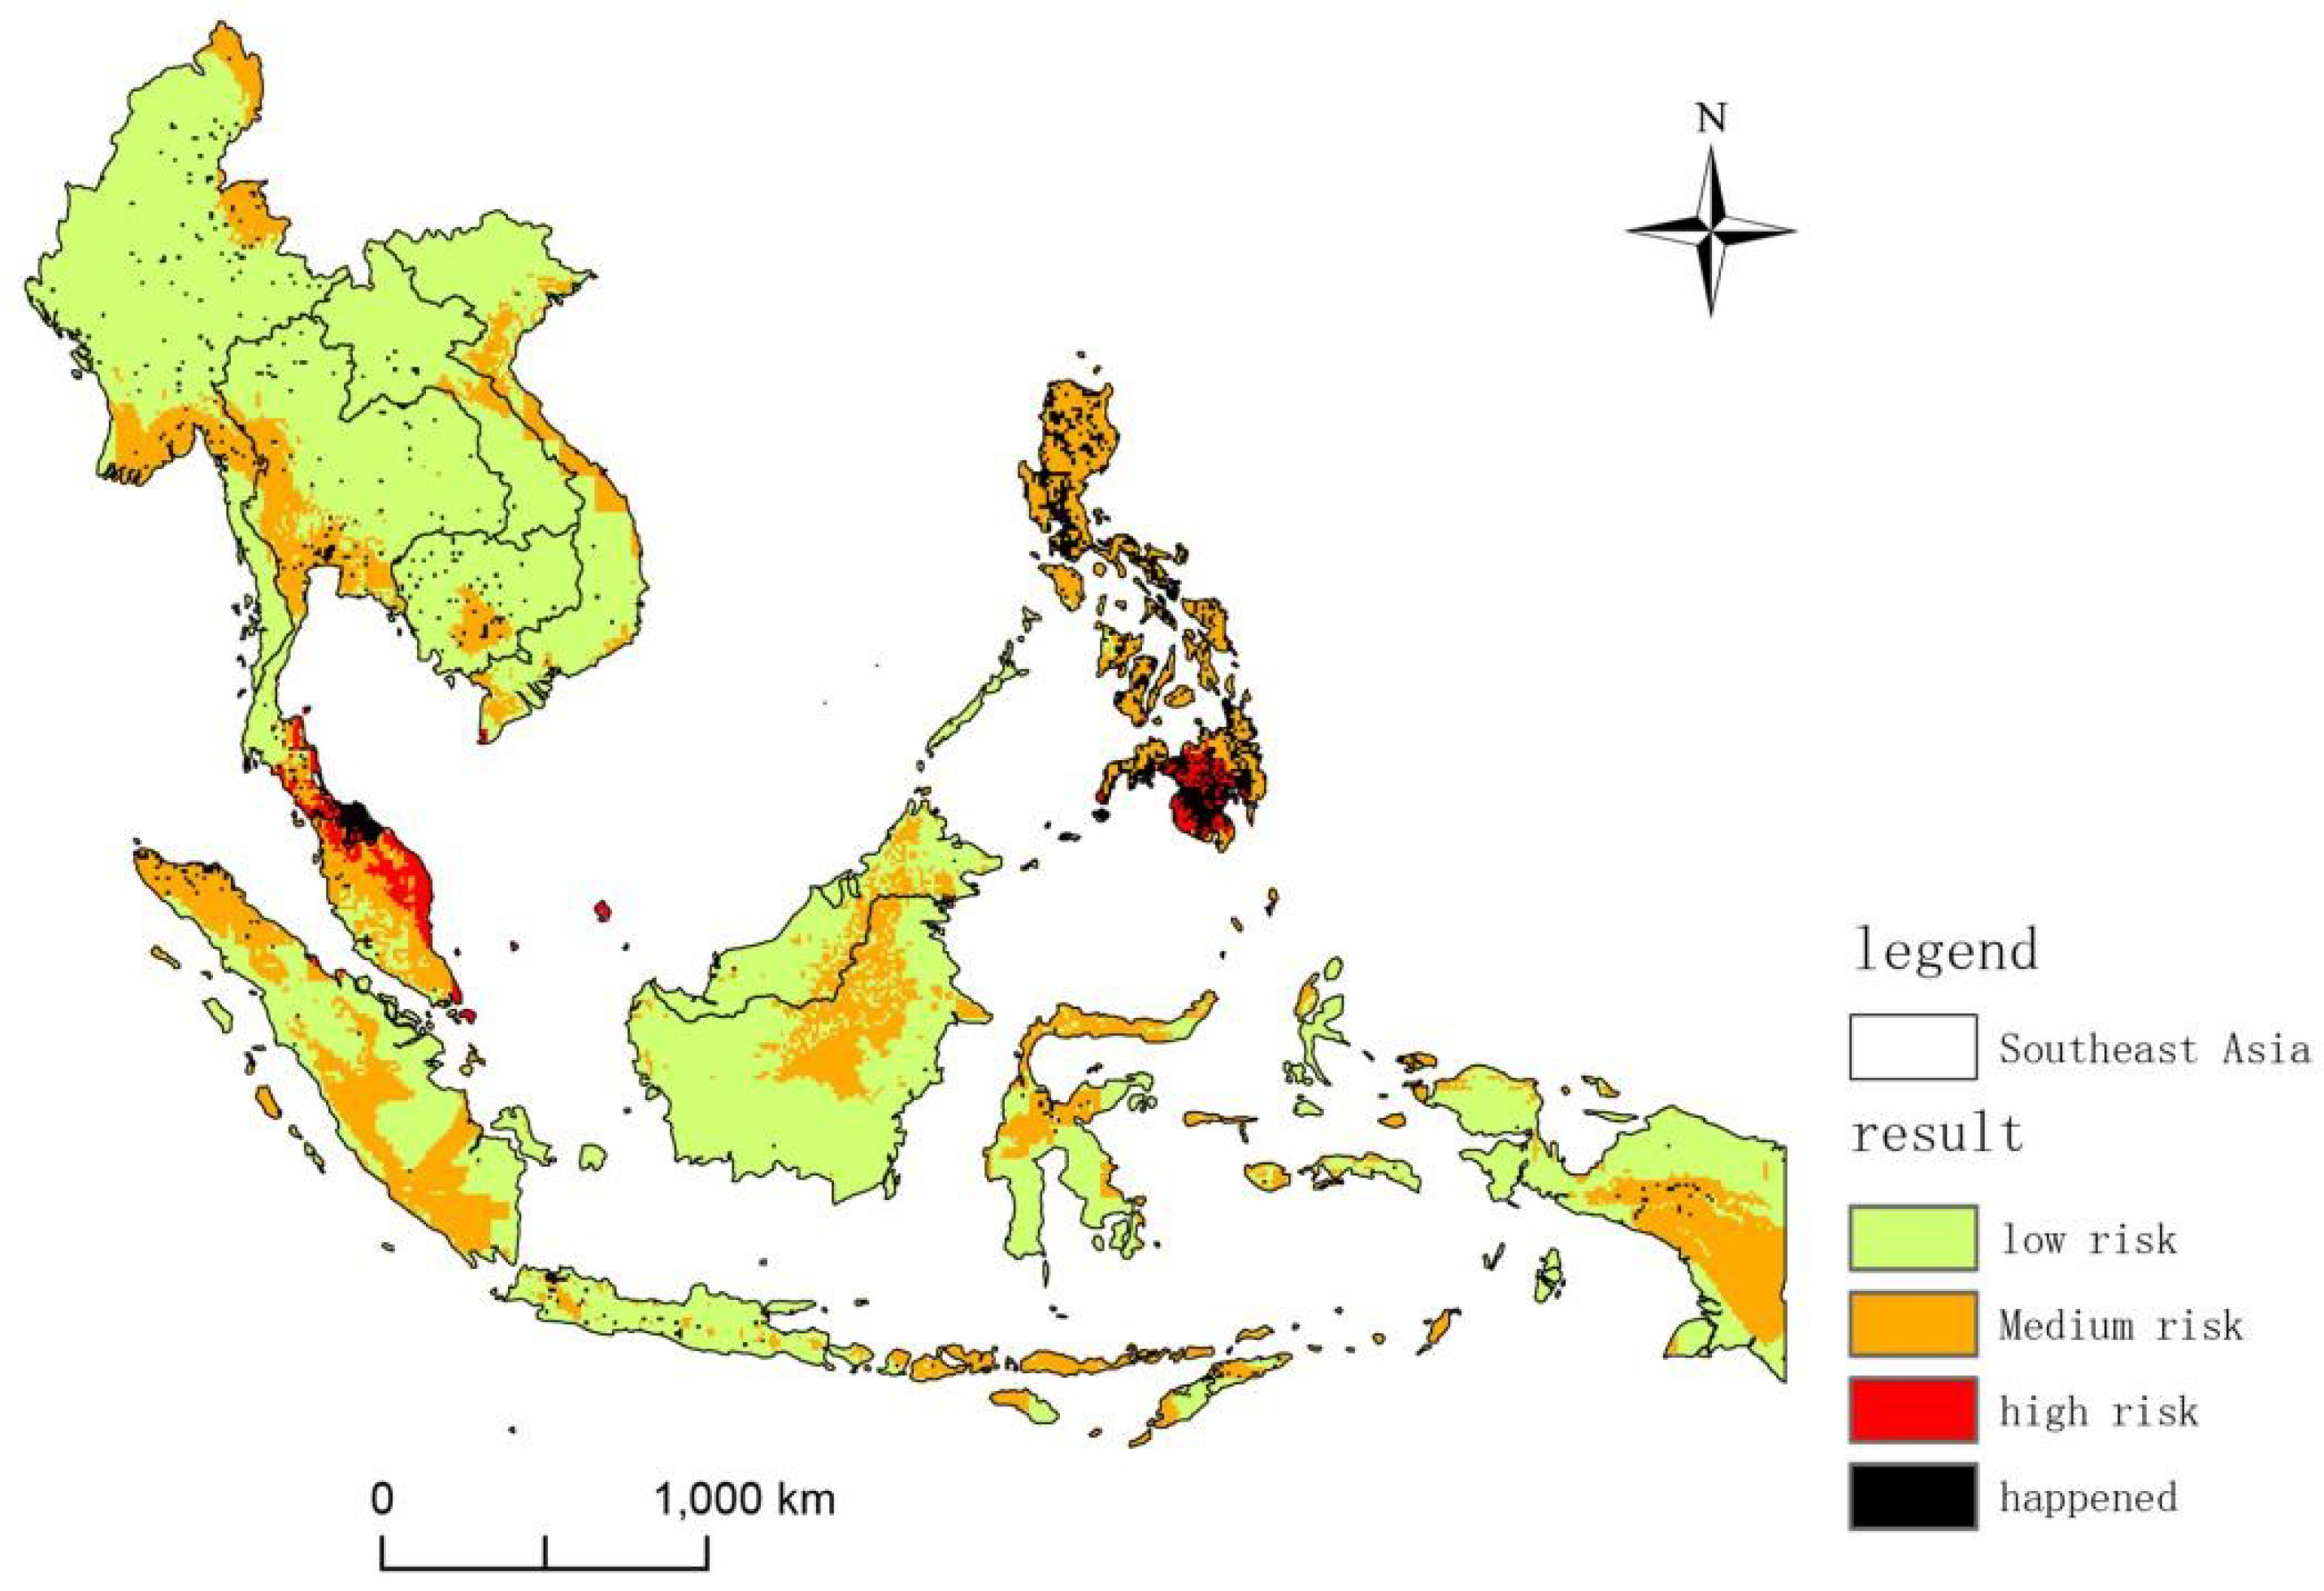
As seen in Figure 9, with the increase in the threshold, the precision rate increases but the recall rate decreases, and the F-Measure increases first and then decreases. The F-Measure can comprehensively represent the overall performance of the model. Therefore, when the value with the highest F-Measure is selected in this study, the threshold is 0.4, and the precision is 88%. The results of the spatial risk assessment of an assault are shown in Figure 10. The high-risk areas in the figure have scores greater than 0.4, the medium-risk assessment scores range from 0.1 to 0.4, and the low-risk areas score is less than 0.1. From Figure 10, we can see that the high-risk areas of terrorist attacks in Southeast Asia are generally concentrated and multi-centered. The southernmost part of Thailand and the Philippines are high-risk areas of terrorist attacks. The conflicts between religions and ethnic groups in these regions are serious. The economic development of these regions is not balanced and belongs to the main drug areas, so it is easy to breed terrorism; the medium-risk areas of terrorist attacks are widely distributed. Some coastal and border areas are in medium-risk areas of terrorist attacks. Unbalanced economic development, and ethnic and religious conflicts are quite serious and can lead to terrorist attacks. The low-risk areas of terrorist attacks are also widely distributed. There are fewer religions and ethnic groups in these regions, and it is not easy to cause terrorism.
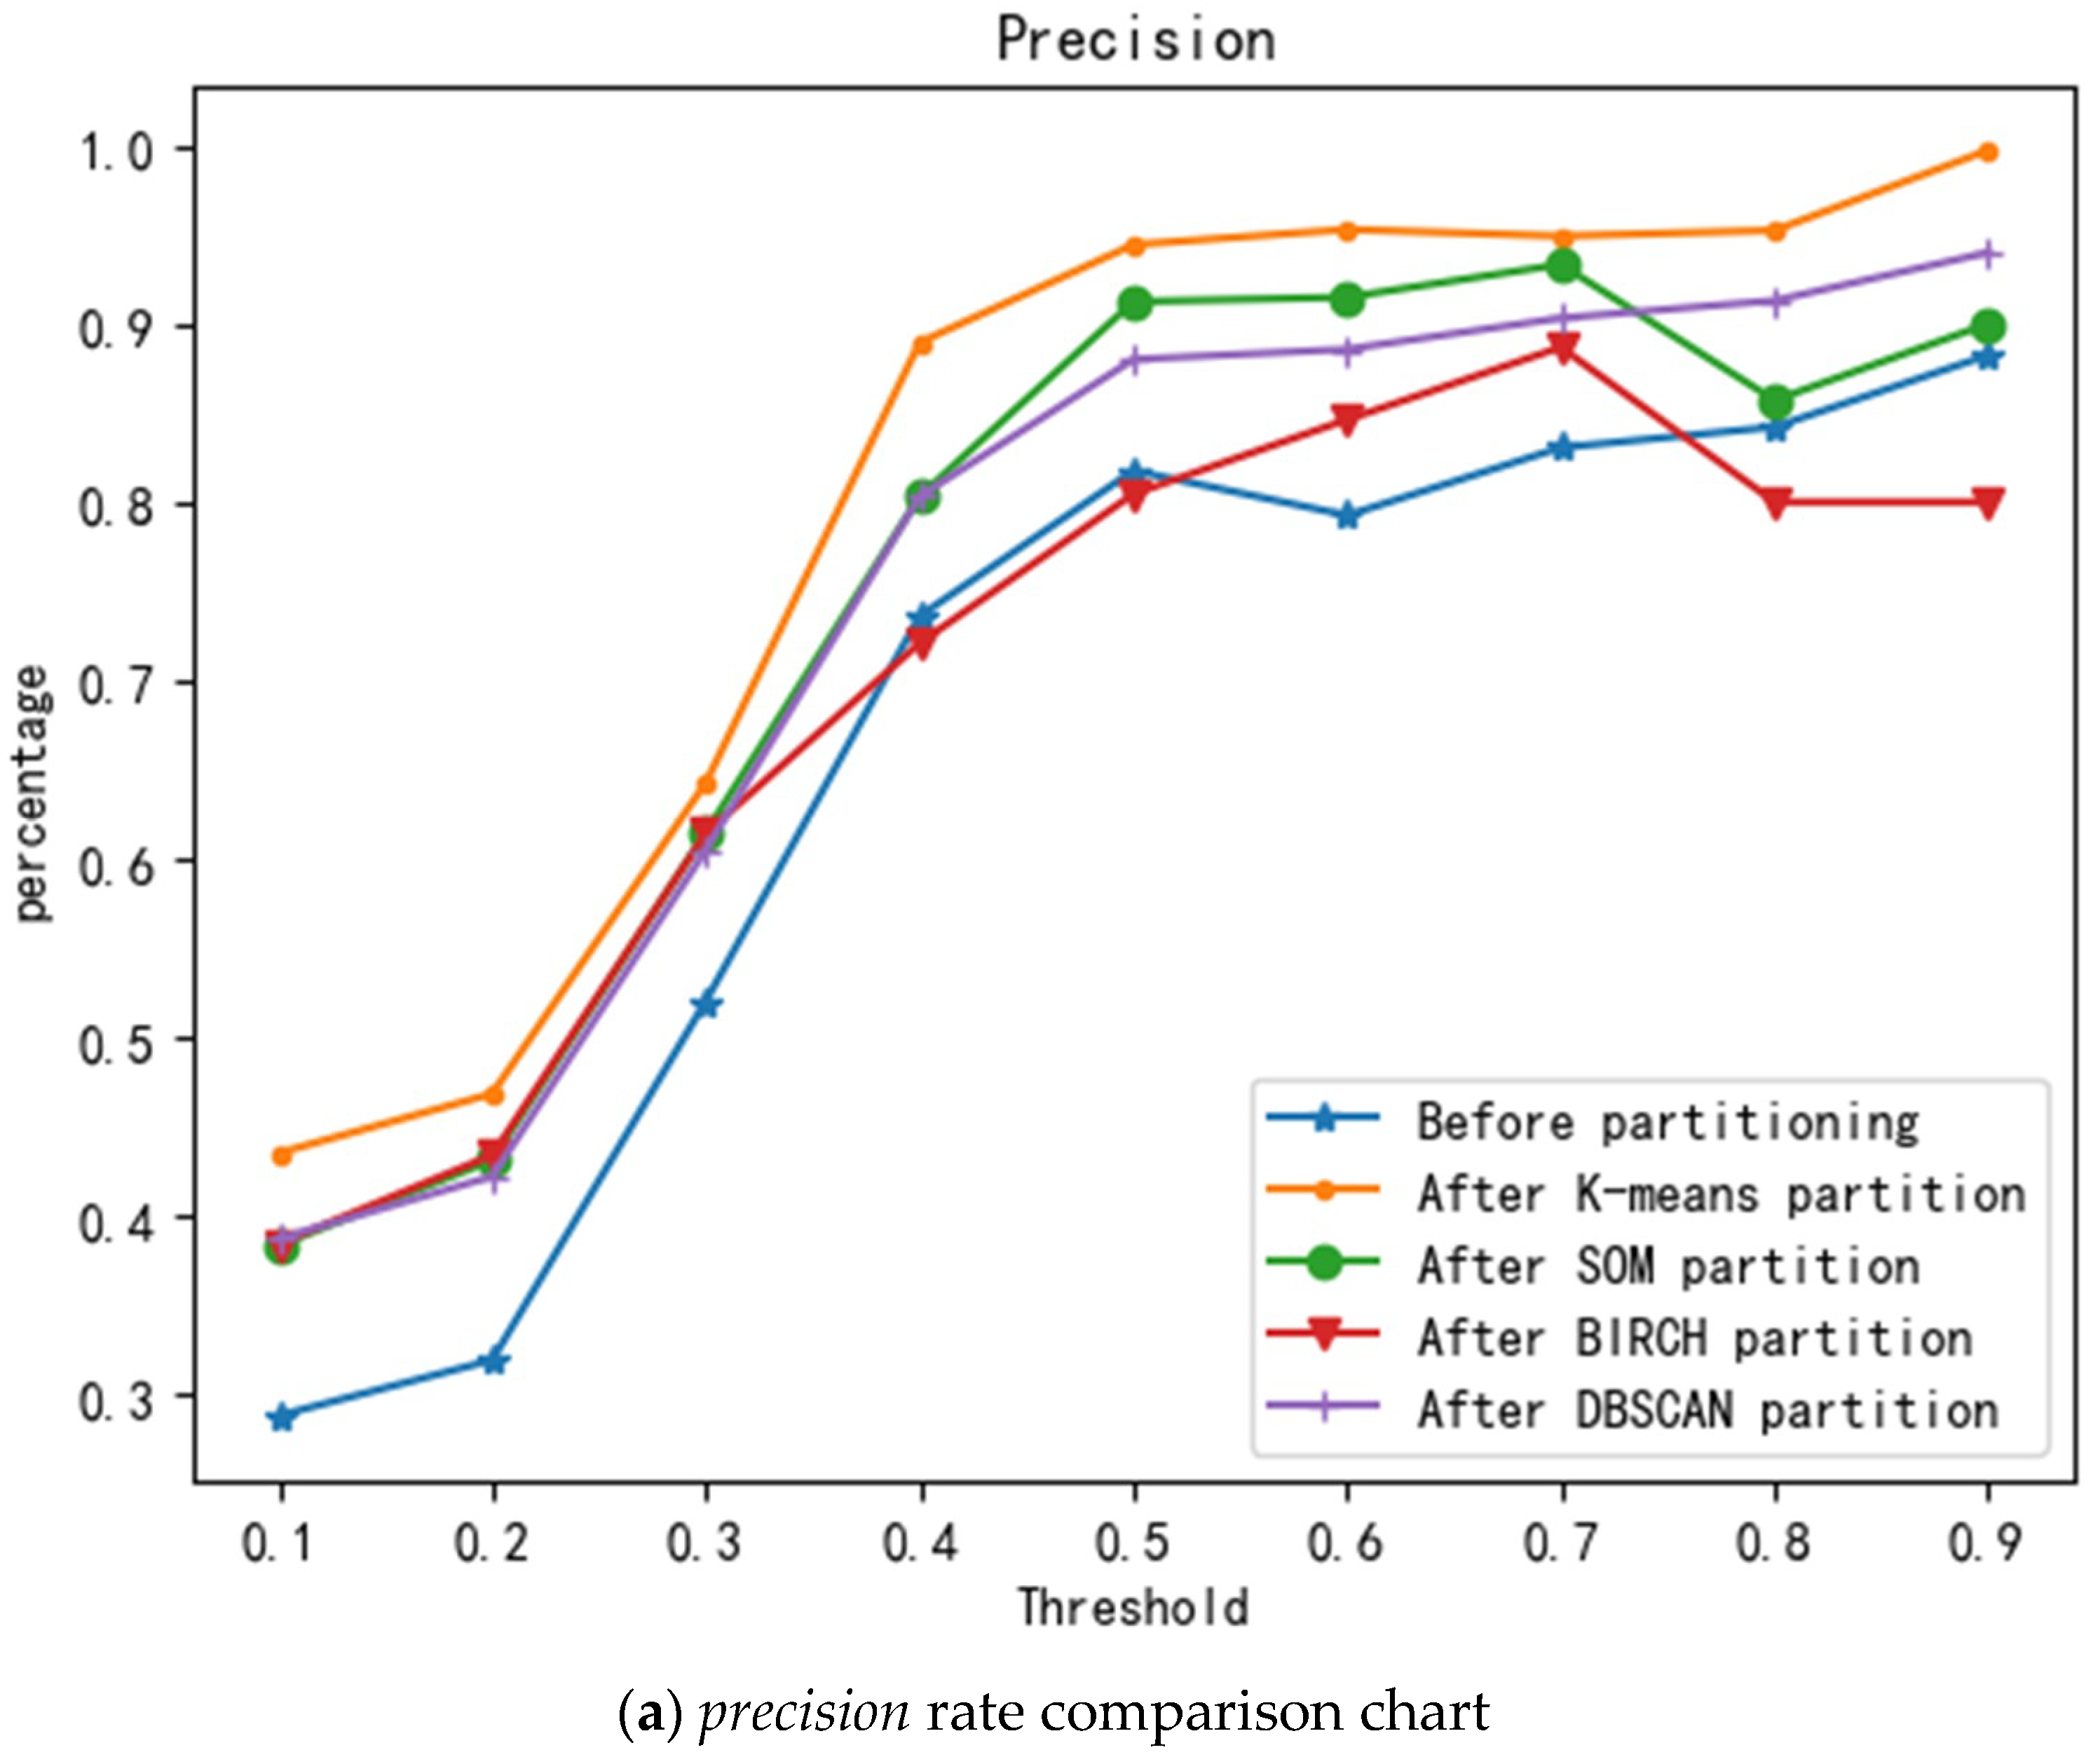
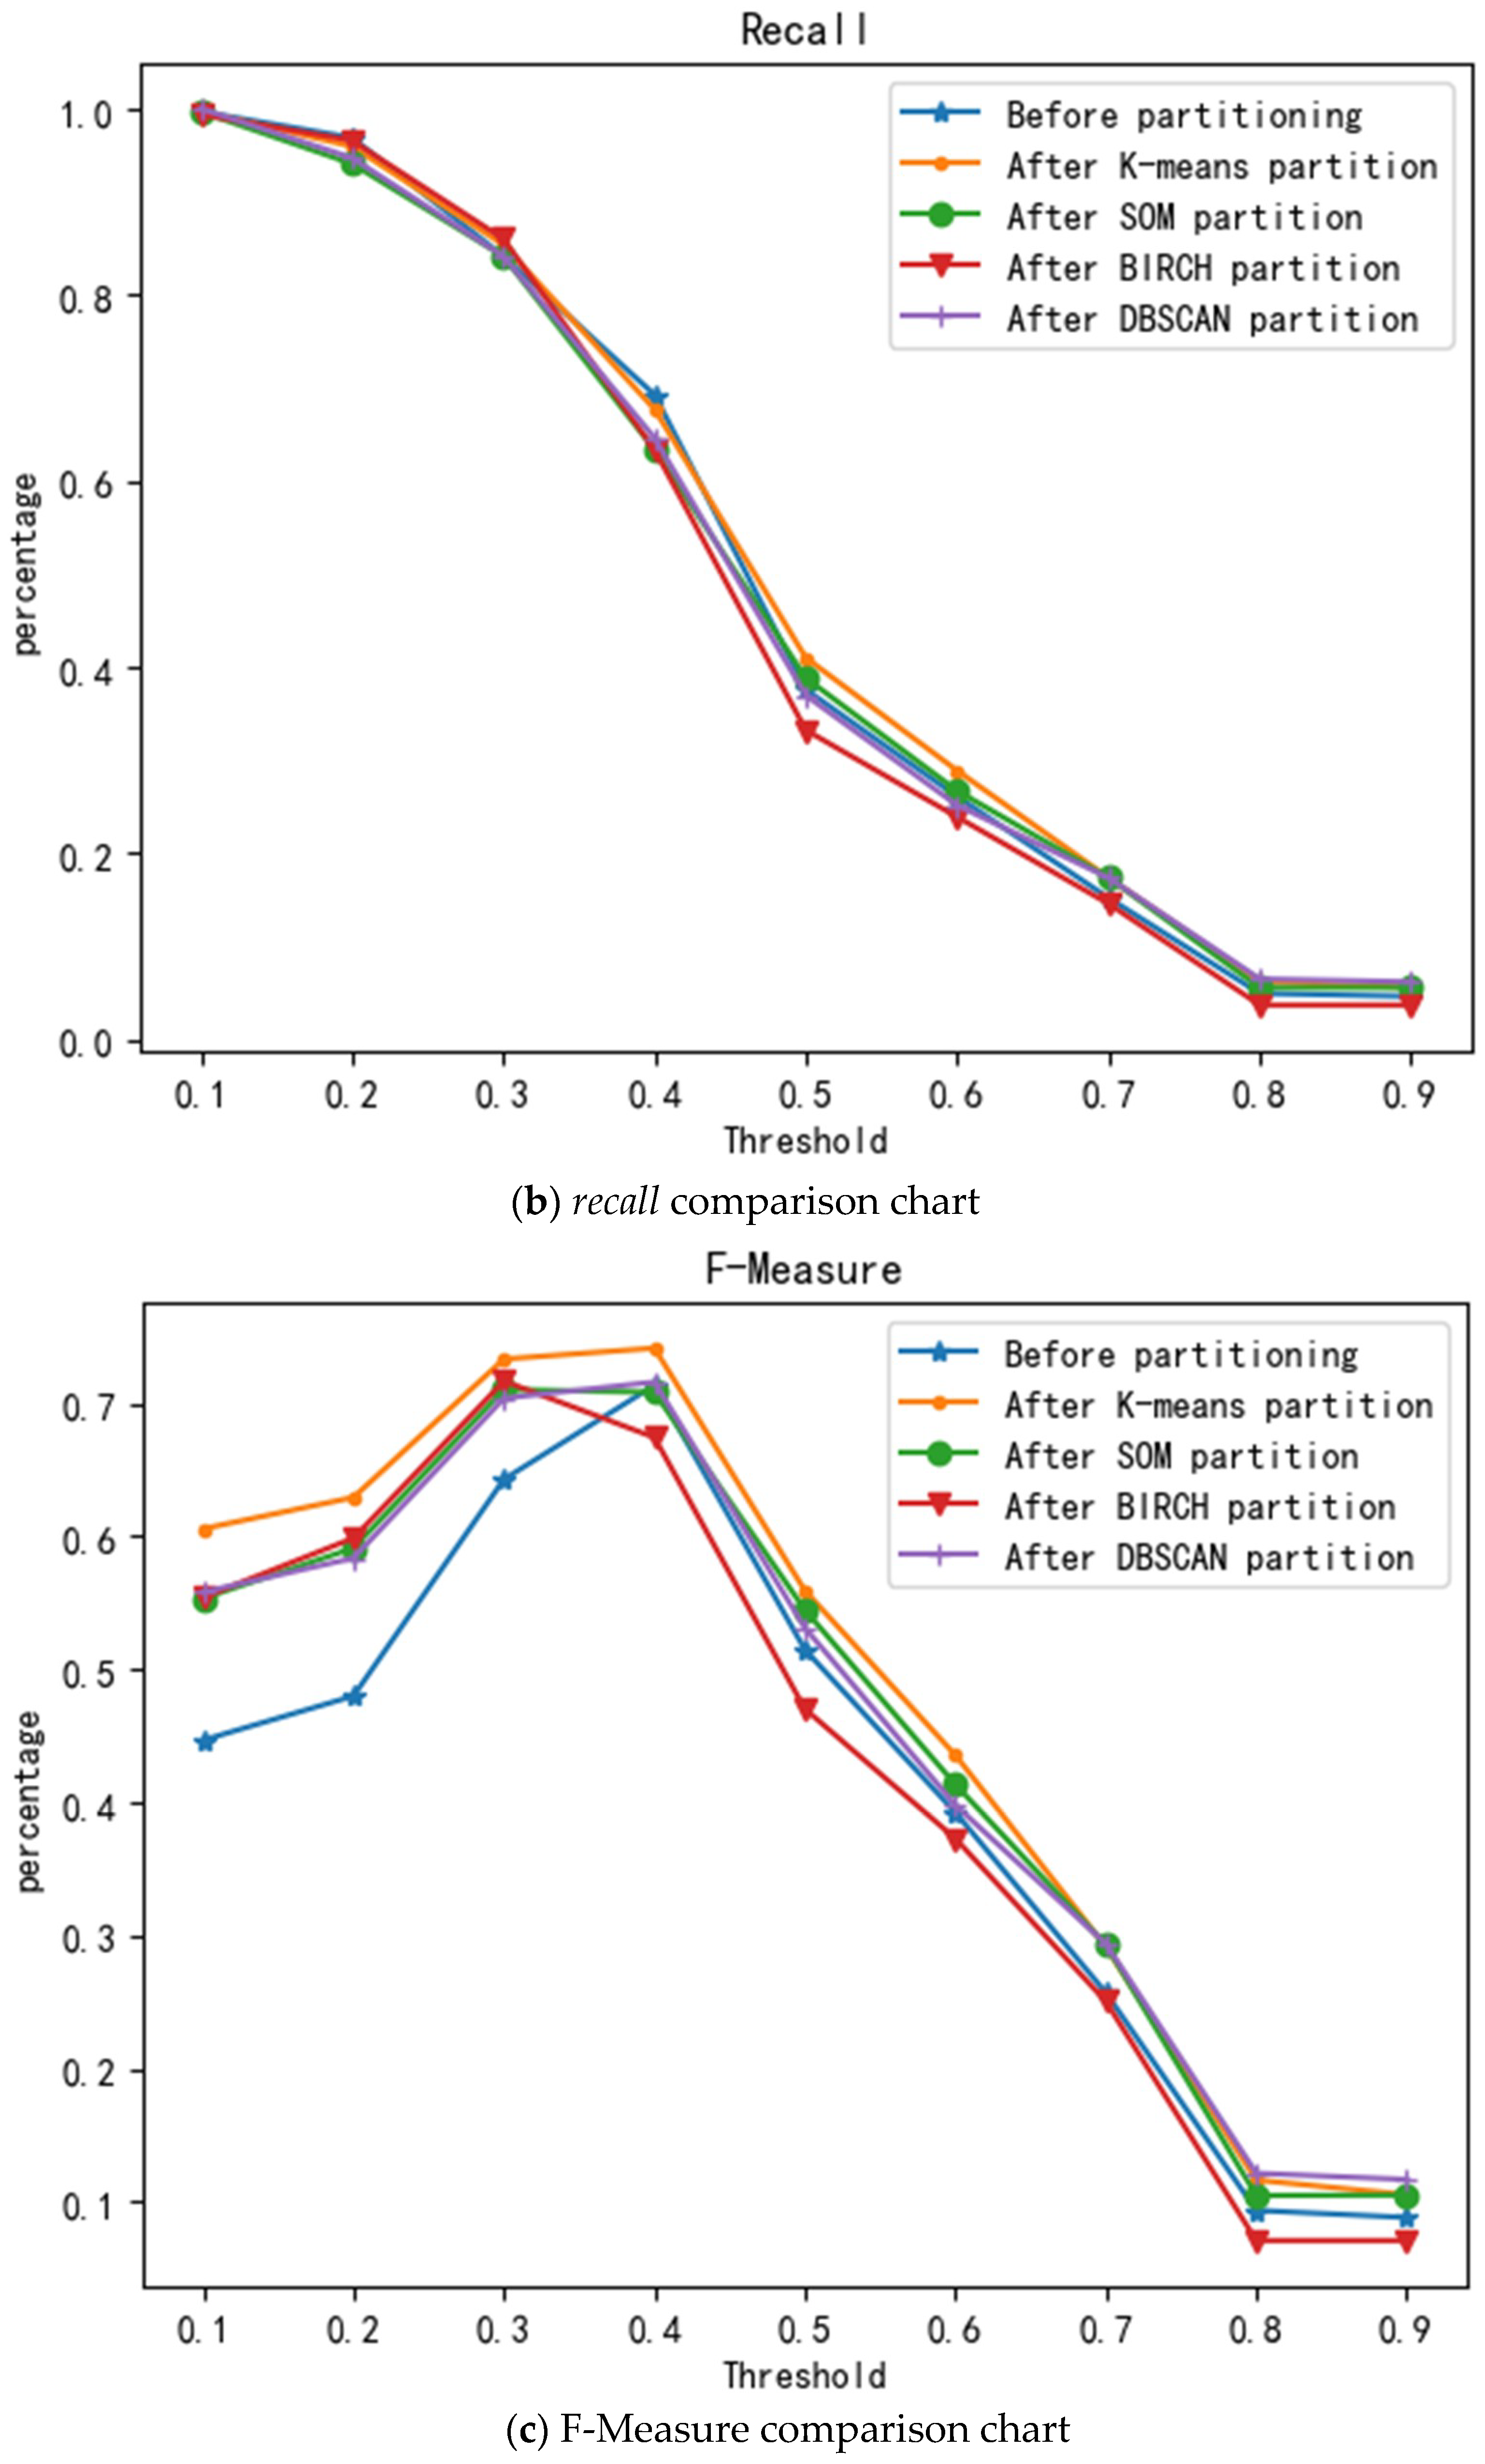
Moreover, to verify the improvement of the model performance brought about by the partitioning of the K-means algorithm, experiments were performed on the partitioning of the other three clustering algorithms and before the partitioning. A 10-fold cross validation method was used to perform multiple experiments on the BIRCH, SOM, and DBSCAN clustering algorithm partitions, and unpartitioned and the average value were used as an evaluation of the model performance. The experimental results are shown in Figure 11.
Figure 11a–c show comparisons of the accuracy, recall, and F-Measure for the model, respectively, partitioned by the K-means, SOM, BIRCH, and DBSCAN algorithms, and the unpartitioned model. Figure 11a shows that the precision rate increases as the threshold increases and that the precision of the model after K-means, DBSCAN, and SOM partitioning under different thresholds is greater than that of the precision of the model when it is not partitioned. The precision of the model after BIRCH partitioning is slightly lower than that of the unpartitioned model when the thresholds are 0.4, 0.5, 0.8, and 0.9. Figure 11b shows that with the increase in the threshold, the recall rate is constantly declining, and the recall rate of different clustering algorithm partitions and non-partitioned models displays minimal difference. Figure 11c shows that, as the threshold increases, the F value rises first and then decreases. The K-means, DBSCAN, and SOM partitioned model F-Measure reached a maximum at a threshold of 0.4, and the BIRCH partitioned model reached a maximum at a threshold of 0.3. In summary, it can be seen from the comparison chart before and after the partition that the accuracy and F-Measure of the K-means algorithm are the highest and that the F-Measure is the highest when the threshold is 0.4; moreover, this result validates the scientific nature of cluster quality assessment using the Calinski-Harabaz indicator. The experimental results show that the improvement of the algorithm in this study is effective and feasible.
4. Conclusions
We took Southeast Asia as the research area and combined the clustering algorithm and location recommendation algorithm from the grid scale. Based on a comprehensive analysis of the influencing factors of terrorist attacks, we conducted a spatial risk assessment of terrorist attacks and completed an effective test of the model.
In this study, a set of location-based spatial risk assessment algorithms for terrorist attacks was designed to address the existing disadvantages of traditional location recommendation algorithms. The algorithm combines the characteristics of the spatial distribution of terrorist attacks and fuses the influence of factors in different regions. The results of the model created are well-behaved because of the abundant multi-source data, including social, economic, natural, and geographical data. In addition, the model also combines the spatial distribution of terrorist attacks to make spatial risk assessment more reasonable and scientific.
The results showed that the southernmost part of the Indochina peninsula and the Philippines are high-risk areas for terrorist attacks. In fact, these areas have experienced a high incidence of terrorist attacks in recent years. The Philippine national separatist organizations have increasingly become religious extremist organizations, and the capacity of extremist organizations for transnational activities has increased. The penetration of the “Islamic State” in South-East Asian organizations indicates that Southeast Asia may become a major battlefield in the international fight against terrorism. The results also show that some coastal areas and border areas are in medium-risk areas of terrorist attacks; thus, the next step in the prevention of terrorism should focus more on these areas.
The research coupled the multi-source factors from space to study terrorist attacks, using attributes such as latitude, longitude, and casualties in the GTD database. The focus of the next step should be on more elaborate time and space scales. Moreover, research on the GTD database should consider the types of attacks, methods of attack, and terrorist organization data, which may reveal more information hidden in the data.
Author Contributions
Conceptualization, X.Z.; Data curation, M.J.; Funding acquisition, X.Z. and M.H.; Investigation, X.Z.; Methodology, J.F.; Project administration, X.Z.; Software, J.F.; Supervision, M.H.; Validation, M.J.; Visualization, M.J. and X.X; Writing—original draft, M.J.; Writing—review & editing, C.Y.
Funding
This research was funded by the Chinese Academy of Sciences key deployment topics (grant number ZDRWZS-2016-6-1); Ministry of Education Humanities and Social Sciences Research Youth Fund Project (grant number 15YJCZH224); Chinese Academy of Sciences Key Deployment Project (grant number ZDRW-ZS-2017-4); and China Postdoctoral Science Fund 62nd batch of projects (grant number 2017M620885); Beijing Natural Science Foundation (grant number 9162002).
Acknowledgments
We would like to acknowledge Beijing Key Laboratory of Big Data Technology for Food Safety and Key Laboratory of Resources utilization and Environmental Remediation for providing a research grant to conduct this work. We express gratitude to the editors for the editing assistance. Lastly, we would like to thank the reviewers for their valuable comments and suggestions on our paper.
Conflicts of Interest
The authors claim that there is no conflict of interest.
References
- Beck, U. The Terrorist Threat World Risk Society Revisited. Theory Cult. Soc. 2002, 19, 39–55. [Google Scholar] [CrossRef]
- Piazza, J.A. Types of Minority Discrimination and Terrorism. Confl. Manag. Peace Sci. 2012, 29, 521–546. [Google Scholar] [CrossRef]
- Perliger, A.; Pedahzur, A. Counter Cultures, Group Dynamics and Religious Terrorism. Polit. Stud. 2016, 64, 297–314. [Google Scholar] [CrossRef]
- Findley, M.G.; Young, J.K. Terrorism, Democracy, and Credible Commitments. Int. Stud. Q. 2011, 55, 357–378. [Google Scholar] [CrossRef]
- Hsiang, S.M.; Burke, M.; Miguel, E. Quantifying the influence of climate on human conflict. Science 2013, 341, 1212. [Google Scholar] [CrossRef] [PubMed]
- Scheffran, J.; Brzoska, M.; Kominek, J.; Link, P.M.; Schilling, J. Climate Change and Violent Conflict. Science 2012, 336, 869–871. [Google Scholar] [CrossRef] [PubMed]
- Horowitz, M.C.; Perkoski, E.; Potter, P.B.K. Tactical Diversity in Militant Violence. Int. Organ. 2018, 72, 139–171. [Google Scholar] [CrossRef]
- Enders, W.; Sandler, T.; Gaibulloev, K. Domestic versus transnational terrorism: Data, decomposition, and dynamics. J. Peace Res. 2011, 48, 319–337. [Google Scholar] [CrossRef]
- Aradau, C.; van Munster, R. The Time/Space of Preparedness Anticipating the “Next Terrorist Attack”. Space Cult. 2012, 15, 98–109. [Google Scholar] [CrossRef]
- LaFree, G.; Dugan, L.; Xie, M.; Singh, P. Spatial and Temporal Patterns of Terrorist Attacks by ETA 1970 to 2007. J. Quant. Criminol. 2012, 28, 7–29. [Google Scholar] [CrossRef]
- Hastings, J.V. Geography, globalization, and terrorism: The plots of Jemaah Islamiyah. Secur. Stud. 2008, 17, 505–530. [Google Scholar] [CrossRef]
- Waheed, A.; Ahmad, M.M. Socioeconomic impacts of terrorism on affected families in Lahore, Pakistan. J. Aggress. Maltreatment Trauma 2012, 21, 202–222. [Google Scholar] [CrossRef]
- Stewart, M.A. Civil War as State-Making: Strategic Governance in Civil War. Int. Organ. 2018, 72, 205–226. [Google Scholar] [CrossRef]
- Findley, M.G.; Young, J.K. Terrorism and Civil War: A Spatial and Temporal Approach to a Conceptual Problem. Perspect. Polit. 2012, 10, 285–305. [Google Scholar] [CrossRef]
- Sivasamy, R.; Njoku, O.A. Mixed average-based fuzzy time series models for forecasting future civilian fatalities by terrorist attacks in south Asia. Int. J. Phys. Math. Sci. 2014, 4, 20–25. [Google Scholar]
- Minu, K.K.; Lineesh, M.C.; John, C.J. Wavelet Neural Networks for Nonlinear Time Series Analysis. Nonlinear Anal.-Real World Appl. 2010, 4, 2485–2495. [Google Scholar]
- Faryal, G.; Wasi Haider, B.; Usman, Q. Terrorist Group Prediction Using Data Classification. In Proceedings of the International Conference on Artificial Intelligence and Pattern Recognition, Kuala Lumpur, Malaysia, 17–19 November 2014. [Google Scholar]
- Dong, Q.L. Machine Learning and Conflict Prediction:A Cross-Disciplinary Approach. World Econ. Polit. 2017, 7, 100–118. (In Chinese) [Google Scholar]
- Blair, R.A.; Blattman, C.; Hartman, A. Predicting Local Violence: Evidence from a Panel Survey in Liberia. J. Peace Res. 2017, 54, 298–312. [Google Scholar] [CrossRef]
- Ivan, S.S. Has the Global War on Terror Changed the Terrorist Threat? A Time-Series Intervention Analysis. Stud. Confl. Terror. 2009, 32, 743–761. [Google Scholar]
- Raghavan, V.; Galstyan, A.; Tartakovsky, A.G. Hidden Markov Models for the Activity Profile of the terrorist Groups. Ann. Appl. Stat. 2013, 7, 2402–2430. [Google Scholar] [CrossRef]
- Adam, S.; Gerald, S.; Anna, N.; Aaron, C. Forecasting the Risk of Extreme Massacres in Syria. Eur. Rev. Int. Stud. 2014, 1, 50–68. [Google Scholar] [Green Version]
- Feng, D.G.; Zhang, Y.; Zhang, Y.Q. An Overview of Information Security Risk Assessment. J Commun. 2004, 25, 10–18. (In Chinese) [Google Scholar]
- Sun, J.G.; Liu, J.; Zhao, L.Y. Research on Clustering Algorithm. J. Softw. 2008, 19, 48–61. (In Chinese) [Google Scholar] [CrossRef]
- Garcia-Escudero, L.A.; Gordaliza, A.; Matran, C. A central limit theorem for multivariate generalized trimmed k-means. Ann. Stat. 1999, 27, 1061–1079. [Google Scholar]
- Madan, S.; Dana, K.J. Modified balanced iterative reducing and clustering using hierarchies (m-BIRCH) for visual clustering. Pattern Anal. Appl. 2016, 19, 1023–1040. [Google Scholar] [CrossRef]
- Birant, D.; Kut, A. ST-DBSCAN: An algorithm to discover spatial-temporal distributions of physical seawater characteristics and a case study in Turkish seas. J. Mar. Sci. Technol. 2007, 60, 208–221. [Google Scholar]
- Teuvo, K. Self-organized formation of topologically correct factor maps. Biol. Cybern. 1982, 43, 59–69. [Google Scholar]
- Wang, Y.M.; Liu, Y.Q.; Li, L.; Infield, D.; Han, S. Short-Term Wind Power Forecasting Based on Clustering Pre-Calculated CFD Method. Energies 2018, 11, 854. [Google Scholar] [CrossRef]
- Sun, G.L.; Song, Z.C.; Liu, J.L.; Zhu, S.X.; He, Y.J. Factor Selection Method Based on Maximum Information Coefficient and Approximate Markov Blanket. Acta Autom Sin. 2017, 43, 795–805. (In Chinese) [Google Scholar]
- Duong, T. Bandwidth selectors for multivariate kernel density estimation. Bull. Aust. Math. Soc. 2005, 71, 351–352. [Google Scholar] [CrossRef]
Figure 1.
Southeast Asia terrorist attack map.

Figure 2.
Southeast Asia terrorist attack death map.

Figure 3.
Evaluation flow chart.

Figure 4.
Calculation flow chart.

Figure 5.
Clustering quality of four algorithms using different parameters.


Figure 6.
Comparison of the clustering quality of four algorithms.

Figure 7.
Partition results.

Figure 8.
Kernel density map.

Figure 9.
Verification results.

Figure 10.
Terrorist attack risk map.

Figure 11.
Effect before and after partition.


Table 1.
Related research.
| Category | Author | Content |
|---|---|---|
| Research from the national scale | Blair R A | Using the 2008 data and neural networks to successfully predict the Liberian conflict in 2010 with accuracy between 0.65 and 0.74 |
| Dong Q | Machine learning based on BP neural network predicts terrorist attacks in India from 2010 to 2016 | |
| Research from time series | Ivan Sascha Sheehan | A time-series approach to investigate the relationship between global strategic armed forces-related incidents and transnational terrorism |
| R. Sivasamy | Using the MABM to fit the civilian casualty data caused by terrorist attacks in South Asia and Predict the Civilian Casualties in 2014 | |
| K. K. Minu | Applying WNN to Terrorist Attack Time-Series of Nonstationary Nonlinear Time-Series | |
| Research from the terrorist attacks | Gohar F | Proposed a new framework for classification and forecasting to predict terrorist organizations |
| Raghavan V | Hidden Markov Models are used to establish a model for the terrorist organization’s activity and detect the sudden situation of the organization. | |
| Scharpf A | Using a power-law distribution based on observations to calculate the likelihood of a single event |
Table 2.
Impact factor data.
| Type of Data | Source | Publisher | |
|---|---|---|---|
| Latitude | Global Terrorism Database (GTD), 1970–2016 | START, University of Maryland (https://www.start.umd.edu/gtd/) | |
| Longitude | |||
| Distance to major navigable lake | G-Econ 4.0, 2011 | Yale University (http://gecon.yale.edu/) | |
| Distance to major navigable river | |||
| Distance to ice—free Ocean | |||
| Average precipitation | |||
| Average temperature | |||
| Ethnic diversity | GeoEPR, the Ethnic Power Relations dataset, 2014 | Center for Comparative and International Studies (CIS), International Conflict Research (http://www.icr.ethz.ch/data/index) | |
| Major drug regions | World drug report, 2016 | Division for Policy Analysis and Public Affairs, United Nations Office on Drugs and Crime (http://www.unvienna.org/unov/en/unodc.html) | |
| Nighttime lights | Nighttime Lights of the World, 2013 | The Earth Observation Group, NOAA (http://ngdc.noaa.gov/eog/index.html) | |
| Population density | Population density of the World, 2015 | NASA’s Earth Observatory (http://neo.sci.gsfc.nasa.gov/) | |
| Topography | Digital elevation model (DEM), 2011 | ||
| POI | Transportation site | Google Places API, 2018 | Google (https://developers.google.cn/places/web-service/intro) |
| Religious places | |||
| Political places | |||
| Catering outlets | |||
| Accommodation outlets | |||
© 2018 by the authors. Licensee MDPI, Basel, Switzerland. This article is an open access article distributed under the terms and conditions of the Creative Commons Attribution (CC BY) license (http://creativecommons.org/licenses/by/4.0/).
Share and Cite
MDPI and ACS Style
Zhang, X.; Jin, M.; Fu, J.; Hao, M.; Yu, C.; Xie, X. On the Risk Assessment of Terrorist Attacks Coupled with Multi-Source Factors. ISPRS Int. J. Geo-Inf. 2018, 7, 354. https://0-doi-org.brum.beds.ac.uk/10.3390/ijgi7090354
AMA Style
Zhang X, Jin M, Fu J, Hao M, Yu C, Xie X. On the Risk Assessment of Terrorist Attacks Coupled with Multi-Source Factors. ISPRS International Journal of Geo-Information. 2018; 7(9):354. https://0-doi-org.brum.beds.ac.uk/10.3390/ijgi7090354
Chicago/Turabian StyleZhang, Xun, Min Jin, Jingying Fu, Mengmeng Hao, Chongchong Yu, and Xiaolan Xie. 2018. "On the Risk Assessment of Terrorist Attacks Coupled with Multi-Source Factors" ISPRS International Journal of Geo-Information 7, no. 9: 354. https://0-doi-org.brum.beds.ac.uk/10.3390/ijgi7090354
Note that from the first issue of 2016, this journal uses article numbers instead of page numbers. See further details here.