Application of Industrial Risk Management Practices to Control Natural Hazards, Facilitating Risk Communication


1
Interdisciplinary Program in Landscape Architecture, Graduate School of Environmental Studies, Seoul National University, Seoul 00826, Korea
2
Department of Landscape Architecture and Rural System Engineering, Seoul National University, Seoul 08826, Korea
3
Research Institute of Agriculture Life Science, Seoul National University, Seoul 08826, Korea
*
Author to whom correspondence should be addressed.
ISPRS Int. J. Geo-Inf. 2018, 7(9), 377; https://0-doi-org.brum.beds.ac.uk/10.3390/ijgi7090377
Submission received: 10 August 2018
/
Revised: 7 September 2018
/
Accepted: 11 September 2018
/
Published: 14 September 2018
(This article belongs to the Special Issue Geospatial Methods and Tools for Natural Risk Management and Communications)
Abstract
:Establishing a comprehensive management framework to manage the risk from natural hazards is challenging because of the extensive affected areas, uncertainty in predictions of natural disasters, and the involvement of various stakeholders. Applying risk management practices proven in the industrial sector can assist systematic hazard identification and quantitative risk assessment for natural hazards, thereby promoting interactive risk communication to the public. The objective of this study is to introduce methods of studying risk commonly used in the process industry, and to suggest how such methods can be applied to manage natural disasters. In particular, the application of Hazard and Operability (HAZOP), Safety Integrated Level (SIL), and Quantitative Risk Analysis (QRA) was investigated, as these methods are used to conduct key studies in industry. We present case studies of the application of HAZOP to identify climate-related natural hazards, and of SIL and QRA studies that were performed to provide quantitative risk indices for landslide risk management. The analyses presented in this study can provide a useful framework for improving the risk management of natural hazards through establishing a more systematic context and facilitating risk communication.
Keywords:
HAZOP; SIL; QRA; risk analysis; risk management; risk communication; natural hazards; climate change1. Introduction
In recent years, climate change has led to increased damage and loss caused by natural hazards [1]. However, establishing tools for the comprehensive management of the risk from natural hazards is challenging due to the extensive areas affected by natural hazards and the uncertainty involved in predicting natural disaster occurrence. Efforts have been made to improve risk management for natural hazards through new IT solutions and geo-information platforms [2,3]; however, such platforms may contain fragmented information and sometimes fail to facilitate communication between decision-makers and the public. This issue might be rooted in the mismanagement of risk information and limitations in the accessibility of risk information. Although the extensive adoption of GIS technology has enabled more informative presentations of hazards, vulnerability, and risk at the local level of decision-making and planning, the end-users of risk information often face difficulties in verifying the correctness and validity of the information due to restricted data access, outdated information, lack of cross-sector communication, and negligence in dissemination [2].
Meanwhile, risk management tools and frameworks have been developed intensively in the industrial sector for decades. Systematically analyzing and adopting such tools for the management of natural disasters may help to reduce the unwanted loss of life, property, and environment caused by natural hazards. The objective of this study is to analyze methods of studying risk that are commonly used in the process industry, and to identify how they can be converted and applied as tools to manage natural hazards and to facilitate risk communication. Communication between decision-makers and the public, knowledge management, and training of public administration are important for managing the risk posed by natural disasters [4,5], and propagation of risk information through a well-constructed risk management framework can increase public awareness and provide better opportunities to reduce the exposed risk. Moreover, disparities have emerged between scientists and policy-makers regarding the use of models and research tools for analyzing the effects of extreme weather due to divergence in their goal orientation [6], but applying risk management tools proven in the industrial sector may contribute to establishing a practical approach for decision-making. Straightforward and forceful tools are also in demand to implement actions for substantial changes [7], and a series of efforts to align exposed risks below tolerable levels through the suggested method can help to satisfy this need.
In general, risk studies are classified into qualitative, semi-quantitative, and quantitative methods. The Hazard and Operability (HAZOP), Safety Integrated Level (SIL), and Quantitative Risk Analysis (QRA) methods are used to conduct key studies in the process industry, and they can be organically connected to form a comprehensive risk management framework extending from risk identification to risk evaluation. HAZOP is a semi-quantitative method that is helpful for identifying cause-and-effect scenarios following changes in the guidewords for each physical parameter [8]. HAZOP is a highly disciplined procedure meant to identify how a process may deviate from its design intent. This method is especially constructive for detecting potential multi-hazard risk by natural harm to a targeted entity that might be otherwise unidentified. SIL provides probability measurements of performance required for a safety-related system to achieve a targeted risk reduction [9]. SIL can be applied to plan periodic inspection activities to reduce the risk below an acceptable level [10], and it can also be used for checking flaws in engineering mitigation measures [11]. QRA is a systematic quantitative approach used to estimate and evaluate the risk to which a study area is exposed [12]. Spatial criteria can be determined to avoid exposing people and properties to a higher than tolerable risk level during site planning. These risk studies can construct a risk management cycle more systematically, moving from risk identification, risk analysis, risk evaluation, and risk treatment to risk acceptance, which is introduced in ISO 31000 [13]. The results of each analysis are often used as input data for the other studies that comprise the risk management cycle. For example, credible cause-and-effect scenarios from a HAZOP study can serve as a basis for conducting SIL and QRA, and results from QRA can lead to new findings for HAZOP and provide evidence for risk assessment during SIL. As a comprehensive risk management framework, the well-established methods and result formats of these industrial risk management practices can enhance the cascading of risk information at each stage of the project life cycle, and risk communication can be improved by providing risk indicator and by encouraging public participation.
In this study, the definitions of HAZOP, SIL, and QRA and their application in various fields are briefly introduced. After the introduction, this paper describes common ways of implementing these risk studies and the methodology for applying them to control natural hazards. As a case study, HAZOP was applied to identify climate-related hazards, and SIL and QRA studies were conducted for landslide risk management. Finally, the characteristics of each method are reviewed, and the possible advantages and shortcomings of applying these methods to natural hazards are discussed, followed by an examination of how to set a framework for risk management and communication for coping with natural hazards. The analysis presented in this study may help improve the risk management of natural hazards through establishing a more systematic context and facilitating risk communication.
2. HAZOP for Identification of Risk by Natural Hazards
2.1. Introduction to HAZOP
Hazard identification is the first step and the most essential part of risk management to ensure safe operations, avoiding unintended failure in a system [8]. HAZOP aims to identify sets of cause–consequence scenarios considering the system response when deviations are generated from design intent or from ordinary operating conditions [14]. HAZOP, in which “hazard analysis” and “operability study” were initially separate components, originated at Imperial Chemical Industries Ltd. in the UK in the late 1960s and spread to Europe and elsewhere [15,16]. Early studies were based on the supposition that process problems can occur when there are deviations from a normal state, and it was used as a tool to analyze hazards in complex systems [17]. Since then, Klertz [18,19,20] researched the HAZOP technique in detail in studies that have gained widespread recognition, and addressed practical issues of hazard identification and analysis through case studies. Nolan [21,22] has discussed HAZOP and what-if studies, and tried to extend the concept to the security field of the process industry, introducing methodology and documentation.
In recent decades, HAZOP has been applied to various fields besides the process industry. It was shown that HAZOP could successfully be applied to computers and transportation systems in addition to mechanical systems [23]. In addition, HAZOP was successfully used to predict traffic problems, and it was also reported to be advantageous for finding newly occurring deviations in a road system in response to adoption of a new technology [24]. Analogous attempts have also been applied to detect problems caused by human errors. For instance, the implementation of HAZOP was discussed to analyze human factors by interpreting guidewords as human mistakes and by adding parameters for human behavior [25]. Kletz [26] discussed the necessity of expanding the factor of human errors for HAZOP, and exemplified the various types of incidents induced by human mistakes. The application of HAZOP can also be extended to climate change issues, and it may be possible for entities such as local governments or general service companies, which may suffer losses from natural disasters, to use HAZOP to identify specific hazards.
2.2. The HAZOP Method
The procedure of HAZOP can be presented based on IEC 61882 [27], as summarized below. The first step in conducting HAZOP is to divide systems to define the scope of the study. The study can start with a description of the system to inform the team before proceeding with a node-by-node examination. Next, a deviation needs to be generated, considering a combination of parameters and guidewords. Parameters are also known as elements, keywords, or properties. Guidewords are the words used to identify and state a particular deviation from a design intent. The combination of parameters with guidewords results in meaning and generates applicable deviations. An illustrative arranged blend of parameters with guidewords is displayed as a matrix in Table 1a, which is a typical set of applicable deviations.
Alternatively, the combinations shown in Table 1a can be converted to those shown in Table 1b when we consider climate change issues to identify deviations with suitable combinations of guidewords and parameters. To generate deviations caused by climate-related natural hazards, parameters of climate exposure, such as temperature, rain, and wind, can be used to replace the physical parameters of a typical process. Combined with suitable guidewords, deviations that lead to damage by natural hazards can be derived, such as heavy rain, drought, storm, flooding, landslides, sea level rise, abnormally high temperatures, and so on.
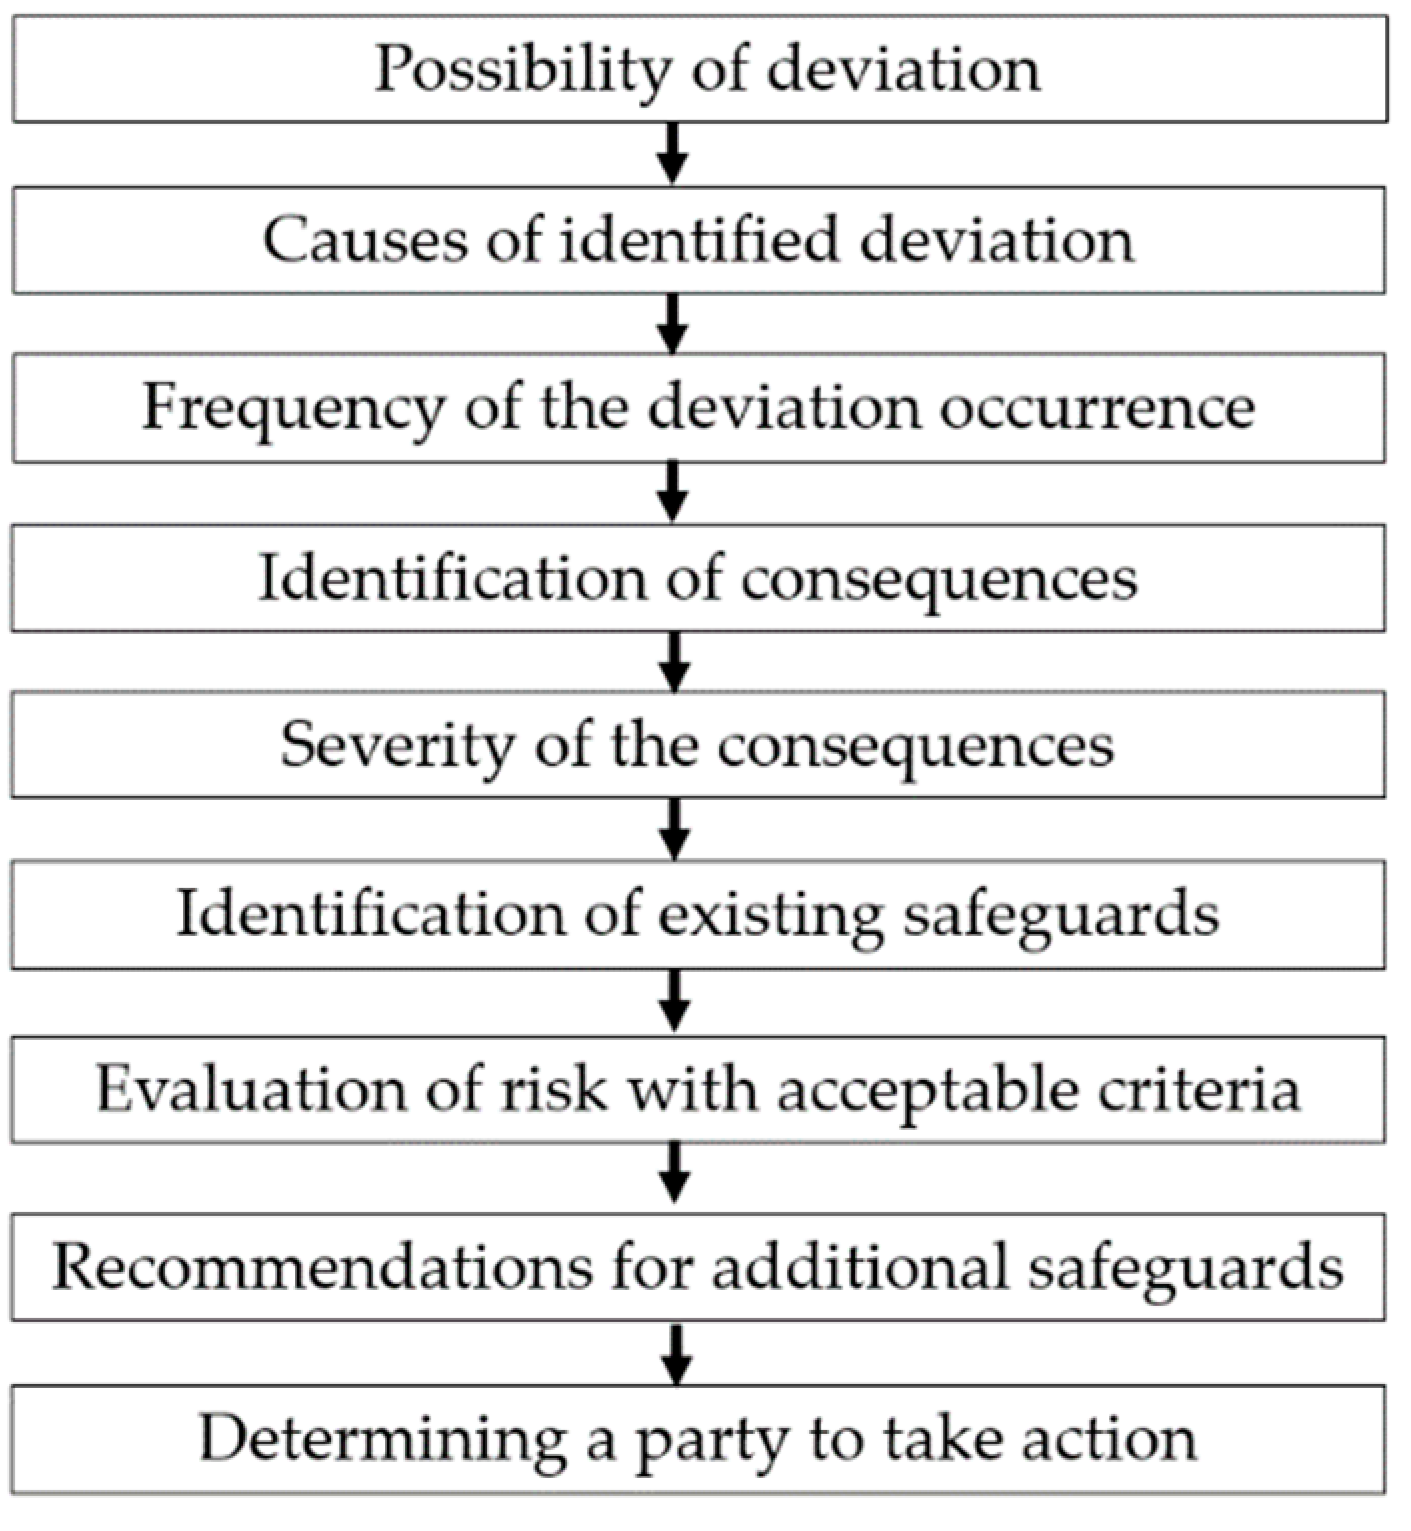
After setting up parameter–guideword combinations, a study can be conducted following the flow shown in Figure 1. Once it is decided whether a deviation results in causes, the possible causes are established through a multi-disciplinary team discussion. The expected frequency of initiating causes needs to be addressed, but without considering existing safeguards. Consequences should be considered to complete the cause–consequence scenario, and the severity of consequences need to be stated under the categories of loss of life, property, environment, or reputation of an entity. Before risk evaluation, existing safeguards in a plan, design, or operating condition should be considered as mitigating measures in order to avoid overestimating the level of risk. At the stage of risk estimation and evaluation, a risk matrix can be used to decide acceptability. Risk scenarios above the acceptable risk criteria are identified as high-risk items and screened for possible recommendations. The acceptable risk criteria on the risk matrix may be developed in variable sets depending on the nature of entities and the environment. Finally, recommendations are provided to correct deficiencies of design or omission of operational planning to reduce risk to below an acceptable level. Importantly, recommendations should be presented to a party that will carry out an action to resolve the raised issues. This series of steps is used as a procedure for finding a credible cause–consequence relationship that results from a deviation. A HAZOP study can be conducted quantitatively if the frequency of the initial cause and the magnitude of consequences are estimated numerically.
The sequence of a HAZOP study can be presented in the order shown in the worksheets in Table 3 for the HAZOP case study, as such a system enables the systematic reporting of causes and consequences. It contains columns to be filled with content established during a HAZOP session, including deviations from parameter–guideword combinations, cause–consequence scenarios estimated in a quantitative manner, and recommendations, together with an indication of the party designated to carry out actions before the due date. This worksheet should be filled out for each node. In the context of controlling natural hazards, the nodes could consist of services, infrastructure, or facilities of an entity, such as transportation, electricity, water supply, and sewerage networks. The specific content of the nodes is expected to vary in accordance with land use patterns in residential, commercial, industrial, rural, and forest areas.
2.3. A Case Study of HAZOP for Identifying Natural Hazards
The following checklist in Table 2 and HAZOP worksheet on Table 3 are part of a sample case study for an enterprise that we have developed to identify various incident scenarios when exposed to natural hazards by extreme weather events. The checklist was designed to reflect the likelihood and severity of risk factors for the company caused by abnormal weather conditions on a qualitative scale. In contrast, the HAZOP worksheet shows how the risks identified using the checklist can be analyzed more specifically and documented in a logical order.
3. SIL for the Assessment and Treatment of Risk by Natural Hazards
3.1. Introduction to SIL
SIL was presented in IEC 61508 by the International Electro-Technical Commission as a measure of the probability that a safety function in a certain system performs a desired action properly [9]. SIL literally refers to the discrete level of safety integrity requirements that is expected to be met by a safety function. It consists of four levels in the IEC standard, from the lowest level of SIL 1 to the most stringent level of SIL 4, to be assigned in a safety-related system. To apply the concept to random natural disasters with a low frequency of occurrence, the measures proposed for the low-demand mode can be referred to. The targeted failure measures of average probability are shown in Table 4.
The SIL was originally developed for safety-related systems embedded in an electrical, electronic, or programmable electronic device. SIL studies are used in the process industry to prevent losses of life, environment, or assets by accidents such as fires, explosions, toxic material releases or mechanical failures. This approach to functional safety is widely used in various industries to protect humans, the environment, and material assets against hazardous events, as after the inception of SIL, its use spread to system integrators and to manufacturers [28]. However, it is possible to use the concept for managing risk by natural hazards if we consider a safety function as a barrier to minimize any damage by a natural disaster.
To apply the SIL concept for natural disasters, the safety function to prevent losses by natural hazards should be defined first. For landslides, prevention of a landslide through monitoring activities followed by warranted mitigation measures was considered to be the safety function in this study. By applying the SIL concept to natural hazards, it is possible to obtain probability measurements for the performance required for the safety function, which enables the quantitative calculation of risk to meet a targeted risk reduction factor [9]. Prior to conducting SIL, it is necessary to review a hazard identification report such as HAZOP to determine additional safety barriers [29].
3.2. The SIL Method
IEC 61508 states that a SIL study should be implemented following the overall safety lifecycle introduced in the standard as a technical framework [9]. The notion of life cycle assessment has been presented in various disciplines, such as economics, biology, anthropology, and also in the field of security [30]. The overall safety lifecycle in IEC 61508 includes the steps from planning to retirement, and consists of design, realization, validation, maintenance, and decommissioning stages. The overall safety lifecycle is constructed to achieve the desired safety integrity level of the safety-related system based on a more systematic approach. The purpose of the safety life cycle can be understood as a sequential process of analyzing a safety-related problem, designing a solution, and verifying that the problem is substantially resolved as intended [31]. This study is limited to SIL within the scope of the design stage. To comply with the standards, a SIL study at the design stage is divided into SIL classification to determine safety requirements and SIL verification to calculate the reliability of a safety function [32].
SIL classification aims to determine the target SIL for an individual safety function in a system, whereas SIL verification is a way to ensure whether the targeted SIL can be satisfied by calculating the probability of failure on demand (PFD) afterward. The numeric calculation of reliability with the PFD is a common technique used to design safety interlock in process systems [33], and this risk-based approach is widely implemented in the process industry and structural safety management as part of adopting reliability engineering [11,34,35]. The PFD calculation is conducted by using the failure rates of devices that comprise a safety-related system, and it normally involves a communicating connection of sensors, programmable logic solver, and final actuating elements [36].
To apply SIL to control natural hazards, the frequency of occurrence of natural disasters, which corresponds to the failure rate of mechanical components, needs to be identified. The probability of disaster occurrence should also be calculated in the same manner as the PFD calculation. Furthermore, a systematic classification of natural hazards, as in a SIL study, is required to assign safety requirements. Below, we present SIL classification and SIL verification methods separately, examining how SIL studies can be applied for landslide prevention.
3.2.1. SIL Classification
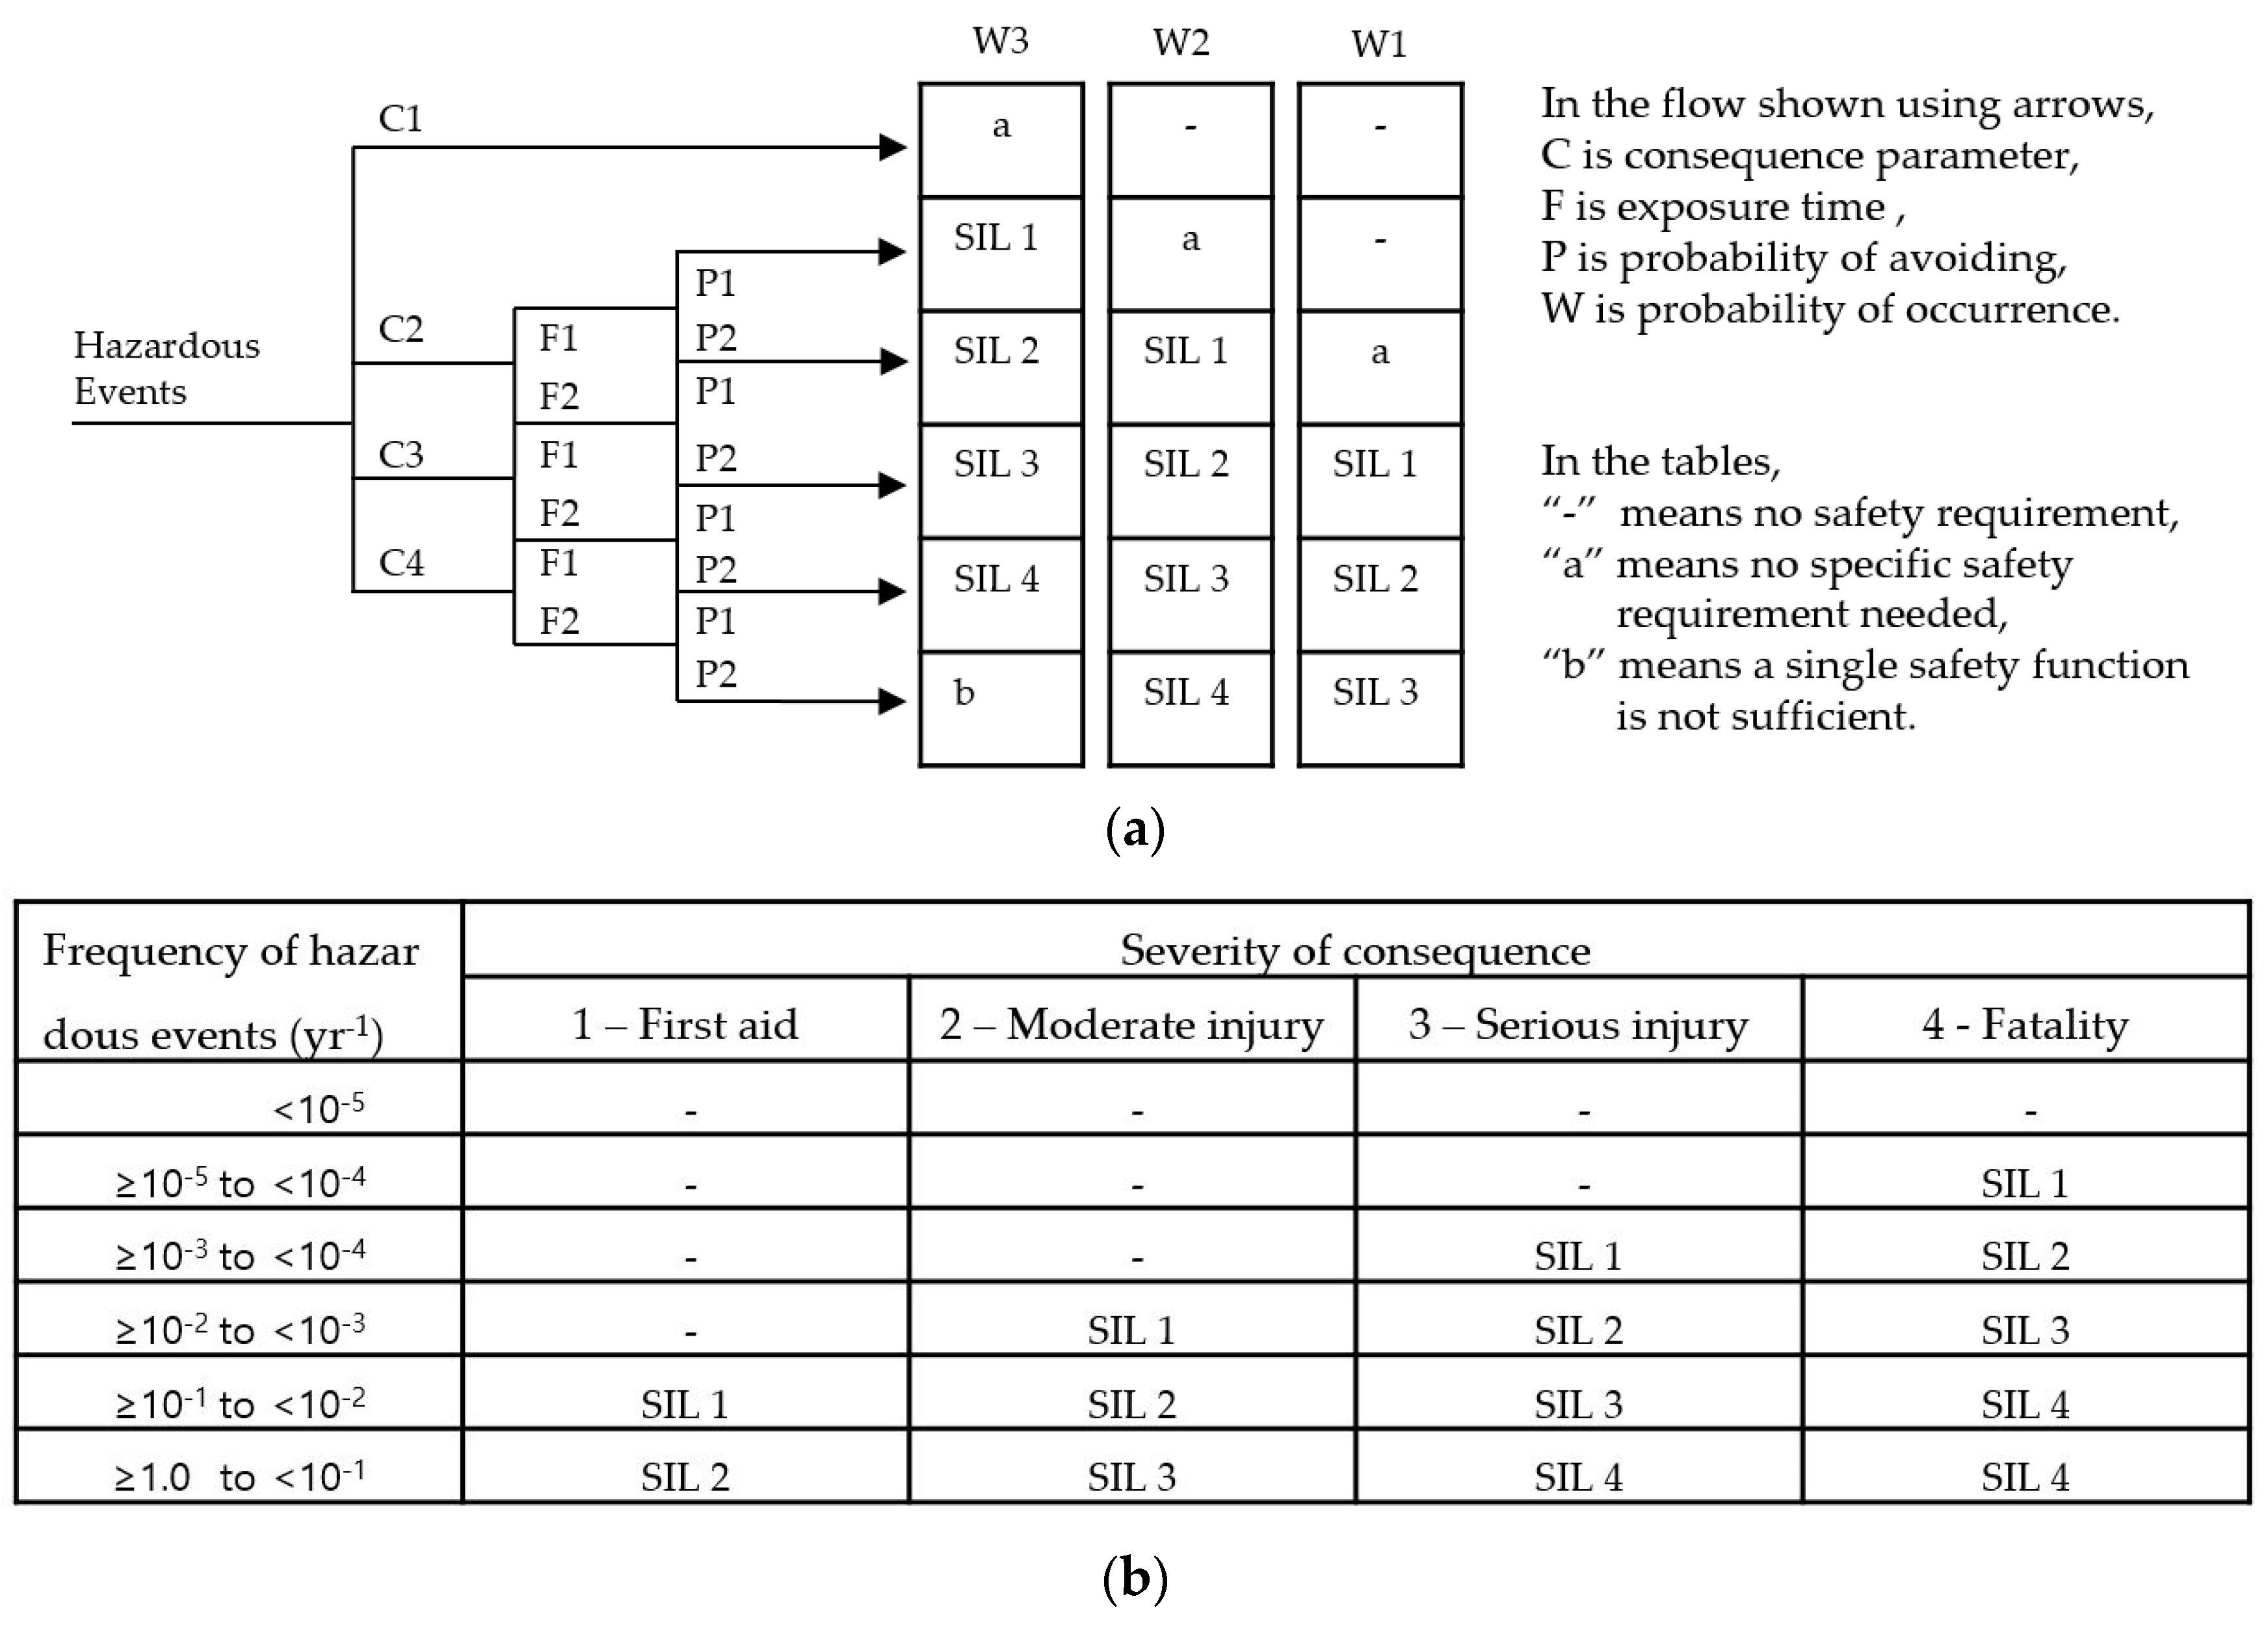
A SIL classification study can be conducted using the risk graph, risk matrices, or Layer of Protection Analysis (LOPA) methods [36]. The common purpose of these methods is to specify the targeted SILs for safety functions. The procedures contain a scheme of risk-based analysis, in which a numerical level is selected for the safety requirement. The risk graph method includes four parameters for selecting a risk level: consequences of the event, frequency of exposed time, possibility of avoidance, and probability of unwanted occurrence [9]. The risk matrix method includes two parameters of risk, severity of consequences and likelihood of the event; however, it can be used as a more quantitative method than the risk graph method. When values and ranges are quantitatively developed to describe adverse impact on life, environment and property, the matrices type of risk ranking can provide criteria to determine SILs numerically [37]. In this regard, the risk matrices method is more quantitative than the risk graph method [38]. Considering the efficiency and complexity needed for a given case, entities can choose the method that best suits their purposes. Examples of risk graph and risk matrix models are shown in Figure 2. Through the LOPA method, which is more quantitative, various safety barriers, including existing safety devices and procedural control measures such as inspections, are assessed, and the requirement for additional independent protective layers is determined based on a targeted risk tolerance level [39].
The SIL classification method can be used in various ways to establish safety requirements that protect against natural hazards. For landslides, which we selected as a case study, it was possible to use a landslide susceptibility map to determine the desired safety integrity levels. A landslide susceptibility map can be produced through logistic regression or other methodologies to show the landslide hazard grades, and it can be interpreted as a process for determining a targeted safety requirement. If a hazardous landslide grade is identified in a certain location, stringent management and robust mitigation measures are required to achieve a higher risk reduction effect than is possible for the other areas, provided that the same conditions of vulnerability for elements as described in Varnes’s risk formula are assigned [40].
3.2.2. SIL Verification
After determining the desired safety level, a verification process should be performed to ensure that the safety function meets the targeted safety requirements. SIL verification is a process for proving that a safety function satisfies the required SIL by calculating the average probability of failure on demand (PFDavg), and it can be performed through a reliability analysis or Markov analysis [41]. The reliability analysis method was used for this case study, and the PFDavg calculation showed the degree to which a safety function reliably fulfilled the requirements. Reliability is commonly defined as the probability that an item performs its purpose adequately during the desired time period under certain operating conditions [42]. It is possible to identify the variables that are needed to describe probability of natural disaster occurrence from the context of reliability definition.
The probability of landslide occurrence can be derived from the concept of reliability. Reliability R(t) and unreliability F(t) can be expressed mathematically as shown below [43]:
where Ns is the number of surviving items, N is the number of total items, λ is the failure rate, t is the specific time.
R(t) = Ns(t)/N
F(t) = 1 − R(t) = 1 − e−λt
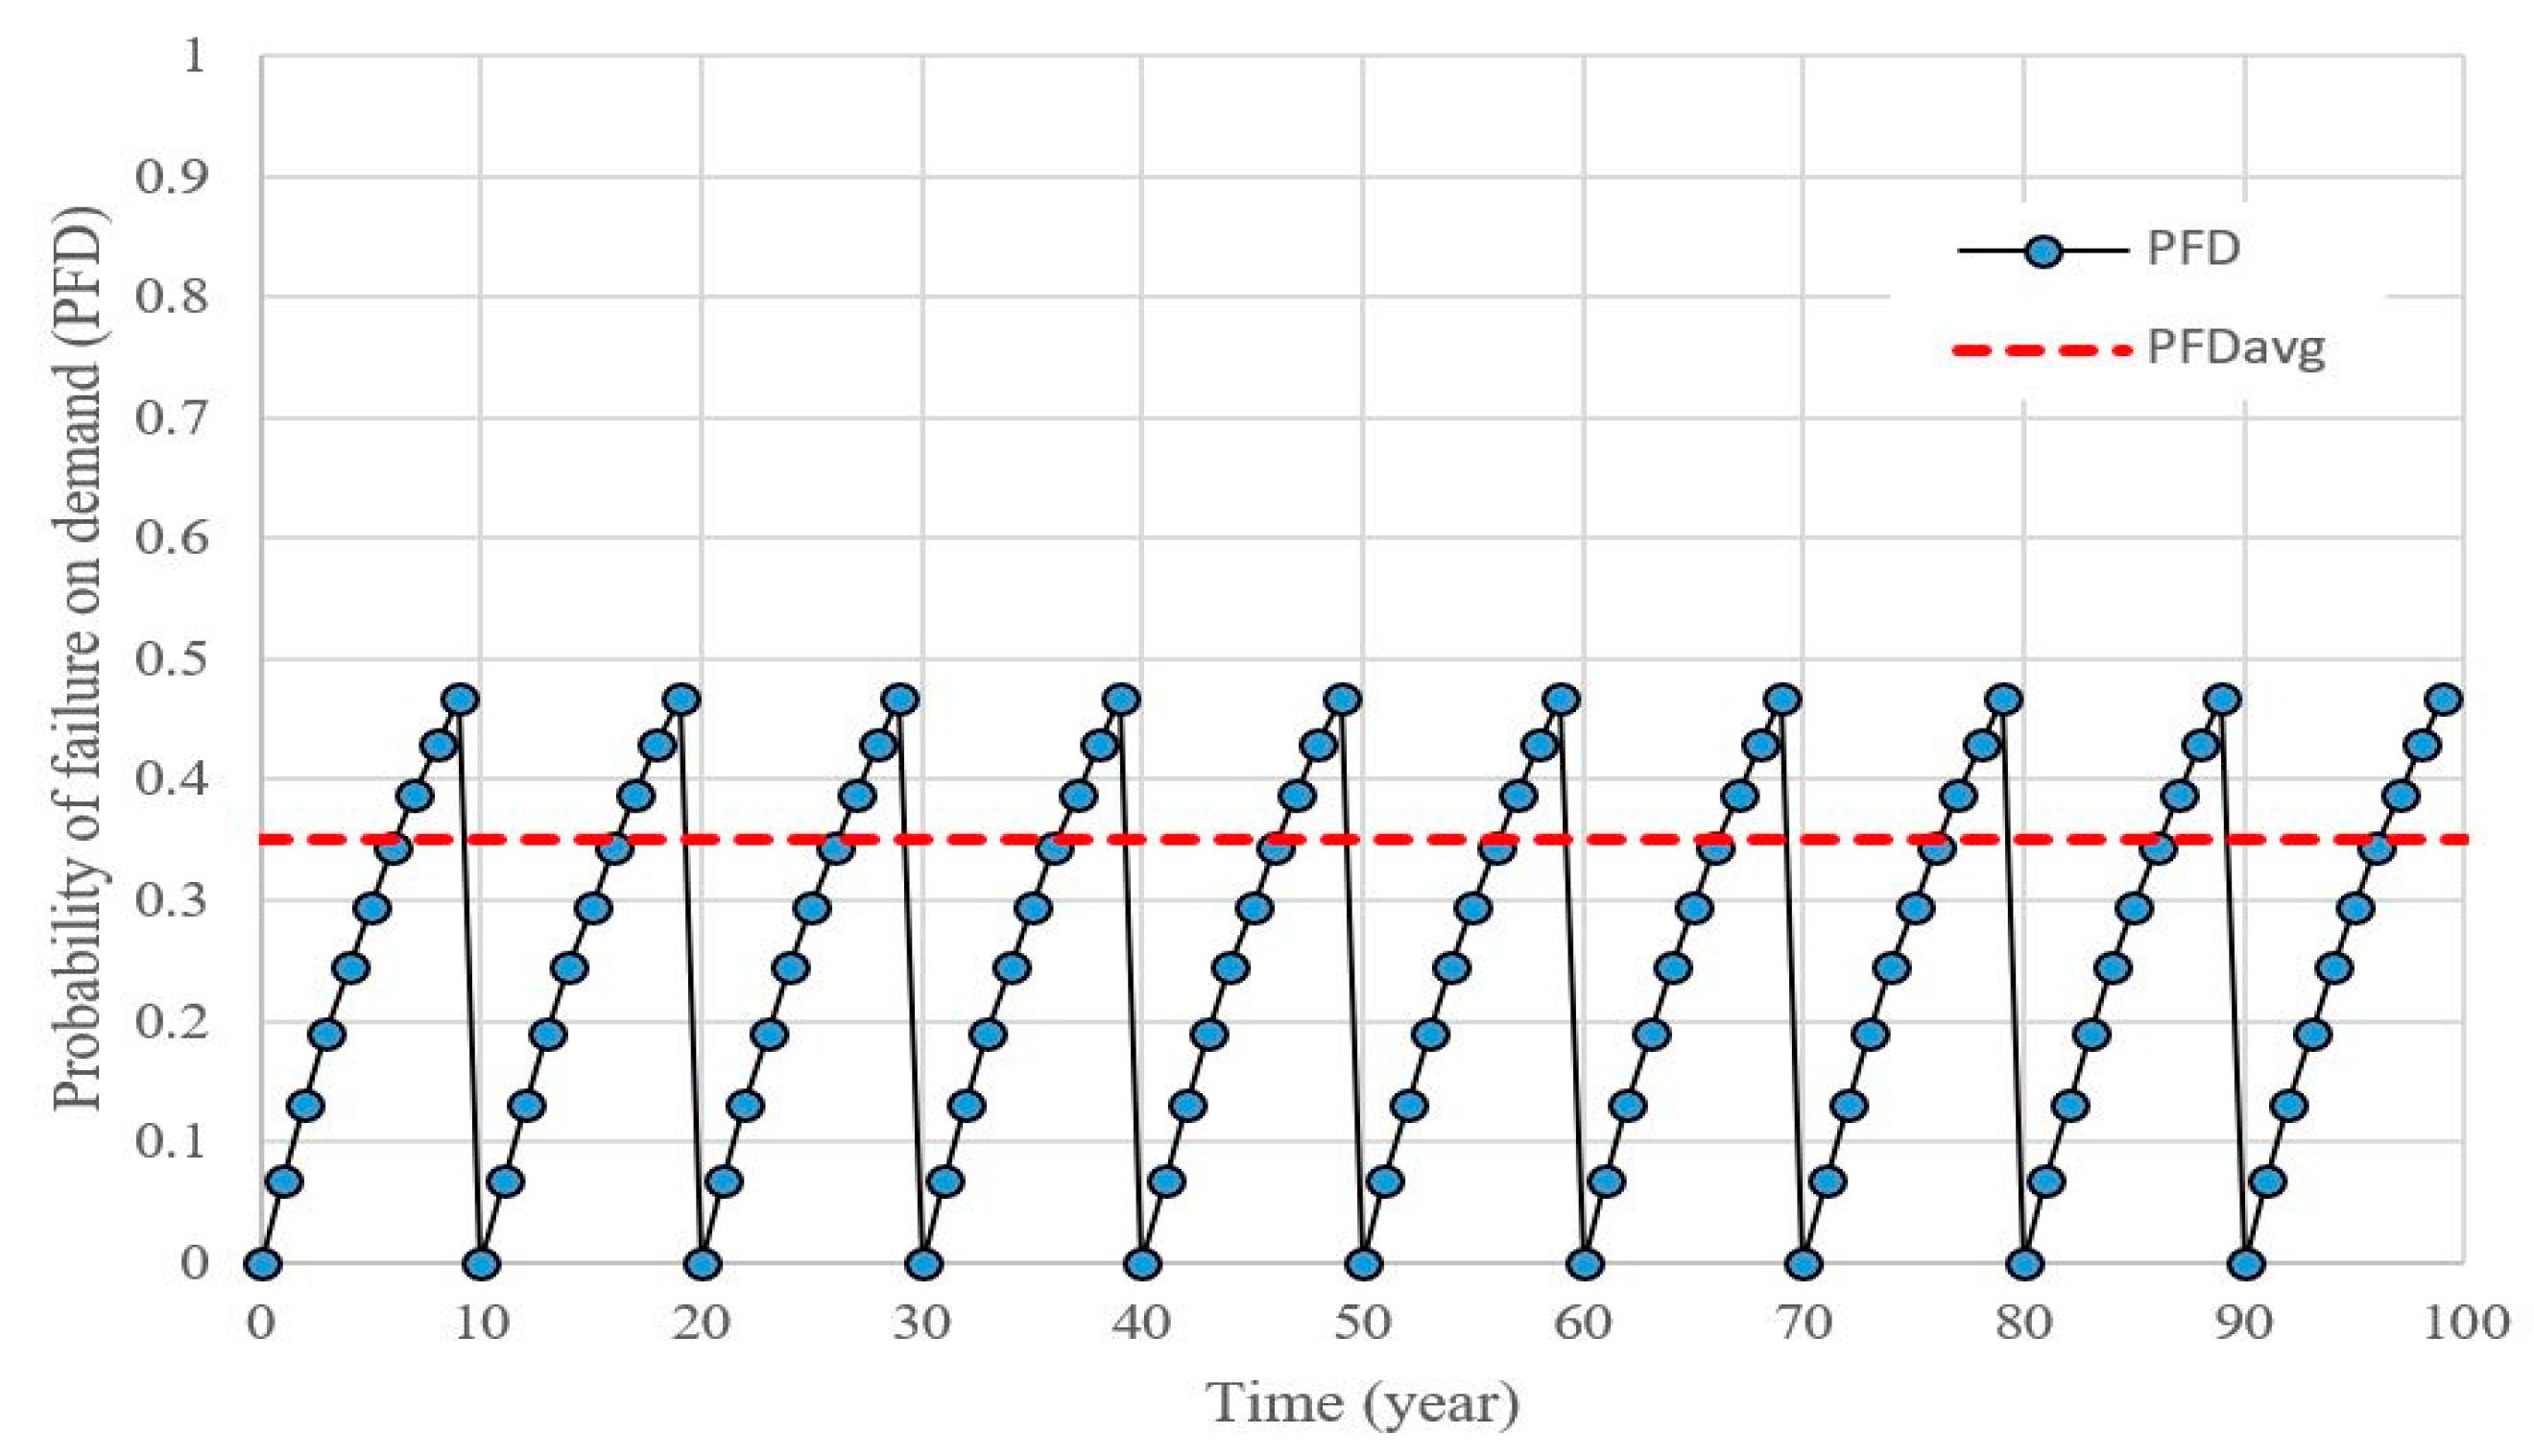
When the number of surviving items Ns is regarded as the number of locations where landslides have not happened, the value of N minus Ns can be considered as the number of locations where landslides have occurred. If the specific time (t) is regarded as the period of time for observing landslides, the failure rate (λ) can be deemed as the frequency of landslide occurrence, which is used to denote the probability of landslide occurrences. According to the ISA-TR84 [44], PFDavg is expressed by the equation below, and a graphical illustration of the equation is shown in Figure 3:
where TI is the time interval between the proof tests.
This explains how the average unreliability can be managed to be below the desired level of risk, which corresponds to the probability of landslide occurrence in our case study. Provided that the safety function for preventing landslides is performed well by the authorities, the average probability of landslides can be managed in static conditions with periodic monitoring activities followed by proper mitigation measures. It is possible to estimate the controlled risk levels by calculating PFDavg, and the resulting measures enable a judgement to be made regarding whether safety requirements have been met.
3.3. Case Study of SIL for Managing Landslide Hazards
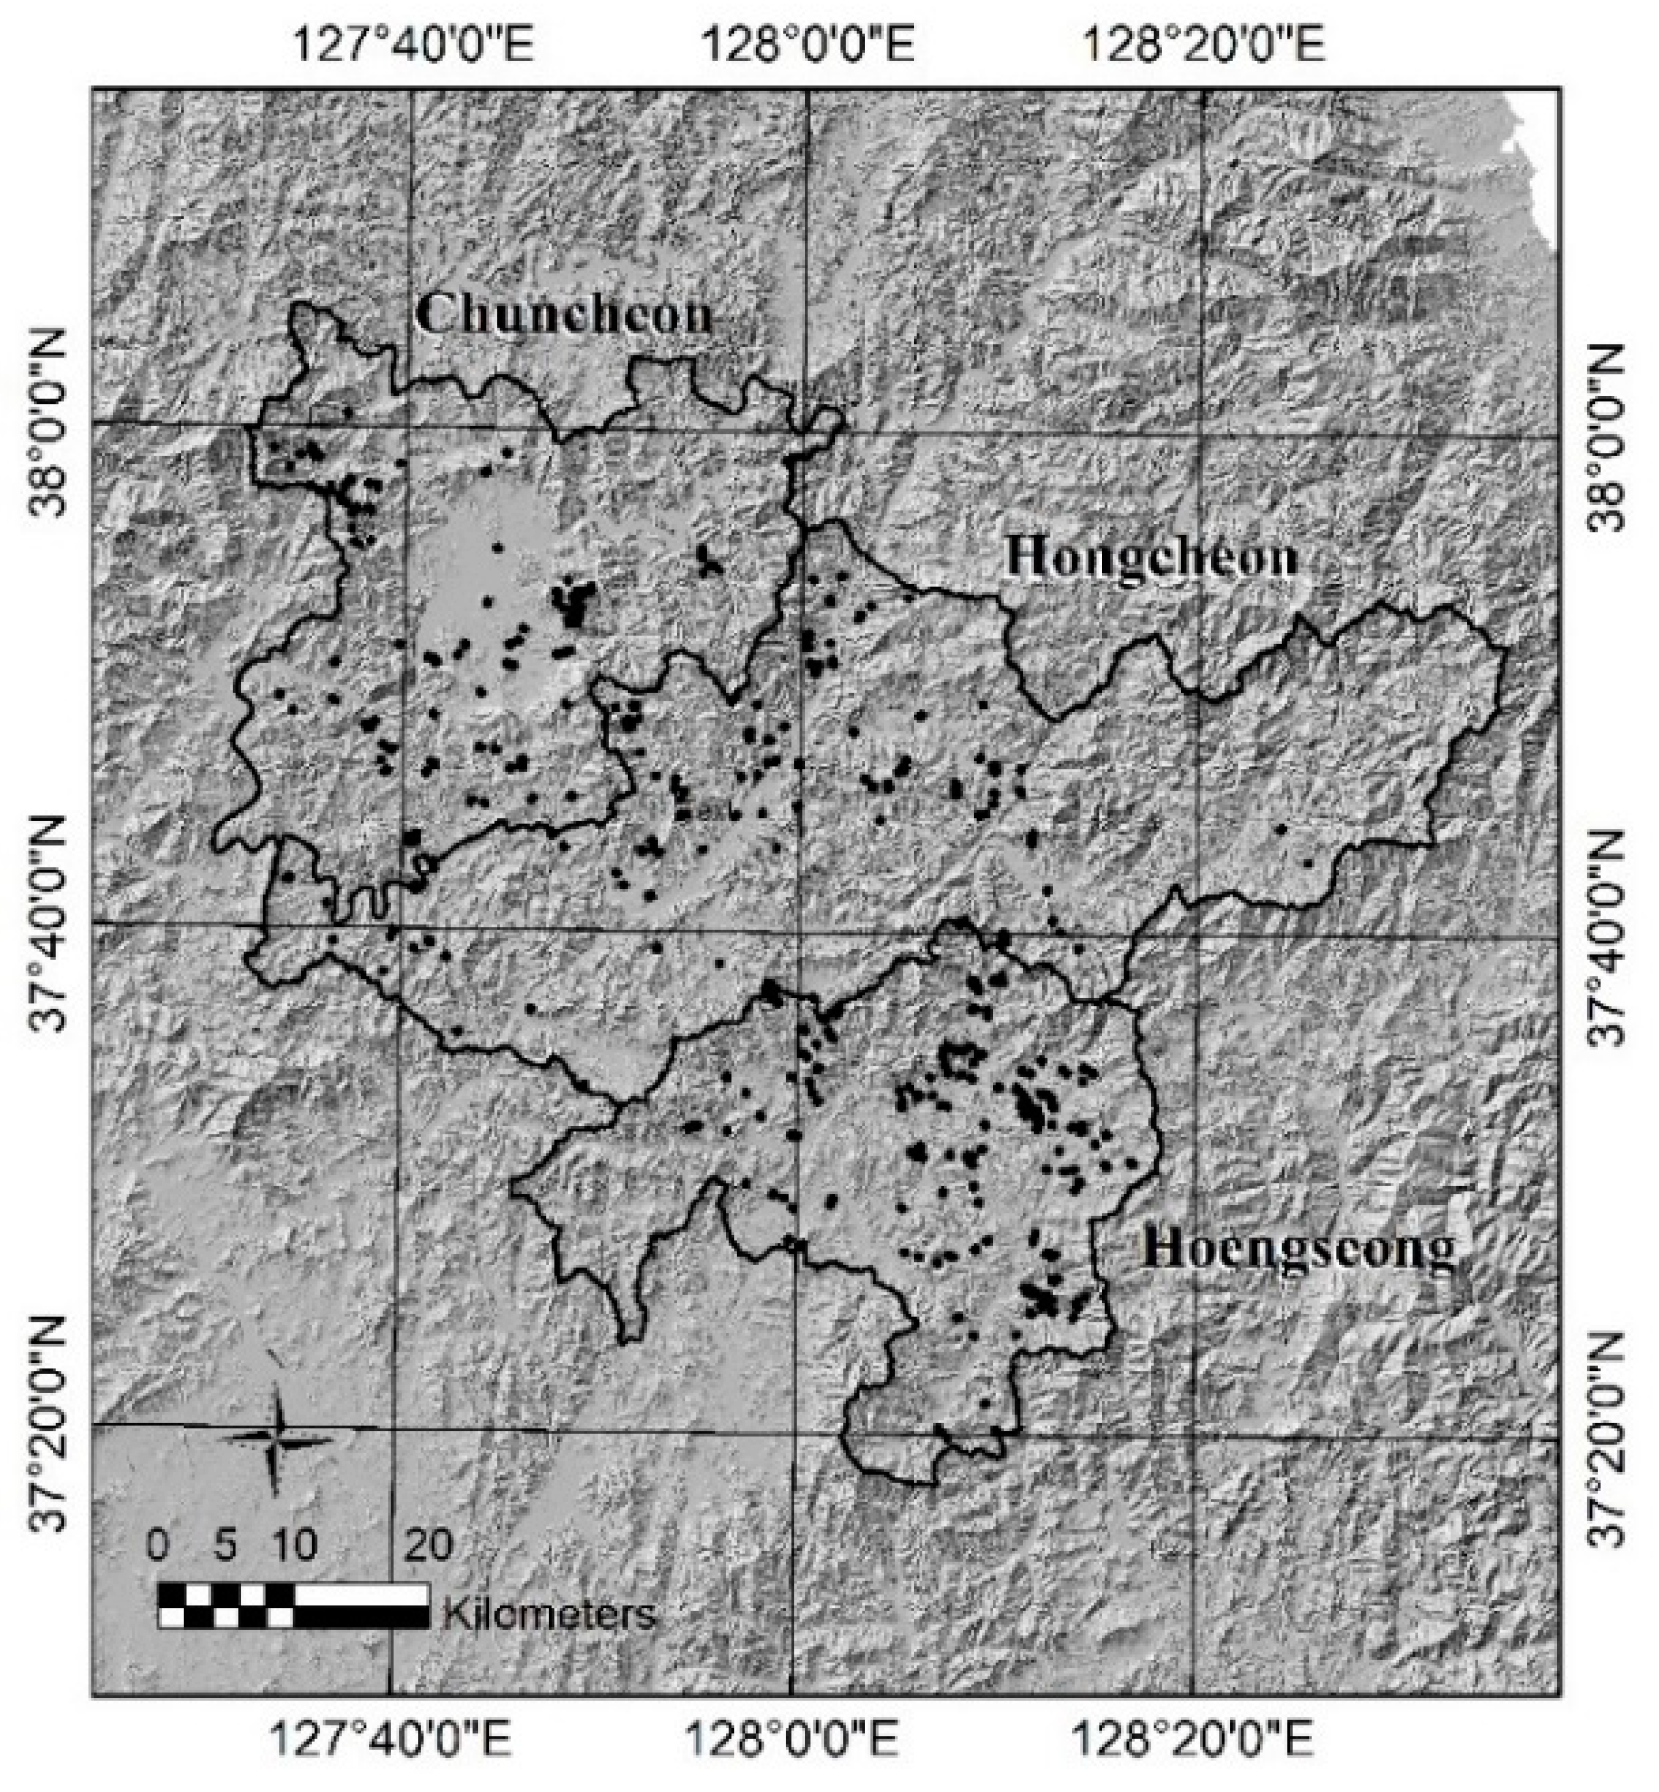
As a case study, we analyzed the probability of landslide occurrence in the region of Chuncheon, Hongcheon, and Hoengseong Counties in South Korea to explore the application of SIL as a way to suggest cost-efficient strategies for managing landslide risk. These three counties are located in the middle of Gangwon Province. The provincial government is headquartered in Chuncheon County, which serves as the administrative center of the local government. We used a landslide inventory dataset from a single weather event, when Typhoon Ewiniar brought severe damage to the region in July 2006, due to the limited availability of inventory data. The locations where landslides occurred in these three counties are shown in Figure 4.
To classify safety requirements, different hazard grades in the landslide susceptibility map produced by the Korea Forest Service in 2012 were regarded as target SIL requirements. Using the hazard grades throughout the region as assigned SILs, the locations exposed to a higher landslide hazard grade were considered to be those that required more stringent safety management for loss prevention. As a result, the frequency of landslides according to landslide hazard grade was estimated, as shown in Table 5. The detailed methodology and conceptual background for estimating the frequency of landslide occurrence from single weather event data were discussed by Lee et al. [10].
We used a rainfall threshold to estimate the frequency of landslide occurrence, and 10 years of weather data over the region were reviewed to identify rainfall events exceeding the threshold. Three events in the 10-year period were screened because they exceeded the criteria of the rainfall threshold. Thus, the probabilistic return period for landslide occurrence was approximated as 3.3 years. The concept of the rainfall threshold for inducing landslides was introduced by Caine [45], and its relationship with rainfall duration and intensity has been examined by researchers to identify the most suitable correlation [46]. In this study, cumulative precipitation of more than 200 mm for 48 h and daily rainfall intensity over 150 mm were selected as the rainfall threshold based on a local research report [47].
Using the resulting frequency, PFDavg was calculated based on Equation (3) to determine differences in the probability of landslide occurrence for different time intervals. Table 6 shows the average probability of landslide occurrence, and it presents variation in the time-dependent reliability of slope stability.
Based on this result, it can be seen that Grade 1 areas require more stringent safety requirements to compensate for the approximately 40-fold gap of PFDavg when compared to Grade 4 in the study region. In SIL verification studies, this concept is often expressed as the risk reduction factor (RRF) for lowering the risk below a desired level. To achieve the targeted RRF for Grade 1 (i.e., for it to be in line with Grade 4), the safety function, which ranges from monitoring to proper mitigation, needs to be adjusted more strictly. More frequent implementation of valid landslide monitoring or the additional installation of robust mitigation measures are sample strategies for reducing the probability of landslide occurrence. The results in Table 6 can provide technical guidance for decision-makers as to when a mitigation measure must be put in place in order to manage landslide risk, and this enables the effectiveness of a safety function to be verified in a quantitative manner. For safety functions for preventing landslides, safety can be strengthened through more frequent monitoring followed by non-structural mitigation measures, such as early warning and emergency evacuation, or it can be reinforced by installing structural mitigation measures such as trenches, retaining walls, and check dams. The approach of managing the probability of landslide occurrence by periodic monitoring with warranted mitigations aiming at the same level of risk reduction has been discussed by Lee et al. [48].
4. QRA for the Evaluation and Acceptance of Risk by Natural Hazards
4.1. Introduction to QRA
There is always the possibility of disasters, even if we identify natural hazards and take steps for risk management based on an analysis of the probability of occurrence using the HAZOP and SIL approaches. Therefore, to minimize losses from disasters, more precise prediction is needed through simulations based on physical models to determine the extent of damage that can occur in various areas under various weather conditions. QRA provides a methodology to estimate the magnitude of the consequences of hazardous events considering the likelihood of their occurrence, and presents quantitative risk indices for the elements at risk, which could be people, environments, property, or even reputation.
The definitions of QRA vary; Freeman [12] introduced QRA as a methodology for risk assessment with the goal of developing cost-effective strategies for risk reduction. QRA originated in the early 1970s in the nuclear power industry [49]. QRA is also widely used for chemical process risk assessment, and it is a regulatory requirement in many countries for planning new facilities and for operational changes [50]. QRA has also been extensively adopted for analyzing construction safety, the fire safety of buildings, food safety, and so on [51,52,53].
QRA has been actively applied in the field of natural disasters, and various studies have discussed applying QRA to natural hazards affecting people and assets. Guzzetti [54] discussed applying the risk analysis to landslides, and Dai et al. [55] discussed the use of the F-N curve by UK-HSE for analyzing the potential societal risk posed by landslide hazards. Zêzere et al. [56] and Remondo et al. [57] sought to introduce more accurate quantitative measures in landslide risk analysis, and Jaiswal et al. [58] detailed the magnitude of landslide consequences in risk calculation by considering the run-out distance with volumes estimated based on empirical data. Van Westen et al. [59] addressed the difficulties in quantitative landslide risk analysis due to a lack of landslide inventory data and limitations in runout modeling and estimating landslide vulnerability. However, more accurate quantitative analyses have recently been made possible by physical modeling based on hydrology.
The use of a physical model, which represents a major advance from the previous practice of frequency estimation through incomplete historic data, indicates whether damages will be actually caused by natural hazards in given topographic, geologic, and meteorological conditions. The model result can provide technical guidance to estimate the possibility that an element at risk will be damaged in a certain location at a specific time. In the case study, we conducted QRA to analyze the extent of the areas affected by potential landslide based on a physical model, the Transient Rainfall Infiltration and Grid-based Regional Slope-stability analysis (TRIGRS) model.
4.2. The QRA Method
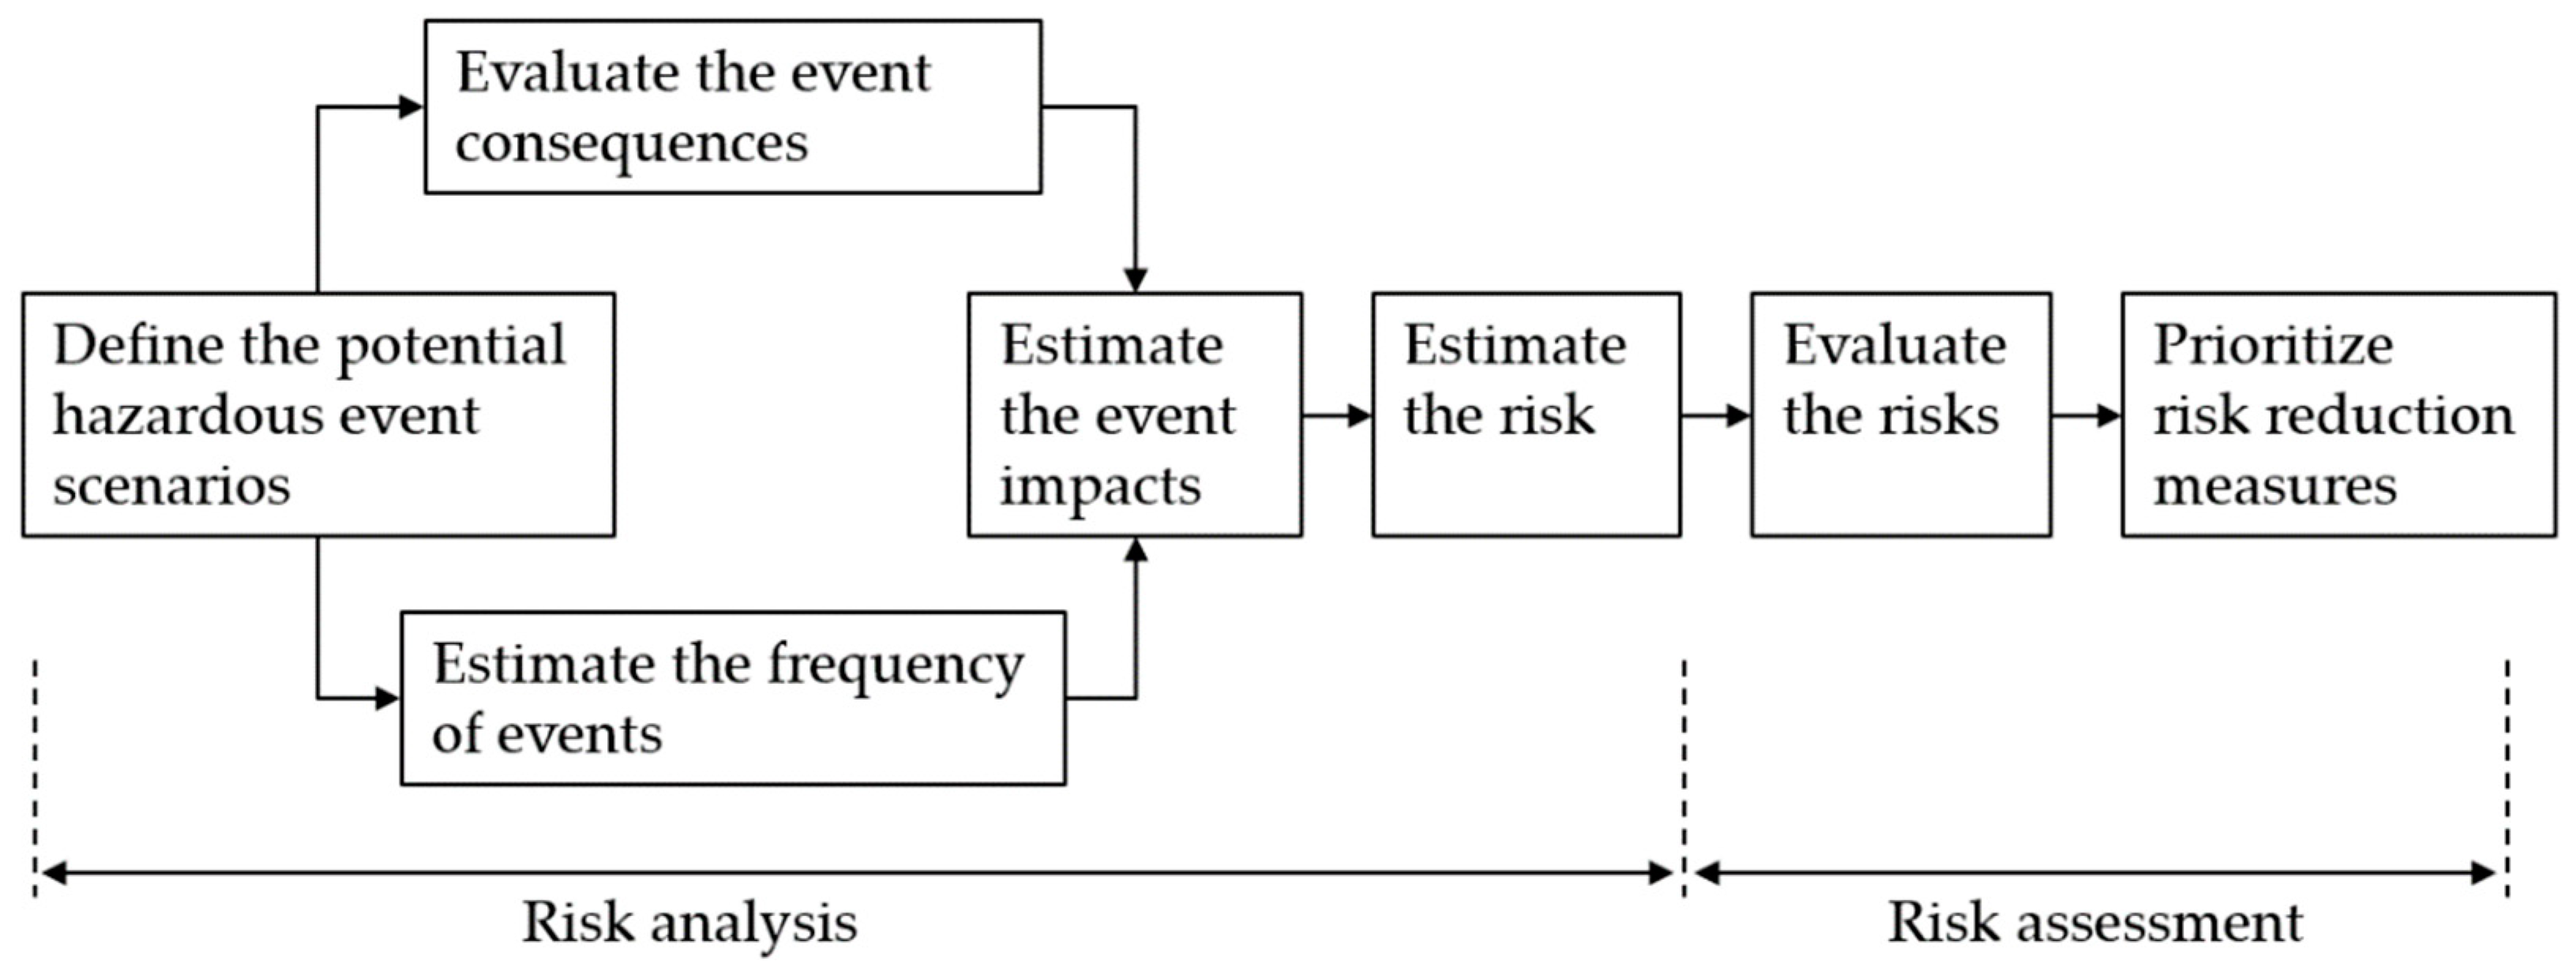
The methodology of QRA can be summarized in the steps shown in Figure 5. The overall process of QRA consists of two parts: risk analysis and risk assessment. The first step, risk analysis, involves defining potential events and incidents. This step is related to hazard identification, and HAZOP results can provide insights into hazardous scenarios. The next step is to construct the risk analysis, including an evaluation of consequences and an estimation of frequencies. Consequence Analysis (CA) is commonly implemented to reflect the results of modeling fires, explosions, or toxic releases in the process industry, and the use of physical modeling to simulate the outcomes of landslide incidents can be considered as an example of CA. For the frequency analysis, the likelihood of hazardous events can be estimated systematically by employing event tree analyses (ETA) and fault tree analyses (FTA), assuming that the events are independent of each other [60]. After the analysis of consequences and frequencies, the adverse impact on elements at risk must be estimated. If the consequences of natural events are found to pose no hazard to people or properties at any frequency, the risk can be considered negligible. Otherwise, further analysis of frequency is required to evaluate the risk, combining the potential consequences with the frequency of events. In the risk assessment process, the risk should be reviewed first in light of acceptable criteria. If the risk exposed to the elements is considered to be excessive, a risk reduction measure needs to be found and prioritized cost-effectively. When applying the QRA method to natural hazards, the selection of components and techniques in the QRA steps can be flexible, as long as the natural disaster scenarios are well defined, and the results of the risk evaluation are sufficiently analyzed.
4.3. Case Study of QRA to Manage Landslide Hazards
As a case study for landslide hazards, we conducted a simplified QRA in a way that could be applied for planning a pension resort. In Gangwon Province in South Korea, there is a demand for constructing pension houses for leisure purposes on hillsides in mountainous regions that are rather vulnerable to landslides. Assuming that the pension resort that already exists in the upper left corner of Figure 6a has a plan to open a branch on the other side of the mountain slope across the river, we calculated the quantitative risk that the pension house user would be exposed to landslides. It should be noted that we did not intend to apply QRA for the currently existing building in order to avoid potential implications for property values; instead, the case study was conducted for the possible selection of a new location in the planning stage.
We used the TRIGRS model by USGS to perform the consequence analysis, and the model was developed to simulate shallow landslides induced by rainfall with a presentation of timing and distribution. This model computes the transient pore-pressure changes using input variables of the rainfall infiltration, hydraulic properties, and slope stability, and displays results for the factor of safety over the grid area [61]. The study area is a northwest slope, as shown in Figure 6b, and the total modeling area is about 1 km2 with a pixel unit of 30 m × 30 m. For the frequency estimation, the return period was estimated by reviewing the weather data. First, we evaluated whether a landslide occurred under the condition of 200 mm of rainfall for 48 h, which is a threshold proposed by local researchers. Next, we evaluated the possibility of landslide occurrence in conditions of 800 mm of daily rainfall, which is the maximum daily rainfall intensity recorded over approximately 100 years from 1904 to 2010 in South Korea [62].
As shown in Figure 6c, when new construction was planned at location A, it was predicted that landslides would not affect the planning location, as a safety factor greater than 1 was shown with the rainfall condition of 200 mm for 48 h. However, the continuous simulation result with the rainfall condition of 800 mm per day indicated that landslides could damage the planning area, as shown in Figure 6d. Therefore, the frequency of potential damage by landslides at the planning area was estimated to be 0.01 event per year. Additionally, in order to reflect real-world conditions in the risk calculation, further consideration should be given to the runout factor of debris and sediment, the occupancy factor by use time, and the vulnerability of different building types. It should be noted that variables other than rainfall conditions were arbitrarily selected for the modeling demonstration, without a field survey. This study focused on discussing the approach and methodology for risk management and communication. The individual risk can be evaluated from the risk function below [63]:
where R(I) is the individual risk in terms of annual loss of life, P(H) is the probability of landslide events, P(L) is the probability of spatial impact by landslides considering the runout distance, P(O) is the temporal probability by occupancy, V(B) is the vulnerability of individuals by building type.
R(I) = P(H) × P(L) × P(O) × V(B)
Based on this formula, the annual individual risk (IR) of the case was calculated using the best available assumptions as follows:
IR = 0.01 × 0.6 × (0.3 × 0.7) × 0.2 = 2.5 × 10⁻⁴ fatality·year−1
The resulting individual risk, 2.5 × 10⁻⁴ fatalities per year, was estimated, assuming that a rainfall-induced landslide would occur once every 100 years. The probability of spatial impact was selected as 0.6, assuming the probability of the runout distance reaching 20–30 m, which is a distance that can have an effect within a pixel unit. We chose an annual occupancy of 0.3, considering the variation in demand between the high season and the slow season, and a daily occupancy of 0.7 was selected with the assumption that guests will go out for 8 h a day. Finally, assuming that the building type of the pension house was a reinforced concrete structure that was relatively resistant to collapse, the associated vulnerability factor was selected as 0.2.
The resulting IR value is within the As Low As Reasonably Practicable (ALARP) zone presented on the F-N curve by UK-HSE [55], but considering additional safeguards or an alternative location may be required to achieve broad acceptance. Regarding societal risk, if more than 10 people at a time stay at the new pension location in the future, they would be exposed to intolerable societal risk, exceeding acceptable criteria. This case study only reflects an attempt to present the methodology of obtaining a useful measure of risk for planning potential construction, and does not reflect an absolute judgment [64].
5. Discussion and Conclusion
5.1. Application of HAZOP for Risk Communication Regarding Natural Hazards
The advantages of the HAZOP technique for identifying natural hazards are as follows. It reduces the chances of omitting crucial causes of natural harms that may result in losses. HAZOP provides numerical estimates of the frequency of causes and the amount of losses, and it enables a determination of the acceptability of risk through a comparison with risk tolerance criteria. The estimated amount of loss found during HAZOP can be used as a basis for cost-benefit analysis, so that companies appropriately allocate resources for mitigating natural hazards. In addition, HAZOP allows hazard identification to be customized for a given entity better than an experience-based checklist format, which limits the scope of questioning deviations from design intent [65]. In the cause–consequence scenarios derived from a HAZOP study, location-specific damage scenarios can be included, considering the geo-spatial features of natural hazards. Moreover, HAZOP addresses the possibility of compound deviations due to potential multiple failures [66]. Most importantly, HAZOP facilitates risk communication between decision-makers and the public through multi-disciplinary participation.
Despite its advantages, HAZOP has some drawbacks for hazard identification. Baybutt [66] discussed the weaknesses of HAZOP. First, disadvantages can arise, since HAZOP studies rely on discovery based on previous experiences, rather than by applying certain rules. The outcome of HAZOP can be subjective and can omit important scenarios by mistake if a leader lacks experience or the involvement of team members is not well balanced. HAZOP studies may fail to consider various external factors or deviations due to issues other than system design, because it generates deviations by choosing parameters within the design intent. During HAZOP studies, the repetitive presence of deviations can lead to the duplication of cause and consequence scenarios, which may hamper team performance in hazard identification and reduce the readability of the study report. In addition, a method that follows the guidewords can lead to exaggerated scenarios through HAZOP, or a team may fail to find a critical deviation by misunderstanding the combination of the guideword and the parameter. Lastly, it may fail to address transitional events between an initial cause and consequences, which might be important for understanding the complete sequence of cause and effect in scenarios.
To complement these shortcomings, experienced team members from a multidisciplinary department should participate in the study, with good communication and cooperation [67]. The perceived problem that most HAZOP findings are typical, and that the report contents are often repetitive, can be overcome by producing a safety review in a shortened form that is equivalent to the HAZOP procedure [68]. HAZOP studies should be updated periodically to reflect the identification of new hazards and to maintain validation [66]. The frequency and impact of disaster occurrence as a result of natural hazards due to climate change can vary over time. In particular, periodic updates for the management of infrastructure or changes in facilities should be conducted because the vulnerability of people living in the affected area can be impacted by changes in circumstances. The HAZOP study is not only an end in itself, but it is also a starting point for various risk communications and provides input data for other risk analysis methods. The contents of HAZOP can inform hazardous natural disaster scenarios in subsequent risk analyses, such as SIL and QRA, and can facilitate risk communication with the public throughout the decision-making process.
5.2. Application of SIL for Risk Communication Regarding Natural Hazards
The advantages of SIL are that it provides a systematic method to determine desired safety requirements, and that it enables verification of whether the safety function meets the target with numerical criteria. When it is applied to manage the risk from natural hazards, a decision-maker can follow a logical sequence to determine the desired safety level, and can verify its suitability for planning. In addition, the technical guidance given by applying SIL to natural hazards can help stakeholders to reach an agreement through risk communication enhanced by numerical guidance. Notably, it is not recommended to depend on an unconvincing safety-related system with strict management only by satisfying a PFD calculation result [31]. In the IEC 61508 standard, there are additional restrictions, referred to as architectural constraints [9]. The design process must involve selecting a sufficiently robust architectural configuration of safety to guide the selection of safer equipment and to ensure that redundancy is considered. Examples of such measures, regardless of the PFD calculation, would be a sufficient and fast enough beacon to detect potential landslides in a community, or a sufficiently well-constructed check-dam to prevent debris and sediment reaching a town located in the downflow of a catchment. In addition, considering human factors is also important when utilizing the concept of SIL to control natural hazards. In the IEC standard, little attention is paid to human interventions in organizational matters during the operation stage; however, specific safety functions may require human-operated actions, and they might be more sensitive to human factors than other safety functions [69]. In case of natural hazards, planned safety system reliability at the design stage can deteriorate due to mismanagement and human errors during the operation stage of an entity. Some additional shortcomings should be considered before applying an SIL study to control natural disasters. As with other risk studies, subjective interventions can lead to greater uncertainty, even if the SIL analysis is quantitative in nature. While applying SIL to natural hazards, the fact that risk discriminators can be applied in an unbalanced way is also a problem. When the SIL graph method is used, the magnitude of potential consequences is consolidated into a single parameter of the probability of unwanted occurrence [70]. If the range of the risk parameter is not subdivided appropriately, it may not be possible to set a reasonable risk target.
To resolve these problems, the construction of an expert team with interested parties not biased toward a single field is important for establishing reasonable safety requirements. It is also necessary to select risk parameters carefully to achieve safety objectives, and when doing so it is important to understand the entire process, ranging from the setting of target safety levels to the verification of fulfilment on quantitative grounds. SIL executors should set the range of risk parameters prudently for proper risk discrimination, and the frequency of natural disasters must be based on empirical data to achieve credible verification results.
5.3. Application of QRA for Risk Communication Regarding Natural Hazards
The advantages and shortcomings of QRA can be summarized as follows [49]. Most importantly, QRA can contribute to promoting a common understanding of risk issues between experts and the public. In dealing with natural disasters, informing residents who might be harmed about the exposed risk is very important in order to minimize losses, and information on the risk can reduce unnecessary arguments regarding decision-making. Next, QRA can improve the completeness of risk analysis. It is not possible to take into account all multiple-failure scenarios through qualitative risk methods; however, the complex interactions between hazardous events and safety system components can be structured by FTA and ETA. Because of these advantages, the QRA approach can examine multi-hazard risk issues from natural hazards more accurately. In addition, in the process of quantifying risk indices through informed input values, it is possible to find previously unrecognized variables, which promotes an understanding of the uncertainties of risk studies. This, in turn, raises awareness of the limitations in estimating risk for natural disasters, which has high uncertainty for prediction, and can be a basis for setting a safety margin.
However, a shortcoming of the QRA is the difficulty that it faces in incorporating human factors into the model, although it has been agreed that human errors show a pattern of probability in the operational stage [71]. In addition, there are limitations in how the failure of digital software is reflected in QRA because the causes of failure modes may be unclear and complicated. Finally, construction or manufacturing errors at the design stage lead to significant variation in QRA results. Such design errors are rare, but can cause major hazardous events. Natural-technological (NaTec) disasters are examples of the escalation effect, which can have a serious adverse impact on human dwellings when design errors are combined with natural disasters.
The information obtained through QRA allows people to understand the actual damage that can result from natural hazards in the later stages of risk communication. By becoming familiar with location-specific risk information projected over a specific period of time, those who are at risk can reconsider their adaptation strategies. This communication feedback can play a role in significantly reducing overall risk. Nevertheless, QRA should be used as a supporting tool for cost-efficient risk management and decision making, not as a total replacement of other safety assessment methods.
5.4. Setting a Framework for Natural Risk Management and Communications
Enhancing risk communication for natural hazards is a complicated task due to its uncertainty, lack of context, procedural fragmentation, and involvement of diverse stakeholders [72]. Nevertheless, the application of the industrial risk management tools introduced in this study and the use of information such as that presented in the case studies can help improve risk communication for natural hazards. Among the multiple purposes of risk communication [73], the goal of raising awareness can be achieved with distinct risk-related indicators, which can be provided by these industrial risk management practices. Such measures can support reaching agreements through active public participation and motivating action by designating parties to take action. Individual experiences of natural hazards and trust in authorities are the most significant factors in enhancing risk perception [74], and public participation has been recommended as an important means to strengthen those factors by increasing awareness of natural disasters and promoting self-readiness. The participation of the stakeholders, including the public, in all processes from hazard identification, risk assessment, and risk treatment to risk acceptance is a major advantage of these industrial risk management practices.
High-magnitude risks posed by natural hazards have low probabilities, and communication about low-probability risks with people who do not have a suitable understanding of heuristics can also be challenging [75]. When risk information about natural hazards is communicated in the framework of industrial risk management practices, frequencies and probabilities can be presented clearly in a quantitative manner, which can help increase risk awareness. In addition, non-structural mitigation measures, such as forecasting, early warning, and emergency response, have been recognized as crucial parts of preventing disasters from natural hazards [76,77], and the application of industrial risk management practices can support building cost-efficient non-structural mitigation measures that could be prepared as a flexible response to hazardous situations. For instance, more reliable warnings about natural hazards are possible with customized hazard identification and risk assessment based on quantitative evidence, and furthermore, the results of QRA can provide risk indicators for establishing an emergency response plan that includes geo-referenced spatial information.
Importantly, risk management should be implemented as an integrated framework for effective risk communication with the public and stakeholders rather than executing HAZOP, SIL, or QRA separately. Stakeholders’ participation must be ensured, and risk information should cascade through the integrated chain of risk studies. These requirements are usually documented in a written procedure for industrial risk studies, and it is also recommended for natural risk management. Such an integrated approach could reduce the communication gap between experts and the end-users who are actually exposed to the excessive natural risk. As a comprehensive risk management framework, the application of HAZOP, SIL, and QRA can improve risk communication between experts and end-users, through cascading risk information in systematic and quantitative forms. However, the risk analysis methods reviewed in this study should be used as a supporting tool for decision-making, because they are merely probability assessments based on the best available assumptions. Further research on regional-scale analyses using inventory data of multiple events supplemented by field survey data can improve the accuracy of risk estimation. The methods and case studies presented in this study can help build a framework for managing natural risk and facilitate risk communication about natural hazards, with the goal of preventing losses from potential natural disasters.
Author Contributions
J.L. conceived and analyzed the study, and wrote the paper. D.K.L. supervised and provided comments for revisions.
Funding
This study was supported by the BK 21 Plus Project in 2018 (Seoul National University Interdisciplinary Program in Landscape Architecture, Global Leadership Program toward innovative green infrastructure), and funded by Korea Ministry of Environment (MOE) grant number 2016000210004, Public Technology Development Program based on Environmental Policy, through the Korea Environmental Industry and Technology Institute (KEITI).
Conflicts of Interest
The authors declare no conflicts of interest.
Abbreviations
| ALARP | As Low As Reasonably Practicable |
| CA | Consequence Analysis |
| ETA | Event Tree Analyses |
| FTA | Fault Tree Analyses |
| HAZOP | Hazard and Operability |
| PFD | Probability of Failure on Demand |
| PFDavg | Average Probability of Failure on Demand |
| QRA | Quantitative Risk Analysis |
| RRF | Risk Reduction Factor |
| SIL | Safety Integrated Level |
| TRIGRS | Transient Rainfall Infiltration and Grid-based—Regional Slope-stability analysis model |
References
- Myhre, G.; Shindell, D.; Bréon, F.M.; Collins, W.; Fuglestvedt, J.; Huang, J.; Koch, D.; Lamarque, J.F.; Lee, D.; Mendoza, B.; et al. Climate Change 2013: The Physical Science Basis. Contribution of Working Group i to the Fifth Assessment Report of the Intergovernmental Panel on Climate Change; Cambridge University Press: Cambridge, UK, 2013. [Google Scholar]
- Larson, E. Living with Risk: A Global Review of Disaster Reduction Initiatives; United Nations Publication: New York, NY, USA, 2003; Volume 1, pp. 1–429. [Google Scholar]
- Montoya, L. Geo-data acquisition through mobile gis and digital video: An urban disaster management perspective. Environ. Model. Softw. 2003, 18, 869–876. [Google Scholar] [CrossRef]
- Albano, R.; Sole, A.; Adamowski, J. Ready: A web-based geographical information system for enhanced flood resilience through raising awareness in citizens. Nat. Hazards Earth Syst. Sci. 2015, 15, 1645–1658. [Google Scholar] [CrossRef]
- Hošková-Mayerová, Š. Education and training in crisis management. In The European Proceedings of Social & Behavioural Sciences; Future Academy: Hong Kong, China, 2016; pp. 849–856. [Google Scholar]
- Schweikert, A.; Chinowsky, P.; Kwiatkowski, K.; Espinet, X. The infrastructure planning support system: Analyzing the impact of climate change on road infrastructure and development. Transp. Policy 2014, 35, 146–153. [Google Scholar] [CrossRef]
- Michielsen, A.; Kalantari, Z.; Lyon, S.W.; Liljegren, E. Predicting and communicating flood risk of transport infrastructure based on watershed characteristics. J. Environ. Manag. 2016, 182, 505–518. [Google Scholar] [CrossRef] [PubMed]
- Dunjo, J.; Fthenakis, V.; Vilchez, J.A.; Arnaldos, J. Hazard and operability (HAZOP) analysis. A literature review. J. Hazard Mater. 2010, 173, 19–32. [Google Scholar] [CrossRef] [PubMed]
- International Electrotechnical Commission. Functional Safety of Electrical/Electronic/Programmable Electronic Safety-Related Systems; IEC 61508; International Electrotechnical Commission: Geneva, Switzerland, 1998. [Google Scholar]
- Lee, J.; Lee, D.K. Risk management for natural hazards based on reliability analysis: A case study landslides. In Safety and Reliability—Safe Societies in a Changing World; Haugen, S., Barros, A., van Gulijk, C., Kongsvik, T., Vinnem, J., Eds.; CRC Press/Balkema: Boca Raton, FL, USA, 2018; pp. 2797–2803. [Google Scholar]
- Stewart, M.G. Reliability-based assessment of ageing bridges using risk ranking and life cycle cost decision analyses. Reliab. Eng. Syst. Saf. 2001, 74, 263–273. [Google Scholar] [CrossRef]
- Freeman, R.A. Ccps guidelines for chemical process quantitative risk analysis. Plant Oper. Prog. 1990, 9, 231–235. [Google Scholar] [CrossRef]
- Purdy, G. Iso 31000:2009—Setting a new standard for risk management: Perspective. Risk Anal. 2010, 30, 881–886. [Google Scholar] [CrossRef] [PubMed]
- Rossing, N.L.; Lind, M.; Jensen, N.; Jørgensen, S.B. A functional HAZOP methodology. Comput. Chem. Eng. 2010, 34, 244–253. [Google Scholar] [CrossRef]
- Knowlton, R.E. Steady progress with hazard and operability studies. R D Manag. 1979, 10, 33–34. [Google Scholar] [CrossRef]
- Swann, C.D.; Preston, M.L. Twenty-five years of HAZOPs. J. Loss Prev. Process Ind. 1995, 8, 349–353. [Google Scholar] [CrossRef]
- Lawley, H.G. Operability studies and hazard analysis. Chem. Eng. Prog. 1974, 8, 105–116. [Google Scholar]
- Kletz, T. Incidents that could have been prevented by HAZOP. J. Loss Prev. Process Ind. 1991, 4, 128–129. [Google Scholar] [CrossRef]
- Kletz, T.A. HAZOP-past and future. Reliab. Eng. Syst. Saf. 1997, 55, 263–266. [Google Scholar] [CrossRef]
- Kletz, T.A. HAZOP & HAZAN: Identifying and Assessing Process Industry Hazards, 4th ed.; Institution of Chemical Engineers: Rugby, UK, 1999. [Google Scholar]
- Nolan, D.P. Safety and Security Review for the Process Industries: Application of HAZOP, PHA, What-If and SVA Reviews; Elsevier Science: New York, NY, USA, 2014; pp. 1–167. [Google Scholar]
- Nolan, D.P. Application of HAZOP and What-If Safety Reviews to the Petroleum, Petrochemical and Chemical Industries; Noyes Publications: Park Ridge, NJ, USA, 1994. [Google Scholar]
- Robinson, B.W. Application of hazard and operability studies to a wide range of industries and activities. Qual. Reliab. Eng. Int. 1995, 11, 399–402. [Google Scholar] [CrossRef]
- Jagtman, H.M.; Hale, A.R.; Heijer, T. A support tool for identifying evaluation issues of road safety measures. Reliab. Eng. Syst. Saf. 2005, 90, 206–216. [Google Scholar] [CrossRef]
- Aspinall, P. HAZOPs and Human Factors. In Hazards Xix—Process Safety and Environmental Protection—What Do We Know? Where Are We Going? Institution of Chemical Engineers: Rugby, UK, 2006; pp. 820–829. [Google Scholar]
- Kletz, T.A. An Engineer’s View of Human Error; IChemE: Rugby, UK, 2006. [Google Scholar]
- Macdonald, D. Practical HAZOPs, Trips and Alarms; Elsevier: Newnes, MA, USA, 2004. [Google Scholar]
- Gall, H. Functional Safety Iec 61508/Iec 61511 the Impact to Certification and the User. In Proceedings of the 2008 IEEE/ACS International Conference on Computer Systems and Applications, Doha, Qatar, 31 March–4 April 2008; pp. 1027–1031. [Google Scholar]
- Bhimavarapu, K.; Stavrianidis, P. Safety integrity level analysis for processes: Issues and methodologies. Process Saf. Prog. 2000, 19, 19–24. [Google Scholar] [CrossRef]
- Urban, R.; Hošková-Mayerová, Š. Threat life cycle and its dynamics. Deturope 2017, 9, 93–109. [Google Scholar]
- Van Beurden, I.J.W.R.J.; Amkreutz, R.J.P. Safety integrity level verification—A PFD average calculation is not enough. Hydrocarb. Process 2001, 80, 47–50. [Google Scholar]
- Stavrianidis, P.; Bhimavarapu, K. Safety instrumented functions and safety integrity levels (SIL). ISA Trans. 1998, 37, 337–351. [Google Scholar] [CrossRef]
- Freeman, R.; Summers, A. Evaluation of uncertainty in safety integrity level calculations. Process Saf. Prog. 2016, 35, 341–348. [Google Scholar] [CrossRef]
- Bertolini, M.; Bevilacqua, M.; Ciarapica, F.E.; Giacchetta, G. Development of risk-based inspection and maintenance procedures for an oil refinery. J. Loss Prev. Process Ind. 2009, 22, 244–253. [Google Scholar] [CrossRef]
- Selvik, J.T.; Aven, T. A framework for reliability and risk centered maintenance. Reliab. Eng. Syst. Saf. 2011, 96, 324–331. [Google Scholar] [CrossRef]
- Gabriel, A.; Ozansoy, C.; Shi, J. Developments in SIL determination and calculation. Reliab. Eng. Syst. Saf. 2018, 177, 148–161. [Google Scholar] [CrossRef]
- Baybutt, P. The use of risk matrices and risk graphs for SIL determination. Process Saf. Prog. 2014, 33, 179–182. [Google Scholar] [CrossRef]
- Langeron, Y.; Barros, A.; Grall, A.; Bérenguer, C. Combination of safety integrity levels (SILs): A study of IEC61508 merging rules. J. Loss Prev. Process Ind. 2008, 21, 437–449. [Google Scholar] [CrossRef]
- Freeman, R. Using layer of protection analysis to define safety integrity level requirements. Process Saf. Prog. 2007, 26, 185–194. [Google Scholar] [CrossRef]
- Radbruch-Hall, D.H.; Varnes, D.J. Landslides—Cause and effect. Bull. Int. Assoc. Eng. Geol. 1976, 13, 205–216. [Google Scholar] [CrossRef]
- Shu, Y.; Zhao, J. A simplified markov-based approach for safety integrity level verification. J. Loss Prev. Process Ind. 2014, 29, 262–266. [Google Scholar] [CrossRef]
- Billinton, R.; Allan, R.N. Reliability Evaluation of Engineering Systems: Concepts and Techniques, 2nd ed.; Springer Science/Business Media, LLC: New York, NY, USA, 1992. [Google Scholar]
- Goble, W.; Cheddie, H. Safety Instrumented Systems Verification: Practical Probabilistic Calculations; The Instrumentation, Systems and Automation Society: Research Triangle Park, NC, USA, 2005. [Google Scholar]
- International Society of Automation. Safety Instrumented Functions (SIF)—Safety Integrity Level (SIL) Evaluation Techniques; ISA-TR84.00.02-2002; International Society of Automation: Research Triangle Park, NC, USA, 2002. [Google Scholar]
- Caine, N. The rainfall intensity-duration control of shallow landslides and debris flows. Geogr. Ann. Ser. A 1980, 62, 23–27. [Google Scholar]
- Aleotti, P. A warning system for rainfall-induced shallow failures. Eng. Geol. 2004, 73, 247–265. [Google Scholar] [CrossRef]
- Kim, W.-Y.; Chae, B.-G. Characteristics of rainfall, geology and failure geometry of the landslide areas on natural terrains in Korea. J. Eng. Geol. 2009, 19, 331–344. [Google Scholar]
- Piciullo, L.; Dahl, M.P.; Devoli, G.; Colleuille, H.; Calvello, M. Adapting the EDuMaP method to test the performance of the Norwegian early warning system for weather-induced landslides. Nat. Hazards Earth Syst. Sci. 2017, 17, 817–831. [Google Scholar] [CrossRef] [Green Version]
- Apostolakis, G.E. How useful is quantitative risk assessment? Risk Anal. 2004, 24, 515–520. [Google Scholar] [CrossRef] [PubMed]
- Frank, W.; Jones, D. Choosing appropriate quantitative safety risk criteria: Applications from the new CCPS guidelines. Process Saf. Prog. 2010, 29, 293–298. [Google Scholar] [CrossRef]
- Guanquan, C.; Jinhua, S. Quantitative assessment of building fire risk to life safety. Risk Anal. 2008, 28, 615–626. [Google Scholar] [CrossRef] [PubMed]
- Meng, Q.; Qu, X.; Wang, X.; Yuanita, V.; Wong, S.C. Quantitative risk assessment modeling for nonhomogeneous urban road tunnels. Risk Anal. 2011, 31, 382–403. [Google Scholar] [CrossRef] [PubMed]
- Hoornstra, E.; Northolt, M.D.; Notermans, S.; Barendsz, A.W. The use of quantitative risk assessment in HACCP. Food Control 2001, 12, 229–234. [Google Scholar] [CrossRef]
- Guzzetti, F. Landslide fatalities and the evaluation of landslide risk in Italy. Eng. Geol. 2000, 58, 89–107. [Google Scholar] [CrossRef]
- Dai, F.C.; Lee, C.F.; Ngai, Y.Y. Landslide risk assessment and management: An overview. Eng. Geol. 2002, 64, 65–87. [Google Scholar] [CrossRef]
- Zêzere, J.L.; Garcia, R.A.C.; Oliveira, S.C.; Reis, E. Probabilistic landslide risk analysis considering direct costs in the area north of Lisbon (Portugal). Geomorphology 2008, 94, 467–495. [Google Scholar] [CrossRef]
- Remondo, J.; Bonachea, J.; Cendrero, A. Quantitative landslide risk assessment and mapping on the basis of recent occurrences. Geomorphology 2008, 94, 496–507. [Google Scholar] [CrossRef]
- Jaiswal, P.; Van Westen, C.J.; Jetten, V. Quantitative estimation of landslide risk from rapid debris slides on natural slopes in the Nilgiri hills, India. Nat. Hazards Earth Syst. Sci. 2011, 11, 1723–1743. [Google Scholar] [CrossRef] [Green Version]
- Van Westen, C.J.; van Asch, T.W.J.; Soeters, R. Landslide hazard and risk zonation—Why is it still so difficult? Bull. Eng. Geol. Environ. 2006, 65, 167–184. [Google Scholar] [CrossRef]
- Ferdous, R.; Khan, F.; Sadiq, R.; Amyotte, P.; Veitch, B. Fault and event tree analyses for process systems risk analysis: Uncertainty handling formulations. Risk Anal. 2011, 31, 86–107. [Google Scholar] [CrossRef] [PubMed]
- Baum, R.L.; Savage, W.Z.; Godt, J.W. TRIGRS—A FORTRAN Program for Transient Rainfall Infiltration and Grid-Based Regional Slope Stability Analysis Version 2.0; US Geological Survey Open-File Report; US Geological Survey: Reston, VA, USA, 2008; Volume 1159, pp. 1–75.
- Korea Meteorological Administration National Typhoon Center. Typhoon White Book; Korea Meteorological Administration: Seoul, Korea, 2011.
- Australian Geomechanics Society. Landslide risk management concepts and guidelines. Aust. Geomech. J. 2000, 37, 1–44. [Google Scholar]
- Watson, S.R. The meaning of probability in probabilistic safety analysis. Reliab. Eng. Syst. Saf. 1994, 45, 261–269. [Google Scholar] [CrossRef]
- Shafaghi, A.; Cook, F.B. Application of a hazard & operability study to hazard evaluation of an absorption heat pump. IEEE Trans. Reliab. 1988, 37, 159–166. [Google Scholar]
- Baybutt, P. A critique of the hazard and operability (HAZOP) study. J. Loss Prev. Process Ind. 2015, 33, 52–58. [Google Scholar] [CrossRef]
- McKelvey, T.C. How to improve the effectiveness of hazard & operability analysis. IEEE Trans. Reliab. 1988, 37, 167–170. [Google Scholar]
- Grossmann, G.; Fromm, D. HAZOP-proof ammonia plant. A new way of defining a safe and reliable design. Plant Oper. Prog. 1991, 10, 223–227. [Google Scholar] [CrossRef]
- Melo, A.P.A.V.; Melo, P.F.F.F.; Nele, M. Safety integrity level (SIL) integrated with human and organizational factors. Chem. Eng. Trans. 2013, 31, 343–348. [Google Scholar]
- Baybutt, P. An improved risk graph approach for determination of safety integrity levels (SILs). Process Saf. Prog. 2007, 26, 66–76. [Google Scholar] [CrossRef]
- Swain, A.D. Modelling of human performance in complex system with emphasis on nuclear power plant operations and probabilistic risk assessment. Ergonomics 1982, 25, 449. [Google Scholar] [CrossRef] [PubMed]
- Albano, R.; Mancusi, L.; Abbate, A. Improving flood risk analysis for effectively supporting the implementation of flood risk management plans: The case study of “serio” valley. Environ. Sci. Policy 2017, 75, 158–172. [Google Scholar] [CrossRef]
- Bier, V.M. On the state of the art: Risk communication to the public. Reliab. Eng. Syst. Saf. 2001, 71, 139–150. [Google Scholar] [CrossRef]
- Wachinger, G.; Renn, O.; Begg, C.; Kuhlicke, C. The risk perception paradox-implications for governance and communication of natural hazards. Risk Anal. 2013, 33, 1049–1065. [Google Scholar] [CrossRef] [PubMed]
- Keller, C.; Siegrist, M.; Gutscher, H. The role of the affect and availability heuristics in risk communication. Risk Anal. 2006, 26, 631–639. [Google Scholar] [CrossRef] [PubMed]
- Albano, R.; Sole, A.; Adamowski, J.; Mancusi, L. A gis-based model to estimate flood consequences and the degree of accessibility and operability of strategic emergency response structures in urban areas. Nat. Hazards Earth Syst. Sci. 2014, 14, 2847–2865. [Google Scholar] [CrossRef]
- Sättele, M.; Bründl, M.; Straub, D. Reliability and effectiveness of early warning systems for natural hazards: Concept and application to debris flow warning. Reliab. Eng. Syst. Saf. 2015, 142, 192–202. [Google Scholar] [CrossRef]
Figure 1.
The steps used in hazard identification from derived deviations (adapted from [27]).
Figure 1.
The steps used in hazard identification from derived deviations (adapted from [27]).

Figure 2.
(a) An example of the SIL graph method for determining the required risk reduction, (b) An example of the SIL matrix method for determining the required risk reduction (adapted from [37]).
Figure 2.
(a) An example of the SIL graph method for determining the required risk reduction, (b) An example of the SIL matrix method for determining the required risk reduction (adapted from [37]).

Figure 3.
Changes in probability of failure on demand (PFD) across a year, and the average probability of failure on demand (PFDavg) (adapted from [43]).
Figure 3.
Changes in probability of failure on demand (PFD) across a year, and the average probability of failure on demand (PFDavg) (adapted from [43]).

Figure 4.
Landslide locations in the study area. The landslide inventory data were parts of the second and third rounds of data collection in Gangwon Province.
Figure 4.
Landslide locations in the study area. The landslide inventory data were parts of the second and third rounds of data collection in Gangwon Province.

Figure 5.
The steps of QRA, modified from chemical process QRA (adapted from [12]).
Figure 5.
The steps of QRA, modified from chemical process QRA (adapted from [12]).

Figure 6.
The case study site and the results of TRIGRS modeling: (a) the site location; (b) topography of the site; (c) TRIGRS modeling result—200 mm for 48 h; (d) TRIGRS modeling result—800 mm for 24 h.
Figure 6.
The case study site and the results of TRIGRS modeling: (a) the site location; (b) topography of the site; (c) TRIGRS modeling result—200 mm for 48 h; (d) TRIGRS modeling result—800 mm for 24 h.


Table 1.
(a) Meaningful combinations of guidewords for process parameters; (b) Deviations that lead to damage by natural hazards.
Table 1.
(a) Meaningful combinations of guidewords for process parameters; (b) Deviations that lead to damage by natural hazards.
| (a) | |
| Parameters | Meaningful Combination of Guidewords |
| Flow | No, more of, less of, reverse, else where, as well as |
| Temperature | Higher, lower |
| Pressure | Higher, lower, reverse |
| Level | No, higher, lower, reverse |
| Mixing | No, more less |
| Reaction | Higher, lower (rate of), no, reverse, as well as |
| Phase | Other, reverse, as well as |
| Composition | Part of, as well as |
| Communication | No, part of, more of, less of, other, as well as |
| (b) | |
| Climate Exposure Parameters | Deviation by Climate Change |
| Temperature | Hot, cold, boiling, freezing |
| Rain | Heavy rain, flooding, drought, wildfire |
| Snow | Heavy snow, frost |
| Wind | String wind, Tornado, Typhoon |
| Topography | Landslides, land subsidence |
| Inundation | Sea level rise, coastal river flood |
| Flora/Fauna | Withering, vermin, infectious disease |
| Lightening | Lighting injury, asset damage |
Table 2.
The sample checklist for identify risks caused by heavy rain.
| Risk Category | Risk Factor | Occurrence Frequency | Impact Category | Impact Severity |
|---|---|---|---|---|
| Low High | People/Property/Env. | Low High | ||
| Employee | Injury caused by equipment collapsing due to heavy rainfall | [1] [√] [3] [4] [5] | [√]/[ ]/[ ] | [1] [2] [3] [√] [5] |
| Injury caused by electric shock due to humid conditions | [√] [2] [3] [4] [5] | [√]/[ ]/[ ] | [1] [2] [3] [4] [√] | |
| Commuting delays due to traffic system downtime | [1] [2] [3] [√] [5] | [√ ]/[ ]/[ ] | [√] [2] [3] [4] [5] | |
| Logistics | Transportation network disconnected by flooding due to heavy rain | [1] [√] [3] [4] [5] | [ ]/[√]/[ ] | [1] [2] [√] [4] [5] |
| Shipping and aviation disruption caused by heavy rain | [√] [2] [3] [4] [5] | [ ]/[√]/[ ] | [1] [2] [3 ] [√] [5] | |
| Inundation of logistics storage due to heavy rains | [1] [√] [3] [4] [5] | [ ]/[√]/[ ] | [1] [2] [√] [4] [5] | |
| Raw material or final product damage or quality deterioration due to heavy rain | [1] [√] [3] [4] [5] | [ ]/[√]/[ ] | [1] [√] [3] [4] [5] | |
| Location | Slope collapse near worksite, soil discharge, or landslide | [√] [2] [3] [4] [5] | [√]/[ ]/[ ] | [1] [2] [3] [4] [√] |
| Inundation of rivers and lakes near the workplace due to heavy rainfall | [√] [2] [3] [4] [5] | [√]/[ ]/[ ] | [1] [2] [3] [√] [5] | |
| Utilities | Damage of electrical equipment (substation, transmission tower, etc.) | [1] [√] [3] [4] [5] | [ ]/[√]/[ ] | [1] [2] [3] [√] [5] |
| Damage of water supply network due to heavy rain | [√] [2] [3] [4] [5] | [ ]/[√]/[ ] | [1] [2] [√] [4] [5] | |
| Damage of waste treatment facility due to heavy rain | [√] [2] [3] [4] [5] | [ ]/[√]/[ ] | [1] [2] [√] [4] [5] |
Note: The checklist was filled out arbitrarily, and the intention of presenting the checklist is to provide a comparison with the HAZOP worksheet.
Table 3.
A sample HAZOP worksheet to identify risks associated with the parameter of rain for the service node of logistics.
Table 3.
A sample HAZOP worksheet to identify risks associated with the parameter of rain for the service node of logistics.
| Guide Word | Deviation | Cause | Freq. | Consequence | Expected Damage | Existing Safeguard | Risk Level (H/M/L) | Recommended Action | Action to Be Taken by |
|---|---|---|---|---|---|---|---|---|---|
| More | Heavy rain | Traffic system downtime and disconnection | 5 year | Possible production disruption caused by raw material supply instability | People: Assets: H Environ. | Extreme weather operation guideline | High | Increasing capacity of raw material storage | Dept. of Training |
| More | Heavy rain | River flooding near the worksite | 10 year | Production downturn due to potential inundation damage of the facilities (Tag-xxx) for maintenance | People: Assets: M Environ. | Drainage network | Medium | Emergency pumping | Dept. of Maintenance |
| More | Heavy rain | River flooding near the worksite | 10 year | Damage of the final products stored in station B at the north yard | People: Asset: L Environ. | Drainage network | Low | Embankment work | Dept. of Logistics |
Note: The levels of risks are decided through a comparison using a risk matrix reflecting the frequency of the initiating cause and the expected damage estimated by the HAZOP team.
Table 4.
Target failure measures for SILs of safety function (in low-demand mode).
| Safety Integrated Level (SIL) | Average Probability of Failure to Perform a Desired Function |
|---|---|
| SIL 4 | ≥10−5 to <10−4 |
| SIL 3 | ≥10−4 to <10−3 |
| SIL 2 | ≥10−3 to <10−2 |
| SIL 1 | ≥10−2 to <10−1 |
Table 5.
Frequency estimation of landslide occurrence based on the probabilistic return period.
| Landslide Hazard Grade | Total Area (100 m2) | No. of Landslides | Total Time of Surviving Items (Year) | Frequency of Landslide Occurrence (λ) * |
|---|---|---|---|---|
| 1 (high) | 364,383 | 11 | 1,202,428 | 9.15 × 10⁻⁶ |
| 2 | 11,737,057 | 72 | 38,732,051 | 1.86 × 10⁻⁶ |
| 3 | 17,287,106 | 41 | 57,047,315 | 7.19 × 10⁻⁷ |
| 4 (low) | 1,330,109 | 1 | 4,389,356 | 2.28 × 10⁻⁷ |
* The frequency unit of landslide occurrence (λ) is event × pixel −1 × year −1.
Table 6.
The estimated average probability of landslide occurrence over time (year).
| Year | 1 | 5 | 10 | 15 | 30 | Proportion to Grade 4 |
|---|---|---|---|---|---|---|
| Grade 1 | 4.57 × 10⁻⁶ | 2.29 × 10⁻⁵ | 4.57 × 10⁻⁵ | 6.86 × 10⁻⁵ | 1.37 × 10⁻⁴ | 40.15 |
| Grade 2 | 9.29 × 10⁻⁷ | 4.65 × 10⁻⁶ | 9.29 × 10⁻⁶ | 1.39 × 10⁻⁵ | 2.79 × 10⁻⁵ | 8.16 |
| Grade 3 | 3.59 × 10⁻⁷ | 1.80 × 10⁻⁶ | 3.59 × 10⁻⁶ | 5.39 × 10⁻⁶ | 1.08 × 10⁻⁵ | 3.15 |
| Grade 4 | 1.14 × 10⁻⁷ | 5.70× 10⁻⁷ | 1.14 × 10⁻⁶ | 1.71 × 10⁻⁶ | 3.42 × 10⁻⁶ | 1.00 |
© 2018 by the authors. Licensee MDPI, Basel, Switzerland. This article is an open access article distributed under the terms and conditions of the Creative Commons Attribution (CC BY) license (http://creativecommons.org/licenses/by/4.0/).
Share and Cite
MDPI and ACS Style
Lee, J.; Lee, D.K. Application of Industrial Risk Management Practices to Control Natural Hazards, Facilitating Risk Communication. ISPRS Int. J. Geo-Inf. 2018, 7, 377. https://0-doi-org.brum.beds.ac.uk/10.3390/ijgi7090377
AMA Style
Lee J, Lee DK. Application of Industrial Risk Management Practices to Control Natural Hazards, Facilitating Risk Communication. ISPRS International Journal of Geo-Information. 2018; 7(9):377. https://0-doi-org.brum.beds.ac.uk/10.3390/ijgi7090377
Chicago/Turabian StyleLee, Jongook, and Dong Kun Lee. 2018. "Application of Industrial Risk Management Practices to Control Natural Hazards, Facilitating Risk Communication" ISPRS International Journal of Geo-Information 7, no. 9: 377. https://0-doi-org.brum.beds.ac.uk/10.3390/ijgi7090377
Note that from the first issue of 2016, this journal uses article numbers instead of page numbers. See further details here.