Article

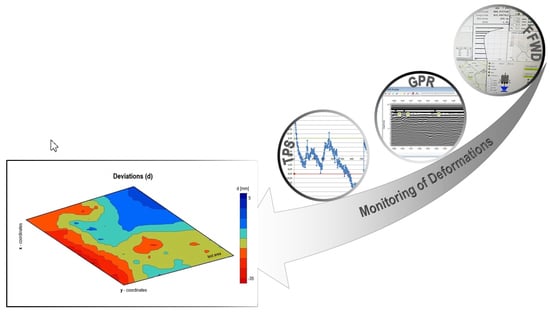
Improved Decision-Making Geo-Information System for Continuous Monitoring of Deformations on Airport Infrastructure

1
The Surveying and Mapping Authority of the Republic of Slovenia, Project unit e-Prostor, Zemljemerska 12, SI-1000 Ljubljana, Slovenia
2
University of Maribor, Faculty of Civil Engineering, Transportation Engineering and Architecture, Department of Geodesy, Smetanova 17, SI-2000 Maribor, Slovenia
*
Author to whom correspondence should be addressed.
ISPRS Int. J. Geo-Inf. 2019, 8(1), 1; https://0-doi-org.brum.beds.ac.uk/10.3390/ijgi8010001
Submission received: 12 November 2018 / Revised: 17 December 2018 / Accepted: 18 December 2018 / Published: 21 December 2018

Abstract

:
Heavy burdens are placed on runways daily; thus, it is necessary to monitor these surfaces regularly. The appearance of distortions can cause difficulties for aircraft when they land or take off, which occurs mainly for lighter planes. This can be seen in reduced grip, uneven use of tires, problems with measurement systems, and unbalanced drive, which can result in damage to or even destruction of the plane or its parts. For that purpose, the model of continuous monitoring of distortions on and under the surface of the runway was created. This model is based on geodetic and geophysical methods. The method for monitoring distortions was developed into a decision-making model in the shape of a geo-information base. The results provide an image of the state of the runway including damage on and under the surface, which are the most common causes of runway distortions. The data are automatically recorded in the newly established information system, which supports the decision making regarding renovations and runway maintenance. The measurement on the runway takes 30 min, which does not lead to a long closure of the airport and, thus, reduces traffic jams and additional costs.

Graphical Abstract

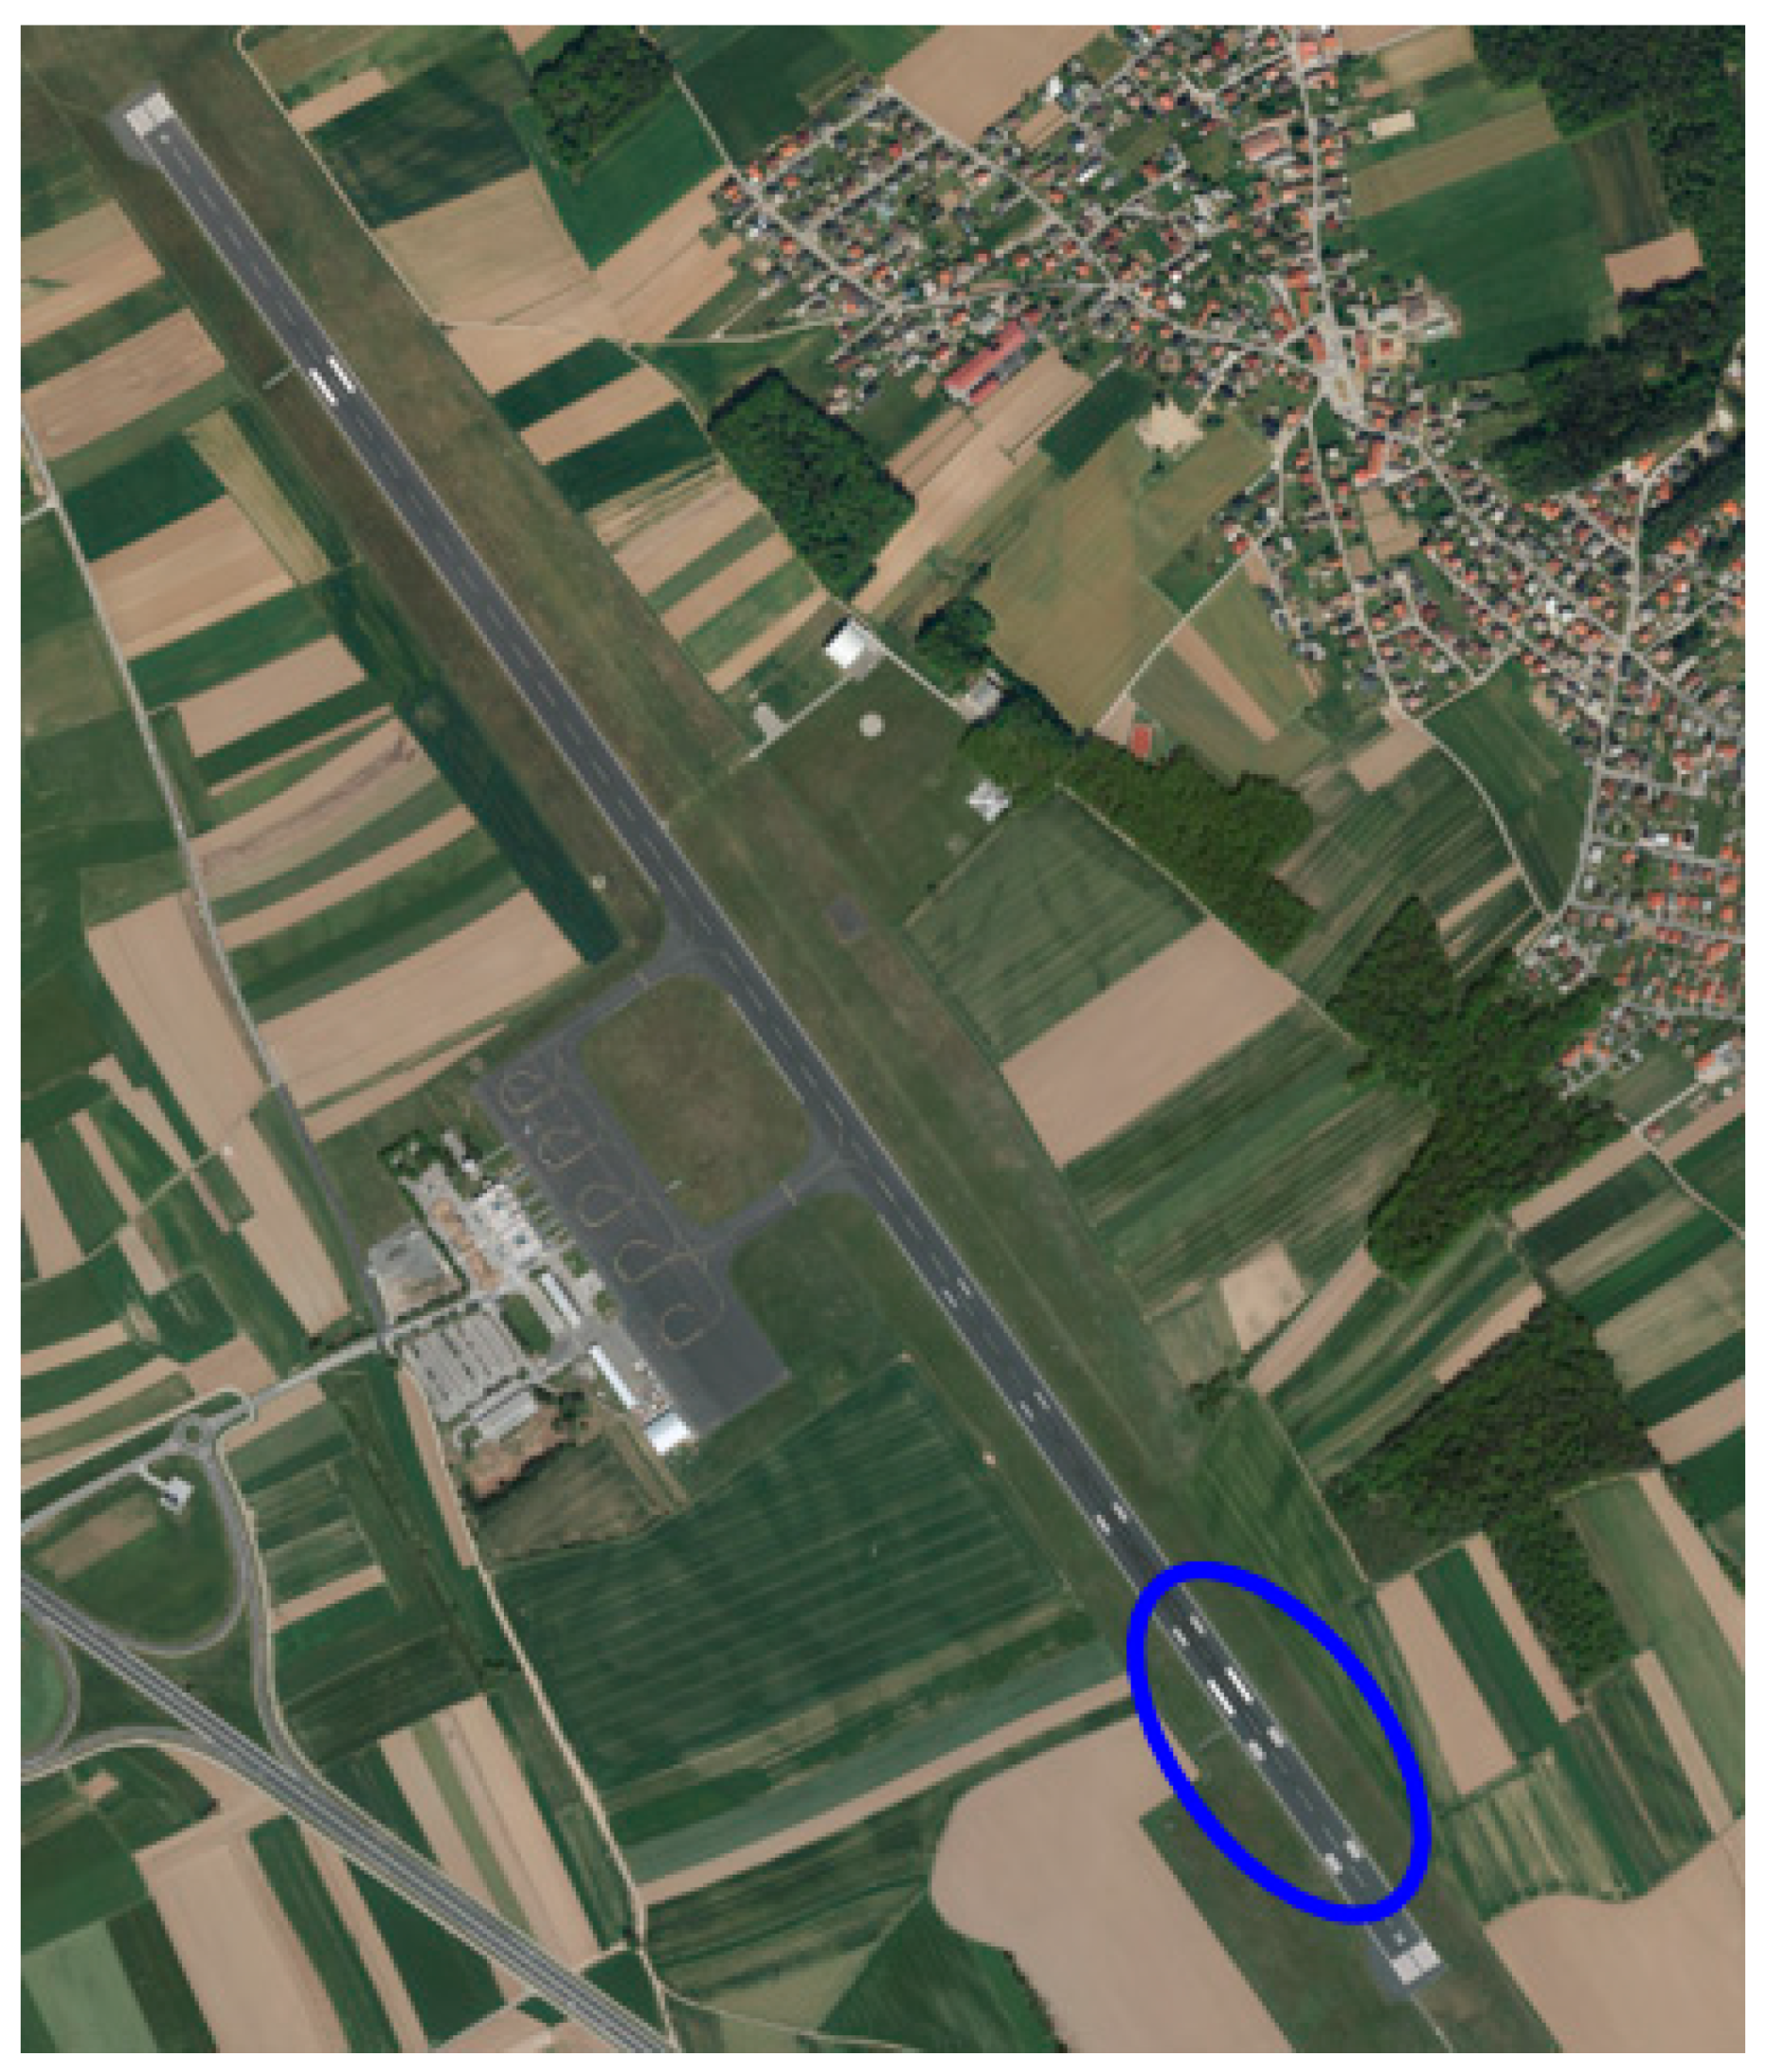
1. Identification of the Problem

Modern society has very high demands for quality, as well as fast and reliable mobility of people and goods. The network that creates the conditions and makes the connections through which mobility happens is called the logistic infrastructure. This is very important in modern society [1] and represents fundamental appliances and objects, enabling the social and economic activities of a certain community. Among the logistic infrastructure, airport infrastructure enables the transport of people and goods from one geographic point to another, for which impeccable ground infrastructure is needed, especially the runway part. The infrastructure is especially important in areas where the development of the road and railway infrastructure is difficult due to disadvantageous physical–geographic characteristics or during natural disasters when other means of transport are disabled. In addition, air traffic in the EU is expected to more than double due to travel to countries with poor logistic connections. Efficient airport management requires a considerable amount of data about the structure and state of airport facilities, as well as the action at the airport and its surroundings. The data must be accurate and readily available to the ground staff at any time. Although the ground staff can obtain data manually according to prescribed protocols, this time-consuming activity can also be the source of human errors. The data can also be obtained and processed with automated procedures and are part of existing or developing geographic information systems. The demand for prompt, accurate, and available data at any time has encouraged the development of systems that enable automated acquisition and processing of data in real time [2].
The data can be obtained in different ways: from classic geodetic measurements, LIght Detection and Ranging (LIDAR) laser scanning, synthetic aperture radar (SAR) interferometry, or satellite monitoring, which are described in [3,4,5,6]. On the one hand, fast and accurate measurements of the surface of the runway are very important and, on the other hand, it is necessary to find the cause of the emergence of deformities. Deformities occur on runways mostly due to the large forces at airplane landing, tectonic and meteorological changes, underground streams, or other causes, as described in [7]. The influence of an airplane’s axle wheel load on runway damage is described in [8]. The author describes a study of FAARFIELD V1.42 software used to determine the influence of wheel load on the runway surface and the damage underneath it. The authors of [9,10,11] describe different causes and methods to determine damage on runway surfaces.
This paper focuses on runways that must provide corresponding loads, good surface friction, smooth driving for aircraft, and, most important, safety. All of these depend on appropriate runway maintenance. The system for runway maintenance will be merged with the obtained results into a geo-information maintenance model in which continuous geodetic monitoring will be emphasized. In fact, quality geodetic monitoring can provide on-time detection of anomalies on runway surfaces. Well-maintained runways and reliable geo-information systems for runway maintenance systems are very important for ensuring that aircraft are able to take off and land safely [12]. Distortions on the surface hinder the pilot’s management of the aircraft, which causes vibrations on the board. This leads to complications for correctly reading the measuring instruments, which causes mechanical defects in aircraft and diminishes the contact of the tires with the ground. This ultimately affects the correct performance of the braking system [13]. Runway maintenance must be performed periodically with short-term, middle-term, and long-term plans, with known equipment and methods. This is intended to maintain runways in the best possible way, with fewer interventions and less traffic congestion, and in an economically advantageous way under the best possible conditions. Late renovations result in greater distortions, which means that renovation costs will be higher and renovations will last longer. The costs for airport companies also increase as they must ground their aircraft during the renovation or find substitute locations [14,15,16,17,18,19,20]. For instance, from 1 May to 20 June 2014, the runways were renovated at Dubai Airport. During this time, the Emirates Airline Company grounded 20 airplanes in May and 22 in June, which caused the loss of 1 billion dirhams [21].

2. Existing Information Models for Monitoring Distortion on Runways

Noninvasive geodetic and geophysical measurement methods enable the detection of information on and under the surface with high accuracy. These methods are not included in the existing models that are used for monitoring the state of the runways. The existing models include the Aircraft Classification Number/Pavement Classification Number (ACN/PCN), which was developed by the International Civil Aviation Organization (ICAO), and the runway condition assessment matrix (RCAM), which is used during bad weather by the Federal Aviation Administration (FAA). Furthermore, these are not included in the newer models, such as the Boeing method [22]. Their connection enables us to study the interactions between distortions on the surface and discontinuities in the lower structure of runways, which allows us to predict future states, including the spread of existing distortions and the creation of new distortions.
The detection of distortions, which defines their shape, dimensions, and underlying causes, is a complex process that requires an interdisciplinary approach [23].
Two main types of deformations include surface deformations (such as cracks, humps, and holes) and underground deformations, among which voids and underground cracks are the most frequent. There are more categories of data monitoring methods: geodetic methods (GPS, RTS, and laser scanning) and an optical method (vibrometer) discover surface deformations, whereas geomechanical methods (HWD, FWD, and FFWD) and geophysical methods (GPR) discover underground deformations [24]. Further, many methods can be used for data processing and analyzing. Deformations are usually analyzed by the Hannower, Karlsruhe, Frederiction, or Delft method. These methods aim to analyze identical situations in multiple time periods [25]. When dynamic methods of data gathering are used in monitoring, they are not suitable for deformation analysis because dynamic methods cannot provide monitoring of identical situations in several time periods. To establish underground deformations and especially a correlation with surface deformations, geomechanical and geophysical methods are also included in the model [26].
Deformities on the runway occur based on movement, and according to the movement, they are divided onto vertical, horizontal, and spatial 3D deformities. The cause can also be loading, and according to the loading, they are divided into elastic and plastic. Two methods are used to determine the size of the movement: absolute (physical) and relative (geodetic). With the development of the geodetic measurement technique in the last decade, it has become regularly used in the exact assessment of deformities. Geodetic control measurements are simple, reliable, and fast, which is a great advantage in determining runway deformities since there is no need to close the runway or to intervene in its inwardness. There are several methods of deformation analysis, depending on quantity measurements (such as length and angles) and desired final values (such as coordinate changes, variations in length, angles, etc.). The usual task of geodetic deformation analysis is to study the movements and deformities of the object in space and time. With the development of measurement techniques and analytical procedures on the one hand and the need for interdisciplinary treatment of the solutions on the other hand, deformation analysis has spread to the treatment of the whole process, which includes, besides the parameters of the resulting deformity or movement, the capture and description of the whole process. It is about physical interpretation and modeling the relations between causal forces and resulting changes in space and time. The object, the influences, and the resulting changes are dealt with in the joined dynamic model. Geodetic deformation analysis is becoming more an analysis of dynamic processes. Such treatment demands the expansion of geodetic knowledge in areas such as mechanics, geotechnics, and similar sciences, which also deal with changes of objects, as well as the causes of their occurrence. For successful interdisciplinary treatment of the processes of object change, of which the consequences are movements and deformities, standardization of the procedures of treatment and terminology is necessary. Dynamic models are the most general models, and with simplification, static, cinematic, and identity models are derived [27].
Recently, the automatized acquisition and processing of spatial data on the distortions of roads and runways have been a focus in many studies [28,29,30,31,32,33,34]. In the studies, the authors focused mainly on the interpretation and analysis of road and runway records. The use of geophysical methods, and to a lesser extent geodetic methods, was also the subject of a few studies in Europe and other parts of the world [35,36,37,38,39,40,41,42,43,44]. The authors studied the detection of distortions on and under the surface of runways and roads with the use of 3D laser scanners and ground-penetrating radar (GPR). This has been combined with other noninvasive methods, such as Fast Falling Weight Deflectometer (FFWD) for measuring the load capacity with a ground load capacity meter [45].
The use of 3D laser scanning with high resolution to detect surface deformities of runways is described in [46,47,48,49]. The usability of radar measurements for detecting distortions of the surface, discovering the underground infrastructure, and finding cracks and voids and other anomalies in the lower structure of runways were first studied in [35]. In the last decade, researchers [50,51,52] have been dealing especially with SAR interferometry capture of data to detect deformities on runways. They found that distortions can be detected in time by the use of radar measurements, which reduces the costs of restoration and runway maintenance. Geomechanical studies of underground distortions are expensive and require a long time, which becomes an issue for airports.
Furthermore, research on the usage of geodetic methods (terrestrial, Global Navigation Satellite System (GNSS), and LIDAR technology) and geophysical methods (georadar measurements), including their connection in researching and predicting distortions of runways (distortions on the surface and discontinuities in the lower structure), cannot be found in the accessible literature or the methods are not sufficiently analyzed. Geodetic and geophysical methods are not included since they do not consider the detection of distortions under runways and thus weaken the prediction of distortions. The use of geodetic and geophysical methods enables the detection of distortions on and under the surface, and their connection enables us to predict the spread and creation of new distortions on runways.
The findings of current studies have been upgraded with precise geodetic and geophysical measurements, thus creating a new innovative geo-information model for continuous monitoring and the prediction of runway distortions. This will enable us to detect distortions accurately by finding the interactions between distortions on and under runway surfaces and predicting their spread or the possibility of new distortions being created.

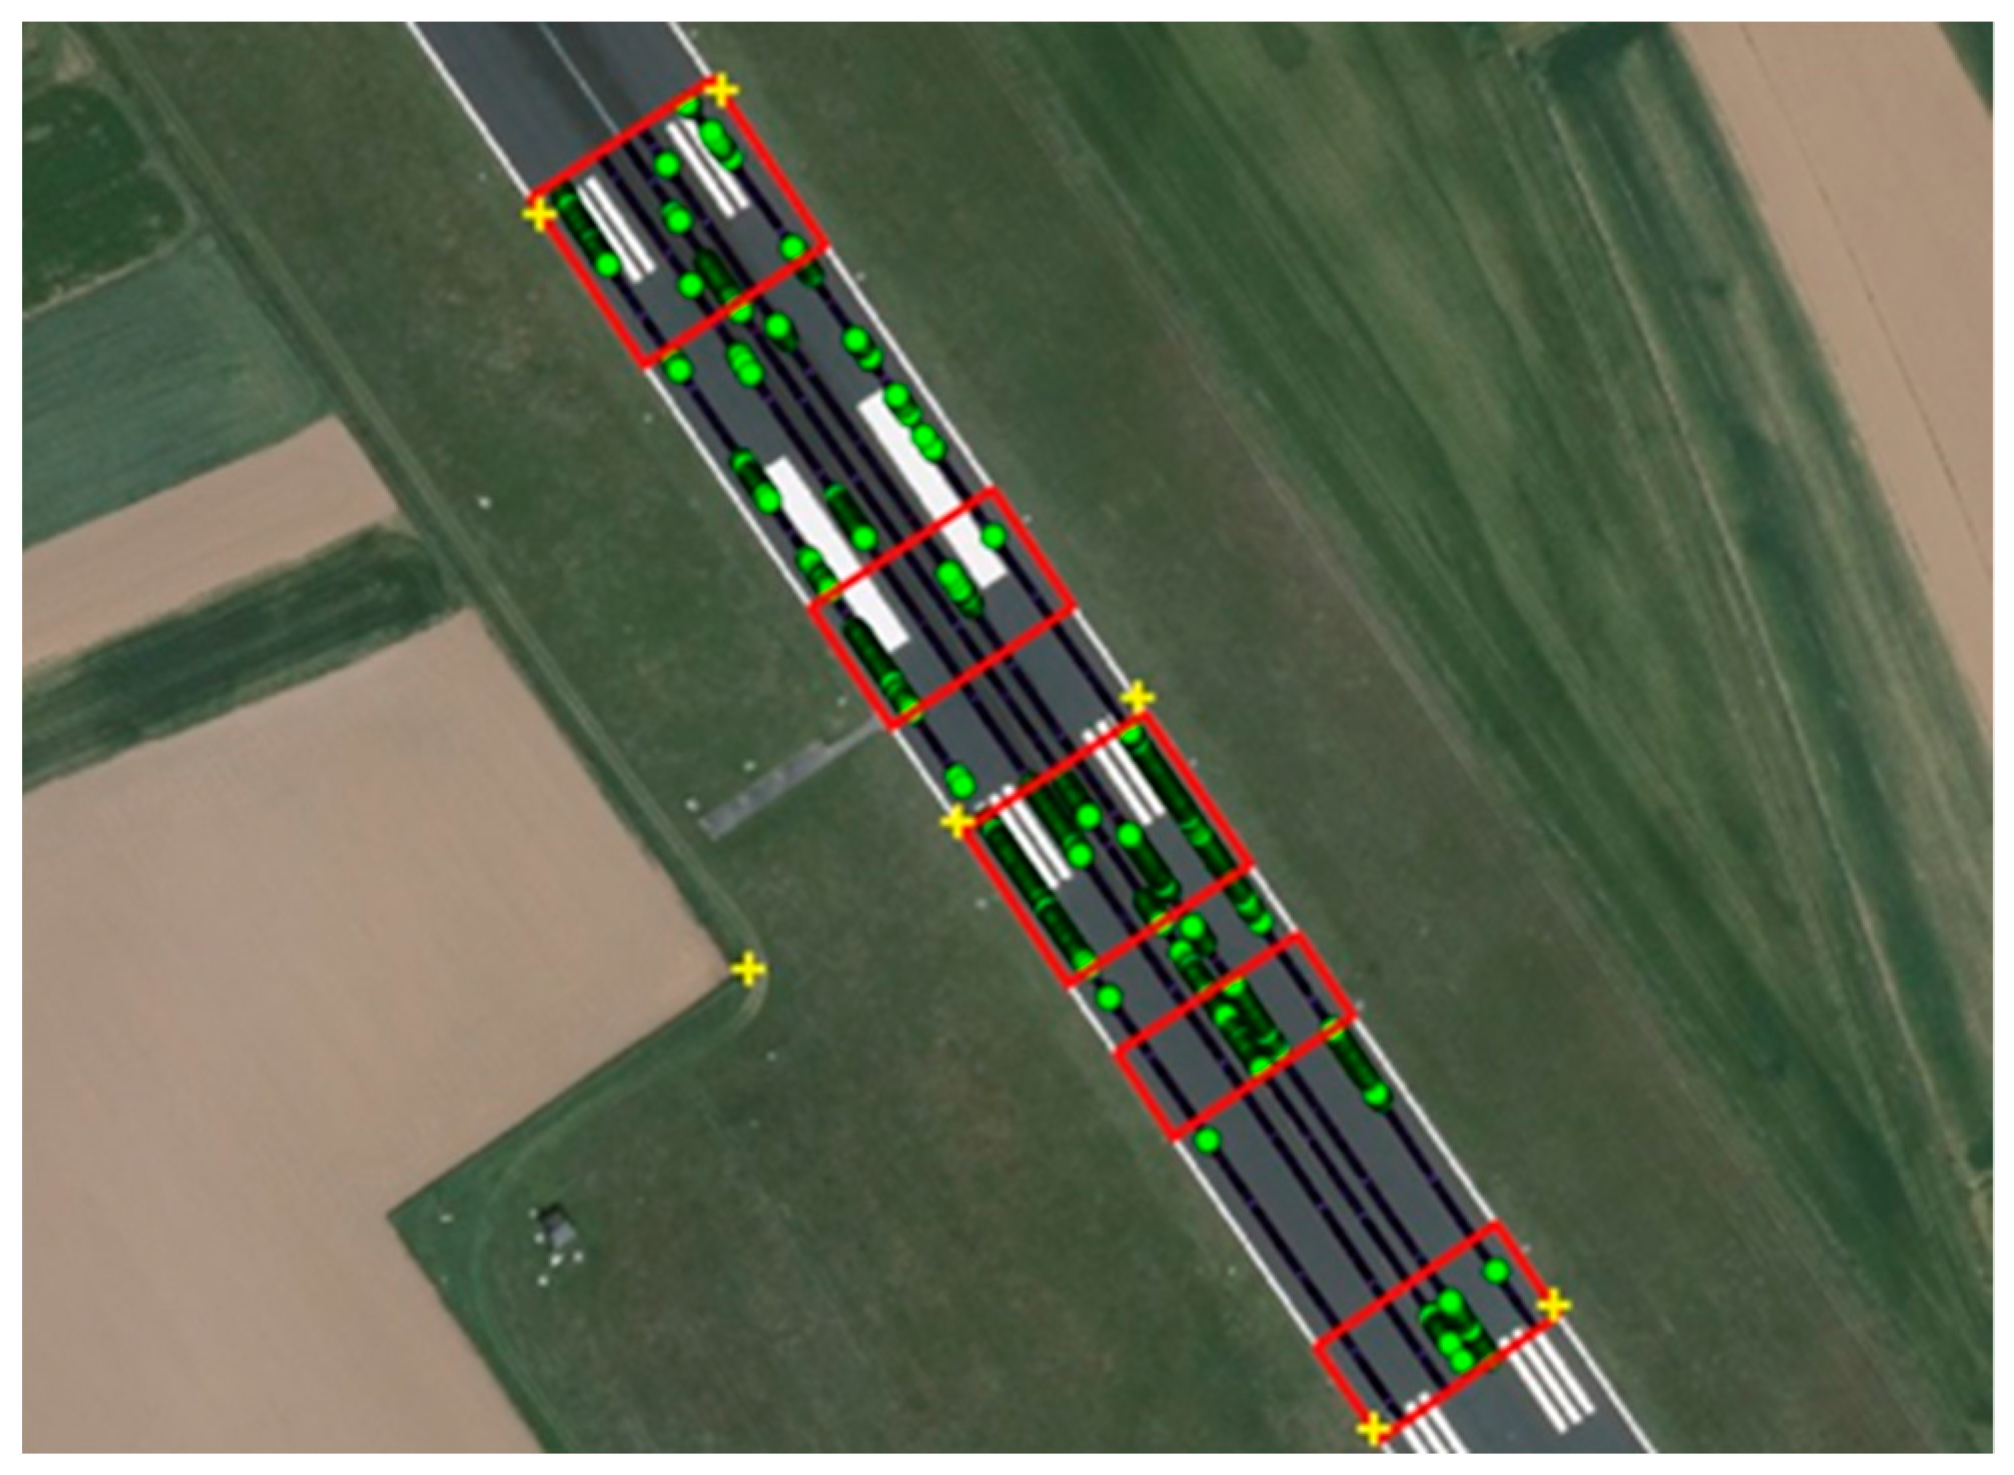
3. Materials and Methods

Distortions were monitored on a runway at Edvard Rusjan Airport in Maribor in a touchdown zone (Figure 1 and Figure 2), which is the area that is most vulnerable to deformation. The runway is 2500 m long and 45 m wide. The slope is 2.025‰ and the load capacity is pavement classification number (PCN) 86/F/A/X/T.

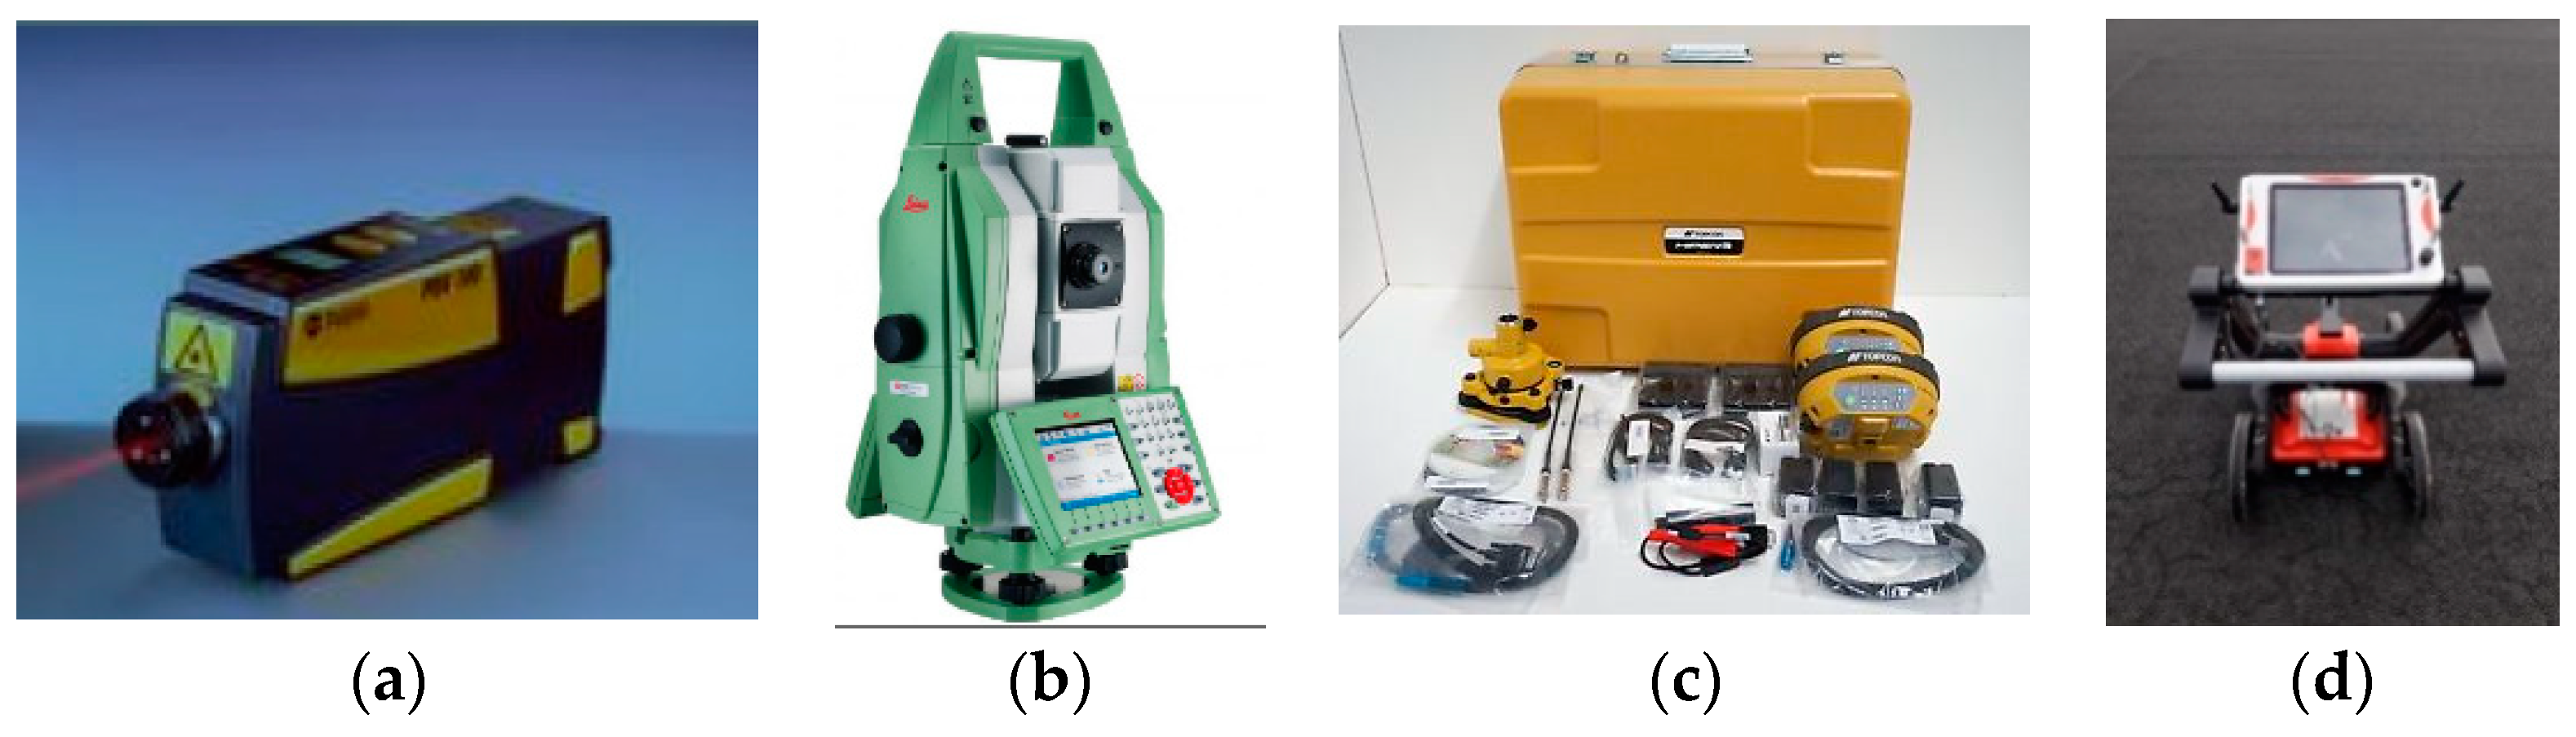
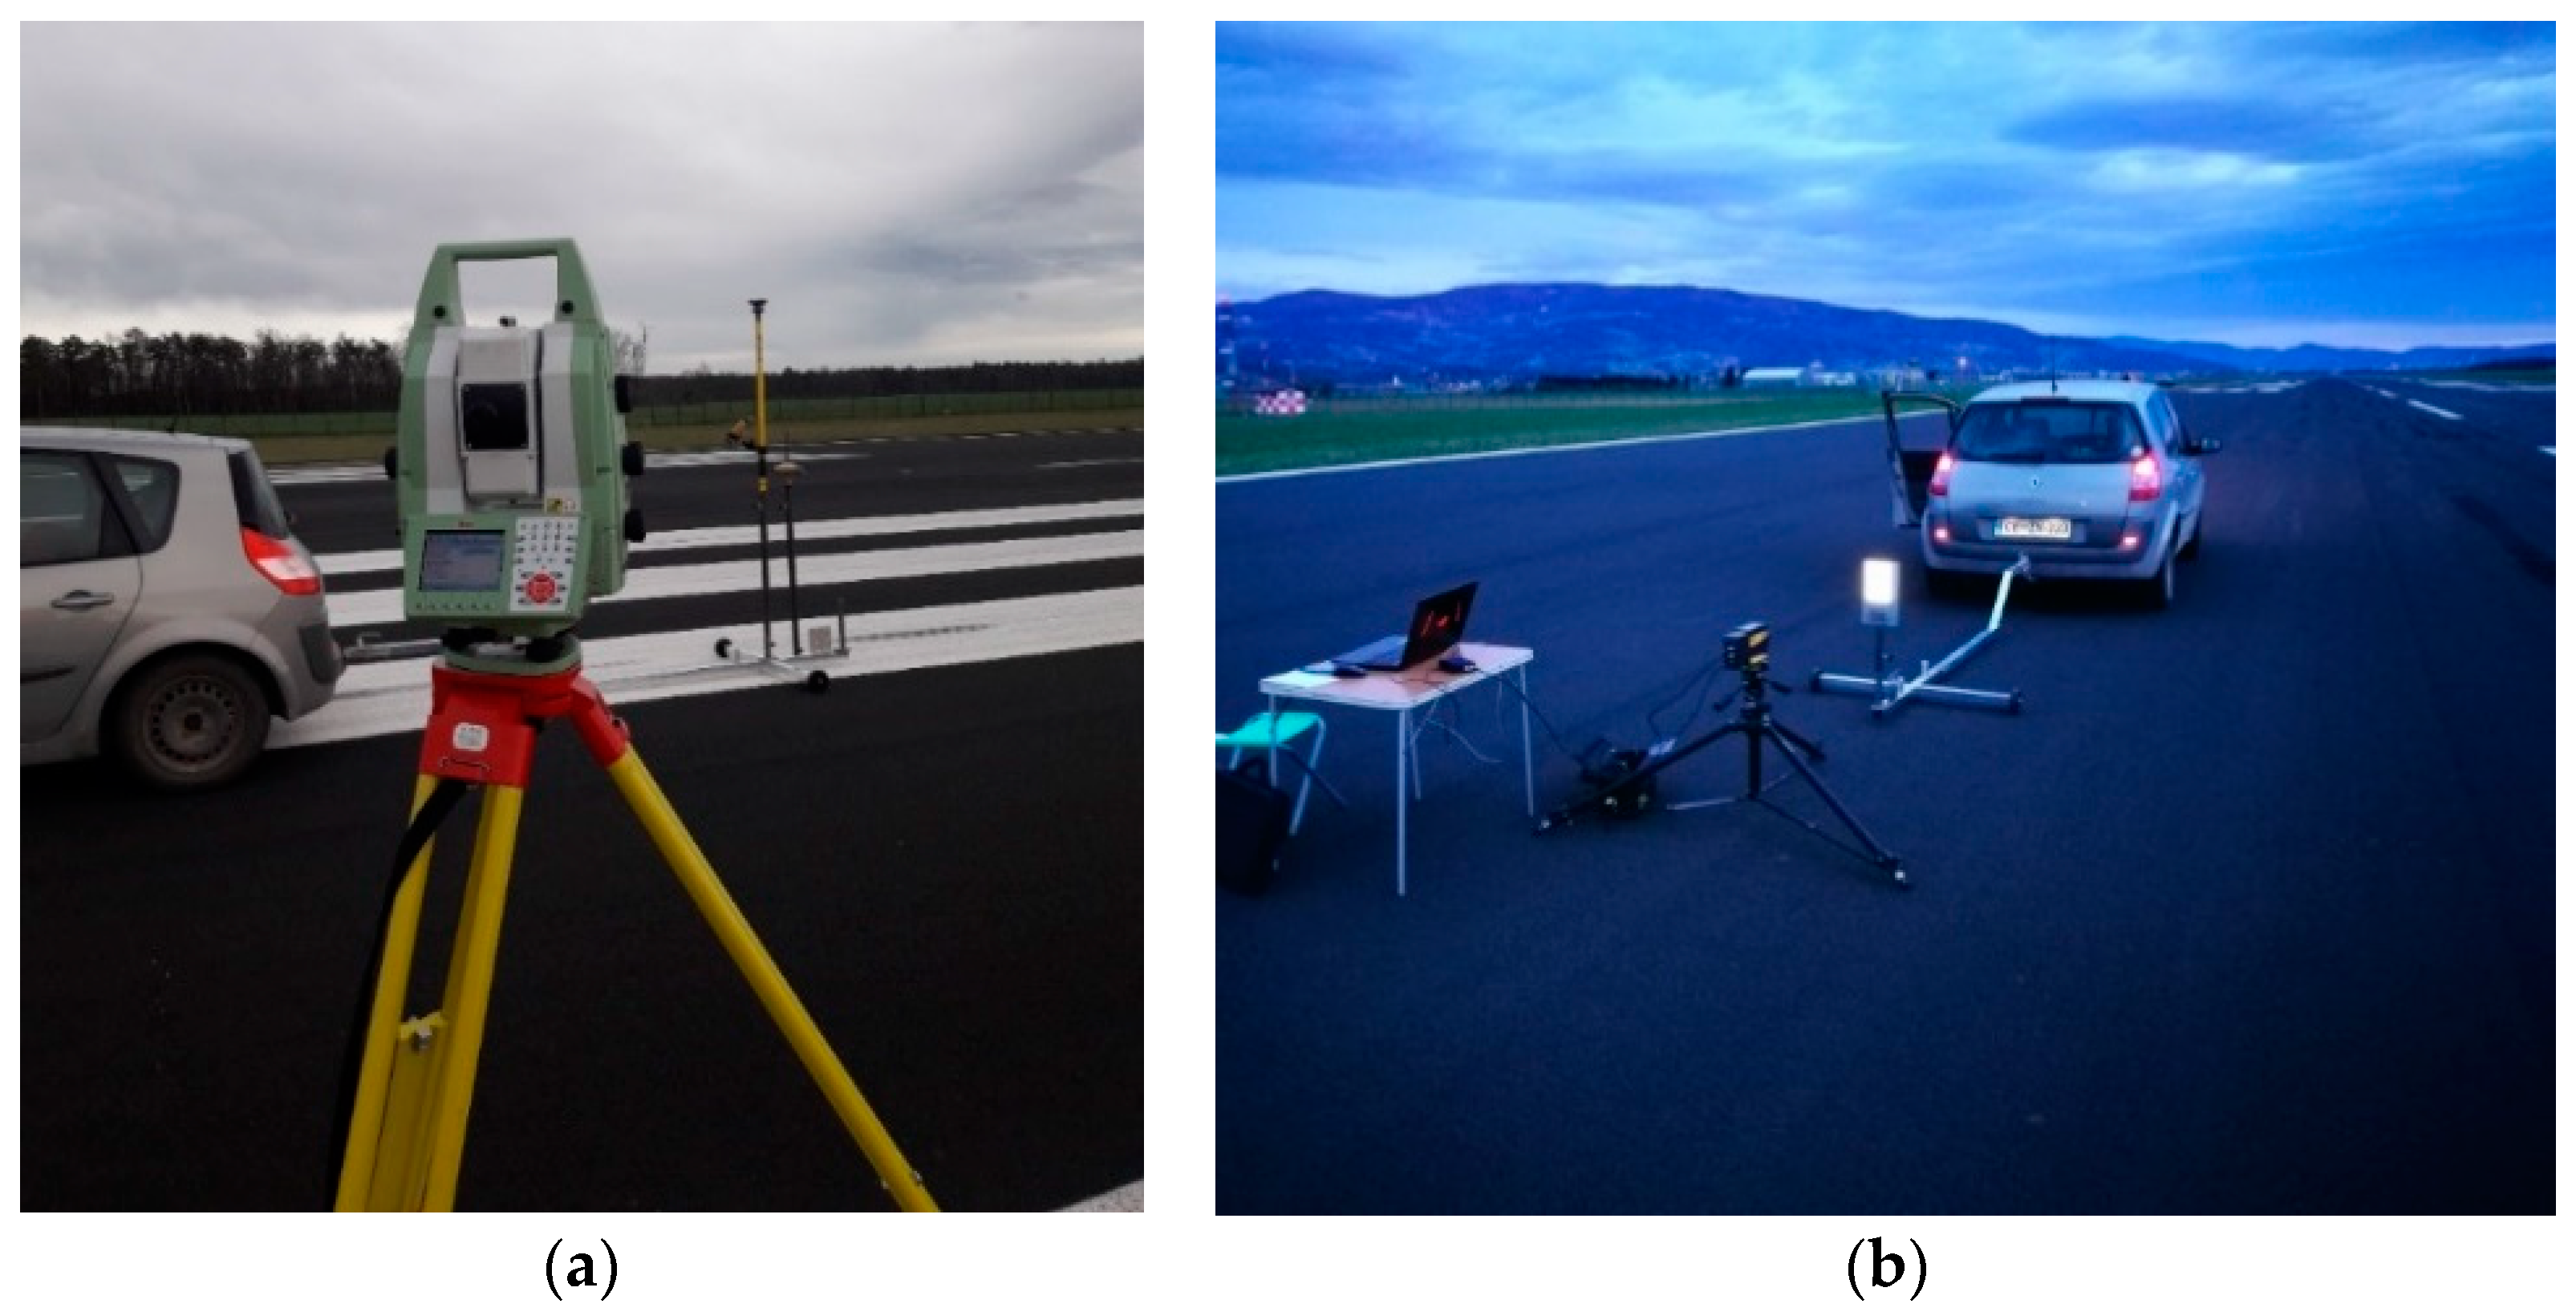
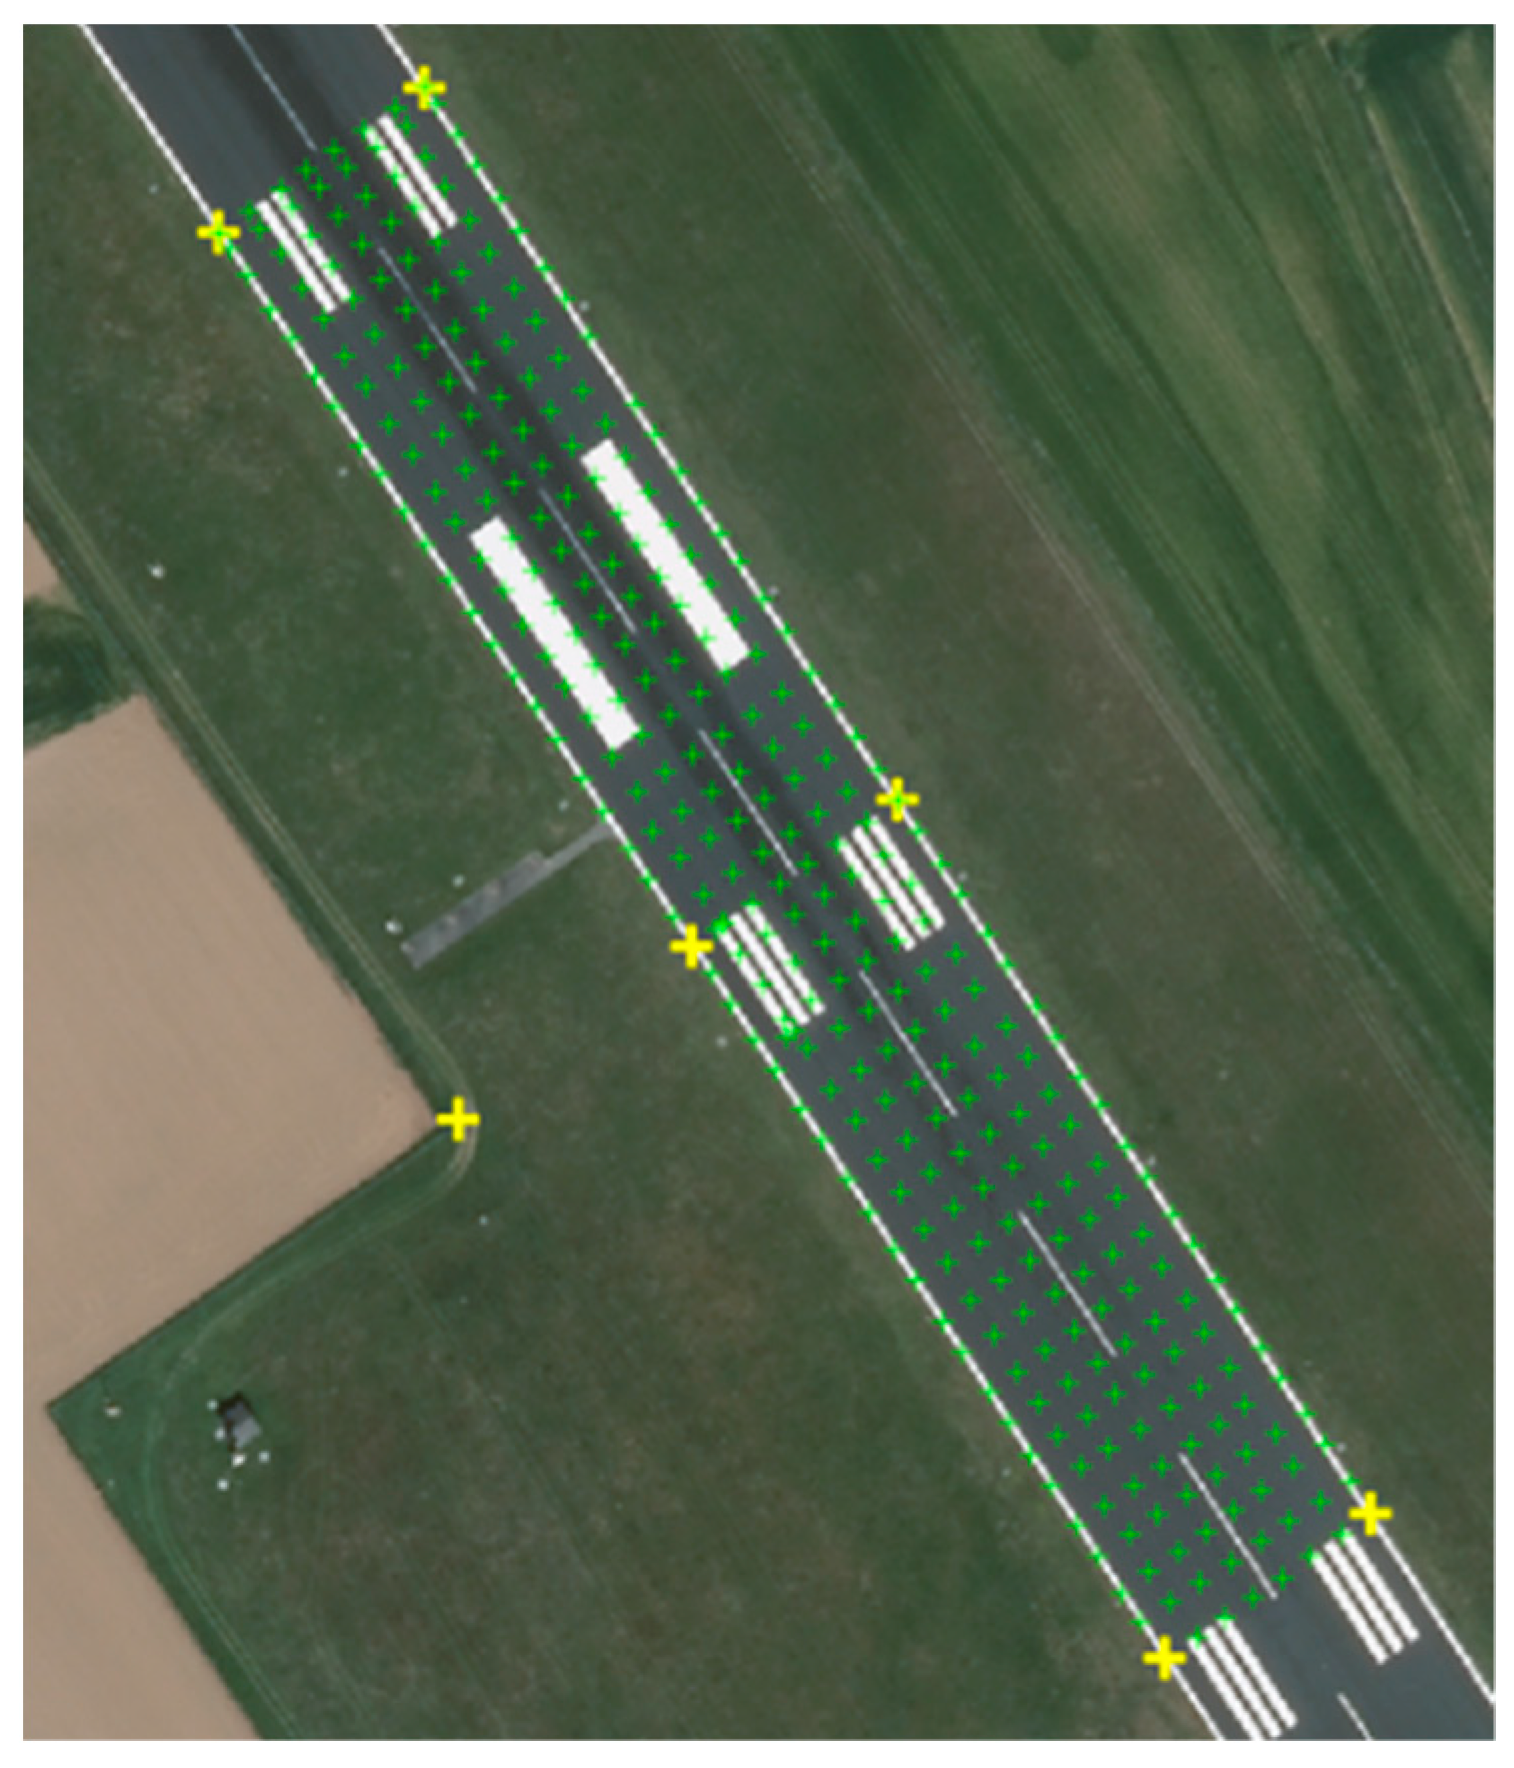
3.1. Measurement Instruments and Methods of Data Processing

The total area of the touchdown zone was divided into five subareas, which were processed individually but were combined in a unified coordinate system. The nonhorizontality of the surface was monitored by a Swiss (Heerbrugg) manufacturer Leica RTS TS50 geodetic instrument with an accuracy of 0.5 s. Ten readings per second were taken with automatic tracking with the GeoCOM protocol by Swiss (Heerbrugg) manufacturer. The 360° prism was placed on the processed vehicle with the set of remaining measuring technology that is shown in Figure 3.
The towing vehicle was stiff and unsprung. Five longitudinal profiles were transported before 8700 points were recorded at an even minimum speed of 6 km/h. The detected areas of the deformed runway were additionally recorded with a German (Waldbronn) manufactured Polytec PDV-100 doppler vibrometer, which enables non-contact measurement of vibrations on the surface in the speed range of 0.05–0.5 m/s at a frequency range of 0.05–22 KHz. These are shown in Figure 4a,b.
The working distance was in the range of 0.1–30 m. This is why the distortions were only measured with the vibrometer in areas where changes with the geodetic methods were detected after an altitude component of more than 6 mm.
The Japanese (Tokio) manufactured Topcon GNSS equipment was set on the towing vehicle and on the GPR -Mala (Australia Brookvale)with the purpose of positioning the vehicle and locating the measured values on the comparative plane, which was recorded in a classic geodetic way with density of the points of 2.5 × 2.5 m, shown in Figure 5.
The places on the runway where the distortions exceeded the permitted limit of 8 mm were obtained with geodetic measurements of nonhorizontality. This is prescribed in the Regulation on Aerodromes in the Republic of Slovenia to perform quality geodetic measurements. Seven geodetic points were stabilized at the edge of the runway, which formed the basic geodetic net. The remaining geodetic measurements were obtained from these points. The net points were leveled according to the Hannover method. To determine the discontinuities under the surface, ground-penetrating radar (GPR) was used. The measurements were obtained on the transverse profiles of the spots where distortions in altitude were detected with the geodetic method. GPR enables us to measure or detect, based on ultrasound, the structure of the ground to a depth of 1.4 m.
The big advantage of the described method is that the measurements can be performed with one vehicle. Thus, errors of even sampling and time-consuming measurements, which could occur with the use of several vehicles, and consequently disturbing traffic or even closing the airport can be avoided. It is also important to use the towing vehicle and avoid closing the runway. The data on the condition of the runway are automatically put into the airport geo-information system, which is used by the airport administration and the maintenance services, as shown in Section 4. The data are very useful for the service since it is easier to decide, based on the automated overview of the state of the runway, about potential restorations and have insight into the state of the runway’s deformation. It is also significant that the suggested geo-information system automatically and quickly warns about deformities; therefore, the measurements can be taken on time, which diminishes the cost and the need to close the runway for extensive restorations. If this method were used more frequently, measurements could also be made at night or at a time when the runway is closed. The method is open, which enables input of other kinds of data, such as geo-mechanic and geophysical measurements, and does not obstruct aeronautic frequencies or cause additional problems.

3.2. Mathematical Determination of the Plane Deformation

The results were addressed in a unified coordinated system, which enables easier processing and analysis of the measured values to establish the geo-information model of runway maintenance and a unified deformity analysis of the geodetic net. The first measurement in Table 1 shows the starting comparative era or the basic grid.
Since it is physically impossible to obtain the same point every time, the runway was divided into zones, inside of which the points were measured and calculated in the plane. The difference between the relative point distance of the rectangular net and the individual plane represents a mutual vertical departure. The vertical departures between the time dimensions (ΔR1/R2, ΔR1/R3, and ΔR2/R3) were determined based on the difference of the rectangular net point distance measured in the first phase from the plane leveled through the points obtained in the first time dimension (R1), the plane leveled through the points obtained in the second time dimension (R2), and the plane leveled through the points obtained in the third time dimension (R3). The plane was adjusted to the points that were obtained in the individual time dimension. The non-coplanar points were determined by the equation of the plane with the use of the Moor–Penrose matric inverse, which returns the solution through the method of the smallest squares. In addition, the method minimizes the vertical departures from the plane. The procedure for the calculation of the plane is described in [53].
The general form of the equation of the plane with the normal vector n = [a b c]T by [53] is:
n · x + D = 0 a · x + b · y + c · z + D = 0 a · x + b · y + c · H + D = 0
where a, b, c, are the unknowns of the equation of the plane and D is the distance from the centroid of point cloud.
It is assumed that c = 1 (weight) and the equation of the plane is written in the matrix shape, where x is the vector of the unknowns [53]:
A · x = B [ x 0 y 0 1 x 1 y 1 1 x n y n 1 ] · [ a b D ] = [ H 0 H 1 H n ]
Since we are looking for the equation of the plane through more than three points, the system is predefined. The solution is found with the use of the left pseudoinverse matrix or Moor–Penrose matrix inverse A+ [50], where N is the number of points:
A T · A · x = A T · B [ x i · x i x i · y i x i y i · x i y i · y i y i x i y i N ] · [ a b D ] = [ x i · H i y i · H i H i ] x = A + · B A + = ( A T · A ) 1 · A T [ a b D ] = ( A T · A ) 1 · A T · B
If it is assumed that x i = Y i = H i = 0 , we can conclude that D = 0 and the plane passes through the centroid of point cloud.
The accuracy of the calculated parameters is given with the diagonal part in the variant–covariant matrix [53]:
= [ σ a 2 σ ab σ ba σ b 2 ]
The parameters of the equation of the planes R1, R2, and R3 and their accuracy are shown in Table 2 and Table 3.
The distance of the rectangular net points Ti = (xi, yi, zi) from planes R1 and R2 is equal to the length of the projection of the rectangular vector from the plane to the point Ti ( m ) on the normal vector of the plane ( n ) [53]:
d = | proj n m | = | n · m n |
The average vertical departure between the individual dimensions Δ is:
Δ Ri / Rj = d ı ¯ d ȷ ¯
where d ı ¯ and d ȷ ¯ are the average distances of the points of the rectangular net from planes Ri and Rj (R1, R2, and R3). The calculated values from Equation (2) are shown in Table 4.

4. Results

Weak logistic infrastructure and operative processes can be the main obstacle to including them in the world market [54]. As found in [55], bad logistic infrastructure, including at airports, and inappropriate length and bad quality of runways are the causes of bad logistic services. This suggests the necessity for efficient management, which demands unambiguously defined processes among the included actors. Maintenance of the airport infrastructure is one of the basic processes in airport management, in which three actors are included: the runway maintenance service, which carries out monitoring and notes changes on the runways; the maintenance and investments director, who analyzes the results of the monitoring and prepares suggestions for renovation plans and investments for the administration; and the administration, which accepts the decisions about their realization.

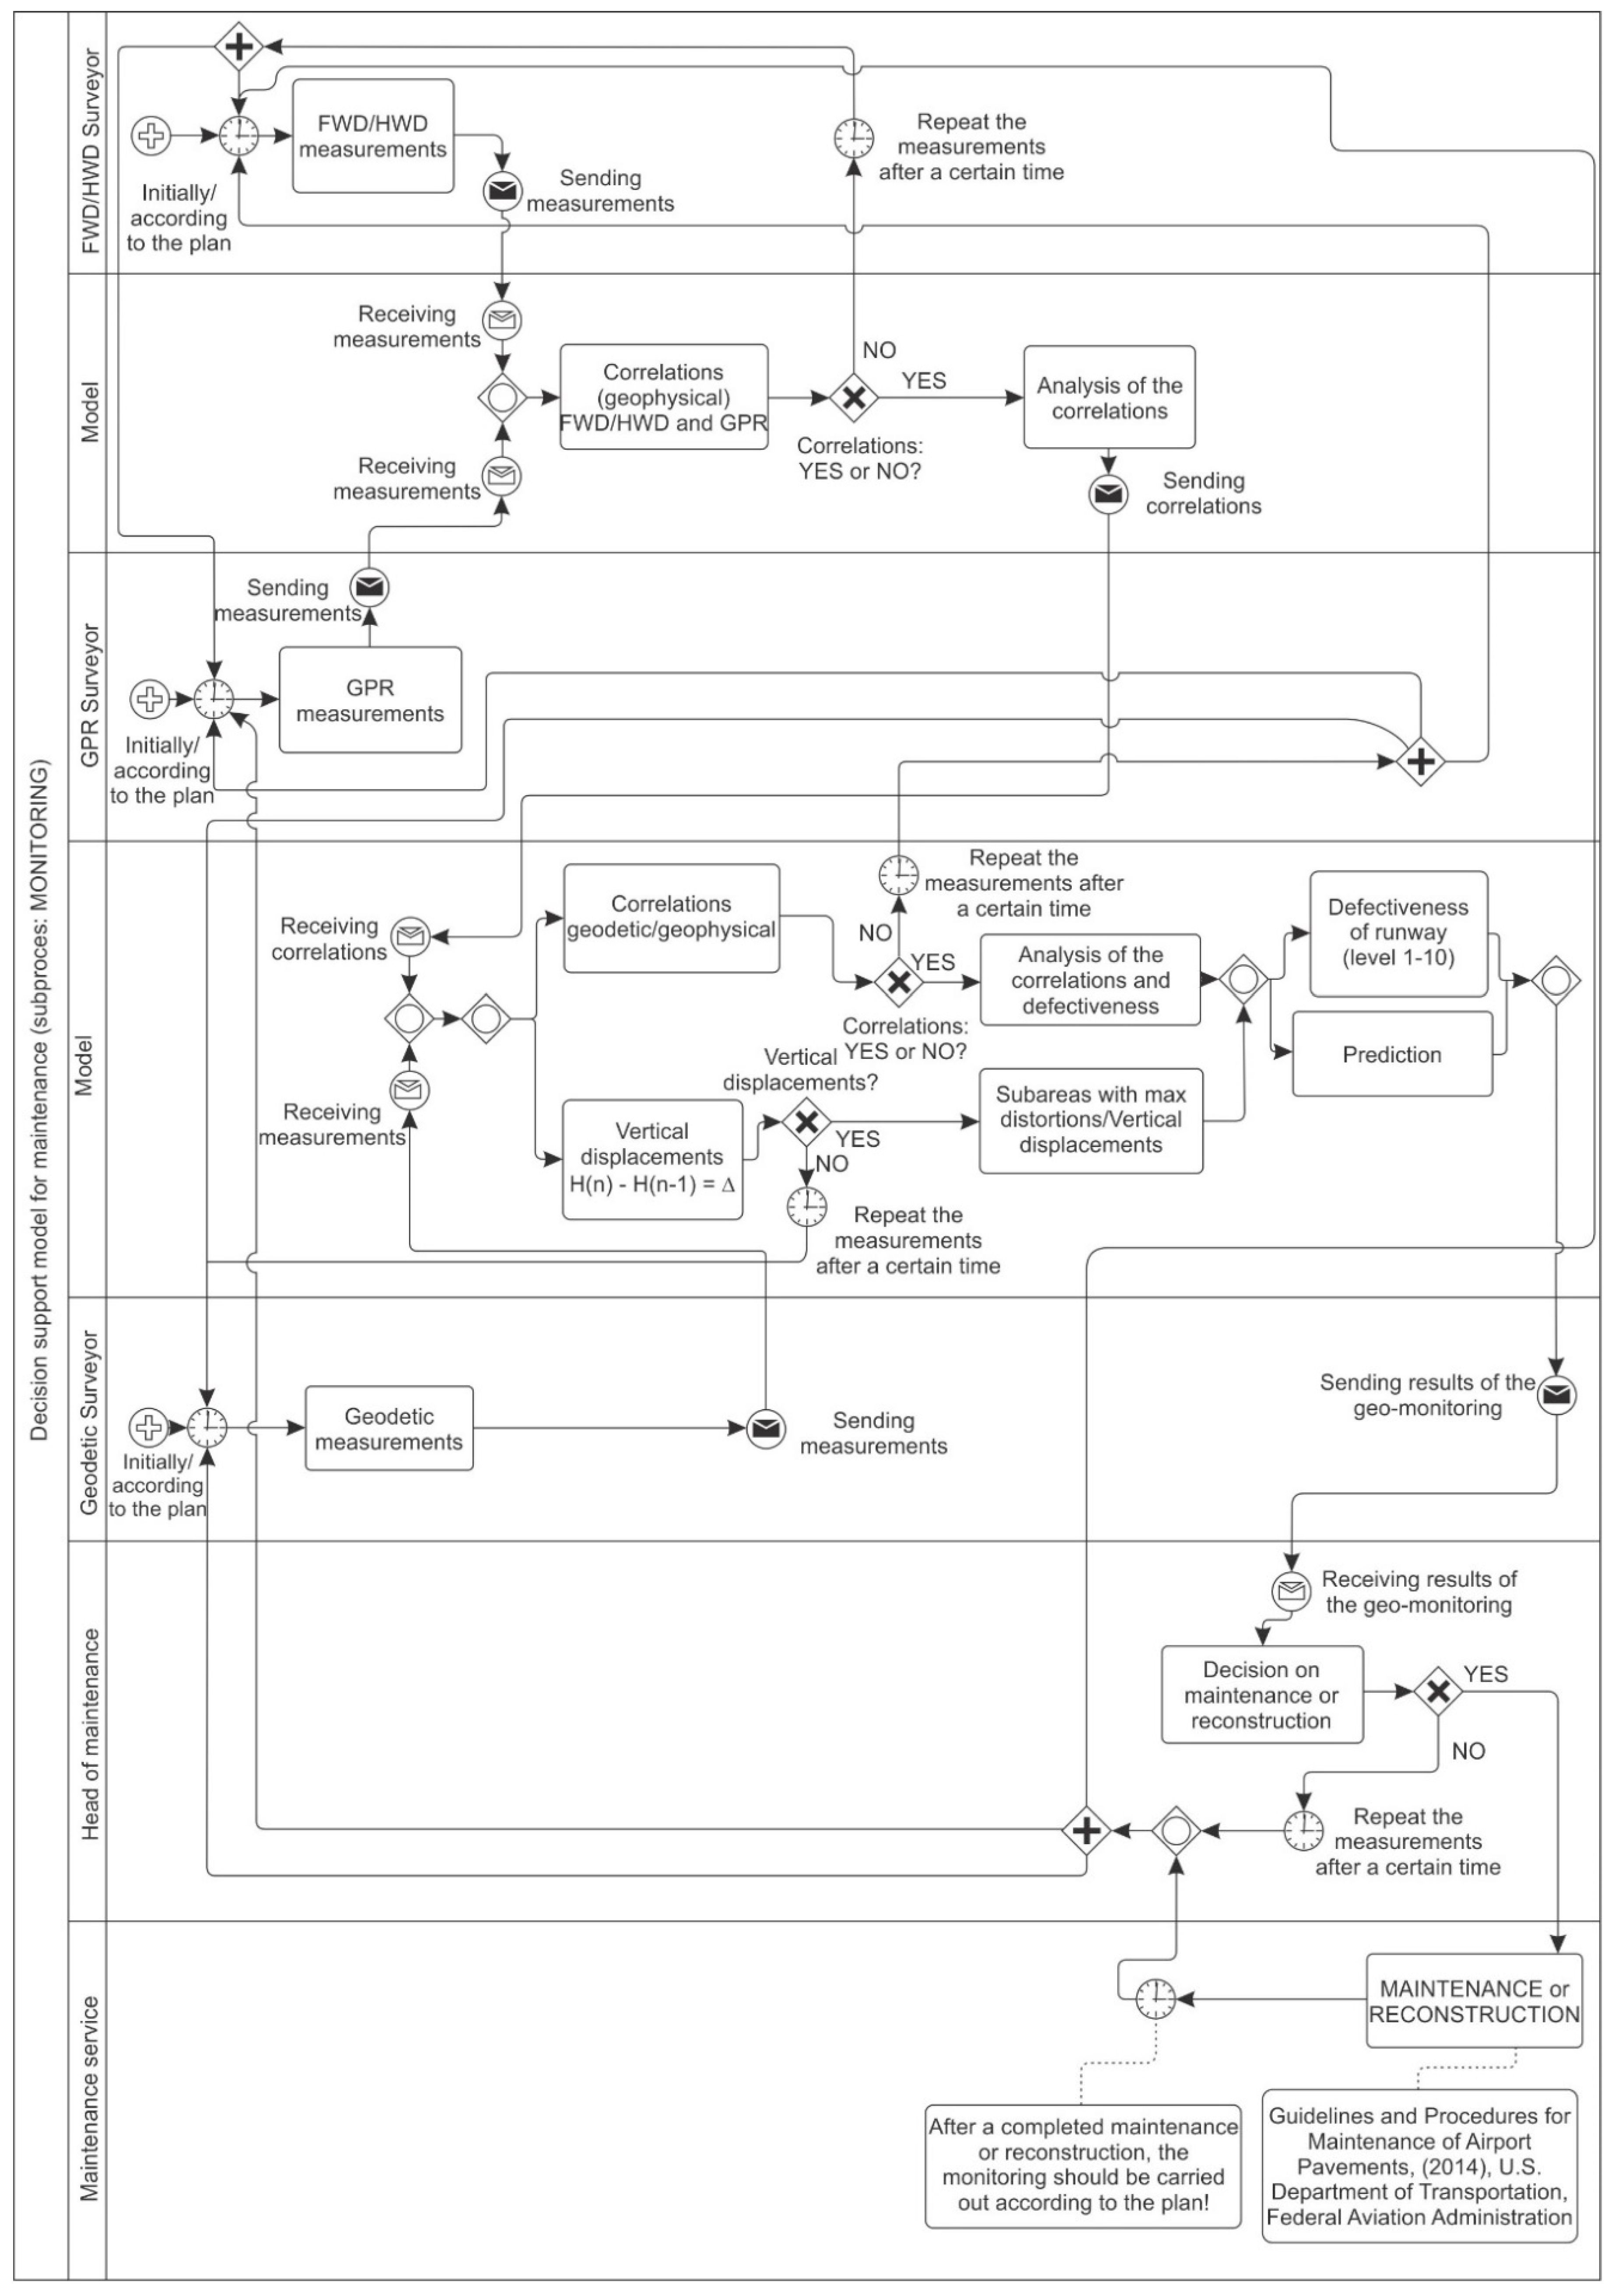
4.1. Innovative Geo-Information System for Decision Making

The central part of the maintenance process is the subprocess of monitoring. The decision-making model is made for that purpose (Figure 6), connecting geodetic, geophysical, and geomechanical measurements with the core of the decision-making model, i.e., the algorithm, which, based on a comparison of the results of geodetic measurements performed at several time periods, determines the deformities and vertical deviations and the areas of maximal deviation. The deviations are classified based on size grade and make up the deviation graph (Figure 7).

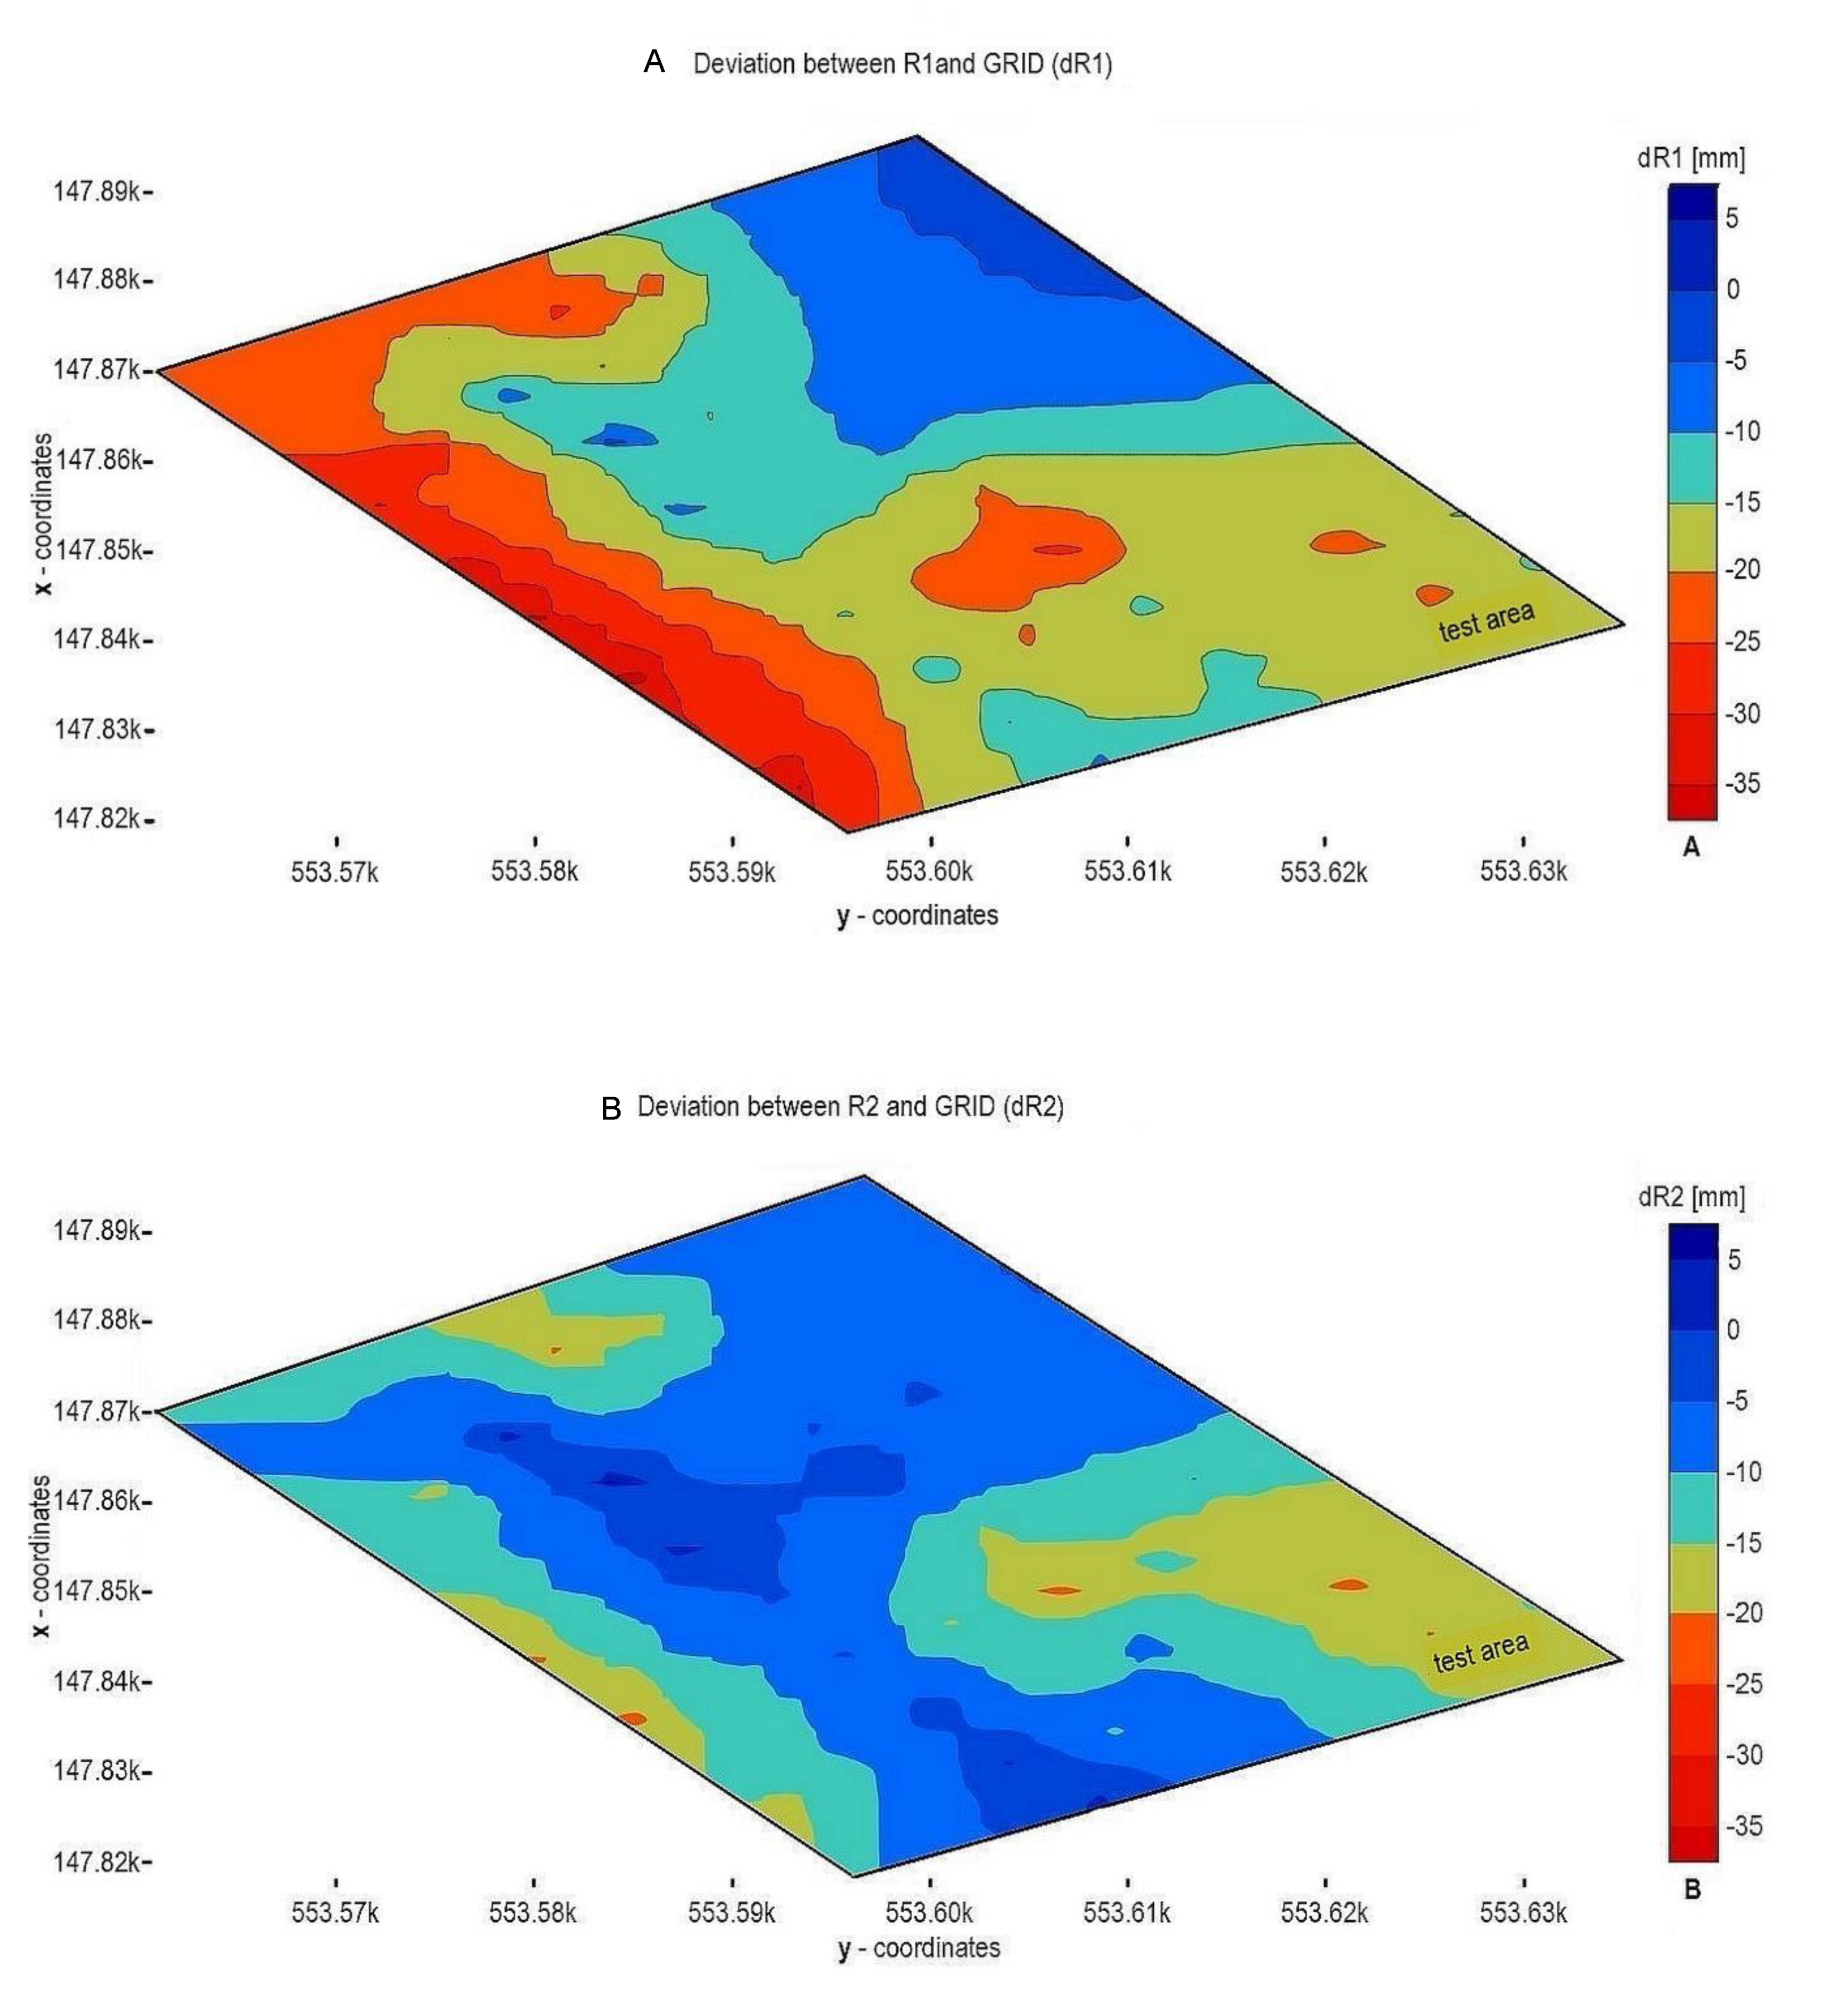
4.2. The Results of the Studies of the Determination of Deviation

In Figure 7, graph A shows the deviation of the first forward measurement from the basic grid, graph B shows the deviation of the second forward measurement from the basic grid, and graph C shows the deviation of the third forward measurement from the basic grid. These graphs show the deviations measured with the RTS method. The deviations are in the range from −35 mm (red) to 5 mm (blue). On parts of the runway where bigger deviations were found, they were additionally determined with the vibrometer, and potential causes for their occurrence under the ground were checked with GPR.
The results of the monitoring are stored in the geo-information base and present the input data to the basic process, shown in Figure 7. The use of mobile devices and augmented reality, which enables the integration of the results of the model into a physical picture of the real world, enables a better understanding and visualization of the results of the monitoring, which is essential for fast and important decision making.
The procedure is very simple and fast in meeting the requirements of airport runways. In the given geo-information system, the monitoring data are obtained after 30 min from the beginning of the measurements or automatically transferred from the field to the geo-information base depending on the characteristics of the runway. During this period of time, the runway does not need to be closed since the measurements can be performed at any time. The results of the window monitoring and geodetic measurements are shown in the shape of the image of the vertical departures from the basic grid. If a dark blue or orange zone appears in the image, the information of the state is triggered and sent to the administration of maintenance and investment service management. Furthermore, a decision-making renovation procedure is triggered in the new geo-information system of continuous monitoring of runway distortions.

5. Discussion

The quality and range of the logistic infrastructure significantly influence the whole logistic system and consequently the international competition. Monitoring the state of the logistic infrastructure and developing information models for condition monitoring with the aim to support decision making are very important. As already mentioned in the introduction, runways are extremely exposed to deformation, which is why the monitoring of their surface is critical: timely deformation detection saves time and money and prevents runway closure. Therefore, the model for deformation monitoring of runways was developed to evaluate runway condition. The model is open to enable the inclusion of other measures, especially geomechanical and geophysical, which helps to determine the causes of deformation appearance. Indeed, deformation determination and understanding the causes for their emergence are an important source of information in the phase of decision making about the course and extent of maintenance work. For the purpose of model designing and testing, four measurements were conducted in different seasons—spring, summer, autumn, and winter—at the airport Edvard Rusjan in Maribor, according to our assumption that maximal vertical deviations resulting in deformations would appear in certain seasons. Moreover, in the parts of the runway where the largest deformations and/or maximal deviations from the grid were perceived—orange and red areas in Figure 7—geomechanical (fast falling weight deflectometer (FFWD)) and geophysical (GPR) measurements were additionally carried out. Maximal deviation of the first measurement from the basic grid was 36.8 mm; the maximal deviation of the second measurement from the grid was 23.9 mm and the third measurement from the grid was 33.1 mm. In addition, the obtained results of deviation on these areas were compared to geomechanical and geophysical measurements as seen from the process in Figure 6. The comparison indicates the interaction (correlation) between anomalies under the surface (cracks, runway lower structure was not thick enough or was poorly reinforced), poorly built-in installation systems for the runway lightning, and deformations on the runway surface. As a result, the correlation shows the causal connection between anomalies under the surface and deformations on the surface, and the spread of the runway deformation can be predicted. The resulting analysis exposes the question of further monitoring and demands cyclicality of each measurement. The maintenance of the monitoring data and further measurements will be done by the maintenance service, which will also be the main user of these data. These data are the source of the information needed for the management in maintenance decision making. In our opinion, the monitoring should be done periodically, whereby the measurements of deformations on the surface should be taken more often. However, when repeated distortions and deformations are perceived, or they appear on new parts of the runway, geomechanical and geophysical measurements should be done to explain the reasons for their appearance. Above all, the decision logistic information model is useful for flat areas that are subject to various loads. Nevertheless, the model should be upgraded in the occurrence of the following: it is used for displacement and deformation determination on the roads; a mutual comparison of the calculated planes is not sufficient: a mutual comparison of the planes (calculated from the measurement data) is needed.

6. Conclusions

Geodetic and geophysical measurements of distortions on the runway at the Maribor Airport were obtained to study and create the innovative model. A special vehicle without suspension was created and measuring sensors (GPR, 3D reflecting prism, GNSS receiver, reflecting targets) were placed on it. Similar vehicles with measuring sensors are noticed in the literature, although they fail to contain spatial data in a unified coordinate system, which is crucial when finding out the interactions of distortions on and under runways. The development of the decision-making geo-information system for the continuous monitoring of distortions on runways was conducted in several parts. In the first part, the various geodetic and geophysical methods in the unified coordinate system were used to obtain the spatial data about the state on and under the runway and assess suitable methods to help acquire the necessary data. Modern appliances can easily contain the quality of spatial data. However, developing geo-information systems to process spatial data presents a bigger challenge. Therefore, the second part introduces the development of the algorithms for monitoring and predicting distortions, which were included in the suggested model of 3D geodetic monitoring of the state. This can be used to predict distortions on and under the runway. In the last part, the suggested model was tested at the airport and was included in the new GIS for 3D geodetic monitoring for the prediction of distortions on and under the runway, which is appropriate for smaller airports. The results confirm the hypothesis that it is possible to detect distortions on the surface and discontinuities in the lower structure of runways with the use of geodetic and geophysical methods and measurements in a very specific environment at an airport with known conditions (established constitution of the lower structure of the runways). Furthermore, this can be conducted with high accuracy. Consequently, the high precision of the obtained data or discovered distortions allowed us to create the suggested decision-making geo-information system, which is based on connecting the results of the distortions above and under runways. Based on the executed scientific studies, the appropriateness of the methods for detecting distortions on and under the surface of runways was determined, the cause of their emergence was discovered, and the model for monitoring and predicting distortions was created and included in the GIS of the airport.

Author Contributions

Conceptualization: B.K. and D.D.; methodology: D.D. and B.K.; software: D.D.; validation: B.K. and D.D.; formal analysis: B.K.; investigation: B.K. and D.D.; resources: B.K.; data curation: D.D.; writing—original draft preparation: D.D. and B.K.; writing—review and editing: D.D. and B.K.; visualization: D.D.; supervision: D.D. and B.K.; project administration: D.D.

Funding

This research received no external funding.

Conflicts of Interest

The authors declare no conflict of interest.

References

  1. Zhang, A. A Novel System of Pavement Cracking Detection Algorithms Using 1 mm 3D Surface Data. Ph.D. Dissertation, Oklahoma State University, Stillwater, OK, USA, 2015. [Google Scholar]
  2. Jackson, P.T.G.; Nelson, C.J.; Schiefele, J.; Obara, B. Runway detection in High Resolution remote sensing data. In Proceedings of the 9th International Symposium on Image and Signal Processing and Analysis (ISPA), Zagreb, Croatia, 7–9 September 2015. [Google Scholar] [CrossRef]
  3. Tomás, R.; Romero, R.; Mulas, J.; Marturià, J.J.; Mallorquí, J.J.; López-Sánchez, J.M.; Herrera, G.; Gutiérrez, F.; González, P.J.; Fernández, J. Radar interferometry techniques for the study of ground subsidence phenomena: A review of practical issues through cases in Spain. Environ. Earth Sci. 2014, 71, 163–181. [Google Scholar] [CrossRef]
  4. Hooper, A.J. Persistent Scatter Radar Interferometry for Crustal Deformation Studies and Modeling of Volcanic Deformation. Ph.D. Thesis, Stanford University, Stanford, CA, USA, 2006. [Google Scholar]
  5. Sousa, J.J.; Ruiz, A.M.; Hanssen, R.F.; Bastos, L.; Gil, A.J.; Galindo-Zaldívar, J.; de Galdeano, C.S. PS-InSAR processing methodologies in the detection of field surface deformation—Study of the Granada Basin (Central Betic Cordilleras, Southern Spain). J. Geodyn. 2010, 49, 181–189. [Google Scholar] [CrossRef]
  6. Jendryke, M.; Balz, T.; Jiang, H.; Liao, M.; Stilla, U. Using open-source components to process interferometric TerraSAR-X spotlight data. Int. J. Antennas Propag. 2013, 2013, 275635. [Google Scholar] [CrossRef]
  7. Kierzkowski, A. Model of reliability of security control operation at an airport. Tech. Gaz. 2017, 24, 469–476. [Google Scholar]
  8. Gholam, A.S.; Kashi, E. Effect of Aircraft Load and Configuration on Runway Damages. Period. Polytech. Civ. Eng. 2015, 59, 85–94. [Google Scholar] [CrossRef]
  9. Stuyfzand, P.J. The impact of land reclamation on groundwater quality and future drinking water supply in the Netherlands. Water Sci. Technol. 1995, 31, 47–57. [Google Scholar] [CrossRef]
  10. Hoeksema, R.J. Three stages in the history of land reclamation in The Netherlands. Irrig. Drain. 2007, 56, S113–S126. [Google Scholar] [CrossRef]
  11. Douglas, I.; Lawson, N. Airport construction: Materials use and geomorphic change. J. Air Transp. Manag. 2003, 9, 177–185. [Google Scholar] [CrossRef]
  12. Wang, W.; Deng, S. Evaluation and analysis of the pavement roughness of airport runway. J. Chin. Civ. Aviat. Coll. 2006, 24. [Google Scholar]
  13. D’Apuzzo, M.; Festa, B.; Giuliana, G.; Mancini, L.; Nicolosi, V. The Evaluation of Runway Surface Properties: A New Approach. Procedia 2012, 53, 1192–1201. [Google Scholar] [CrossRef]
  14. Lang, J. Lecture on Pavement Management System, Road Construction and Maintence; WSP: Montreal, QC, Canada, 13 May 2014. [Google Scholar]
  15. Domitrovic, J. Application of on Artificial Neural Network in Pavement Management system. Tech. Gaz. 2018, 25, 466–473. [Google Scholar]
  16. Breen, T.J.; Smith, A.E. Airport Pavement Management System. U.S. Patent US74372502, 14 October 2008. [Google Scholar]
  17. Tadovic, N.; Jokanovic, I.; Matic, B.; Seslija, M. A measurement of roughness of road network condition. Tech. Gaz. 2016, 23, 881–884. [Google Scholar]
  18. Ismail, N.; Ismail, A.; Atiq, R. An Overview of Expert Systems in Pavement Management. Eur. J. Sci. Res. 2009, 30, 99–111. [Google Scholar]
  19. Barisic, I.; Dimiter, S.; Rukavina, T. Characterization of cement stabilized pavement layers with ultrasound testing. Tech. Gaz. 2016, 23, 447–453. [Google Scholar] [CrossRef]
  20. Chang, A.; Krugler, C.P.; Smith, R. A Knowledge Approach Oriented to Improved Strategic Decisions in Pavement Management Practices. In Proceedings of the 1st Annual Inter-University Symposium of Infrastructure Management, Waterloo, ON, Canada, 6 August 2005. [Google Scholar]
  21. Kannan, P. Dubai International Runway Closures: Emirates Details Plan to Cut 5.400 Flights. Available online: http://www.thenational.ae/uae/transport/dubai-international-runway-closures-emirates-details-plan-to-cut-5-400-flights-1.335240 (accessed on 28 April 2014).
  22. DeBord, K.J. Runway Roughness Measurement, Quantification and Application-The Boeing Method; Document D6–81746; Boeing Commercial Airplane Group: Chicago, IL, USA, 1995. [Google Scholar]
  23. Wang, W. Network level pavement evaluation with 1 mm 3D survey system. J. Traffic Transp. Eng. 2015, 2, 391–398. [Google Scholar] [CrossRef]
  24. Wu, S.S. Of Pavement Deflection and Performance. In Proceedings of the 8th International Conference on Applications of Advanced Technology in Transport Engineering (AATTE), Beijing, China, 26–28 May 2004. [Google Scholar] [CrossRef]
  25. Welsch, W.M.; Heunecke, O. Models and Terminology for the Analysis of geodetic Monitoring Observations. In Proceedings of the 10th International Symposium of Deformation measurements, Orange, California, USA, 19–22 March 2001; pp. 390–412. [Google Scholar]
  26. Guler, G.; Kılıç, H.; Hosbas, G.; Ozaydin, K. Evaluation of the Movements of the Dam Embankments by Means of Geodetic and Geotechnical Methods. J. Surv. Eng. 2006, 132, 31–39. [Google Scholar] [CrossRef]
  27. Bogatin, S.; Kogoj, D. Preview of Evalution Models of Geodetic Control Measurements. Géod. Vestn. 2006, 50, 201–209. [Google Scholar]
  28. Oliveira, H.; Correia, P.L. Automatic Road Crack Detection and Characterization. IEEE Trans. Intell. Transp. Syst. 2013, 14, 155–168. [Google Scholar] [CrossRef]
  29. Mokhtari, S.; Wu, L.; Yun, H.B. Comparison of Supervised Classification Techniques for Vision-Based Pavement Crack Detection. Transp. Res. Rec. 2016, 2595, 119–127. [Google Scholar] [CrossRef]
  30. Shi, Y.; Cui, L.; Qi, Z.; Meng, F.; Chen, Z. Automatic Road Crack Detection Using Random Structured Forests. IEEE Transa. Intell. Transp. Syst. 2016, 17, 3434–3445. [Google Scholar] [CrossRef]
  31. Wang, P.; Hu, Y.; Dai, Y.; Tian, M. Asphalt Pavement Pothole Detection and Segmentation Based on Wavelet Energy Field. Math. Probl. Eng. 2017, 2017, 1604130. [Google Scholar] [CrossRef]
  32. Peng, L.; Chao, W.; Shuangmiao, L.; Baocai, F. Research on Crack Detection Method of Airport Runway Based on Twice-Threshold Segmentation. In Proceedings of the 2015 Fifth International Conference on Instrumentation and Measurement, Computer, Communication and Control (IMCCC), Qinhuangdao, China, 18–20 September 2015. [Google Scholar] [CrossRef]
  33. Cubero Fernandez, A.; Rodriguez Lozano, F.J.; Villatoro, R.; Olivares, J.; Palomares, J.M. Efficient pavement crack detection and classification. EURASIP J. Image Video Process. 2017, 2017, 39. [Google Scholar] [CrossRef]
  34. Lalagüe, A. Use of Ground Penetrating Radar for Transportation Infrastructure Maintenance. Ph.D. Thesis, Norwegian University of Science and Technology, Trondheim, Norway, 2015. [Google Scholar]
  35. Chapursky, V.V.; Ivashov, S.I.; Razevig, V.V.; Sheyko, A.P.; Vasilyev, I.A.; Pomozov, V.V.; Semeikin, N.P.; Desmond, D.J. Subsurface radar examination of an airstrip. In Proceedings of the IEEE Conference on Ultra Wideb and Systemssnd Technologies, Baltimore, MD, USA, 21–23 May 2002. [Google Scholar]
  36. Moropoulou, A.; Avdelidis, N.P.; Koui, M.; Aggelopoulos, A.; Karmis, P. Infrared thermography and ground penetrating radar for airport pavements assessment. Nondestruct. Test. Eval. 2002, 18, 37–42. [Google Scholar] [CrossRef]
  37. Berthelod, C.; Stuber, E.; Haichert, R.; Anthony, A.; Hansen, D.; Heal, P. Non-Destructive Structural Asset Valuation of a Saskatchewan Rural Airfield before and after Structura Upgrade. In Proceedings of the Annual Conference of the Transportation Association of Canada, Vancouver, BC, Canada, 18 October 2009. [Google Scholar]
  38. Song, X.; Wu, R.; Liu, J. Underground diseases identification of airport runway using GPR. In Proceedings of the PIERS Proceedings, Xi’an, China, 22–26 March 2010. [Google Scholar]
  39. Celaya, M. Evaluation of Nondestructive Technologies to Assess Presence and Extent of Delamination of Hot Mix Asphalt Airfield Pavements; The University of Texas at El Paso: El Paso, TX, USA, 2011. [Google Scholar]
  40. Tsai, Y.; Jiang, C.; Wang, Z. Pavement Crack Detection Using High-Resolution 3D Line Laser Imaging Technology. In Proceedings of the 7th RILEM International Conference on Cracking in Pavements, Delft, The Netherlands, 22–22 June 2012; pp. 169–178. [Google Scholar] [CrossRef]
  41. Tsai, Y.; Wang, Z.; Jiang, C.; Mahfood, B.; Rone, J. Innovative Crack Sealing Analysis and Cost Estimation for Airport Runway Shoulders Using 3D Laser Technology and Automatic Crack Detection Algorithms. In Proceedings of the International Airfield and Highway Pavements Conference, Miami, FL, USA, 7–10 June 2015. [Google Scholar] [CrossRef]
  42. Sanchez Dominguez, F.; Ramos Garcia, J.A.; Salces Goni, C. Assessment of the structural condition of concrete runways and platforms in airports using 3D laser, HWD and 3D radar. In Proceedings of the International Symposium, Non-Destructive testing in Civil Engineering (NDT-CE), Berlin, Germany, 15–17 September 2015. [Google Scholar]
  43. Slabej, M.; Grinč, M.; Kováč, M.; Decký, M.; Šedivý, Š. Non-invasive diagnostic methods for investigating the quality of Žilina airport’s runway. Contrib. Geophys. Geod. 2015, 45, 237–254. [Google Scholar] [CrossRef] [Green Version]
  44. Grinč, M. 3D GPR investigation of pavement using 1 GHz and 2 GHz horn type antenna—Comparison of the results. Contrib. Geophys. Geod. 2015, 45, 25–39. [Google Scholar] [CrossRef]
  45. Minasian, D.; Kayen, R.; Ashford, S.; Kawamata, Y.; Sugano, T. Ground Deformation Analysis of Blast-Induced Liquefaction at a Simulated Airport Infrastructure Using High Resolution 3D Laser Scanning. In Proceedings of the American Geophysical Union Fall Meeting, San Francisco, CA, USA, 15–19 December 2008; pp. 89–95. [Google Scholar]
  46. Barbarella, M.; De Blasiis, M.R.; Fiani, M.; Santoni, M. A LiDAR application to the study of taxiway surface evenness and slope. ISPRS Ann. Photogramm. Remote Sens. Spat. Inf. Sci. 2014, 2, 65–72. [Google Scholar] [CrossRef]
  47. Riesner, E. Modern Airfield Pavement Management Strategies. In Proceedings of the Airports Conference, Hershey, PA, USA, 12 March 2014. [Google Scholar]
  48. Schwarz, K.P.; El-Sheimy, N. Mobile Mapping Systems—State of The Art and Future Trends. Int. Arch. Photogramm. Remote Sens. Spat. Inf. Sci. 2004, 35, 759–768. [Google Scholar]
  49. Barbarella, M.; Fiani, M.; Lugli, A. Landslide monitoring using multitemporal terrestrial laser scanning for ground displacement analysis. Geomat. Nat. Hazards Risk 2013, 11, 1–21. [Google Scholar] [CrossRef]
  50. Hooper, A. A Statistical-Cost Approach to Unwrapping the Phase of InSAR Time Series. In Proceedings of the International Workshop on ERS SAR Interferometry, Frascati, Italy, 30 November–4 December 2009. [Google Scholar]
  51. Samsonov, S.V.; d’Oreye, N.; González, P.J.; Tiampo, K.F.; Ertolahti, L.; Clague, J.J. Rapidly accelerating subsidence in the greater vancouver region from two decades of ERS-ENVISAT-RADARSET-2 DInSAR measurements. Remote Sens. Environ. 2014, 143, 180–191. [Google Scholar] [CrossRef]
  52. Crosetto, M.; Monserrat, O.; Cuevas-Gonzaìlez, M.; Devantheìry, N.; Crippa, B. Analysis of X-band very high resolution persistent scatterer interferometry data over urban area. In Proceedings of the International Archives of the Photogrammetry, Remote Sensing and Spatial Information Science, Hannover, Germany, 1–24 May 2013; pp. 21–24. [Google Scholar]
  53. Penrose, R. A generalized inverse for matrices. Proc. Camb. Philos. Soc. 1955, 51, 406–413. [Google Scholar] [CrossRef]
  54. Devlin, J.; Yee, P. Trade logistics in developing countries: The case of the Middle East and North Africa. World Econ. 2005, 28, 435–456. [Google Scholar] [CrossRef]
  55. Gani, A. The Logistics Performance Effect in International Trade. Asian J. Shipp. Logist. 2017, 33, 279–288. [Google Scholar] [CrossRef]
Figure 1. The whole runway and measurement area.
Ijgi 08 00001 g001
Figure 2. Subareas of the process in the touchdown zone.
Ijgi 08 00001 g002
Figure 3. Measuring equipment used. (a) Polytec mobile doppler vibrometer-Germany (Waldbronn), (b) Leica TS50-Swisserland (Heerbrugg, (c) Topcon global navigation satellite system (GNSS)-Japan (Tokio), (d) ground-penetrating radar (GPR MALA)-Australia (Brookvale).
Ijgi 08 00001 g003
Figure 4. (a,b) Measuring equipment (a: Leica TS50) and unsprung trailer vehicle (b).
Ijgi 08 00001 g004
Figure 5. Basic geodetic net (yellow crosses) and recorded points for the comparative plane (green crosses).
Ijgi 08 00001 g005
Figure 6. Diagram of the decision support maintenance model (monitoring).
Ijgi 08 00001 g006
Figure 7. Results of monitoring in the information diagram of the decision support model.
Ijgi 08 00001 g007aIjgi 08 00001 g007b
Table 1. Measurements on the runway were performed in three time periods and measured in degrees Celsius (°C).
DateTemperature at 7:00 (°C)
15 January 2018−2.3
5 April 201811.4
8 June 201817.1
Table 2. Parameters of the equations of the planes.
Parametersab
Planes
R1−0.011019−0.005116
R2−0.010734−0.004876
R3−0.011022−0.005114
Table 3. Accuracy of the parameters of the equations of the planes.
Accuracyσaσb
Planes
R11.6810 × 10−51.2756·10−5
R20.9783 × 10−50.7669·10−5
R31.5154 × 10−51.1416·10−5
Table 4. Vertical departures between individual time dimensions.
Vertical DeparturesΔ (m)Δ (mm)↓ Descent
↑ Ascent
ΔR1/R2−0.00651−6.51plane ↓
ΔR1/R3−0.00366−3.66plane ↓
ΔR2/R30.002852.85plane ↑
Note: ↓ represents negative displacement or descent of the plane and ↑ represents ascent of the plane.

