Remote Sensing in Environmental Justice Research—A Review


1
German Aerospace Center (DLR), German Remote Sensing Data Center (DFD), Münchner Str. 20, 82334 Wessling, Germany
2
Institute for Geography and Geology, University of Würzburg, Am Hubland, 97074 Würzburg, Germany
*
Author to whom correspondence should be addressed.
ISPRS Int. J. Geo-Inf. 2019, 8(1), 20; https://0-doi-org.brum.beds.ac.uk/10.3390/ijgi8010020
Submission received: 6 December 2018
/
Revised: 29 December 2018
/
Accepted: 6 January 2019
/
Published: 10 January 2019
Abstract
:Human health is known to be affected by the physical environment. Various environmental influences have been identified to benefit or challenge people’s physical condition. Their heterogeneous distribution in space results in unequal burdens depending on the place of living. In addition, since societal groups tend to also show patterns of segregation, this leads to unequal exposures depending on social status. In this context, environmental justice research examines how certain social groups are more affected by such exposures. Yet, analyses of this per se spatial phenomenon are oftentimes criticized for using “essentially aspatial” data or methods which neglect local spatial patterns by aggregating environmental conditions over large areas. Recent technological and methodological developments in satellite remote sensing have proven to provide highly detailed information on environmental conditions. This narrative review therefore discusses known influences of the urban environment on human health and presents spatial data and applications for analyzing these influences. Furthermore, it is discussed how geographic data are used in general and in the interdisciplinary research field of environmental justice in particular. These considerations include the modifiable areal unit problem and ecological fallacy. In this review we argue that modern earth observation data can represent an important data source for research on environmental justice and health. Especially due to their high level of spatial detail and the provided large-area coverage, they allow for spatially continuous description of environmental characteristics. As a future perspective, ongoing earth observation missions, as well as processing architectures, ensure data availability and applicability of ’big earth data’ for future environmental justice analyses.
1. Introduction: Urbanization and the Inequity of Environmental Burdens
In the Sustainable Development Goals (SDG) the United Nations highlight with SDG #3, to “ensure healthy lives and promote well-being for all at all age” [1], that health is an important humanitarian challenge for the upcoming decades and especially concerns those who are most disadvantaged. It is known that the exposure towards health-related environmental conditions varies on global, national, regional, and local scales [2,3], and even in-between urban neighborhoods (e.g., [4]). This will lead to stark inequities in health in dependence of locations, especially due to population growth and the increasing trend of urbanization [5]. In order to assess these inequities, studies on local effects on health are of high relevance, and are considered to be among the most important issues in this century [3]. Moreover, health as “a state of complete physical, mental, and social well-being” [6] is influenced by several important factors. Among them, especially our individual lifestyle as well as our social and physical environment [7,8] have proven to affect exposure to different health burdens. Yet, as the physical environment we live in is extremely heterogeneous, exposure, e.g., towards polluted air or noisy environments, strongly depends on our place of residence and work. Therefore, geospatial data on the biophysical conditions of our living environment are essential for the analysis on the effects of the environment on humans.
As healthy and unhealthy environments are not distributed equally in space and society, certain societal groups are more exposed towards hazardous environments than others. This social imbalance is subsumed under the research of environmental justice or environmental (in)equity. It describes the disproportionate environmental burdens on individuals, depending on their varying socioeconomic status [9]. Thus, environmental justice combines people’s health and their socioeconomic status, bringing together various approaches and research disciplines [10].
1.1. Health Burdens of Environmental Exposure: A Historical Perspective
Over the course of the last decades, environmental justice research has gained much interest from political stakeholders, as well as from society. Early environmental justice studies as reviewed by, e.g., Mohai et al. [11] focused on the spatial bias of siting hazardous facilities, such as toxic waste facilities [12] or contaminated water [13]. The intense discussion initially focused on the unequal burdens for racial and social minorities in the United States. This movement soon began to raise interest in the research communities of European countries, with environmental justice studies conducted in France (e.g., [14]), Switzerland (e.g., [15]), Great Britain (e.g., [16,17]), and Germany (e.g., [18]). Moving the research further, not only hazardous facilities were included into the studies but also environmental conditions aside from toxic facilities and polluted water, as they had been proven to influence human health. Prominent examples include air pollution (e.g., [19]), noise (e.g., [20]) or green spaces (e.g., [21]). In this context, studies have shown that health is impaired by environmental burdens caused by polluted water (e.g., [22]), soil and air (e.g., [23,24]), ambient noise stress (e.g., [25]), heat waves [26], among others). Positive Effects of environmental entities like public green spaces, on the other hand, can improve physical, mental or social well-being of the people [15,27,28]. Since these different environmental features are not distributed equally in our environment, it is found that especially low social groups and certain ethnic groups suffer from environmental inequity [12,16,29]. Higher levels of environmental toxins or less accessibility of green spaces important for physical and mental recreation are then a driver for reduced physical well-being or even higher mortality within these communities.
1.2. Spatial Scale in Environmental Justice Research
Environmental justice research brings together various disciplines such as epidemiology, sociology, and geography, which each have their individual data and methodological approaches of analysis. In the vast variety of studies covering environmental justice issues each one tends to emphasize findings from a specific thematic field. However, while a great share of studies employ spatial data at some point of their analysis (e.g., [17,30,31]), some scholars criticize that frequently spatial data are not used correctly, which then leads to analyses being characterized as “essentially aspatial” [32,33]. They point out that the chosen spatial entities do not represent a suitable entity for analyzing fine scale local characteristics and disparities. As a matter of fact, data with strong levels of aggregation are frequently used in nationwide studies as data of large spatial entities such as zip codes or census tracts are deployed [11,33]. In consequence, analyses might lead to spatially biased assumptions and ecological fallacy. Yet, the use of geographic data is inevitable since environmental justice per se is a spatial phenomenon.
Since geographic data at too coarse granularity can alter the output significantly [34,35], their spatial detail is of fundamental importance for environmental justice analyses. To account for this issue, the spatial framework of environmental data needs to be matched thoughtfully with meaningful applications in the domains of environmental justice and health issues. Even more, the United Nations stress the need to explore “the full extent of urban health inequities”, as “it is important to disaggregate health and health determinants data within cities” [3]. However, it must be stressed that only few consistent international data exist and national data are comparatively heterogeneous [36].
Recent developments in modern earth observation have proven to provide valuable data for achieving these goals. Remote sensing data from satellite images are used for consistent monitoring of biophysical parameters of the Earth’s surface in high spatial, temporal, and semantic detail covering large patches of land. They are used for various applications including highly detailed land use/land cover mapping. For example, maps of health relevant urban features like green spaces (e.g., [37,38]), Urban Heat Islands (UHI) [39,40,41], or air pollution [42,43] provide consistent information about environmental conditions. In this way, the availability of high resolution environmental data in large spatial extents can be considered a big step towards understanding the spatial heterogeneity both on a very high level of spatial and thematic detail as well as large area coverage. Furthermore, satellite imagery allow for internationally independent, objective and homogeneous data as demanded by the WHO [36,44].
1.3. Socioeconomic Status and Individual Behavior Affecting Health
Alongside environmental influences on health, the effect of the socioeconomic status (SES) has been discussed as an important health determinant for many years. Eventually, it was widely accepted to play an important role as a pathway of health [7]. Especially the social class has been identified as a key variable which influences health behavior (e.g., [45]). Social disparities, in turn, lead to spatial segregation within the urban environment turning the SES itself into a quasi-spatial characteristic. For the characterization of the SES of individuals a broad spectrum of factors including income, education, ethnicity, age, gender, and social context are required [46]. Some scholars suggest the acquisition of as much socioeconomic information as possible (e.g., [47]). Only thus the risk of false conclusions can be avoided when combined with environmental data [48].
In addition to the recognized impact of the individual SES on health, it is also discussed if there is an association between health and regional or neighborhood socioeconomic deprivation. While Breckenkamp et al. [49] found only small influences of regional deprivation, other studies suggest that contextual effects on regional or neighborhood scale can indeed affect health (e.g., [50,51,52]). Moreover, differences on national levels can be observed due to variations in social and economic fortunes [53]. Strong trends of urbanization in the 21st century are expected to exacerbate the disparities in public health due to social and physical environmental changes [54]. In terms of environmental justice, recent research combining socioeconomic data with environmental factors has shown that the differences in individual socioeconomic status can be linked to the magnitude of exposure towards environmental burdens (e.g., [55,56]).
1.4. Aim and Outline of This Review
Outlining how modern ‘big earth data’ (e.g., [57,58]) can be utilized to understand human health and well-being [59], this study will condense recent research efforts on the integration of geographic data in environmental justice research, in particular how remote sensing can contribute to increasing the level of spatial detail used in environmental justice research. Studies are selected to provide to outline the breadth of possible applications of geographic and remote sensing data and methods for this purpose. With the multitude of space-borne earth observation sensors we have entered an era in which data archives are being filled with endless streams of georeferenced images about the physical appearance of the Earth’s surface. Now, it is necessary to focus on remote sensing imagery to support the retrieval of information for environmental justice and public health research. With it, the possibilities to identify, quantify, describe, and monitor measures and proxies of social or environmental injustice with an explicit spatial perspective can be systematized. In consequence, the present review approaches the question of how earth observation data can be utilized for analyses of health relevant environmental factors on a high level of detail with large area coverage. Therefore, it focuses on highlighting the applicability of state-of-the-art earth observation data for investigating the (socio-) spatial distribution of health relevant environmental influences in the human habitat. In that context, we focus on environmental justice and health from a geographical perspective.
The study first presents an overview of the most prominent health relevant environmental influences in Section 2 identified from the literature. Additionally, in this section we systematize state-of-the-art remote sensing approaches supporting the derivation of health relevant environmental descriptors as key elements for spatial data analysis in the context of interdisciplinary analyses like environmental justice. In Section 3, we gather fundamental concepts of environmental and spatial studies as they are key to the validity of spatial environmental justice analyses. A special focus hereby lies on the combination of different data sources and how differing spatial reference units influence the outcome. In the context of combining different data, we compare selected interdisciplinary studies which integrate the environment, socioeconomic status and health in space. In Section 4, potentials as well as limitations of modern remote sensing data and techniques are identified from the literature. They are discussed against the backdrop of their applicability in environmental justice research. Based on the information gathered from the literature, recommendations are proposed how future environmental justice research can benefit from recent advances in technology. In Section 5, a conclusion of the findings completes the paper.
2. Remote Sensing of Environmental Health Burdens
Over the last decades, remote sensing has become a valuable data source for performing large-area measurements of physical conditions of the Earth’s surface. Today, data from a variety of different sensors is available for large areas and free of costs, hence allowing researchers and decision-makers to gather information and answer questions about environmental conditions and to monitor global change. Modern research on the influence of the living environment on health associates various environmental conditions with different health outcomes. The following section summarizes the environmental health influences most commonly covered by the literature—namely green space, air pollutants, noise, and heat—and outlines how remote sensing techniques can be used for their derivation. The cited articles were identified by searching for the respective keywords in the relevant remote sensing journals.
2.1. Green Space
Relevance:
Green space is considered the most prominent variable in environmental research. The effects of green space on individual health and well-being have been associated with a variety of mental and physical health outcomes. Overall, positive relationships can be found between health and the availability of nearby green spaces [60] as they can, for example, promote stress relief [15] and are suggested to build a buffer against the negative health impact of stressful life events [61]. The mere abundance of green space in the living environment has been shown to reduce stress and mortality in socioeconomically deprived areas [62,63]. Green spaces are linked to the reduction of the risks of cardiovascular and respiratory diseases as well as mortality [64,65]. The positive health effects of green spaces originate from a variety of impacts. Green areas within cities, for instance, can decrease surface temperatures and therefore lower heat stress in surrounding areas [66]. Moreover, peoples’ physical activity is increased given a higher abundance of green spaces in their surroundings [15,28]. However, it has already been shown that the health benefits of green spaces depend on the degree of urbanization [67,68] making the health benefit of green space a function of urban density. Moreover, low-income and minority communities experience disadvantages in the access to green spaces [62,69,70,71] and some societal groups show underuse of urban green spaces [72]. Thus, positive effects of green space are not equally accessible in the entire society.
Derivation:
The derivation of green areas from space-borne remote sensors follows a long line of methodological development and application. In fact, chlorophyll and bioactive substances are easily detectable from multispectral data with the visible (∼0.4 µm–0.75 µm [73]) and near infrared (NIR) part of the electromagnetic spectrum (∼0.7 µm–1.4 µm [73]). Data are used for the derivation of the spatial extent of vegetated areas as well as their properties, like primary production, vitality, or crop yields (e.g., [74,75]).
Within rural areas, coarse spatial resolutions (pixel size > 50 m) of the sensors might not reduce important information and are therefore sufficient for mapping green spaces in the country side. The extreme local heterogeneity of urban settings, however, requires a high spatial resolution (pixel size < 10 m) to identify highly scattered green areas, also on top and in between the buildings. Advances in sensor development, allowed for the detection of even small vegetation patches in urban areas with a high degree of accuracy. Methods for mapping green space were also used in environmental justice or urban ecosystem analyses. In this context, remote sensing has been used to derive the spatial distribution, extent and quality of urban green spaces (e.g., [31,37,38,66,76,77,78,79]). Based on such data, green space provision is often described as a function of euclidean distance to the closest patch of green or share of green space in the neighborhood [80].
In addition to remote sensing other high resolution spatial data products are used in environmental research, such as the European Urban Atlas (EUA) (e.g., [71,81]), CORINE Land Cover (e.g., [28]), German ATKIS Basic-DLM (e.g., [82]), or Dutch LGN4 (e.g., [27,61]). National data, however, are available only at high costs, on small spatial scales or are not updated frequently. This limits their use in large scale studies or in areas where such data sets do not exist.
2.2. Air Pollution
Relevance:
Air pollution, originating from traffic, industrial facilities, or combustion processes in our daily environment, is also known to influence human health significantly. It leads to millions of deaths worldwide [83]. Although limit values are meant to protect citizens from the health impacts of air pollutants, even concentrations of e.g., fine particulate matter below these limits might lead to higher death rates [84]. After adjusting for individual behavior, air pollutants like ozone, fine particulate matter, nitrogen oxide, blacksmoke, and sulfur have been shown to increase mortality rates in cities [85,86]. These mortality rates vary with the degree of pollution across different cities [87]. In long-term experiments, Pope et al. [88,89] were able to confirm these trends and furthermore quantify a linear increase of cardiopulmonary and lung cancer mortality with higher exposure to combustion related air pollutants. By modeling vehicle traffic exhaust gasses, Zhang & Batterman [90] suggest that traffic congestions increase the health burdens to commuters, pedestrians, and people living next to major streets. Given the current strong trends of urbanization and increased motorization, these effects can be expected to rise significantly.
Environmental justice research studies which focused on air pollutants identified stronger exposures of low-income or racialized neighborhoods in Canada (e.g., [30]), Great Britain (e.g., [16]), and Germany (e.g., [18]). In a most recent study Collins et al. [91] were able to find that the exposure towards air pollution might also be dependent on the sexual orientation which might in turn be linked to social discrimination.
Derivation:
Typically, air pollution, including particulate matter (PM2.5, PM10), sulfur, ozone, NOx, carbon monoxide, ammonia etc., is measured by ground-based in situ sensors [92]. These data provide information about the ambient air composition at ground, which is the air humans breathe in every day, of one geographic location. However, there are some shortcomings of this technique. On the one hand, air pollution is spatially highly dynamic, and therefore only vaguely measurable by scattered local sensors. As a result, areal information about air toxins is difficult to derive from such measurements. On the other hand, although being calibrated well in most cases, these ground-based sensors differ in type or design over the world [92].
As an alternative, remote sensing of atmospheric conditions can be applied, as it represents one possible approach to overcome some of these restrictions. In fact, remote sensing has been suggested to act as an important source of data to measure ground-level air pollutants on large scale [93,94]. Furthermore, remote sensing allows for a consistent retrieval of air pollution concentrations independent of ground-based stations, especially in sparsely built or rural environments. However, the spatial resolution of these remote sensing-based data products is still very low, ranging from a few to tens of kilometers squared. Therefore, current air pollution data from remote sensing is only able to provide information about the distribution of air pollutants on a regional, national or global level [95,96]. Yet, upcoming and recently launched missions like e.g., Sentinel-5(P) providing higher spatial resolution within the single-digit kilometers will allow for the assessment of air pollution from space even on an intra-urban level.
Recent studies have used aerosol optical thickness or depth retrievals calculated from MODIS measurements to derive global PM2.5 concentrations [97,98,99] alongside chemical transport models to enable higher spatial heterogeneity [100,101]. Voigtländer et al. [102] used resampling methods to increase the spatial resolution of PM10 exposure in Germany. In addition, modern machine learning techniques applied for data fusion between stationary observations and satellite data showed increased modeling accuracies [103].
Even though current remote sensing techniques can only provide rather coarse data on air pollutants, they have already been successfully deployed to detect the spatial heterogeneity of health burdens. By combining current methods for the assessment of air pollutants from satellite imagery and ground-based measurements, land use regression models (LUR), originally introduced by Brigs et al. [104] as “Regression Mapping”, can be built. LUR are able to approximate local differences in environmental burdens in dependence of multiple physical variables in the local surroundings spatially exhaustive and with high spatial resolution [105,106]. Thus, LUR approaches were used in various studies to assess local concentrations of ambient air pollution (e.g., [107,108,109,110]), where the independent variables are land use/land cover (LULC), population, and traffic density, as well as built-up structure. As another method to provide a spatial representation of air pollutant exposure, physical atmospheric dispersal models can be deployed on local or regional scales [111,112]. By including airflow characteristics, traffic, meteorological, and geographic data, they estimate small scale variations in air pollution exposure. The predictive exposures achieved by LUR and dispersal model shows similar results for most air pollutants [113].
In summary, while various methods have been developed to derive air pollution measures for large areas in high spatial resolution, future sensors and techniques will further improve the level of detail. As of now, modeling techniques like LUR are available to overcome resolution restrictions.
2.3. Noise
Relevance:
Noise originates from various sources like roads, rail and air traffic or industrial facilities. Constantly, high noise levels increase peoples’ stress levels and thus affect their social, mental, and physical well-being. Despite being known as a health threat for multiple decades, the noise average exposure is still increasing, especially in times of strong urbanization [114]. In recent studies, noise was linked to annoyance and sleeping problems [115], as well as long-term memory impairment and psychosocial symptoms [116]. Furthermore, high noise levels have been shown to cause hypertension [20] and other cardiovascular diseases. To counteract noise annoyance, access to green spaces have been shown to have positive effects [21]. However, as with green spaces a social gradient in noise disturbance disproportionally affects lower social groups in their living environment (e.g., [117]).
Derivation:
Being an acoustic phenomenon, noise is not per se detectable from remote sensors. Hence, similar to air pollutants, direct measurements are performed using ground-level stationary sensors. Accordingly, the same shortcomings of spatially discrete data points with no area-covering information thus having local limitations occur [117].
To overcome this issue, noise models pose a widely used method for assessing noise pollution in space (e.g., [117,118,119]). These usually include variables like traffic speed, vehicle counts, road type, surrounding built-up structures, topography, and land cover, etc. to approximate the local noise levels [25,120]. In this way, such models are able to map the noise spatially with high accuracy. However, they require vast input data, expertise as well as computational cost [121], wherefore they are not applicable on regional or national level. Existing data sets for the noise estimation in urban areas, as for example used by [76,122], are usually only available in cities with more than 100,000 inhabitants, along main road and rail networks [123]. Hence, such data sets neither represent an extensive nor complete nor consistent data source. Similar to air pollution modeling, land use regression models were applied to assess urban noise levels using a combination of ground-based noise sensors and environmental data to map noise on a high spatial granularity (e.g., [124,125,126]). Since LUR techniques still depend on ground-based measurements, their application is spatially restricted to areas that are covered by such sensors. As one alternative approach to model noise without in situ measurements, Aguilera et al. [127] tested a “GIS-only” model against classical LUR models with comparable performance.
To encounter limitations to noise modeling, recent studies investigated the usability of various proxy information in order to assess noise pollution on larger spatial scales. In this context, landscape metrics, including parameters like building type, orientation and height, green space distribution, geometric features and densities are deployed to analyze the relation between urban structure and noise. Thus, it is strongly suggested that urban properties are a proxy to noise burdens [128,129,130,131,132,133,134]. Even though these studies suggest a strong relationship between the urban inventory and noise levels, a reverse extrapolation of noise exposure from easily accessible geographic data on large spatial scale have yet to be developed. Thus, since measuring noise directly is not feasible for large spatial areas, a combination of in situ sensors and proxy information is needed to assess noise exposure within cities.
2.4. Heat
Relevance:
As a direct consequence of climate change, extreme weather events are predicted to increase [135]. One implication of these effects is the occurrence of prolonged periods of abnormally high temperatures (i.e., heat waves). In several instances heat waves have been proven to be the direct cause of spatio-temporal clusters of increased mortality, like in the case of the heat wave recorded in Europe in August 2003 (e.g., [26,50,136,137]). Detailed analyses of causes of deaths revealed that especially the elderly, people confined to bed or those suffering from cardiovascular, neurological, or mental disorders are most vulnerable to heat mortality [137]. In particular, Scherer et al. [138] showed that about 5% of all deaths in Berlin can be related to heat.
The health burdens through heat, however, strongly depend on the spatial setting and vary at different scales (regionally [139] and locally [140]). Local changes, especially in heavily urbanized areas, originate from heterogeneous land use patterns, built-up densities and characteristics of the urban setting [141], and are connected to vegetation deficiency [142]. Regarding the environmental equality of heat related health risks, it has been shown that socioeconomic properties of the population affect the risks of heat-related mortality within cities [143] as well as on the national scale [50].
Derivation:
The analysis of heat, i.e., measured or subjectively experienced air temperatures, in environmental studies is broadly driven by the urban heat island effect (UHI). This effect of gradual temperature increases over urbanized land is mostly driven by changes in abundance of vegetation and water surfaces, building materials, surface roughness, wind speed, and the size of the urban area [144]. UHI have been measured for decades by manual, ground-based measurements (see e.g., [145]). However, since early on remote sensing data were identified as a valuable source measure UHI [146,147] because ground temperatures can be measured from space using thermal infrared sensors (4 to 20 µm [73]). Lately, thermal infrared sensors from satellite imagery with high spatial resolution, such as Landsat TM/ETM+ or Landsat-8/TIRS, were used to measure temperature in urban environments on large scales and thus quantify the UHI effects (e.g., [41,148,149]). In addition to that, Meng et al. [39] highlighted the existence of intra-day temperature variations by examining both daytime and nocturnal MODIS imagery. However, satellite sensors are only able to measure the temperature of surfaces. Therefore, these quantifications refer to increases in land surface temperature (LST) and accordingly are also called surface urban heat islands (SUHI). The combination of LST and LULC information describes the urban environment even better in terms of microclimatic conditions [150], which has already been shown by e.g., Heldens et al. [151].
Building upon these assumptions Stewart & Oke [152] developed the concept of the Local Climate Zones (LCZ). They describe the structural and land cover differences between rural and urban land use with respect to temperature affecting properties of the landscape. Thus, zones of homogeneous LULC are differentiated by parameters like imperiousness, building density and height, surface roughness, or spectral absorption of materials.
The impact of the structures in these zones on both the ambient as well as the surface temperature has been demonstrated in various studies, e.g., using in situ weather stations for temperature measurements (e.g., [152,153,154,155,156]) or LST as derived from remote sensing (e.g., [157,158,159,160]). Overall, findings are consistent indicating an increase of temperatures inside urban areas. Successful attempts to delineate LCZ from satellite imagery have been made recently (e.g., [161,162,163,164]).
In conclusion, LST distributions can be derived from remote sensing imagery in high spatial resolution with modern satellite sensors. However, proxy information such as urbanity or concepts like the LCZ scheme have been shown to provide useful information about the vulnerability of the people to strong heat events.
2.5. (Intra-) Urban Structure
Relevance:
Many health relevant environmental influences that are not directly measurable can only be described by a proxy of urban structure [60,67,139,165]. As these proxies can be assessed at different spatial scales from the level of an entire city to the level of single streets, they must be captured at various levels.
Derivation:
Recent developments of high and very high resolution satellite missions and the methodological advantages in image processing enable detailed mappings of the environment. In fact, the use of remote sensing has long been regarded as a promising tool for urban studies and urban development [166,167]. For instance, attempts of mapping the settlement patterns on a global scale have been realized recently. With 12 meters ground resolution the global urban footprint (GUF) derived from TerraSAR-X and TanDEM-X data contains all built-up areas [168]. A similar mapping product, the global human settlement layer (GHSL), is derived from high resolution optical imagery, although it provides built up structures at around 38 meters resolution [169]. Besides static products of urban extent, remote sensing is also capable of analyzing the dynamics of urban growth over the last decades [170]. Functional information of urban areas was derived from high resolution SPOT (20 meters ground resolution) [171]. In even higher detail, temporal changes to the urban inventory can be obtained at a high level of spatial detail from high resolution satellite imagery [172]. By using such data sets it is possible to locate the human habitat on very large or even global dimensions, leading to new possibilities for analysis in the context of environmental justice research. In other studies, remote sensing data was used for the delineation of urban structures in high resolution [173,174,175,176]. It has been shown that intra-urban differences in built-up structures can also be obtained on large scales. These differences in urban structure inevitably result in differing exposures to health relevant environmental factors within the city.
In addition to the two-dimensional extent of urban structures, three-dimensional building extraction has been applied in several studies based on different data sources. Gamba et al. [177], for example, extracted three-dimensional building models from interferometric synthetic aperture radar (InSAR) imagery. Wurm et al. [178] applied stereographic optical imagery to derive building densities to estimate urban structure and building volume estimation. Using three-dimensional urban models, it is also possible to assess the urban density [179]. These approaches demonstrate that remote sensing is capable of describing the urban landscape detached from existing spatial entities like administrative boundaries.
Building upon the highly detailed description of the physical landscape, conceptual approaches of aggregating physically homogeneous urban patches can be performed. Spatial concepts, such as the LCZ, provide an environment-driven way to investigate environmental justice independent of existing spatial entities like census tracts or administrative areas, which were mainly developed for political or governmental purposes. These concepts also include physical parameters of various health relevant features, such as the vegetation abundance or aeration.
2.6. Summary
Modern earth observation (EO) and geographic information science (GISc) provide useful data and tools for a comprehensive description of the physical environment. In combination with large socioeconomic studies they allow for highly detailed analyses of environmental justice. Even though some of these tools have already been used in environmental justice and environmental health research, recent methodological developments in remote sensing enable the derivation of additional environmental parameters, thus enriching the description of the urban environment for a multitude of health burdens.
For instance, information on environmental influences like green spaces, air pollutants and UHI can be directly derived from remote sensing imagery. However, the exposure towards noise cannot be measured directly on large scales, which is why either complex models have to be applied or proxy-information on noise exposure is needed. In accordance with recent research more empirical and theoretical research, it is necessary to ensure an adequate analysis of the potential of ‘big earth data’ in filling these gaps of exhaustive spatial data.
3. The Importance of Space for Modeling Environmental Justice
In the existing literature on environmental justice or different models attempt to depict the causal connections between environmental exposures, SES and health. While some of these models approach the topic from an environmental, epidemiologic or public health perspective (e.g., [10,180]) others describe it from a sociological point of view (e.g., [181,182]). These disciplines capture environmental justice with different emphases and theoretical foundations. However, all the resulting models consider spatial properties of the environment as a driver for health threatening exposures as well as salutogenic benefits. All models refer to multiple levels of the environment, i.e., micro, meso, and macro scales. Thus, the individual as well as contextual exposures and influences are represented and quantified. To avoid false conclusions and bias, the use of spatial data for analyzing these influences is subject to important considerations.
As pointed out by Soobader et al. [183], various levels of spatial aggregation are needed for the analysis of environmental justice in geographic space. These levels represent different scales of spatial variables which every data model needs to be able to represent. In order to avoid false conclusions, the modifiable areal unit problem (MAUP) [34], as well as ecological fallacy [184], are to be considered by the data models.
3.1. Scales
When applying spatial data, the consideration of spatial scale is of crucial importance. In the context of environmental justice, for instance, different health relevant environmental influences show varying effect ranges at different scales. In fact, while the propagation of noise is spatially confined due to the shielding and absorbing effect of barriers like walls, air pollution can spread out over long distances. Thus, a data model that includes different environmental factors must be able to depict these varying effect ranges and scales [185]. As Soobader et al. [183] pointed out, this is also true for socioeconomic multilevel data analyses. Although it has been stressed that quantitative environmental justice analyses must include socioeconomic data on the individual scale, as well as the contextual information about the individual living environment [186], in practice socioeconomic data is oftentimes available at an aggregated level and individual level data are rare, especially regional or national data.
Typically, socioeconomic and health data are collected either on a level of individuals or households (micro-scale), or on a contextual level via census data covering areas such as counties, municipalities or census tracts (macro-scale). The distinction between individual-level and contextual measures is important when (a) the variables reflect similar properties, such as individual unemployment status versus the unemployment rate in a district, or (b) the variables can only be measured at a specific level, e.g., population density [187]. Accordingly, while census data might provide a valuable source of information due to their systematic collection for entire populations [186], conclusions about the specific individual health risks are not necessarily imperative. However, macro-level variables represent an important source for indicators affecting individual behavior [187], such as regional deprivation, which also have been shown to impact individual health (e.g., [51,52]). For the application of multilevel analyses on socioeconomic variables, it is therefore necessary to include both individual and aggregated socioeconomic information.
Scale in environmental analyses is not only a matter of space but also a matter of time (for discussion see [188]) making it indispensable to include spatial as well as temporal scales of exposure into the analyses. For instance, while some environmental stressors pose a risk only during short periods of time, others influence human health over extended periods of time. The mobility of the individuals should therefore be represented within a data model [183]. The accumulating effects of different neighborhood influences can only be investigated when using longitudinal data and time series of environmental characteristics [186]. Therefore, in order to paint a holistic picture about the environmental influences on health, it is relevant to also integrate human mobility into the analyses [188].
3.2. Ecological Fallacy and the Modifiable Areal Unit Problem
For modeling environmental health or environmental justice data from heterogeneous sources are utilized to support the analyses. Therefore, it is necessary to question the correct application of geographic data as they might lead to false conclusions owing to potentially inadequate choice of spatial entities. Especially when using different levels of aggregation, i.e., individual-level data in combination with aggregated data, fallacies of inference may occur when necessary variables are missing for the analysis. That is, ecological fallacy can occur when the aggregated units of analysis are used to extrapolate to individual level inferences [184,187,189,190]. As a consequence, it is indeed necessary to include individual-level as well as group-level information when investigating public health and environmental justice. Only thus, it is possible to account for both individual behavior and socially contextual inferences on health [187].
Furthermore, another problem concerning the study design is given by the modifiable areal unit problem (MAUP) [34]. It describes the bias of the chosen spatial entity on the statistical outcomes and it highlights the importance of spatial entities in environmental studies. In fact, in multivariate analyses the influence of MAUP on the changes on variable impact is unpredictable [191]. Any geographical analysis might thereby be influenced in terms of scale, i.e., the chosen size of the spatial entities, and/or zoning, i.e., the actual spatial arrangement of the respective entities [192]. In the case of environmental studies, the effects of MAUP can change the magnitude and distribution of environmental inequality in urban areas drastically [193,194]. To avoid the problem of aggregation bias, Fotheringham & Wong ([191], p. 1042) suggest “to avoid the use of aggregated data where possible”. In reality, however, data on societal properties are mostly available in aggregated form like in census tracts, which restricts most analyses to such aggregated forms. In consequence, analyses in which aggregated data are applied may be subject to a bias induced by MAUP. However, analyses on the scale of image pixels have shown that scaling effects also occur on such fine levels [195] and therefore have to be considered throughout the analysis of any spatial remote sensing data.
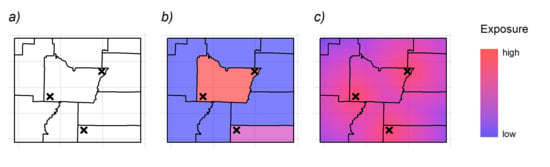
Boundary effects are an additional spatial phenomenon that occurs when high level spatial entities (e.g., spatially discrete emission sources) are aggregated within lower-level spatial units (e.g., census tracts). These might lead to incorrect attribution of environmental exposures to the local population and hence to variation in evidence of environmental health effects [35]. This phenomenon is depicted in Figure 1. Figure 1a) shows administrative areas with three emission sources. Figure 1b) depicts the simple aggregation of burdens as “unit-hazard coincidence”, implicitly affecting only the population within the corresponding administrative area. This approach suggests no exposure to populations close to the emitters which do not live in the host unit. Hence, the exposure might be under-represented by this approach. A review by Brender et al. [196] showed that in environmental studies, such assignments to lower-level spatial entities are used fairly often. The authors also point out that larger spatial entities tend to show a higher environmental bias resulting in ecological fallacy. On the contrary, distance-based methods like the one depicted in Figure 1c) decrease these effects by using spatial weighting of individual emission sources. However, while this only depicts a theoretical case, additional information about topographic or climatic characteristics of the area are required in order to describe the exposure risk in high spatial accuracy.
In conclusion, since the abundance of inconsistent spatial data sources used in the different environmental studies, spatial, ecological, and areal biases lead to varying results with regard to the existence and/or magnitude of environmental health impacts and environmental justice [11]. Since environmental justice analyses underlie the principles of the MAUP and a general solution is not to be found, the analyst must necessarily be aware of possible the implications of the chosen spatial framework on the results [192]. Hence, a spatially accurate description of health relevant influences on individual-level, both salutogenic and noxious, is essential to reduce the spatial bias in environmental justice and health studies. Moreover, when the transition from spatially continuous towards discrete spatial entities is inevitable, it must be taken into account that a certain degree of bias is introduced as a result of the spatial aggregation.
3.3. Combining Remote Sensing and Socioeconomic Data
In recent years, spatial methods have increasingly been used in public health, epidemiological and environmental justice studies [32]. In Section 2, we highlighted how modern methods of remote sensing and geography can be used to derive environmental characteristics of the human habitat as an input variable for interdisciplinary analyses. In this section we describe how interdisciplinary studies combine heterogeneous data from remote sensing and socioeconomic or health surveys. A special focus is placed on the methodological approaches successfully used for combining spatial depictions of physical-environmental conditions and the varying representation of socioeconomic and health (individual-level vs. aggregate).
The combination of socioeconomic and environmental data in areal entities is very common in environmental justice research due to the wide availability of national census surveys. Hence, in various studies such aggregated data were used to analyze the exposure to environmental burdens of differently constituted population (e.g., [18,79,149]). In recent research, various techniques were applied to integrate environmental data into the predefined spatial units. Thereby, applied methods range from distance based methods and kernel density estimations (e.g., [30]), statistical aggregation (e.g., [50,143]) to point data extrapolation (e.g., [17]). Pham et al. [70] and Apparicio et al. [31] applied spatial population-based rescaling to increase the spatial resolution of census data to city block levels. These city blocks were then analyzed with relational land cover metrics. The use of gridded population information in combination with a distance-based aggregation of industrial air pollution [29] increased the spatial information content of coarse census survey data. To achieve even higher spatial detail on sub-block level, land cover and socioeconomic data can be combined using dasymetric metrics [197]. Especially in highly heterogeneous urban landscapes, such methods enable the analysis of environmental burdens on fine granular scales.
Several studies used individual-level socioeconomic and health data in combination with geographically referenced information about the environment. Since these data are either very restricted in terms of access or only very sparsely available, researchers often rely on self-conducted questionnaires and surveys (e.g., [61,198,199]). However, in a practical context it is very cost- and time-intensive to conduct such surveys, which generally limits their application in many applications. To work around this restriction, Taubenböck et al. [200] used very high resolution IKONOS imagery and geo-located questionnaire to investigate relationship between SES and urban structure on building level.
As an alternative, nation-wide individual-level or household surveys like the German Socioeconomic Panel (SOEP) [201], the UK Household Longitudinal Survey (UKHLS) (https://www.understandingsociety.ac.uk/) or the study “Household, Income and Labour Dynamics in Australia” (HILDA) [202] provide large longitudinal data bases of socioeconomic variables on individuals and households. On the basis of household addresses the integration of spatial and socioeconomic data represent a powerful tool for understanding the interaction and behavior of humans within their living environment [203]. While, e.g., Kohlhuber et al. [204] used the vast pool of variables also determining the living conditions of the people to analyze perceived environmental exposure, others enriched the questionnaire with environmental mappings on a spatial base to individual environmental exposure (e.g., [71,102,205]). These and further studies show that there is a significant interest in environmental research to develop, apply and test methods on individual-level surveys. However, many studies are still utilized rather large general purpose spatial units (e.g., [206]).
Even though information is available on both individual and aggregated level, finding the right interpolation method might not be a trivial task. Depending on the used data and research question multiple methods might be required [207]. Furthermore, it is argued that complex geostatistical models require large computer resources, yet, recent advances in computational capacities (e.g., via the Google Earth Engine, see [57]) provide a way to apply vast geospatial methods on large scales. In addition to immense archives of historical and recent satellite imagery, such tools allow for a new way of thinking spatially in environmental health studies and of analyzing exposure on the level of individuals.
4. Discussion
4.1. Establishing Remote Sensing as a Valuable Source of Spatial Data
For this review, literature from a broad range of scientific fields including environmental justice, epidemiology, and remote sensing has been gathered. Overall, the findings show that modern techniques and methods of ’big earth data’ analysis are able to provide relevant spatial information about our environment. In fact, high resolution earth observation imagery can be used to incorporate highly detailed spatial representations of health relevant environmental properties for environmental justice research. Especially in the most prominent case of the localization of green spaces in very heterogeneous urban environments, high resolution earth observation imagery can be considered as an already well-established data source for environmental studies.
To add to further research, this study highlights additional potential benefits of remote sensing data to environmental justice research. Among them are the derivation of micro-climatic properties and land surface temperature estimates, the characterization of the urban structure and density as well as the distribution of air pollutants. Furthermore, the assessment of certain health impacts which cannot be directly derived from physical measurements can greatly benefit from highly accurate proxy information on e.g., the degree of urbanity, urban structure or urban heat islands. Overall, remote sensing imagery provides valuable data to overcome former limitations in terms of detailed quantification of health relevant influences in the urban environment.
In an era in which large archives of historic and recent satellite imagery are freely and easily accessible and unprecedented processing architectures are at hand to derive the physical properties of very large areas, these enormous advantages can be considered a unique opportunity in environmental research. Especially the large-area coverage of satellite imagery and the possibility of large scale data processing create best conditions towards a lasting change in the scope of environmental justice studies. Furthermore, as these developments allow for attainability of as unprecedented spatial resolutions, the choice or the development of socioeconomic or health survey designs to be included in public health and environmental justice studies is altered lastingly. Since it is now possible to acquire highly detailed data of environmental properties in our surroundings on very fine spatial scale, nation-wide individual-level cohort or cross-sectional studies can be merged with multidimensional environmental data.
Building upon the theoretical approach by Bolte et al. [10], environmental justice is defined as the interplay between individual and social influences as well as environmental exposures. Remote sensing technologies and modern ‘big earth data’ are able to provide highly detailed data for the spatial neighborhood of the urban living environment and which can greatly support advances in environmental justice research. Especially since remote sensing images cover large areas on nationwide or even global scales, data models of environmental justice are no longer limited by geographic extent. Multi-level analyses further incorporate highly detailed socioeconomic surveys which provide in-depth descriptions of the population’s SES and vulnerability. In particular, when large-scale comparative studies are performed on national or even international level, remote sensing imagery is a valuable data source without restrictions concerning the quantity and quality of in situ measurements or national bias. Overall, modern big earth geo data provided by satellite imagery has great potential of providing many health relevant features on international level. It should hence be considered for environmental justice research to close the gap of such data as highlighted by the WHO [36].
4.2. Levels of Analysis
Generally, two levels of detail can be distinguished when regarding socioeconomic surveys that are used to describe the SES of the people: individual-level and aggregate data. While individual-level surveys describe the SES of households or individual people, the latter describe aggregate properties of the population grouped within a certain (spatial) entity. However, while both types of socioeconomic surveys are frequently used in environmental justice research, the findings might be related to the level of analysis, i.e., phenomena observed at aggregate-level cannot be identified at individual-level and vice versa. That is, conclusions between those levels of detail might lead to ecological fallacy. Furthermore, when using aggregated survey data, the modifiable areal unit problem has to be considered. While spatial units like census tracts might be adequate for administrative purposes, they might represent some arbitrary spatial entity in terms of environmental conditions and urban neighborhoods. Conversely, in studies in which individual-level data are used, the MAUP has to be considered when integrating contextual metrics and neighborhoods of environmental conditions at e.g., household locations.
Both individual-level and aggregated socioeconomic surveys allow for a detailed description of populations’ characteristics. The SES determines the possibilities of social participation, serves as an effect modifier of individual and external health influences, and impinges upon residential location. That is, environmental justice analyses carry out whether any societal group faces disproportionate environmental burdens. Therefore, detailed descriptions of the social status of the regarded population are mandatory. However, the level of detail of existing socioeconomic data sets varies both in semantic, as well as spatial, detail. While the majority of studies uses survey data which are aggregated on a higher-level unit such as census data, others use existing or self-conducted questionnaires. The latter, however, requires high temporal and personal resources which might not be practicable for certain research questions.
4.3. Limitations
Although remote sensing is able to contribute data to understand and quantify health risks which are induced by various environmental influences, some limitations remain. By nature, satellite sensors are limited to detect phenomena which are detectable by the electromagnetic radiation reflected from the Earth’s surface. Hence, environmental toxins practically invisible to the sensors are not detectable. This issue is exemplified by water and ground pollution or radioactive radiation being undetectable, if the pollutant does not affect the appearance of the surface or vegetation. On another note, all exposures in indoor environments are hidden from the sensors. Hence, information about the indoor housing and living conditions cannot be acquired.
Since some environmental health burdens like noise or air pollution are subject to high spatio-temporal variability, granular resolution assessment of ground-level toxins from remote sensing measurements might not suit the needs of epidemiological studies. However, promising approaches of providing proxy information have been taken to overcome such shortcomings. Yet, further research is needed on how exposure can be modeled by spectral and contextual information such as street network density, built-up structure, or abundance of green spaces.
Further limitations come with the mobility of people. In current studies, exposure towards environmental threats and benefits is assessed at the location of residence. However, people tend to show a highly mobile behavior in the course of the day [208]. In addition, the detectable mobility patterns of every individual are also changing over a life-time [209]. Hence, in order to assess the actual exposure, it is necessary to include individual mobility patterns into the analysis of environmental toxins. Since it remains difficult to model the exact ways of human mobility [210], location-based data from mobile phones and other electronic devices have already been used in urban studies (e.g., [208,211]). They have the potential to support analyses of individuals’ exposure levels in high spatio-temporal resolution.
4.4. Future Pathways
Facing the current developments in the field of earth observation, environmental justice will strongly benefit from ongoing and planned missions as they provide high resolution data. For example, with the recent start of Sentinel-5P and the follow-up mission Sentinel-5 (planned to launch in 2021) atmospheric pollutants can be traced with increased spatial resolution on a global scale. Furthermore, ongoing missions like the Sentinel-2C/D or Landsat programs will provide data continuity on high resolution environmental data for the next decades.
These vast data sources in combination with historic data are already being used to provide user-ready map products like CORINE Land Cover, GUF, GHSL, or EUA. Such products demonstrate the possibilities of deriving semantic information from satellite imagery. Comparatively, domain specific environmental justice data sets could be derived on global scales as products from other disciplines have shown (e.g., [212,213]). Furthermore, temporal monitoring of changing environmental conditions can be achieved by accessing historical and recent images. Especially in combination with modern achievements in machine learning [214], the highly complex relationships between the environment, peoples’ social status, and their health are about to be modeled on a new level of detail.
To summarize this narrative review, all referenced studies which applied spatial analyses of health relevant environmental influences or environmental justice are listed in Table 1. To provide a more detailed overview, the table also presents the most commonly investigated health impacts, the level of detail (LoD) of both socioeconomic status and spatial data, the spatial extent of each study, and if remote sensing techniques were used. As can be deduced from the table, in most studies only one environmental health impact was included in the analyses. Yet, as shown in this review, various environmental factors have a notable impact on human health. This fact stresses the urgent need for environmental studies to include multiple exposures in order to look at our environment in its entirety. Furthermore, both SES and environmental properties were most commonly represented as aggregated variables. Although in some of these cases the environmental variables were acquired continuously (e.g., from satellite imagery), joint analyses were conducted on an aggregated level. We assume that this is due to data availability, since many studies rely on aggregated census data for the description of the socioeconomic conditions. Concerning the size of the area under investigation, the spatial extent covered in the majority of the referenced studies was limited to only one city. While no explanations for this occurrence could be found in the studies, this decision might also be driven by the data availability. However, as we discussed in this review, spatial limitations due to the availability of environmental data might be significantly reduced by modern ‘big earth data’.
The overall use of remote sensing data is more frequent in studies which assess distribution of green space and heat islands and less common in studies analyzing air pollution or noise exposure. While the direct use of remote sensing data by the researchers is mostly limited to citywide analyses, derived data sets like LULC products, such as EUA or CORINE, are used more often in nationwide analyses.
In light of the current state and foreseeable developments of remote sensing-based environmental justice research, we can make the following recommendations for the use of remote sensing in environmental justice studies:
- Remote sensing should be considered a valuable data source for the description, derivation, and quantification of environmental characteristics and their spatial disparities, especially in the heterogeneous urban landscape.
- Either by physical measurements (e.g., for green spaces, heat islands, or air pollution) or through the provision of spatial proxy information (e.g., noise or urban structure), environmental studies can benefit by means of descriptions of environmental characteristics.
- In addition to that, remote sensing can extend existing techniques of describing the physical environment, such as modeling or in-situ measurements, when direct derivation are not possible.
- Remote sensing data can be used to derive information about multiple environmental burdens at various spatial scales.
- Large area coverage and powerful processing infrastructures will bring sustainable changes to the usage of geographic data in environmental justice research by facilitating analyses on regional and national scale.
- Historic and future data in combination with longitudinal survey data can be utilized to study the long-term effects of (changing) urban environments on human health in broad study designs (see also [188]).
- In order to increase public health, remote sensing methods can be applied to build monitoring services of health relevant environmental conditions on national or even international level.
5. Conclusions
Interdisciplinary environmental justice research analyzes the disproportionate environmental health burdens posed to certain social groups. In this context, quantitative spatial analyses have a need for accurate descriptions of environmental characteristics. However, many studies in this field of research employ data at very coarse detail, thus limiting their explanatory power for any small scale phenomena. Furthermore, this review shows that a large share of environmental justice studies are limited to small investigation areas or cover only few environmental burdens. As one possible solution, modern earth observation data can be employed as they aid in increasing the data availability for environmental studies. Moreover, they pose a major improvement by increasing the spatial detail of environmental features in comparison to existing coarse data sets based on strongly aggregated spatial entities. Furthermore, they can be deployed to derive various health relevant environmental features.
As shown in this review, remote sensing data are already used frequently in environmental studies to derive the location and quality of urban green spaces in high spatial detail. Further, the analysis of surface temperatures to assess heat-related burdens are quite common in practice. However, recent developments in remote sensing techniques show further possibilities to aid environmental justice research. In particular, the derivation of large scale high resolution imagery allow for the description various proxy information in urban areas. These, in turn, aid the mapping and understanding of more complex health burdens like noise or air pollution. These unprecedented possibilities of large area data analyses are able to trigger a shift of the research focus of future studies from local to national or international scales. By using historic and recent imagery, temporal changes and developments can be integrated into long-term studies.
Environmental justice research can profit from future remote sensing research. Thus, it is possible to include large scale geographic knowledge in broad interdisciplinary studies to understand the influence of the daily environment on our health in more detail. Further research is needed on how large area spatial data can be brought together with existing surveys on health and socioeconomic characteristics of the population. This will, in consequence, evoke a lasting transformative effect on future research on environmental justice as it enables the expansion of analyses on national or even international levels, while maintaining the high spatial resolution necessary for individual level studies.
Author Contributions
M.W. (Matthias Weigand) designed the conceptual framework and wrote the initial manuscript. M.W. (Michael Wurm) contributed to the design of the conceptual framework as well as to the written manuscript. S.D. and H.T. contributed to the conceptual framework as well as to the written manuscript. All authors discussed the results and commented on the manuscript at all stages.
Funding
This study was funded by a PhD scholarship granted by the German Federal Environmental Foundation (DBU). The funding sponsor had no role in the design of the study, the interpretation, the process of writing of the manuscript or the decision to publish the study.
Acknowledgments
The authors would like to thank Natalie Bienenstein for her constructive criticism on the manuscript.
Conflicts of Interest
The authors declare no conflict of interest. The funders had no role in the design of the study; in the collection, analyses, or interpretation of data; in the writing of the manuscript, or in the decision to publish the results.
References
- UN General Assembly. Transforming Our World: The 2030 Agenda for Sustainable Development; Technical Report; A/RES/70/1; UN General Assembly: New York, NY, USA, 2015. [Google Scholar]
- WHO. Comission on Social Determinants of Health: Note by the Secretariat; Document Number: EB115/35; World Health Organization: Geneva, Switzerland, 2004. [Google Scholar]
- WHO; UN-HABITAT. Hidden Cities: Unmasking and Overcoming Health Inequities In Urban Settings; World Health Organization, Centre for Health Development: Geneva, Switzerland, 2010. [Google Scholar]
- Timæus, I.M.; Lush, L. Intra-urban differentials in child health. Health Transit. Rev. 1995, 5, 163–190. [Google Scholar]
- UNPD. World Urbanization Prospects: The 2014 Revision; Technical Report; United Nations Population Division: New York, NY, USA, 2011. [Google Scholar]
- WHO. Constitution of the Wold Health Organization. Available online: https://apps.who.int/gb/bd/PDF/bd47/EN/constitution-en.pdf (accessed on 9 November 2018).
- Adler, N.E.; Ostrove, J.M. Socioeconomic status and health: What we know and what we don’t. Ann. N. Y. Acad. Sci. 1999, 896, 3–15. [Google Scholar] [CrossRef] [PubMed]
- Valent, F.; Bertollini, R.; Nemer, L.E.; Barbone, F.; Tamburlini, G. Burden of disease attributable to selected environmental factors and injury among children and adolescents in Europe. Lancet 2004, 363, 2032–2039. [Google Scholar] [CrossRef]
- Brulle, R.J.; Pellow, D.N. Environmental justice: Human health and environmental inequalities. Annu. Rev. Public Health 2006, 27, 103–124. [Google Scholar] [CrossRef] [PubMed]
- Bolte, G.; Pauli, A.; Hornberg, C. Environmental justice: Social disparities in environmental exposures and health: Overview. In Encyclopedia of Environmental Health; Nriagu, J.O., Ed.; Elsevier: Amsterdam, The Netherlands, 2011; Volume 2, pp. 459–470. [Google Scholar]
- Mohai, P.; Pellow, D.; Roberts, J.T. Environmental justice. Annu. Rev. Environ. Resour. 2009, 34, 405–430. [Google Scholar] [CrossRef]
- United Church of Christ; Commission for Racial Justice. Toxic Wastes and Race in the United States: A National Report on the Racial and Socio-Economic Characteristics of Communities with Hazardous Waste Sites; Public Data Access: New York, NY, USA, 1987. [Google Scholar]
- Byers, V.; Levin, A.; Ozonoff, D.; Baldwin, R. Association between clinical symptoms and lymphocyte abnormalities in a population with chronic domestic exposure to industrial solvent-contaminated domestic water supply and a high incidence of leukaemia. Cancer Immunol. Immunother. 1988, 27, 77–81. [Google Scholar] [CrossRef]
- Laurian, L.; Funderburg, R. Environmental justice in France? A spatio-temporal analysis of incinerator location. J. Environ. Plan. Manag. 2013, 57, 424–446. [Google Scholar] [CrossRef]
- Hansmann, R.; Hug, S.M.; Seeland, K. Restoration and stress relief through physical activities in forests and parks. Urban For. Urban Green. 2007, 6, 213–225. [Google Scholar] [CrossRef]
- Mitchell, G.; Dorling, D. An environmental justice analysis of British air quality. Environ. Plan. A 2003, 35, 909–929. [Google Scholar] [CrossRef]
- Elliott, P.; Shaddick, G.; Wakefield, J.C.; de Hoogh, C.; Briggs, D.J. Long-term associations of outdoor air pollution with mortality in Great Britain. Thorax 2007, 62, 1088–1094. [Google Scholar] [CrossRef] [Green Version]
- Flacke, J.; Schüle, S.A.; Köckler, H.; Bolte, G. Mapping environmental inequalities relevant for health for informing urban planning interventions—A case study in the city of Dortmund, Germany. Int. J. Environ. Res. Public Health 2016, 13, 711. [Google Scholar] [CrossRef] [PubMed]
- Elliott, S.J.; Cole, D.C.; Krueger, P.; Voorberg, N.; Wakefield, S. The Power of Perception: Health Risk Attributed to Air Pollution in anUrban Industrial Neighbourhood. Risk Anal. 1999, 19, 621–634. [Google Scholar] [CrossRef] [PubMed]
- Bluhm, G.L.; Berglind, N.; Nordling, E.; Rosenlund, M. Road traffic noise and hypertension. Occup. Environ. Med. 2007, 64, 122–126. [Google Scholar] [CrossRef] [PubMed]
- Gidlöf-Gunnarsson, A.; Öhrström, E. Noise and well-being in urban residential environments: The potential role of perceived availability to nearby green areas. Landsc. Urban Plan. 2007, 83, 115–126. [Google Scholar] [CrossRef]
- Schwarzenbach, R.P.; Egli, T.; Hofstetter, T.B.; von Gunten, U.; Wehrli, B. Global Water Pollution and Human Health. Annu. Rev. Environ. Resour. 2010, 35, 109–136. [Google Scholar] [CrossRef] [Green Version]
- Pope, C.A.; Dockery, D.W. Health Effects of Fine Particulate Air Pollution: Lines that Connect. J. Air Waste Manag. Assoc. 2006, 56, 709–742. [Google Scholar] [CrossRef] [PubMed] [Green Version]
- Lim, S.S.; Vos, T.; Flaxman, A.D.; Danaei, G.; Shibuya, K.; Adair-Rohani, H.; AlMazroa, M.A.; Amann, M.; Anderson, H.R.; Andrews, K.G.; et al. A comparative risk assessment of burden of disease and injury attributable to 67 risk factors and risk factor clusters in 21 regions, 1990–2010: A systematic analysis for the Global Burden of Disease Study 2010. Lancet 2012, 380, 2224–2260. [Google Scholar] [CrossRef]
- Seto, E.Y.W.; Holt, A.; Rivard, T.; Bhatia, R. Spatial distribution of traffic induced noise exposures in a US city: An analytic tool for assessing the health impacts of urban planning decisions. Int. J. Health Geogr. 2007, 6, 24. [Google Scholar] [CrossRef]
- Kovats, R.S.; Johnson, H.; Griffith, C. Mortality in southern England during the 2003 heat wave by place of death. Health Stat. Q. 2006, 29, 6–8. [Google Scholar]
- Groenewegen, P.P.; Van den Berg, A.E.; De Vries, S.; Verheij, R.A. Vitamin G: Effects of green space on health, well-being, and social safety. BMC Public Health 2006, 6, 149. [Google Scholar] [CrossRef]
- Dewulf, B.; Neutens, T.; Van Dyck, D.; De Bourdeaudhuij, I.; Broekx, S.; Beckx, C.; Van de Weghe, N. Associations between time spent in green areas and physical activity among late middle-aged adults. Geospat. Health 2016, 11, 411. [Google Scholar] [CrossRef] [PubMed]
- Rüttenauer, T. Neighbours matter: A nation-wide small-area assessment of environmental inequality in Germany. Soc. Sci. Res. 2018, 70, 198–211. [Google Scholar] [CrossRef] [PubMed]
- Kershaw, S.; Gower, S.; Rinner, C.; Campbell, M. Identifying inequitable exposure to toxic air pollution in racialized and low-income neighbourhoods to support pollution prevention. Geospat. Health 2013, 7, 265–278. [Google Scholar] [CrossRef] [PubMed]
- Apparicio, P.; Séguin, A.M.; Dubé, J. Spatial distribution of vegetation in and around city blocks on the Island of Montreal: A double environmental inequity? Appl. Geogr. 2016, 76, 128–136. [Google Scholar] [CrossRef]
- Auchincloss, A.H.; Gebreab, S.Y.; Mair, C.; Diez Roux, A.V. A review of spatial methods in epidemiology, 2000–2010. Annu. Rev. Public Health 2012, 33, 107–122. [Google Scholar] [CrossRef]
- Macintyre, S.; Ellaway, A.; Cummins, S. Place effects on health: How can we conceptualise, operationalise and measure them? Soc. Sci. Med. 2002, 55, 125–139. [Google Scholar] [CrossRef]
- Openshaw, S. The Modifiable Areal Unit Problem; Number 38 in Concepts and Techniques in Modern Geography; Geo Books: Norwich, UK, 1983. [Google Scholar]
- Mohai, P.; Saha, R. Reassessing racial and socioeconomic disparities in environmental justice research. Demography 2006, 43, 383–399. [Google Scholar] [CrossRef]
- WHO. Towards Environmental Health Inequality Reporting; Technical Report; World Health Organization: Copenhagen, Denmark, 2011. [Google Scholar]
- Liu, Y.; Meng, Q.; Zhang, J.; Zhang, L.; Jancso, T.; Vatseva, R. An effective Building Neighborhood Green Index model for measuring urban green space. Int. J. Digit. Earth 2016, 9, 387–409. [Google Scholar] [CrossRef]
- De Voorde, T.V. Spatially explicit urban green indicators for characterizing vegetation cover and public green space proximity: A case study on Brussels, Belgium. Int. J. Digit. Earth 2017, 10, 798–813. [Google Scholar] [CrossRef]
- Meng, Q.; Zhang, L.; Sun, Z.; Meng, F.; Wang, L.; Sun, Y. Characterizing spatial and temporal trends of surface urban heat island effect in an urban main built-up area: A 12-year case study in Beijing, China. Remote Sens. Environ. 2018, 204, 826–837. [Google Scholar] [CrossRef]
- Zhangyan, J.; Yunhao, C.; Jing, L. On urban heat island of Beijing based on landsat TM data. Geo-Spat. Inf. Sci. 2006, 9, 293–297. [Google Scholar] [CrossRef]
- De Faria Peres, L.; de Lucena, A.J.; Filho, O.C.R.; de Almeida França, J.R. The urban heat island in Rio de Janeiro, Brazil, in the last 30 years using remote sensing data. Int. J. Appl. Earth Obs. Geoinf. 2018, 64, 104–116. [Google Scholar] [CrossRef]
- Luechinger, S. Valuing air quality using the life satisfaction approach. Econ. J. 2009, 119, 482–515. [Google Scholar] [CrossRef]
- Di, Q.; Dai, L.; Wang, Y.; Zanobetti, A.; Choirat, C.; Schwartz, J.D.; Dominici, F. Association of Short-term Exposure to Air Pollution With Mortality in Older Adults. JAMA 2017, 318, 2446. [Google Scholar] [CrossRef] [PubMed]
- Kohlhuber, M.; Schenk, T.; Weiland, U. Verkehrsbezogene Luftschadstoffe und Lärm. In Umweltgerechtigkeit Chancengleichheit bei Umwelt und Gesundheit: Konzepte, Datenlage und Handlungsperspektiven; Bolte, G., Bunge, C., Hornberg, C., Köckler, H., Andreas, M., Eds.; Verlag Hans Huber: Bern, Switzerland, 2012; pp. 87–89. [Google Scholar]
- Marmot, M.; Shipley, M.; Rose, G. Inequalities in death–specific explanations of a general pattern? Lancet 1984, 323, 1003–1006. [Google Scholar] [CrossRef]
- Winkleby, M.A.; Jatulis, D.E.; Frank, E.; Fortmann, S.P. Socioeconomic status and health: How education, income, and occupation contribute to risk factors for cardiovascular disease. Am. J. Public Health 1992, 82, 816–820. [Google Scholar] [CrossRef] [PubMed]
- Braveman, P.A.; Cubbin, C.; Egerter, S.; Chideya, S.; Marchi, K.S.; Metzler, M.; Posner, S. Socioeconomic Status in Health Research. JAMA 2005, 294, 2879. [Google Scholar] [CrossRef] [PubMed]
- Maschewsky, W. Umweltgerechtigkeit, Public Health und Soziale Stadt; VAS: Frankfurt am Main, Germany, 2001. [Google Scholar]
- Breckenkamp, J.; Mielck, A.; Razum, O. Health inequalities in Germany: Do regional-level variables explain differentials in cardiovascular risk? BMC Public Health 2007, 7, 132. [Google Scholar] [CrossRef]
- Rey, G.; Fouillet, A.; Bessemoulin, P.; Frayssinet, P.; Dufour, A.; Jougla, E.; Hémon, D. Heat exposure and socio-economic vulnerability as synergistic factors in heat-wave-related mortality. Eur. J. Epidemiol. 2009, 24, 495–502. [Google Scholar] [CrossRef]
- Voigtländer, S.; Berger, U.; Razum, O. The impact of regional and neighbourhood deprivation on physical health in Germany: A multilevel study. BMC Public Health 2010, 10, 403. [Google Scholar] [CrossRef]
- Reiss, K.; Berger, U.; Winkler, V.; Voigtländer, S.; Becher, H.; Razum, O. Assessing the effect of regional deprivation on mortality avoiding compositional bias: A natural experiment. J. Epidemiol. Community Health 2012, 67, 213–218. [Google Scholar] [CrossRef] [PubMed]
- Marmot, M. Epidemiology of socioeconomic status and health: Are determinants within countries the same as between countries? Ann. N. Y. Acad. Sci. 1999, 896, 16–29. [Google Scholar] [CrossRef] [PubMed]
- Frumkin, H. Urban sprawl and public health. Public Health Rep. 2002, 117, 201–217. [Google Scholar] [CrossRef]
- Evans, G.W.; Kantrowitz, E. Socioeconomic Status and Health: The Potential Role of Environmental Risk Exposure. Annu. Rev. Public Health 2002, 23, 303–331. [Google Scholar] [CrossRef] [PubMed] [Green Version]
- Vrijheid, M.; Martinez, D.; Aguilera, I.; Ballester, F.; Basterrechea, M.; Esplugues, A.; Guxens, M.; Larrañaga, M.; Lertxundi, A.; Mendez, M.; et al. Socioeconomic status and exposure to multiple environmental pollutants during pregnancy: Evidence for environmental inequity? J. Epidemiol. Community Health 2010, 66, 106–113. [Google Scholar] [CrossRef]
- Gorelick, N.; Hancher, M.; Dixon, M.; Ilyushchenko, S.; Thau, D.; Moore, R. Google Earth Engine: Planetary-scale geospatial analysis for everyone. Remote Sens. Environ. 2017, 202, 18–27. [Google Scholar] [CrossRef]
- Guo, H. Big Earth data: A new frontier in Earth and information sciences. Big Earth Data 2017, 1, 4–20. [Google Scholar] [CrossRef] [Green Version]
- Faruque, F. Remote Sensing and Geospatial Technologies in Public Health. ISPRS Int. J. Geo-Inf. 2018, 7, 303. [Google Scholar] [CrossRef]
- Maas, J.; Verheij, R.A.; Groenewegen, P.P.; De Vries, S.; Spreeuwenberg, P. Green space, urbanity, and health: How strong is the relation? J. Epidemiol. Community Health 2006, 60, 587–592. [Google Scholar] [CrossRef]
- van den Berg, A.E.; Maas, J.; Verheij, R.A.; Groenewegen, P.P. Green space as a buffer between stressful life events and health. Soc. Sci. Med. 2010, 70, 1203–1210. [Google Scholar] [CrossRef] [Green Version]
- Mitchell, R.; Popham, F. Effect of exposure to natural environment on health inequalities: An observational population study. Lancet 2008, 372, 1655–1660. [Google Scholar] [CrossRef]
- Thompson, C.W.; Roe, J.; Aspinall, P.; Mitchell, R.; Clow, A.; Miller, D. More green space is linked to less stress in deprived communities: Evidence from salivary cortisol patterns. Landsc. Urban Plan. 2012, 105, 221–229. [Google Scholar] [CrossRef] [Green Version]
- Villeneuve, P.J.; Jerrett, M.; Su, J.G.; Burnett, R.T.; Chen, H.; Wheeler, A.J.; Goldberg, M.S. A cohort study relating urban green space with mortality in Ontario, Canada. Environ. Res. 2012, 115, 51–58. [Google Scholar] [CrossRef] [PubMed]
- Richardson, E.; Pearce, J.; Mitchell, R.; Kingham, S. Role of physical activity in the relationship between urban green space and health. Public Health 2013, 127, 318–324. [Google Scholar] [CrossRef] [Green Version]
- Du, H.; Cai, W.; Xu, Y.; Wang, Z.; Wang, Y.; Cai, Y. Quantifying the cool island effects of urban green spaces using remote sensing Data. Urban For. Urban Green. 2017, 27, 24–31. [Google Scholar] [CrossRef]
- Mitchell, R.; Popham, F. Greenspace, urbanity and health: Relationships in England. J. Epidemiol. Community Health 2007, 61, 681–683. [Google Scholar] [CrossRef] [PubMed]
- Milligan, C.; Bingley, A. Restorative places or scary spaces? The impact of woodland on the mental well-being of young adults. Health Place 2007, 13, 799–811. [Google Scholar] [CrossRef] [PubMed]
- Heynen, N.; Perkins, H.A.; Roy, P. The political ecology of uneven urban green space: The impact of political economy on race and ethnicity in producing environmental inequality in Milwaukee. Urban Aff. Rev. 2006, 42, 3–25. [Google Scholar] [CrossRef]
- Pham, T.T.H.; Apparicio, P.; Séguin, A.M.; Landry, S.; Gagnon, M. Spatial distribution of vegetation in Montreal: An uneven distribution or environmental inequity? Landsc. Urban Plan. 2012, 107, 214–224. [Google Scholar] [CrossRef]
- Wüstemann, H.; Kalisch, D.; Kolbe, J. Access to urban green space and environmental inequalities in Germany. Landsc. Urban Plan. 2017, 164, 124–131. [Google Scholar] [CrossRef]
- Kabisch, N.; Haase, D. Green justice or just green? Provision of urban green spaces in Berlin, Germany. Landsc. Urban Plan. 2014, 122, 129–139. [Google Scholar] [CrossRef]
- Solimini, D. Understanding Earth Observation; Springer International Publishing: New York, NY, USA, 2016. [Google Scholar] [CrossRef]
- Tucker, C.J.; Sellers, P.J. Satellite remote sensing of primary production. Int. J. Remote Sens. 1986, 7, 1395–1416. [Google Scholar] [CrossRef] [Green Version]
- Idso, S.B.; Jackson, R.D.; Reginato, R.J. Remote-Sensing of Crop Yields. Science 1977, 196, 19–25. [Google Scholar] [CrossRef] [PubMed]
- Lakes, T.; Brückner, M.; Krämer, A. Development of an environmental justice index to determine socio-economic disparities of noise pollution and green space in residential areas in Berlin. J. Environ. Plan. Manag. 2013, 57, 538–556. [Google Scholar] [CrossRef]
- Li, X.; Meng, Q.; Li, W.; Zhang, C.; Jancso, T.; Mavromatis, S. An explorative study on the proximity of buildings to green spaces in urban areas using remotely sensed imagery. Ann. GIS 2014, 20, 193–203. [Google Scholar] [CrossRef]
- Santos, T.; Tenedório, J.; Gonçalves, J. Quantifying the City’s Green Area Potential Gain Using Remote Sensing Data. Sustainability 2016, 8, 1247. [Google Scholar] [CrossRef]
- Banzhaf, E.; de la Barrera, F. Evaluating public green spaces for the quality of life in cities by integrating RS mapping tools and social science techniques. In Proceedings of the 2017 Joint Urban Remote Sensing Event (JURSE), Dubai, UAE, 6–8 March 2017. [Google Scholar] [CrossRef]
- Ekkel, E.D.; de Vries, S. Nearby green space and human health: Evaluating accessibility metrics. Landsc. Urban Plan. 2017, 157, 214–220. [Google Scholar] [CrossRef]
- Bertram, C.; Rehdanz, K. The role of urban green space for human well-being. Ecol. Econ. 2015, 120, 139–152. [Google Scholar] [CrossRef] [Green Version]
- Grunewald, K.; Richter, B.; Meinel, G.; Herold, H.; Syrbe, R.U. Proposal of indicators regarding the provision and accessibility of green spaces for assessing the ecosystem service “recreation in the city” in Germany. Int. J. Biodivers. Sci. Ecosyst. Serv. Manag. 2017, 13, 26–39. [Google Scholar] [CrossRef]
- Lelieveld, J.; Evans, J.S.; Fnais, M.; Giannadaki, D.; Pozzer, A. The contribution of outdoor air pollution sources to premature mortality on a global scale. Nature 2015, 525, 367–371. [Google Scholar] [CrossRef]
- Beelen, R.; Raaschou-Nielsen, O.; Stafoggia, M.; Andersen, Z.J.; Weinmayr, G.; Hoffmann, B.; Wolf, K.; Samoli, E.; Fischer, P.; Nieuwenhuijsen, M.; et al. Effects of long-term exposure to air pollution on natural-cause mortality: An analysis of 22 European cohorts within the multicentre ESCAPE project. Lancet 2014, 383, 785–795. [Google Scholar] [CrossRef]
- Brunekreef, B.; Holgate, S.T. Air pollution and health. Lancet 2002, 360, 1233–1242. [Google Scholar] [CrossRef]
- Hoek, G.; Brunekreef, B.; Goldbohm, S.; Fischer, P.; van den Brandt, P.A. Association between mortality and indicators of traffic-related air pollution in the Netherlands: A cohort study. Lancet 2002, 360, 1203–1209. [Google Scholar] [CrossRef]
- Dockery, D.W.; Pope, C.A.; Xu, X.; Spengler, J.D.; Ware, J.H.; Fay, M.E.; Ferris, B.G., Jr.; Speizer, F.E. An association between air pollution and mortality in six US cities. N. Engl. J. Med. 1993, 329, 1753–1759. [Google Scholar] [CrossRef] [PubMed]
- Pope, C.A.; Burnett, R.T.; Thun, M.J.; Calle, E.E.; Krewski, D.; Ito, K.; Thurston, G.D. Lung cancer, cardiopulmonary mortality, and long-term exposure to fine particulate air pollution. JAMA 2002, 287, 1132–1141. [Google Scholar] [CrossRef] [PubMed]
- Pope, C.A.; Burnett, R.T.; Thurston, G.D.; Thun, M.J.; Calle, E.E.; Krewski, D.; Godleski, J.J. Cardiovascular mortality and long-term exposure to particulate air pollution. Circulation 2004, 109, 71–77. [Google Scholar] [CrossRef] [PubMed]
- Zhang, K.; Batterman, S. Air pollution and health risks due to vehicle traffic. Sci. Total Environ. 2013, 450, 307–316. [Google Scholar] [CrossRef] [Green Version]
- Collins, T.W.; Grineski, S.E.; Morales, D.X. Sexual Orientation, Gender, and Environmental Injustice: Unequal Carcinogenic Air Pollution Risks in Greater Houston. Ann. Am. Assoc. Geogr. 2017, 107, 72–92. [Google Scholar] [CrossRef]
- Erbertseder, T.; Taubenböck, H.; Meyer-Arnek, J. Dicke Luft – Stadtregionen als globale Zentren der Luftverschmutzung. In Globale Urbanisierung; Springer: Berlin/Heidelberg, Germany, 2015; pp. 191–203. [Google Scholar]
- Martin, R.V. Satellite remote sensing of surface air quality. Atmos. Environ. 2008, 42, 7823–7843. [Google Scholar] [CrossRef]
- Duncan, B.N.; Prados, A.I.; Lamsal, L.N.; Liu, Y.; Streets, D.G.; Gupta, P.; Hilsenrath, E.; Kahn, R.A.; Nielsen, J.E.; Beyersdorf, A.J.; et al. air quality applications: Examples of applications, summary of data end-user resources, answers to FAQs, and common mistakes to avoid. Atmos. Environ. 2014, 94, 647–662. [Google Scholar] [CrossRef]
- Van Donkelaar, A.; Martin, R.V.; Brauer, M.; Boys, B.L. Use of Satellite Observations for Long-Term Exposure Assessment of Global Concentrations of Fine Particulate Matter. Environ. Health Perspect. 2015. [Google Scholar] [CrossRef] [PubMed]
- Brauer, M.; Freedman, G.; Frostad, J.; van Donkelaar, A.; Martin, R.V.; Dentener, F.; van Dingenen, R.; Estep, K.; Amini, H.; Apte, J.S.; et al. Ambient Air Pollution Exposure Estimation for the Global Burden of Disease 2013. Environ. Sci. Technol. 2015, 50, 79–88. [Google Scholar] [CrossRef] [PubMed]
- Gupta, P.; Christopher, S.A.; Wang, J.; Gehrig, R.; Lee, Y.; Kumar, N. Satellite remote sensing of particulate matter and air quality assessment over global cities. Atmos. Environ. 2006, 40, 5880–5892. [Google Scholar] [CrossRef]
- Hu, Z. Spatial analysis of MODIS aerosol optical depth, PM2.5, and chronic coronary heart disease. Int. J. Health Geogr. 2009, 8, 27. [Google Scholar] [CrossRef] [PubMed] [Green Version]
- Guo, Y.; Feng, N.; Christopher, S.A.; Kang, P.; Zhan, F.B.; Hong, S. Satellite remote sensing of fine particulate matter (PM2.5) air quality over Beijing using MODIS. Int. J. Remote Sens. 2014, 35, 6522–6544. [Google Scholar] [CrossRef]
- Van Donkelaar, A.; Martin, R.V.; Brauer, M.; Kahn, R.; Levy, R.; Verduzco, C.; Villeneuve, P.J. Global Estimates of Ambient Fine Particulate Matter Concentrations from Satellite-Based Aerosol Optical Depth: Development and Application. Environ. Health Perspect. 2010, 118, 847–855. [Google Scholar] [CrossRef] [PubMed] [Green Version]
- Prud’homme, G.; Dobbin, N.A.; Sun, L.; Burnett, R.T.; Martin, R.V.; Davidson, A.; Cakmak, S.; Villeneuve, P.J.; Lamsal, L.N.; van Donkelaar, A.; et al. Comparison of remote sensing and fixed-site monitoring approaches for examining air pollution and health in a national study population. Atmos. Environ. 2013, 80, 161–171. [Google Scholar] [CrossRef]
- Voigtländer, S.; Goebel, J.; Claßen, T.; Wurm, M.; Berger, U.; Stunk, A.; Elbern, H. Using geographically referenced data on environmental exposures for public health research: A feasibility study based on the German Socio-Economic Panel Study (SOEP). SOEPpapers 2011, 386, 22. [Google Scholar] [CrossRef]
- Li, T.; Shen, H.; Yuan, Q.; Zhang, X.; Zhang, L. Estimating Ground-Level PM2.5 by Fusing Satellite and Station Observations: A Geo-Intelligent Deep Learning Approach. Geophys. Res. Lett. 2017, 44, 11985–11993. [Google Scholar] [CrossRef]
- Briggs, D.J.; Collins, S.; Elliot, P.; Fischer, P.; Kingham, S.; Lebert, E.; Pryl, K.; van Reeuwijk, H.; Smallbone, K.; van der Veen, A. Mapping urban air pollution using GIS: A regression-based approach. Int. J. Geogr. Inf. Sci. 1997, 11, 699–718. [Google Scholar] [CrossRef]
- Hoek, G.; Beelen, R.; de Hoogh, K.; Vienneau, D.; Gulliver, J.; Fischer, P.; Briggs, D. A review of land-use regression models to assess spatial variation of outdoor air pollution. Atmos. Environ. 2008, 42, 7561–7578. [Google Scholar] [CrossRef]
- Ryan, P.H.; LeMasters, G.K. A Review of Land-use Regression Models for Characterizing Intraurban Air Pollution Exposure. Inhal. Toxicol. 2007, 19, 127–133. [Google Scholar] [CrossRef] [Green Version]
- Ryan, P.H.; LeMasters, G.K.; Biswas, P.; Levin, L.; Hu, S.; Lindsey, M.; Bernstein, D.I.; Lockey, J.; Villareal, M.; Hershey, G.K.K.; et al. A Comparison of Proximity and Land Use Regression Traffic Exposure Models and Wheezing in Infants. Environ. Health Perspect. 2007, 115, 278–284. [Google Scholar] [CrossRef] [Green Version]
- Habermann, M.; Billger, M.; Haeger-Eugensson, M. Land use Regression as Method to Model Air Pollution. Previous Results for Gothenburg/Sweden. Procedia Eng. 2015, 115, 21–28. [Google Scholar] [CrossRef] [Green Version]
- Bertazzon, S.; Johnson, M.; Eccles, K.; Kaplan, G.G. Accounting for spatial effects in land use regression for urban air pollution modeling. Spat. Spatio-Temporal Epidemiol. 2015, 14–15, 9–21. [Google Scholar] [CrossRef]
- Lee, M.; Brauer, M.; Wong, P.; Tang, R.; Tsui, T.H.; Choi, C.; Cheng, W.; Lai, P.C.; Tian, L.; Thach, T.Q.; et al. Land use regression modelling of air pollution in high density high rise cities: A case study in Hong Kong. Sci. Total Environ. 2017, 592, 306–315. [Google Scholar] [CrossRef] [Green Version]
- Pearce, J.; Kingham, S.; Zawar-Reza, P. Every Breath You Take? Environmental Justice and Air Pollution in Christchurch, New Zealand. Environ. Plan. A 2006, 38, 919–938. [Google Scholar] [CrossRef]
- Vardoulakis, S.; Fisher, B.E.; Pericleous, K.; Gonzalez-Flesca, N. Modelling air quality in street canyons: A review. Atmos. Environ. 2003, 37, 155–182. [Google Scholar] [CrossRef]
- Wang, M.; Gehring, U.; Hoek, G.; Keuken, M.; Jonkers, S.; Beelen, R.; Eeftens, M.; Postma, D.S.; Brunekreef, B. Air Pollution and Lung Function in Dutch Children: A Comparison of Exposure Estimates and Associations Based on Land Use Regression and Dispersion Exposure Modeling Approaches. Environ. Health Perspect. 2015, 123, 847–851. [Google Scholar] [CrossRef] [Green Version]
- Passchier-Vermeer, W.; Passchier, W.F. Noise exposure and public health. Environ. Health Perspect. 2000, 108, 123. [Google Scholar]
- Fyhri, A.; Aasvang, G.M. Noise, sleep and poor health: Modeling the relationship between road traffic noise and cardiovascular problems. Sci. Total Environ. 2010, 408, 4935–4942. [Google Scholar] [CrossRef]
- Stansfeld, S.A.; Matheson, M.P. Noise pollution: Non-auditory effects on health. Br. Med. Bull. 2003, 68, 243–257. [Google Scholar] [CrossRef]
- Von Szombathely, M.; Albrecht, M.; Augustin, J.; Bechtel, B.; Dwinger, I.; Gaffron, P.; Krefis, A.; Oßenbrügge, J.; Strüver, A. Relation between Observed and Perceived Traffic Noise and Socio-Economic Status in Urban Blocks of Different Characteristics. Urban Sci. 2018, 2, 20. [Google Scholar] [CrossRef]
- Fyhri, A.; Klaeboe, R. Road traffic noise, sensitivity, annoyance and self-reported health—A structural equation model exercise. Environ. Int. 2009, 35, 91–97. [Google Scholar] [CrossRef]
- Havard, S.; Reich, B.J.; Bean, K.; Chaix, B. Social inequalities in residential exposure to road traffic noise: An environmental justice analysis based on the RECORD Cohort Study. Occup. Environ. Med. 2011, 68, 366–374. [Google Scholar] [CrossRef]
- Steele, C. A critical review of some traffic noise prediction models. Appl. Acoust. 2001, 62, 271–287. [Google Scholar] [CrossRef]
- Garg, N.; Maji, S. A critical review of principal traffic noise models: Strategies and implications. Environ. Impact Assess. Rev. 2014, 46, 68–81. [Google Scholar] [CrossRef]
- Riedel, N.; Scheiner, J.; Müller, G.; Köckler, H. Assessing the relationship between objective and subjective indicators of residential exposure to road traffic noise in the context of environmental justice. J. Environ. Plan. Manag. 2013, 57, 1398–1421. [Google Scholar] [CrossRef]
- European Union. Directive 2002/49/EC of the European parliament and the Council of 25 June 2002 relating to the assessment and management of environmental noise. Off. J. Eur. Commun. 2002, 189, 2002. [Google Scholar]
- Xie, D.; Liu, Y.; Chen, J. Mapping Urban Environmental Noise: A Land Use Regression Method. Environ. Sci. Technol. 2011, 45, 7358–7364. [Google Scholar] [CrossRef]
- Goudreau, S.; Plante, C.; Fournier, M.; Brand, A.; Roche, Y.; Smargiassi, A. Estimation of Spatial Variations in Urban Noise Levels with a Land Use Regression Model. Environ. Pollut. 2014, 3. [Google Scholar] [CrossRef]
- Dale, L.M.; Goudreau, S.; Perron, S.; Ragettli, M.S.; Hatzopoulou, M.; Smargiassi, A. Socioeconomic status and environmental noise exposure in Montreal, Canada. BMC Public Health 2015, 15. [Google Scholar] [CrossRef]
- Aguilera, I.; Foraster, M.; Basagaña, X.; Corradi, E.; Deltell, A.; Morelli, X.; Phuleria, H.C.; Ragettli, M.S.; Rivera, M.; Thomasson, A.; et al. Application of land use regression modelling to assess the spatial distribution of road traffic noise in three European cities. J. Expo. Sci. Environ. Epidemiol. 2015, 25, 97–105. [Google Scholar] [CrossRef]
- de Souza, L.C.L.; Giunta, M.B. Urban indices as environmental noise indicators. Comput. Environ. Urban Syst. 2011, 35, 421–430. [Google Scholar] [CrossRef]
- Ariza-Villaverde, A.B.; Jiménez-Hornero, F.J.; Ravé, E.G.D. Influence of urban morphology on total noise pollution: Multifractal description. Sci. Total Environ. 2014, 472, 1–8. [Google Scholar] [CrossRef]
- Silva, L.T.; Oliveira, M.; Silva, J.F. Urban form indicators as proxy on the noise exposure of buildings. Appl. Acoust. 2014, 76, 366–376. [Google Scholar] [CrossRef] [Green Version]
- Weber, N.; Haase, D.; Franck, U. Assessing modelled outdoor traffic-induced noise and air pollution around urban structures using the concept of landscape metrics. Landsc. Urban Plan. 2014, 125, 105–116. [Google Scholar] [CrossRef]
- Weber, N.; Haase, D.; Franck, U. Traffic-induced noise levels in residential urban structures using landscape metrics as indicators. Ecol. Indic. 2014, 45, 611–621. [Google Scholar] [CrossRef]
- Bouzir, T.A.K.; Zemmouri, N. Effect of urban morphology on road noise distribution. Energy Procedia 2017, 119, 376–385. [Google Scholar] [CrossRef]
- Sakieh, Y.; Jaafari, S.; Ahmadi, M.; Danekar, A. Green and calm: Modeling the relationships between noise pollution propagation and spatial patterns of urban structures and green covers. Urban For. Urban Green. 2017, 24, 195–211. [Google Scholar] [CrossRef]
- IPCC. Climate Change 2014: Synthesis Report. Contribution of Working Groups I, II and III to the Fifth Assessment Report of the Intergovernmental Panel on Climate Change; Technical Report; Intergovernmental Panel on Climate Change: Geneva, Switzerland, 2014. [Google Scholar]
- Pirard, P.; Vandentorren, S.; Pascal, M.; Laaidi, K.; Le Tertre, A.; Cassadou, S.; Ledrans, M. Summary of the mortality impact assessment of the 2003 heat wave in France. Euro Surveillance Bulletin Europeen sur les Maladies Transmissibles 2005, 10, 153–156. [Google Scholar] [CrossRef]
- Vandentorren, S.; Bretin, P.; Zeghnoun, A.; Mandereau-Bruno, L.; Croisier, A.; Cochet, C.; Ribéron, J.; Siberan, I.; Declercq, B.; Ledrans, M. August 2003 heat wave in France: Risk factors for death of elderly people living at home. Eur. J. Public Health 2006, 16, 583–591. [Google Scholar] [CrossRef]
- Scherer, D.; Fehrenbach, U.; Lakes, T.; Lauf, S.; Meier, F.; Schuster, C. Quantification of heat-stress related mortality hazard, vulnerability and risk in Berlin, Germany. DIE ERDE J. Geogr. Soc. Berl. 2014, 144, 238–259. [Google Scholar] [CrossRef]
- Urban, A.; Burkart, K.; Kyselỳ, J.; Schuster, C.; Plavcová, E.; Hanzlíková, H.; Štěpánek, P.; Lakes, T. Spatial patterns of heat-related cardiovascular mortality in the Czech Republic. Int. J. Environ. Res. Public Health 2016, 13, 284. [Google Scholar] [CrossRef]
- Schuster, C.; Burkart, K.; Lakes, T. Heat mortality in Berlin–Spatial variability at the neighborhood scale. Urban Clim. 2014, 10, 134–147. [Google Scholar] [CrossRef]
- Dugord, P.A.; Lauf, S.; Schuster, C.; Kleinschmit, B. Land use patterns, temperature distribution, and potential heat stress risk—The case study Berlin, Germany. Comput. Environ. Urban Syst. 2014, 48, 86–98. [Google Scholar] [CrossRef]
- Weng, Q.; Lu, D.; Schubring, J. Estimation of land surface temperature–vegetation abundance relationship for urban heat island studies. Remote Sens. Environ. 2004, 89, 467–483. [Google Scholar] [CrossRef]
- Johnson, D.P.; Wilson, J.S.; Luber, G.C. Socioeconomic indicators of heat-related health risk supplemented with remotely sensed data. Int. J. Health Geogr. 2009, 8, 57. [Google Scholar] [CrossRef] [Green Version]
- Oke, T.R. City size and the urban heat island. Atmos. Environ. 1973, 7, 769–779. [Google Scholar] [CrossRef]
- Bornstein, R.D. Observations of the Urban Heat Island Effect in New York City. J. Appl. Meteorol. 1968, 7, 575–582. [Google Scholar] [CrossRef] [Green Version]
- Roth, M.; Oke, T.; Emery, W. Satellite-derived urban heat islands from three coastal cities and the utilization of such data in urban climatology. Int. J. Remote Sens. 1989, 10, 1699–1720. [Google Scholar] [CrossRef]
- Ngie, A.; Abutaleb, K.; Ahmed, F.; Darwish, A.; Ahmed, M. Assessment of urban heat island using satellite remotely sensed imagery: A review. S. Afr. Geogr. J. 2014, 96, 198–214. [Google Scholar] [CrossRef]
- Ayanlade, A.; Jegede, O. Evaluation of the intensity of the daytime surface urban heat island: How can remote sensing help? Int. J. Image Data Fusion 2015, 6, 348–365. [Google Scholar] [CrossRef]
- Pearsall, H. Staying cool in the compact city: Vacant land and urban heating in Philadelphia, Pennsylvania. Appl. Geogr. 2017, 79, 84–92. [Google Scholar] [CrossRef]
- Stathopoulou, M.; Cartalis, C. Use of Satellite Remote Sensing in Support of Urban Heat Island Studies. Adv. Build. Energy Res. 2007, 1, 203–212. [Google Scholar] [CrossRef]
- Heldens, W.; Taubenböck, H.; Esch, T.; Heiden, U.; Wurm, M. Analysis of Surface Thermal Patterns in Relation to Urban Structure Types: A Case Study for the City of Munich. In Thermal Infrared Remote Sensing; Springer: Dordrecht, The Netherlands, 2013; pp. 475–493. [Google Scholar] [CrossRef]
- Stewart, I.D.; Oke, T.R. Local Climate Zones for Urban Temperature Studies. Bull. Am. Meteorol. Soc. 2012, 93, 1879–1900. [Google Scholar] [CrossRef]
- Middel, A.; Häb, K.; Brazel, A.J.; Martin, C.A.; Guhathakurta, S. Impact of urban form and design on mid-afternoon microclimate in Phoenix Local Climate Zones. Landsc. Urban Plan. 2014, 122, 16–28. [Google Scholar] [CrossRef] [Green Version]
- Leconte, F.; Bouyer, J.; Claverie, R.; Pétrissans, M. Using Local Climate Zone scheme for UHI assessment: Evaluation of the method using mobile measurements. Build. Environ. 2015, 83, 39–49. [Google Scholar] [CrossRef]
- Fenner, D.; Meier, F.; Bechtel, B.; Otto, M.; Scherer, D. Intra and inter ‘local climate zone’ variability of air temperature as observed by crowdsourced citizen weather stations in Berlin, Germany. Meteorol. Z. 2017, 26, 525–547. [Google Scholar] [CrossRef]
- Leconte, F.; Bouyer, J.; Claverie, R.; Pétrissans, M. Analysis of nocturnal air temperature in districts using mobile measurements and a cooling indicator. Theor. Appl. Climatol. 2017, 130, 365–376. [Google Scholar] [CrossRef]
- Budhiraja, B.; Pathak, P.; Agrawal, G. Spatio-temporal variability of urban heat islands in local climate zones of Delhi-NCR. In Proceedings of the Remote Sensing Technologies and Applications in Urban Environments II, Warsaw, Poland, 11–14 September 2017; Heldens, W., Chrysoulakis, N., Erbertseder, T., Zhang, Y., Eds.; [Google Scholar] [CrossRef]
- Cai, M.; Ren, C.; Xu, Y.; Lau, K.K.L.; Wang, R. Investigating the relationship between local climate zone and land surface temperature using an improved WUDAPT methodology—A case study of Yangtze River Delta, China. Urban Clim. 2018, 24, 485–502. [Google Scholar] [CrossRef]
- Chen, Y.C.; Lin, T.P.; Shih, W.Y. Modeling the urban thermal environment distributions in Taipei Basin using Local Climate Zone (LCZ). In Proceedings of the 2017 Joint Urban Remote Sensing Event (JURSE), Dubai, UAE, 6–8 March 2017. [Google Scholar] [CrossRef]
- Geletic, J.; Dobrovolny, P.; Lehnert, M. Statistical analyses of land surface temperature in local climate zones: Case study of Brno and Prague (Czech Republic). In Proceedings of the 2017 Joint Urban Remote Sensing Event (JURSE), Dubai, UAE, 6–8 March 2017. [Google Scholar] [CrossRef]
- Bechtel, B.; Daneke, C. Classification of Local Climate Zones Based on Multiple Earth Observation Data. IEEE J. Sel. Top. Appl. Earth Obs. Remote Sens. 2012, 5, 1191–1202. [Google Scholar] [CrossRef]
- Bechtel, B.; Alexander, P.; Böhner, J.; Ching, J.; Conrad, O.; Feddema, J.; Mills, G.; See, L.; Stewart, I. Mapping Local Climate Zones for a Worldwide Database of the Form and Function of Cities. ISPRS Int. J. Geo-Inf. 2015, 4, 199–219. [Google Scholar] [CrossRef] [Green Version]
- Danylo, O.; See, L.; Bechtel, B.; Schepaschenko, D.; Fritz, S. Contributing to WUDAPT: A Local Climate Zone Classification of Two Cities in Ukraine. IEEE J. Sel. Top. Appl. Earth Obs. Remote Sens. 2016, 9, 1841–1853. [Google Scholar] [CrossRef]
- Tuia, D.; Moser, G.; Wurm, M.; Taubenböck, H. Land use modeling in North Rhine-Westphalia with interaction and scaling laws. In Proceedings of the 2017 Joint Urban Remote Sensing Event (JURSE), Dubai, UAE, 6–8 March 2017. [Google Scholar] [CrossRef]
- Um, S.B.; Um, J.S. Metropolitan urban hotspots of chronic sleep deprivation: Evidence from a community health survey in Gyeongbuk Province, South Korea. Geospat. Health 2015, 10, 382. [Google Scholar] [CrossRef]
- Forster, B. Remote Sensing and its application to urban studies. Urban Policy Res. 1984, 2, 25–32. [Google Scholar] [CrossRef]
- Maktav, D.; Erbek, F.S.; Jürgens, C. Remote sensing of urban areas. Int. J. Remote Sens. 2005, 26, 655–659. [Google Scholar] [CrossRef]
- Esch, T.; Marconcini, M.; Felbier, A.; Roth, A.; Heldens, W.; Huber, M.; Schwinger, M.; Taubenböck, H.; Muller, A.; Dech, S. Urban Footprint Processor—Fully Automated Processing Chain Generating Settlement Masks From Global Data of the TanDEM-X Mission. IEEE Geosci. Remote Sens. Lett. 2013, 10, 1617–1621. [Google Scholar] [CrossRef] [Green Version]
- Pesaresi, M.; Huadong, G.; Blaes, X.; Ehrlich, D.; Ferri, S.; Gueguen, L.; Halkia, M.; Kauffmann, M.; Kemper, T.; Lu, L.; et al. A Global Human Settlement Layer From Optical HR/VHR RS Data: Concept and First Results. IEEE J. Sel. Top. Appl. Earth Obs. Remote Sens. 2013, 6, 2102–2131. [Google Scholar] [CrossRef]
- Taubenböck, H.; Esch, T.; Felbier, A.; Wiesner, M.; Roth, A.; Dech, S. Monitoring urbanization in mega cities from space. Remote Sens. Environ. 2012, 117, 162–176. [Google Scholar] [CrossRef]
- Banzhaf, E.; Grescho, V.; Kindler, A. Monitoring urban to peri-urban development with integrated remote sensing and GIS information: A Leipzig, Germany case study. Int. J. Remote Sens. 2009, 30, 1675–1696. [Google Scholar] [CrossRef]
- Leichtle, T.; Geiß, C.; Wurm, M.; Lakes, T.; Taubenböck, H. Unsupervised change detection in VHR remote sensing imagery—An object-based clustering approach in a dynamic urban environment. Int. J. Appl. Earth Obs. Geoinf. 2017, 54, 15–27. [Google Scholar] [CrossRef]
- Wurm, M.; Taubenböck, H.; Roth, A.; Dech, S. Urban structuring using multisensoral remote sensing data: By the example of the German cities Cologne and Dresden. In Proceedings of the 2009 Joint Urban Remote Sensing Event, IEEE, Shanghai, China, 20–22 May 2009. [Google Scholar] [CrossRef]
- Wurm, M.; Taubenböck, H.; Dech, S. Quantification of urban structure on building block level utilizing multisensoral remote sensing data. In Proceedings of the Earth Resources and Environmental Remote Sensing/GIS Applications, Toulouse, France, 20–23 September 2010; Michel, U., Civco, D.L., Eds.; [Google Scholar] [CrossRef]
- Taubenböck, H.; Esch, T.; Wurm, M.; Roth, A.; Dech, S. Object-based feature extraction using high spatial resolution satellite data of urban areas. J. Spat. Sci. 2010, 55, 117–132. [Google Scholar] [CrossRef]
- Montanges, A.P.; Moser, G.; Taubenböck, H.; Wurm, M.; Tuia, D. Classification of urban structural types with multisource data and structured models. In Proceedings of the 2015 Joint Urban Remote Sensing Event (JURSE), Lausanne, Switzerland, 30 March–1 April 2015. [Google Scholar] [CrossRef]
- Gamba, P.; Houshmand, B.; Saccani, M. Detection and extraction of buildings from interferometric SAR data. IEEE Trans. Geosci. Remote Sens. 2000, 38, 611–617. [Google Scholar] [CrossRef] [Green Version]
- Wurm, M.; d’Angelo, P.; Reinartz, P.; Taubenböck, H. Investigating the Applicability of Cartosat-1 DEMs and Topographic Maps to Localize Large-Area Urban Mass Concentrations. IEEE J. Sel. Top. Appl. Earth Obs. Remote Sens. 2014, 7, 4138–4152. [Google Scholar] [CrossRef] [Green Version]
- Taubenböck, H.; Standfuß, I.; Klotz, M.; Wurm, M. The Physical Density of the City—Deconstruction of the Delusive Density Measure with Evidence from Two European Megacities. ISPRS Int. J. Geo-Inf. 2016, 5, 206. [Google Scholar] [CrossRef]
- Morello-Frosch, R.; Shenassa, E.D. The Environmental “Riskscape” and Social Inequality: Implications for Explaining Maternal and Child Health Disparities. Environ. Health Perspect. 2006, 114, 1150–1153. [Google Scholar] [CrossRef]
- Dahlgren, G.; Whitehead, M. European Strategies for Tackling Social Inequalities in Health: Leveling Up Part 2; Studies on Social and Economic Determinants of Population Health; World Health Organization: Copenhagen, Denmark, 2006; Volume 3. [Google Scholar]
- Voigtländer, S.; Mielck, A.; Razum, O. Die Bedeutung des kleinräumigen Kontexts für Gesundheit: Entwurf eines Erklärungsmodells. Das Gesundheitswesen 2011, 74, 702–709. [Google Scholar] [CrossRef] [Green Version]
- Soobader, M.; Cubbin, C.; Gee, G.C.; Rosenbaum, A.; Laurenson, J. Levels of analysis for the study of environmental health disparities. Environ. Res. 2006, 102, 172–180. [Google Scholar] [CrossRef]
- Openshaw, S. Ecological Fallacies and the Analysis of Areal Census Data. Environ. Plan. A 1984, 16, 17–31. [Google Scholar] [CrossRef]
- Cummins, S.; Curtis, S.; Diez-Roux, A.V.; Macintyre, S. Understanding and representing ‘place’ in health research: A relational approach. Soc. Sci. Med. 2007, 65, 1825–1838. [Google Scholar] [CrossRef] [PubMed]
- Diez Roux, A.V. Investigating neighborhood and area effects on health. Am. J. Public Health 2001, 91, 1783–1789. [Google Scholar] [CrossRef] [PubMed]
- Diez-Roux, A.V. Bringing context back into epidemiology: Variables and fallacies in multilevel analysis. Am. J. Public Health 1998, 88, 216–222. [Google Scholar] [CrossRef] [PubMed]
- Helbich, M. Toward dynamic urban environmental exposure assessments in mental health research. Environm. Res. 2018, 161, 129–135. [Google Scholar] [CrossRef] [PubMed]
- Schwartz, S. The fallacy of the ecological fallacy: The potential misuse of a concept and the consequences. Am. J. Public Health 1994, 84, 819–824. [Google Scholar] [CrossRef] [PubMed]
- Morgenstern, H. Ecologic Studies in Epidemiology: Concepts, Principles, and Methods. Annu. Rev. Public Health 1995, 16, 61–81. [Google Scholar] [CrossRef] [Green Version]
- Fotheringham, A.S.; Wong, D.W.S. The Modifiable Areal Unit Problem in Multivariate Statistical Analysis. Environ. Plan. A 1991, 23, 1025–1044. [Google Scholar] [CrossRef]
- Manley, D. Scale, Aggregation, and the Modifiable Areal Unit Problem. In Handbook of Regional Science; Springer: Berlin/Heidelberg, Germany, 2014; pp. 1157–1171. [Google Scholar] [CrossRef]
- Lee, J.; Alnasrallah, M.; Wong, D.; Beaird, H.; Logue, E. Impacts of Scale on Geographic Analysis of Health Data: An Example of Obesity Prevalence. ISPRS Int. J. Geo-Inf. 2014, 3, 1198–1210. [Google Scholar] [CrossRef] [Green Version]
- Fernández, I.C.; Wu, J. Assessing environmental inequalities in the city of Santiago (Chile) with a hierarchical multiscale approach. Appl. Geogr. 2016, 74, 160–169. [Google Scholar] [CrossRef]
- Nouri, H.; Anderson, S.; Sutton, P.; Beecham, S.; Nagler, P.; Jarchow, C.J.; Roberts, D.A. NDVI, scale invariance and the modifiable areal unit problem: An assessment of vegetation in the Adelaide Parklands. Sci. Total Environ. 2017, 584–585, 11–18. [Google Scholar] [CrossRef]
- Brender, J.D.; Maantay, J.A.; Chakraborty, J. Residential Proximity to Environmental Hazards and Adverse Health Outcomes. Am. J. Public Health 2011, 101, S37–S52. [Google Scholar] [CrossRef] [Green Version]
- Shrestha, R.; Flacke, J.; Martinez, J.; van Maarseveen, M. Environmental Health Related Socio-Spatial Inequalities: Identifying “Hotspots” of Environmental Burdens and Social Vulnerability. Int. J. Environ. Res. Public Health 2016, 13, 691. [Google Scholar] [CrossRef] [PubMed]
- Helbich, M.; van Emmichoven, M.J.Z.; Dijst, M.J.; Kwan, M.P.; Pierik, F.H.; de Vries, S.I. Natural and built environmental exposures on children’s active school travel: A Dutch global positioning system-based cross-sectional study. Health Place 2016, 39, 101–109. [Google Scholar] [CrossRef] [PubMed]
- Schuster, C.; Honold, J.; Lauf, S.; Lakes, T. Urban heat stress: Novel survey suggests health and fitness as future avenue for research and adaptation strategies. Environ. Res. Lett. 2017, 12, 044021. [Google Scholar] [CrossRef]
- Taubenböck, H.; Wurm, M.; Setiadi, N.; Gebert, N.; Roth, A.; Strunz, G.; Birkmann, J.; Dech, S. Integrating remote sensing and social science. In Proceedings of the 2009 Joint Urban Remote Sensing Event, Shanghai, China, 20–22 May 2009. [Google Scholar] [CrossRef]
- Wagner, G.G.; Frick, J.R.; Schupp, J. The German Socio-Economic Panel Study (SOEP)—Evolution, Scope and Enhancements. SSRN Electron. J. 2007. [Google Scholar] [CrossRef]
- Wooden, M.; Freidin, S.; Watson, N. The Household, Income and Labour Dynamics in Australia (HILDA)Survey: Wave 1. Aust. Econ. Rev. 2002, 35, 339–348. [Google Scholar] [CrossRef]
- Wurm, M.; Goebel, J.; Wagner, G.G. Fernerkundung im urbanen Raum. In Fernerkundung im Urbanen Raum—Erdbeobachtung auf dem Weg zur Planungspraxis; Chapter Integration Raumrelevanter Indikatoren in sozial- und Verhaltenswissenschaftlichen Analysen; Taubenböck, H., Dech, S., Eds.; WBG: Darmstadt, Germany, 2010; pp. 159–162. [Google Scholar]
- Kohlhuber, M.; Mielck, A.; Weiland, S.K.; Bolte, G. Social inequality in perceived environmental exposures in relation to housing conditions in Germany. Environ. Res. 2006, 101, 246–255. [Google Scholar] [CrossRef]
- Krekel, C.; Kolbe, J.; Wüstemann, H. The greener, the happier? The effect of urban land use on residential well-being. Ecol. Econ. 2016, 121, 117–127. [Google Scholar] [CrossRef]
- Jokela, M. Are Neighborhood Health Associations Causal? A 10-Year Prospective Cohort Study With Repeated Measurements. Am. J. Epidemiol. 2014, 180, 776–784. [Google Scholar] [CrossRef] [Green Version]
- Auchincloss, A.H.; Roux, A.V.D.; Brown, D.G.; Raghunathan, T.E.; Erdmann, C.A. Filling the gaps: Spatial interpolation of residential survey data in the estimation of neighborhood characteristics. Epidemiology 2007, 18, 469. [Google Scholar] [CrossRef]
- Calabrese, F.; Diao, M.; Lorenzo, G.D.; Ferreira, J.; Ratti, C. Understanding individual mobility patterns from urban sensing data: A mobile phone trace example. Transp. Res. Part C Emerg. Technol. 2013, 26, 301–313. [Google Scholar] [CrossRef]
- Yee, W.; Arsdol, M.D.V. Residential Mobility, Age, and the Life Cycle. J. Gerontol. 1977, 32, 211–221. [Google Scholar] [CrossRef] [Green Version]
- Song, C.; Qu, Z.; Blumm, N.; Barabasi, A.L. Limits of Predictability in Human Mobility. Science 2010, 327, 1018–1021. [Google Scholar] [CrossRef] [PubMed]
- González, M.C.; Hidalgo, C.A.; Barabási, A.L. Understanding individual human mobility patterns. Nature 2008, 453, 779–782. [Google Scholar] [CrossRef] [PubMed]
- Townshend, J.R.; Masek, J.G.; Huang, C.; Vermote, E.F.; Gao, F.; Channan, S.; Sexton, J.O.; Feng, M.; Narasimhan, R.; Kim, D.; et al. Global characterization and monitoring of forest cover using Landsat data: Opportunities and challenges. Int. J. Digit. Earth 2012, 5, 373–397. [Google Scholar] [CrossRef]
- Pekel, J.F.; Cottam, A.; Gorelick, N.; Belward, A.S. High-resolution mapping of global surface water and its long-term changes. Nature 2016, 540, 418–422. [Google Scholar] [CrossRef] [PubMed]
- Chew, R.F.; Amer, S.; Jones, K.; Unangst, J.; Cajka, J.; Allpress, J.; Bruhn, M. Residential scene classification for gridded population sampling in developing countries using deep convolutional neural networks on satellite imagery. Int. J. Health Geogr. 2018, 17, 12. [Google Scholar] [CrossRef] [Green Version]
- Babisch, W.; Ising, H.; Gallacher, J. Health status as a potential effect modifier of the relation between noise annoyance and incidence of ischaemic heart disease. Occup. Environ. Med. 2003, 60, 739–745. [Google Scholar] [CrossRef] [Green Version]
Figure 1.
Schematic depiction of the problem of boundary effects with three emission sources (x) and administrative areal units. (a) presents the distribution of the point locations within the areal units. (b) depicts the environmental exposure by occurrence within each administrative unit (hazard-unit coincidence). (c) visualizes a simple spatially continuous distance based method of the impact of the hazardous sites on the surrounding independent of spatial units.


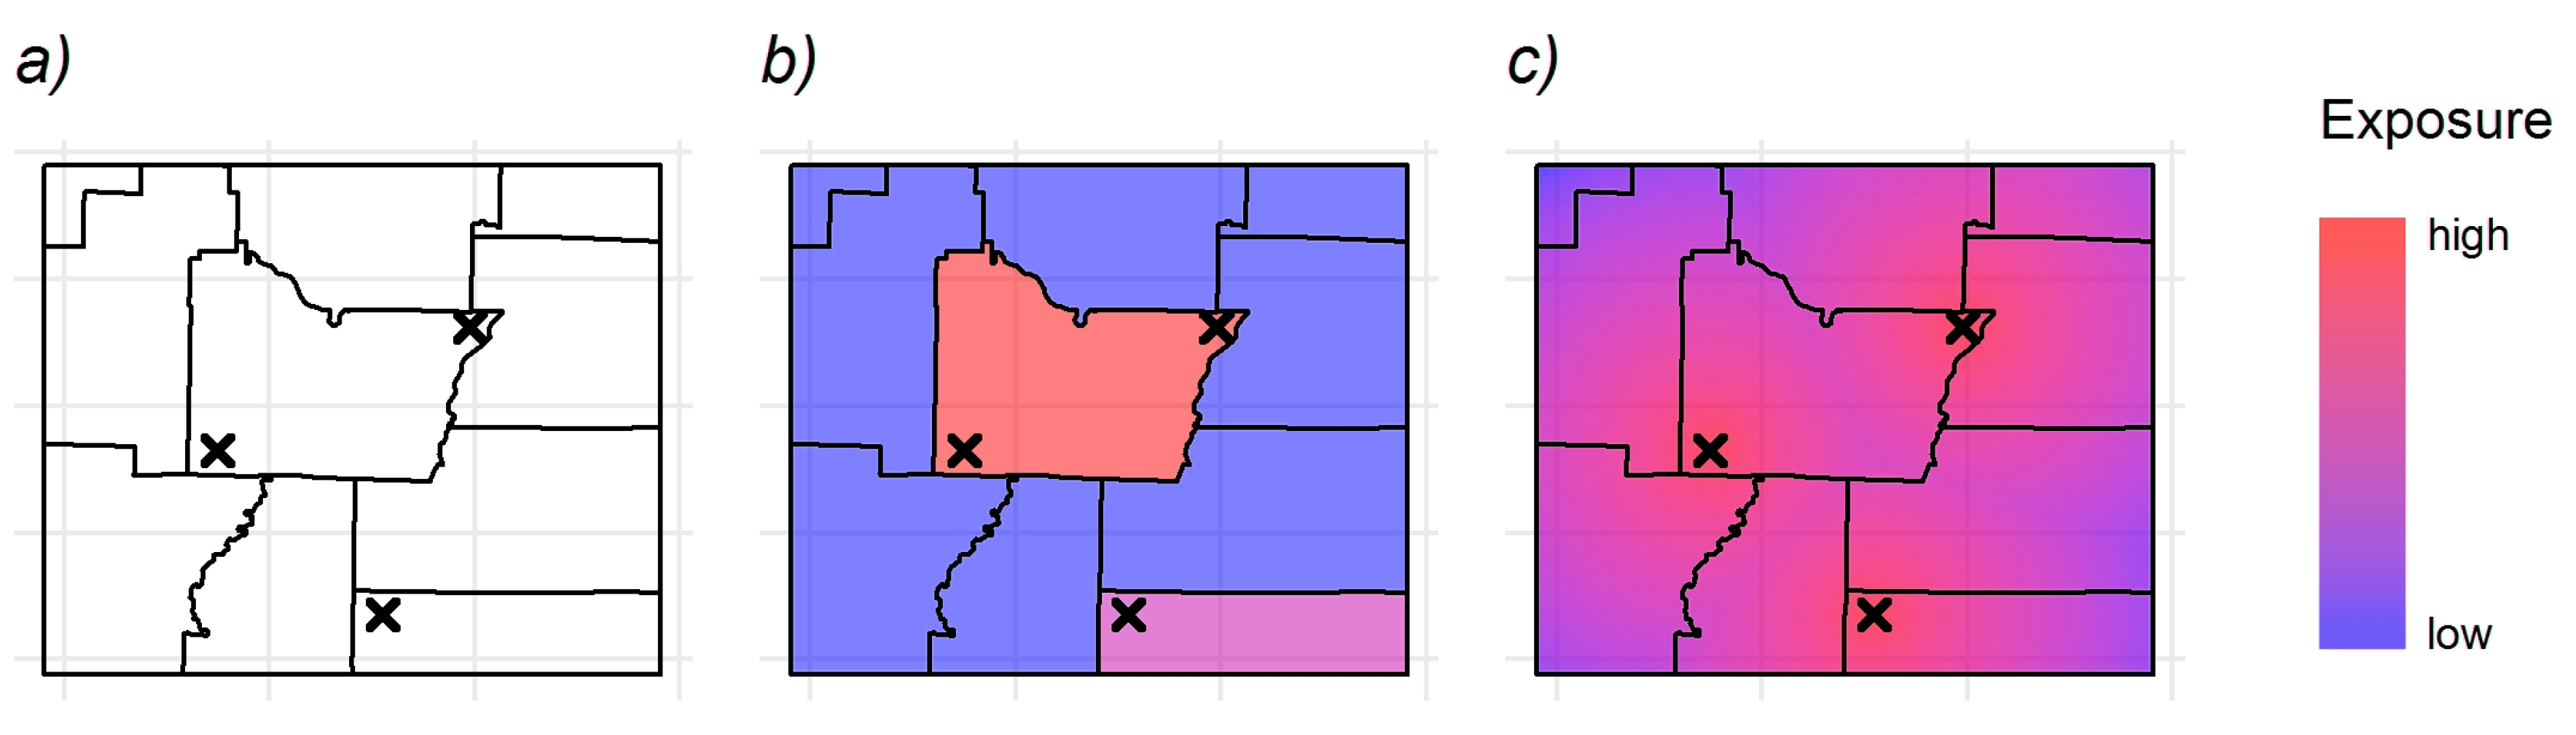
Table 1.
Selected studies which deploy spatial analysis of environmental burdens or benefits. The most commonly studied health impacts include green space (GS), air pollution (AP), noise (N), and heat (H). The levels of detail (LoD) are summarized on household (hh), individual (in), or aggregated (agg) level for socioeconomic status (SES), and for spatial data as point (poi), aggregated (agg), or continuous (con) information, respectively. Where applicable, it is indicated whether remote sensing techniques (RS) were used to derive environmental parameters directly (++) or indirectly (+).
| Study | Health Impacts | SES LoD | Spatial LoD | Spatial Extent | RS | |||||||
|---|---|---|---|---|---|---|---|---|---|---|---|---|
| GS | AP | N | H | hh | in | agg | poi | agg | con | |||
| [28] | x | x | local | + | ||||||||
| [18] | x | x | x | x | x | city | ++ | |||||
| [76] | x | x | x | x | city | ++ | ||||||
| [72] | x | x | x | city | + | |||||||
| [69] | x | x | x | city | ++ | |||||||
| [70] | x | x | x | city | ++ | |||||||
| [149] | x | x | x | x | city | ++ | ||||||
| [141] | x | x | x | x | city | ++ | ||||||
| [31] | x | x | x | city | ++ | |||||||
| [79] | x | x | x | city | ++ | |||||||
| [38] | x | x | x | city | ++ | |||||||
| [81] | x | x | x | city | + | |||||||
| [30] | x | x | x | city | ||||||||
| [91] | x | x | x | city | ||||||||
| [115] | x | x | x | city | ||||||||
| [20] | x | x | x | city | ||||||||
| [215] | x | x | x | city | ||||||||
| [117] | x | x | x | city | ||||||||
| [119] | x | x | x | city | ||||||||
| [25] | x | x | x | city | ||||||||
| [122] | x | x | x | city | ||||||||
| [143] | x | x | x | city | ++ | |||||||
| [138] | x | x | x | city | ||||||||
| [137] | x | x | x | x | 4 cities | ++ | ||||||
| [87] | x | x | x | 6 cities | ||||||||
| [64] | x | x | x | x | 10 cities | ++ | ||||||
| [71] | x | x | x | 77 cities | + | |||||||
| [89] | x | x | x | metrop. areas | ||||||||
| [205] | x | x | x | major cities | + | |||||||
| [67] | x | x | x | country | + | |||||||
| [60] | x | x | x | country | + | |||||||
| [61] | x | x | x | country | + | |||||||
| [62] | x | x | x | country | + | |||||||
| [27] | x | x | x | country | + | |||||||
| [204] | x | x | x | country | ||||||||
| [86] | x | x | x | country | ||||||||
| [16] | x | x | x | country | ||||||||
| [102] | x | x | x | country | ++ | |||||||
| [50] | x | x | x | country | ||||||||
| [26] | x | x | country | |||||||||
| Summary | 21 | 10 | 10 | 7 | 4 | 16 | 19 | 3 | 22 | 13 | ||
© 2019 by the authors. Licensee MDPI, Basel, Switzerland. This article is an open access article distributed under the terms and conditions of the Creative Commons Attribution (CC BY) license (http://creativecommons.org/licenses/by/4.0/).
Share and Cite
MDPI and ACS Style
Weigand, M.; Wurm, M.; Dech, S.; Taubenböck, H. Remote Sensing in Environmental Justice Research—A Review. ISPRS Int. J. Geo-Inf. 2019, 8, 20. https://0-doi-org.brum.beds.ac.uk/10.3390/ijgi8010020
AMA Style
Weigand M, Wurm M, Dech S, Taubenböck H. Remote Sensing in Environmental Justice Research—A Review. ISPRS International Journal of Geo-Information. 2019; 8(1):20. https://0-doi-org.brum.beds.ac.uk/10.3390/ijgi8010020
Chicago/Turabian StyleWeigand, Matthias, Michael Wurm, Stefan Dech, and Hannes Taubenböck. 2019. "Remote Sensing in Environmental Justice Research—A Review" ISPRS International Journal of Geo-Information 8, no. 1: 20. https://0-doi-org.brum.beds.ac.uk/10.3390/ijgi8010020
Note that from the first issue of 2016, this journal uses article numbers instead of page numbers. See further details here.