1. Introduction
During the past two decades, with the emergence of professional digital cameras and advanced digital photogrammetric methods, the use of photogrammetric images, especially close-range photogrammetric images taken from or just above the ground surface, has become a typical practice in various applications [
1]. Various needs in different contexts (e.g., quality control of industrial parts, cultural heritage, civil engineering, medicine, animation, architecture, etc.) have been addressed by such capabilities of the close-range photogrammetry as three-dimensional modelling, displacement measurement, mapping, real-time precise measurement, archiving, adaptive model-based repair, virtual visualization and so forth, so as to cope with respective challenges. Integration of close-range photogrammetry into an unmanned aerial vehicle (UAV) as a highly flexible imaging platform has led to the new branch of UAV photogrammetry [
2]. The use of the UAV photogrammetric images makes possible appropriate positioning at imaging stations while enhancing the geometrical accuracy of the reference photogrammetric network. Moreover, when it comes to observing large-scale structures, the use of UAVs makes it possible to access otherwise inaccessible positions to implement basic photogrammetric techniques.
Displacement measurement of large-scale structures is an important application of the close-range photogrammetry, where high precision on the feature is subject to appropriate network design and local feature extraction and matching on the convergent images taken from the feature. The excavated walls are among the most sensitive structures because of importance for preventing possible collapse of neighbouring structures and the resultant financial and life damages. Compared to conventional methods for excavated wall displacement measurement (e.g., micro-geodesic methods or the use of instrumentations), photogrammetric displacement measurement offers numerous advantages. Among other advantages of the photogrammetry in this field, one may refer to their high rate of data acquisition, potential for achieving high precisions, lower observation and equipment costs and visualization nature of the observations. Application of target-based photogrammetry in such projects incurs particular limitations, including the necessity of installing and protecting the targets and restricted number of acquisition points. Should the use of artificial targets rendered infeasible, in order to use a point across a feature as the reference point for displacement measurement, one should extract their corresponding position on the images precisely. Moreover, application of UAV for geometric-spatial improvement of the imaging network in such projects can be of much help. Given that most excavation projects are performed within urban areas due to the high cost of land across such areas, the spatial limitation imposed by the presence of neighbouring constructions affects the success of reference photogrammetric imaging from the ground surface. Under such condition, application of available space by UAVs to reach suitable positions for imaging is of paramount importance in making such projects feasible.
Numerous research works have been performed on displacement measurement of large-scale structures using reference photogrammetric techniques. In 2013, Esmaeili et al. used close-range target-based photogrammetry for excavated wall displacement measurement. They showed that, using the proposed combined photogrammetric displacement adjustment (CPDA), one could achieve a displacement measurement precision of 8 mm provided photogrammetry targets were installed on the structure [
3]. In 2015, Li et al. measured unsaturated soil deformations during triaxial testing using a photogrammetry-based method [
4]. In a research published in 2010, Xiao et al. undertook transmission tower displacement measurement under various loading configurations via close-range photogrammetry. In this research, a simple innovative method based on the search for the closest neighbour after the coordinate conformation was employed to determine the corresponding targets that represented displacement at a point [
5]. In 2010, Jiang et al. investigated deformations along a steel-made transportation bridge under the effect of loading using close-range photogrammetry. They proposed the refined distance constraint (RDC) method for controlling the close-range photogrammetric network and employed two-sided targets for this purpose [
6,
7]. Scaioni et al. (2016) measured surface changes in a down-scaled landslide model using high-speed stereo image sequences [
8]. In 2010, Ozbek et al. used an instantaneous photogrammetry system to measure vibration frequency of a rotating wind turbine blade [
9]. Scaioni et al. (2010) presented the development and the results of a fast method for displacement measurement based on digital images, which allowed a deformation analysis along the cross-sections of a tunnel via vision metrology [
10,
11,
12]. In 2005, Fraser et al. measured surface changes of the Hobart Radio Telescope in response to a change in the angle of antenna under three scenarios, with reference to the existing vector model of the telescope surface, via close-range photogrammetry. Introducing the concept of hyper redundancy, they succeeded to achieve predetermined accuracies in their measurements [
13]. Later in 2014, Cerminaro used close-range photogrammetry to improve proactive assessment of retaining walls along transportation corridors. They used continuous surface measurement and surface correspondence matching for the sake of displacement measurement [
14]. In a research, Luo et al. (2017) measured the effect of pressure on large inflatable structures with the help of close-range photogrammetry. Combining the digital photogrammetry with the Delaunay triangulation, they could measure the pressure-induced displacements on irregular non-smooth surfaces [
15]. In another work, Tsvetkov et al. (2017) used the close-range photogrammetry for deformation monitoring of load-bearing reinforced concrete [
16]. For this purpose, they used IP cameras with a server to which the captured images were transferred wirelessly. In 2010, Scaioni et al. presented the development and implementation of three image-based methods for displacement detection and measurement at a vast number of points in laboratory testing on construction materials. They further compared the use of artificial targets versus dense correspondence matching without such targets for displacement measurement of a concrete beam under pressure. In both cases, it was possible to dynamically monitor the structure displacement with the sufficient accuracy [
12]. With respect to displacement measurement using UAV-captured images, Nocerino et al. (2013) reported the results of an integrated UAV and terrestrial photogrammetric survey realized in the archaeological site of the Roman theatre in Ventimiglia, Italy. They could achieve displacement measurement accuracies as high as 4 mm using surface modelling based on the UAV images [
17]. Naumann et al. (2014) generated digital surface models (DSM) with the help of UAV-captured images to detect deformations or shape changes occurred to dike constructions or similar structures over time [
18].
In most of the mentioned research works, photogrammetric targets were used as base points for feature extraction and structural displacement measurement. Some other works were founded on surface displacement measurement. Design of the photogrammetric network has been based on the required accuracy in the specific project. Scale bars were used to indicate a reference length for the network control and exactly match the results to real scale features. In some projects (e.g., wind turbine vibration measurement [
9]), real-time measurements were undertaken using multiple synchronized cameras. The sensor used in most of such projects was a non-metric RGB camera. In total, existing research works indicate that, application of photogrammetry in displacement measurement of large-scale structures is superior over similar methods in many aspects, including lower cost, faster rate of observation, high accuracy, suitable visualization power based on the acquired images, no need to touch the feature, and, if needed, the required capabilities for archiving and performing the calculations. Other methods typically used for displacement measurement of large-scale structures include laser scanners, GPS (Global Positioning System) systems, micro-geodesic techniques and instrumentation methods, to name a few.
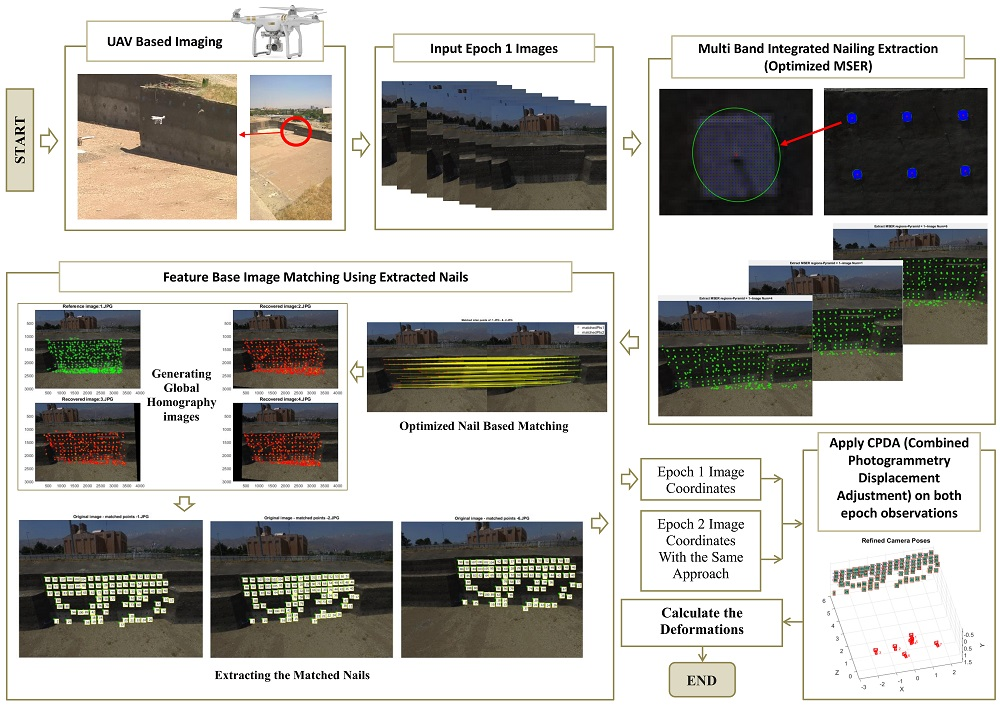
Figure 1 presents a comparison among different methods used for displacement measurement of large-scale structures, including photogrammetry, micro-geodesy, geodetic GPS systems and instrumentation. The figure is based on a review on related literature. The methods were scored based on a 0–5 scale, with a higher score in each parameter indicating better performance of the considered in that parameter.
According to
Figure 1, when it comes to the accuracy and precision of displacement measurement, the close-range photogrammetry provides the same performance as those of micro-geodesy and laser scanners. Although the close-range photogrammetry is capable of achieving precisions in the order of microns but for most part, displacement measurement of large-scale structures requires precisions in the order of millimetres that are available through all of the three methods. When geodetic GPS systems are used for such a purpose, the results are generally less accurate than those of the micro-geodesy, as far as the height parameter is concerned. When using instrumentation, achievement of adequately precise results depends on the way the instrument is installed and the conditions under which it is maintained; in this case, it is often infeasible to undertake as precise measurement of absolute displacement along three dimensions as those achievable via micro-geodesy or photogrammetry. Considering the rate of sampling, given the nature of imaging in the close-range photogrammetry method, the rate is so high. The results of instrumentation can also be at hand immediately upon installing the required equipment. However, the need for numerous length and angle readings at various stations at each epoch in the micro-geodesy method has made this method the slowest one when it comes to the rate of observation. Moreover, the need for long-term placement of GPS receivers for acquiring observations is a relatively slow process, while acquiring observations using laser scanners at different stations is a time-consuming procedure. Considering the cost of the required equipment, the close-range photogrammetry is the most inexpensive method. The general equipment for photogrammetry include digital imaging camera, targets and scale bars, which are far less expensive than precise total stations, geodetic GPS receivers, laser scanners and expensive instrumentation equipment. Compared to other methods, close-range photogrammetry provides observations within shorter periods of time. In contrary to the instrumentation, the costs of installation and maintenance of the required equipment for photogrammetry are low. These make the cost of data acquisition lower than all of the other methods, declaring another superiority of the photogrammetry. In terms of ease of implementation and data acquisition, the close-range photogrammetry is much more convenient than the other methods. Given possible spatial restrictions faced in the project site, however, there are chances that the photogrammetry method encounters limitations in imaging or determining the fixed base points. By the way, such limitations are still there for the micro-geodesy, laser scanner and GPS-based methods. Thanks to its nature of imaging, photogrammetry provides large potentials for capturing details and generating archives of observations. The high rate and ease of data acquisition further contributes to the mentioned potentials. Also laser scanners provide large potentials for producing archives of observations given that the scanners are typically equipped with imaging cameras. Once installed, instrumentation equipment continuously transmits and stores the acquired data, which introduces a particular advantage of this method. Flexibility of the photogrammetry, particularly in achieving the target precision, is much higher than the other methods thanks to its ability to increase independent observations and hence boost redundancy of the images and also network control and on-feature point constraints. As of current, the only procedure offering the possibility of acquiring real-time three-dimensional images at ultrahigh rates, particularly for the structures experiencing instantaneous displacement, is the close-range photogrammetry. The capacity to employ a set of high-speed imaging cameras (such as those capturing at 1000 frames/second), has made the close-range photogrammetry an unrivalled approach in terms of the data acquisition rate. Among other methods, the close-range photogrammetry and laser scanners are capable of acquiring observations without physically touching the feature. The two methods are the only ones via which displacement measurement can be done by generating and comparing three-dimensional surfaces. In the photogrammetry, each target on a structure serves as an instrumentation sensor or a micro-geodesic target but rather exhibiting much better performance at much lower cost. In all of the investigated research works, the close-range photogrammetry had shown promising performance in displacement measurement and deformation measurement of large-scale structures.
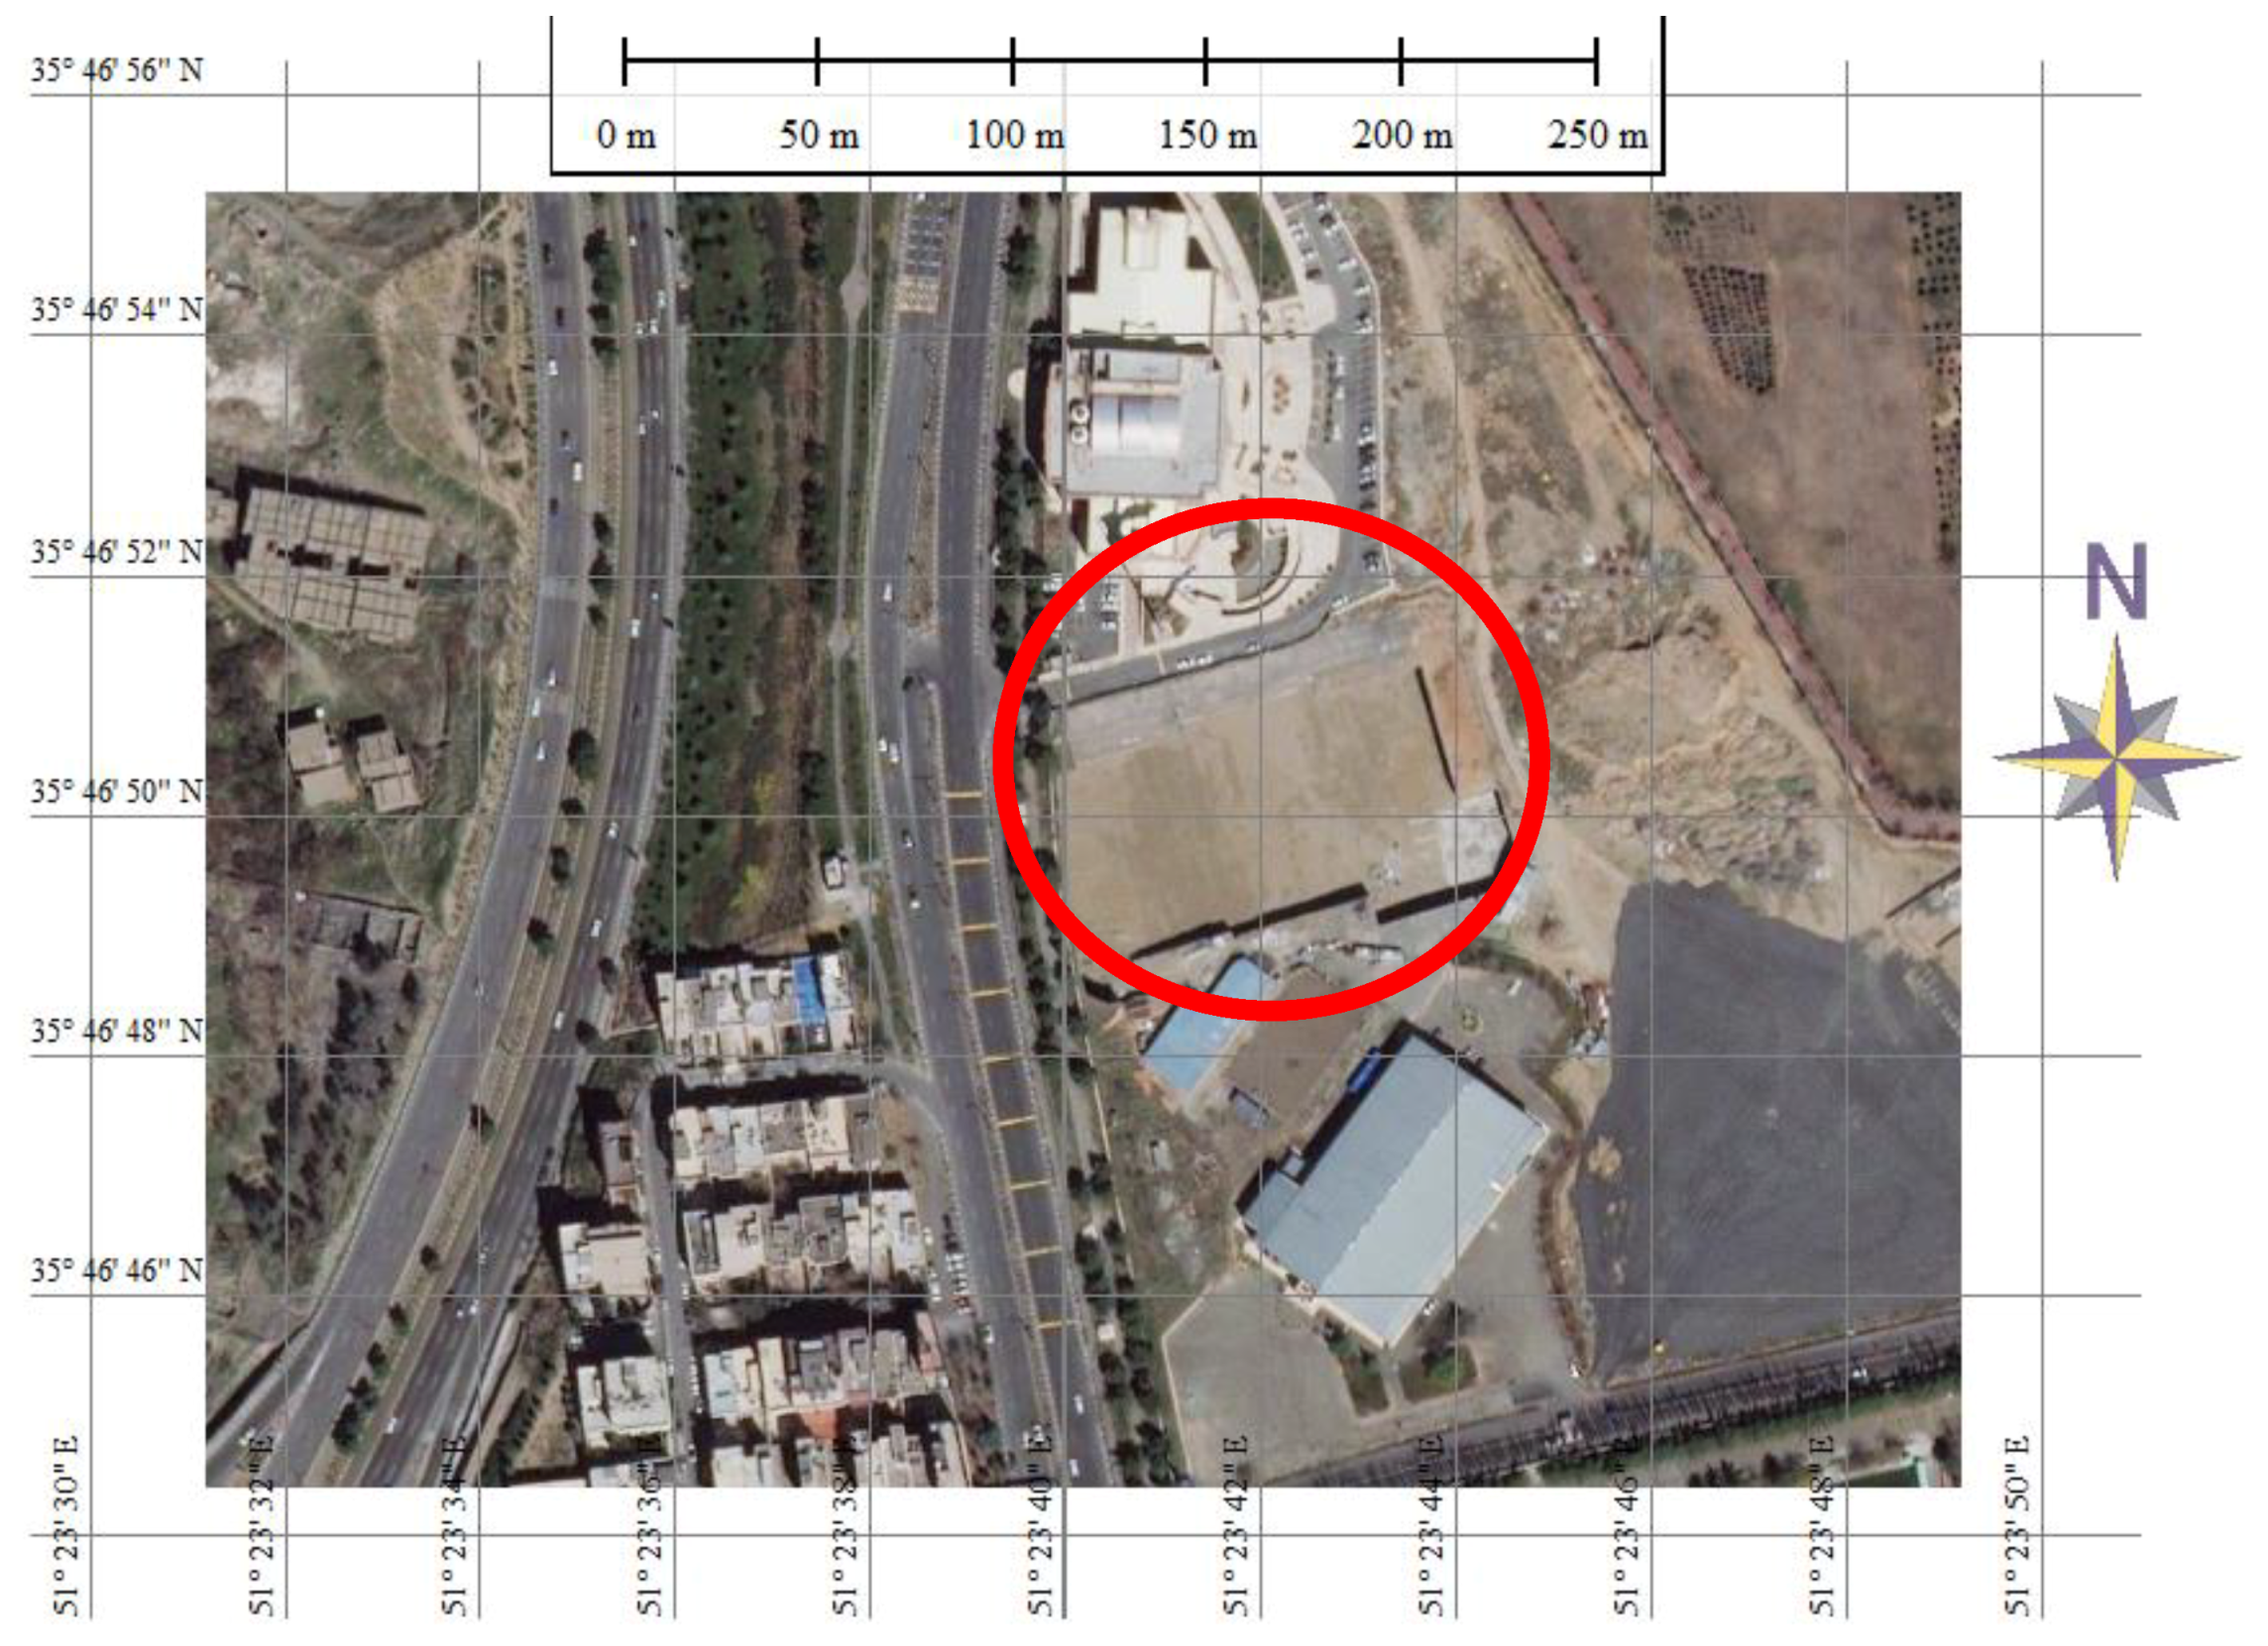
Due to ever increasing value of land in urban areas, excavation activities have been significantly expanded in such areas during the recent past. Accordingly, keeping the excavated walls restrained firmly using different methods such as nailing is of paramount importance for protecting not only the structure under construction but also the neighbouring constructions. In the meantime, wall monitoring during the construction phase can prevent the occurrence of such incidents as excavated wall collapse.
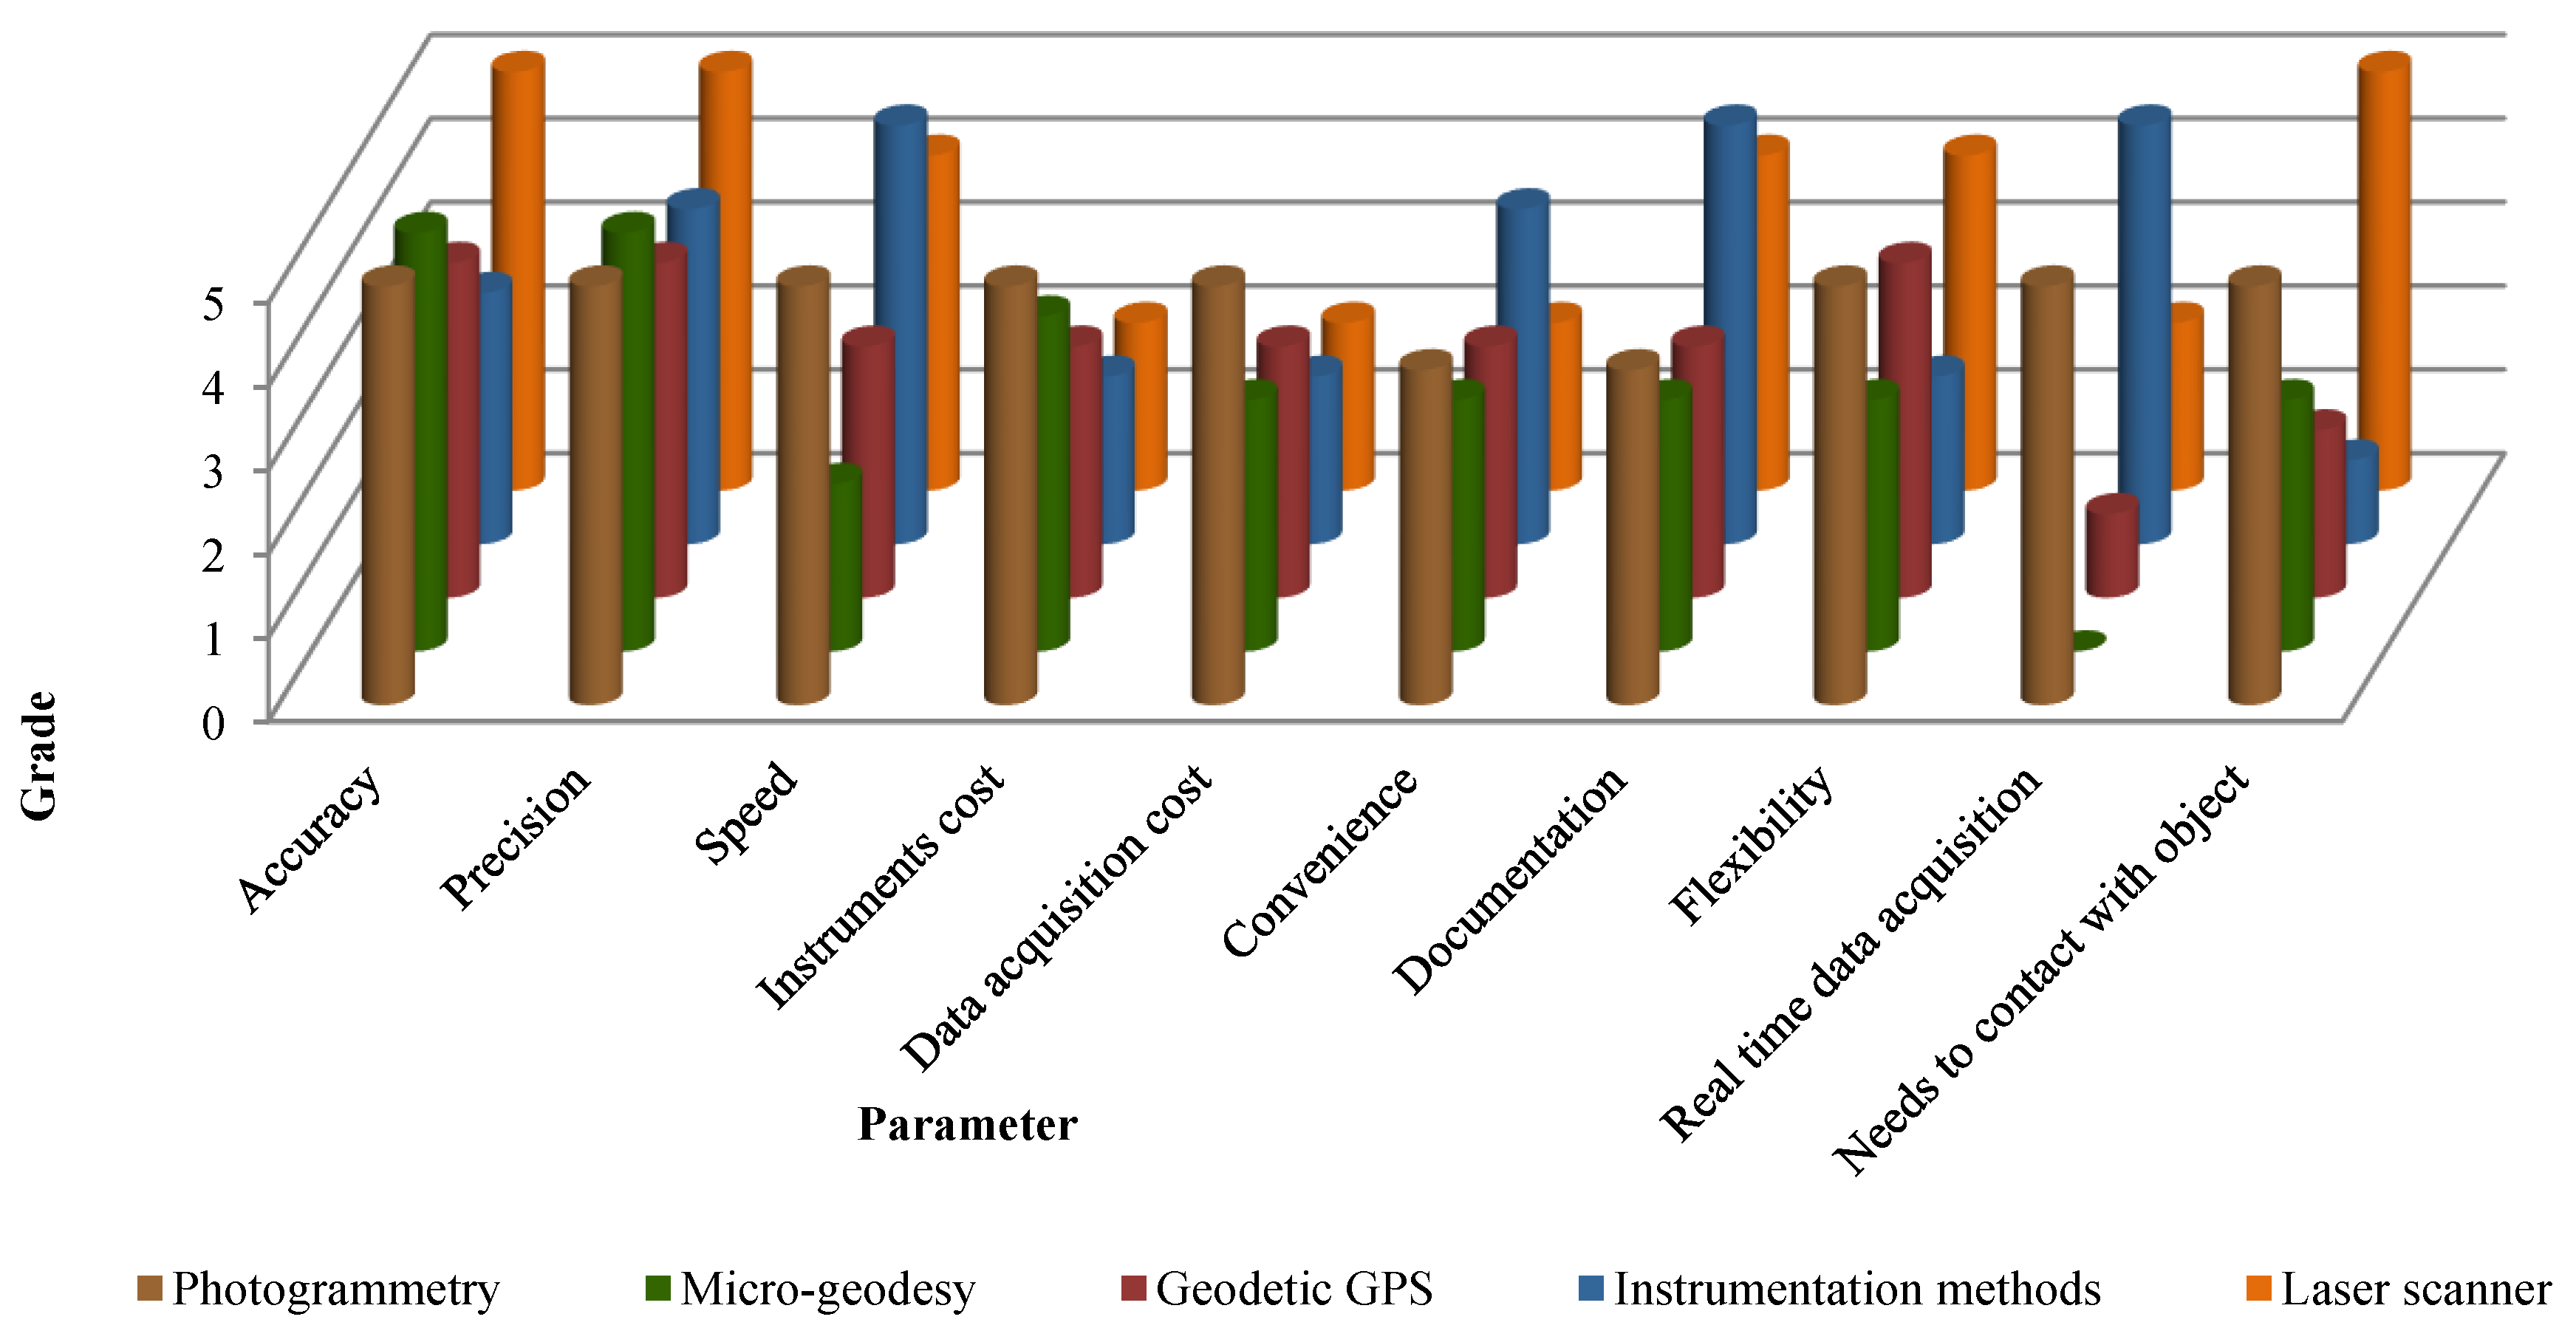
Figure 2 provides a view of the collapse of a nail-restrained excavated wall.
As observed in
Figure 2, due to failure to monitor the wall displacement during the construction operation, the excavated wall had collapsed despite the deployment of the support structure (nailing). Micro-geodesy and instrumentation define the typical approaches to excavated wall displacement measurement. According to the assessment presented in
Figure 1, high cost, low rate and difficulty of data acquisition in micro-geodesy and instrumentation methods have led to inefficient or only discontinuous monitoring in such projects. In their research, Esmaeili et al. demonstrated the potentials of photogrammetry for excavated wall displacement measurement [
3]. They performed terrestrial imaging by means of photogrammetric targets as base points for displacement measurement on the feature. Application of photogrammetry-customized UAVs may provide a much efficient method, especially for urban excavation projects which suffer, for most part, from restricted working spaces. The UAVs can be stabilized at suitable-for-imaging stations beyond such working space restrictions and develop a robust imaging network to achieve high precision in the monitoring of different parts of the excavation project via photogrammetry. Moreover, using precise extraction of local features by taking metal plates at the end of nails as base points, one can monitor a wide area of the wall, thereby minimizing the need for artificial photogrammetric targets.
In the present paper, an integrated system based on UAV photogrammetry is introduced for monitoring nail-restrained excavated walls displacement. Performance of the proposed method is then evaluated on an actual project. Continuing with the work, firstly, technical structure of the system is introduced, followed by its implementation and evaluation.
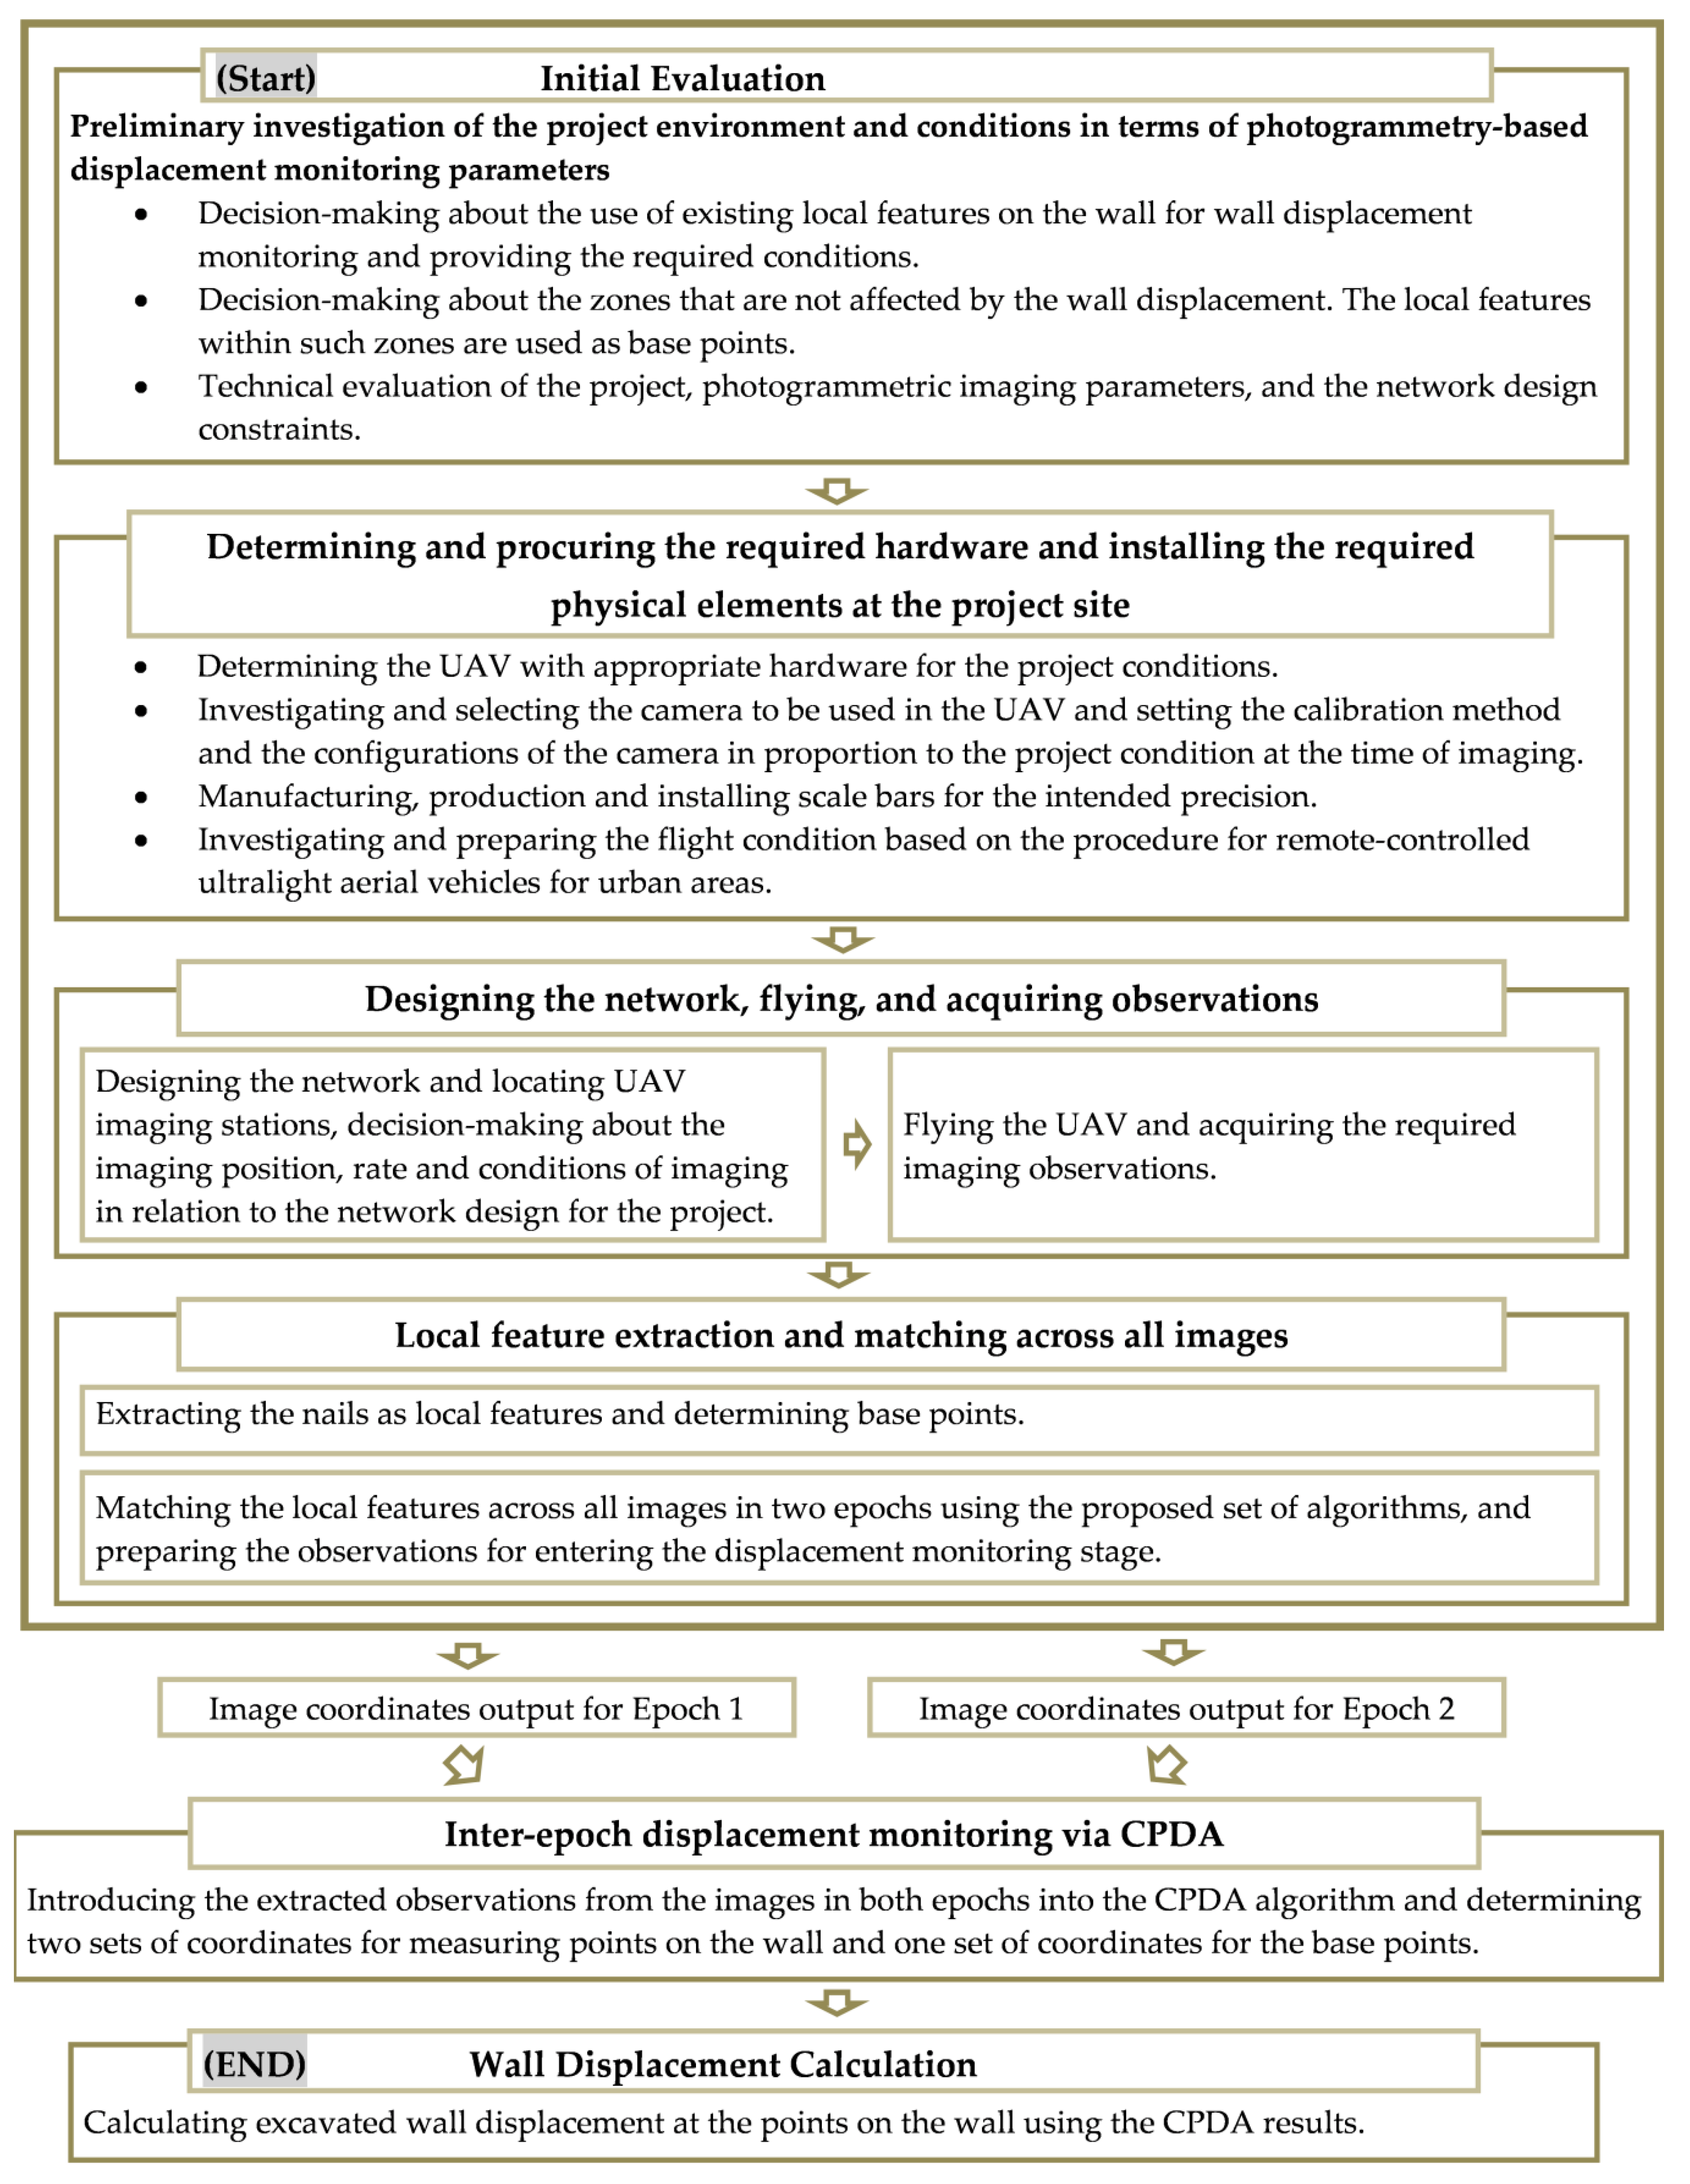
2. Materials and Methods
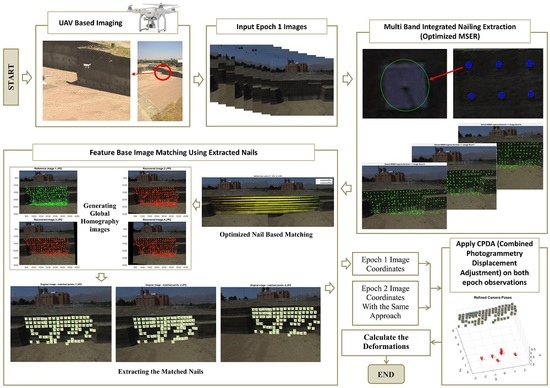
In general, excavated wall displacement measurement via UAV photogrammetry can be described as shown in
Figure 3.
According to
Figure 3, the main steps of this process include (1) initial evaluation of the project, (2) determining and procuring the required hardware and installing and setting up the required physical elements at the project site, (3) designing the network, flying the UAV and acquiring the observations and (4) processing the acquired data to calculate final outputs in terms of wall displacement measurements. Continuing with the work, configuration of the photogrammetry method based on nailing systems is described.
2.1. Preliminary Investigation of the Project Environment and Conditions
In order to implement the proposed algorithm in projects like this, a photogrammetry expert shall begin with evaluating the project in three stages:
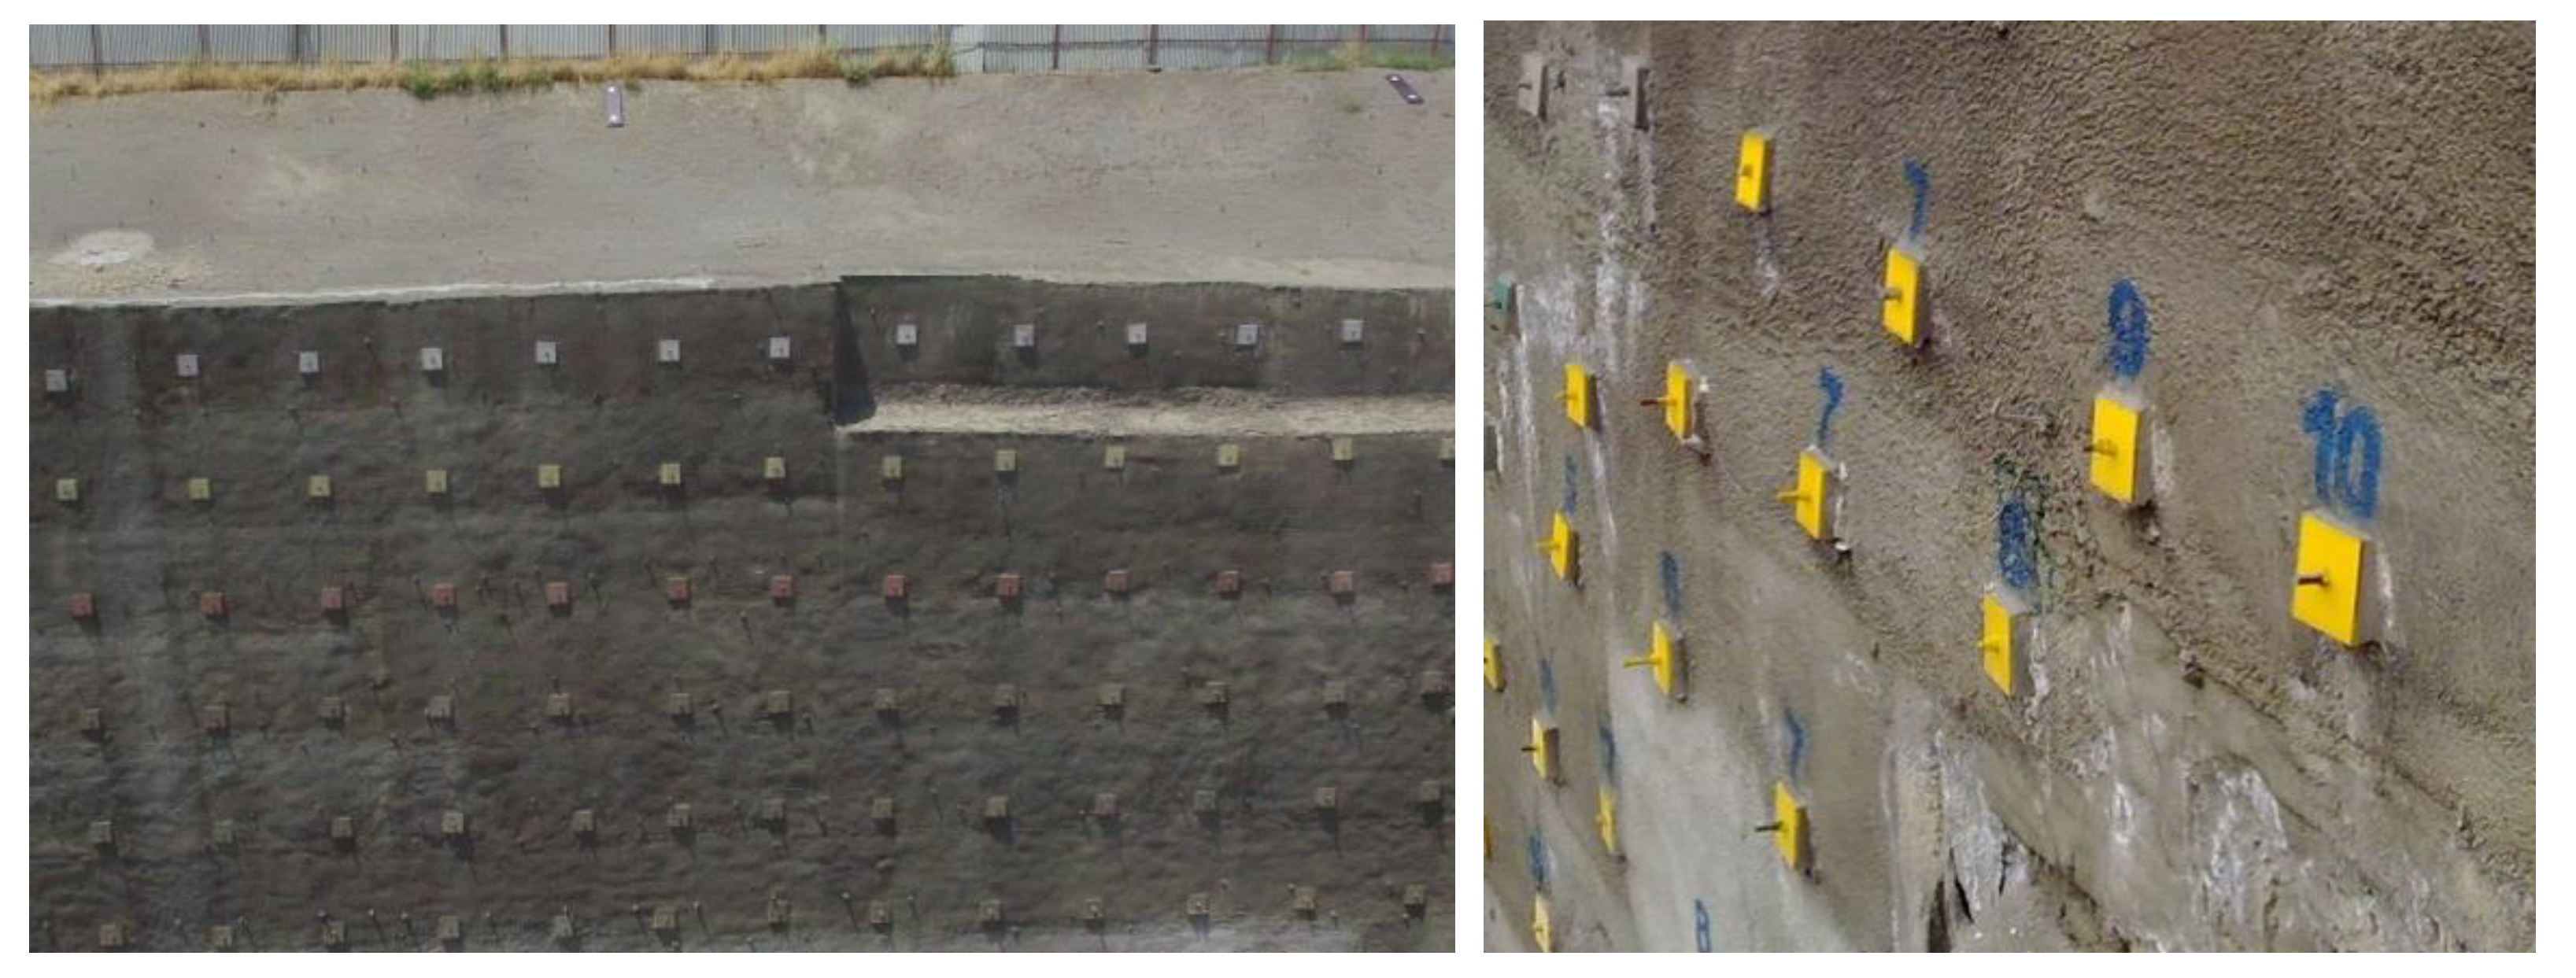
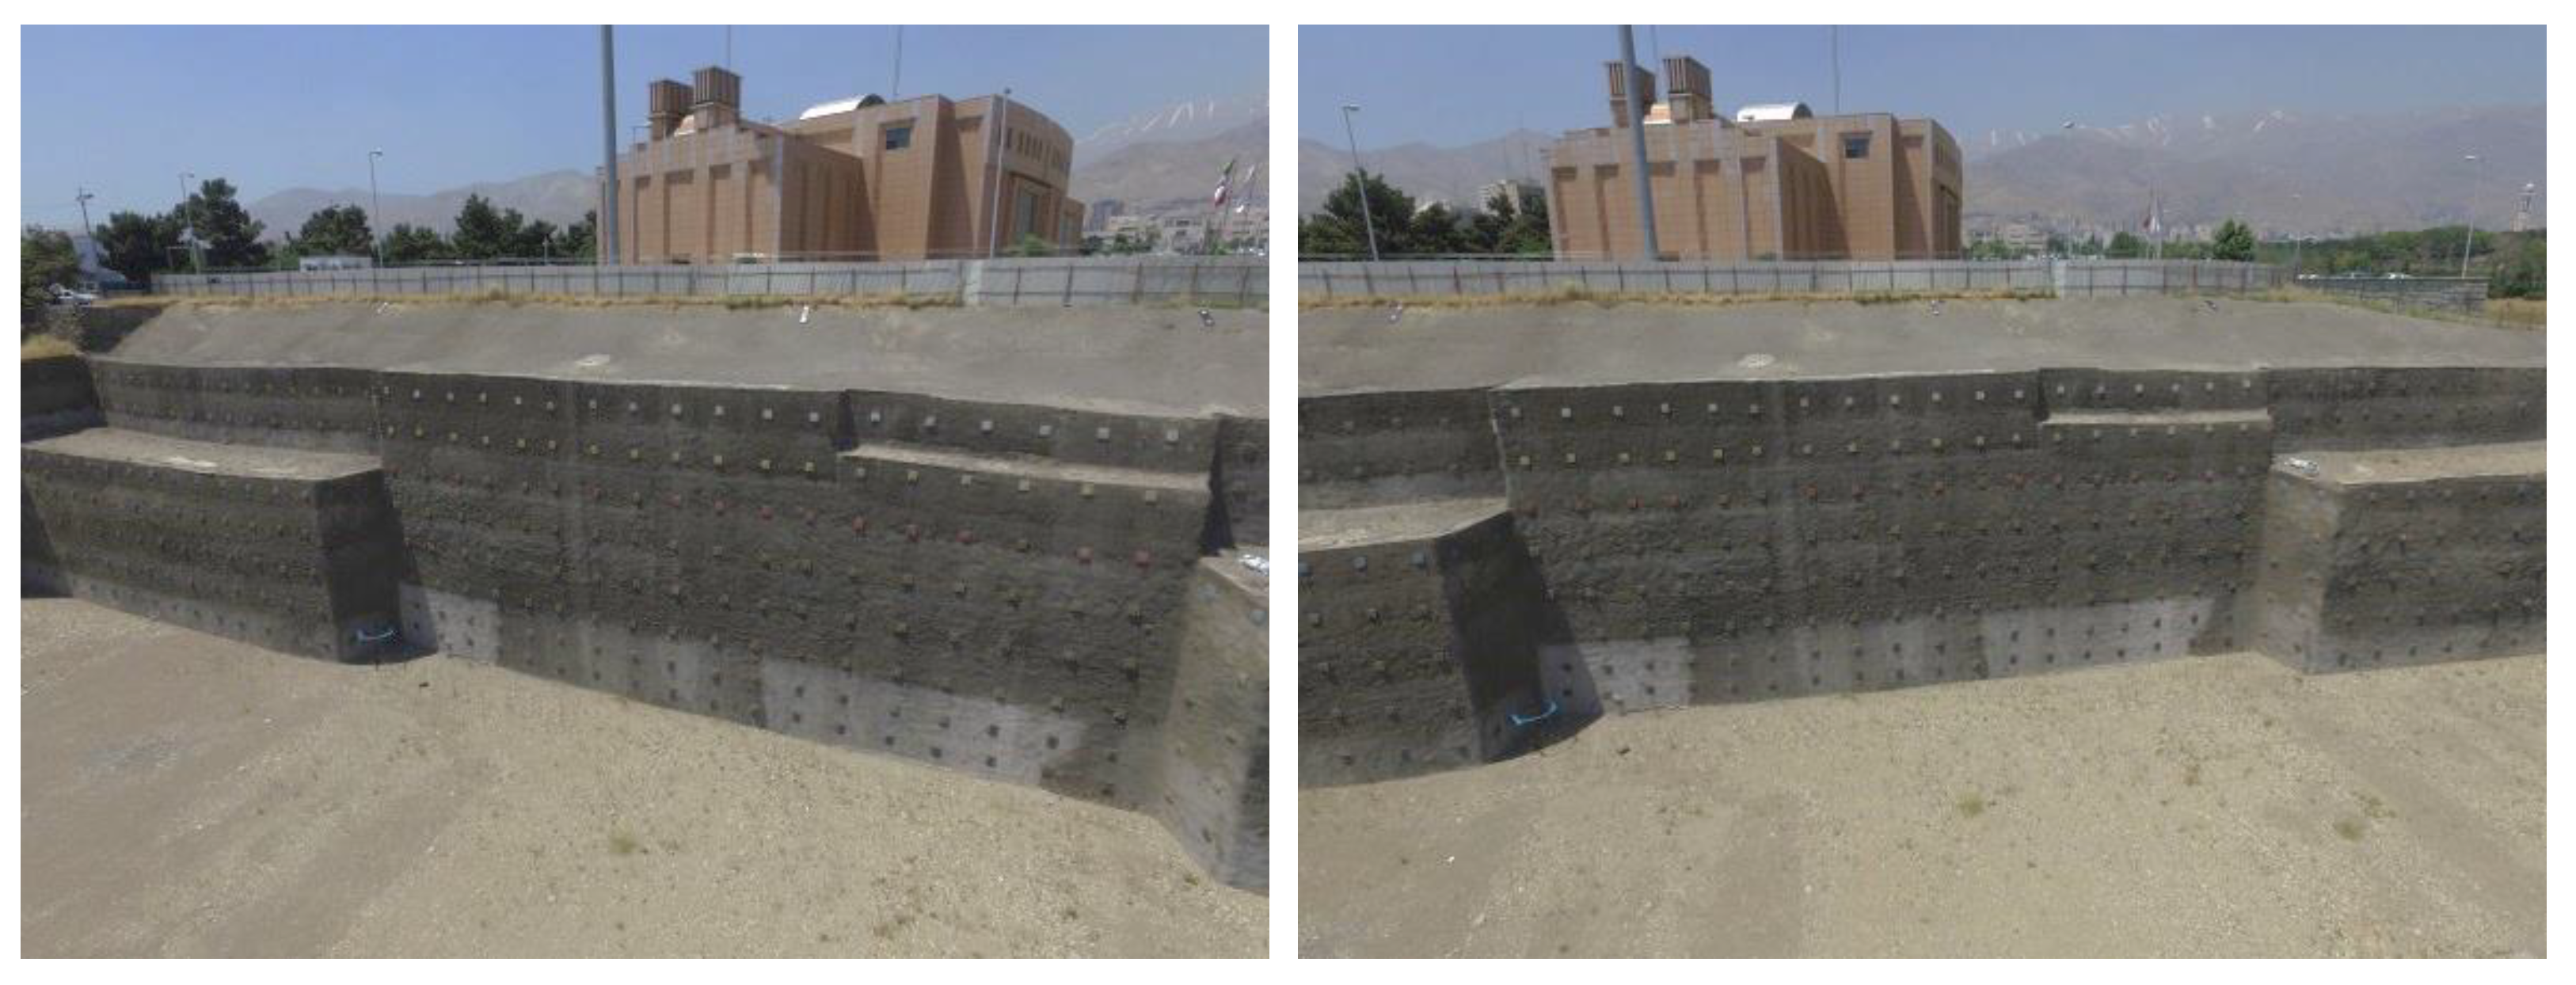
Firstly, one should identify a set of local features on the wall for which the local variability during the execution of the project is minimal. Given that the excavation operation is typically performed in stages, with 1–2 m of soil excavated per epoch followed by nailing and finally shotcrete spraying on the wall after each stage, the wall surface will practically experience radical changes throughout the execution of the project. In the meantime, the nails and the metal plate attached to them are not subject to such changes, so that any change in absolute position of them represents a wall displacement (
Figure 4).
Often times in nailing projects, the metal plates at the end of nails are painted in colours and numbered in rows of multiple nails. This is a typical practice for designating the excavated layers and identifying the length of the planted nails into the walls in similar projects. Given that the nails are planted into the excavated walls by some 15 m, on average, with cement slurry injected around the nails and knowing that the metal plates are firmly screwed to the nails, principles of structural engineering imply that no systematic relative displacement is exhibited by the nails, while their absolute displacement represents that the whole wall has been displaced. On this basis, the nails naturally provide good features for the detection of the images taken via photogrammetry, where those serve as target points for determining the wall displacement. However, one should work with executive officers of the project to appropriately set the initial painting process and also take care not to spray any shotcrete on the plates. These are the local features that the algorithm proposed in this research is seeking to extract from the images (i.e., visual observations) precisely irrespective of their form, size, colour and geometry.
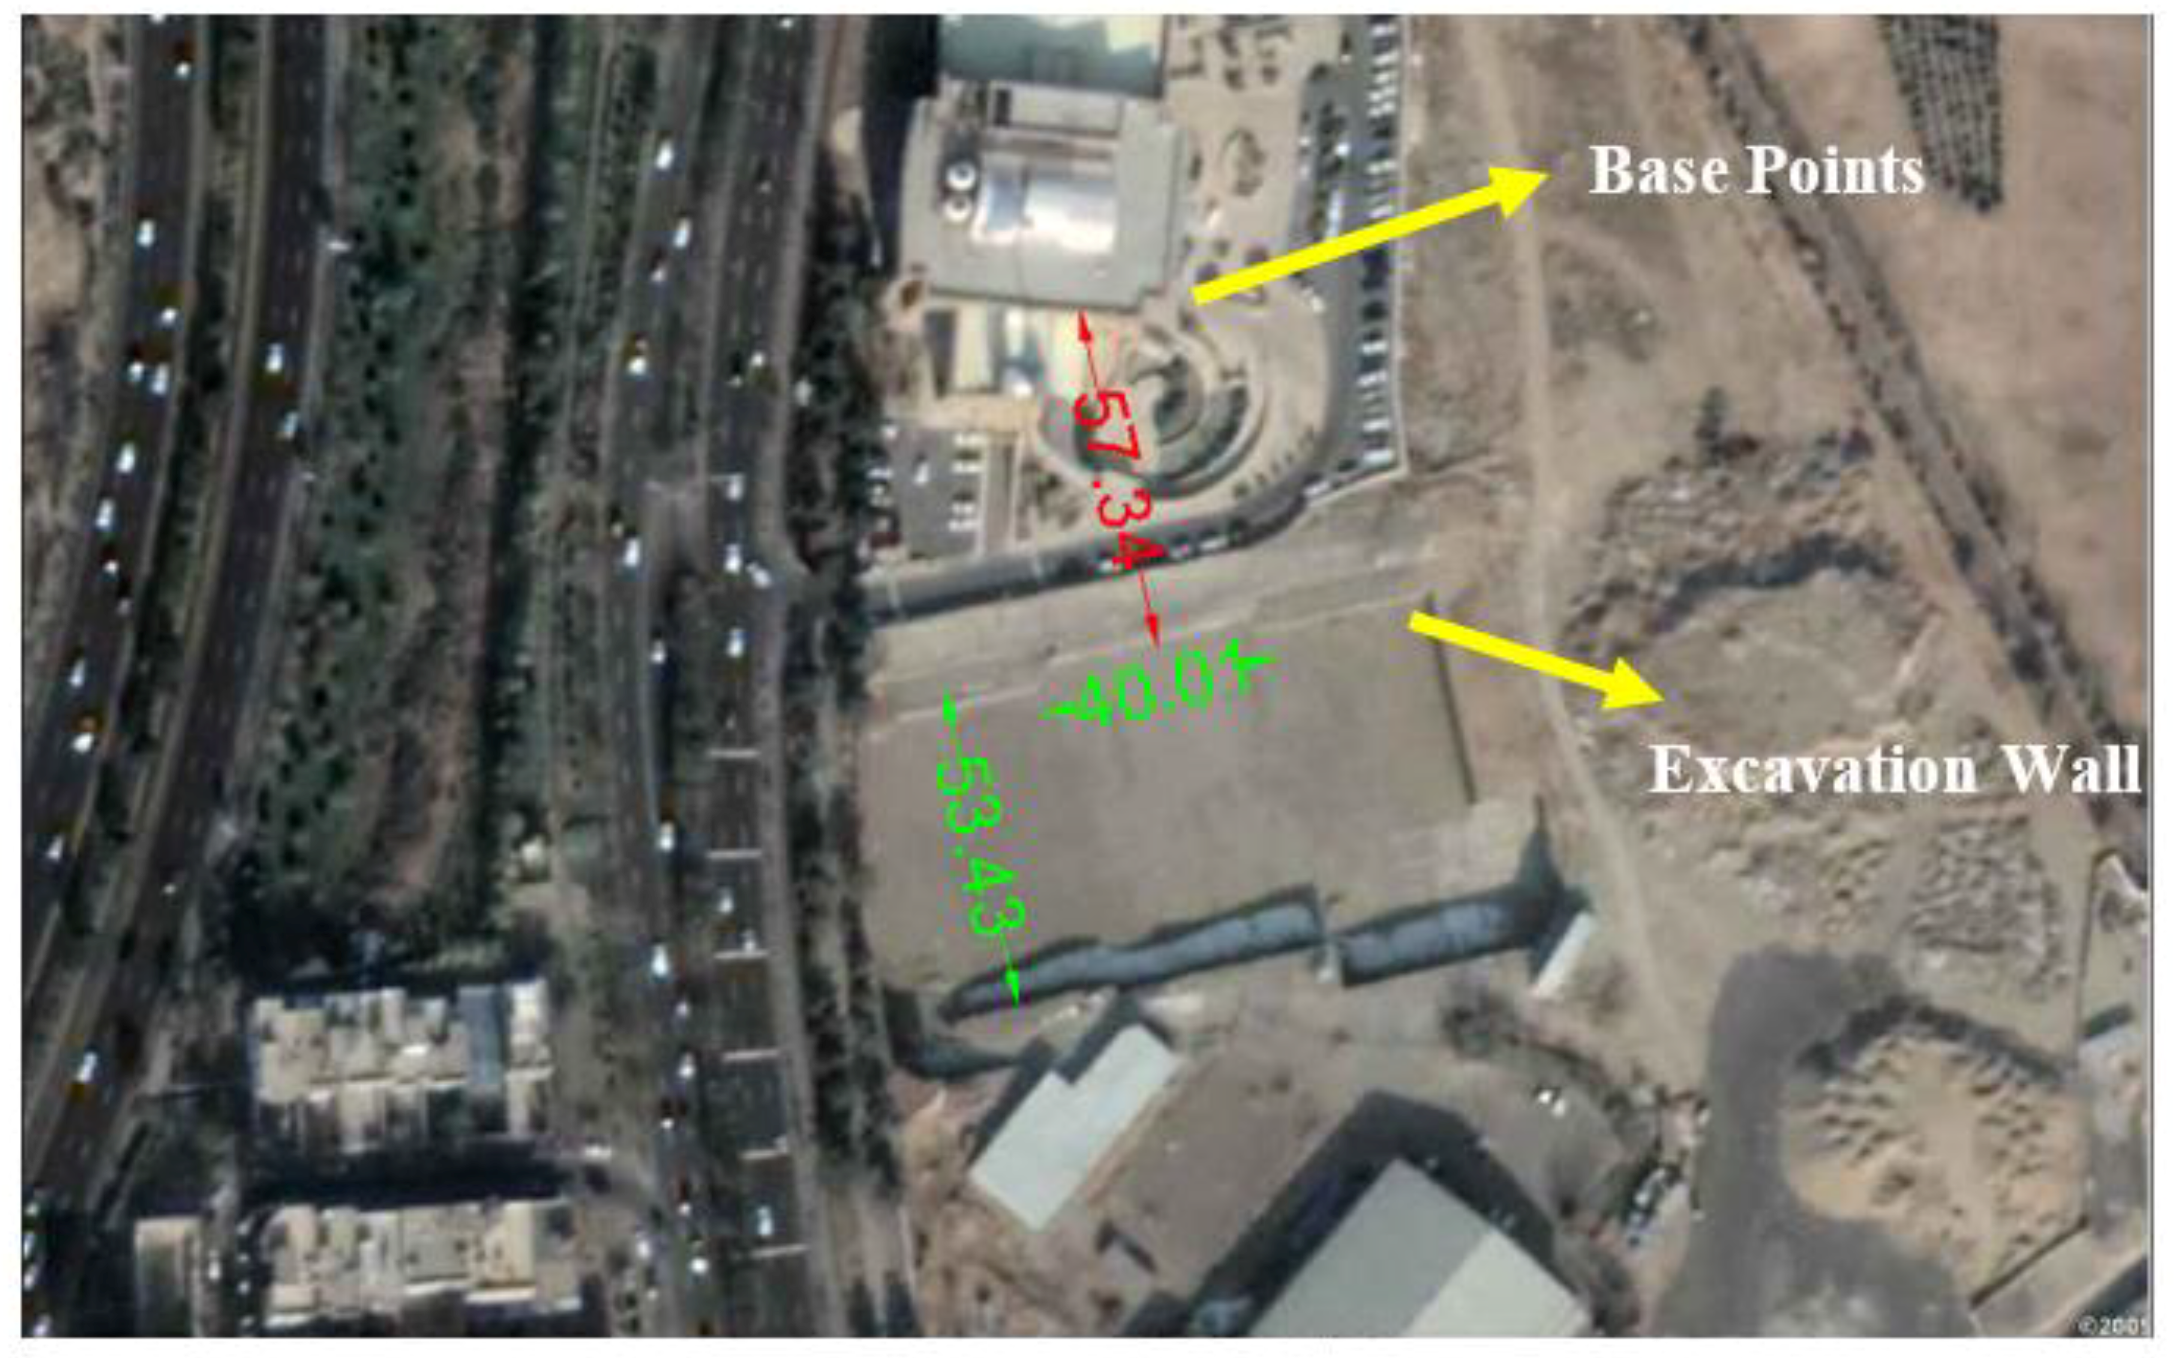
In the next step, the photogrammetry expert must look for fixed positions with respect to the excavated pit according to the respective standard code [
19]. Similar to the approach followed to extract the nails on the wall, appropriate fixed positions and unique local features are taken as base points for precise feature extraction from the images. This step is performed using the same algorithm for extraction and correspondence matching as that used for local features on the wall.
In a last stage, appropriate space for imaging is determined based on the principles of photogrammetry network design [
20]. To the extent possible, the presence of workshop equipment or possible auxiliary support systems such as trusses must be managed in such a way to provide suitable imaging stations with reference to the target wall while preserving the sight of imaging. Excessive wiring across the workshop space tends to negatively affect the manoeuvre power of the imaging UAV device.
2.2. Determining and Procuring the Required Hardware and Installing and Setting up the Required Physical Elements at the Project Site
In the present research, the considered structure for displacement measurement was a particular type of structure with specific properties. As such, one could configure the components of the displacement measurement system as well as the required hardware items depending on the expected properties for such projects. However, differences in the implementation conditions and the workshop environment in nailed excavations call for flexibility of the displacement measurement process to maximize its adaptability to the project. On this basis, the required pieces of equipment can be classified under two classes: “installable elements” and “used tools and equipment.” These two classes are explained in the following.
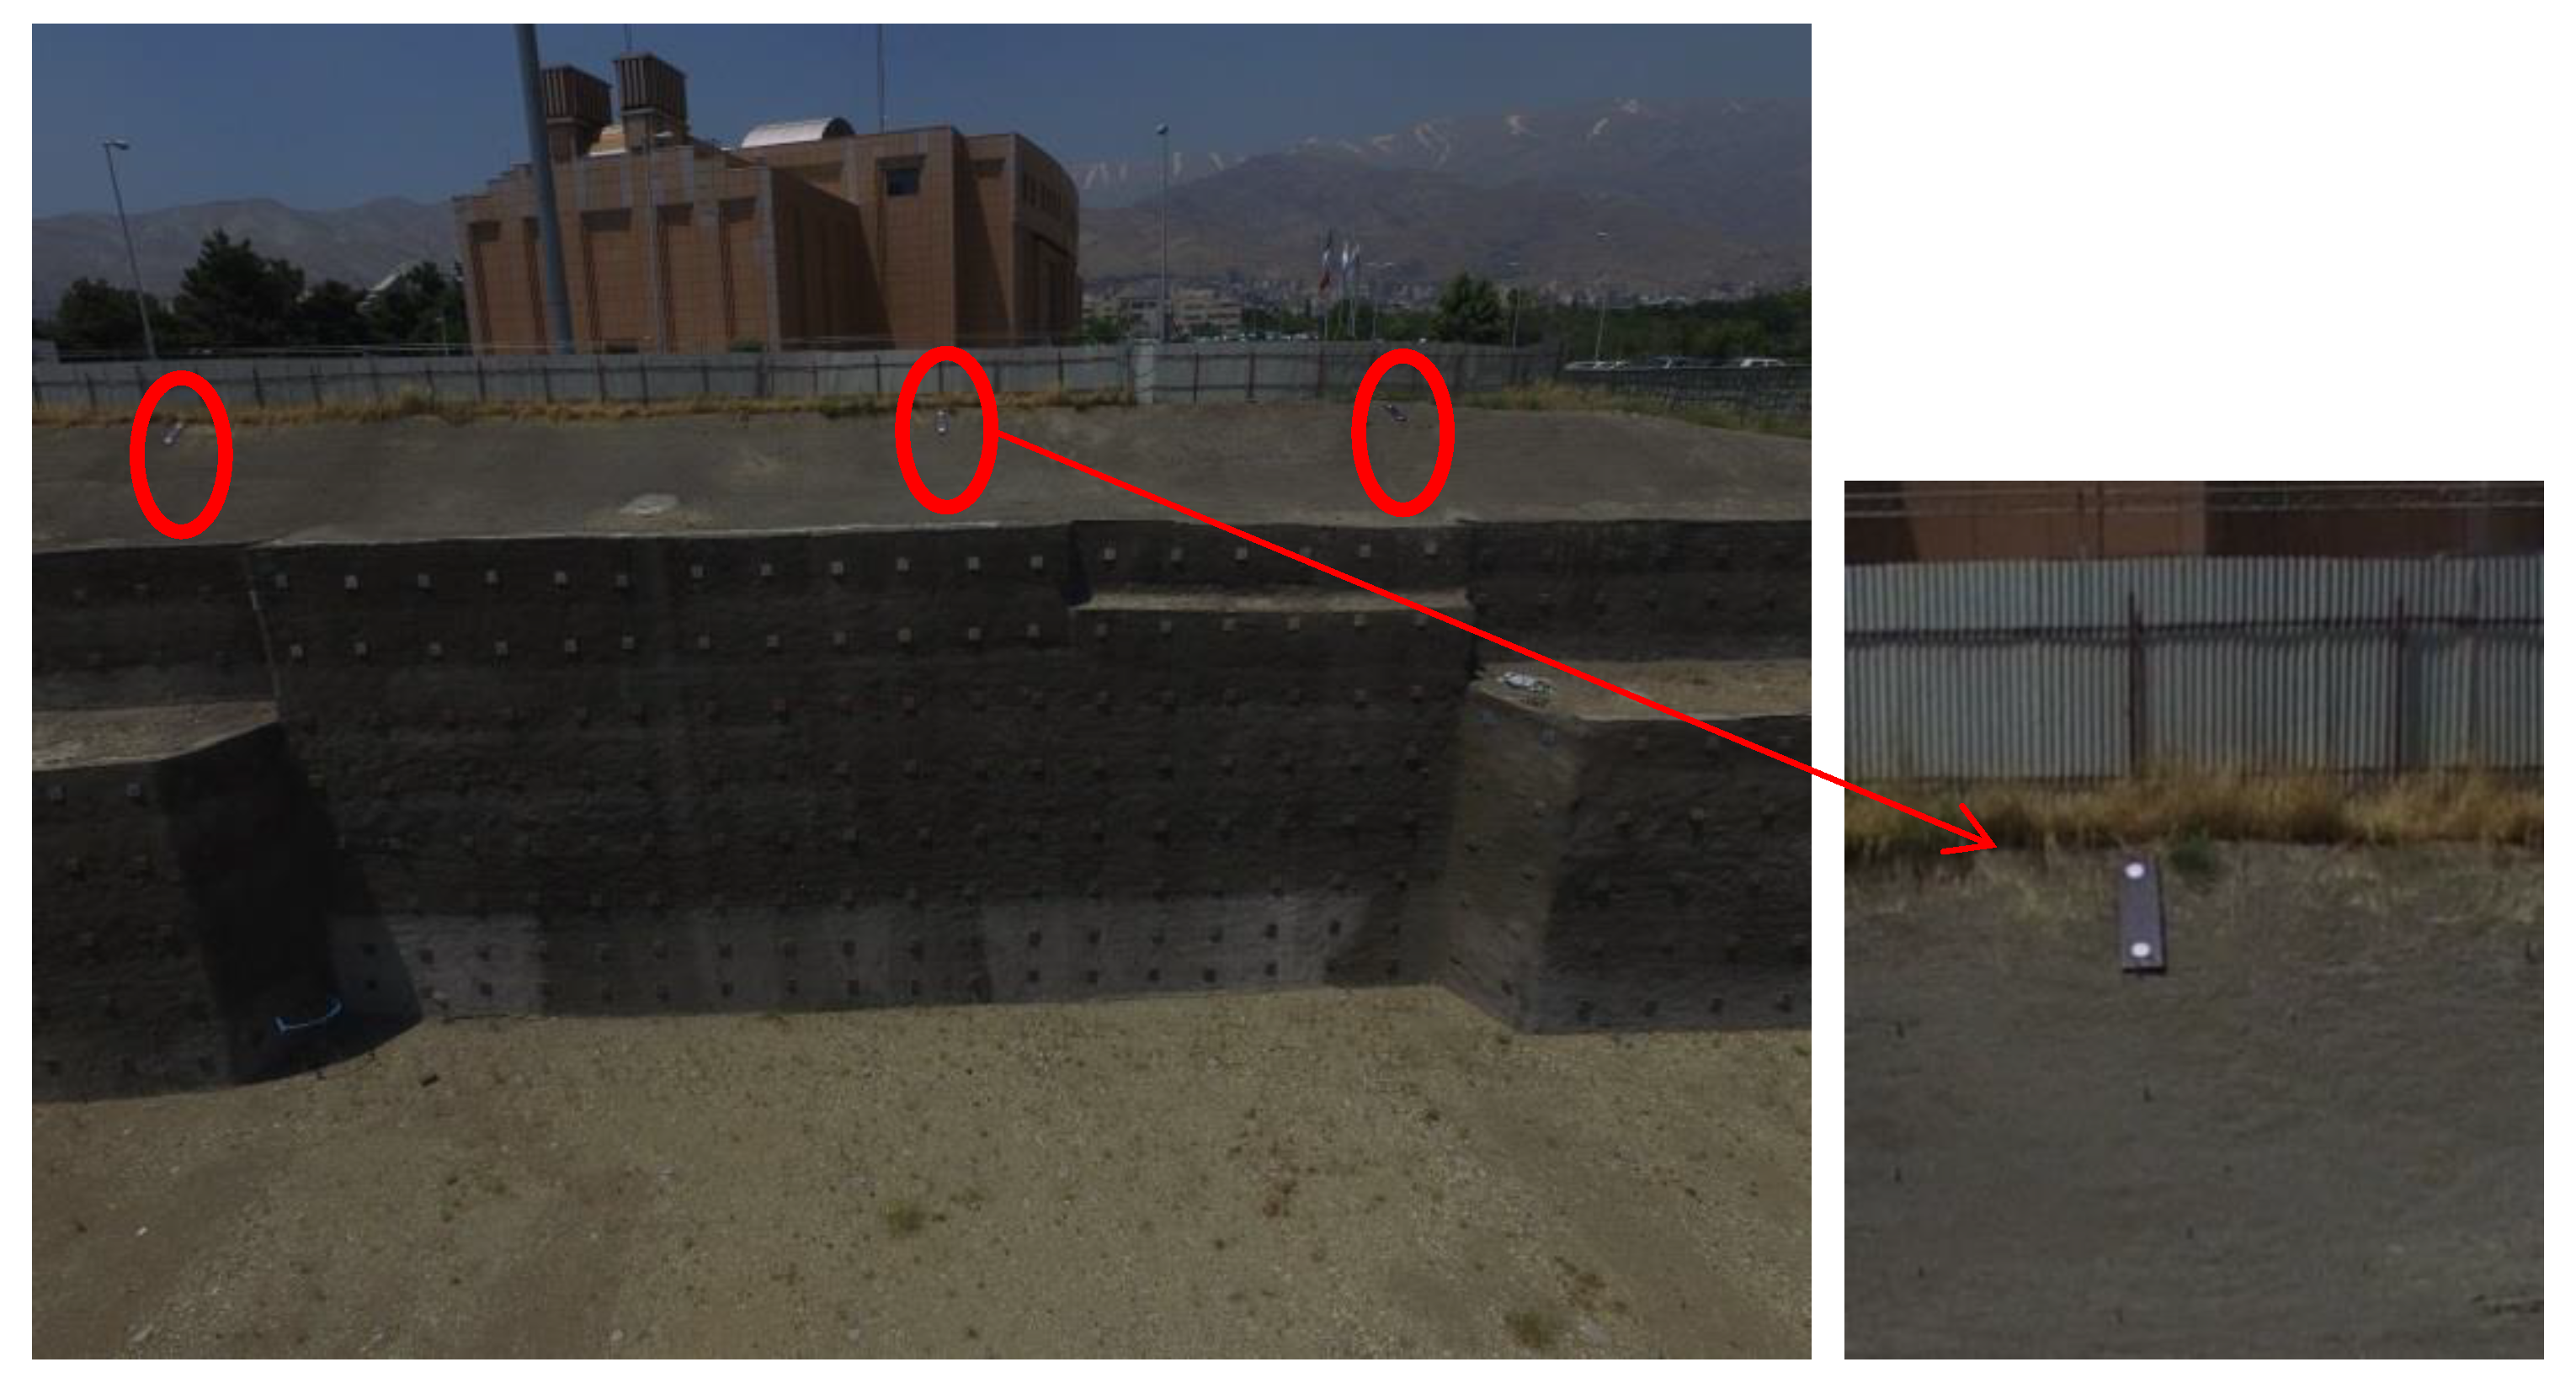
If suitable conditions, in terms of the presence of appropriate nails that can be taken as local feature in the project images, are already satisfied or can be established in all parts of the project, there would be no need to install photogrammetry targets, so that the flow of displacement measurement becomes somewhat facilitated and provided with high degrees of flexibility. The metal plate attached to the nails on the wall can serve as measurement points. Using the algorithm for identifying maximally stable external regions (MSER), such regions are identified on the images and centres of mass of such regions are considered as target points for displacement measurement. However, when it comes to scaling, the scale bars have been acknowledged as the most efficient option for such a purpose. Given the possibility of precise distance measurement using the scale bars in laboratory, as compared to distance measurement using total station cameras at the project site, the scale bars can be used with appropriate distribution to address the demand for scaling across the project. Since the expected precision for the results of displacement measurement is of the order of centimetres, the sufficient tolerance of estimating the distance between the targets at the two ends of a scale bar in an excavated wall displacement measurement project is just smaller than 2 mm. Depending on the specific set of conditions at the project site, it might be appropriate to install either fixed or portable scale bars. Regarding the need for fixed points to match the results of different epochs, if there are appropriate local features with sufficient spacing and good distribution around the excavation area for precise extraction from the images, those can be used as base points across the images. Otherwise, it is recommended to install photogrammetric targets for this purpose.
The most important piece of the used tools and equipment is the imaging camera adopted for the project. Achievement of optimal results in photogrammetry techniques is directly related to the imaging camera. Rieke-Zapp et al. performed a systematic assessment of a wide range of structures of the cameras used in photogrammetry [
21]. They found that, various factors affect the final results of such projects, including the sensor structure and dimensions, the lens type and its parameters, radiometric properties, digital single-lens reflex (DSLR) structure and geometrical parameters of the camera. On the other hand, depending on the environmental conditions of excavation projects, the used of UAVs equipped with a camera provides a promising solution to achieve robust network geometry. Multi-rotor UAVs offer suitable features for excavation projects. It is obvious that the combination of the best camera on the best UAV defines the ideal for a photogrammetry project. However, considering the diversity of commercial UAVs and the fact that numerous factors affect the choice of an appropriate UAV, it is practically infeasible to acknowledge a single specific model of UAV as the best one. In this case, different criteria may differ in importance even from one user to another or from a project to another; such criteria include flight endurance, rotation angles of the UAV’s gimbal, flight security sensors, dimensions and weight of the UAV, compatibility with various imaging cameras, navigation facilities and even capabilities of the flight management software. The specific model of imaging camera selected for a project imposes another constraint on the choice of the UAV. Accordingly, the choice of UAV is largely dependent on actual conditions, needs, users and available budget.
When it comes to flying a UAV for an excavation project, since most of such projects are administered in urban areas, the procedures and regulations associated with flight in urban areas shall be closely observed and the required permission shall be obtained in advance.
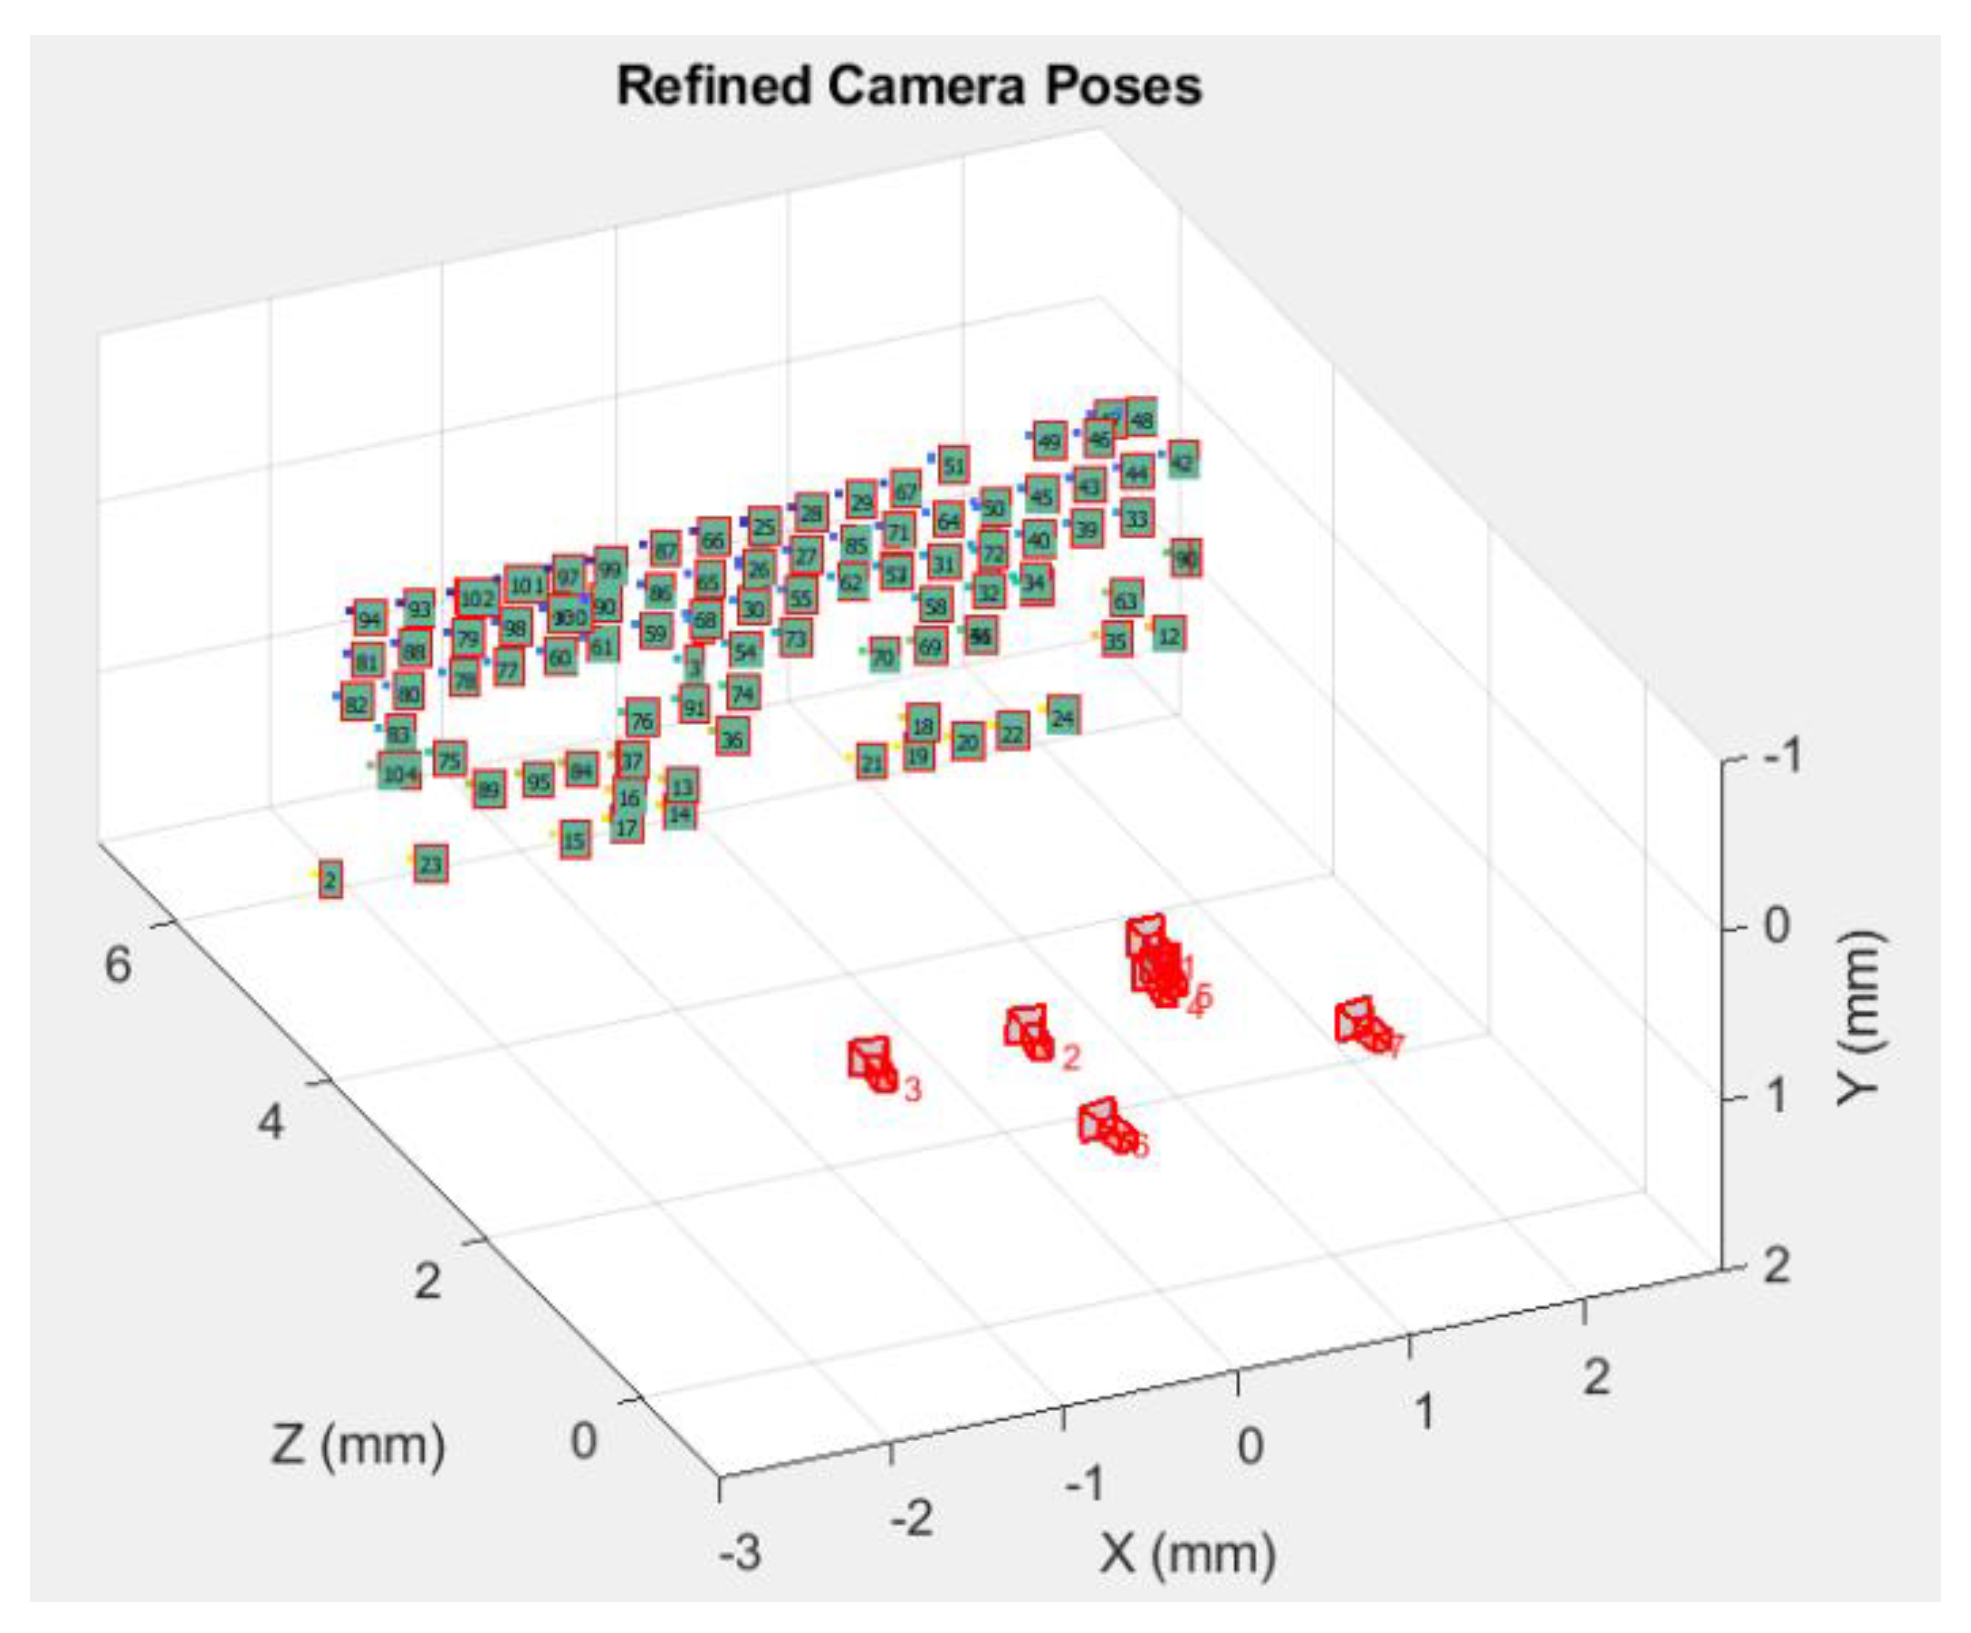
2.3. Designing the Network, Flying and Acquiring Observations
Design of the photogrammetry network and the number and positions of the target local features for displacement measurement in the project are directly related to the achievable precision of the results. Before a UAV can provide the expert with a three-dimensional view, a dense imaging network shall be established across the project site. Extensive research has been performed on the design of close-range photogrammetry networks [
20,
22,
23,
24,
25,
26]. In the present research, the Fraser network design principles and constraints were used to determine the region within which the wall was imaged by the UAV [
20].
In a flight for imaging purposes, it is so important to use a UAV equipped with position stabilization feature to capture images with no image motion and stretching and also to set the imaging region precisely. On this basis, the possibility to see the sight of UAV on a real-time basis on the controller will serve as a determinant factor. During the imaging operation, movement of individuals and equipment items across the project site shall be minimized. The specific hour(s) along the day during which the imaging operation is performed affects the performance of feature extraction from the captured images. It is better not to have long shadows in the image, particular along the margins of the nailing plates. Accordingly, the imaging operation is better to be undertaken during the hours when the wall is fully under shadow or when it is cloudy.
2.4. Extracting and Correspondence Matching
By definition, a local feature is a pattern of image which is uniquely distinctive of its neighbouring patterns within the part of image where it is resided [
27]. Such features are typically defined based on changes in one or more image properties. For most part, such properties include changes in the grey intensity, colour and texture. Most often expressed as points, edges and closed regions across the image, these local features are used in different systems and applications, as stable points with high information content across the image. Various algorithms have been proposed for local feature extraction from an image. As the most popular ones, one may refer to the intensity-based regions [
28,
29], maximally stable extremal regions (MSER) [
30] and segmentation-based methods [
27]. Tuytelaars et al. performed a comprehensive comparison among various features of reference region extraction techniques [
27]. Their results indicated that, the MSER algorithm was not only rotation-, scale and affine-invariant but also provided significantly higher levels of repeatability, accuracy, efficiency and robustness than the other typical algorithms in different applications. On this basis, the present research adopted MSER method for extracting the nailed regions on the excavated wall. The detection of MSER is related to threshold setting [
27]. All stages of feature extraction, correspondence matching and displacement determination were performed by coding in MATLAB.
In this study, performance of the extraction technique was optimized by setting the thresholds on input parameters for the metal plates on top of the nails. By adjusting the range of the number of pixels falling within the MSER, aspect ratio of the extracted zones and similarity in grey intensity of the pixels within and outside region, one could optimize the MSER performance for extracting the nails on the excavated wall. Moreover, for the sake of noise attenuation, a constraint was adopted to keep near circular regions while omitting the non-circular ones.
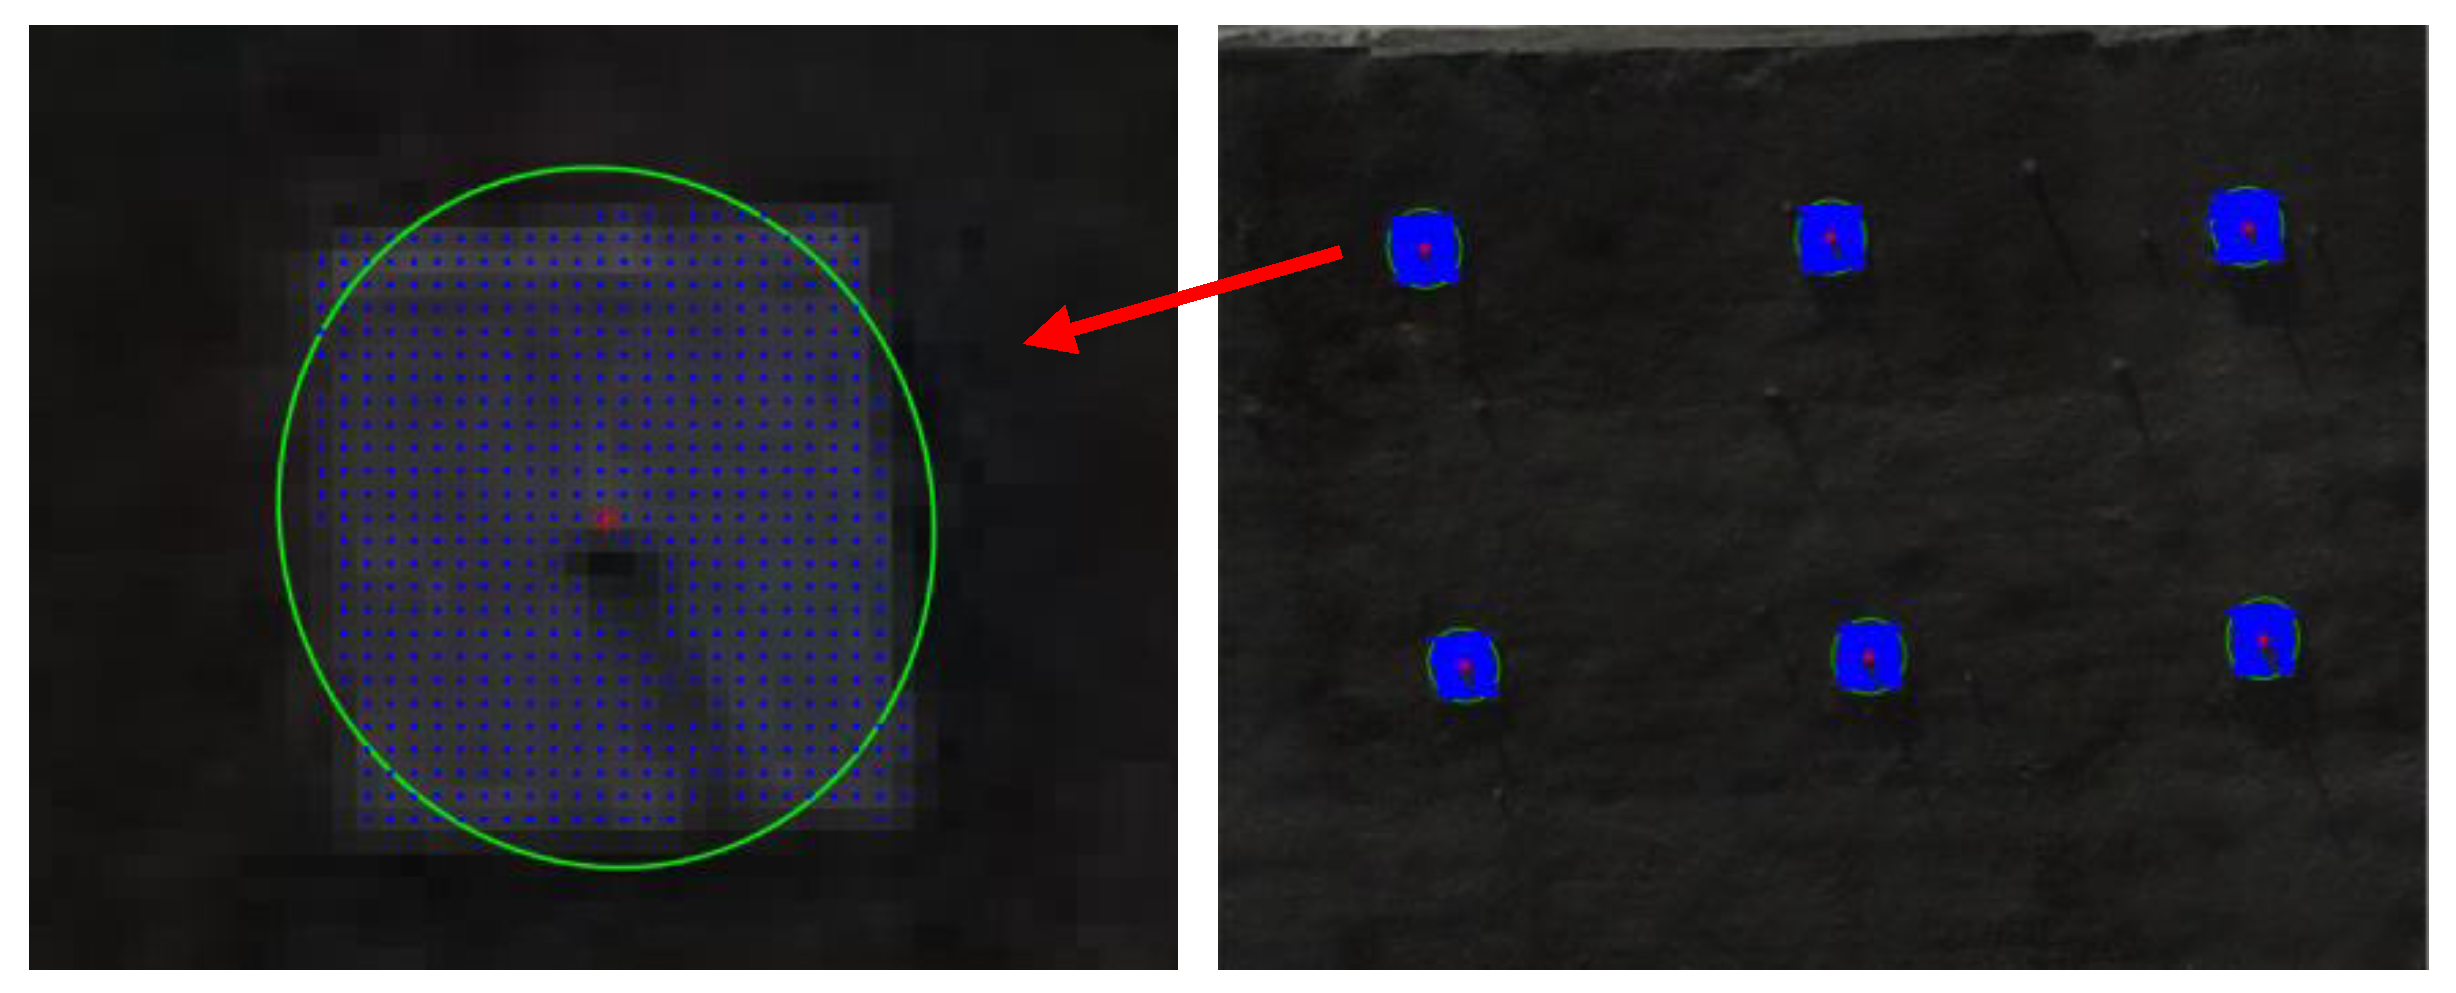
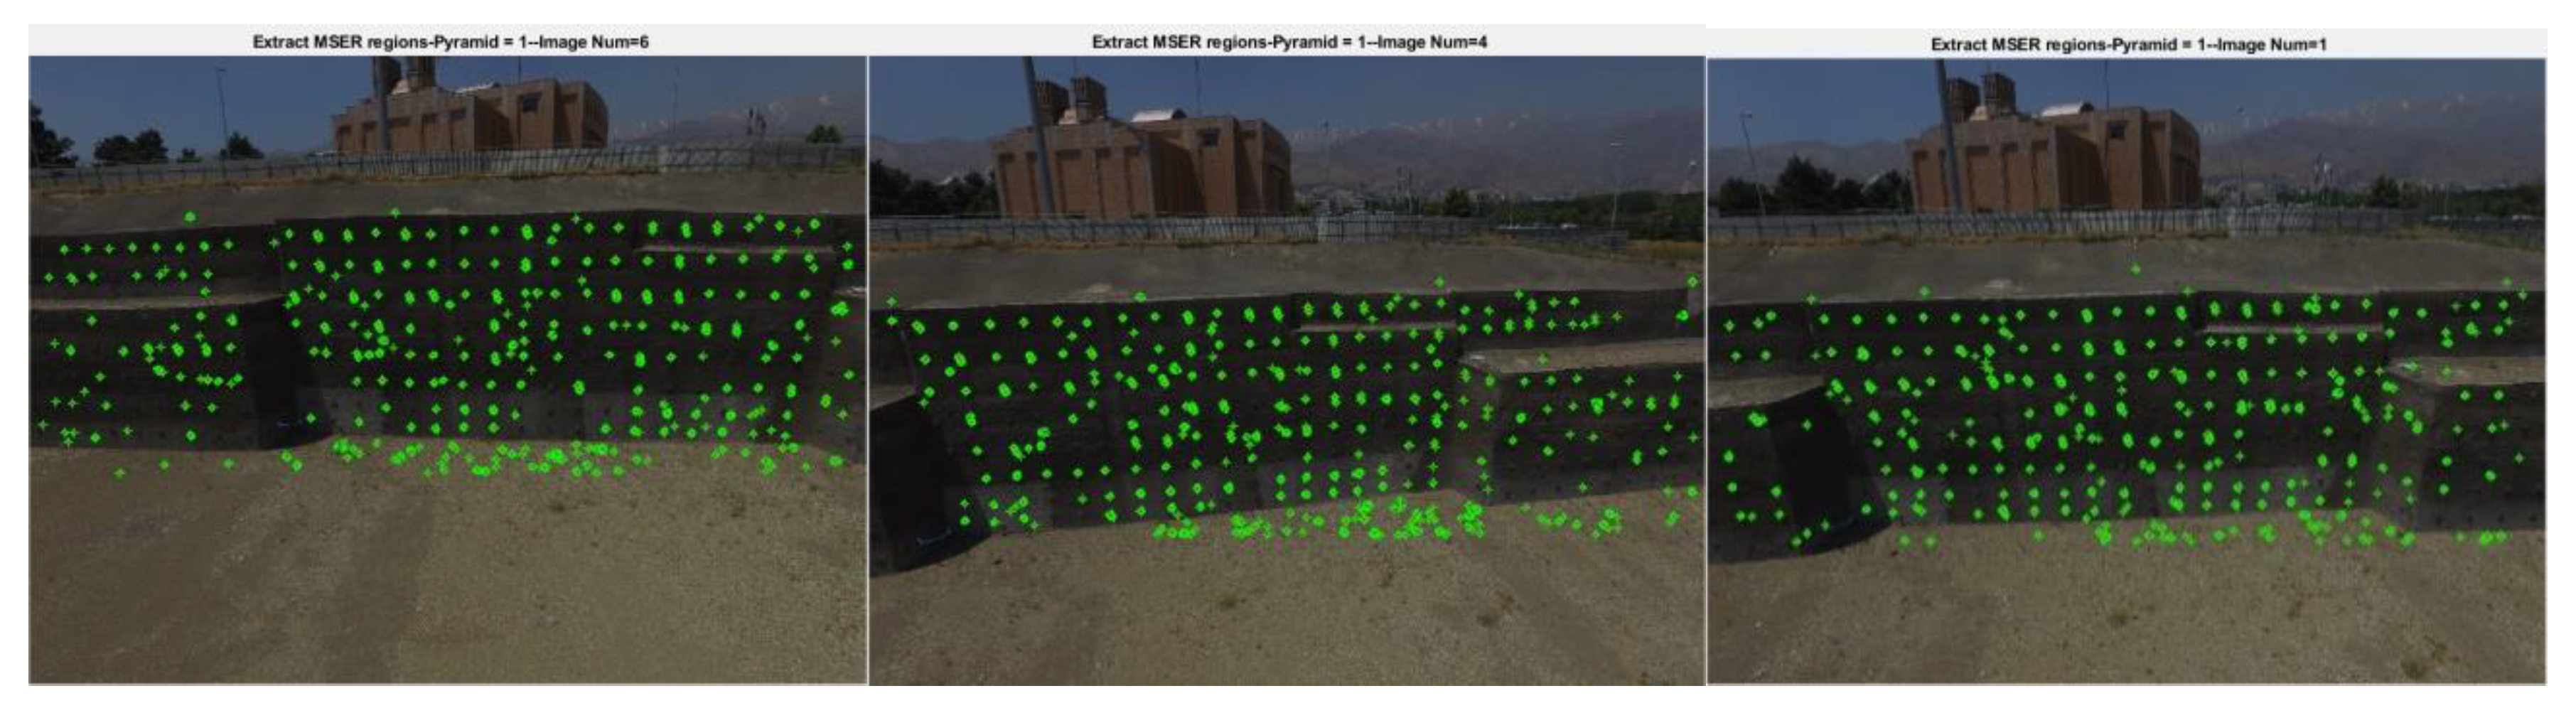
Figure 5 demonstrates an example of the regions extracted on the excavated wall using the MSER algorithm.
As can be seen in
Figure 5, once finished with extracting the regions using the MSER algorithm, an ellipse was fitted to each region. Next, the centre of this ellipse was taken as a highly stable point feature for feature extraction in all images and then matching the images.
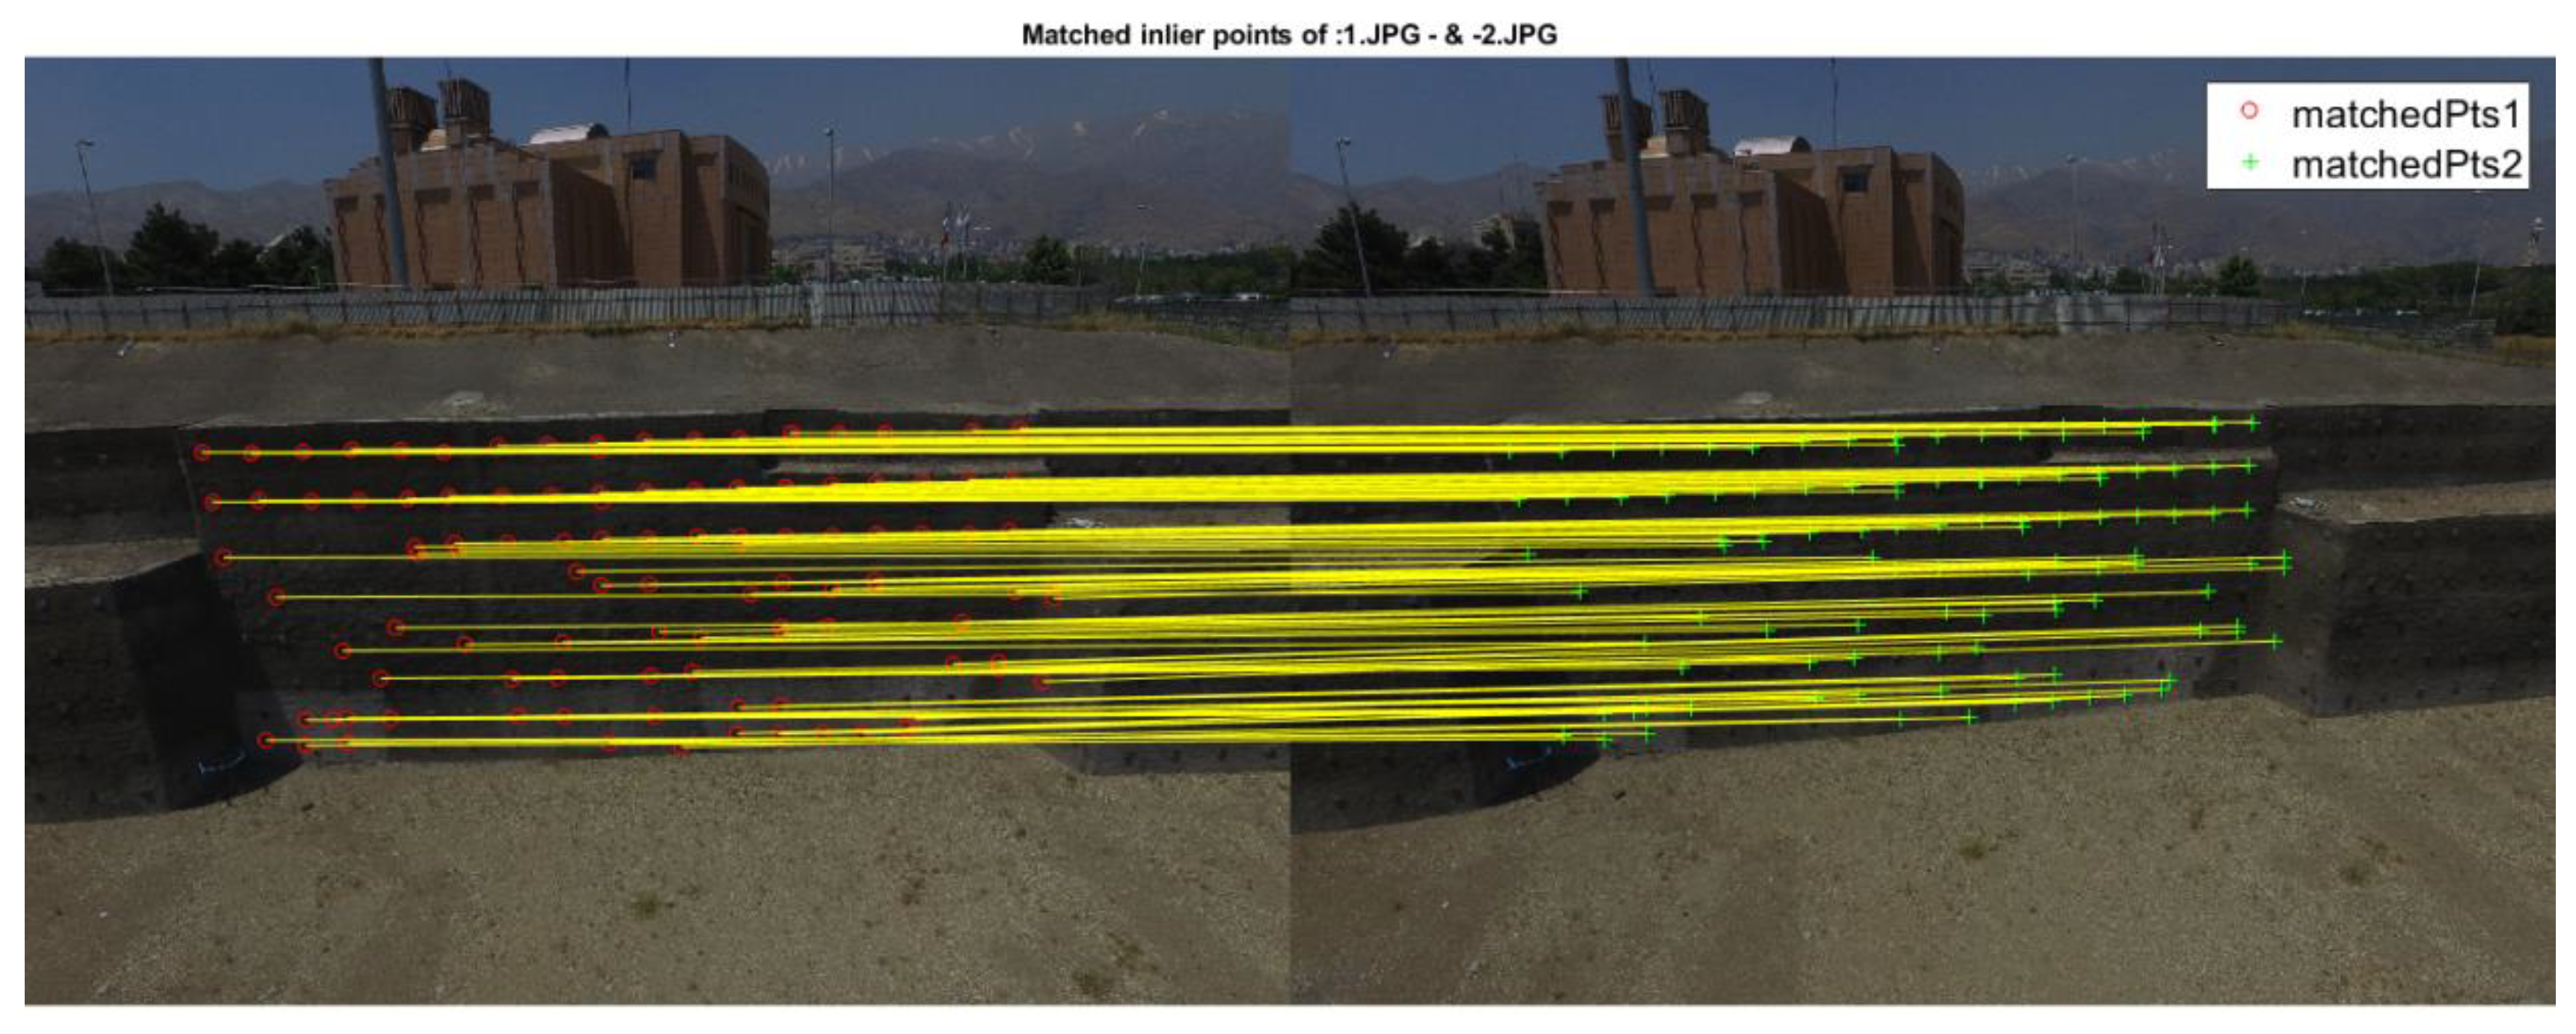
Once finished with extracting the local features, the next step is to match different points across the convergent images acquired from the wall using the UAV. Descriptors are herein determined based on weighted gradient of the image around the central point in each MSER feature. Afterwards, a feature vector was built for the central pixel of each of the MSER-extracted regions on each image. The corresponding interest points between a particular image, as reference image and the other images were identified based on similarity in the feature vector developed by the descriptors. The reference image is the one for which the incident angle of the direction of optical axis to the excavated wall is closest to 90°, as compared to other images. In order to ensure appropriate similarity identification, strict thresholds were considered for matching corresponding features. According to the preliminary similarities obtained in this research, coefficients of a projective geometry transformation from the reference image to the other images were determined. Accordingly, the preliminary corresponding interest points that failed to satisfy the threshold obtained upon solving the projective equations were omitted. This process of inappropriate correspondence elimination was inspired by the M-estimator sample consensus (MSAC) [
31].
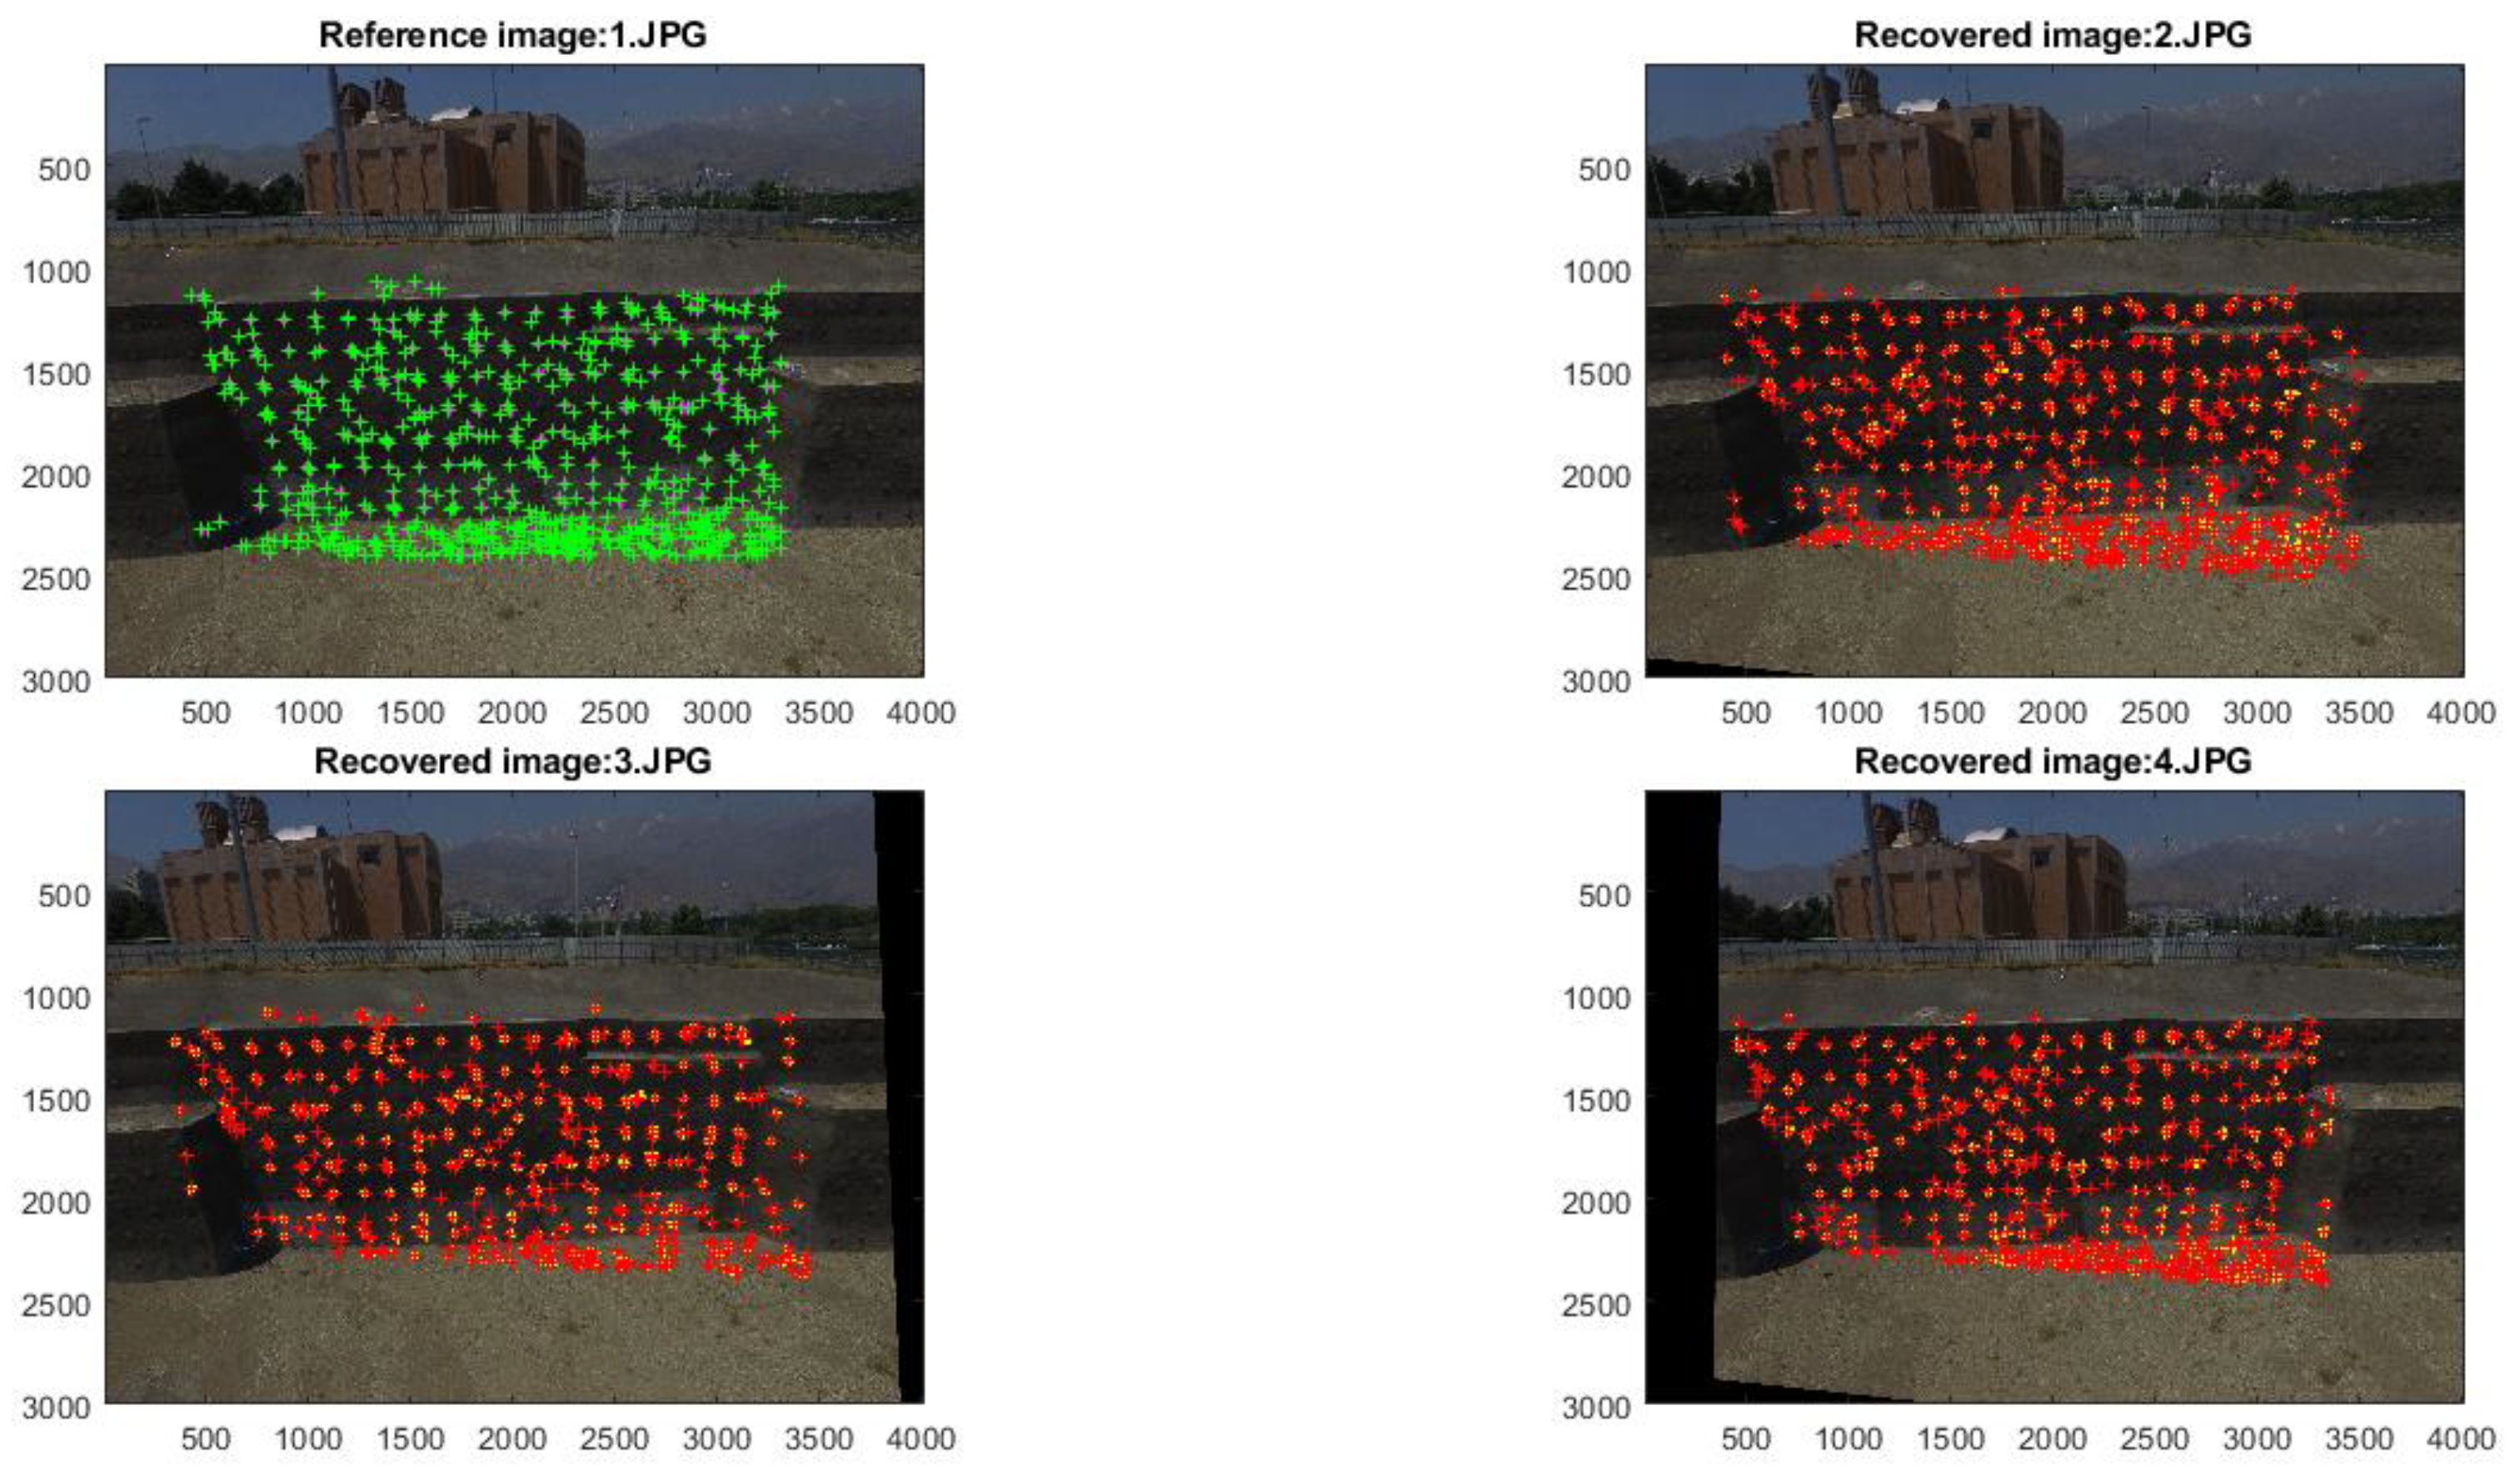
Figure 6 shows the initial appropriate correspondence matching between two images taken from the excavated wall by the UAV.
Once finished with determining the initial corresponding points, projective homography was used to project all images and points onto the reference image. The homographic images were formed according to
Figure 7.
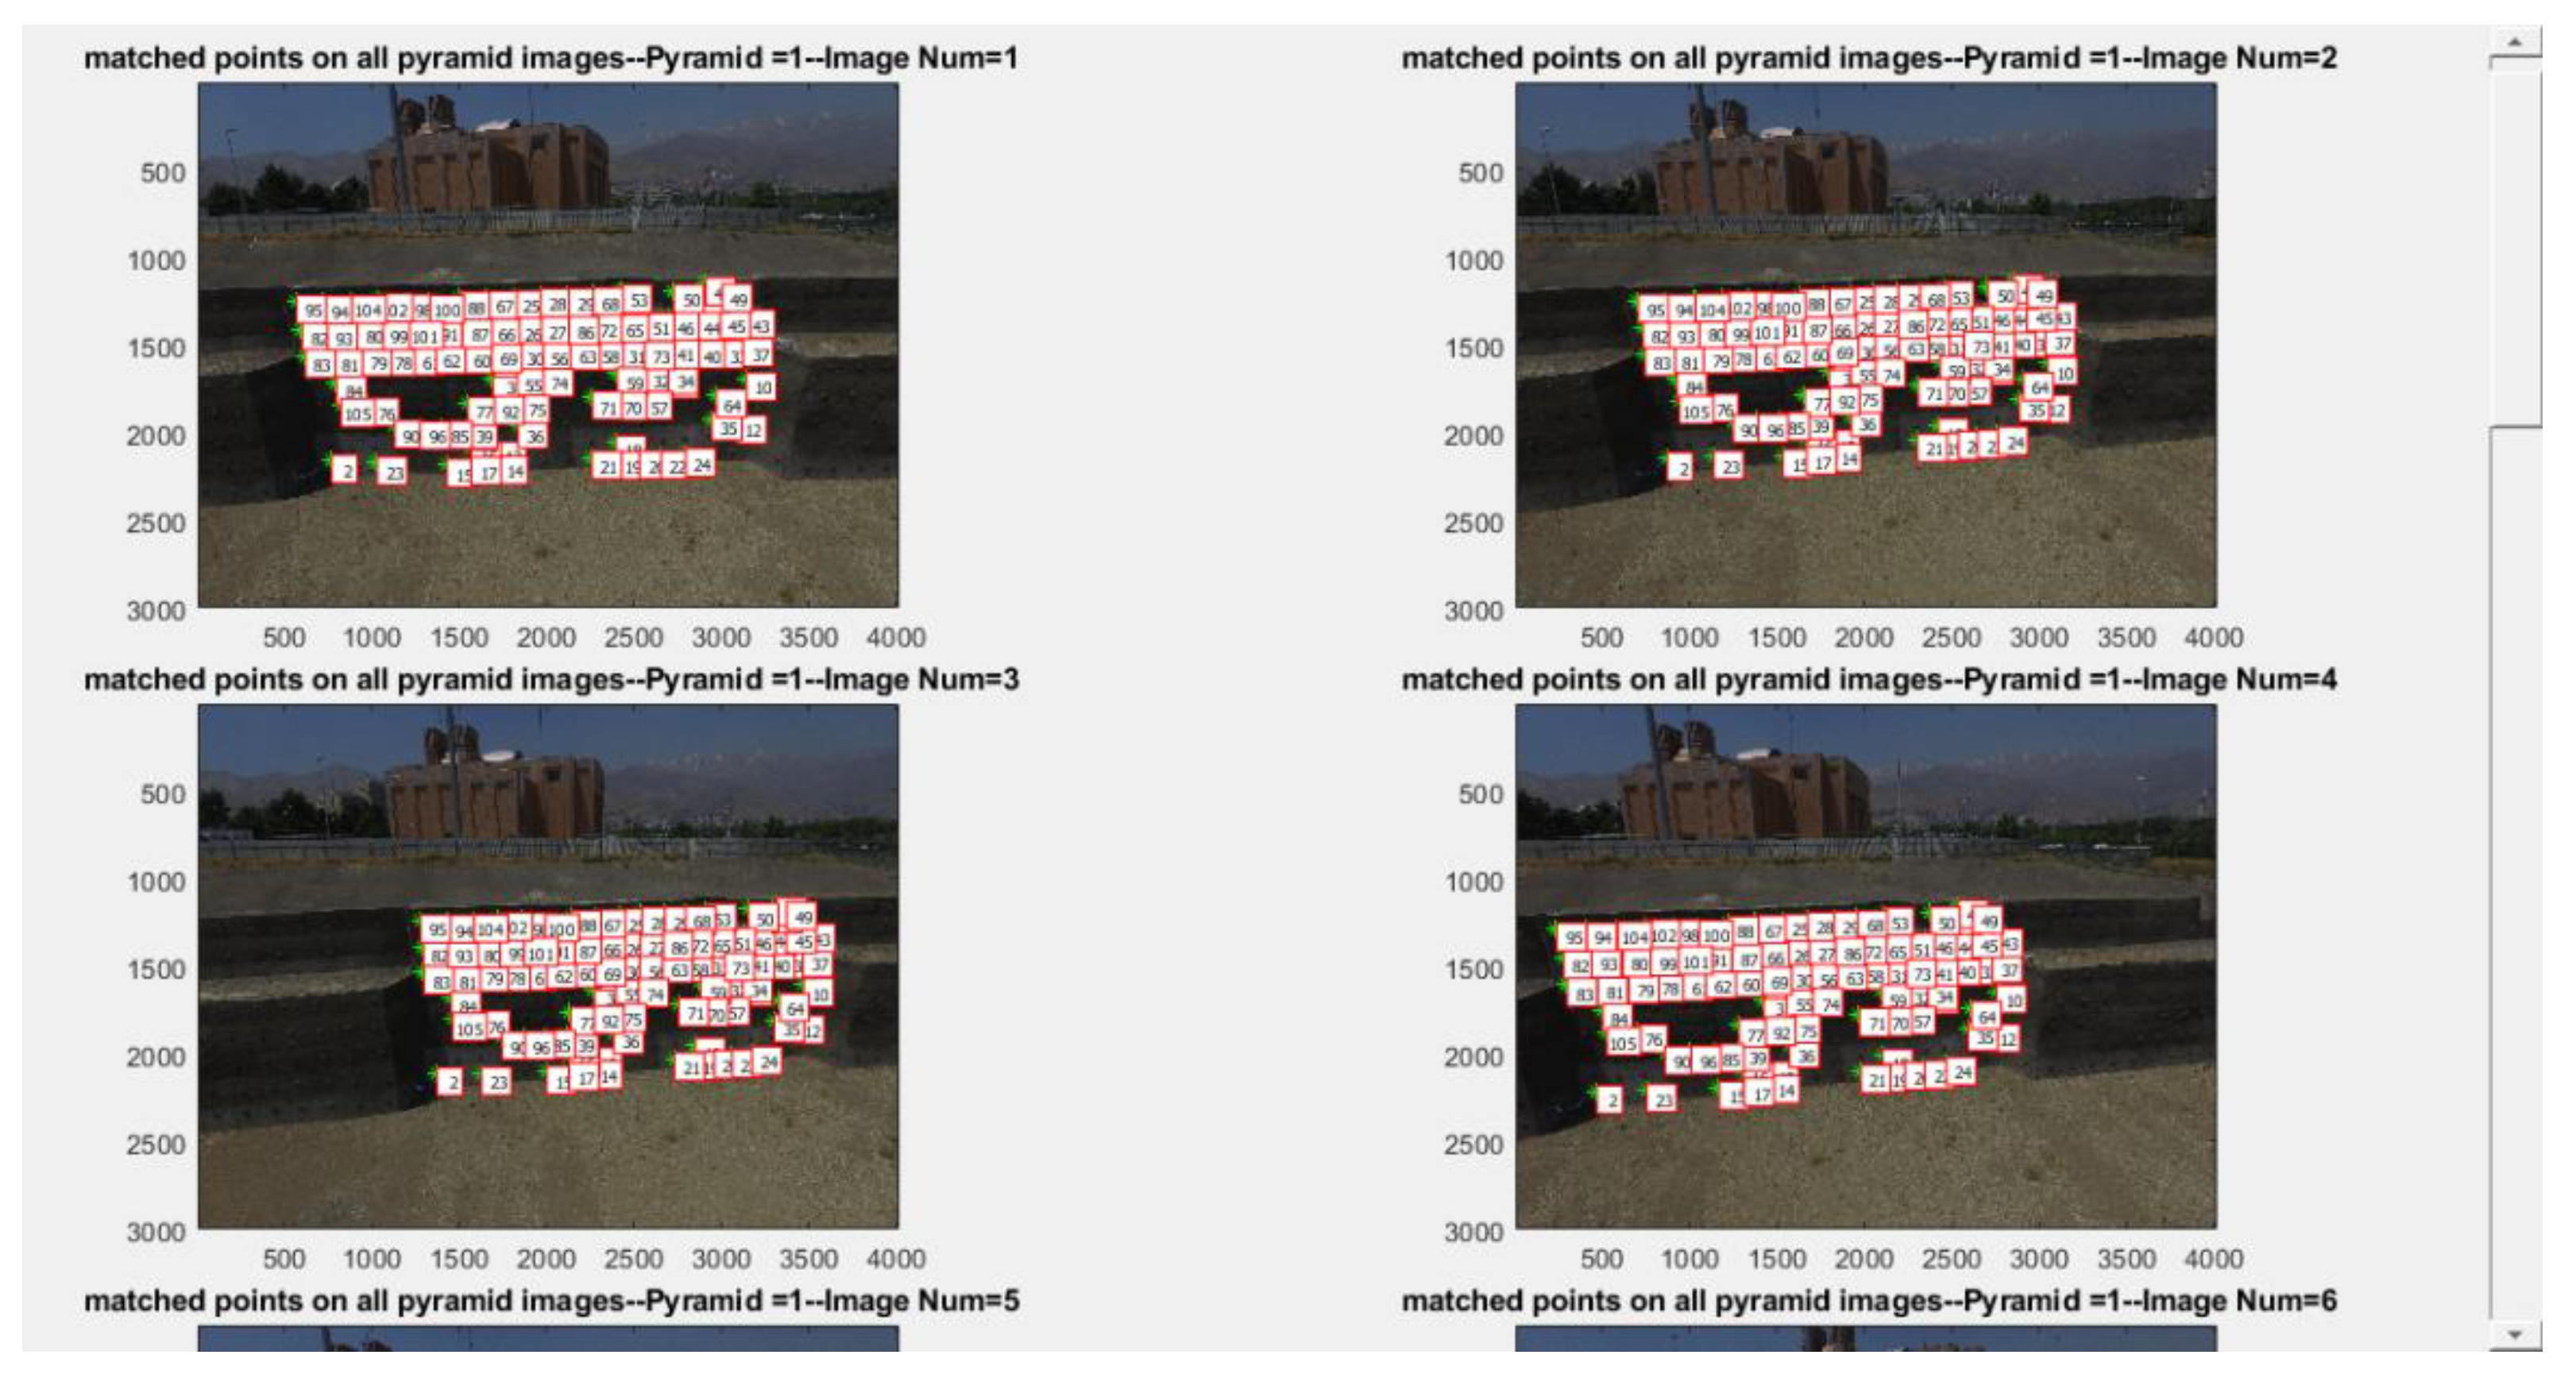
For the corresponding points transformed into the reference image, the nearest extracted point was determined with a strict threshold. Repeated corresponding points were eliminated based on the nearest positions. On the reference image, those features for which there was corresponding features on all other images were retained, with their image and pixel coordinates determined based on the designation number of the corresponding points in all images (
Figure 8).
The points matching were performed across all images in the Epochs 1 and 2. The set of corresponding points across the images in both epochs and the fixed base points were introduced into the next stage, that is, displacement measurement.
2.5. Displacement Measurement Based on CPDA Method
In the present research, displacement measurement was performed via combined photogrammetry displacement adjustment (CPDA) method [
3]. In the CPDA, combined adjustment is applied on both epochs simultaneously by assuming common observations for base points in both epochs and independent observations at each epoch for the displaced points. In this methodology, the network obtained from the Epoch 1 was adjusted based on the respective internal justification, while the network derived from the Epoch 2 was simultaneously justified based on the internal justification for the second network. Coordinates of the fixed and displaced points were determined commonly between the two epochs and using images from the respective epoch, respectively. Therefore, as output, the methodology provides a set of coordinates for the fixed points along with two sets of coordinates for the displaced points, all of which reside within a common coordinate system. These two sets of coordinates for the displaced points refer to the Epochs 1 and 2. Comparing the coordinates of the displaced points, one can evaluate the displacement occurred in the two epochs. In this case, in order to scale up the dimensions to real values, scale bars are used. An important point about displacement measurement on nail-restrained excavated walls is the continuous changes in the wall surface as a result of collapse or incidence of the shotcretes originally sprayed onto the subsequent excavation layers. Therefore, except for the metal plates at the end of the nails that were originally painted and then washed regularly after each round of shotcrete spraying, no part across the wall exhibited fixed condition. This results in a situation where photogrammetry for displacement measurement cannot enjoy surface modelling techniques and hence surface comparison for wall behaviour determination is not an option in the photogrammetry-based displacement measurement methods, because most of the changes in this case are in fact resulted from changes in the shotcrete thickness in successive stages of shotcrete spraying, rather than actual wall displacement.


