An Analysis of the Evolution, Completeness and Spatial Patterns of OpenStreetMap Building Data in China


1
School of Information Engineering, China University of Geosciences, Wuhan 430074, China
2
Wuhan Center of Geological Survey, China Geological Survey, Wuhan 430205, China
*
Author to whom correspondence should be addressed.
ISPRS Int. J. Geo-Inf. 2019, 8(1), 35; https://0-doi-org.brum.beds.ac.uk/10.3390/ijgi8010035
Submission received: 24 October 2018
/
Revised: 11 December 2018
/
Accepted: 9 January 2019
/
Published: 16 January 2019
(This article belongs to the Special Issue Free and Open Source Tools for Geospatial Analysis and Mapping)
Abstract
:OpenStreetMap (OSM) is a free map that can be created, edited, and updated by volunteers globally. The quality of OSM datasets is therefore of great concern. Extensive studies have focused on assessing the completeness (a quality measure) of OSM datasets in various countries, but very few have been paid attention to investigating the OSM building dataset in China. This study aims to present an analysis of the evolution, completeness and spatial patterns of OSM building data in China across the years 2012 to 2017. This is done using two quality indicators, OSM building count and OSM building density, although a corresponding reference dataset for the whole country is not freely available. Development of OSM building counts from 2012 to 2017 is analyzed in terms of provincial- and prefecture-level divisions. Factors that may affect the development of OSM building data in China are also analyzed. A 1 × 1 km2 regular grid is overlapped onto urban areas of each prefecture-level division, and the OSM building density of each grid cell is calculated. Spatial distributions of high-density grid cells for prefecture-level divisions are analyzed. Results show that: (1) the OSM building count increases by almost 20 times from 2012 to 2017, and in most cases, economic (gross domestic product) and OSM road length are two factors that may influence the development of OSM building data in China; (2) most grid cells in urban areas do not have any building data, but two typical patterns (dispersion and aggregation) of high-density grid cells are found among prefecture-level divisions.
1. Introduction
Volunteered geographic information (VGI) is geographical information that can be created, edited, and updated voluntarily by individuals [1]. OpenStreetMap (OSM), as a typical VGI project, is an online map with free content—everyone can edit and use it. Many applications have been proposed using OSM data, such as routing and navigation [2,3], crisis mapping [4,5], three-dimensional modeling [6,7], and land-use/cover mapping [8]. OSM data are free to use, have global coverage, and are also up to date. However, most OSM data have been contributed by “non-professional” or “amateur geographers” [9,10]. The quality of the data is therefore of great concern, and many studies have paid attention to this [11,12,13]. According to the International Organization for Standardization definition, spatial data quality includes six main measures: Completeness, logical consistency, positional accuracy, temporal quality, semantic accuracy, and usability. Among these quality elements, the completeness measure, which reflects whether a specific area has been covered well, has been paid much more attention.
Extensive research has been conducted on assessing the completeness of OSM datasets in various countries by comparing with corresponding reference datasets which may be obtained from either an authoritative or commercial dataset. For example, Haklay [10] assessed the completeness of the OSM road dataset in England by comparison with a corresponding dataset produced by Ordnance Survey, an authoritative mapping agency in the UK. Girres and Touya [14] compared the OSM dataset in France with a reference dataset that produced by the French National Mapping Agency. Goetz and Zipf [15] compared the building data of OSM and official datasets in Germany. They found that the building completeness of OSM datasets in Germany was only 30%. Hecht et al. [16] used the so-called “unit-based” and “object-based” approaches for assessing the building completeness of OSM datasets in two states of Germany (Rhine-Westphalia and Saxony). The unit-based approach denoted a comparison of building number or building area between the OSM and reference datasets; the object-based approach denoted the overlapped building area between OSM and reference datasets in proportion to the total building area of a reference dataset. Similar studies have also been carried out in the Canada [17], England [18], Germany [19,20,21,22], Iran [23], Italy [24], Switzerland [25] and United States [26,27,28,29], which all used either an authoritative or commercial dataset as the reference for assessing the completeness of an OSM dataset.
Reference datasets are not always available in practical applications. This is because they can be very expensive to purchase or have restrictions for usage. Some studies have therefore assessed OSM completeness without a reference dataset. For instance, Goodchild and Li [30] proposed three approaches (crowd-sourcing, social, and geographic) for quality assurance in VGI. Mocnik et al. [31] identified a variety of groundings (e.g., perception-based and data-based) used for measuring quality. Antoniou and Skopeliti [32] reviewed four types of quality indicators, i.e., data, demographic, socio-economic, and contributors’ indicators. Barron et al. [33] developed a framework, including 25 indicators (e.g., “Development of OSM Features and Tags” and “Completeness of House Numbers tagged to Buildings”) for OSM quality assessment, which can be solely based on analysis of historical data of an OSM dataset. Gröchenig et al. [34] used historical data to analyze OSM completeness. They found that while the OSM data in a region were almost complete, the increment of data in such a region was less than 3%. Fan [35] used “development of building count over time” which was also based on analyzing the historical data in OSM. Mobasheri et al. [36] analyzed the OSM sidewalk data by counting the number of road segments with/without a tag. Recently, Zhou [37] proposed using OSM building density as a proxy indicator to quantitatively estimate OSM building completeness. Zhou and Tian [38] also proposed three geometric indicators (i.e., area, perimeter, and density) for quantitatively estimating the completeness of street blocks in an OSM road dataset.
In addition to proposing quality indicators and approaches, some studies paid much more attention to the development or evolution of OSM dataset(s) in one or multiple specific regions, although the main purpose was still for the quality analysis. For instances, Neis et al. [39] analyzed the evolution of OSM road datasets in Germany between the years 2007-2011 and found that the OSM dataset even provided 27% more data than the commercial dataset in this region. Arsanjani et al. [40] developed a contribution index to also investigate the dynamism of the OSM dataset in Germany. Neis et al. [41] analyzed the development of OSM road datasets in 12 selected urban areas around the world over different years and found that socio-economic factors (e.g., income and population density) affected the completeness of an OSM dataset. Similar conclusions were also obtained by Zielstra and Zipf [42]. Corcoran et al. [43] analyzed the growth of three OSM road datasets in Ireland and explained the growth as two patterns, i.e. densification and exploration. Similar studies have also been carried out in China [44,45], although they all focused on OSM road networks. In addition, infrastructure was also described for understanding the OSM project [46].
The main objective of this study is to investigate the OSM building data in China for two main reasons. First, building datasets in China produced by authoritative mapping agencies or commercial companies are not freely available to the public. It is thus very desirable to employ some open datasets as alternatives, especially for researchers and educators who may care more about the quantity and/or quality rather than the specific region of a dataset. The OSM dataset may be used as it is freely available. Second, few studies have focused on analyzing the OSM building datasets in China. It is therefore interesting to investigate a variety of research issues, such as:
- Q1: How has the OSM building data in China developed in recent years?
- Q2: Which province- or prefecture-level division(s) has/have relatively more OSM building data?
- Q3: What is/are the potential factor(s) that affect the spatial distribution of OSM building data in China?
- Q4: Which grid cell(s) in urban areas has/have relatively higher OSM building density values?
- Q5: Is there any pattern for those high-density grid cells among different prefecture-level divisions?
The above research issues will be addressed in this study, in order to analyze the evolution (Q1) and completeness (Q2 and Q4), and also to understand the spatial patterns (Q3 and Q5) of the OSM building data in China, which may benefit users who choose appropriate OSM building dataset(s).
The aim of this study is to employ two existing quality indicators, OSM building count and OSM building density, for the analysis. More precisely, first of all, the numbers of OSM building data from 2012 to 2017 were calculated in terms of provincial- and prefecture-level divisions in China. Factors that may affect the development of the OSM building data in China were also analyzed. Then, a 1 × 1 km2 regular grid was further overlapped onto the OSM building datasets in urban areas, and those high-density grid cells (whose OSM building data were almost complete) were further extracted and analyzed.
The remainder of this article is structured as follows: Section 2 presents the quality indicators, methods, and steps for analyzing the evolution, completeness and spatial patterns of OSM building data in China; Section 3 describes the various datasets involved in this study; Section 4 analyzes the experimental results; and Section 5 concludes and discusses this study.
2. Methodology
2.1. Quality Indicators
2.1.1. OSM Building Count
OSM building count denotes the number of OSM buildings in a given region. Several studies [34,35] have proposed that the “development of building count over time” can be used for quality assessment of OSM building completeness. Theoretically, the OSM building count is positively correlated with the completeness of OSM building data in a region, although the former cannot specifically indicate a completeness value.
2.1.2. OSM Building Density
OSM building density denotes the total areas of OSM building data in a given region in proportion to the land area of such a region. This indicator has recently been promoted by Zhou [37] as a potential proxy for quantitative completeness estimation of OSM building data in urban areas. He found that the OSM building density is positively correlated with the completeness of OSM building data in urban areas. Therefore, the OSM building density indicator was also used. However, non-urban areas were not considered because a low density of OSM building data in non-urban areas may still be complete [37].
2.2. Methods and Steps
2.2.1. Analysis Based on OSM Building Count
The tenet of this method was to compare the OSM building counts across different years for analyzing the evolution (Q1), and also to compare those among different provincial- and prefecture-level divisions for analyzing the Q2. More precisely, the development of OSM building counts across different years (from 2012 to 2017) was calculated, in terms of provincial- and prefecture-level divisions. These years were considered because there were very few OSM building data (e.g., no more than 5,000) in each provincial- and prefecture-level division before 2012.
Factors that may influence the development (or the spatial distribution) of OSM building data in China were also analyzed (Q3). These included the gross domestic product (GDP), population, urban land area, and OSM road length. GDP and population were considered because previous studies [38,39] found that population and socio-economic factors may have an impact on the completeness of OSM data. Urban land area was considered because the building count is often positively correlated with the size of an urban area. OSM road length was also considered because the OSM project was initially developed for collecting road data all over the world, and thus we assumed that volunteers may begin to contribute other geographical data (e.g. buildings and land uses), while road data are relatively complete.
The analysis based on OSM building count included the following steps:
- Step 1: Intersect the OSM building dataset for each year with provincial- and prefecture-level administrative datasets, respectively.
- Step 2: Calculate the OSM building count in each provincial- or prefecture-level division.
- Step 3: Compare the OSM building counts among different provincial- or prefecture-level divisions across different years (2012–2017).
- Step 4: Calculate the correlations between the OSM building count and the four factors (GDP, population, urban land area, and OSM road length) in terms of provincial- and prefecture-level divisions for different years.
2.2.2. Analysis Based on OSM Building Density
The tenet of this method was to compare the OSM building density values based on a smaller analysis unit (1 × 1 km2 grid) across different years for analyzing the evolution (Q1), and also to compare among different grid cells for analyzing the completeness in urban areas (Q4). This method was somehow implemented by following the steps proposed by Zhou [37], however, the correlation between the density and completeness of OSM building data was first validated with several study cases in China. The specific steps are listed as follows:
- Step 1: Create a 1 × 1 km2 grid across each urban area in China.
- Step 2: Calculate the OSM building density and completeness values for each grid cell (here, the OSM building completeness denotes the ratio of the total area of OSM building data to that of corresponding reference building data in each grid cell).
- Step 3: Plot the relationship between OSM building density and completeness for all the grid cells in each urban area.
Rather than applying the above relationship to estimate the OSM building completeness for all the grid cells, only those grid cells whose OSM building density was either smaller or larger than a certain threshold were analyzed. Otherwise, the estimation error may increase dramatically, as discussed by Zhou [37]. More precisely,
- Step 4: Calculate the percentage of grid cells whose OSM building density equals 0%, indicating that the corresponding OSM building completeness is also 0%, or there are no buildings in such grid cells. Calculate the percentage of grid cells whose OSM building density is larger than a certain threshold (this threshold can be determined as the inverse of the slope of the relationship obtained in Step 3), to find out which grid cells have relatively higher density values or tend to be complete.
- Step 5: Compare the percentages of grid cells in urban areas with different OSM building density ranges across different years.
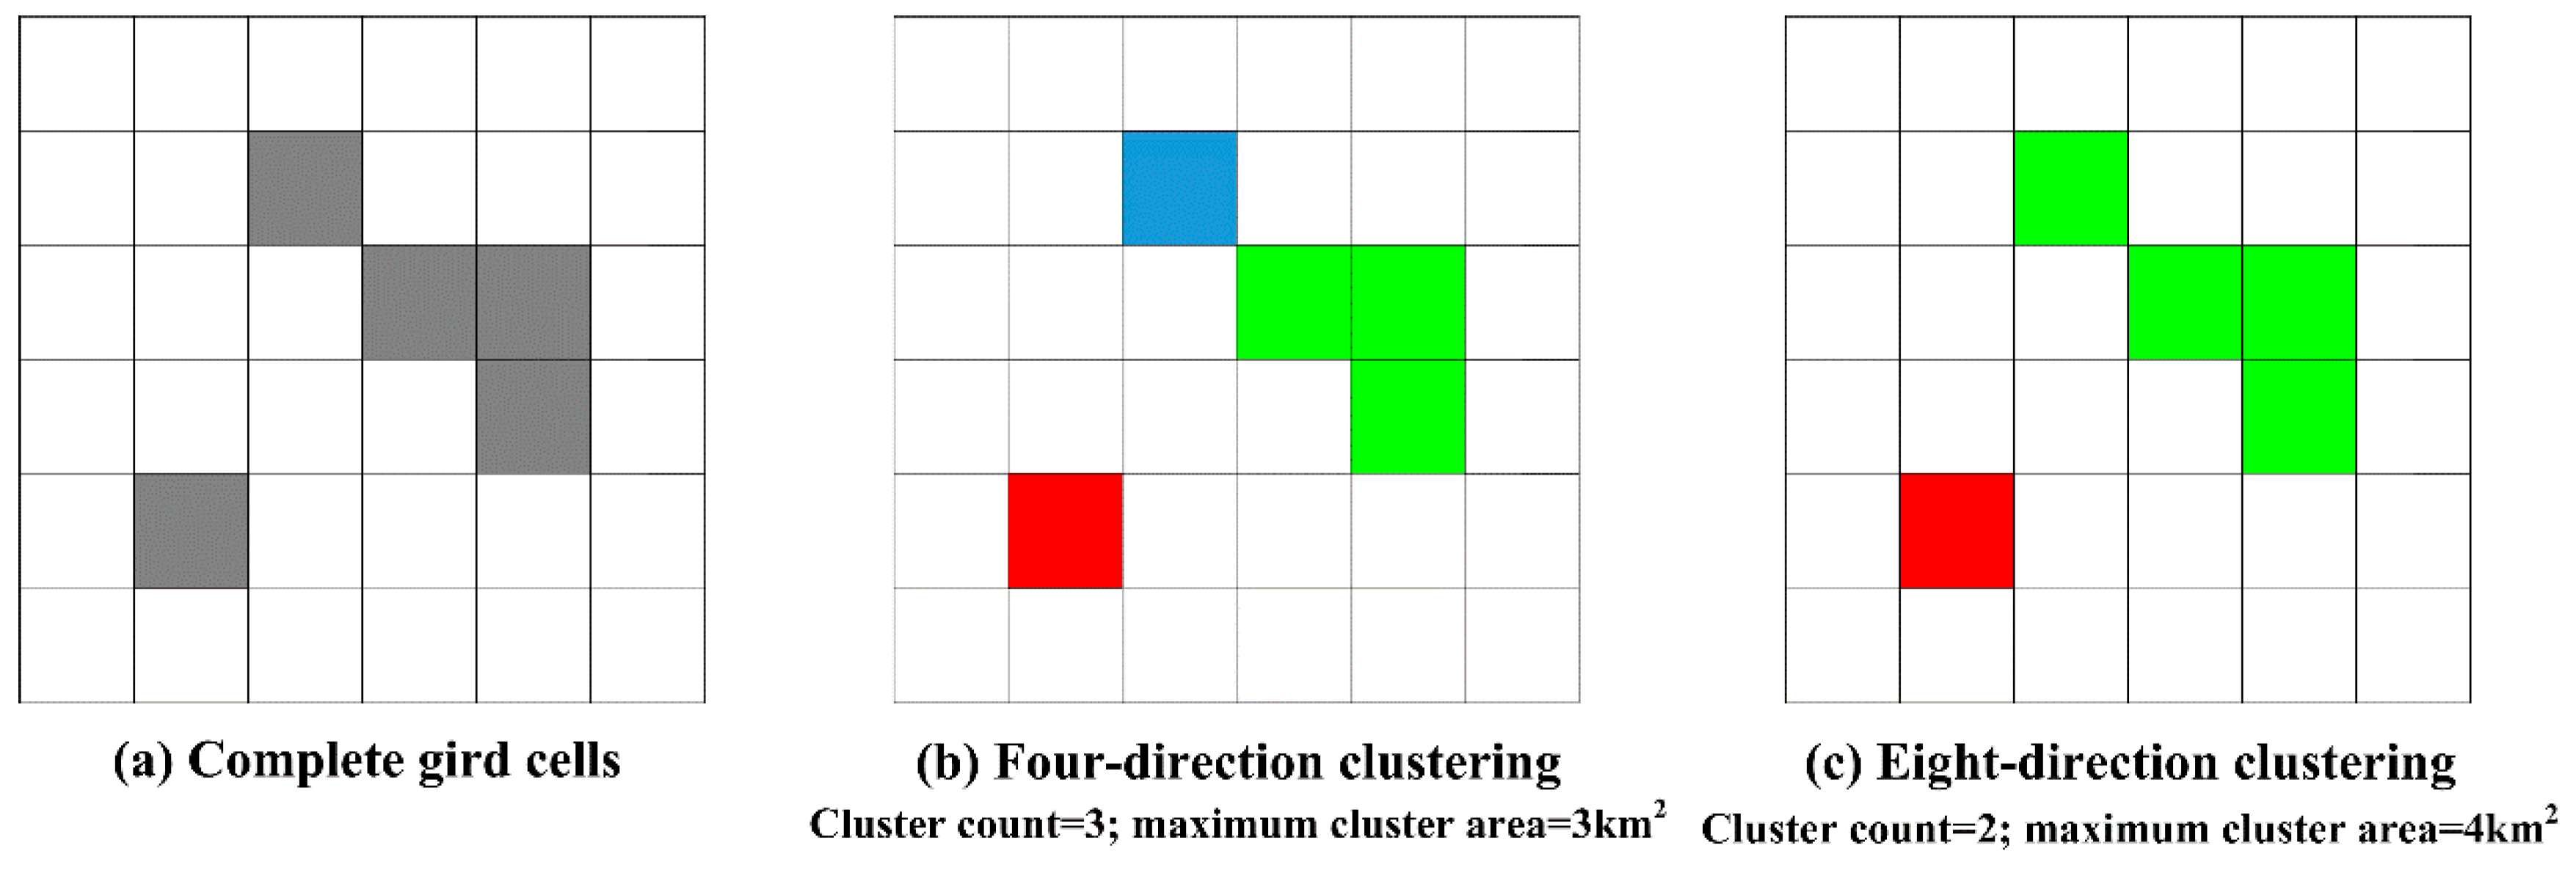
A clustering approach is proposed to analyze the spatial pattern of those grid cells (called high-density grid cells) whose density values larger than a certain threshold (Q5). The aim of this approach is to group neighboring high-density grid cells into a cluster (Figure 1). Neighboring high-density grid cells were found by searching in either the four-direction clustering or the eight-direction clustering from an original high-density grid cell. After clustering, the number of clusters and the maximum area of a cluster was calculated for all the urban areas in each prefecture-level division. Finally, the above two measures (cluster count and maximum cluster area) were compared among different prefecture-level divisions, for which there was at least a single cluster.
3. Data
Mainland China (excluding Hong Kong, Macao, Taiwan and the islands in the South China Sea) was used for analysis. The datasets involved in this study were as follows:
- (1)
- OSM datasets: Buildings and roads in the OSM datasets of China for 6 years (2012–2017) were obtained from http://download.geofabrik.de/index.html. Each OSM dataset was obtained for the last month (December) of each year.
- (2)
- Administrative datasets: Provincial- and prefecture-level administrative datasets were downloaded from http://www.gadm.org. A total of 34 provincial-level divisions and 334 prefecture-level divisions in China were used in the analysis.
- (3)
- Land-use/cover datasets: Globe land-cover/use datasets at 30 m resolution were downloaded (http://globallandcover.com) and “artificial surface” was viewed as the urban areas.
- (4)
- Socio-economic data: Three types of socio-economic data (population, GDP, and urban land area in terms of provincial- and prefecture-level divisions) across different years were acquired from the National Bureau of Statistics in China (http://www.stats.gov.cn).
4. Results and Discussions
4.1. Analyses Based on OSM Building Count
Figure 2 shows the development of OSM building counts in China from 2012 to 2017. In 2012, there were 38,928 OSM buildings, but this value increased to 755,376 by the end of 2017, almost 20 times that in 2012. This demonstrates that the OSM building data have significantly developed in recent years.
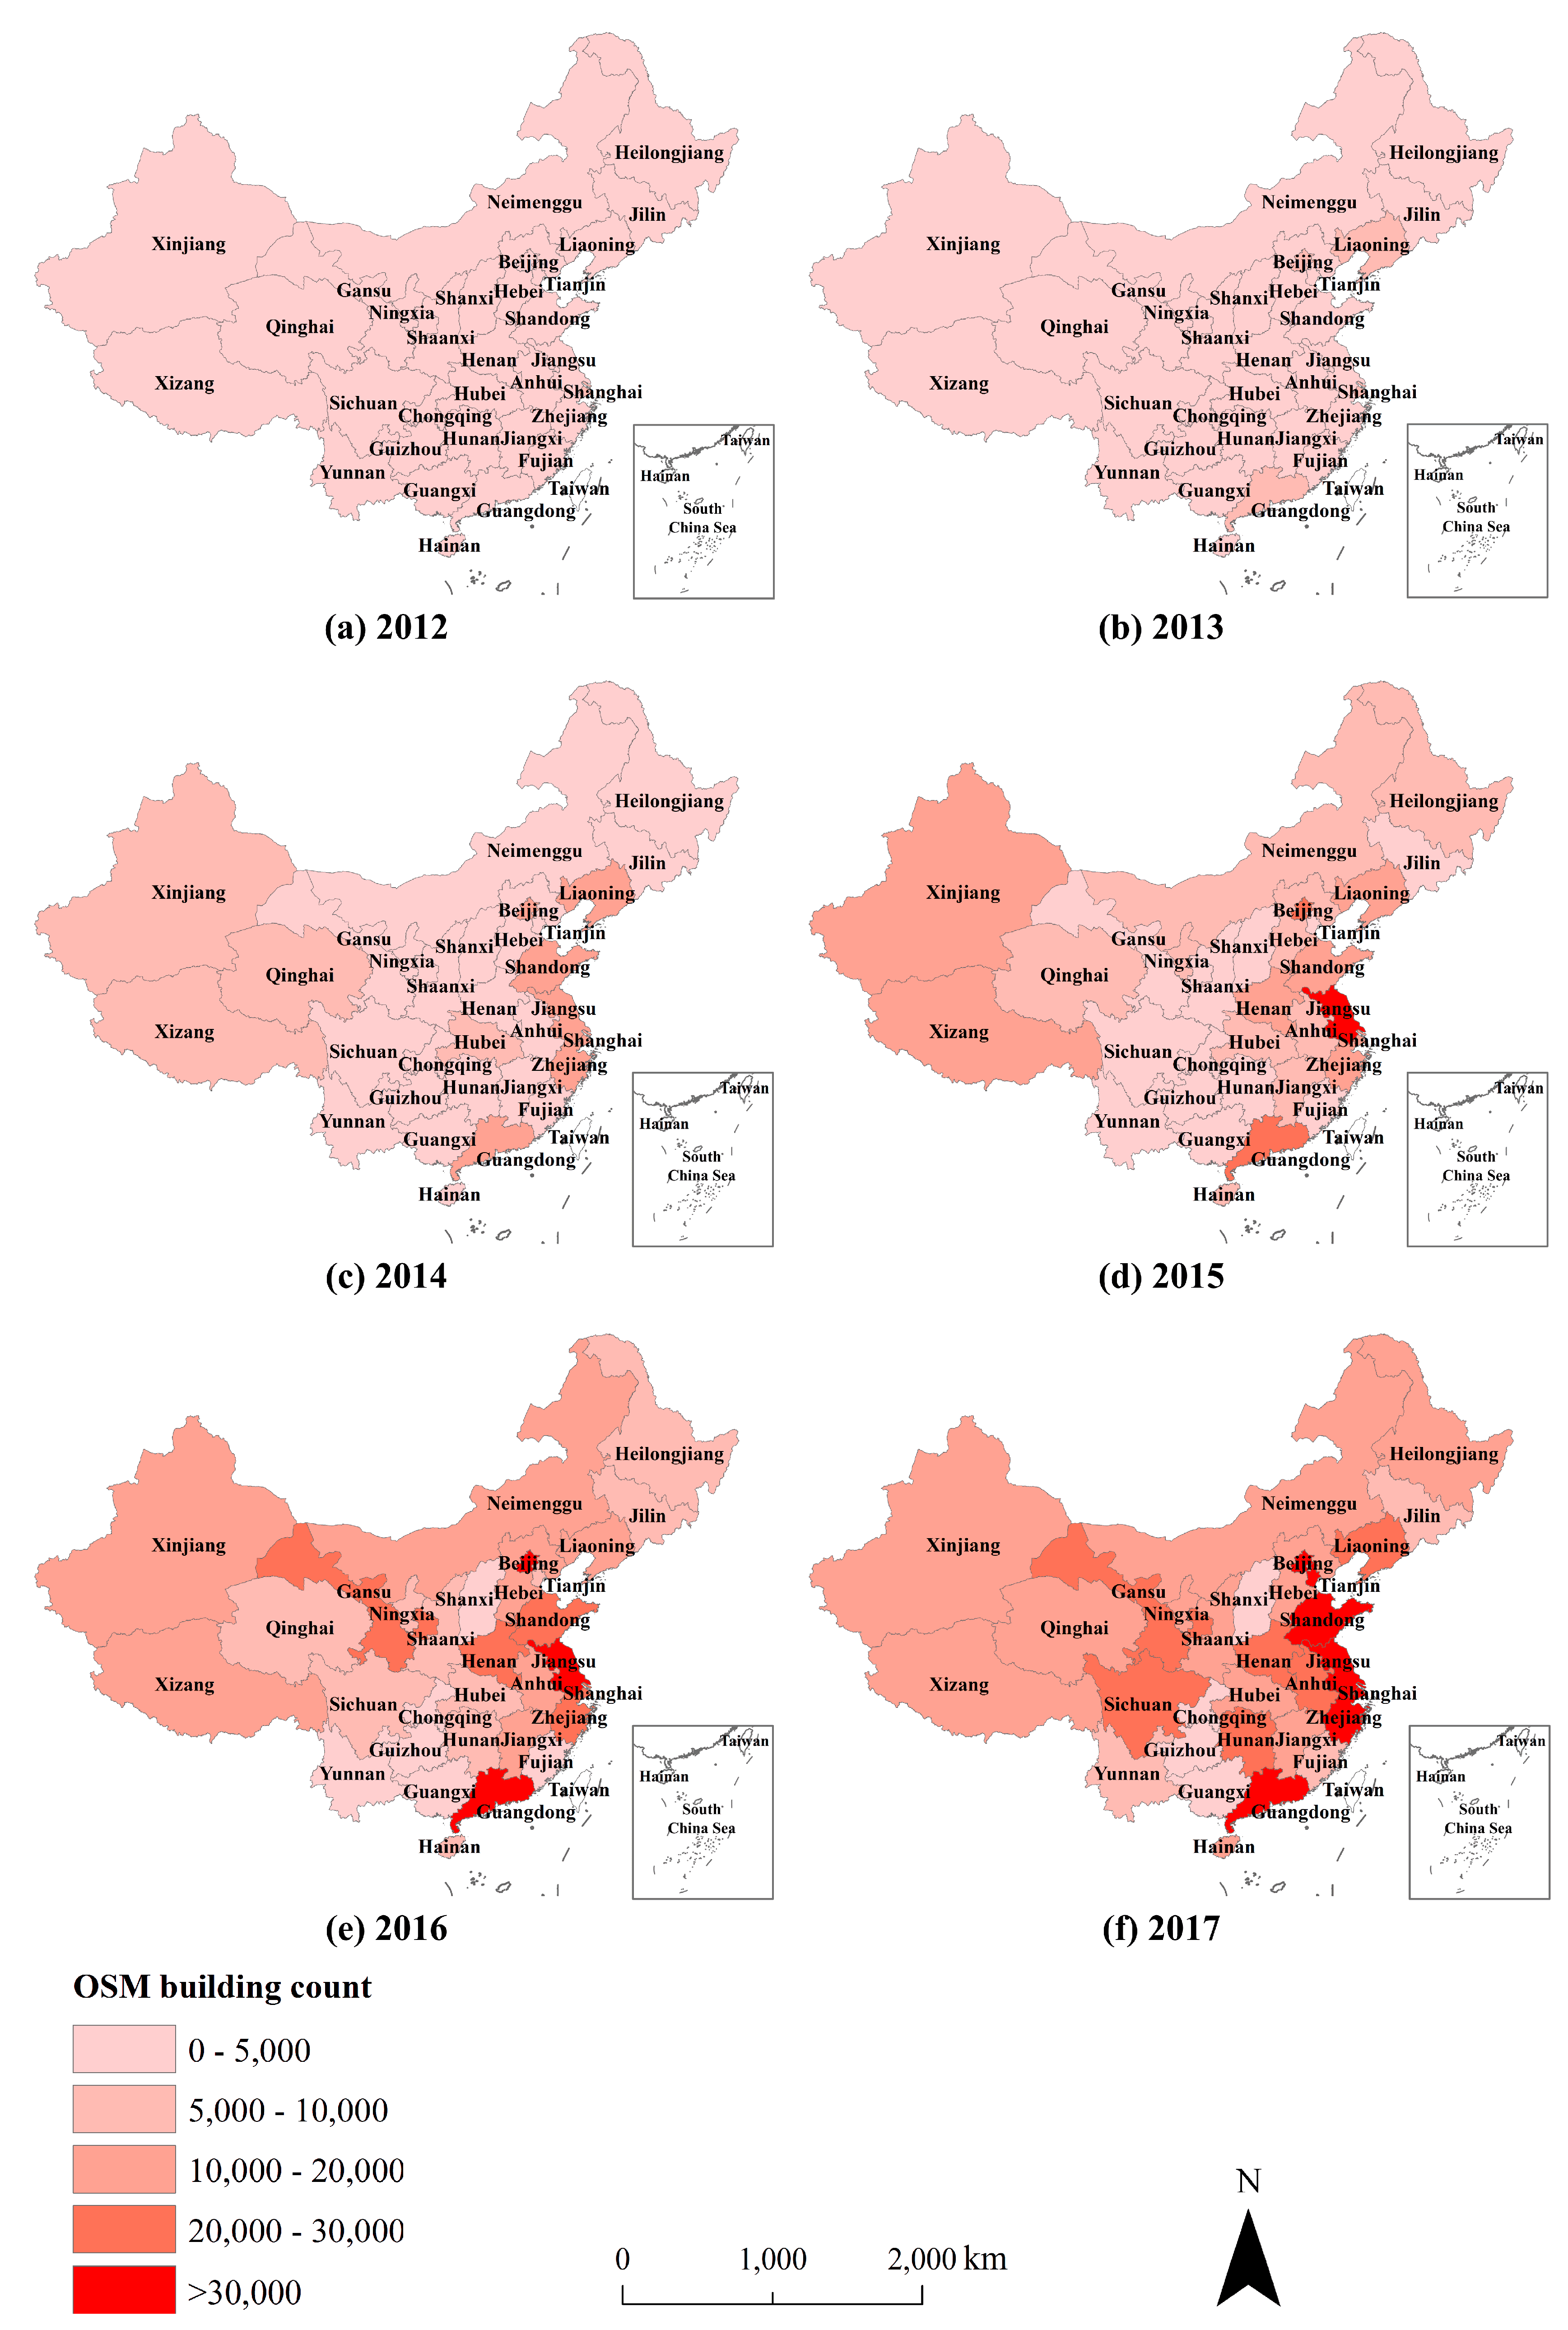
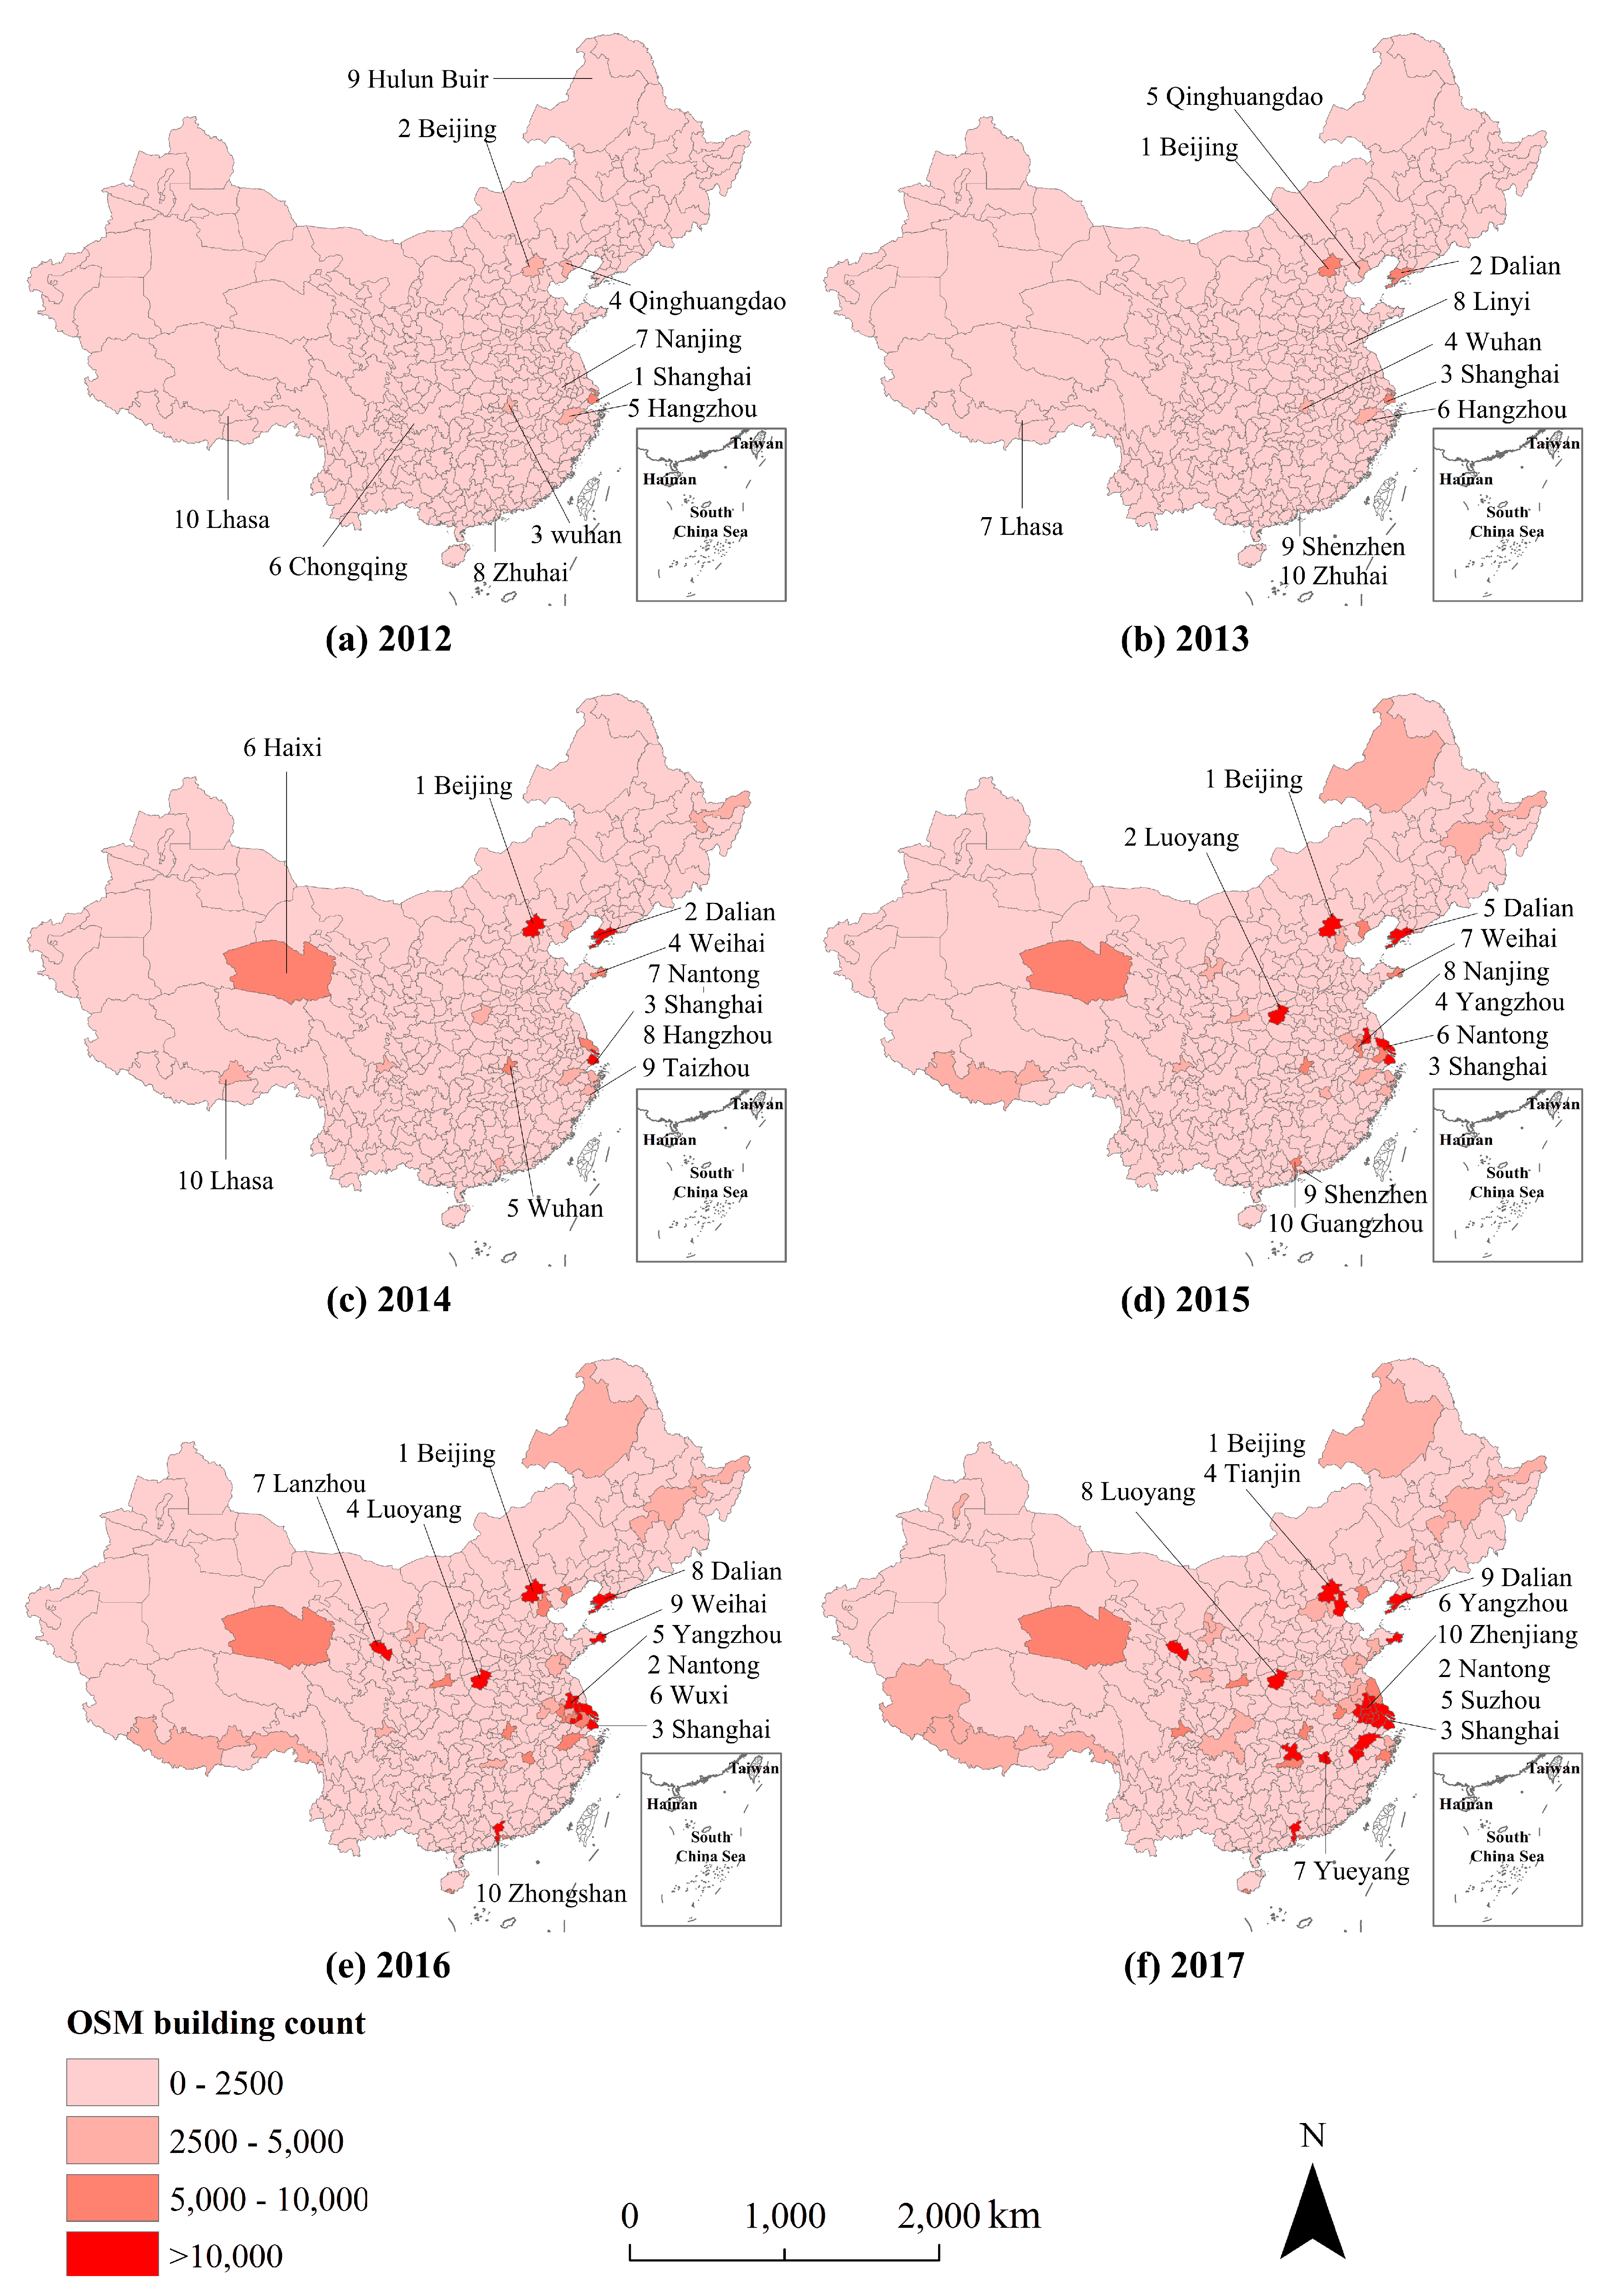
Figure 3 and Figure 4 show the number distributions of OSM building data for provincial- and prefecture-level divisions in China from 2012 to 2017.
- (1)
- For most provincial-level divisions, the number of OSM building data was less than 5000 in 2012. However, for 7 out of 34 provincial-level divisions, the number was 30,000 and higher by 2017. These provinces (Shandong, Jiangsu, Zhejiang, Guangdong, Beijing, Shanghai, and Tianjin) were all located on the eastern coast of China. The heterogeneous distribution of OSM building data in China is evident. For example, by the end of 2017, the number of OSM building data was 175,215 in Jiangsu, and only 1463 in Guizhou.
- (2)
- The number of OSM building data was less than 2500 in 2012 for 329 out of the 334 prefecture-level divisions in China. However, the number for 21 prefecture-level divisions, mostly located on the eastern coast of China, was greater than 10,000 in 2017. Although the number of OSM building data in Beijing exceeded 40,000, those for 83% of prefecture-level divisions were still less than 2500.
Table 1 lists the correlations among OSM building count and four potential factors (GDP, population, urban land area, and OSM road length) for provincial- and prefecture-level divisions in China.
Table 1 shows that in most cases, GDP and OSM road length have moderate correlations with the number of OSM building data for either provincial- or prefecture-level divisions in China. Indeed, most OSM building data were located in the relatively developed regions (e.g., eastern coast) of China, as shown in Figure 3 and Figure 4. This is probably because there are not only much more buildings in total, but also more high-income and internet users in relatively developed regions of China. Interestingly, OSM road length was also positively correlated with the number of OSM building data. One possible reason is that the longer the OSM road length in a region, the more complete the OSM road data in such a region, where volunteers begin to contribute other geographical data (e.g., building data).
4.2. Analyses Based on OSM Building Density
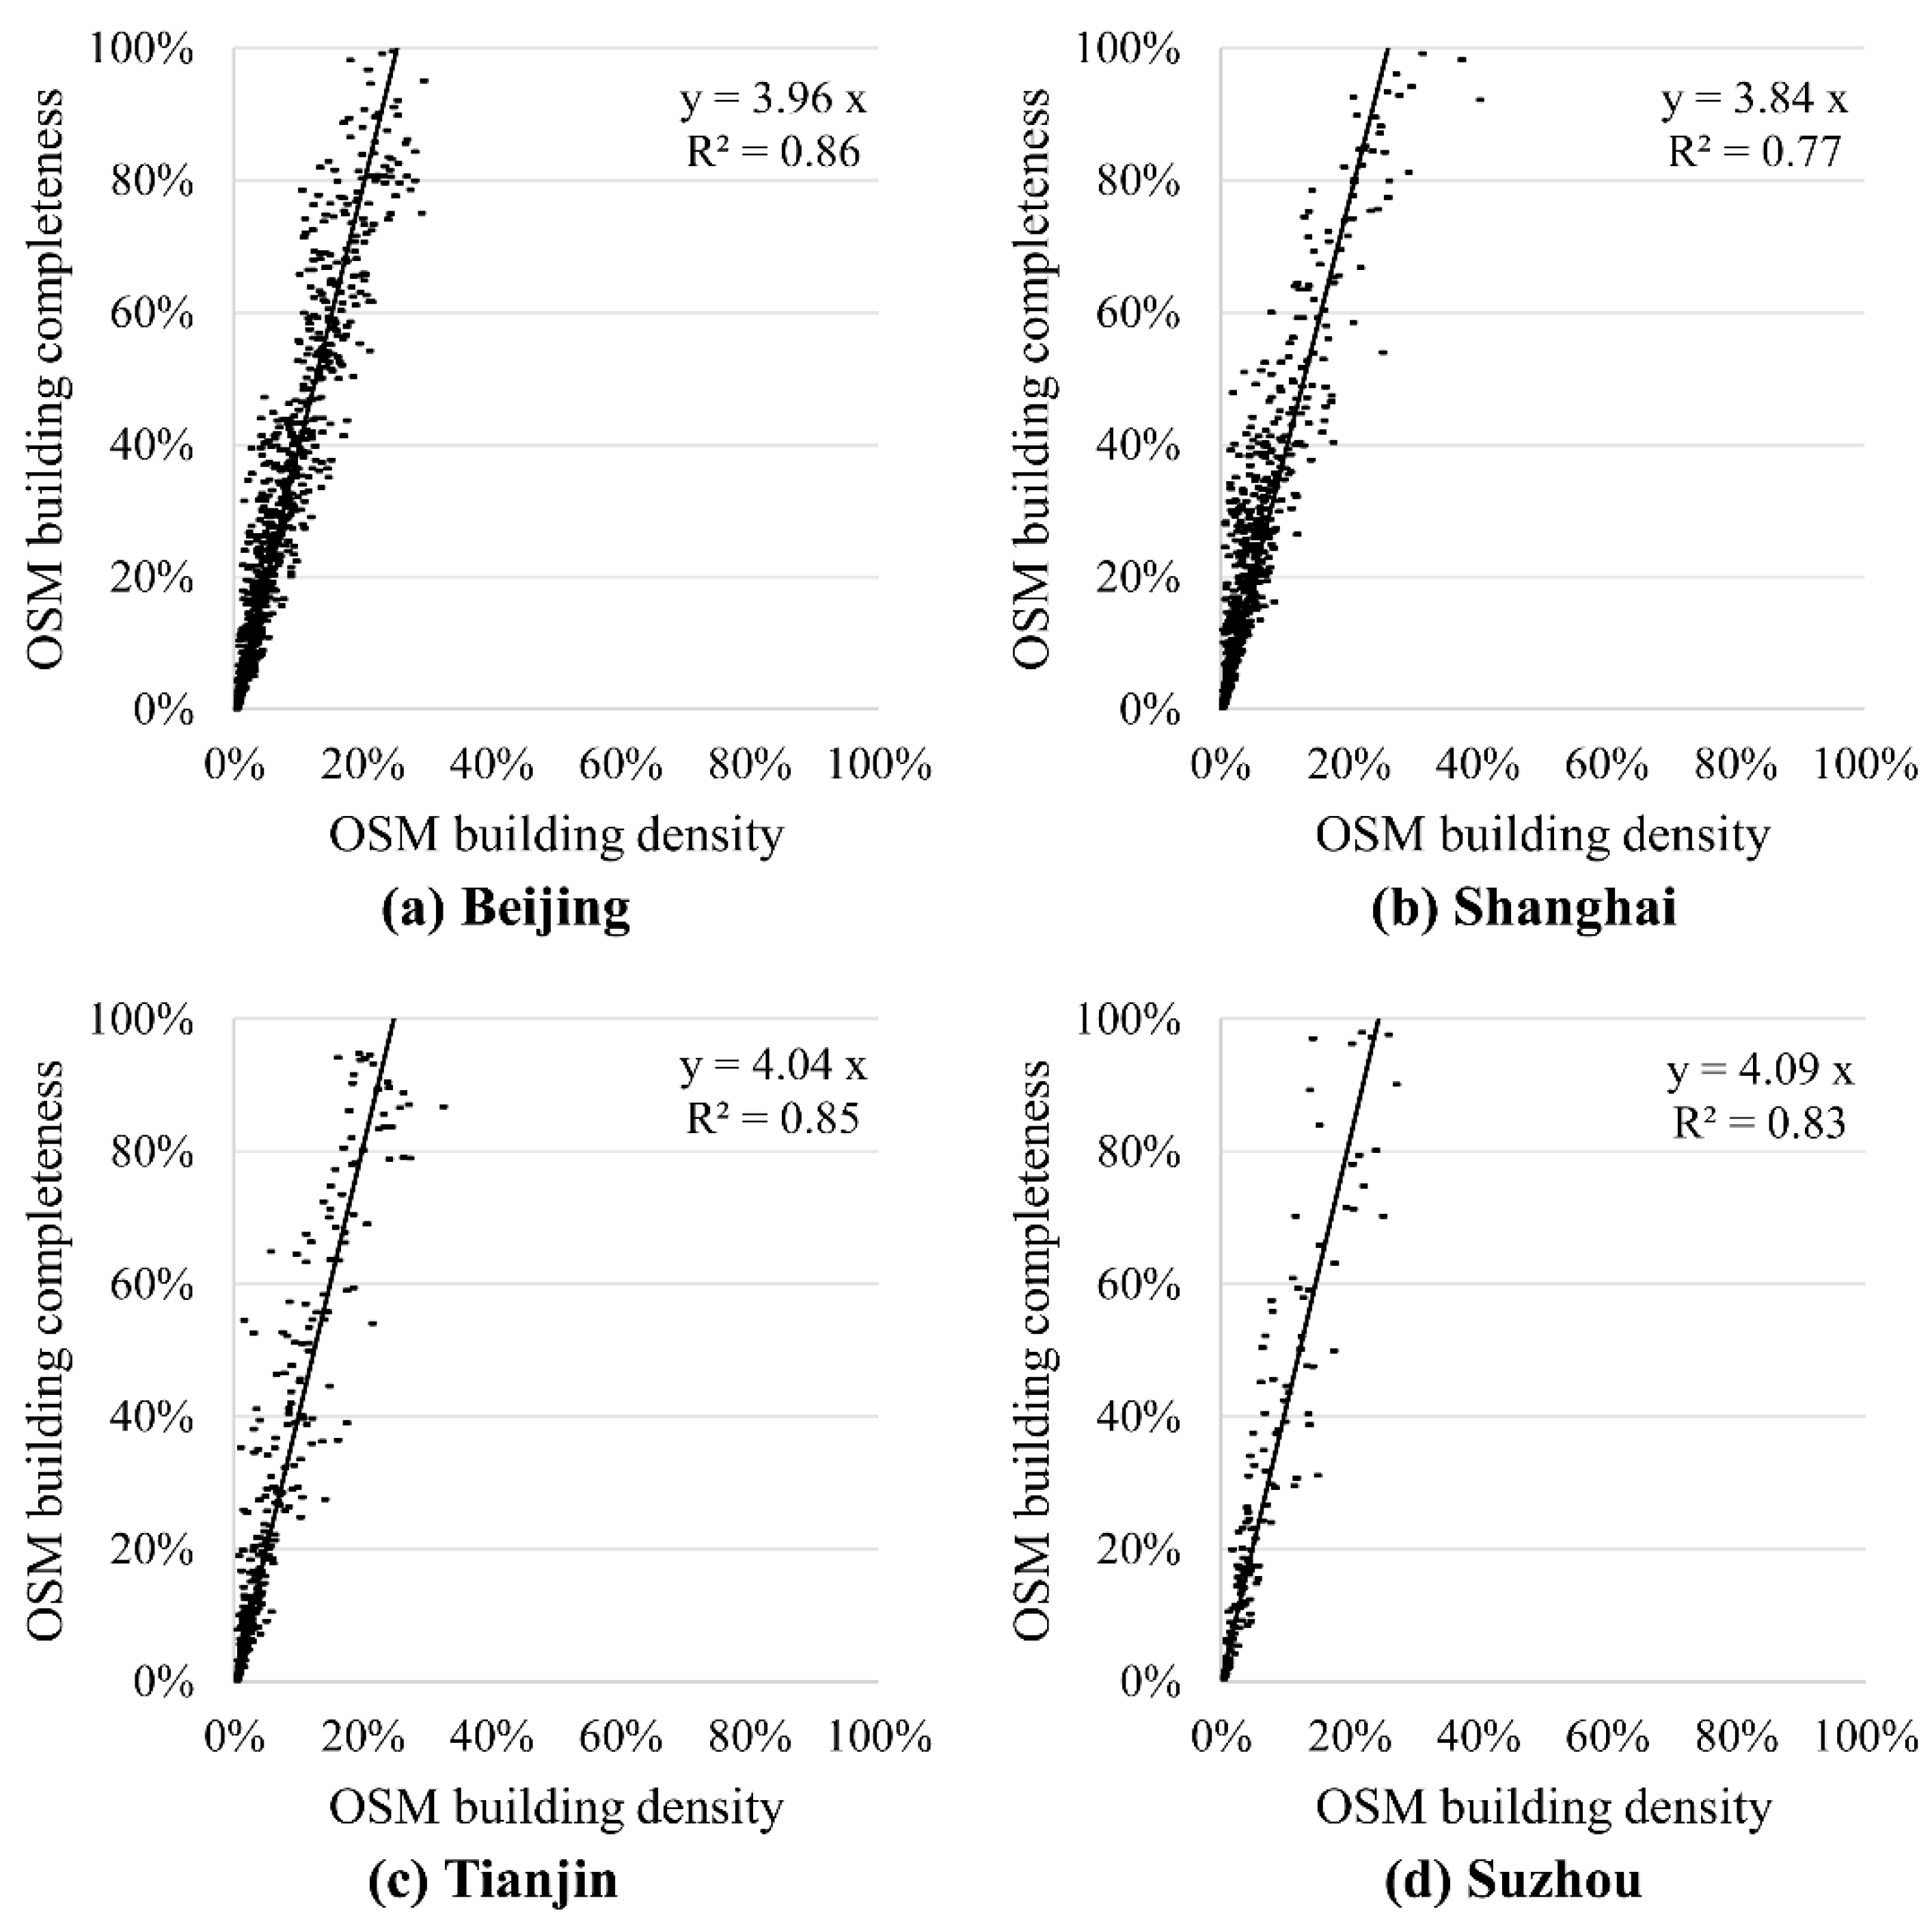
Four metropolises in China (Beijing, Shanghai, Tianjin, and Suzhou) were used to investigate the relationship between OSM building density and OSM building completeness. They were chosen because the corresponding reference building data were available. Figure 5 plots the line correlations for these four metropolises. It can be seen in the figure that the slope varies from 3.84 to 4.09, which is almost consistent with that (3.4–4.0) found by Zhou [37]. It can be inferred from these line correlations that OSM building data in a grid cell tend to be complete, while OSM building density of this grid cell is higher than 25%. Therefore, 25% was used as a threshold to determine high-density grid cells, in spite of the fact that some low-density grid cells may still be complete [37].
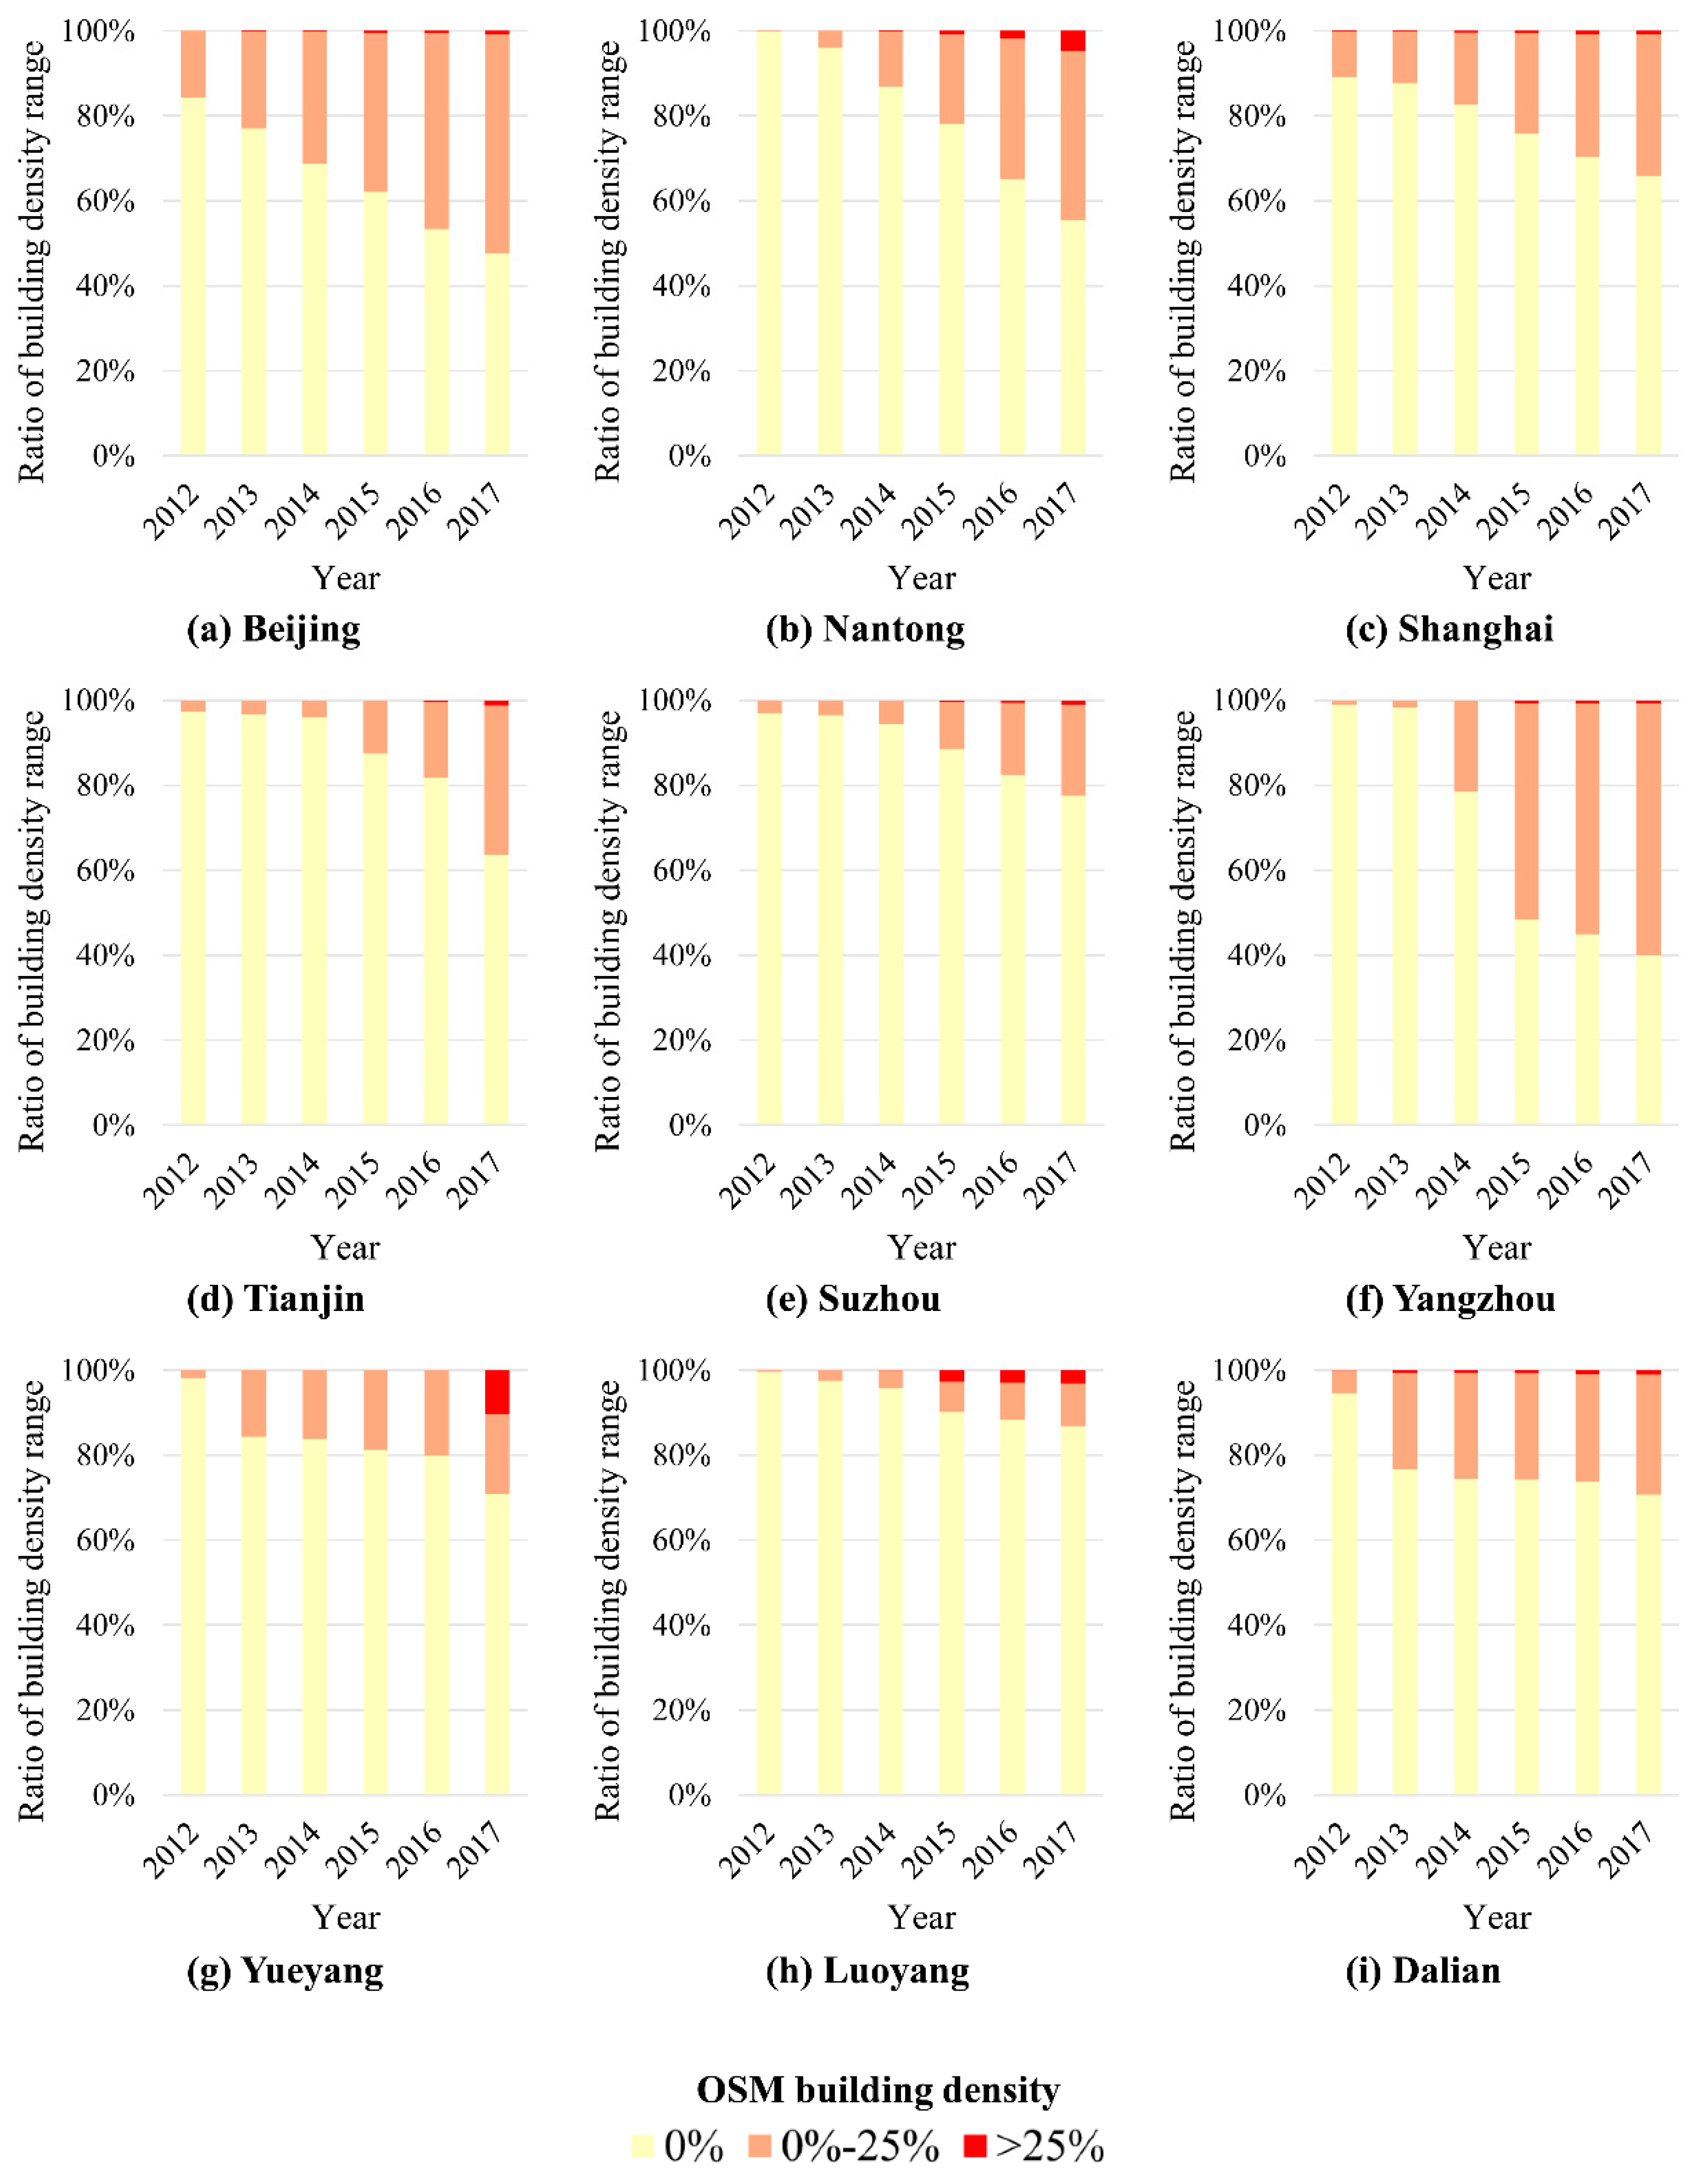
Figure 6 plots OSM building densities for nine prefecture-level divisions from 2012 to 2017. The x-axis denotes the year, and the y-axis denotes the number of grid cells within a certain building density range in proportion to the total number of grid cells completely located within urban areas in each prefecture-level division. These divisions were chosen because they were ranked top in terms of OSM building count.
Figure 6 shows that the number of grid cells whose OSM building density equaled 0% decreased from 2012 to 2017. Conversely, the number of grid cells whose OSM building density was larger than 0% increased. This indicates an increase of OSM building data in China over the years. Nevertheless, by the end of 2017, 40–70% of grid cells had an OSM building density equal to 0%, even for the nine prefecture-level divisions with the largest numbers of OSM building data. Moreover, less than 10% of grid cells had an OSM building density larger than 25%. This indicates that the OSM building data in China are still far from complete.
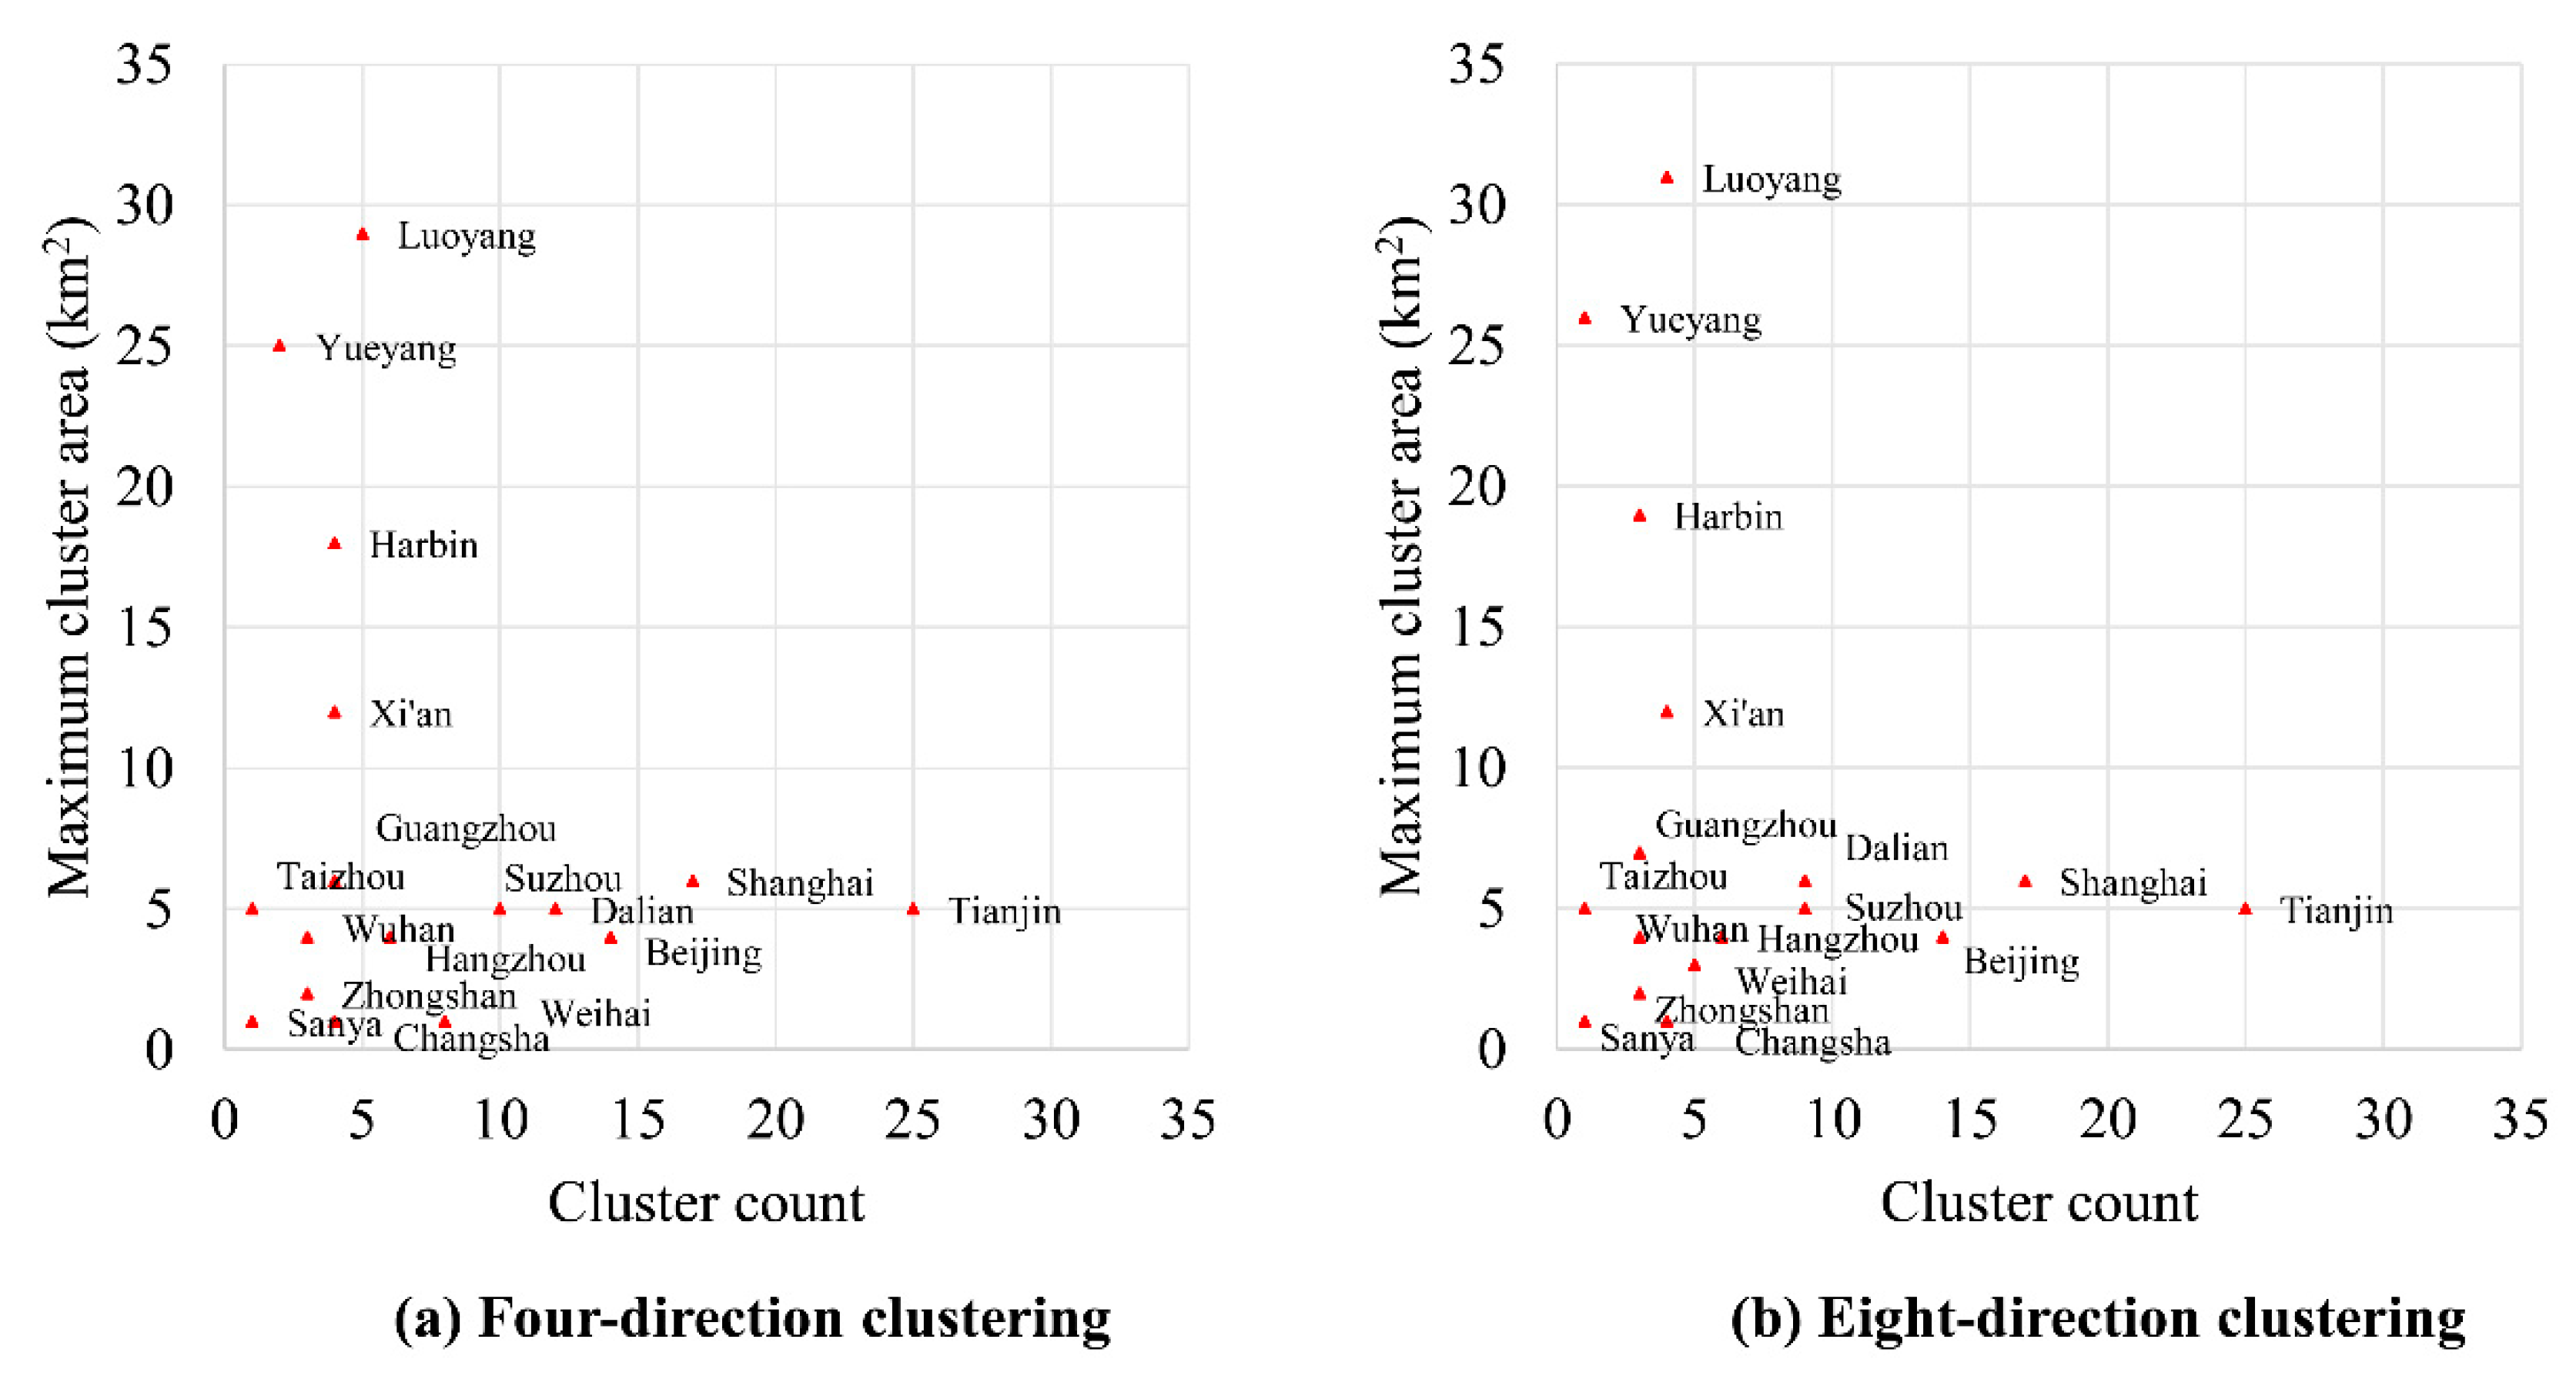
Figure 7 plots the relationships between the cluster count and maximum cluster area, using the clustering approach proposed in Section 3 for two different cases. Figure 7 shows that for most prefecture-level divisions, the cluster count was no more than five, and the maximum cluster area was smaller than 5 km2. However, for some prefecture-level divisions (e.g., Beijing, Shanghai, Tianjin, Dalian, and Suzhou), the cluster count was much larger than 5. Conversely, for others (e.g., Luoyang, Yueyang, Harbin, and Xi'an), the maximum cluster area was much larger than 5 km2. This indicates that the spatial distribution pattern of high-density grid cells varied among different prefecture-level divisions.
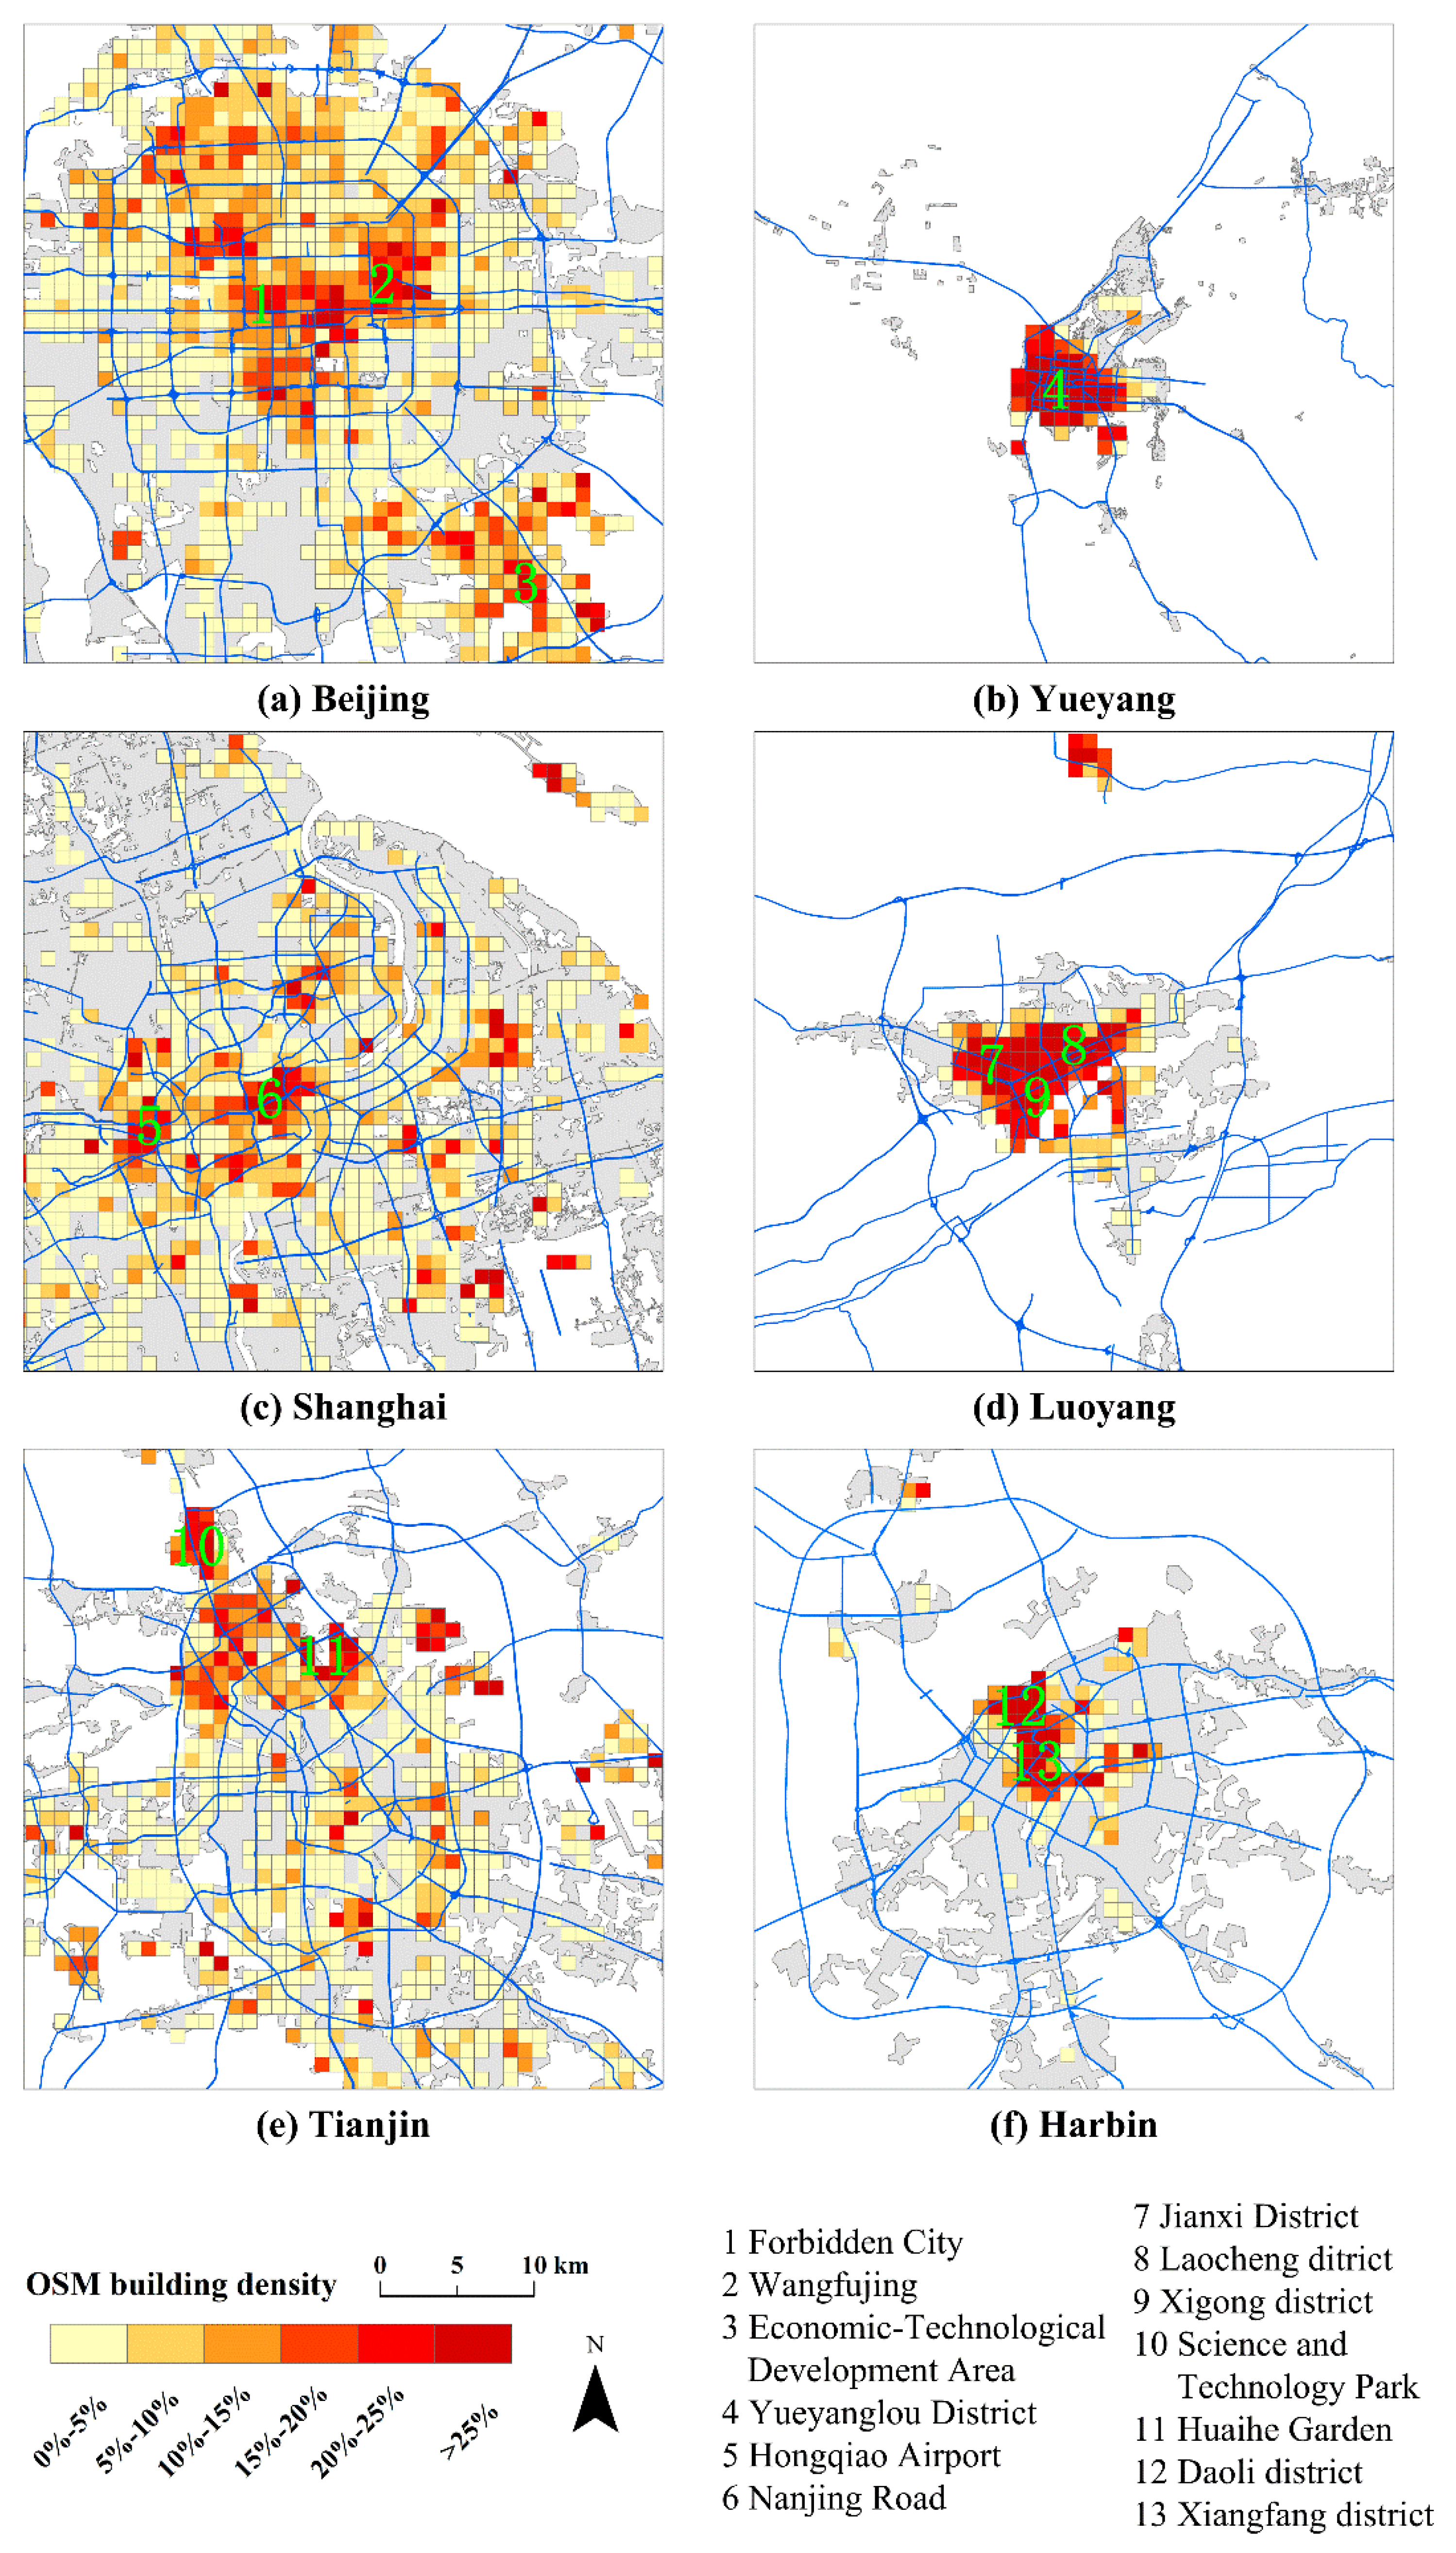
Figure 8 shows the density distributions of OSM building data for six typical metropolises in China, for the year 2017. It can be seen in this figure that in Beijing, Shanghai, and Tianjin (Figure 8a,c,e), most grid cells whose OSM building density was larger than 25% were dispersedly located in shopping centers (e.g., 2-Wangfujing in Figure 8a and 6-Nanjing Road in Figure 8c), tourist centers (e.g., 1-Forbidden City in Figure 8a and 11-Huaihe Garden in Figure 8e), or transportation centers (e.g., 5-Hongqiao Airport). In Luoyang, Yueyang, and Harbin, on the contrary, most grid cells whose OSM building density was larger than 25% were aggregated inside the core of urban areas (e.g., 4-Yueyang Lou district in Figure 8b, 8-Laocheng district in Figure 8d, and 12-Daoli district in Figure 8f). The reason for the different spatial distribution modes of high-density grid cells is probably due to the single- or multi-centers of different metropolises.
5. Conclusions
This study has analyzed the evolution, completeness and spatial patterns of the OSM building data in China. This may benefit users who obtain free building datasets in China because authorized building datasets in this country are not freely available. Two existing indicators (OSM building count and OSM building density) were employed. The numbers of OSM building data (or OSM building count) in different provincial- and prefecture-level divisions from 2012 to 2017 were analyzed on the spatial scale and in the temporal dimension. Four potential factors (GDP, population, urban land area, and OSM road length) that may affect the development of OSM building data were also investigated. The percentages of different density ranges (0%, 0–25%, >25%) in urban areas were calculated for several typical prefecture-level divisions, and a clustering approach was proposed to analyze the spatial distribution of grid cells whose density values were relatively higher (called high-density grid cells).
The results of this study have demonstrated that:
- (1)
- The OSM building data in China increased by almost 20 times from 2012 to 2017, especially for those regions located on the eastern coast of China. In most cases, the GDP and OSM road length factors had a moderate correlation with OSM building count.
- (2)
- Most grid cells in urban areas still have no buildings or their building density is equal to 0%, which indicates that the OSM building dataset in China is far from being complete. From analyzing the high-density grid cells, two typical spatial distribution modes (dispersion and aggregation) were found in multiple prefecture-level divisions.
The above results may benefit users (especially researchers and educators) who choose appropriate OSM building dataset(s) in China as study area(s). For instance, the provinces and prefecture-level divisions located on the eastern coast (or relatively developed regions) of China may be preferred because there are more OSM building data in these regions. Users may also refer to the spatial distribution modes of different metropolises in Figure 7 and Figure 8 to choose OSM building dataset(s) in hot spot(s) (e.g., shopping, tourist and/or transportation centers), or those with relatively larger cluster areas. More importantly, the proposed approach may be used for continually extracting high-density grid cells, as OSM building data is still being updated. Moreover, volunteers around the world may be motivated to contribute more OSM building data in various regions (e.g., those provinces or prefecture-level divisions that have very few OSM building data, or those grid cells that do not have any OSM building data) of China.
There are some limitations of this study, however. First, specific completeness values for those provincial- and prefecture-level divisions in China were not given out, because the total building numbers for various divisions were unknown. Besides, there was not any evidence that the OSM building count can be used for quantitative completeness estimation of OSM building data, and this is also the case for the OSM building area indicator. Second, rural areas were excluded using the OSM building density for analysis, because this indicator is not suitable for analyzing in rural areas [37]. Therefore, in future work, there is still a need to develop quality indicators for quantitative completeness estimation of OSM building data, especially in rural areas. One possible alternative is to consider not only geometric indicators (e.g., OSM building count, area and/or density), but also socio-economic indicators (e.g., population and/or income). It would also be interesting to investigate other quality measures (e.g., positional accuracy and semantic accuracy) or geographical features (e.g., railways, land uses, and points of interest) in China’s OSM dataset.
Author Contributions
Q.Z. contributed to conceive and design this study; Y.T. performed the experiment. Y.T. and X.F. analyzed the results. Y.T. wrote the manuscript and Q.Z. revised the manuscript.
Funding
This project was supported by the National Natural Science Foundation of China (Nos. 41771428 and 71874165), China Institute of Geo-Environment Monitoring (No. 0001212016CC60013), Fundamental Research Funds for the Central Universities, China University of Geosciences (Wuhan), and Open Research Fund of Teaching Laboratory, China University of Geosciences (Wuhan).
Acknowledgments
The authors want to thank the OpenStreetMap © contributors for making available as open their databases. We also express special thanks to all the editors and anonymous reviewers for their careful work and thoughtful suggestions that have helped improve this paper substantially.
Conflicts of Interest
The authors declare no conflict of interest.
References
- Goodchild, M.F. Citizens as sensors: The world of volunteered geography. GeoJournal 2007, 69, 211–221. [Google Scholar] [CrossRef]
- Zielstra, D.; Hochmair, H. Using free and proprietary data to compare shortest-path lengths for effective pedestrian routing in street networks. Transp. Res. Rec. J. Transp. Res. Board 2012, 2299, 41–47. [Google Scholar] [CrossRef]
- Bakillah, M.; Lauer, J.; Liang, S.H.L.; Zipf, A.; Jokar Arsanjani, J.; Mobasheri, A.; Loos, L. Exploiting big VGI to improve routing and navigation services. In Big Data Techniques and Technologies in Geoinformatics; CRC Press: Boca Raton, FL, USA, 2014; pp. 177–192. [Google Scholar]
- Meier, P. Crisis mapping in action: How open source software and global volunteer networks are changing the world, one map at a time. J. Map Geogr. Libr. 2012, 8, 89–100. [Google Scholar] [CrossRef]
- Zook, M.; Graham, M.; Shelton, T.; Gorman, S. Volunteered geographic information and crowdsourcing disaster relief: A case study of the Haitian earthquake. World Med. Health Policy 2010, 2, 7–33. [Google Scholar] [CrossRef]
- Over, M.; Schilling, A.; Neubauer, S.; Zipf, A. Generating web-based 3D city models from OpenStreetMap: The current situation in Germany. Comput. Environ. Urban Syst. 2010, 34, 496–507. [Google Scholar] [CrossRef]
- Goetz, M. Towards generating highly detailed 3D CityGML models from OpenStreetMap. Int. J. Geogr. Inf. Sci. 2013, 27, 845–865. [Google Scholar] [CrossRef]
- Arsanjani, J.J.; Helbich, M.; Bakillah, M.; Hagenauer, J.; Zipf, A. Toward mapping land-use patterns from volunteered geographic information. Int. J. Geogr. Inf. Sci. 2013, 27, 2264–2278. [Google Scholar] [CrossRef]
- Goodchild, M.F. Assertion and authority: The science of user-generated geographic content. In Proceedings of the Colloquium for Andrew U. Frank’s 60th Birthday; Vienna University of Technology: Vienna, Austria, 2008. [Google Scholar]
- Haklay, M. How good is volunteered geographical information? A comparative study of OpenStreetMap and Ordnance Survey datasets. Environ. Plan. B Plan. Des. 2010, 37, 682–703. [Google Scholar] [CrossRef]
- Skopeliti, A.; Antoniou, V.; Bandrova, T. Visualisation and communication of VGI quality. In Mapping and the Citizen Sensor; Ubiquity Press: London, UK, 2017; pp. 197–222. [Google Scholar]
- Senaratne, H.; Mobasheri, A.; Ali, A.L.; Capineri, C.; Haklay, M. A review of volunteered geographic information quality assessment methods. Int. J. Geogr. Inf. Sci. 2017, 31, 139–167. [Google Scholar] [CrossRef]
- Nasiri, A.; Abbaspour, R.A.; Chehreghan, A.; Jokar Arsanjani, J. Improving the quality of citizen contributed geodata through their historical contributions: The case of the road network in OpenStreetMap. ISPRS Int. J. Geo-Inf. 2018, 7, 253. [Google Scholar] [CrossRef]
- Girres, J.F.; Touya, G. Quality assessment of the French OpenStreetMap dataset. Trans. GIS 2010, 14, 435–459. [Google Scholar] [CrossRef]
- Goetz, M.; Zipf, A. OpenStreetMap in 3D–detailed insights on the current situation in Germany. In Proceedings of the 15th AGILE International Conference on Geographic Information Science, Avignon, France, 24–27 April 2012. [Google Scholar]
- Hecht, R.; Kunze, C.; Hahmann, S. Measuring completeness of building footprints in OpenStreetMap over space and time. ISPRS Int. J. Geo-Inf. 2013, 2, 1066–1091. [Google Scholar] [CrossRef]
- Tenney, M. Quality evaluations on Canadian OpenStreetMap data. In Proceedings of the Spatial Knowledge and Information, Banff, AB, Canada, 7 February 2014. [Google Scholar]
- Fram, C.; Chistopoulou, K.; Ellul, C. Assessing the quality of OpenStreetMap building data and searching for a proxy variable to estimate OSM building data completeness. In Proceedings of the 23rd GIS Research UK (GISRUK) Conference, Leeds, UK, 15–17 April 2015; pp. 195–205. [Google Scholar]
- Törnros, T.; Dorn, H.; Hahmann, S.; Zipf, A. Uncertainties of completeness measures in OpenStreetMap—A case study for buildings in a medium-sized German city. In Proceedings of the ISPRS Annals of the Photogrammetry, Remote Sensing and Spatial Information Sciences, La Grande Motte, France, 28 September–3 October 2015; Volume II-3/W5, pp. 353–357. [Google Scholar]
- Dorn, H.; Törnros, T.; Zipf, A. Quality evaluation of VGI using authoritative data—A comparison with land use data in Southern Germany. ISPRS Int. J. Geo-Inf. 2015, 4, 1657–1671. [Google Scholar] [CrossRef]
- Arsanjani, J.J.; Mooney, P.; Zipf, A.; Schauss, A. Quality assessment of the contributed land use information from OpenStreetMap versus authoritative datasets. In OpenStreetMap in GIScience; Springer: Cham, Switzerland, 2015; pp. 37–58. [Google Scholar]
- Fan, H.; Zipf, A.; Fu, Q.; Neis, P. Quality assessment for building footprints data on OpenStreetMap. Int. J. Geogr. Inf. Sci. 2014, 28, 700–719. [Google Scholar] [CrossRef]
- Forghani, M.; Delavar, M.R. A quality study of the OpenStreetMap dataset for Tehran. ISPRS Int. J. Geo-Inf. 2014, 3, 750–763. [Google Scholar] [CrossRef]
- Brovelli, M.; Zamboni, G. A new method for the assessment of spatial accuracy and completeness of OpenStreetMap building footprints. ISPRS Int. J. Geo-Inf. 2018, 7, 289. [Google Scholar] [CrossRef]
- Müller, F.; Iosifescu Enescu, I.; Hurni, L. Assessment and Visualization of OSM Building Footprint Quality. In Proceedings of the 27th International Cartographic Conference (ICC 2015), Rio de Janeiro, Brazil, 23–28 August 2015; pp. 23–28. [Google Scholar]
- Zielstra, D.; Hochmair, H.; Neis, P. Assessing the effect of data imports on the completeness of OpenStreetMap–A United States case study. Trans. GIS 2013, 17, 315–334. [Google Scholar] [CrossRef]
- Zielstra, D.; Hochmair, H. Comparative study of pedestrian accessibility to transit stations using free and proprietary network data. Transp. Res. Rec. J. Transp. Res. Board 2011, 2217, 145–152. [Google Scholar] [CrossRef]
- Jackson, S.P.; Mullen, W.; Agouris, P.; Crooks, A.; Croitoru, A.; Stefanidis, A. Assessing completeness and spatial error of features in volunteered geographic information. ISPRS Int. J. Geo-Inf. 2013, 2, 507–530. [Google Scholar] [CrossRef]
- Hochmair, H.H.; Zielstra, D. Development and completeness of points of interest in free and proprietary data sets: A Florida case study. In Proceedings of the GI_Forum, Salzburg, Austria, 3–5 July 2013. [Google Scholar]
- Goodchild, M.F.; Li, L. Assuring the quality of volunteered geographic information. Spat Stat. 2012, 1, 110–120. [Google Scholar] [CrossRef]
- Mocnik, F.B.; Mobasheri, A.; Griesbaum, L.; Eckle, M.; Jacobs, C.; Klonner, C. A grounding-based ontology of data quality measures. J. Spat. Inf. Sci. 2018, 2018, 1–25. [Google Scholar] [CrossRef]
- Antoniou, V.; Skopeliti, A. Measures and indicators of VGI quality: An overview. In Proceedings of the ISPRS Annals of the Photogrammetry, Remote Sensing and Spatial Information Sciences, La Grande Motte, France, 28 September–3 October 2015; Volume II-3/W5, pp. 345–351. [Google Scholar]
- Barron, C.; Neis, P.; Zipf, A. A comprehensive framework for intrinsic OpenStreetMap quality analysis. Trans. GIS 2014, 18, 877–895. [Google Scholar] [CrossRef]
- Gröchenig, S.; Brunauer, R.; Rehrl, K. Estimating completeness of VGI datasets by analyzing community activity over time periods. In Connecting a Digital Europe through Location and Place; Springer: Cham, Switzerland, 2014; pp. 3–18. [Google Scholar]
- Fan, H.C.; Yang, A.; Zipf, A. The intrinsic quality assessment of building footprints data on OpenStreetMap in Baden-Württemberg. In Flächennutzungsmonitoring VIII Flächensparen-Ökosystemleistungen-Handlungsstrategien; RHOMBOS: Berlin, Germany, 2016; pp. 253–260. [Google Scholar]
- Mobasheri, A.; Sun, Y.; Loos, L.; Ali, A.L. Are Crowdsourced datasets suitable for specialized routing services? Case study of OpenStreetMap for routing of people with limited mobility. Sustainability 2017, 9, 997. [Google Scholar] [CrossRef]
- Zhou, Q. Exploring the relationship between density and completeness of urban building data in OpenStreetMap for quality estimation. Int. J. Geogr. Inf. Sci. 2018, 32, 257–281. [Google Scholar] [CrossRef]
- Zhou, Q.; Tian, Y.J. The use of geometric indicators to estimate the quantitative completeness of street blocks in OpenStreetMap. Trans. GIS 2018, 22, 1550–1572. [Google Scholar] [CrossRef]
- Neis, P.; Zielstra, D.; Zipf, A. The street network evolution of crowdsourced maps: OpenStreetMap in Germany 2007–2011. Future Internet 2011, 4, 1–21. [Google Scholar] [CrossRef]
- Arsanjani, J.J.; Mooney, P.; Helbich, M.; Zipf, A. An exploration of future patterns of the contributions to OpenStreetMap and development of a Contribution Index. Trans. GIS 2015, 19, 896–914. [Google Scholar] [CrossRef]
- Neis, P.; Zielstra, D.; Zipf, A. Comparison of volunteered geographic information data contributions and community development for selected world regions. Future Internet 2013, 5, 282–300. [Google Scholar] [CrossRef]
- Zielstra, D.; Zipf, A. A comparative study of proprietary geodata and volunteered geographic information for Germany. In Proceedings of the 13th AGILE International Conference on Geographic Information Science, Guimarães, Portugal, 10–14 May 2010. [Google Scholar]
- Corcoran, P.; Mooney, P.; Bertolotto, M. Analysing the growth of OpenStreetMap networks. Spat. Stat. 2013, 3, 21–32. [Google Scholar] [CrossRef] [Green Version]
- Zhao, P.; Jia, T.; Qin, K.; Shan, J.; Jiao, C. Statistical analysis on the evolution of OpenStreetMap road networks in Beijing. Phys. A Stat. Mech. Its Appl. 2015, 420, 59–72. [Google Scholar] [CrossRef]
- Zhang, Y.; Li, X.; Wang, A.; Bao, T.; Tian, S. Density and diversity of OpenStreetMap road networks in China. J. Urban Manag. 2015, 4, 135–146. [Google Scholar] [CrossRef] [Green Version]
- Mocnik, F.B.; Mobasheri, A.; Zipf, A. Open source data mining infrastructure for exploring and analysing OpenStreetMap. Open Geospatial Data Softw. Stand. 2018, 3, 7. [Google Scholar] [CrossRef]
Figure 1.
(a–c) Illustration of the clustering approach for analyzing spatial patterns of high-density grid cells.
Figure 1.
(a–c) Illustration of the clustering approach for analyzing spatial patterns of high-density grid cells.

Figure 2.
OpenStreetMap (OSM) building counts in China from 2012 to 2017.

Figure 3.
Number distribution of OSM building data for provincial-level divisions in China, from 2012 to 2017 (a–f).
Figure 3.
Number distribution of OSM building data for provincial-level divisions in China, from 2012 to 2017 (a–f).

Figure 4.
Number distribution of OSM building data for prefecture-level divisions in China, from 2012 to 2017 (a–f).
Figure 4.
Number distribution of OSM building data for prefecture-level divisions in China, from 2012 to 2017 (a–f).

Figure 5.
Linear correlations between OSM building density and OSM building completeness for four metropolises in China (a–d).
Figure 5.
Linear correlations between OSM building density and OSM building completeness for four metropolises in China (a–d).

Figure 6.
(a–i) Variation of OSM building density from 2012 to 2017, for nine prefecture-level divisions.
Figure 6.
(a–i) Variation of OSM building density from 2012 to 2017, for nine prefecture-level divisions.

Figure 7.
(a–b) Relationship between the cluster count and maximum cluster area for prefecture-level divisions in China, in 2017. Those prefecture-level divisions that did not have any clusters are not shown.
Figure 7.
(a–b) Relationship between the cluster count and maximum cluster area for prefecture-level divisions in China, in 2017. Those prefecture-level divisions that did not have any clusters are not shown.

Figure 8.
(a–f) Density distributions of OSM building data for six typical metropolises in China, in 2017.
Figure 8.
(a–f) Density distributions of OSM building data for six typical metropolises in China, in 2017.


Table 1.
Correlations among OSM building counts and four potential factors for 2012 to 2016.
| Administrative Division | Year | GDP | Population | Urban Land Area | OSM Road Length |
|---|---|---|---|---|---|
| Provincial-level | 2012 | 0.407 * | 0.149 | 0.074 | 0.196 |
| 2013 | 0.425 * | 0.157 | 0.171 | 0.248 | |
| 2014 | 0.579 ** | 0.256 | 0.315 | 0.449 * | |
| 2015 | 0.720 ** | 0.420 * | 0.454 * | 0.519 ** | |
| 2016 | 0.689 ** | 0.387 * | 0.380 * | 0.529 ** | |
| Prefecture-level | 2012 | 0.639 ** | 0.338 ** | 0.294 ** | 0.671 ** |
| 2013 | 0.622 ** | 0.285 ** | 0.301 ** | 0.643 ** | |
| 2014 | 0.622 ** | 0.279 ** | 0.295 ** | 0.603 ** | |
| 2015 | 0.627 ** | 0.258 ** | 0.279 ** | 0.585 ** | |
| 2016 | 0.625 ** | 0.247 ** | 0.263 ** | 0.602 ** |
Significance level: ** p < 0.01 and * p < 0.05. Statistical data for the year 2017 have not yet been published.
© 2019 by the authors. Licensee MDPI, Basel, Switzerland. This article is an open access article distributed under the terms and conditions of the Creative Commons Attribution (CC BY) license (http://creativecommons.org/licenses/by/4.0/).
Share and Cite
MDPI and ACS Style
Tian, Y.; Zhou, Q.; Fu, X. An Analysis of the Evolution, Completeness and Spatial Patterns of OpenStreetMap Building Data in China. ISPRS Int. J. Geo-Inf. 2019, 8, 35. https://0-doi-org.brum.beds.ac.uk/10.3390/ijgi8010035
AMA Style
Tian Y, Zhou Q, Fu X. An Analysis of the Evolution, Completeness and Spatial Patterns of OpenStreetMap Building Data in China. ISPRS International Journal of Geo-Information. 2019; 8(1):35. https://0-doi-org.brum.beds.ac.uk/10.3390/ijgi8010035
Chicago/Turabian StyleTian, YuanJian, Qi Zhou, and Xiaolin Fu. 2019. "An Analysis of the Evolution, Completeness and Spatial Patterns of OpenStreetMap Building Data in China" ISPRS International Journal of Geo-Information 8, no. 1: 35. https://0-doi-org.brum.beds.ac.uk/10.3390/ijgi8010035
Note that from the first issue of 2016, this journal uses article numbers instead of page numbers. See further details here.