Automated Matching of Multi-Scale Building Data Based on Relaxation Labelling and Pattern Combinations

 , ,
, ,
Abstract
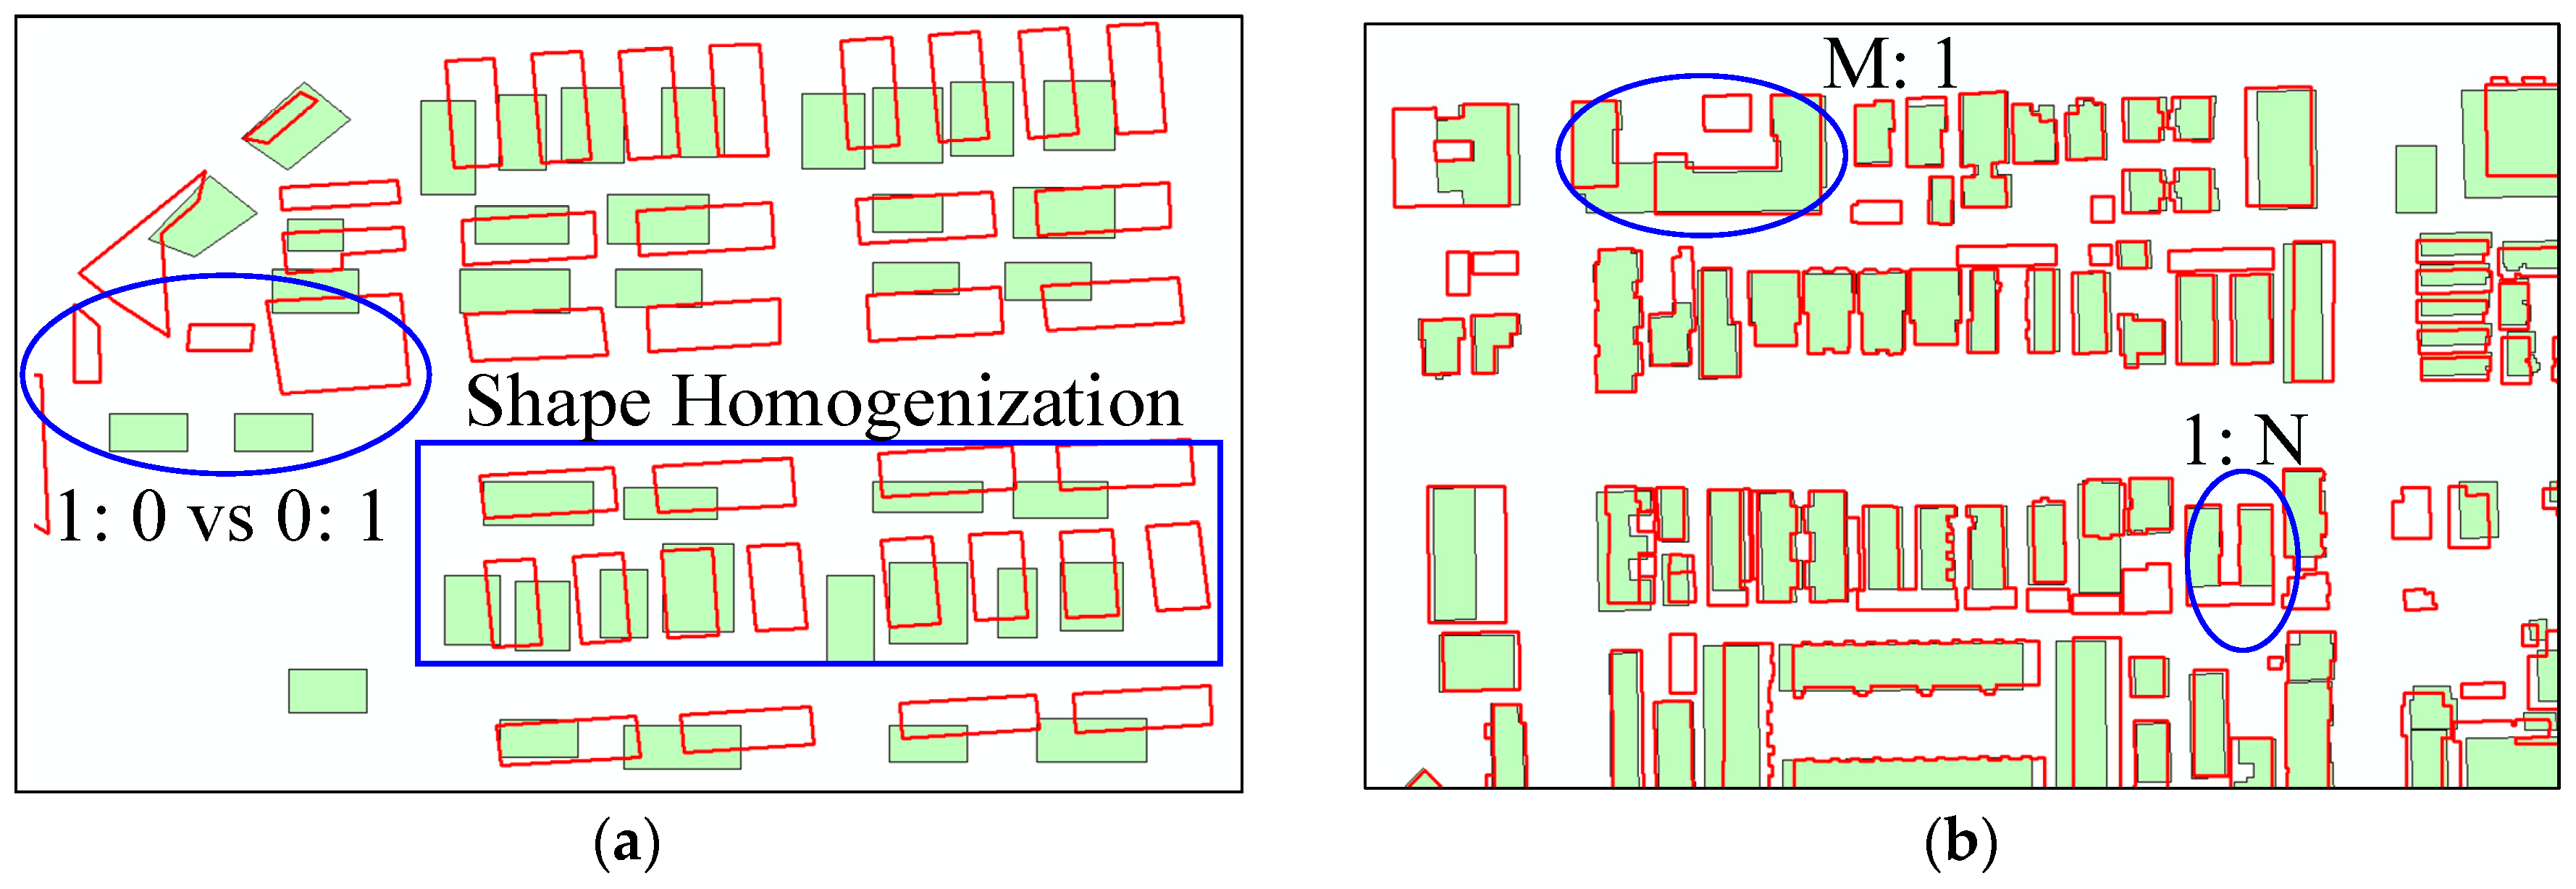
:1. Introduction
2. Literature Review
3. Methodology
- ●
- Detect candidate-matching building objects based on buffering analysis, aggregate neighboring objects into pattern combinations, and calculate the geo-similarities between candidate-matching objects and pattern combinations to initialize the matching matrix;
- ●
- Compute the contextual compatibilities between neighboring matching pairs to iteratively update the initial matching matrix, select the matching pairs based on the convergent matching matrix, and refine them through a matching conflict detection.
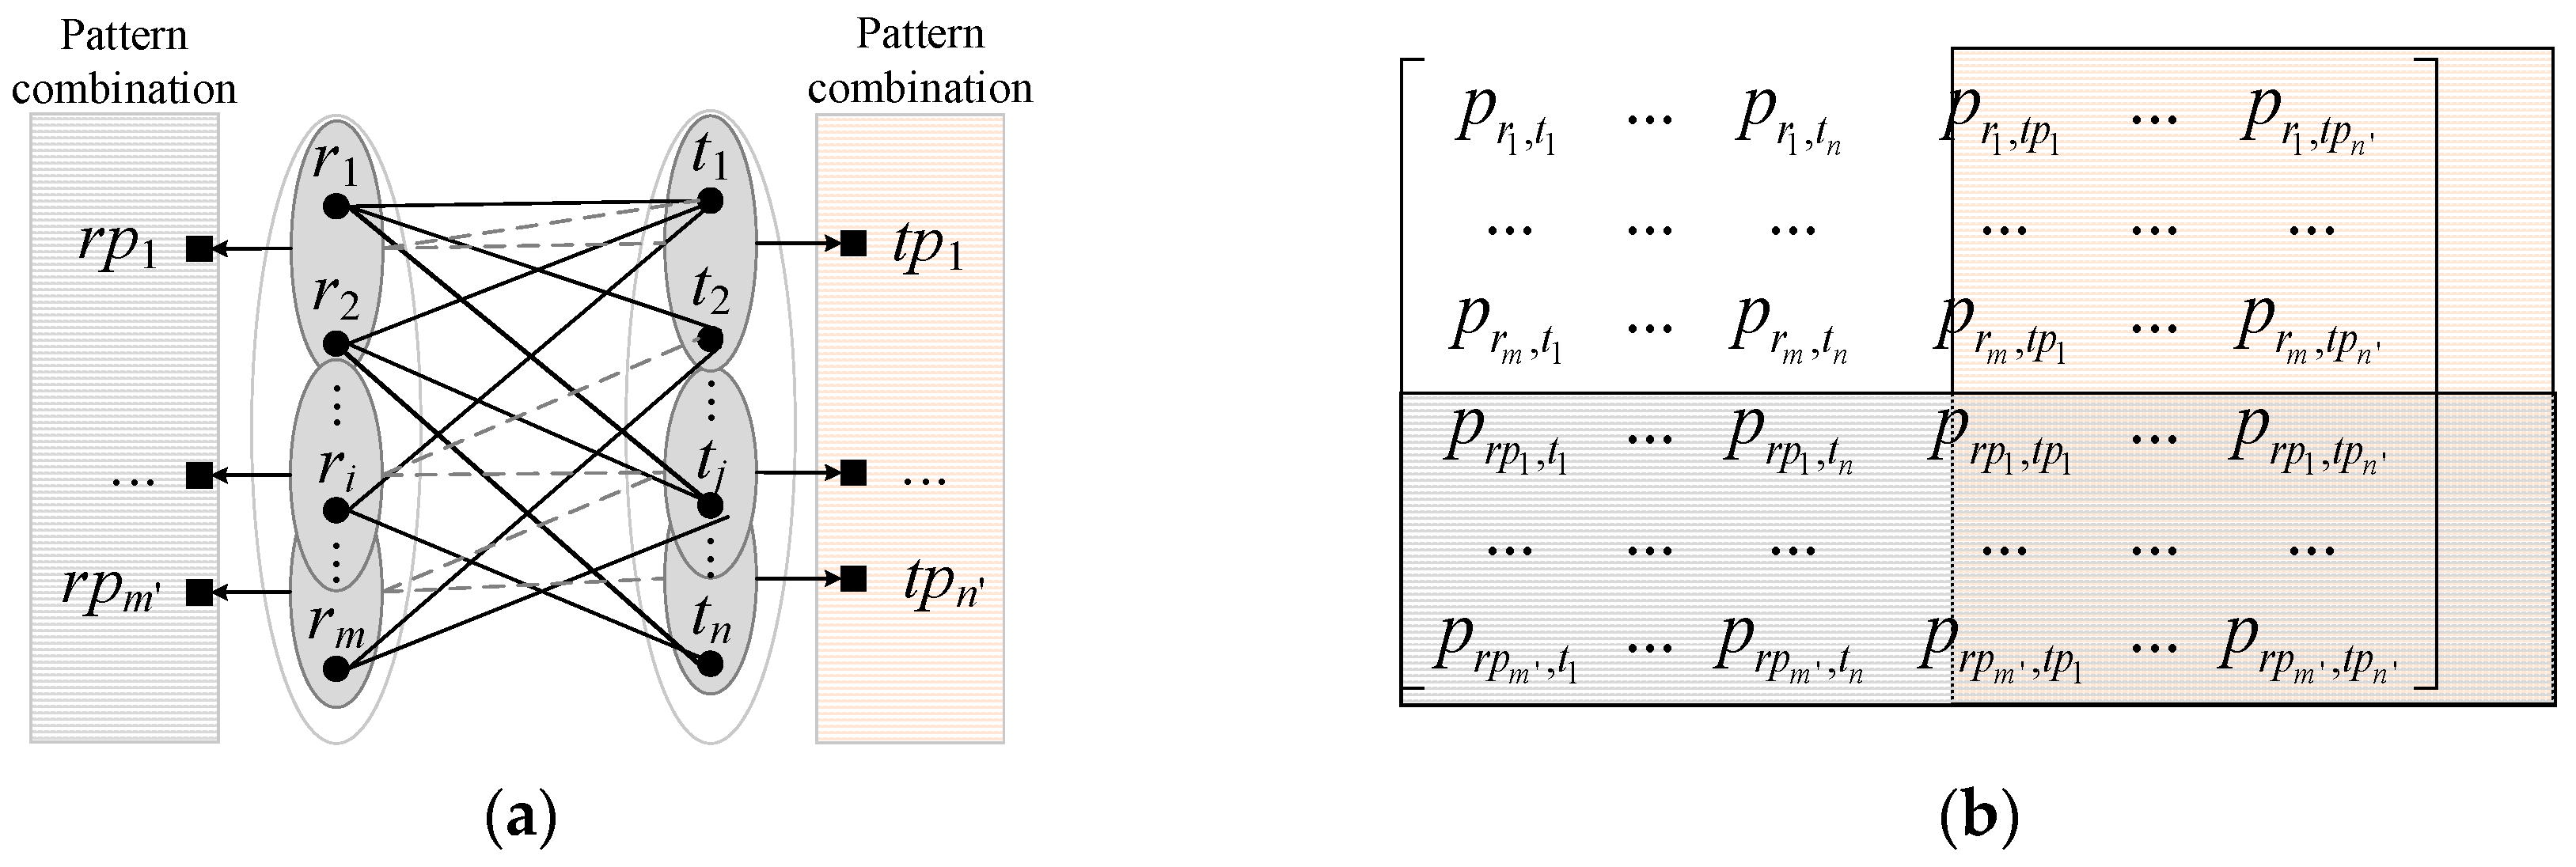
3.1. Matching Probability Initialization in Consideration of Multi-Scale Pattern Combinations
3.1.1. Detection of Candidate-Matching Objects and Pattern Combinations
- ●
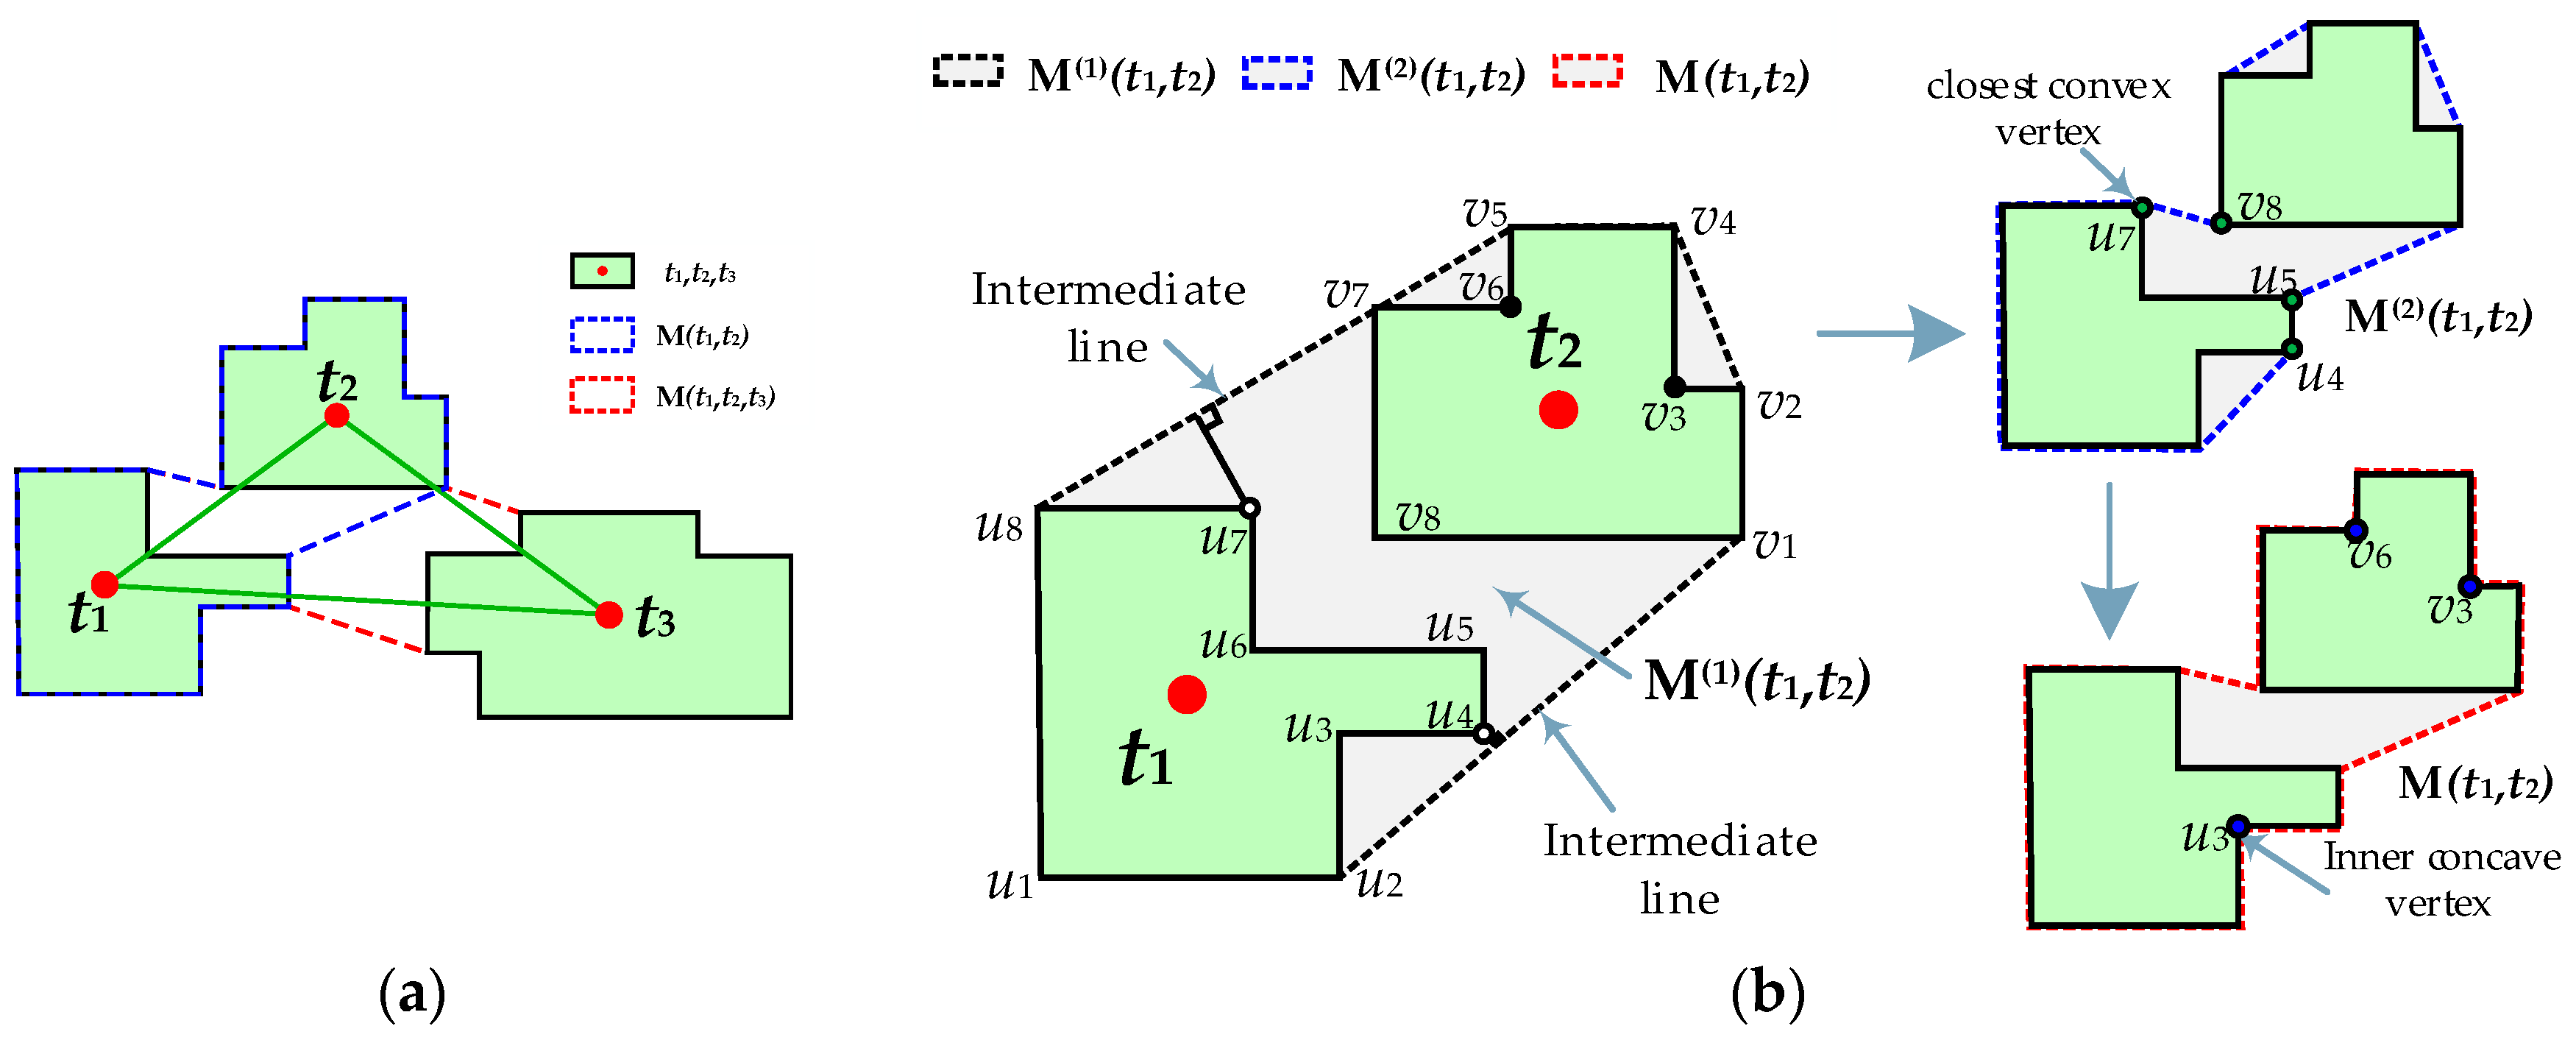
- Step 1: Initialize the convex hull of two building objects as the merged polygon;
- ●
- Step 2: Iteratively add the convex points closest to the intermediate lines to refine the merged polygon;
- ●
- Step 3: Insert the inner concave points within objects t1 and t2 to further refine the merged polygon.
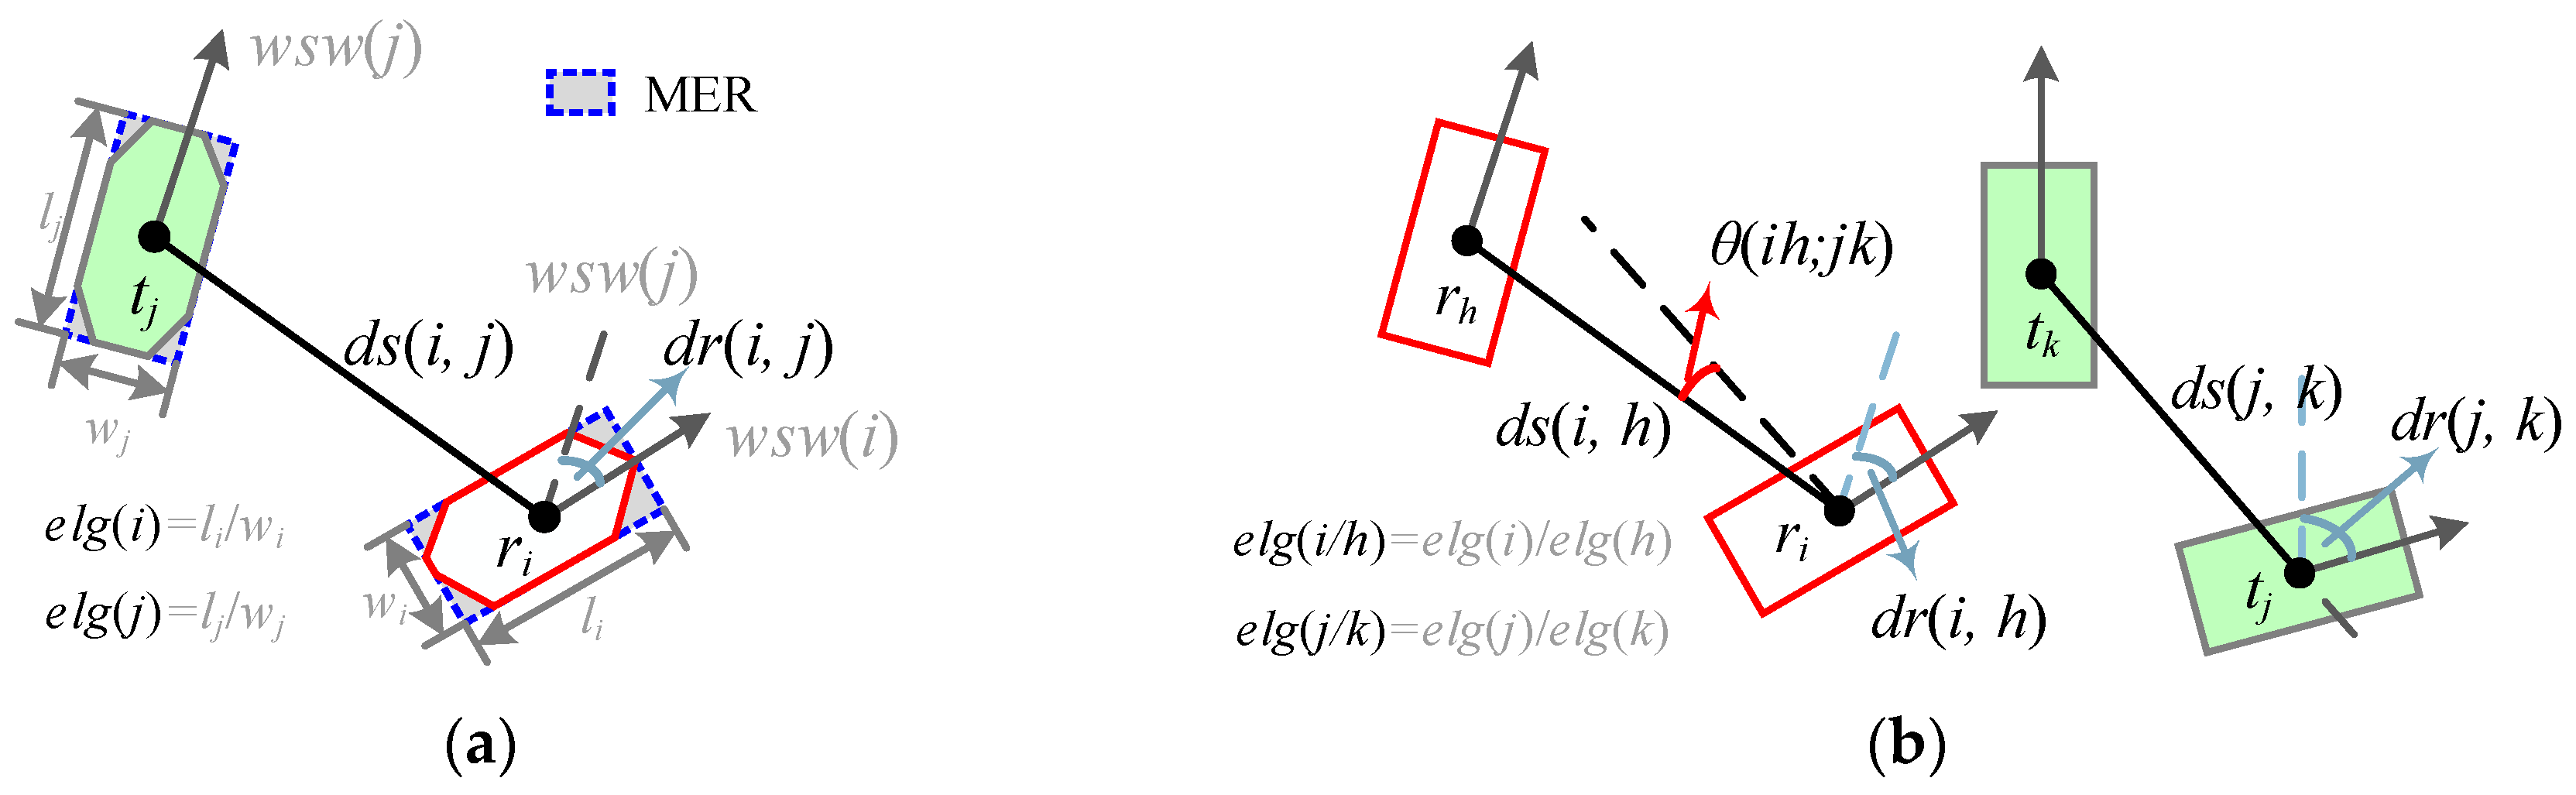
3.1.2. Calculation of Geo-Similarities and Initial Matching Probabilities
3.2. Matching Probability Relaxation Based on Multi-Scale Contextual Information
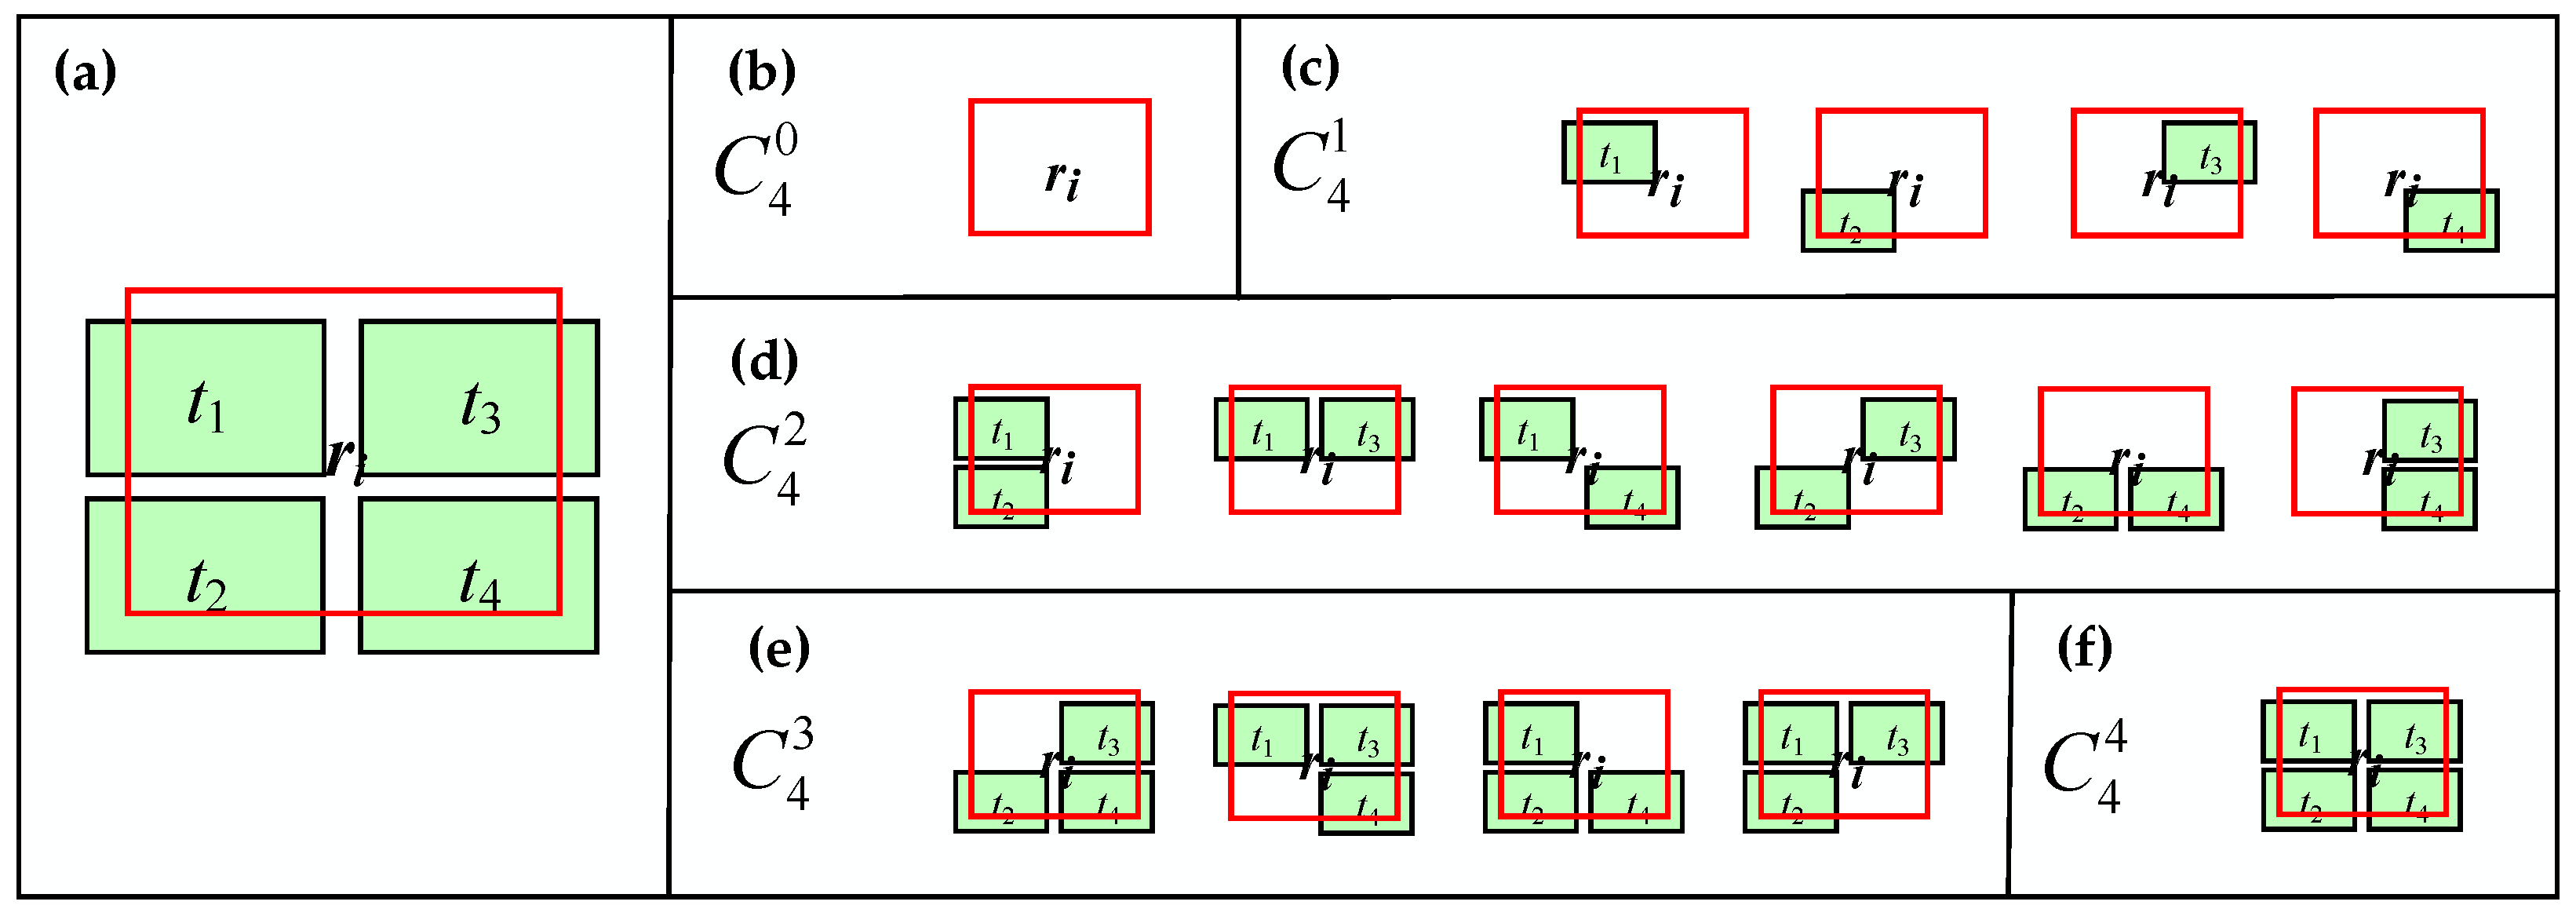
3.2.1. Definition of the Neighboring Relation and Compatibility Coefficient
3.2.2. Relaxation of the Matching Matrix and Selection of Final Matching Pairs
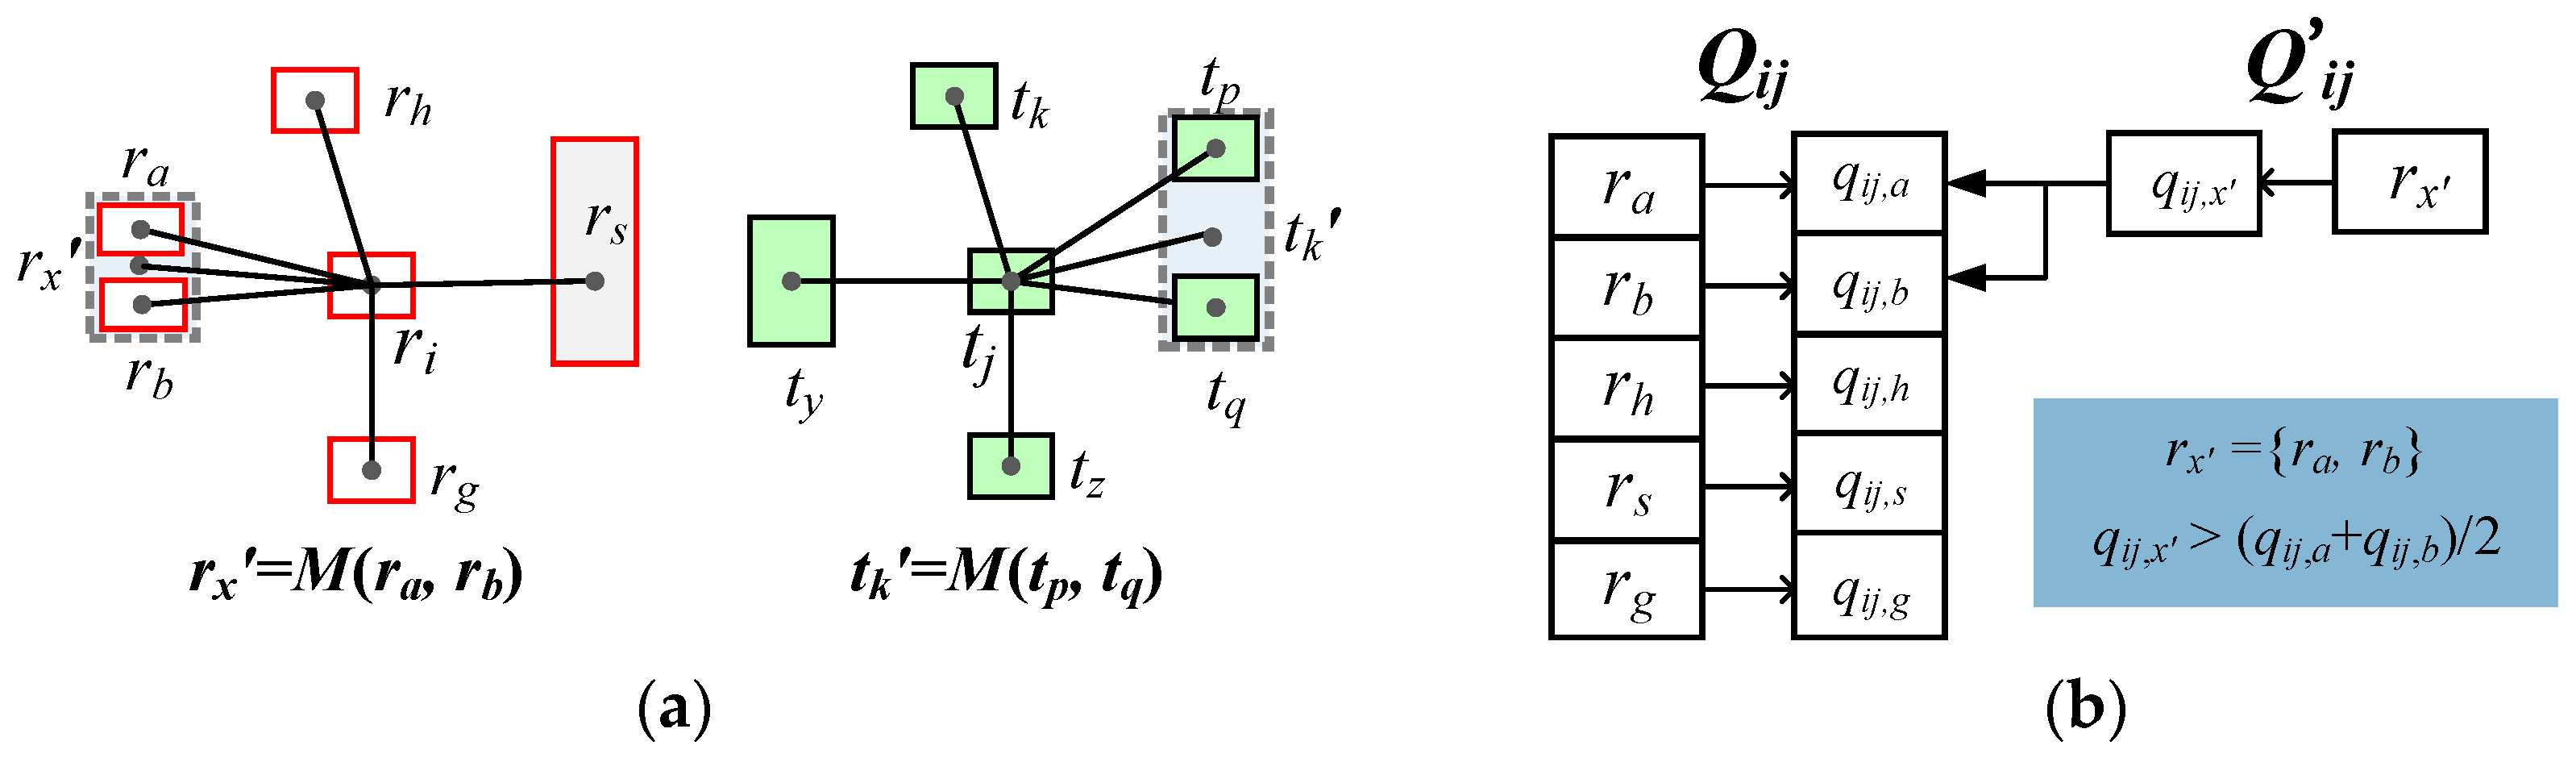
- ●
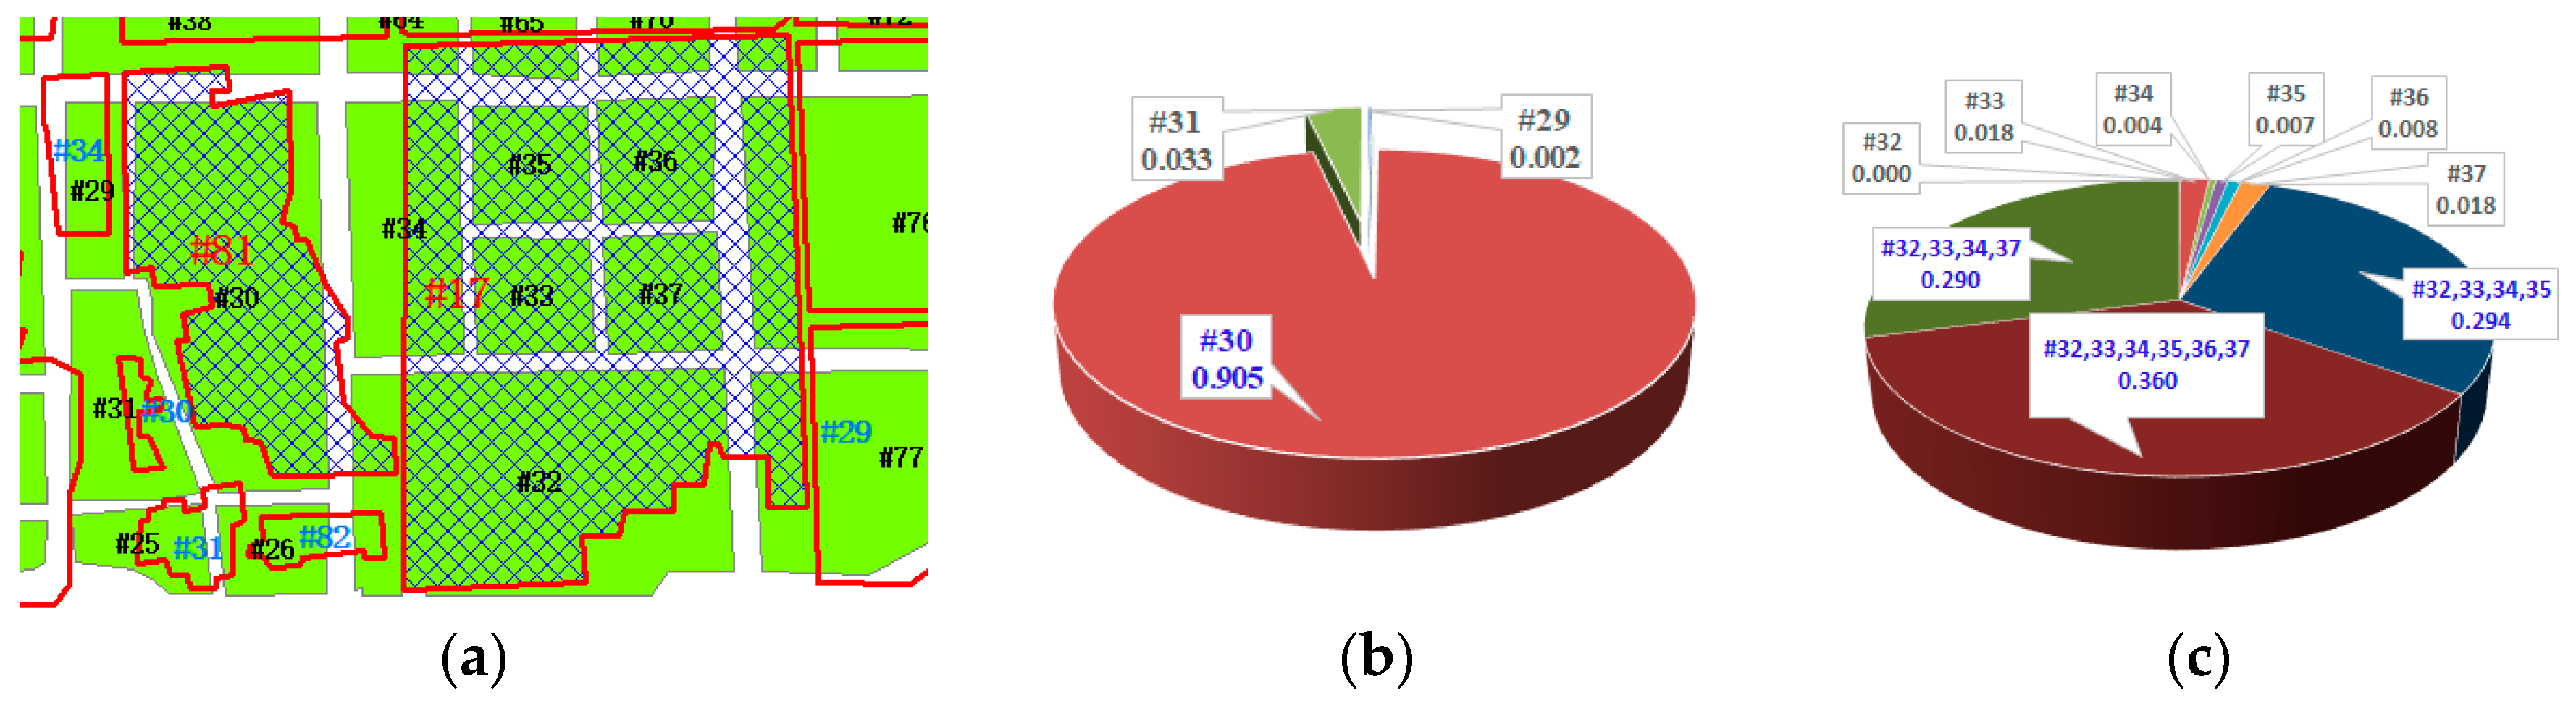
- Calculate the sub-support indexes of all neighboring individual objects and pattern combinations according to Formula (8), which are partitioned into two separate queues of Qij and Q’ij. Qij stores the sub-support indexes of neighboring individual objects and Q’ij stores the sub-support indexes of neighboring pattern combinations. For the candidate-matching pair (ri, tj) in Figure 6a, two sub-support index queues Qij and Qij’ are listed in Figure 6b.
- ●
- Traverse Qij’ in ascending order of the included object number of the neighboring pattern combination, and judge whether its sub-support index is larger than the average support index of its included objects. If yes, the sub-support index of that pattern combination will replace the corresponding sub-support indexes of the included objects in Qij. As elaborated in Figure 6b, the sub-support index qij,x’ of rx’ = {ra, rb} is larger than the average of qij,a and qij,b, so qij,x’ will substitute the values of qij,a and qij,b in Qij.
- ●
- When all elements of Qij’ are traversed and judged by the above steps, the mean of the sub-support indexes in Qij is computed as the total support index qij of (ri, tj).
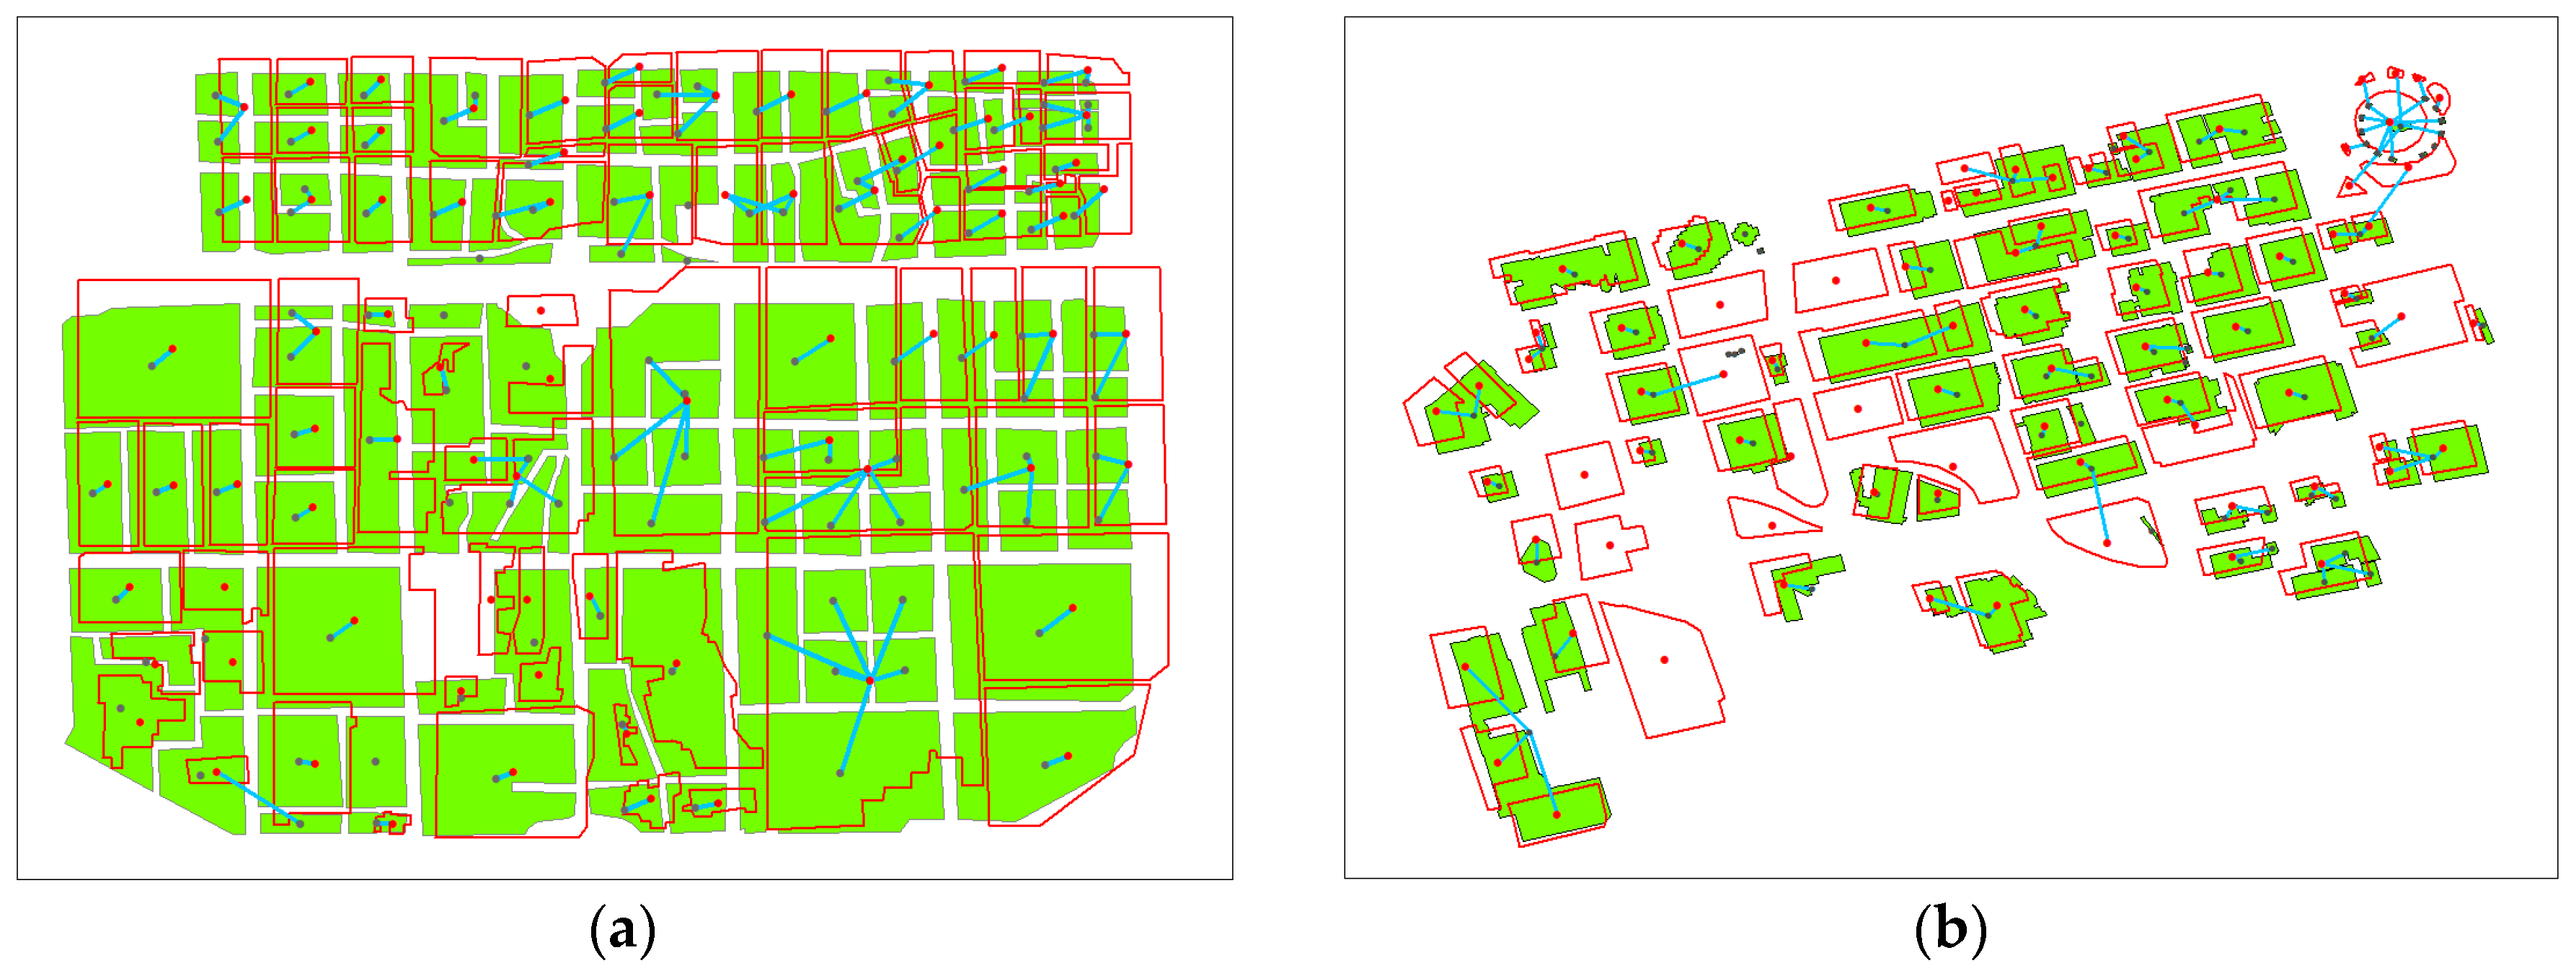
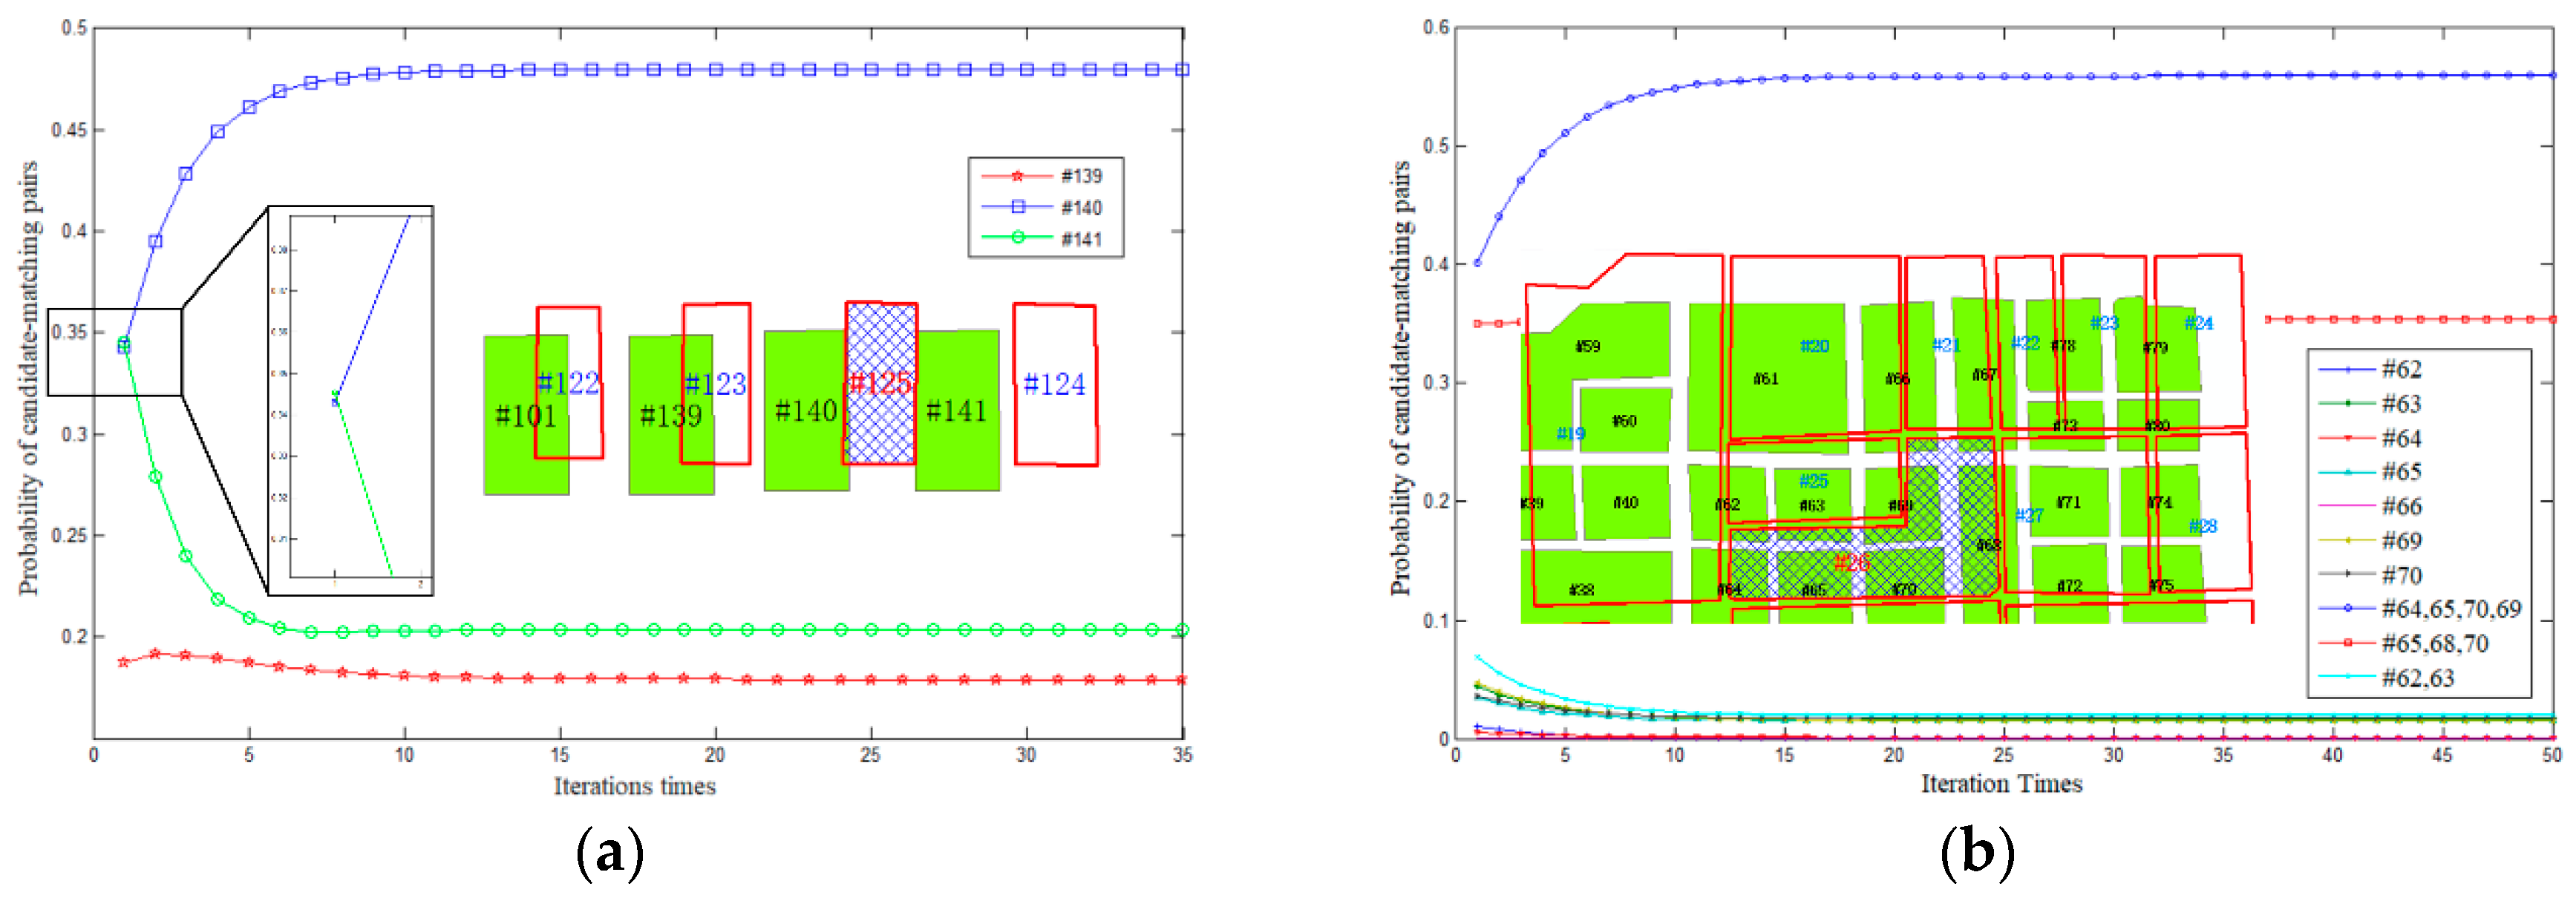
4. Experiment and Analysis
5. Conclusions
Author Contributions
Funding
Acknowledgments
Conflicts of Interest
References
- Jiang, B. Volunteered geographic information and computational geography: New perspectives. In Crowdsourcing Geographic Knowledge; Sui, D., Elwood, S., Goodchild, M., Eds.; Springer: Dordrecht, The Netherlands, 2013; pp. 125–138. [Google Scholar]
- Goetz, M. Towards generating highly detailed 3D CityGML models from OpenStreetMap. Int. J. Geogr. Inf. Sci. 2013, 27, 845–865. [Google Scholar] [CrossRef]
- Bergman, C.; Oksanen, J. Conflation of OpenStreetMap and Mobile Sports Tracking Data for Automatic Bicycle Routing. Trans. GIS 2016, 20, 848–868. [Google Scholar] [CrossRef] [Green Version]
- Yang, W.; Ai, T.; Lu, W. A Method for Extracting Road Boundary Information from Crowdsourcing Vehicle GPS Trajectories. Sensors 2018, 18, 1261. [Google Scholar] [CrossRef] [PubMed]
- Hecht, R.; Kunze, C.; Hahmann, S. Measuring Completeness of Building Footprints in OpenStreetMap over Space and Time. ISPRS Int. J. Geo-Inf. 2013, 2, 1066–1091. [Google Scholar] [CrossRef] [Green Version]
- Ruiz, J.J.; Ariza, F.J.; Ureña, M.A.; Blázquez, E.B. Digital map conflation: A review of the process and a proposal for classification. Int. J. Geogr. Inf. Sci. 2011, 25, 1439–1466. [Google Scholar] [CrossRef]
- Dalyot, S.; Dahinden, T.; Schulze, M.J.; Boljen, J.; Sester, M. Integrating network structures of different geometric representations. EMP Surv. Rev. 2013, 45, 428–440. [Google Scholar] [CrossRef]
- Sester, M.; Arsanjani, J.J.; Klammer, R.; Burghardt, D.; Haunert, J.H. Integrating and generalising volunteered geographic information. In Abstracting Geographic Information in a Data Rich World; Burghardt, D., Duchêne, C., Mackaness, W., Eds.; Springer International Publishing: Cham, Switzerland, 2014; pp. 119–155. [Google Scholar]
- Touya, G.; Brando-Escobar, C. Detecting level-of-detail inconsistencies in Volunteered Geographic Information data sets. Cartogr. Int. J. Geogr. Inf. Geovis. 2013, 48, 134–143. [Google Scholar] [CrossRef]
- Barron, C.; Neis, P.; Zipf, A. A Comprehensive Framework for Intrinsic OpenStreetMap Quality Analysis. Trans. GIS 2014, 18, 877–895. [Google Scholar] [CrossRef]
- Xu, J.; Wu, F.; Qian, H.; Ma, F. Settlement matching algorithm using spatial similarity relations as constraints. Geomat. Inf. Sci. Wuhan Univ. 2013, 38, 484–488. [Google Scholar]
- Saalfeld, A. Conflation: Automated map compilation. Int. J. Geogr. Inf. Sci. 1988, 2, 217–228. [Google Scholar] [CrossRef]
- Kieler, B.; Huang, W.; Haunert, J.; Jiang, J. Matching river datasets of different scales. In Lecture Notes in Geoinformation and Cartography; Sester, M., Bernard, L., Paelke, V., Eds.; Springer: Berlin/Heidelberg, Germany, 2009; pp. 135–154. [Google Scholar]
- Pourabdollah, A.; Morley, J.; Feldman, S.; Jackson, M. Towards an authoritative OpenStreetMap: Conflating OSM and OS OpenData National Maps’ road network. ISPRS Int. J. Geo-Inf. 2013, 2, 704–728. [Google Scholar] [CrossRef]
- Chen, C.-C.; Knoblock, C.; Shahabi, C. Automatically conflating road vector data with orthoimagery. GeoInformatica 2006, 10, 495–530. [Google Scholar] [CrossRef]
- Zhang, J. A Congruent Hybrid Model for Conflation of Satellite Image and Road Database. Ph.D. Thesis, Technical University of Munich, Munich, German, 2013. [Google Scholar]
- McKenzie, G.; Janowicz, K.; Adams, B. A weighted multi-attribute method for matching user-generated Points of Interest. Cartogr. Geogr. Inf. Sci. 2014, 41, 125–137. [Google Scholar] [CrossRef] [Green Version]
- Scheffler, T.; Schirru, R.; Lehmann, P. Matching points of interest from different social networking sites. In KI 2012: Advances in Artificial Intelligence; Goebel, R., Tanaka, Y., Wahlster, W., Siekmann, J., Eds.; Springer: Berlin/Heidelberg, Germany, 2012; pp. 45–248. [Google Scholar]
- Xiong, D.; Sperling, J. Semiautomated matching for network database integration. ISPRS J. Photogramm. Remote Sens. 2004, 59, 35–46. [Google Scholar] [CrossRef]
- Zhang, M.; Meng, L. An iterative road-matching approach for the integration of postal data. Comput. Environ. Urban Syst. 2007, 31, 598–616. [Google Scholar] [CrossRef]
- Mustière, S.; Devogele, T. Matching Networks with Different Levels of Detail. GeoInformatica 2008, 12, 435–453. [Google Scholar] [CrossRef]
- Fan, H.; Yang, B.; Zipf, A.; Rousell, A. A polygon-based approach for matching OpenStreetMap road networks with authority data. Int. J. Geogr. Inf. Sci. 2016, 30, 748–764. [Google Scholar] [CrossRef]
- Safra, E.; Kanza, Y.; Sagiv, Y.; Doytsher, Y. Ad hoc matching of vectorial road networks. Int. J. Geogr. Inf. Sci. 2013, 27, 114–153. [Google Scholar] [CrossRef]
- Yang, B.; Zhang, Y.; Luan, X. A probabilistic relaxation approach for matching road networks. Int. J. Geogr. Inf. Sci. 2013, 27, 319–338. [Google Scholar] [CrossRef]
- Tong, X.; Liang, D.; Jin, Y. A linear road object matching method for conflation based on optimization and logistic regression. Int. J. Geogr. Inf. Sci. 2014, 28, 824–846. [Google Scholar] [CrossRef]
- Chehreghan, A.; Abbaspour, R.A. A geometric-based approach for road matching on multi-scale datasets using a genetic algorithm. Cartogr. Geogr. Inf. Sci. 2018, 45, 255–269. [Google Scholar] [CrossRef]
- Du, H.; Anand, S.; Alechina, N.; Morley, J.; Hart, G.; Leibovici, D.; Jackson, M.; Ware, M. Geospatial information integration for authoritative and crowd sourced road vector data. Trans. GIS 2012, 16, 455–476. [Google Scholar] [CrossRef]
- Liu, C.; Xiong, L.; Hu, X.; Shan, J. A Progressive Buffering Method for Road Map Update Using OpenStreetMap Data. ISPRS Int. J. Geo-Inf. 2015, 4, 1246–1264. [Google Scholar] [CrossRef] [Green Version]
- Yang, B.; Zhang, Y.; Lu, F. Geometric-based approach for integrating VGI POIs and road networks. Int. J. Geogr. Inf. Sci. 2014, 28, 126–147. [Google Scholar] [CrossRef]
- Yang, B.; Zhang, Y. Pattern-mining approach for conflating crowdsourcing road networks with POIs. Int. J. Geogr. Inf. Sci. 2015, 29, 786–805. [Google Scholar] [CrossRef]
- Ai, T.; Yang, M.; Zhang, X.; Tian, J. Detection and correction of inconsistencies between river networks and contour data by spatial constraint knowledge. Cartogr. Int. J. Geogr. Inf. Geov. 2015, 42, 79–93. [Google Scholar] [CrossRef]
- Fan, H.; Zipf, A.; Fu, Q.; Neis, P. Quality assessment for building footprints data on OpenStreetMap. Int. J. Geogr. Inf. Sci. 2014, 28, 700–719. [Google Scholar] [CrossRef]
- Gösseln, G.; Sester, M. Integration of geoscientific datasets and the German digital map using a matching approach. In Proceedings of the XXth International Society for Photogrammetry and Remote Sensing Congress, Istanbul, Turkey, 12–23 July 2004; pp. 1249–1254. [Google Scholar]
- Huh, Y.; Yu, K.; Heo, J. Detecting conjugate-point pairs for map alignment between two polygon datasets. Comput. Environ. Urban Syst. 2011, 35, 250–262. [Google Scholar] [CrossRef]
- Ai, T.; Cheng, X.; Liu, P.; Yang, M. A shape analysis and template matching of building features by the Fourier transform method. Comput. Environ. Urban Syst. 2013, 41, 219–233. [Google Scholar] [CrossRef]
- Wang, Y.; Chen, D.; Zhao, Z.; Ren, F.; Du, Q. A Back-Propagation Neural Network-Based Approach for Multi-Represented Feature Matching in Update Propagation. Trans. GIS 2015, 19, 964–993. [Google Scholar] [CrossRef]
- Du, H.; Alechina, N.; Jackson, M.; Hart, G. A Method for Matching Crowd-sourced and Authoritative Geospatial Data. Trans. GIS 2016. [Google Scholar] [CrossRef]
- Samal, A.; Seth, S.; Cueto, K. A feature-based approach to conflation of geospatial sources. Int. J. Geogr. Inf. Sci. 2004, 18, 459–489. [Google Scholar] [CrossRef]
- Kim, J.O.; Yu, K.; Heo, J.; Lee, W.H. A new method for matching objects in two different geospatial datasets based on the geographic context. Comput. Geosci. 2010, 36, 1115–1122. [Google Scholar] [CrossRef]
- Zhang, X.; Ai, T.; Stoter, J.; Zhao, X. Data matching of building polygons at multiple map scales improved by contextual information and relaxation. ISPRS J. Photogramm. Remote Sens. 2014, 92, 147–163. [Google Scholar] [CrossRef]
- Huh, Y.; Kim, J.; Lee, J.; Yu, K.; Shi, W. Identification of multi-scale corresponding object-set pairs between two polygon datasets with hierarchical co-clustering. ISPRS J. Photogramm. Remote Sens. 2014, 88, 60–68. [Google Scholar] [CrossRef]
- Zhang, Y.; Huang, J.; Deng, M.; Fang, X.; Hu, J. Relaxation Labelling Matching for Multi-scale Residential Datasets Based on Neighboring Patterns. Geomat. Inf. Sci. Wuhan Univ. 2018, 43, 1098–1105. [Google Scholar]
- Deng, M.; Liu, Q.; Cheng, T.; Shi, Y. An adaptive spatial clustering algorithm based on Delaunay triangulation. Comput. Environ. Urban Syst. 2011, 35, 320–332. [Google Scholar] [CrossRef]
- Duchêne, C.; Bard, S.; Barillot, X.; Ruas, A.; Trevisan, J.; Holzapfel, F. Quantitative and qualitative description of building orientation. In Proceedings of the Fifth Workshop on Progress in Automated Map Generalisation, Paris, France, 28–30 April 2003; ICA, Commission on Map Generalisation: Barcelona, Spain, 2003. [Google Scholar]


| Test Data | R (Scale/Object Number) | T (Scale/Object Number) | Tpos | Tdir | Tarea | Tshp | δ |
|---|---|---|---|---|---|---|---|
| Mock data | Small scale/25 | Large scale/42 | 0.75 | 0.95 | 0.8 | 0.75 | 5‰ |
| Xi’an data | 1: 250,000 (83) | 1: 200,000(118) | 0.70 | 0.95 | 0.65 | 0.72 | 5‰ |
| Dallas data | OpenStreetMap/83 | Web data/80 | 0.87 | 0.93 | 0.9 | 0.87 | 5‰ |
| Data | Precision P | Recall R | F Value | |
|---|---|---|---|---|
| Mock data | Object-level method | 100% | 68.57% | 81.35% |
| The proposed method | 100% | 100% | 100% | |
| Xi’an data | 93.56% | 91.47% | 92.5% | |
| Dallas data | 98.12% | 95.45% | 96.93% | |
| Matching Combinations | Data R | Candidate Correspondences in Data T | Matching Probability |
|---|---|---|---|
 | rA | {ta} | 0.011 |
| {ta, tb} | 0.0469 | ||
| {ta, tb, tc} | 0.138 | ||
| {ta, tb, tc, td} | 0.218 | ||
 | rB | {te} | 0.0585 |
| {tf} | 0.1424 | ||
| {te, tf} | 0.308 | ||
| {te, tf, tg} | 0.051 | ||
| rC | {te} | 0.070 | |
| {tg} | 0.130 | ||
| {te, tg} | 0.290 | ||
| {te, tf, tg} | 0.055 |
© 2019 by the authors. Licensee MDPI, Basel, Switzerland. This article is an open access article distributed under the terms and conditions of the Creative Commons Attribution (CC BY) license (http://creativecommons.org/licenses/by/4.0/).
Share and Cite
Zhang, Y.; Huang, J.; Deng, M.; Chen, C.; Zhou, F.; Xie, S.; Fang, X. Automated Matching of Multi-Scale Building Data Based on Relaxation Labelling and Pattern Combinations. ISPRS Int. J. Geo-Inf. 2019, 8, 38. https://0-doi-org.brum.beds.ac.uk/10.3390/ijgi8010038
Zhang Y, Huang J, Deng M, Chen C, Zhou F, Xie S, Fang X. Automated Matching of Multi-Scale Building Data Based on Relaxation Labelling and Pattern Combinations. ISPRS International Journal of Geo-Information. 2019; 8(1):38. https://0-doi-org.brum.beds.ac.uk/10.3390/ijgi8010038
Chicago/Turabian StyleZhang, Yunfei, Jincai Huang, Min Deng, Chi Chen, Fangbin Zhou, Shuchun Xie, and Xiaoliang Fang. 2019. "Automated Matching of Multi-Scale Building Data Based on Relaxation Labelling and Pattern Combinations" ISPRS International Journal of Geo-Information 8, no. 1: 38. https://0-doi-org.brum.beds.ac.uk/10.3390/ijgi8010038