1. Introduction
The Canadian Hydrographic Service (CHS) is responsible for providing hydrographic products and services to ensure safe, sustainable and navigable use of Canada’s waterways. As Canada contains the longest coastline in the world, CHS, with support from the Canadian Space Agency through a Government Related Initiatives Program (GRIP) project, has been exploring remote sensing technologies to help improve its nautical products. CHS’s GRIP focuses on specific applications of Earth Observation (EO) data: shoreline extraction, change detection and Satellite-Derived Bathymetry (SDB).
To date, SDB research has focused on the development of novel empirical [
1,
2,
3] and physics-based approaches [
4,
5], as well as the application of these techniques [
6,
7,
8]. CHS investigations of empirical [
9] and photogrammetric [
10] SDB techniques have illustrated the potential of these approaches for deriving accurate bathymetry estimates in Canadian waters. While representing excellent progress for estimating water depth from satellite imagery, significant challenges remain with providing hydrographic offices (HOs) with sufficient confidence in SDB estimates to allow the information to be incorporated into official nautical products. Internationally, all sources of water depth information must meet accuracy specifications for specific depth ranges, defined by International Hydrographic Organization (IHO) CATegory of Zones Of Confidence (CATZOC) levels (refer to
Section 4.3 for a detailed overview of CATZOC levels) [
11]. As CHS demonstrated in [
9] and [
10], SDB obtained through various techniques can regularly achieve CATZOC level C. While this represents a reasonable accuracy for satellite-derived information, there is a desire by HOs to improve their confidence in SDB results. As well, CATZOC determinations can only be obtained when in situ bathymetric information is available, limiting HO confidence in SDB results when only limited or no in situ depth information is available.
This paper proposes a new technique for quantifying confidence in SDB estimates: a level of confidence assessment. This method operates by determining the level of agreement between multiple SDB techniques applied to a single site. Initially, agreement is assessed between all of the applied techniques (four for this study: empirical, classification and photogrammetric (automatic and manual)). Subsequent agreement is then evaluated for different combinations of techniques (e.g., three agree, two agree), allowing SDB coverage to be gradually increased while maintaining the highest possible degree of confidence in the results. Final SDB estimates are obtained via averages of the SDB results for the techniques incorporated into each combination.
The results of this work demonstrate the benefit of completing a level of confidence assessment and suggest a new approach for HOs to evaluate SDB results:
Applying the level of confidence approach increased overall SDB accuracy, allowing estimates to consistently reach CATZOC level A2/B accuracy when compared with in situ bathymetry.
Understanding agreement between various SDB techniques allows for increased confidence in SDB application, particularly for areas where in situ bathymetry is limited or unavailable (e.g., if four SDB techniques generate similar results, overall confidence in the accuracy of each result increases).
The flexible nature of the approach allows for any form of SDB technique to be incorporated and assessed, allowing for greater leveraging of the strengths of empirical, physics and photogrammetry approaches in a combined fashion.
The confidence levels created as part of the process can also be used as a quality control (QC) tool for areas where fewer techniques agree (e.g., evaluating why multiple techniques do not agree for a particular area).
CHS believes that through the completion of level of confidence assessments, international HOs can increase their overall confidence in SDB, potentially allowing for increased use of SDB within international hydrographic products.
2. Materials and Methods
2.1. Study Site
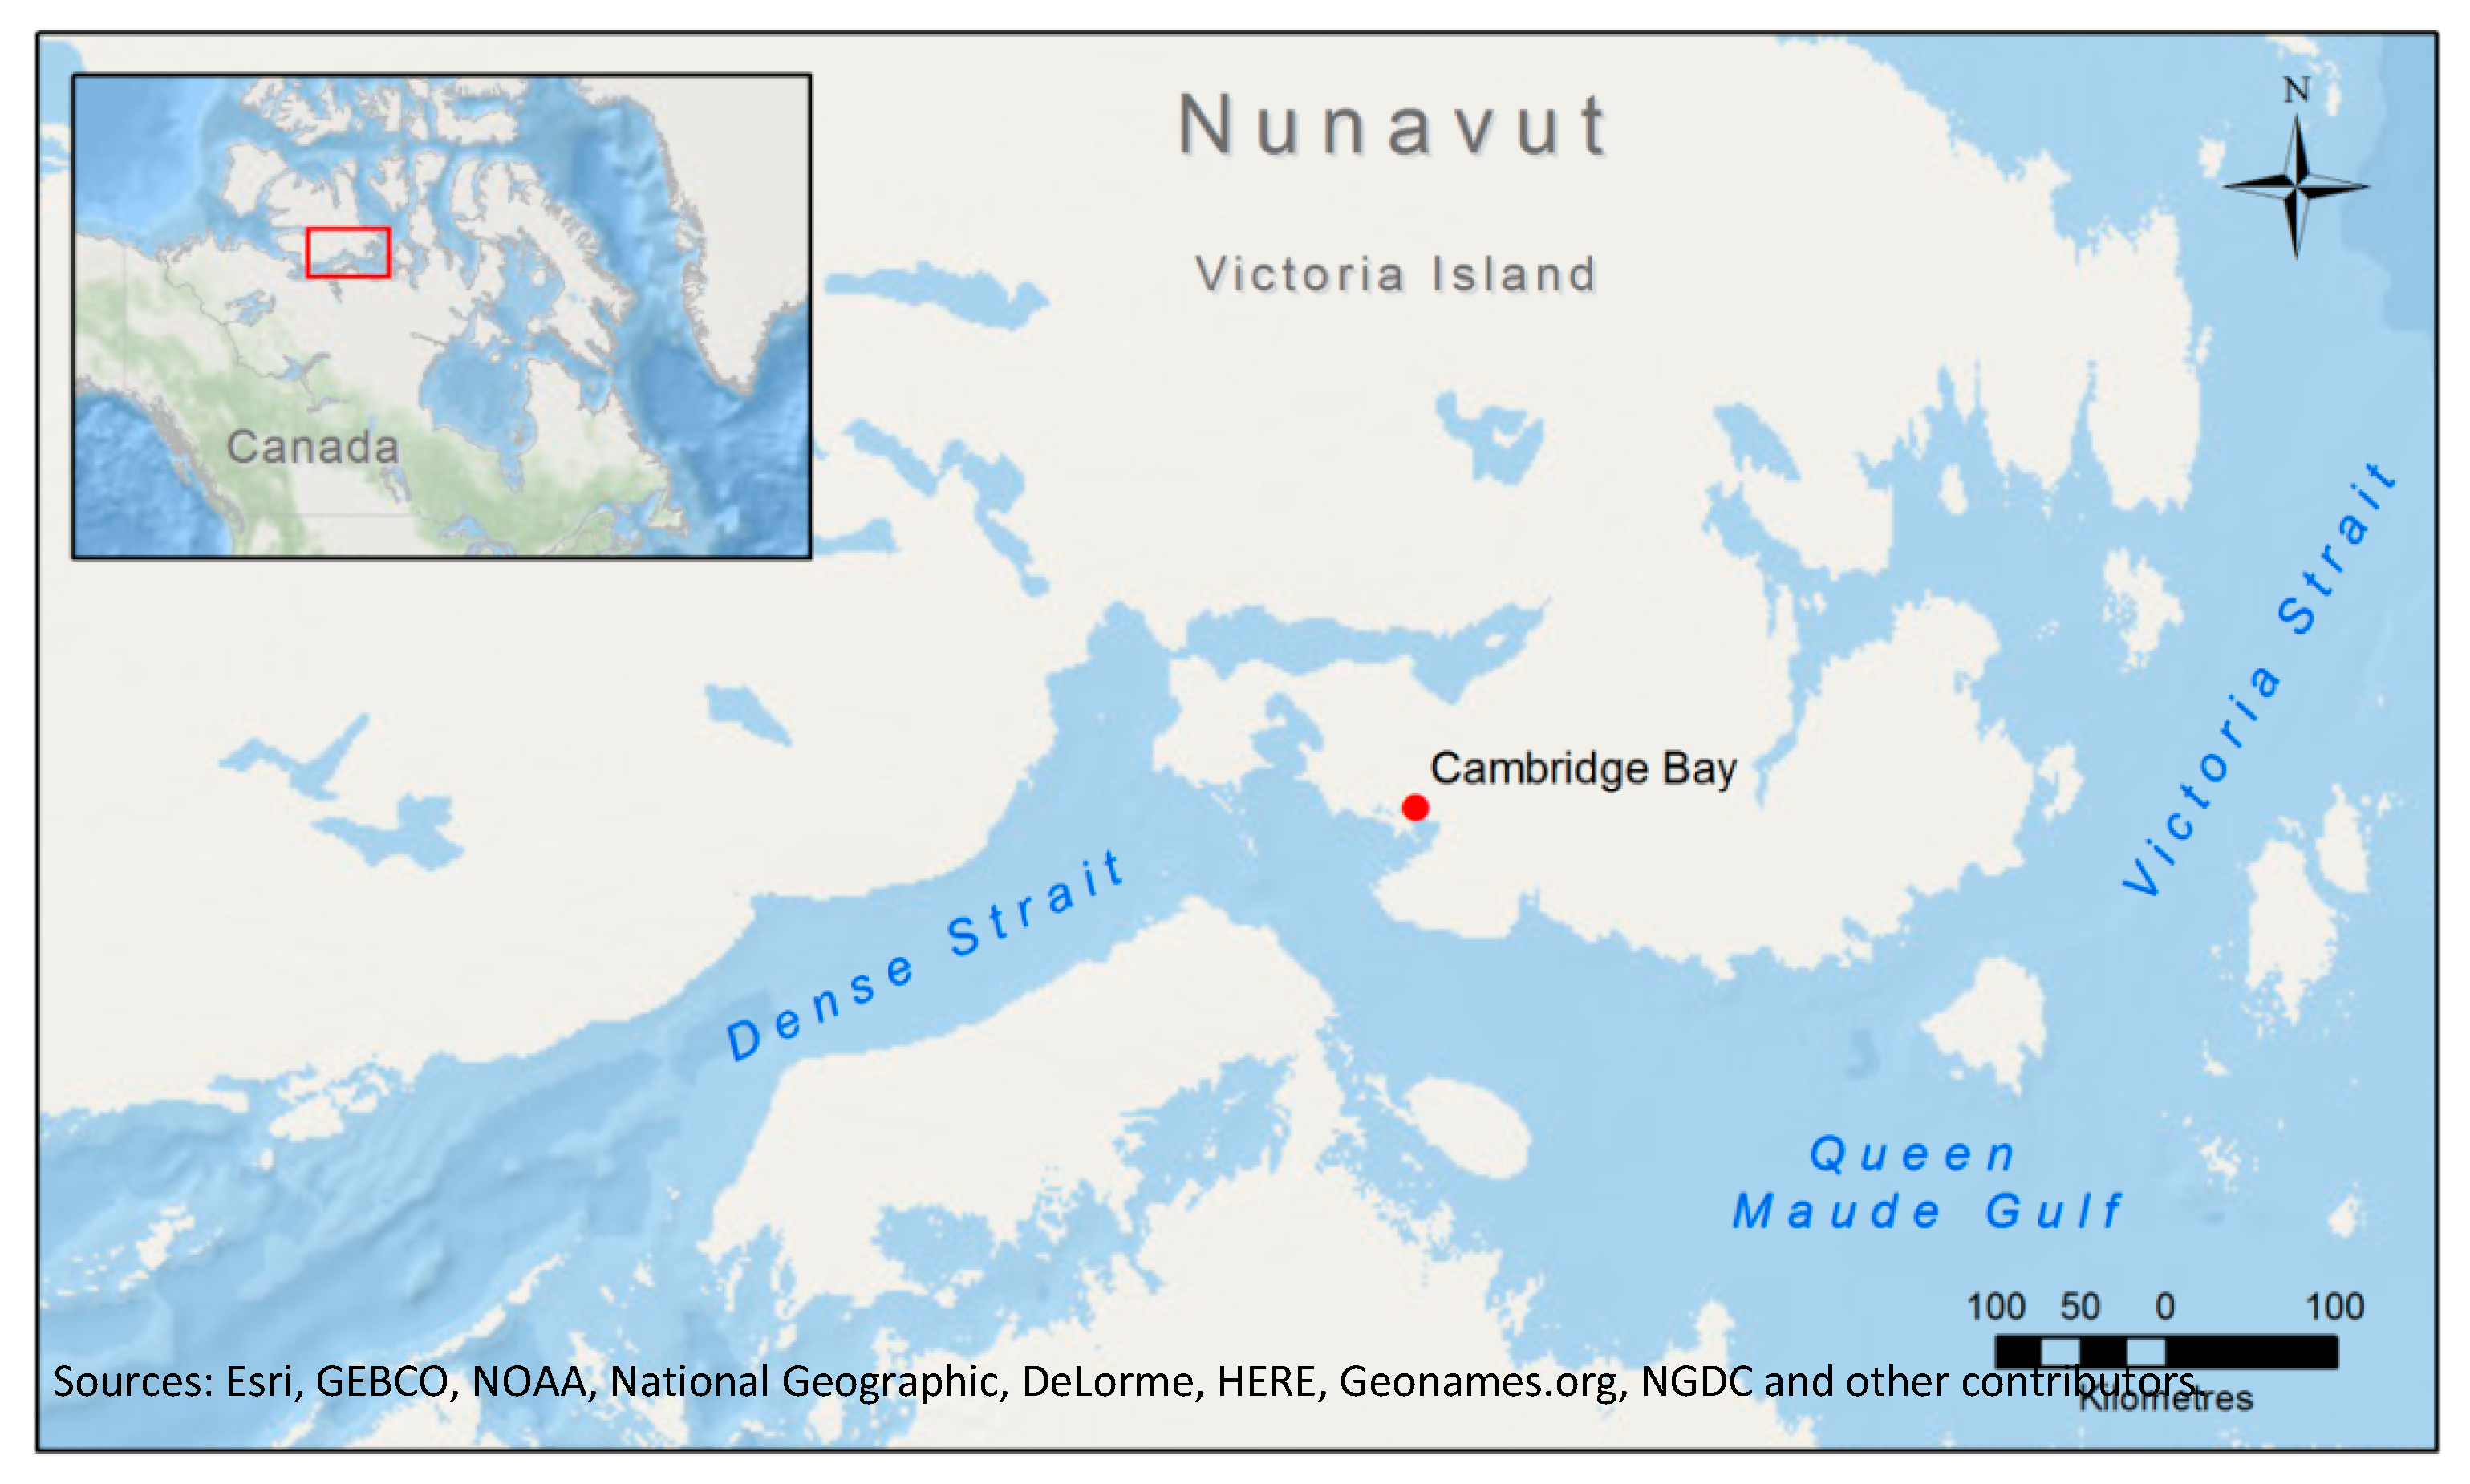
CHS’s primary use of SDB will be in the Canadian Arctic where the greatest concentration of gaps is present in CHS’s hydrographic surveys. The site for this study is situated in the waters near Cambridge Bay (69°07’N, 105°02’W), a hamlet located on Victoria Island, Nunavut (
Figure 1). Water in Cambridge Bay is generally clear with a depth visibility of around 15 m. The bottom is mostly composed of sand and rock but the benthic environment is more heterogeneous with numerous patches of vegetation, making the site somewhat complex for SDB.
2.2. Satellite Imagery
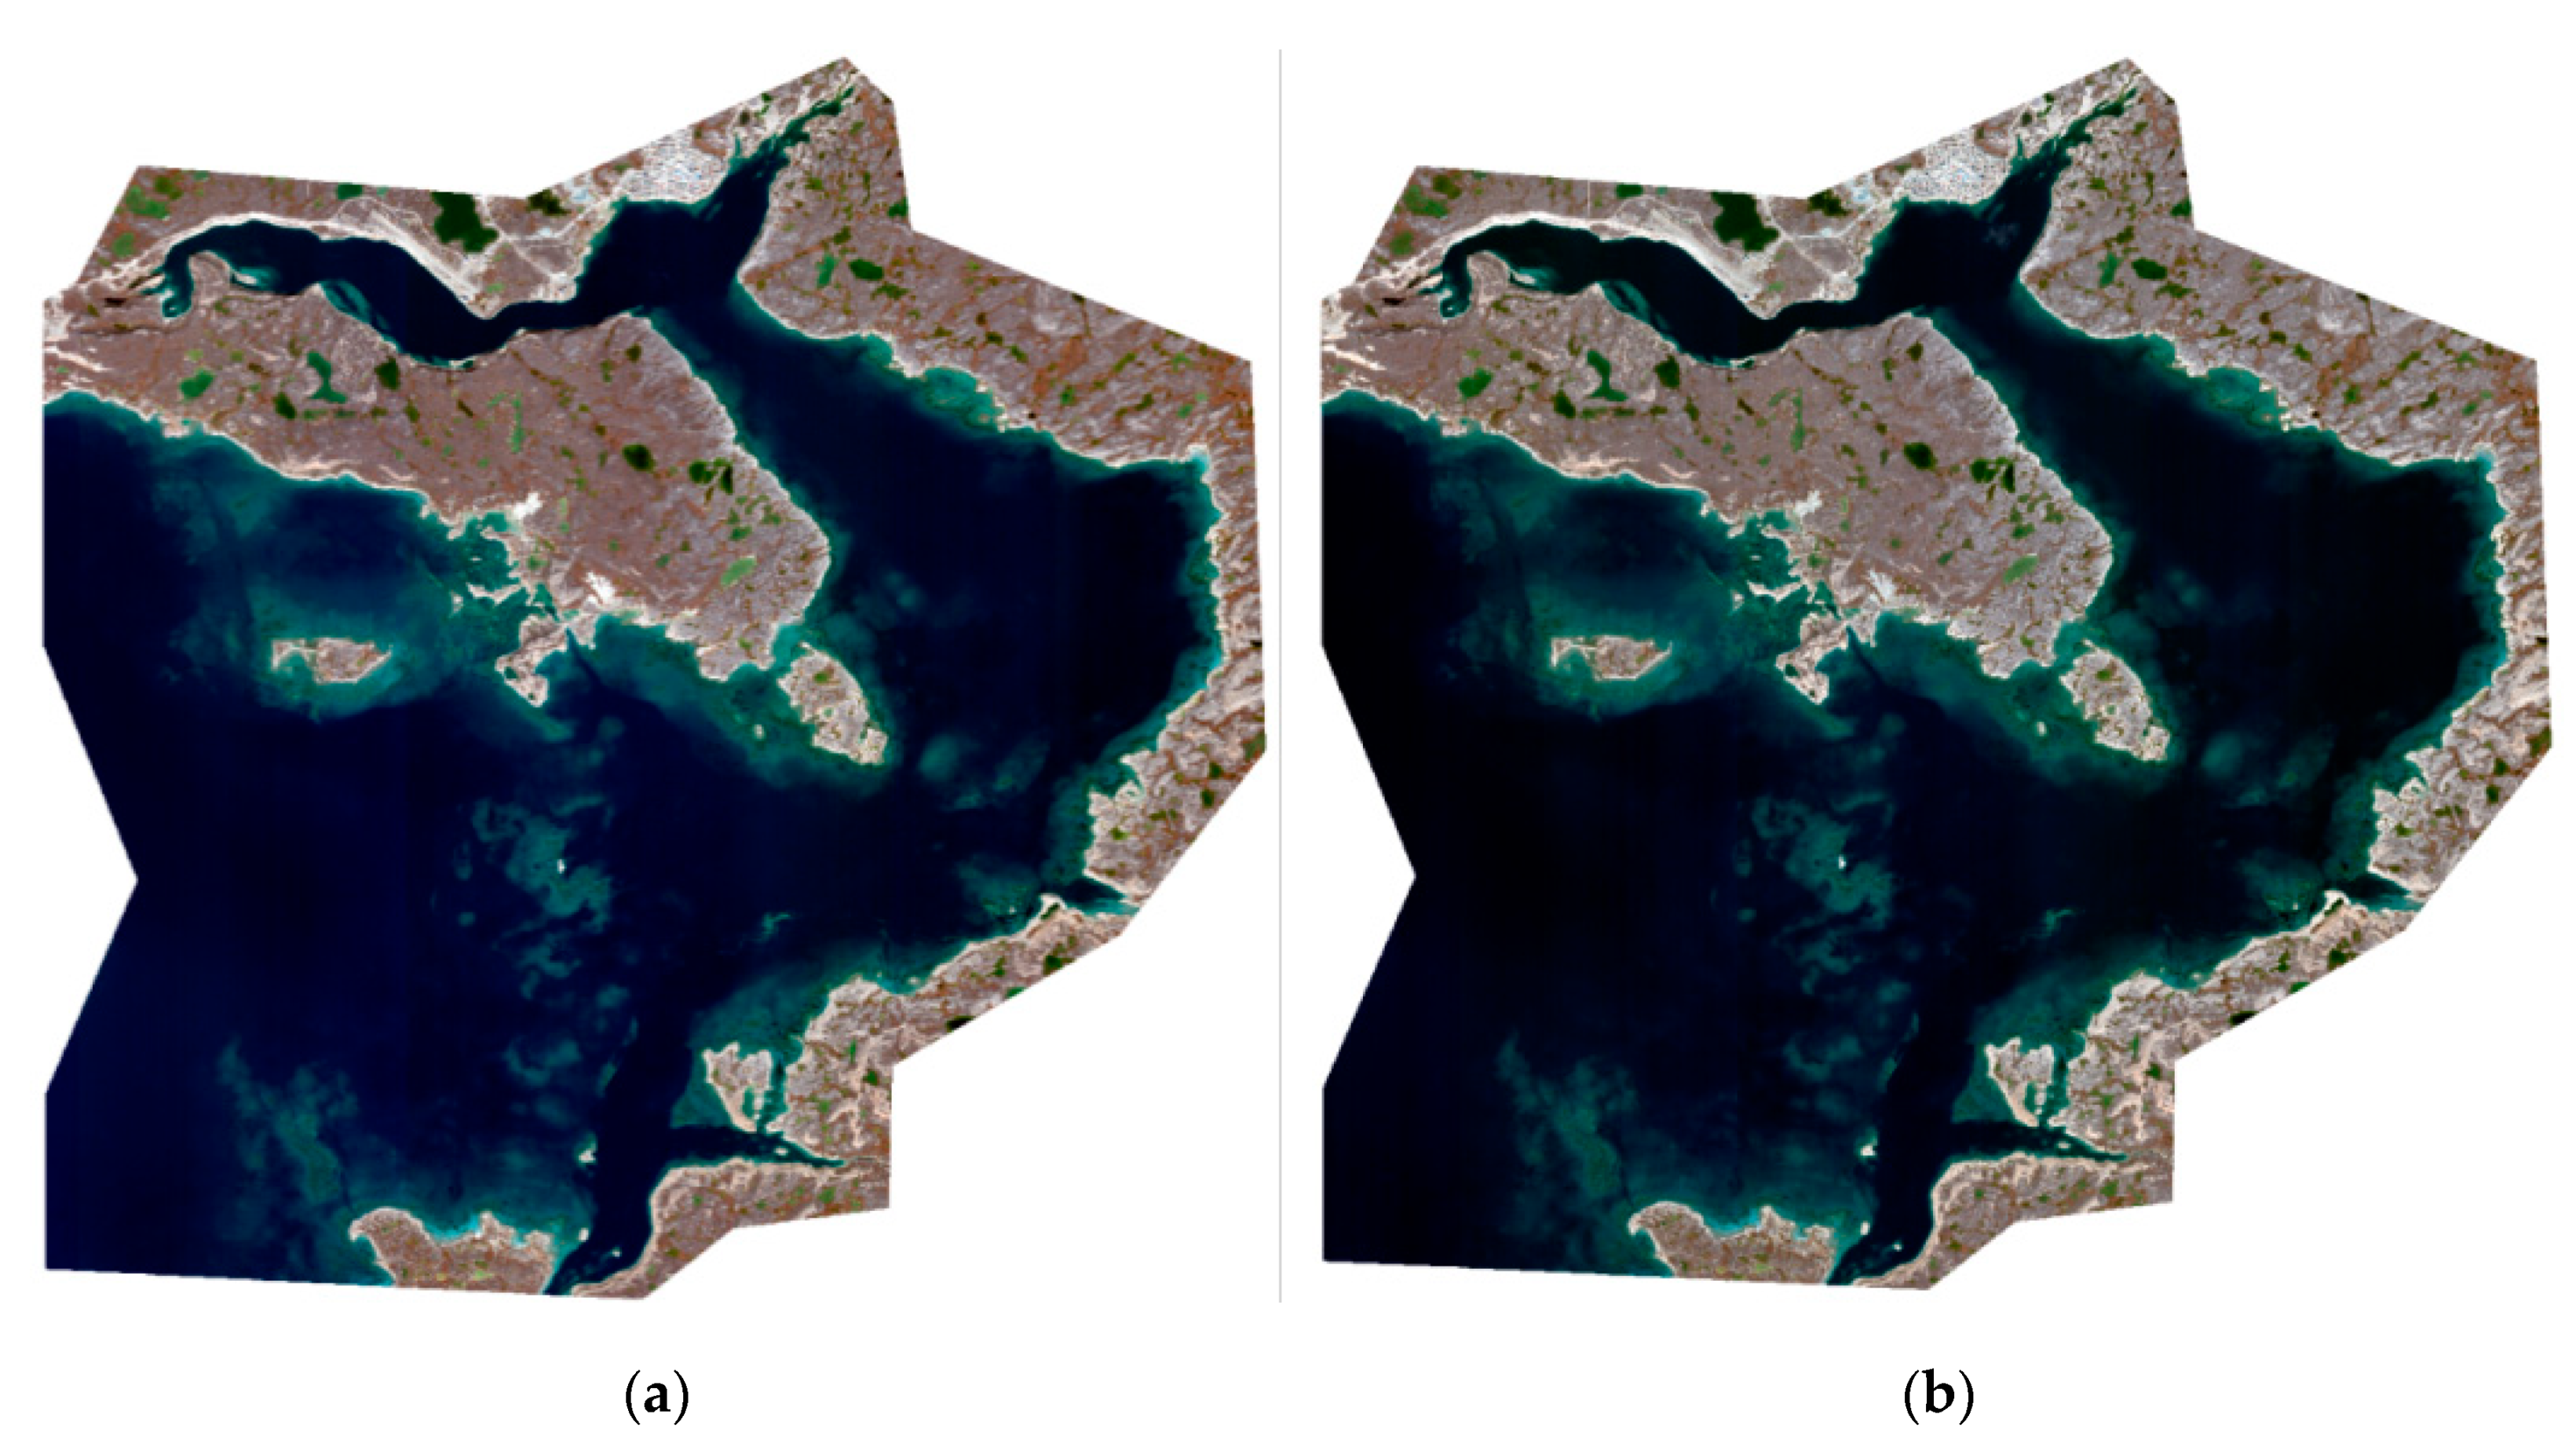
A WorldView-2 stereo pair acquired on 20 September 2015 over Cambridge Bay was used for this study (
Figure 2). The forward image was used for the empirical and classification SDB approaches.
Table 1 provides details of the viewing geometry for the image pair.
2.3. Hydrographic Surveys
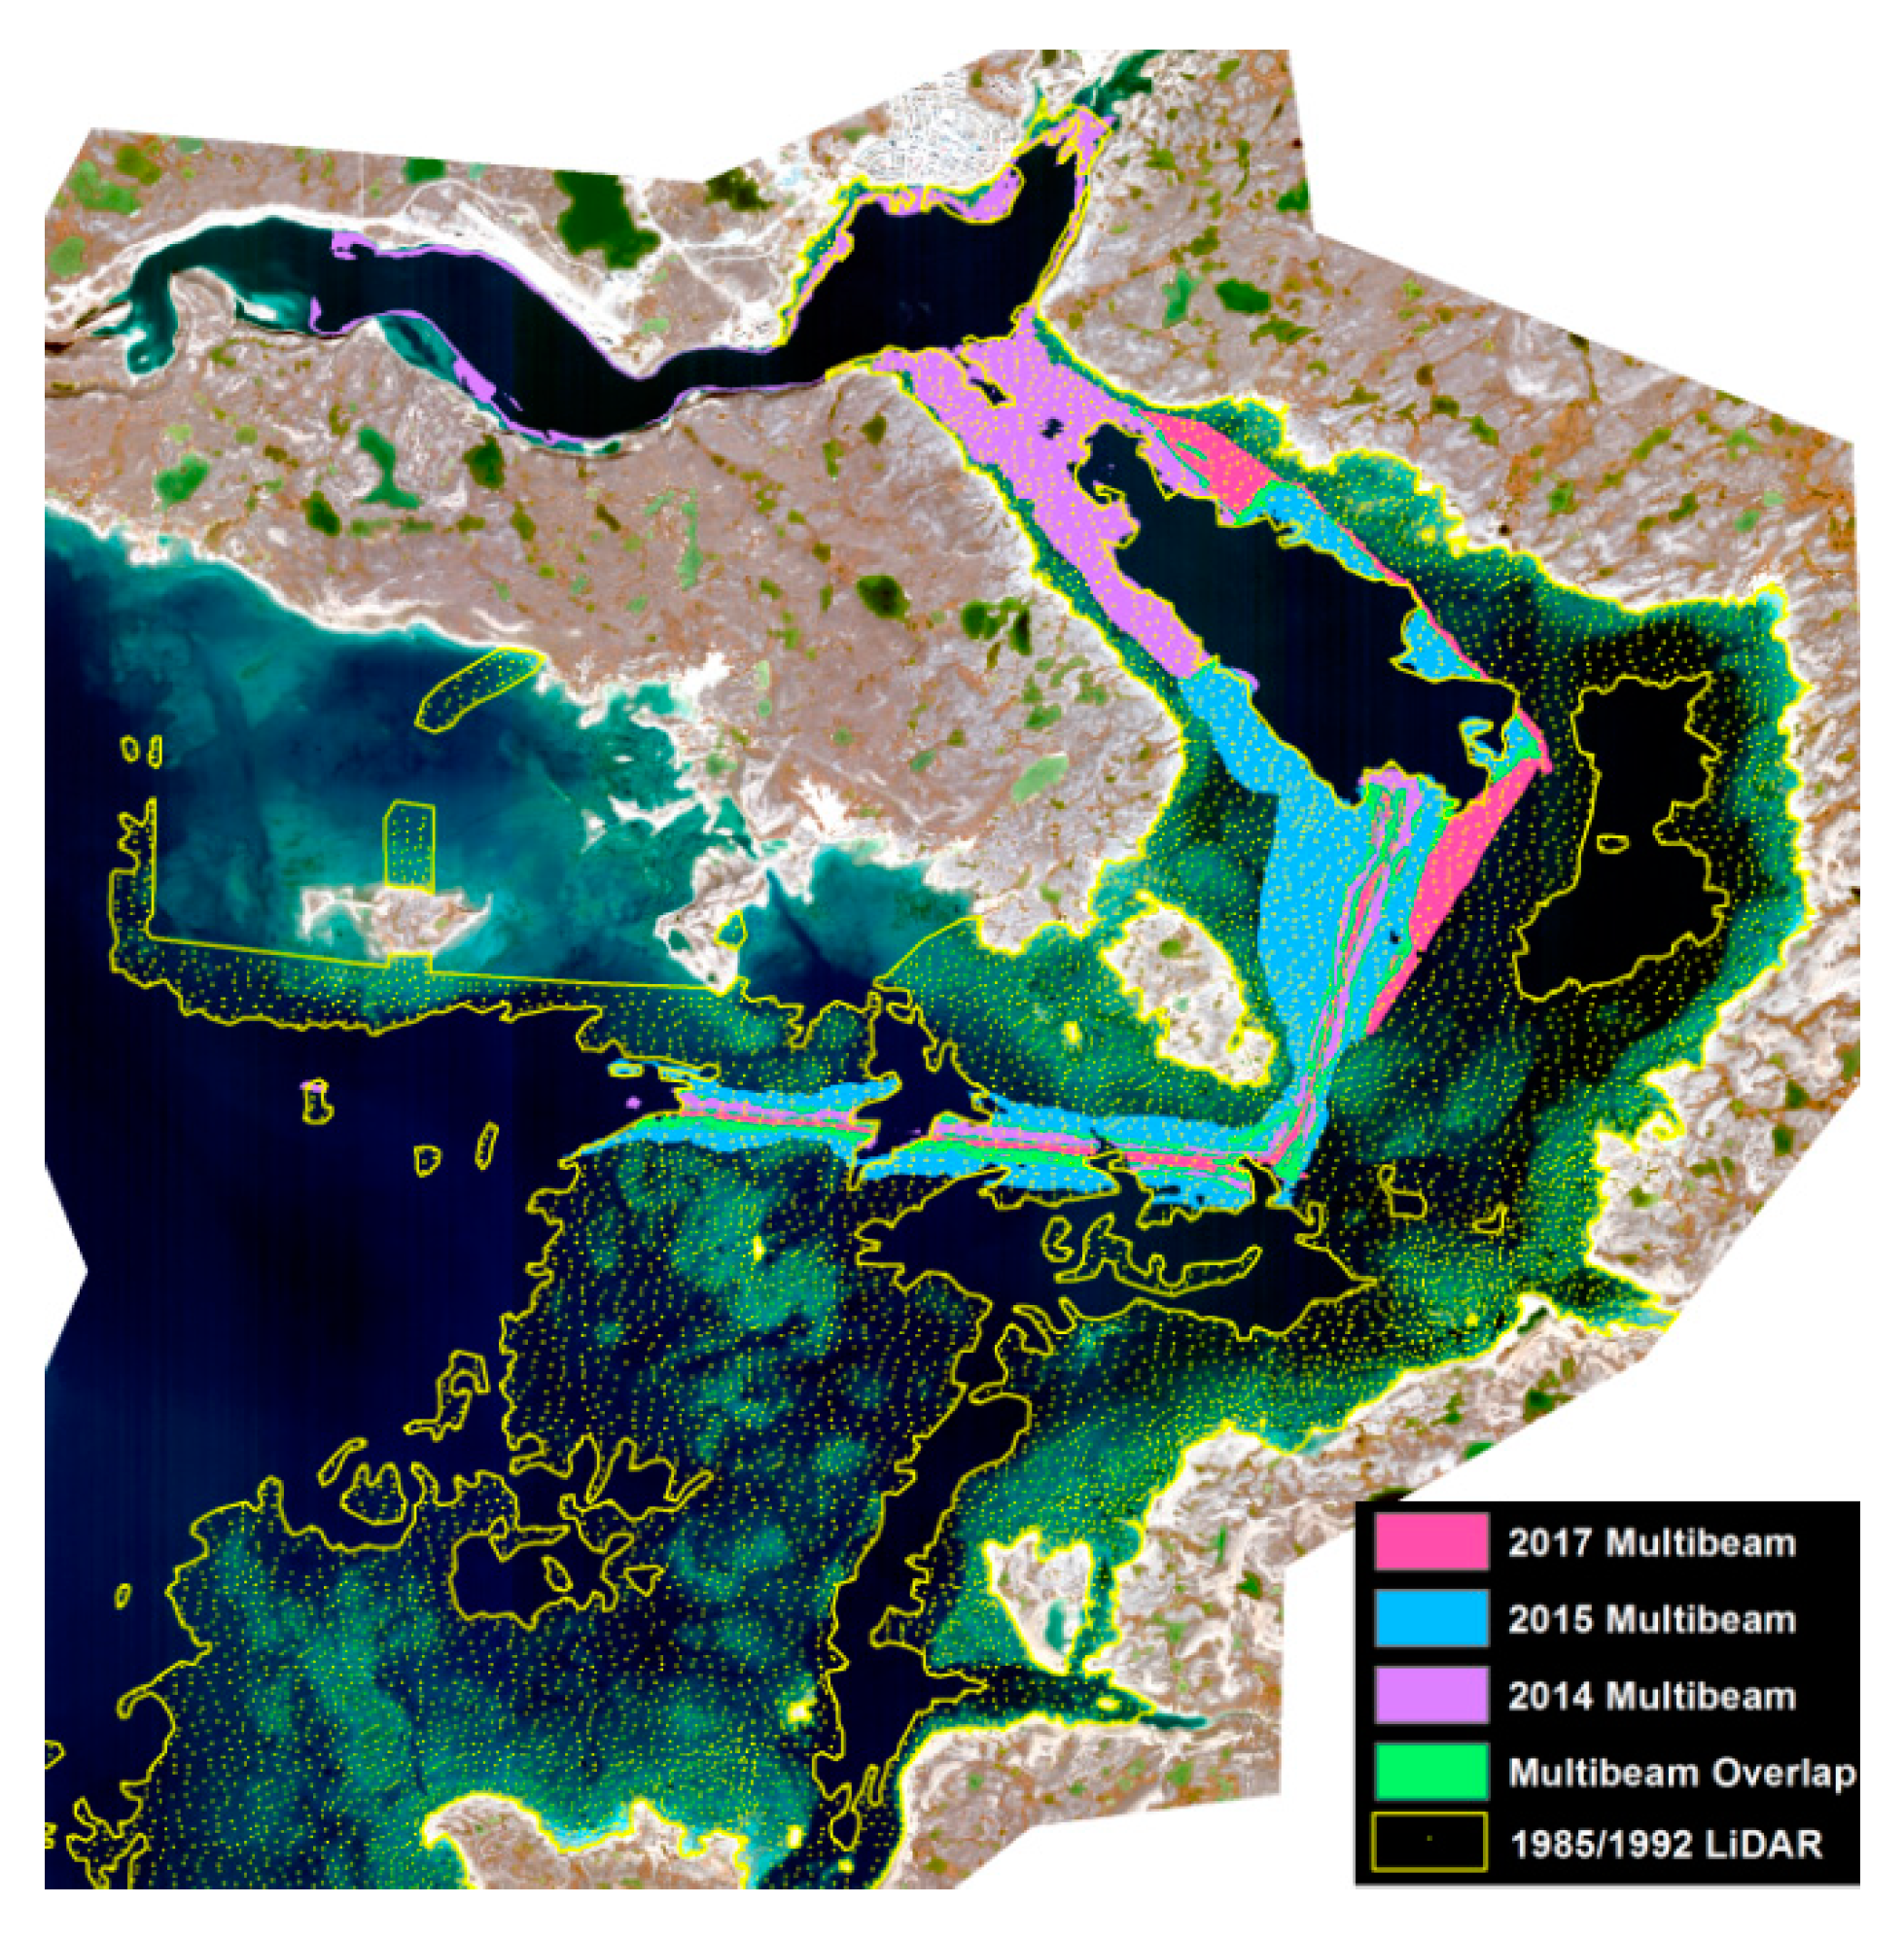
For this research, in situ hydrographic information was required for two aspects of the study: training the models used for the empirical and classification approaches and for assessing the accuracy of all techniques. The in situ dataset is composed of five CHS hydrographic surveys: three multibeam sonar surveys acquired in 2014, 2015 and 2017, as well as two Light Detection and Ranging (LiDAR) surveys acquired in 1985 and 1992 using the Larsen 500 system (
Table 2). The age of the LiDAR datasets is less than ideal and results in some uncertainties relative to the multibeam datasets (refer to a detailed discussion in [
10]). Nevertheless, the LiDAR surveys provide an important source of validation information for shallow depths, particularly from 0–2 m. The geographic coverage of the LiDAR measurements is also more widespread than the multibeam surveys (
Figure 3), making it critical for understanding spatial patterns of uncertainty within the SDB estimates.
2.4. SDB Methods
SDB estimates were derived independently from the WorldView-2 imagery through four techniques as described below. The results from these techniques were then used to develop final SDB estimates through the level of confidence approach.
2.4.1. Empirical
Empirical SDB methods develop a relationship between water depth (most commonly through in situ depth measurements) and optical band values to allow depth to be estimated across an image. For this study, the multi-band approach developed by Lyzenga [
2] was selected for use as it has consistently achieved good accuracy within previous CHS investigations [
9,
12]. This method first identifies water-leaving radiance (
) values for optically deep waters (
). The assumption is that any pixels containing values above
have contributions from the reflectance of the underwater surface, which is exponentially attenuated by the water column. Therefore, constants can be empirically determined to link the log-corrected difference between
and
of multiple bands to the depth, as shown in Equation (1) [
2]:
where
is depth,
indicates band specific parameters and
represents the empirically determined constants. Due to its characteristics, this method is strongly dependent on the input water depths used for training, as well as the characteristics of the imagery (e.g., degree of visibility to the bottom, sun glint presence, and atmospheric characteristics). The survey data used to supply training water depths represented the best available for the site, while the input WorldView imagery contained good bottom visibility, limited atmospheric influence and minimal sun glint.
The multi-band model assumes that the grey values of each band contain a linear relationship with water depth. To determine which bands were best to incorporate into the model for each study site, scatter plots of band values relative to survey depths were generated, allowing the degree of linearity of the relationship to be evaluated. For this study, WorldView-2’s blue, green, red and yellow multispectral bands were used.
2.4.2. Classification
A random forest decision tree classification [
13] technique was also applied. As a first step, training areas were delineated within the WorldView-2 image based on similar spectral characteristics. These polygons were then associated with specific depth classes (0.5 m intervals) using available hydrographic survey depths. The random forest classification was applied using these training areas with the WorldView-2 multispectral bands (red, green, blue and yellow) using the R statistical language [
14]. Similar to the empirical approach, the classification technique is sensitive to the water depths used for model development, as well as the characteristics of the imagery. However, the technique does not require each band to have a specific relationship with depth.
2.4.3. Automatic Photogrammetry
Automatic photogrammetric extraction combines the techniques of image matching with photogrammetric triangulation principles. The correlation coefficient method for stereo matching was developed in the 1970s [
15]. Since then, many improvements have been made to update image matching performance [
16,
17,
18]. Hirschmuller [
19] introduced the concept of a Semi-Global Matching (SGM) algorithm that is based on pixel by pixel matching between images forming a stereo pair. This algorithm is particularly useful when using high-resolution stereo pairs as identical features can be more easily identified between pairs within high-resolution data. This study used an SGM approach available in PCI Geomatica 2017 to automatically derive a digital surface model for the WorldView-2 image. A light refraction correction, as described in [
10], was implemented to account for the influence of refraction and the air-water interface.
Unlike the empirical and classification approaches, the automatic photogrammetric approach does not rely on in situ water depths for SDB estimation, preventing potential biases resulting from training data. However, the method is highly sensitive to site and imagery characteristics as contrasting features are required to support image matching. Through CHS’s initial evaluation of automatic photogrammetry for bathymetry estimation [
10], it was noted that this technique experienced challenges when attempting to match stereo pairs over homogeneous seabed areas. As well, areas containing strong temporal variability (e.g., areas containing waves) cannot be easily matched through this approach.
2.4.4. Manual Photogrammetry
Photogrammetry extracts three-dimensional information based upon two different scenes acquired in close succession with varying viewing geometry. These images are used to create a three-dimensional view, similar to the effect accomplished by human eyes. Photogrammetrists make use of binocular vision and depth perception to extract the XYZ coordinates of features in the stereo pair. Positions are computed through triangulation by considering the sensor’s viewing geometry at the time of acquisition. Here, a conventional photogrammetric analysis was used to manually extract depth from the stereo images using SOCET SET software. The photogrammetrist used a small number of the in situ survey data at different locations within the image to correct for the influence of light refraction and tidal effects on the estimated water depths when extracting the XYZ coordinates. Compared to the other approaches, the manual photogrammetry technique eliminates biases from sources of training information and limitations for automatic pair matching. However, this technique is strongly influenced by the individual completing stereo matching, leading to difficulties with result replication. The capability of manual photogrammetry for estimating water depth has previously been shown in [
10,
20].
2.4.5. Empirical and Classification Approach Training
For the empirical and classification approaches, a random sample of the available survey data was selected in order to develop the empirical model and train the random forest classification. For the empirical approach, survey data was restricted to areas of the bottom which were clearly visible within the imagery. Survey data over dark areas (e.g., underwater vegetation and deep water) were excluded. For the classification approach, survey depths from 0–20 m were retained for model training, as visibility through the water column was limited at greater depths. For both approaches, 10% of the survey data, which met these restrictions, was selected for training.
2.5. Level of Confidence Approach
The proposed level of confidence method operates through understanding the level of agreement between each of the applied SDB techniques. It aims to develop a final SDB estimate where the highest number of techniques agrees within a set difference range for the largest geographical area. This is achieved through the following steps:
The maximum allowable difference between the SDB estimates is determined. For this work, a difference of 1 m was selected as CHS aims to achieve SDB estimates within 1 m of real-world bathymetry.
Absolute differences are calculated between each applied technique (e.g., empirical minus classification, classification minus manual photogrammetry, etc.).
Pixels where all of the techniques agree within the defined difference level (i.e., 1 m) are identified. These represent locations where we can have the greatest confidence in the results, as all of the techniques are producing a similar answer.
A final SDB estimate is calculated via an average of the SDB results from all of the techniques for the identified pixels. This approach reduces the potential for outliers, which may occur if only a single technique was used to generate SDB for a given pixel.
Steps 2–3 are repeated iteratively to identify locations where fewer of the techniques agree within the defined level. For this work, the authors identified locations where three of the techniques agreed within 1 m, then where two of the approaches agreed.
Step 4 is then repeated for each examined technique combination, with averaged results derived only for pixels which were not present within the agreement between a higher number of combined techniques. For example, averaged SDB for locations where three techniques agree would not be calculated if for the same locations, four techniques agree, as the averaged result from the four techniques would be maintained.
2.5.1. Multi-Approach Combination
For step 5, noted above, there are multiple combinations of three and two techniques which can be selected. To determine which combination of techniques to incorporate into the multi-approach SDB model, as well as when to use them, the authors iteratively assessed the overall accuracy of each combination against available survey data (refer to
Section 2.5.2 below). Each combination was assigned a rank based on these accuracies. This rank determined the order in which each combination contributed to the final SDB estimate. Lower ranked combinations were only used for pixels which did not meet the defined 1 m agreement level within higher ranked combinations. Combinations incorporating a greater number of techniques were automatically assigned a greater rank, even if they achieved a higher root mean square error (RMSE). Pixels which did not demonstrate agreement within 1 m for any combination of techniques were excluded from the final SDB result, as were pixels which did not contain results from all techniques. The ranking technique provides the first iteration for automatically grouping the SDB of the different techniques into one model but as described in
Section 3.1, other factors can impact the results of the different approaches. In order to leverage the strengths of each approach as much as possible, it is important to complete a visual QC of each combination. The areas that match with three or more techniques are given a high level of confidence and therefore do not require manual intervention. Areas which only correlate with two or fewer approaches are given a lower level of confidence and should be reviewed visually to ensure that the best results are used in the final products.
2.5.2. Accuracy Assessment
Accuracy assessment was used to determine the rank of the various technique combinations (as described in
Section 2.5.1). In situ CHS survey data described in
Section 2.3 was used to calculate RMSE statistics for differences between SDB estimated depths and the in situ survey depths. Overall RMSEs were calculated for depths up to 10 m in order to understand the general accuracy of each combination. Greater depths were omitted from this assessment as some approaches experienced limitations when estimating deeper water.
Accuracy assessments were also completed for the final SDB estimate resulting from the level of confidence approach and for the individual SDB techniques. This allowed for an understanding of the degree of improvement in accuracy (if any) when implementing the level of confidence approach. For these assessments, the linear error at 90% (LE90) level of confidence was calculated for each approach, allowing for an understanding of the level at which 90% of SDB errors relative to survey data would be expected to occur overall and for specific depth ranges (e.g., 0–2 m). Calculation of LE90 allowed for a direct comparison with CATZOC requirements (see
Section 4.3). Overall bias was also calculated to allow for an assessment of the error trend for each approach.
3. Results
3.1. Individual Approaches
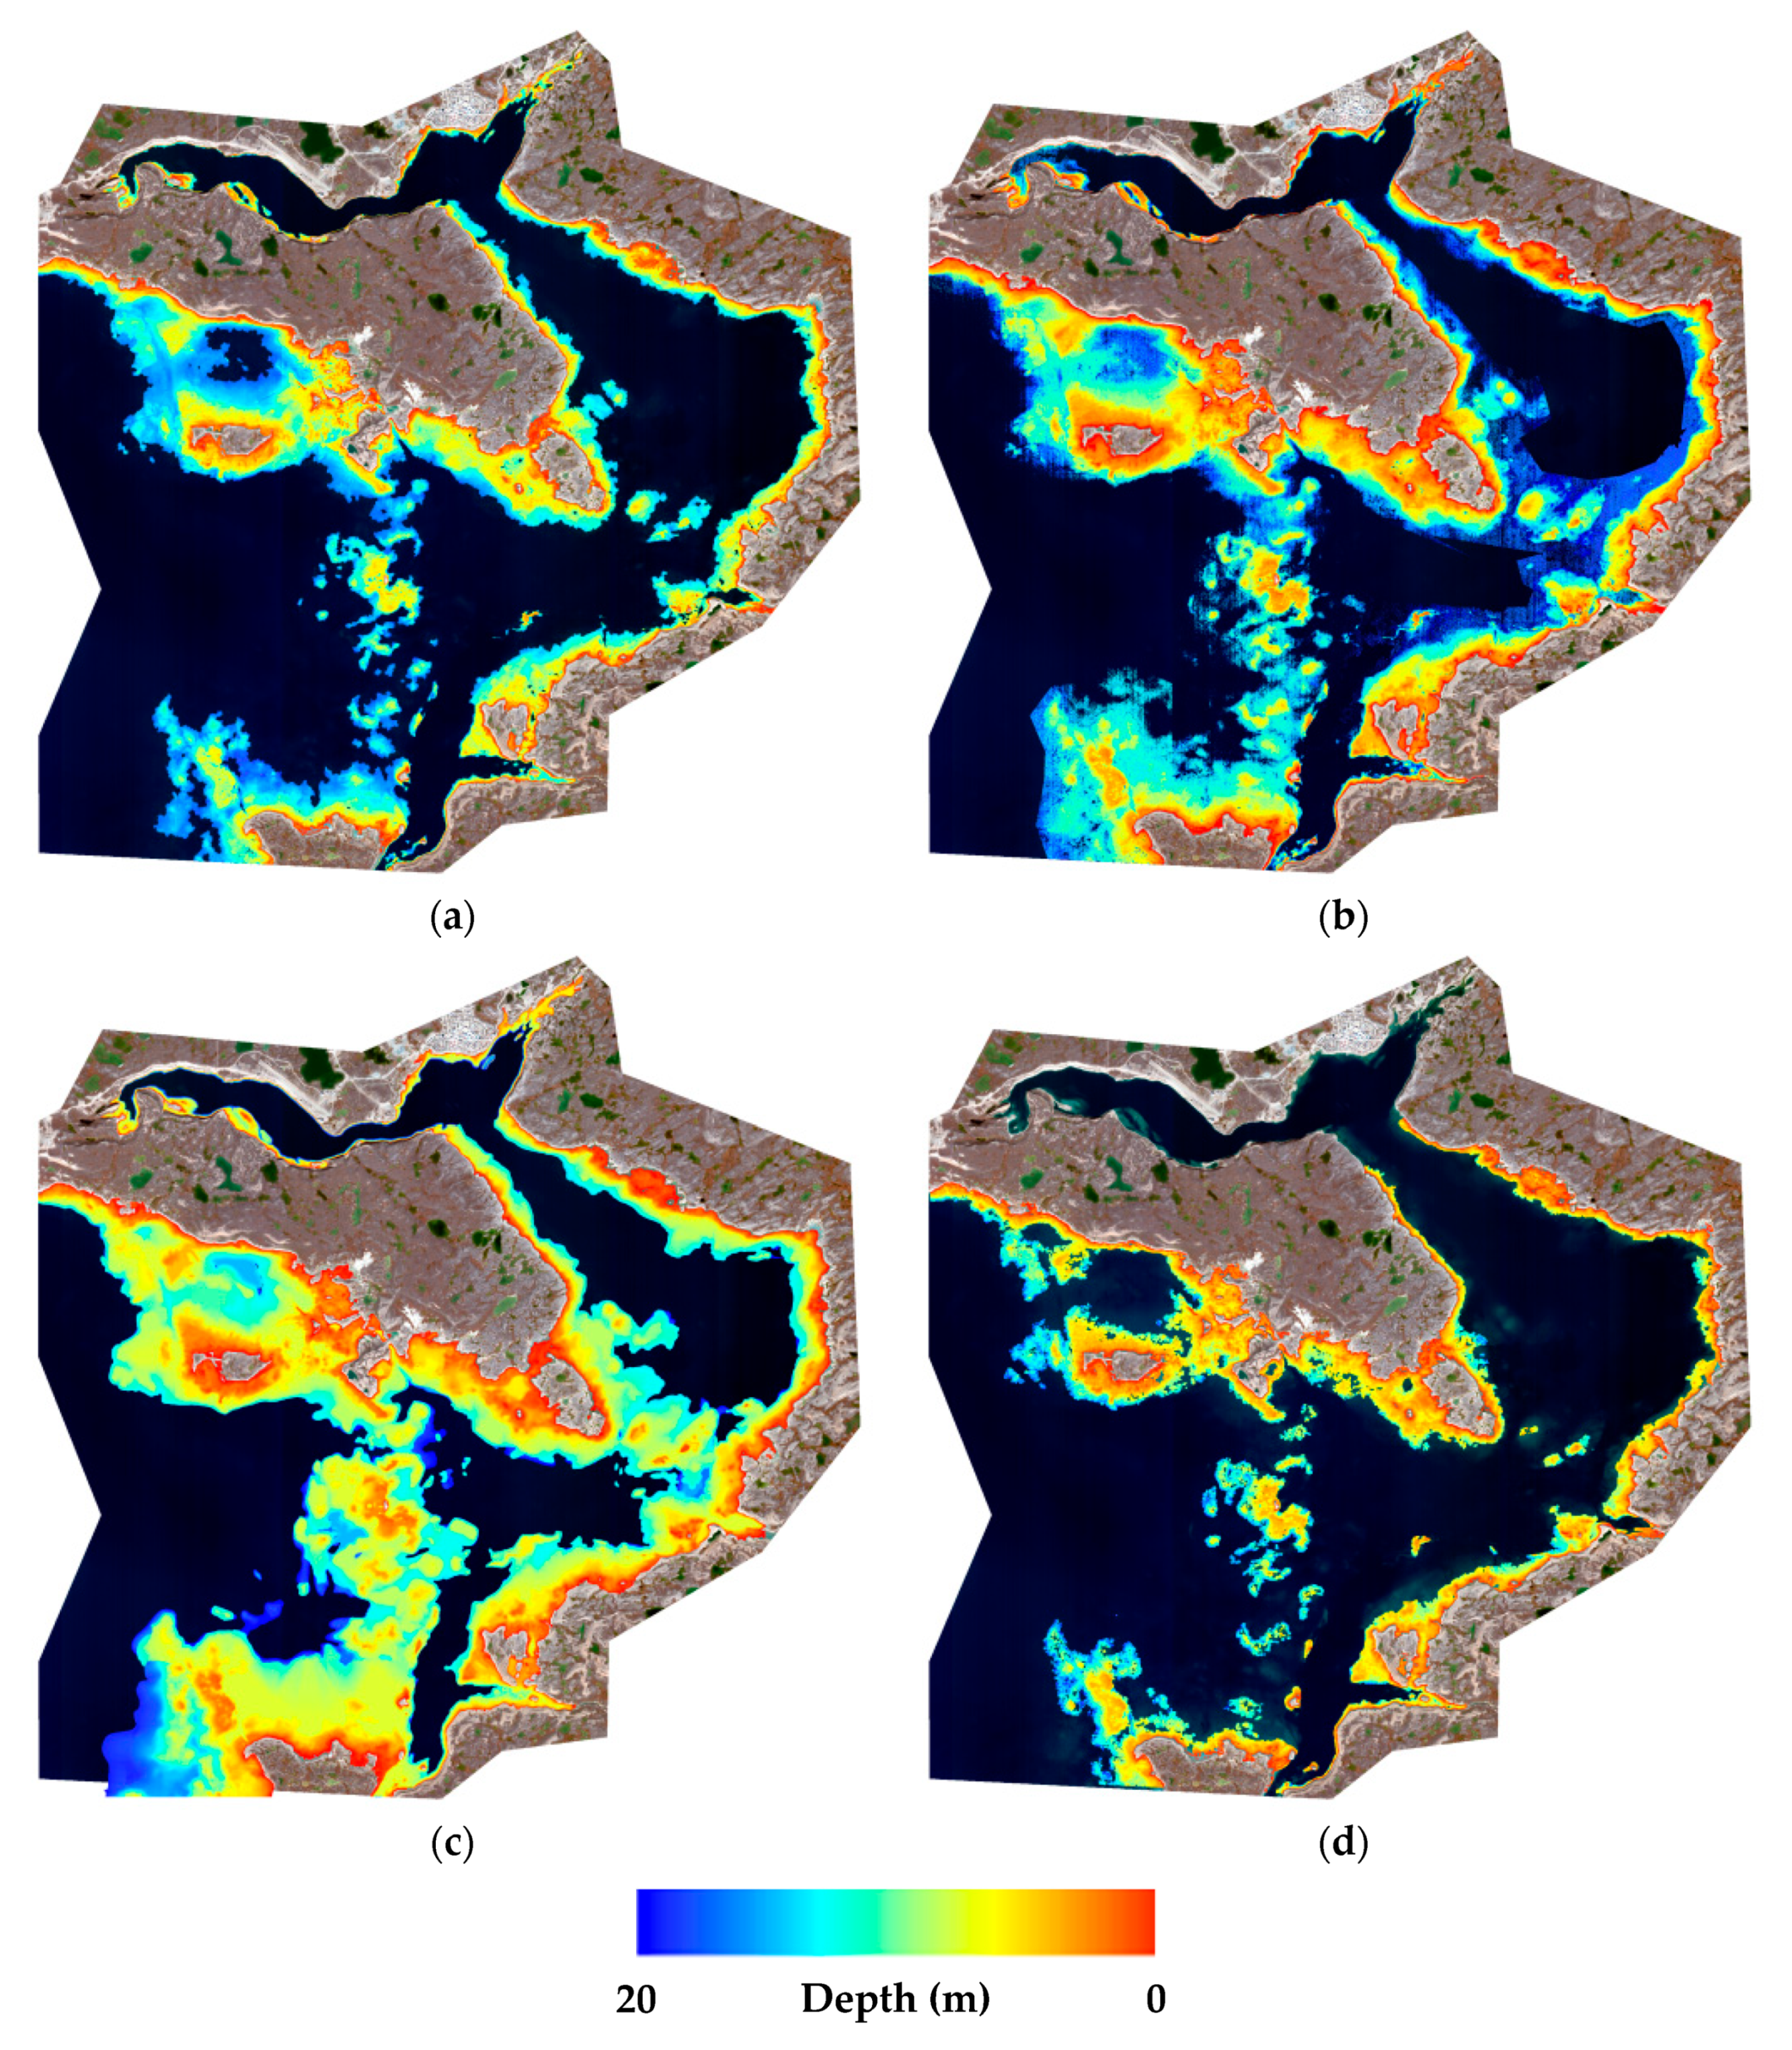
In terms of the total surface of bathymetry extracted after application of the four SDB methods, the manual photogrammetric extraction was the approach that provided the most SDB coverage, followed by classification, empirical and the automatic photogrammetric extraction approaches (
Figure 4). The manual photogrammetric technique extracted 100% of the area for depths from 0–20 m, which was followed by 81% from classification, 59% from the empirical method and 39% from the automatic photogrammetric approach.
Table 3 presents accuracy assessment results for each of the individual SDB techniques relative to the in situ bathymetric validation data. The individual SDB techniques generate good results in general, with most achieving LE90 near 1 m for individual depth ranges. The empirical approach provided the best overall result, with a LE90 of 0.95 m for depths from 0–10 m. Unfortunately, the limited stability of the empirical approach for depths of 0–4 m (possibly due to a lower number of survey points for these depths and/or an overreliance on LiDAR measurements) prevents application of the CATZOC A2/B classification. The automatic photogrammetry approach provided the second best overall accuracy followed by the manual photogrammetry approach. The automatic photogrammetry approach achieved good results for depths from 0–4 m, while the manual photogrammetry technique generated consistent results for all depth ranges, although at a worse level of confidence relative to most of the other techniques. The random forest results provided the worst level of confidence from 0–10 m but generated good results for shallow depths (up to 4 m). Based on these results, it is important to note that each of the approaches has strengths and weaknesses related to the depth ranges and the physical properties of the study site. While each technique is capable of generating good results for some depth ranges, there are clear inconsistencies in the stability of the results between techniques.
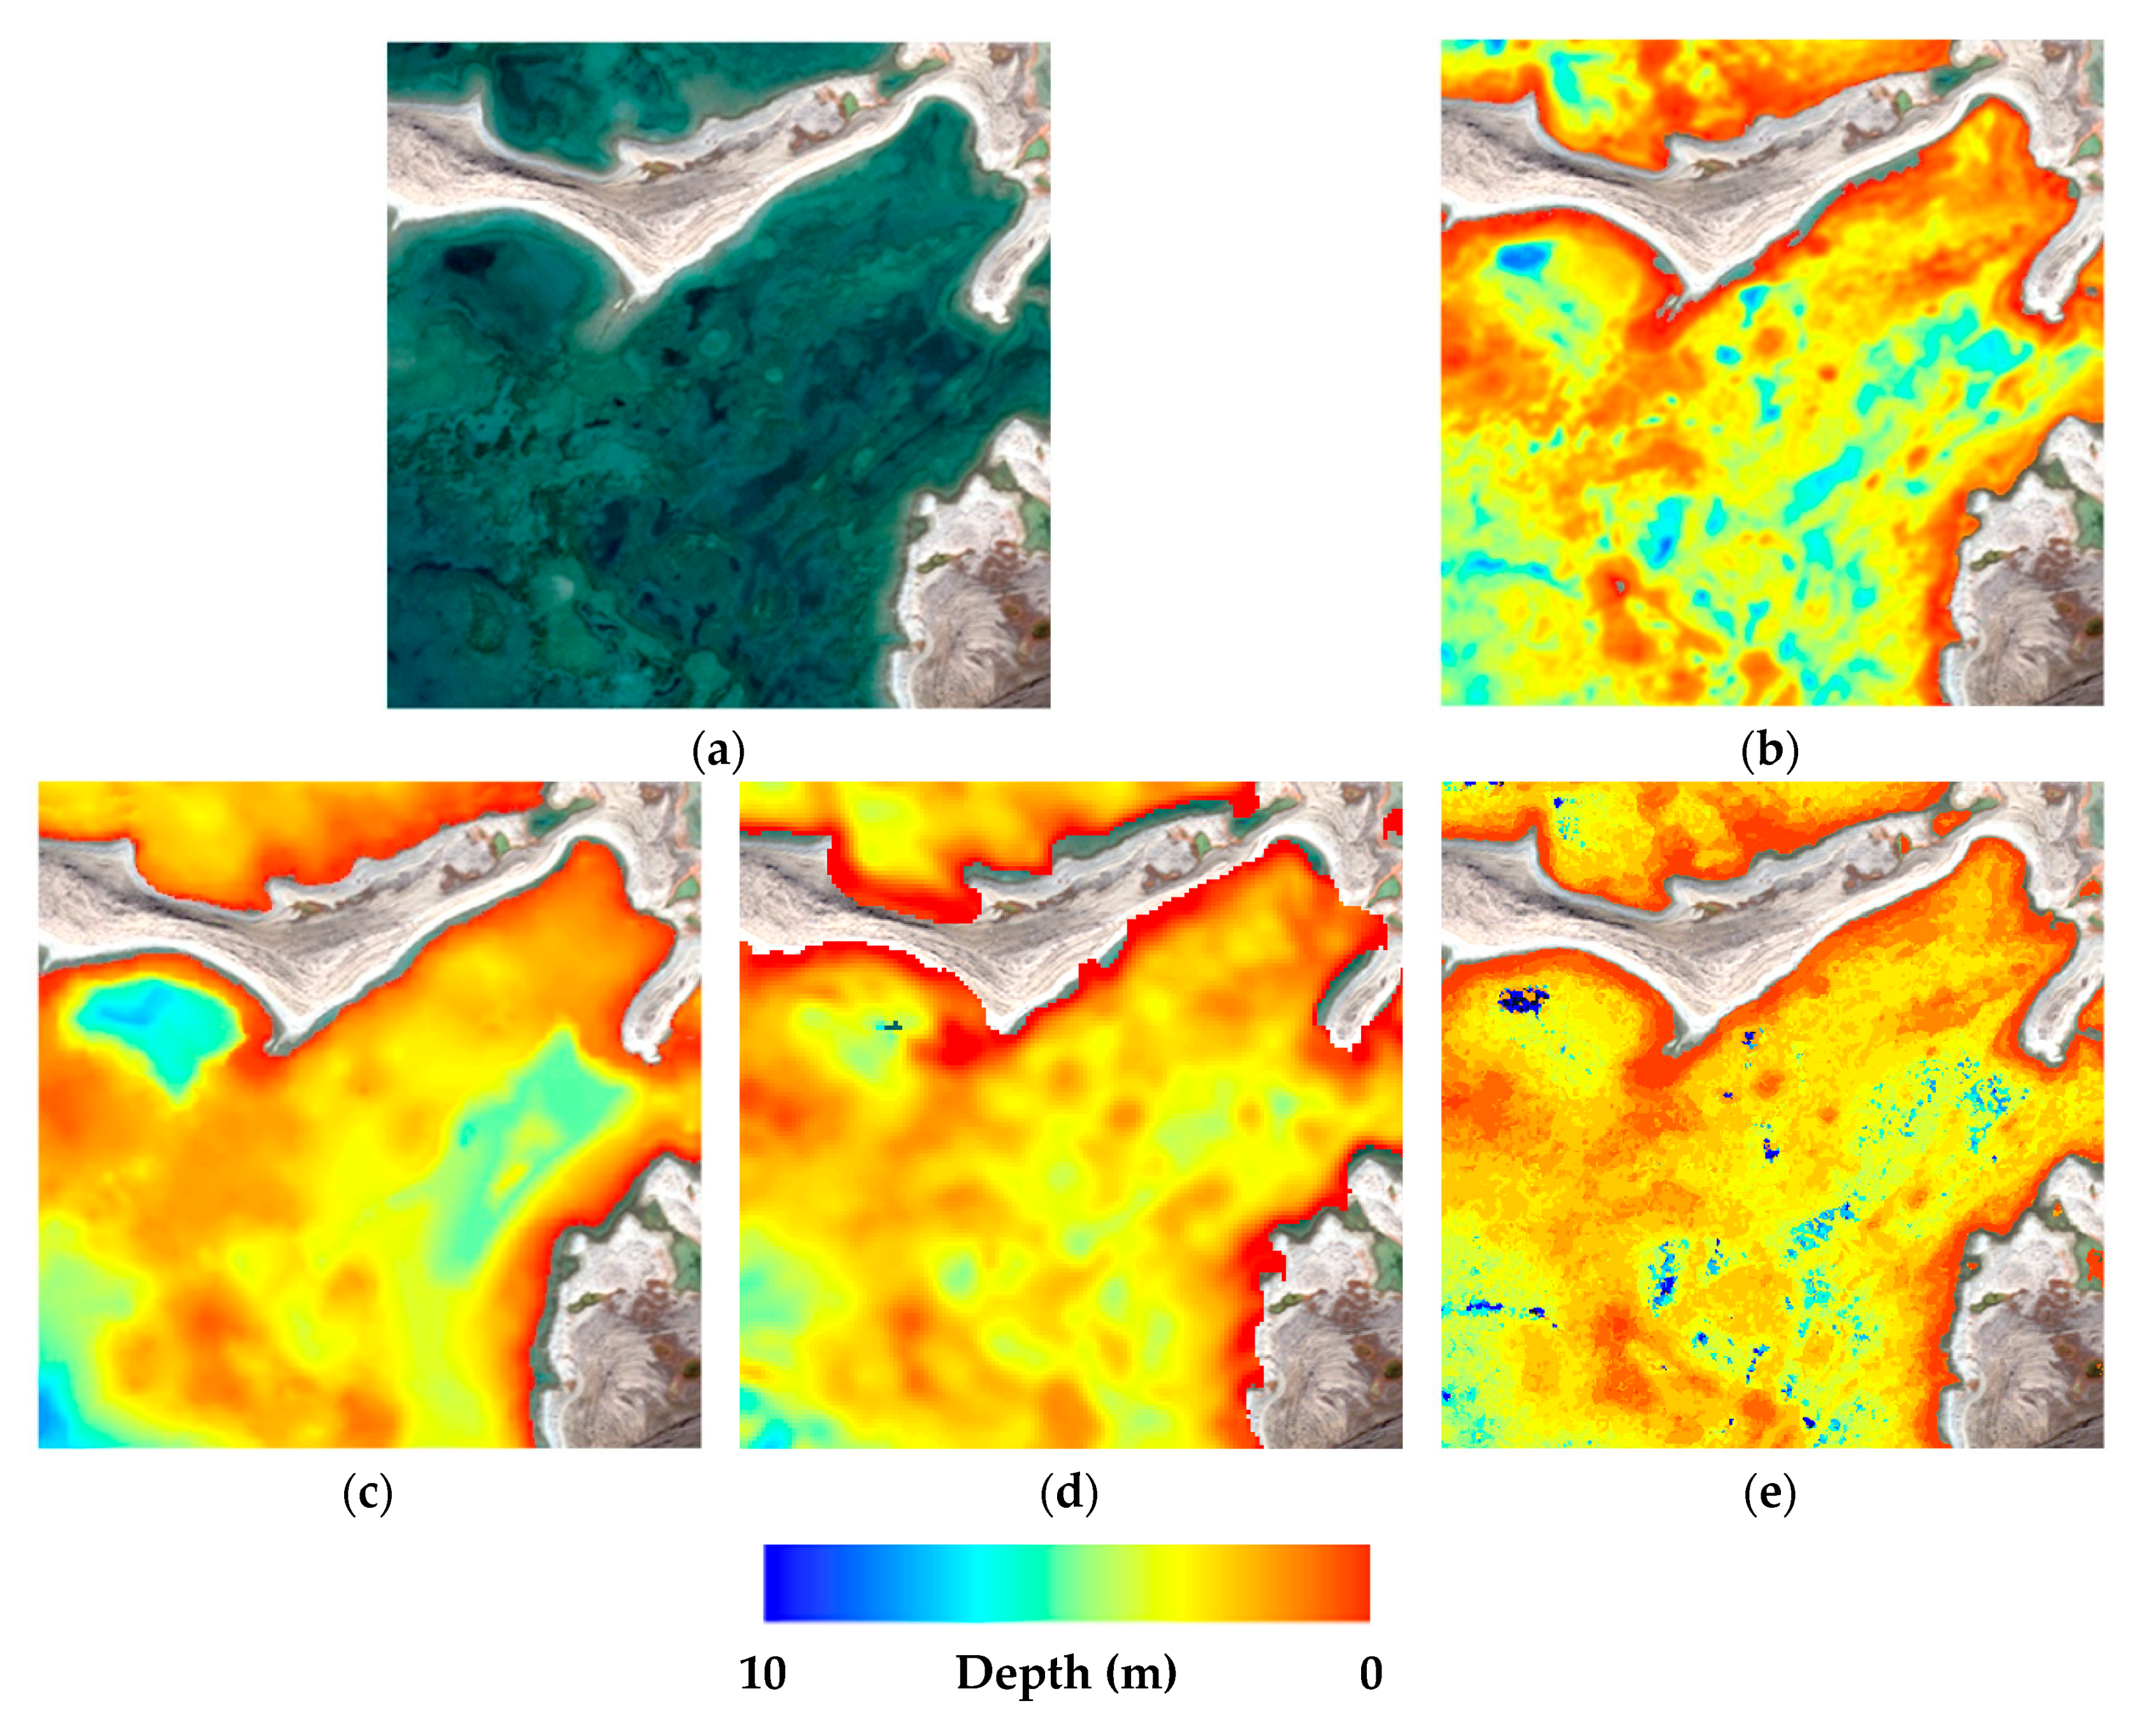
Other physical factors can play a major role in SDB accuracy and should be considered when selecting an approach. One of these factors is seabed type. For each of the investigated techniques, characteristics of the seabed can have beneficial and detrimental impacts. Dark features, commonly caused by underwater vegetation, are of particular concern for the empirical approach as they confuse dark features with deep water (
Figure 5). In contrast, the automatic and manual photogrammetric techniques are not affected by dark underwater features. The photogrammetric approaches actually benefit from such dark areas, as the edges generated by these features assist with image matching [
10,
20]. The benthic environment also creates challenges for the random forest classification but shows improved results over the empirical approach. This is mainly because the decision tree classification approach defines a particular rule set based on training area definition. The random forest decision tree model works better for capturing non-linearity in the data by dividing overall data into smaller sub-spaces (decision trees) based on the defined training classes. This impacts the overall result and is more apparent for distinction between dark features and deep water.
While the photogrammetric approaches benefit from a variable bottom, homogeneous bottom types (e.g., sand) can have a negative impact, particularly for the automatic method [
10,
20]. As the automatic photogrammetric technique is based on image matching, heterogeneity within the image facilitates pixel matching. Within homogeneous areas, the algorithm encounters difficulties with matching pixels, preventing a correlation from being achieved.
3.2. Level of Confidence and Multi-Approach SDB Model
Table 4 presents the overall RMSEs for each combination of techniques assessed for this study, along with the rank assigned to each combination. The percentage of the area covered by four, three and two combinations is also listed. This determined the order in which each combination was applied to generate the combined multi-approach SDB model.
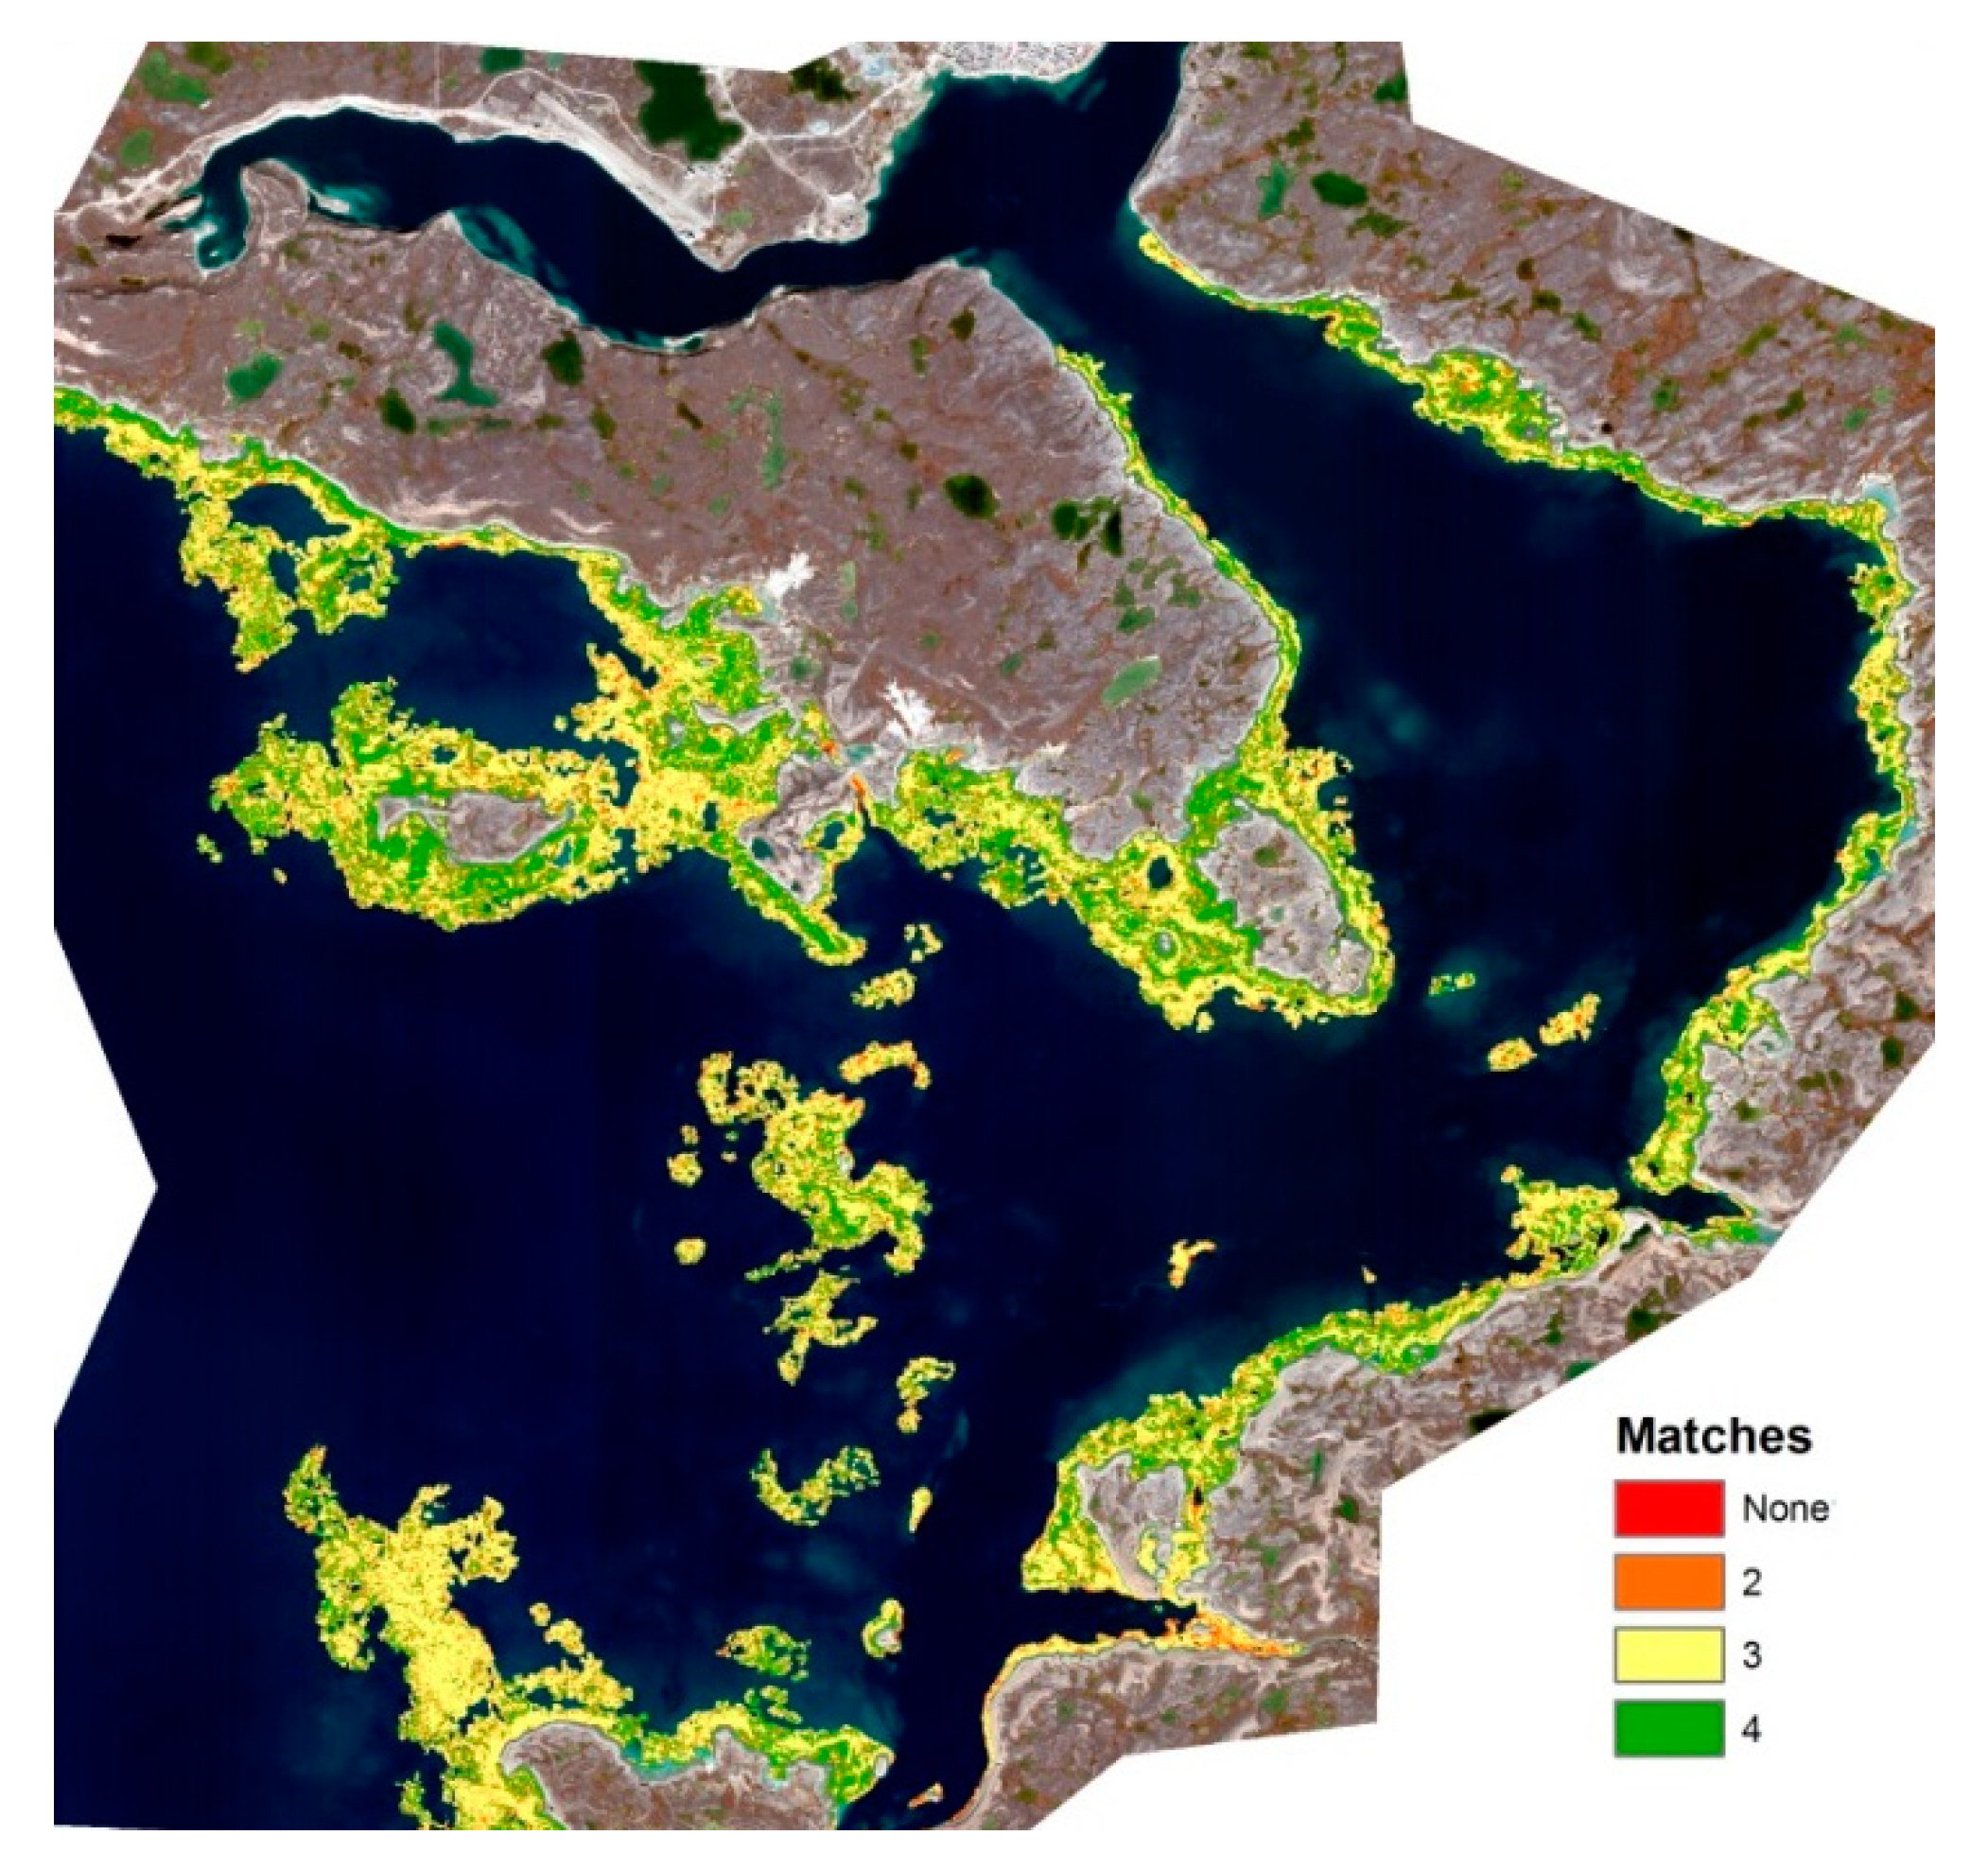
Figure 6 presents a geographical representation of the locations where four, three and two techniques agreed. 81% of the values were given a high level of confidence (i.e., at least three approaches agree) and therefore don’t need or require less QC. The values that agreed with at least two approaches represented 19% of the total overlap area; for these areas, a lower level of confidence is assigned and should be reviewed in the future by a remote sensing expert. The strengths and weakness of each approach as described in
Section 3.1 should be used to make appropriate decisions regarding which combination of techniques to use.
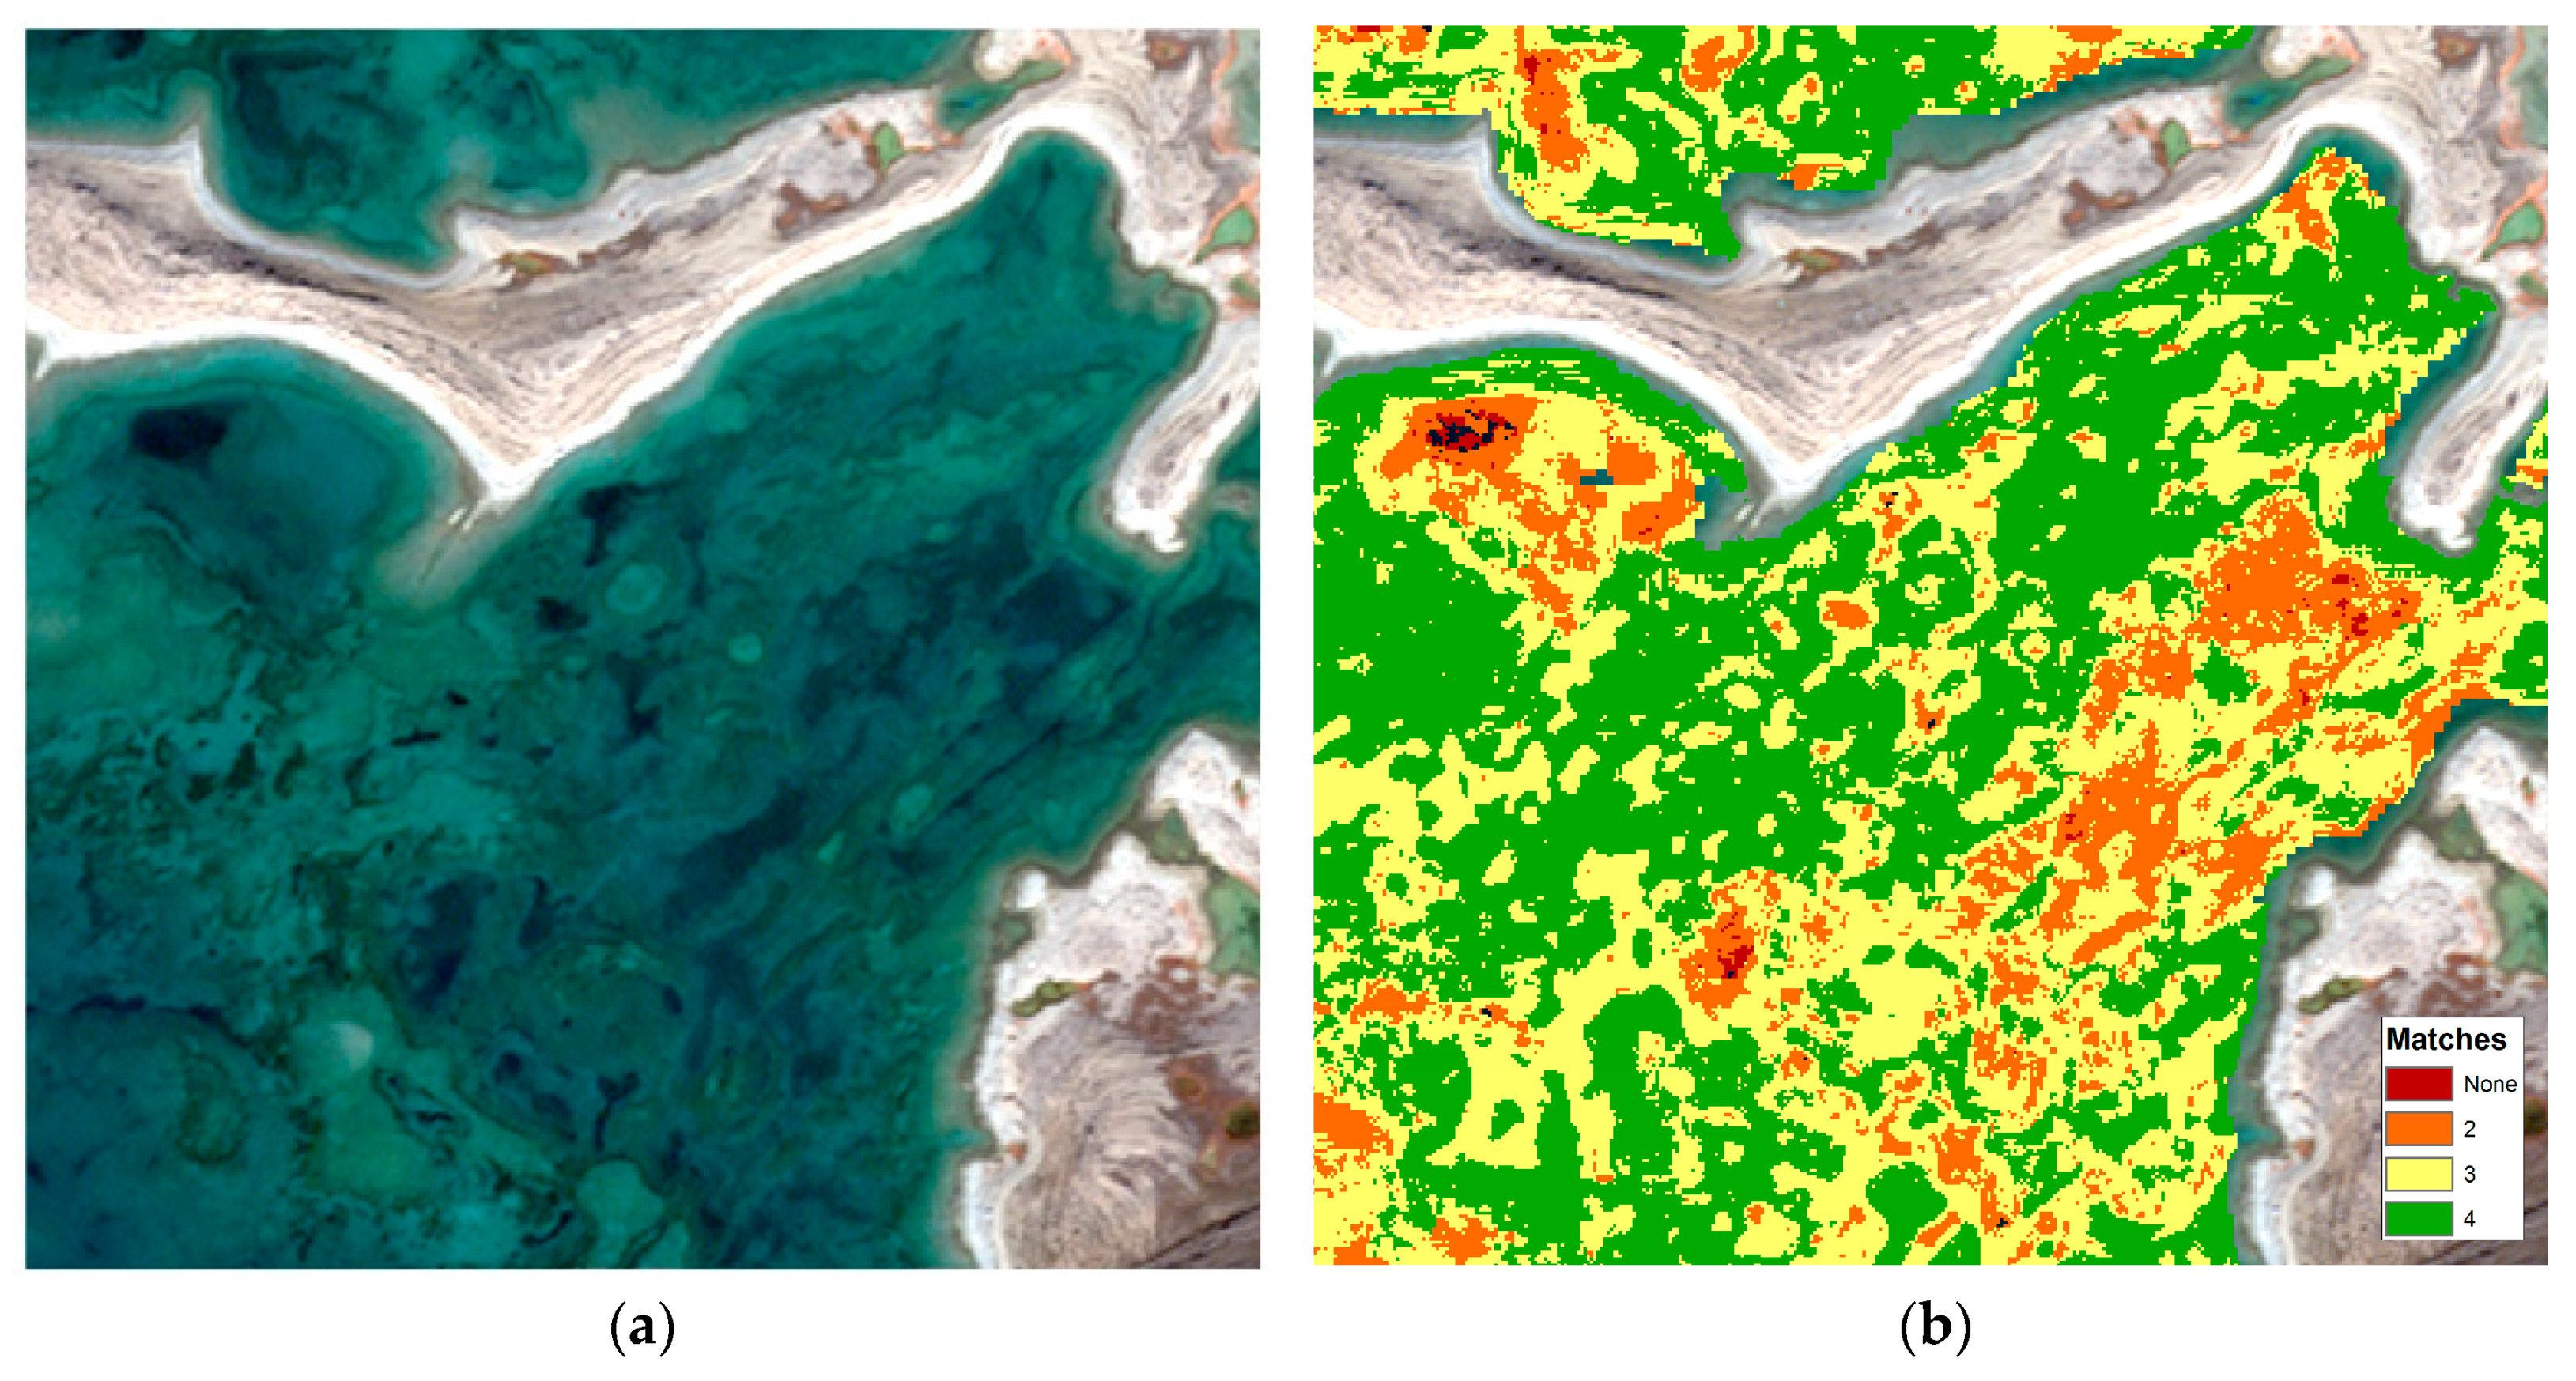
Figure 7 presents an example where the low level of confidence mask can be used as a QC tool. In this example, as the benthic environment is creating issues for the empirical and classification techniques, priority should be given to the photogrammetric approaches.
Table 5 presents accuracy assessment results for the final multi-approach SDB model. In order to compare the results against IHO requirements, LE90 was calculated for each depth range. Compared with results for the individual techniques (
Table 3), the averaging of the approaches reduced the bias to negligible levels, at less than 0.2 m for each quantity of combined combinations. By combining the agreement where four and three techniques agree we retain accuracy for 0–10 m depths. Similar results are also achieved for water deeper than 10 m; where four and three techniques agree, accuracies of 1.00 m and 1.24 m are achieved respectively.
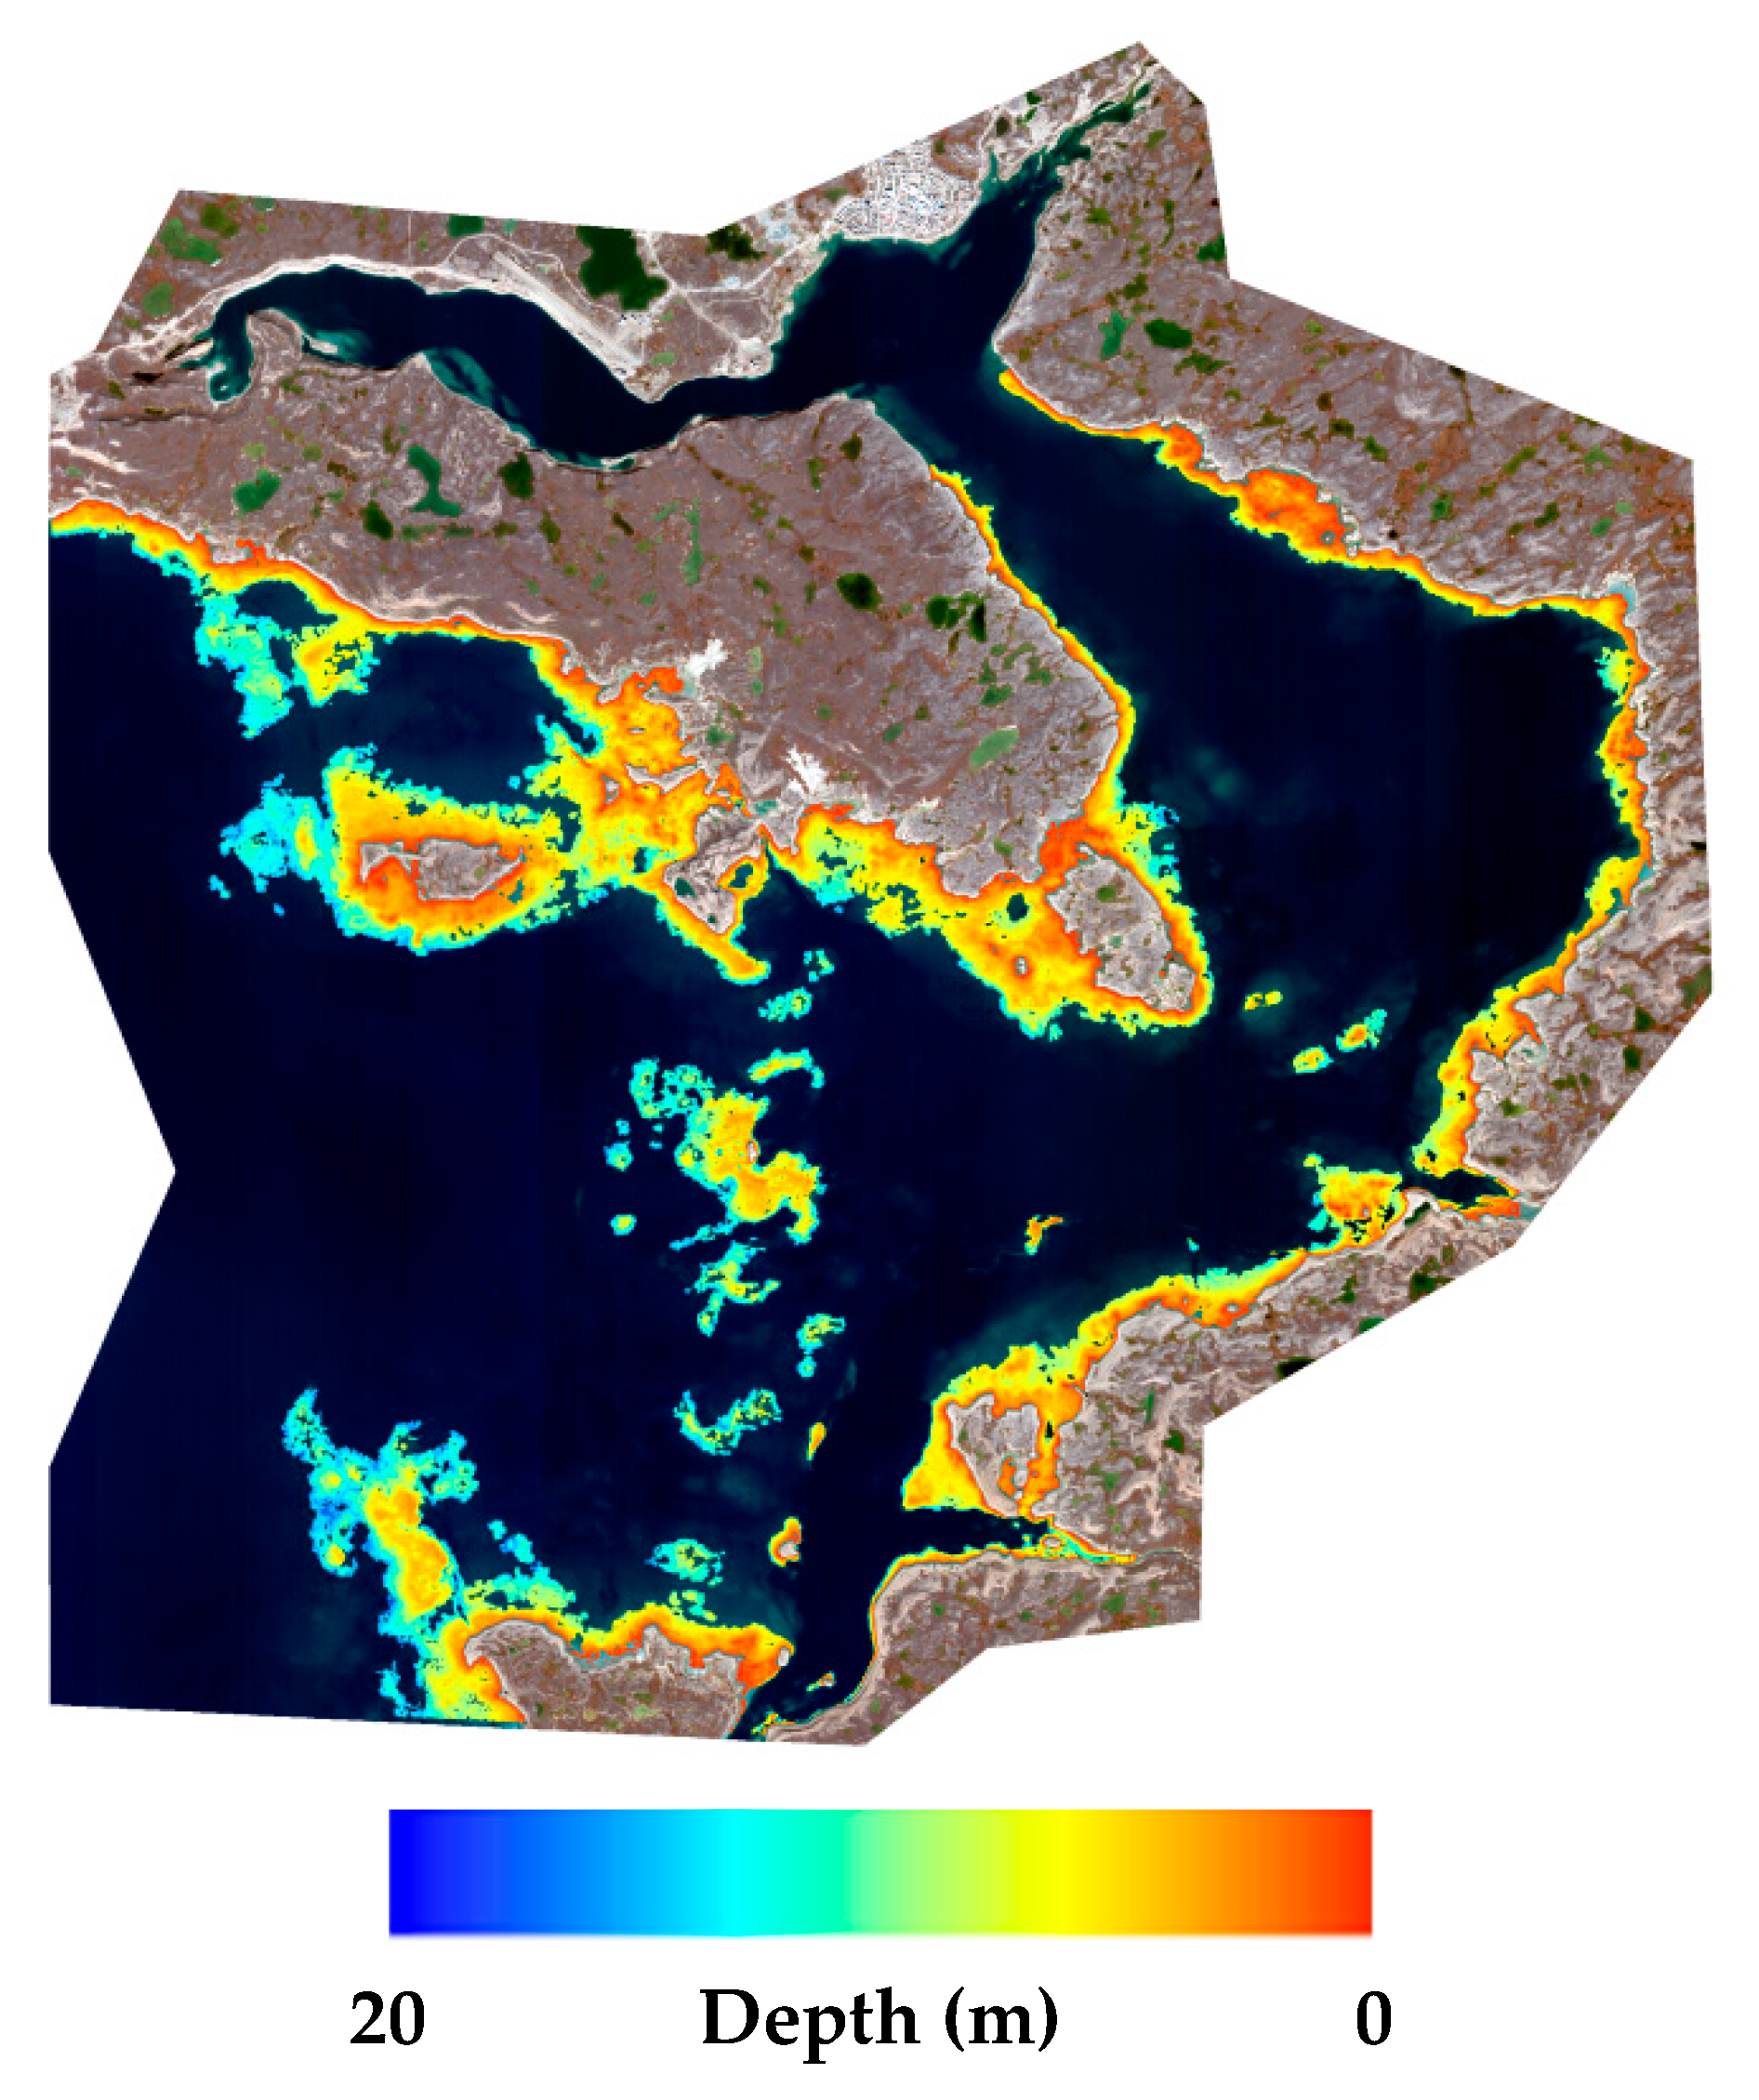
Figure 8 presents a visual overview of the multi-approach SDB results.
4. Discussion
4.1. Level of Confidence Accuracy Improvements
From the accuracy assessment results presented in
Table 5, using the level of confidence technique to build the multi-approach SDB model resulted in notable improvement to LE90 values for most depth ranges compared to results for the individual SDB techniques (
Table 3). While some of the individual techniques achieved better results for specific depth ranges, the multi-approach technique resulted in less variability across all depth ranges. This suggests that by combining separate SDB results through an agreement approach, the strengths of each technique are leveraged to generate an overall improved result. By averaging depth estimates from multiple SDB techniques, outliers from individual techniques are reduced, improving the overall quality of the SDB estimates. The proposed multi-approach technique not only improved the results and confidence in the data but it also reduced required QC effort, as the area that required more detailed QC was reduced to 19% of the site. In order to simplify the QC and make the process more automatic, a seabed type classification could be implemented in the ranking system. Rule sets could be established based on water depths, accuracy and seabed classification.
4.2. Geographical Coverage
The geographical coverage of individual SDB results (
Figure 4) is greater, in some cases significantly so, than the coverage offered by the level of confidence approach (
Figure 8). For some locations, this is due to only a single technique producing a result. Thus, an argument can be made that some results are unfairly excluded from the level of confidence technique due to the minimum requirement for the presence of results for at least two techniques at every pixel. However, for other areas, coverage is omitted from the level of confidence approach as none of the SDB techniques produced results within 1 m of each other. In such instances, the appropriateness of applying any SDB technique to these locations can be questioned. This is an important consideration for HOs where confidence in the information is a significant concern. While use of the level of confidence approach will result in reduced geographical coverage, HOs should be able to have greater confidence in the locations which retain coverage after the approach is applied.
4.3. International Standard Compatibility
The suitability of hydrographic surveys for charting applications is determined using the IHO S-57 standard [
11]. This standard defines CATZOC levels which contain depth accuracy specifications for specific depth ranges.
Table 6 presents a summary of the accuracy requirements for each CATZOC level for depths up to 30 m. SDB estimates will need to be assigned a CATZOC level to allow for incorporation into nautical products.
Comparison of the CATZOC definitions with SDB results derived for each technique (
Table 3) shows that all SDB estimates meet the CATZOC C level. For certain techniques and depth ranges, CATZOC A2/B accuracies are achieved. However, inconsistencies in the results between techniques across various depths highlight the instabilities present within individual approaches, limiting the degree of confidence which can be placed in any single approach. While each approach has the potential to achieve CATZOC A2/B level accuracy, there remains the potential for the presence of outliers throughout the area of coverage, particularly where survey data for validation is not available. This represents a significant hurdle for the incorporation of SDB within hydrographic products, as HOs require a high degree of confidence in the data they are using.
The application of the level of confidence approach resulted in improvements to overall accuracy as well as accuracies for specific depth ranges (
Table 5). While the improvement relative to individual SDB techniques is generally not substantial, result consistency and thus overall confidence is increased as more than one approach is known to be producing a similar result for the same location. This is particularly important for areas outside of in situ survey data coverage as it provides a partial form of validation. While not as robust as comparisons with in situ information, knowing that at least two or more SDB techniques agreed within a defined level is significantly better than having no understanding of SDB appropriateness outside of survey data locations. This represents an important consideration for HOs, especially as they work to assign CATZOC classifications to SDB estimates. By applying this technique, the results demonstrate that 81% of the total common SDB surface could now meet the CATZOC A2/B level requirements, the rest of the SDB surface could be classified as CATZOC C.
4.4. Hydrographic Office Use
CHS envisions several potential uses of the level of confidence approach by HOs to increase the incorporation of SDB within nautical products:
Specific agreement levels between SDB techniques can be determined for individual applications or geographic areas, allowing for flexibility depending on an HO’s needs.
A minimum number of approaches which would need to agree could be defined to restrict SDB use to only high confidence locations.
The approach may present an opportunity to more fully evaluate the application of physics-based SDB techniques, as their agreement relative to empirical and photogrammetric approaches can be assessed.
HOs can develop tailored combination and/or ranking approaches to suit their individual needs. For example, greater weight could be given to specific techniques in general or for defined geographic areas if desired.
4.5. Future Research
While the proposed approach suggests an interesting method to increase overall confidence in SDB results, its application would benefit from additional investigation:
Repeatability—this study represents a single application of the approach at one site. Additional implementations should be explored within other geographical regions to better understand the approach’s benefits and shortcomings.
Technique Weighting—this analysis treated all applied SDB approaches as equal when developing combinations and generating the final combined SDB estimate. However, there may be situations where certain techniques should be weighted more heavily than others (e.g., overall accuracy, representativeness of certain depths, and estimation accuracy for various bottom types). Understanding if and when certain approaches should contribute more to the level of confidence approach would likely further improve confidence in the approach’s results. This may also lead to options for retaining results for locations where only one technique generated SDB, if deemed appropriate.
Multiple Image Scenarios—while this paper used only a single image, for certain sites multiple satellite images may be available. Examining how the approach could be modified to understand how SDB results from multiple overlapping images could be combined to increase overall result confidence would be beneficial. The approach presented in [
21] may be an interesting starting point for such an investigation.
5. Conclusions
For many years, SDB has offered the potential of providing an additional accurate, inexpensive source of bathymetric information. While representing a potentially important data source for many HOs, uptake of SDB information for use in official nautical products has been limited. Much of the cause for this limited uptake is due to the level of confidence which HOs are comfortable placing in data sources. Identified as a common theme during the first IHO supported International Hydrographic Remote Sensing workshop (the workshop was hosted by CHS in collaboration with Service Hydrographique et Océanographique de la Marine (SHOM) and the National Oceanic and Atmospheric Administration (NOAA), 18 to 20 September 2018, Ottawa, Ontario, Canada.), HOs will not utilize SDB information unless it can be validated.
Within this paper, CHS has proposed a level of confidence approach to allow for combinations of SDB estimates obtained from multiple techniques where they agree within a defined level (e.g., 1 m). Through a ranking scheme, various combinations of techniques are built up to generate a final SDB estimate where agreement is highest amongst the most techniques for the largest possible area. Results presented in this work illustrate that the level of confidence approach improved LE90 statistics overall and for individual depth ranges in most cases. CHS’s overall confidence in the level of confidence results was also increased, as for all locations containing SDB estimates, at least two applied techniques demonstrated agreement within 1 m.
CHS believes the proposed technique will allow HOs to obtain greater confidence in SDB results, allowing for wider implementation within nautical products. HOs will be able to define a required agreement level and also determine an appropriate number of techniques which should agree to allow SDB estimates to be produced for an area. The approach also allows for a better understanding of the appropriateness of SDB techniques within areas where no in situ survey data is present, allowing for a form of validation for the entire geographic coverage of SDB estimates. While representing an interesting first step, future research will be required to understand the repeatability of the approach, the potential for adding weighting approaches and how the technique could be used to combine SDB results obtained from multiple images.
Author Contributions
Conceptualization, Supervision, Project Administration and Funding Acquisition, R.C.; Methodology, Formal Analysis and Investigation, R.C., R.A., M.S., M.-A.F. and Y.S.; Validation and Visualization, M.S.; Writing—Original Draft Preparation and Writing—Review and Editing, R.C., R.A. and M.S.
Funding
CHS received support through the Canadian Space Agency’s Government Related Initiatives Program to complete this work.
Acknowledgments
The authors would like to thank Matúš Hodúl, a M.Sc. graduate from the University of Ottawa, who worked at CHS during his studies and helped in the development of the automatic photogrammetric extraction process used in this study. The authors would also like to acknowledge the efforts of Effigis Geo Solutions, who completed manual photogrammetric image processing through a contract with CHS. Additionally, the authors wish to sincerely thank the Canadian Space Agency for their continued support, without which this work would not have been possible.
Conflicts of Interest
The authors declare no conflict of interest. The funders had no role in the design of the study; in the collection, analyses, or interpretation of data; in the writing of the manuscript, or in the decision to publish the results.
References
- Lyzenga, D.R. Passive Remote Sensing Techniques for Mapping Water Depth and Bottom Features. Appl. Opt. 1978, 17, 379–383. [Google Scholar] [CrossRef] [PubMed]
- Lyzenga, D.R. Shallow-water Bathymetry using combined LiDAR and Passive Multispectral Scanner Data. Int. J. Remote Sens. 1985, 6, 115–125. [Google Scholar] [CrossRef]
- Stumpf, R.P.; Holderied, K.; Sinclair, M. Determination of Water Depth with High-Resolution Imagery over Variable Bottom Types. Limnol. Oceanogr. 2003, 48, 547–556. [Google Scholar] [CrossRef]
- Lee, Z.; Carder, K.L.; Mobley, C.D.; Steward, R.G.; Patch, J.S. Hyperspectral Remote Sensing for Shallow Waters: 2. Deriving Bottom Depths and Water Properties by Optimization. Appl. Opt. 1999, 38, 3831–3843. [Google Scholar] [CrossRef] [PubMed]
- Hedley, J.; Roelfsema, C.; Phinn, S.R. Efficient Radiative Transfer Model Inversion for Remote Sensing Applications. Remote Sens. Environ. 2009, 113. [Google Scholar] [CrossRef]
- Mishra, D.; Narumalani, S.; Lawson, M.; Rundquist, D. Bathymetric Mapping using IKONOS Multispectral Data. GISci. Remote Sens. 2004, 41, 301–321. [Google Scholar] [CrossRef]
- Su, H.; Liu, H.; Heyman, W.D. Automated Derivation of Bathymetric Information from Multi-Spectral Satellite Imagery using a Non-Linear Inversion Model. Mar. Geodesy 2008, 31, 281–298. [Google Scholar] [CrossRef]
- Lyons, M.; Phinn, S.; Roelfsema, C. Integrating Quickbird Multi-Spectral Satellite and Field Data: Mapping Bathymetry, Seagrass Cover, Seagrass Species and Change in Moreton Bay, Australia in 2004 and 2007. Remote Sens. 2011, 3, 42–64. [Google Scholar] [CrossRef] [Green Version]
- Chénier, R.; Faucher, M.-A.; Ahola, R. Satellite-Derived Bathymetry for Improving Canadian Hydrographic Service Charts. ISPRS Int. J. Geo-Inf. 2018, 7, 306. [Google Scholar] [CrossRef]
- Chénier, R.; Faucher, M.-A.; Ahola, R.; Shelat, Y.; Sagram, M. Bathymetric Photogrammetry to Update CHS Charts: Comparing Conventional 3D Manual and Automatic Approaches. ISPRS Int. J. Geo-Inf. 2018, 7, 395. [Google Scholar] [CrossRef]
- International Hydrographic Organization (IHO). S-57 Supplement No. 3—Supplementary Information for the Encoding of S-57 Edition 3.1 ENC Data. International Hydrographic Organization, Monaco. 2014. Available online: https://www.iho.int/iho_pubs/standard/S-57Ed3.1/S-57_e3.1_Supp3_Jun14_EN.pdf (accessed on 5 June 2018).
- Ahola, R.; Chénier, R.; Faucher, M.-A.; Horner, B.; Sagram, M. Satellite Derived Bathymetry for Arctic Charting: A Review of Sensors and Techniques for Operational Implementation within the Canadian Hydrographic Service. In Proceedings of the SPIE 10784, Remote Sensing of the Ocean, Sea Ice, Coastal Waters and Large Water Regions, Berlin, Germany, 10–13 September 2018; p. 1078407. [Google Scholar] [CrossRef]
- Ho, T.K. Random Decision Forests. In Proceedings of the 3rd International Conference on Document Analysis and Recognition, Montreal, QC, Canada, 14–16 August 1995. [Google Scholar] [CrossRef]
- R Core Team. R: A Language and Environment for Statistical Computing. R Foundation for Statistical Computing: Vienna, Austria. 2018. Available online: http://www.R-project.org/ (accessed on 10 May 2018).
- Helava, U.V. Digital Correlation in Photogrammetric Instruments. Photogrammetria 1978, 34, 19–41. [Google Scholar] [CrossRef]
- Bulatov, D.; Wernerus, P.; Heipke, C. Multi-view Dense Matching Supported by Triangular Meshes. ISPRS J. Photogramm. Remote Sens. 2011, 66, 907–918. [Google Scholar] [CrossRef]
- Harwin, S.; Lucieer, A. Assessing the Accuracy of Georeferenced Point Clouds Produced via Multi-View Stereopsis from Unmanned Aerial Vehicle (UAV) Imagery. Remote Sens. 2012, 4, 1573–1599. [Google Scholar] [CrossRef] [Green Version]
- Knapitsch, A.; Park, J.; Zhou, Q.; Koltun, V. Tanks and Temples: Benchmarking Large-Scale Scene Reconstruction. ACM Trans. Graph. 2017, 36, 78. [Google Scholar] [CrossRef]
- Hirschmüller, H. Accurate and Efficient Stereo Processing by Semi-Global Matching and Mutual Information. In Proceedings of the 2005 IEEE Computer Society Conference on Computer Vision and Pattern Recognition, San Diego, CA, USA, 20–25 June 2005. [Google Scholar] [CrossRef]
- Hodul, M.; Bird, S.; Knudby, A.; Chénier, R. Satellite Derived Photogrammetric Bathymetry. ISPRS J. Photogramm. Remote Sens. 2018, 142, 268–277. [Google Scholar] [CrossRef]
- Traganos, D.; Poursanidis, D.; Aggarwal, B.; Chrysoulakis, N.; Reinartz, P. Estimating Satellite-Derived Bathymetry (SDB) with the Google Earth Engine and Sentinel-2. Remote Sens. 2018, 10, 859. [Google Scholar] [CrossRef]
Figure 1.
Location of the Cambridge Bay study site on Victoria Island, Nunavut.
Figure 1.
Location of the Cambridge Bay study site on Victoria Island, Nunavut.
Figure 2.
WorldView-2 stereo pair used for each Satellite Derived Bathymetry (SDB) technique. (a) Forward image, used for empirical and classification approaches. (b) Backward image, only used for photogrammetric techniques. Imagery © 2015, DigitalGlobe, Inc.
Figure 2.
WorldView-2 stereo pair used for each Satellite Derived Bathymetry (SDB) technique. (a) Forward image, used for empirical and classification approaches. (b) Backward image, only used for photogrammetric techniques. Imagery © 2015, DigitalGlobe, Inc.
Figure 3.
Spatial distribution of survey data up to 20 m in depth within Cambridge Bay. Note the wide coverage of the LiDAR survey relative to the multibeam datasets. Imagery © 2015, DigitalGlobe, Inc.
Figure 3.
Spatial distribution of survey data up to 20 m in depth within Cambridge Bay. Note the wide coverage of the LiDAR survey relative to the multibeam datasets. Imagery © 2015, DigitalGlobe, Inc.
Figure 4.
SDB results from the (a) manual photogrammetry, (b) classification, (c) empirical and (d) automatic photogrammetry techniques. Imagery © 2015, DigitalGlobe, Inc.
Figure 4.
SDB results from the (a) manual photogrammetry, (b) classification, (c) empirical and (d) automatic photogrammetry techniques. Imagery © 2015, DigitalGlobe, Inc.
Figure 5.
Results over dark features (e.g., underwater vegetation). (a) WorldView-2 image with underwater vegetation visible. (b) Empirical approach, (c) manual photogrammetric technique, (d) automatic photogrammetric technique and (e) classification approach. Note the greater depth variability in the empirical and classification results, likely due to dark feature presence. Imagery © 2015, DigitalGlobe, Inc.
Figure 6.
Visualization of locations where four, three and two SDB techniques agree within 1 m. Imagery © 2015, DigitalGlobe, Inc.
Figure 6.
Visualization of locations where four, three and two SDB techniques agree within 1 m. Imagery © 2015, DigitalGlobe, Inc.
Figure 7.
Illustration of potential use of the level of confidence technique for quality control (QC). (a) Section of WorldView-2 imagery and (b) the associated number of matching SDB approaches. Note that the number of matching techniques is lower for dark bottom areas, likely due to vegetation presence. Specific techniques can be targeted for areas where two or fewer approaches agree if they can be expected to perform better for those locations (e.g., photogrammetric techniques for heterogeneous bottom areas). Imagery © 2015, DigitalGlobe, Inc.
Figure 8.
Overview of the multi-approach SDB results. Imagery © 2015, DigitalGlobe, Inc.
Figure 8.
Overview of the multi-approach SDB results. Imagery © 2015, DigitalGlobe, Inc.
Table 1.
Image and stereo-pair geometry.
Table 1.
Image and stereo-pair geometry.
| Image Geometry | Forward Image | Backward Image | Stereo Geometry | Stereo Pair |
|---|
| In-Track View | 24° | −8° | Convergence | 36.3° |
| Cross Track View | 14.7° | 14.1° | BIE | 71.2° |
| Off Nadir View | 28° | 16.2° | Asymmetrical | 9.5° |
Table 2.
Distribution of hydrographic survey points for water depth ranges up to 20 m.
Table 2.
Distribution of hydrographic survey points for water depth ranges up to 20 m.
| Water Depth (m) | 2017 Multibeam | 2015 Multibeam | 2014 Multibeam | 1992 LiDAR | 1985 LiDAR | Total |
|---|
| 0 to 2 | 0 | 0 | 938 | 259 | 733 | 1930 |
| 2 to 4 | 0 | 440 | 10,163 | 245 | 927 | 11,775 |
| 4 to 6 | 1671 | 17,753 | 46,308 | 200 | 1060 | 66,992 |
| 6 to 8 | 15,052 | 57,957 | 82,574 | 134 | 1052 | 156,769 |
| 8 to 10 | 23,380 | 120,681 | 104,928 | 124 | 1105 | 250,218 |
| 10 to 12 | 67,570 | 199,580 | 166,659 | 48 | 724 | 434,581 |
| 12 to 14 | 150,157 | 270,770 | 211,433 | 54 | 891 | 633,305 |
| 14 to 16 | 137,498 | 189,464 | 202,001 | 33 | 816 | 529,812 |
| 16 to 18 | 140,050 | 228,040 | 243,404 | 42 | 813 | 612,349 |
| 18 to 20 | 63,927 | 180,578 | 216,174 | 54 | 825 | 461,558 |
| Total | 599,305 | 1,265,263 | 1,284,582 | 1193 | 8946 | 3,159,289 |
Table 3.
Accuracy assessment results for individual SDB techniques.
Table 3.
Accuracy assessment results for individual SDB techniques.
| SDB Method | | LE90 (m)
Depth Range |
|---|
| Bias (0–10 m) | 0–10 | 0–2 | 2–4 | 4–6 | 6–8 | 8–10 | 10–14 |
|---|
| Empirical | −0.20 | 0.95 | 1.51 | 1.14 | 0.75 | 1.02 | 0.93 | 1.46 |
| Manual Photogrammetry | −0.58 | 1.58 | 1.51 | 1.68 | 1.35 | 1.38 | 1.19 | 1.76 |
| Automatic Photogrammetry | 0.75 | 1.54 | 0.46 | 0.65 | 1.45 | 1.55 | 1.88 | 2.10 |
| Random Forest | −0.38 | 1.67 | 0.48 | 0.54 | 1.08 | 1.73 | 2.28 | 2.76 |
| Number of Points | 38,773 | 765 | 2128 | 13,511 | 18,168 | 4201 | 359 |
Table 4.
Overall root mean square error (RMSE) and rank of each technique combination for the level of confidence approach. The percentage of the overlap area captured by four, three and two agreeing techniques is also shown.
Table 4.
Overall root mean square error (RMSE) and rank of each technique combination for the level of confidence approach. The percentage of the overlap area captured by four, three and two agreeing techniques is also shown.
| Number of Techniques Agreeing within 1 m | Approaches within Combination 1 | Overall Combination RMSE (m) (0–10 m) | Rank | % Coverage of Overlap Area 2 |
|---|
| 4 | AP, EM, MP, RF | 0.61 | 1 | 31 |
| 3 | AP, EM, RF | 0.60 | 2 | 50 |
| AP, MP, RF | 0.64 | 3 |
| AP, EM, MP | 0.69 | 4 |
| EM, MP, RF | 0.80 | 5 |
| 2 | AP, EM | 0.63 | 6 | 19 |
| AP, RF | 0.70 | 7 |
| AP, MP | 0.71 | 8 |
| EM, MP | 0.82 | 9 |
| EM, RF | 0.83 | 10 |
| MP, RF | 0.90 | 11 |
Table 5.
Accuracy assessment results for the multi-approach technique.
Table 5.
Accuracy assessment results for the multi-approach technique.
| Number of Techniques Agreeing within 1 m | | | LE90 (m) |
|---|
| | | Depth Range |
|---|
| Coverage % | Bias | 0–10 | 0–2 | 2–4 | 4–6 | 6–8 | 8–10 | 10–14 |
|---|
| 4 | 31 | −0.10 | 1.01 | 1.21 | 0.85 | 0.85 | 0.98 | 1.27 | 1.00 |
| 3 | 50 | −0.19 | 1.26 | 1.23 | 0.90 | 1.14 | 1.28 | 1.25 | 1.24 |
| 2 | 19 | 0.05 | 1.28 | 1.30 | 1.21 | 1.25 | 1.24 | 1.07 | 1.90 |
| 4 and 3 | 81 | −0.16 | 1.21 | 1.26 | 0.87 | 1.08 | 1.24 | 1.28 | 1.20 |
| All | 100 | −0.12 | 1.24 | 1.30 | 0.95 | 1.15 | 1.24 | 1.18 | 1.78 |
Table 6.
Required depth accuracies for International Hydrographic Organization (IHO) CATegory of Zones Of Confidence (CATZOC) levels [
11].
Table 6.
Required depth accuracies for International Hydrographic Organization (IHO) CATegory of Zones Of Confidence (CATZOC) levels [
11].
| CATZOC Level | Required Position Accuracy (± m) | Depth Range (m) | Required Depth Accuracy (± m) |
|---|
| A1 | 5 + 5% of depth | 0–10 | 0.6 |
| 10–30 | 0.8 |
| A2 & B | 20 (A2), 50 (B) | 0–10 | 1.2 |
| 10–30 | 1.6 |
| C | 500 | 0–10 | 2.5 |
| 10–30 | 3.5 |
© 2019 by the authors. Licensee MDPI, Basel, Switzerland. This article is an open access article distributed under the terms and conditions of the Creative Commons Attribution (CC BY) license (http://creativecommons.org/licenses/by/4.0/).


