Geographical Analysis on the Projection and Distortion of INŌ’s Tokyo Map in 1817


1
Graduate School of Life and Environmental Science, University of Tsukuba, Tsukuba 305-8572, Japan
2
Faculty of Life and Environmental Science, University of Tsukuba, Tsukuba 305-8572, Japan
*
Author to whom correspondence should be addressed.
ISPRS Int. J. Geo-Inf. 2019, 8(10), 452; https://0-doi-org.brum.beds.ac.uk/10.3390/ijgi8100452
Submission received: 5 July 2019
/
Revised: 10 September 2019
/
Accepted: 10 October 2019
/
Published: 12 October 2019
(This article belongs to the Special Issue Historical GIS and Digital Humanities)
Abstract
:The history of modern maps in Japan begins with the Japan maps (called INŌ’s maps) prepared by Tadataka Inō after he thoroughly surveyed the whole of Japan around 200 years ago. The purpose of this study was to investigate the precision degree of INŌ’s Tokyo map by overlaying it with present maps and analyzing the map style (map projection, map scale, etc.). Specifically, we quantitatively examined the spatial distortion of INŌ’s maps through comparisons with the present map using GIS (geographic information system), a spatial analysis tool. Furthermore, by examining various factors that caused the positional gap and distortion of features, we explored the actual situation of surveying in that age from a geographical viewpoint. As a result of the analysis, a particular spatial regularity was confirmed in the positional gaps with the present map. We found that INŌ’s Tokyo map had considerably high precision. The causes of positional gaps from the present map were related not only to natural conditions, such as areas and land but also to social and cultural phenomena.
1. Introduction
Examining quantitatively the precision of historical maps has become possible because of the development of GIS, and scientific findings have therein been accumulated [1]. In previous studies, the accuracy of the surveying and drawing in historical maps was discussed on the basis of the positional gaps that occurred when historical maps were identified on the projection coordinate system for various current maps [2,3]. In other words, geospatial analyses were conducted to examine what georeferences made historical maps match with current maps [4].
If the precision of historical maps can be verified scientifically, we can advance geographical studies analyzing the distribution patterns of the features and reproducing the landscape and communities from that time. In previous studies in this field, the following outcomes are noted: (1) the study of the transformation of the urban spatial structures of castle towns in the Edo era by measuring the transition of the land-use [5], (2) the study of constructing a system with a 3D comparison between the scene in the 1940s and that in the current age in Kyoto [6], and (3) the study of analyzing the landscape of Tokyo in the 1830s with 3D visualization [7]. It is essential to develop these previous investigations further. The reconstruction of old landscapes and the reproduction of the traditional communities are evolving as primary research themes for the historical GIS of the next generation.
When comparing many maps prepared in different ages, it is required that the same projection method is commonly used for all of them [8]. In reality, projection method differs from one map to another. There are many maps in which the projection method is unknown. Therefore, previous studies have focused on exploring the spatiotemporal changes from the past to the present, by merely applying georeference to historical maps without thoroughly examining the precision of those historical maps themselves [9,10]. To investigate the survey condition in the late Edo era, it is crucial to not only explore the map precision but also to examine the factors of the spatial distortion based on the traditional methodology.
Based on the points above, the purpose of this study is to explore the distortion of INŌ’s maps quantitatively and then to delineate the factors of spatial distortion by focusing on the geodetic datum, projection method, surveying method, and surroundings, among other factors.
2. Materials and Methods
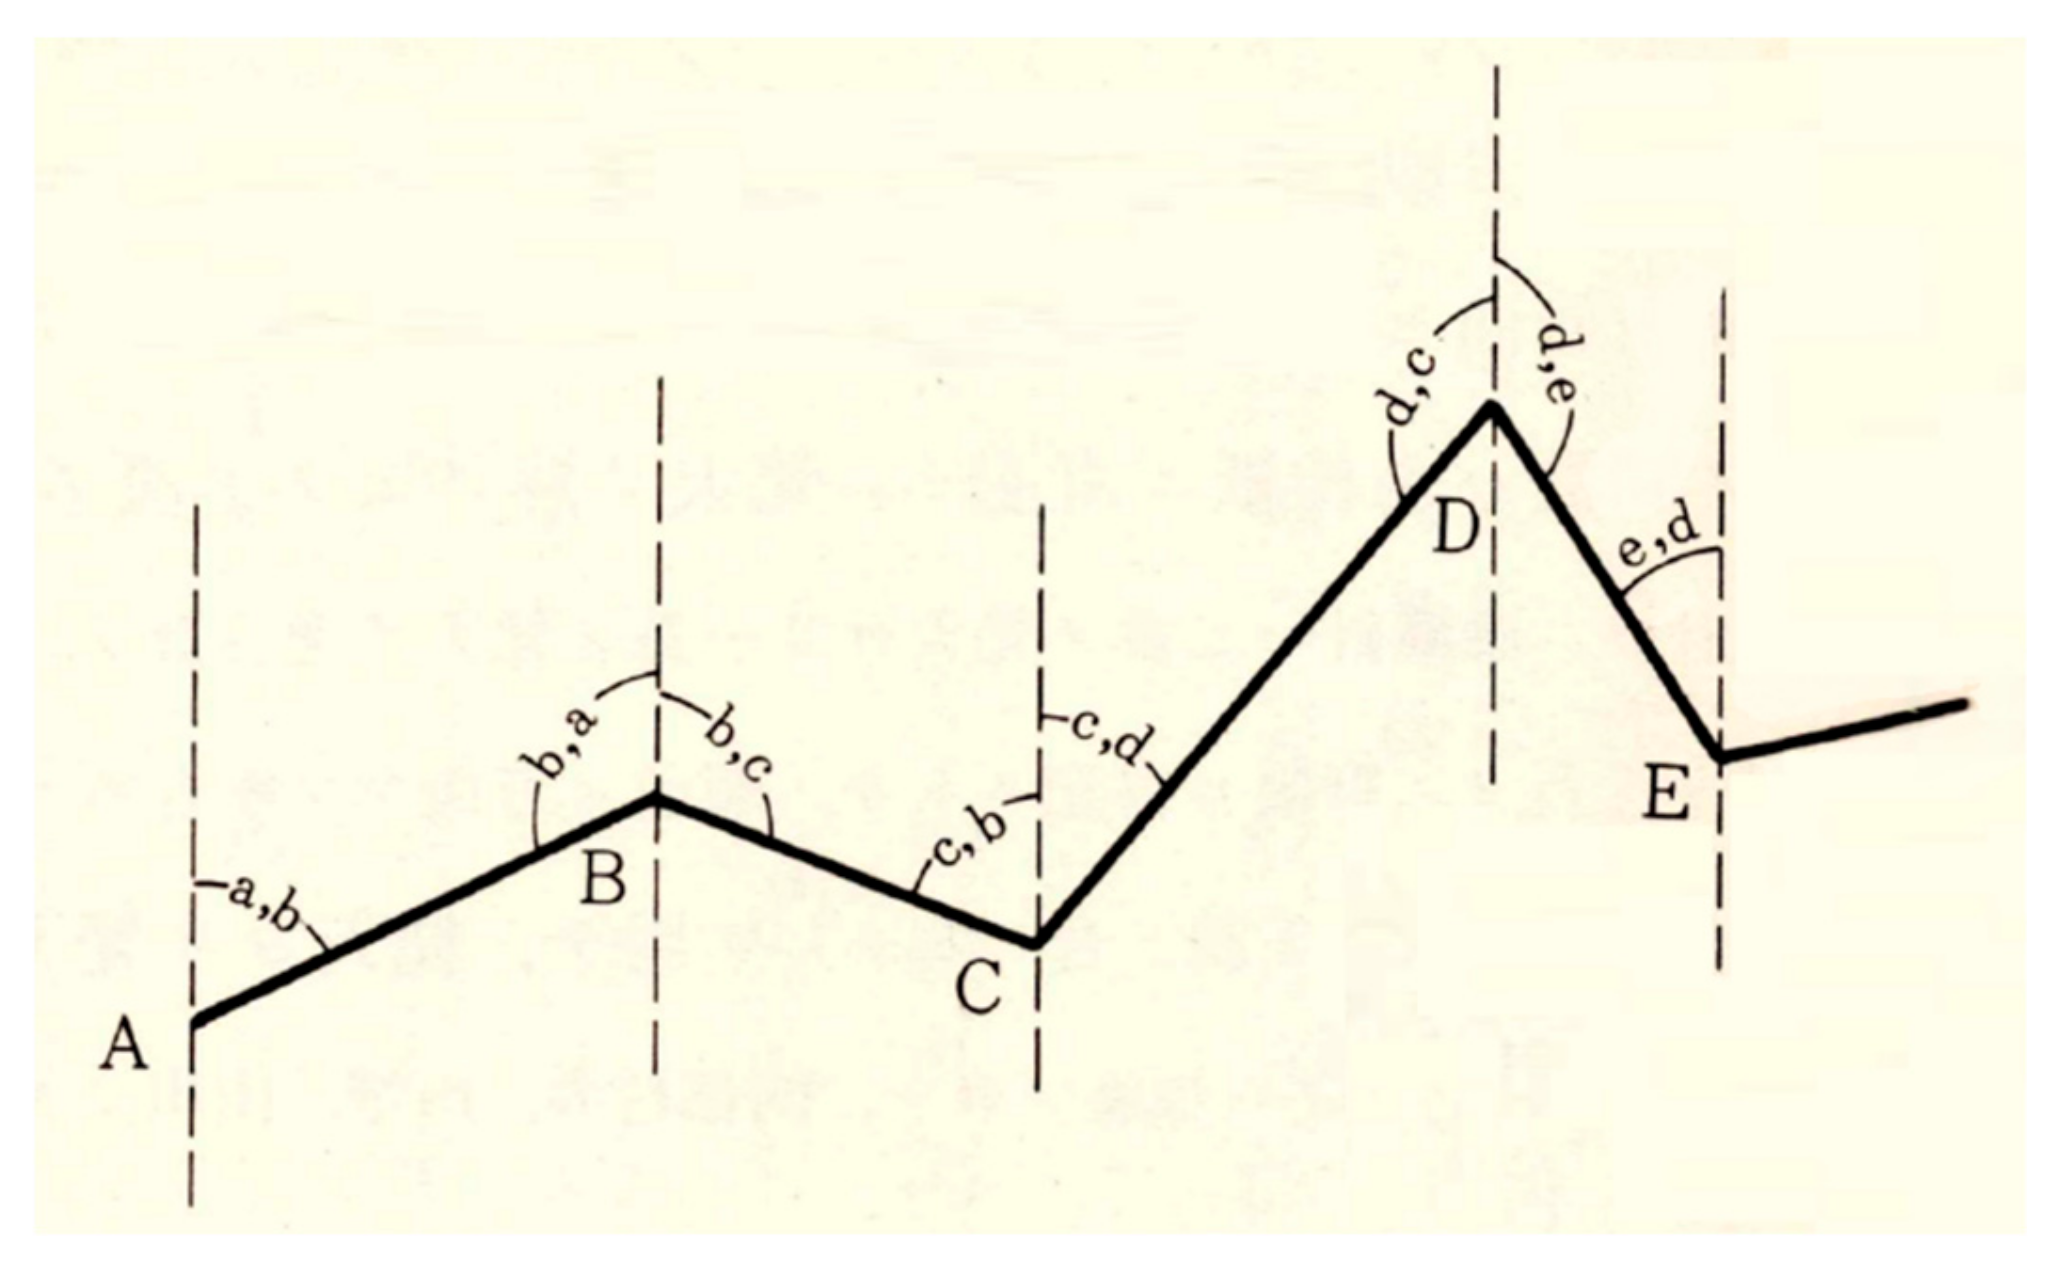
Historical maps are generally divided into two categories: 1) the maps drawn pictorially without implementing the survey, and 2) the maps with actual surveying (surveyed drawings). In light of the purpose of this study, the latter is preferable. The oldest maps surveyed for the whole of Japan are the so-called “INŌ’s maps.” There are various types of INŌ’s maps such as small-scale (approximately 1:432,000) maps which cover the whole land of Japan with three pieces; medium-scale (approximately 1:216,000) maps which include the entire territory of Japan with eight pieces; large-scale (approximately 1:36,000) maps which are divided into 214 parts corresponding to each area; and INŌ’s Tokyo map (approximately 1:6000) which covers the wider Tokyo area. Surveying by Tadataka Inō was conducted from 1800 to 1816. The maps covering the whole of Japan were completed in 1821. The surveying method used by Tadataka Inō was “traverse, “as shown in Figure 1. He drove a stake into the place used for the reference and measured the distance to the next site using an iron chain. Then, he stepped in the direction of the next stake in a straight line and measured the course of the same object (such as the summit of a distant mountain) seen from the stakes at both ends of the straight line. The slope distance was measured with a simple wooden theodolite. Also, he performed an astronomical observation for the latitude to correct the measurement results [11].
In this study, we selected INŌ’s Tokyo map. The reasons were as follows: (1) INŌ’s maps are the oldest surveyed drawings in Japan, and show the most past surveying technology; (2) there are few studies on the precision of INŌ’s Tokyo map compared with other INŌ’s maps [12]; and (3) comparative analysis between them is possible, as there are many different historical maps of Edo (Tokyo) [3,7].
INŌ’s Tokyo map was completed in 1817 after the other INŌ maps were made from 1815 to 1816. This map was prepared using the highest level of surveying technology available at that age. INŌ’s survey diary shows that INŌ’s Tokyo map was not a merging of local surveys, but somewhat preliminary surveys conducted by connecting suburbs [13]. In INŌ’s Tokyo map, the surveyed and non-surveyed lines were discriminated against using different colors (Figure 2). The original of INŌ’s Tokyo map was destroyed by a fire in the Meiji era. All of the existing maps are copies. Careful attention was paid when creating replication [14]. The painter was recruited by the central government.
INŌ’s Tokyo map consisted of two pieces, one each for the northern and southern areas. There is less information on the north of part of INŌ’s Tokyo map, and it is difficult to obtain reference points with regards to it. Thus, this study selected only the southern part of the map as the target of the analysis. For processing INŌ’s Tokyo map on GIS, we used the original drawings being collected in the literature [15] (by the Geospatial Information Authority of Japan, 196 cm (H) and 314 cm (W)). The resolution was set to 250 to 750 dpi.
The scale of INŌ’s Tokyo map is approximately 1:6000. It is necessary to compare with present maps with a similar scale to achieve the goal of this study. In Japan, there are 1:5000 large-scale national maps (Horizontal Mercator projection by the plane orthogonal angle coordinate system) and 1:10,000 topographical maps (Universal Transverse Mercator drawing). The geodetic datum for these maps assumes the Earth as an ellipsoid. In Japan, in the first half of the 1800s when INŌ’s maps were prepared, the Earth was considered as a sphere, as in INŌ’s maps [16], although it was already known by draftsmen that the Earth was a spheroid, as shown in Astronomia of Sterrekunde [8,11]. So far, various discussions have been made about the projection method used for INŌ’s maps [16,17]. In this study, we considered a total of four projection methods, including the sinusoidal projection (ESRI: 53008) and equidistant cylindrical projection (ESRI: 53002), as used in the previous studies, and adding the mercator projection (ESRI: 53004) and stereographic projection (ESRI: 53026), which are widely used for projecting large-scale maps. We attempted to explore the projection method being the most similar to that of modern maps.
Each projection method has the different characteristics. Sinusoidal projection is a projection where the central meridian and parallels orthogonal to it are expressed equidistantly, and the distortion increases moving from the central meridian and equator [18]. In the equidistant cylindrical projection, the meridians are expressed equidistantly. If the parameters are changed, it can be considered that the projection assumes the longitude and latitude as the x and y coordinates on the map, as they are similar to the longitude-latitude coordinate system [18]. Mercator projection is a regular cylindrical projection. The distortion of the high latitude region is larger than that of the low latitude region [19]. Stereographic projection is also a general regular projection [19]. However, unlike the mercator projection, the meridians and parallels are circles. The distortion increases as it moves further from the center.
In this study, the precision of the maps was verified by the following procedures. First, INŌ’s Tokyo map was overlayed on each present map by the four projection methods. Then, the control point (CP) was set on the map, and the distortion at each point was measured. In previous studies, the root mean square (RMS) residue obtained by applying an affine transformation—one of the georeference formulas—was used frequently as the evaluation method [20]. The affine transformation does not maintain the aspect ratio of the figure. However, the affine transformation itself distorts the figure. In this study, we used the absolute value of the Euclidean distance between a coordinate (x, y) on historical maps, and the coordinate (x’, y’) on the present maps as the reference for evaluation, without performing affine transformation, and paying attention to the gaps in the historical maps themselves. For the present maps, the zoom level of the GSI (Geospatial Information Authority of Japan) maps was adopted [19,21], and the positional gap between INŌ’s Tokyo map and the GSI map was extracted by ArcGIS 10.4.
As for the parameters for projection, based on the discussions in previous studies [17], the central meridian was set to 139.7567 for the sinusoidal projection, mercator projection, and stereographic projection. In the equidistant cylindrical projection and mercator projection, the standard parallel was set to 35.6851, in addition to the central meridian, as with the sinusoidal projection. In the stereographic projection, the latitude of origin was set to 35.6851. All of them passed through the Imperial Palace.
The exact scale of INŌ’s Tokyo map is unknown (the scale of the original map is said to be 1:6000). Thus a process to unify the scale with the present maps was conducted first. To be concrete, INŌ’s Tokyo map was transformed by setting the four points at the corner of the roads, extending to the front of temples and shrines located in the peripheral area of the map as necessary CPs (Figure 3), as it is often the case that historical road structures are maintained around temples and shrines. The corner of the road extending to a temple or shrine rather than the temple or shrine itself was selected as a basic CP. That is because (1) a temple or shrine is a feature with a certain area, and it is difficult to set the basic CP as a point in it, and (2) roads are based on actual surveys, whereas the temples and shrines are drawn pictorially without surveying. A similarity conversion enables the scale reduction, turning, and moving of data.
As a result of the similarity transformation, we can show that INŌ’s Tokyo map was turned slightly counterclockwise, and the azimuth of the map was somewhat deviating from due north. Then, we paid attention to the center of each intersection of the road, and selected 100 points from the current position being identified as a local CP in INŌ’s Tokyo map (Figure 4). For the locations of the local CPs, we selected roads with many paths and corners and roads along the temples and shrines. It was highly probable that the routes of these roads have not changed from those in that age, unlike the wide and straight roads.
In the georeference function of ArcGIS, an automatic adjustment of the image is the default setting, and errors become less in the later stage of the constellation of CPs. We made efforts so that the distortion could be grasped precisely based on an absolute scale while suppressing the effect of georeferencing to a minimum level.
3. Results
3.1. The Precision of the Whole of INŌ’s Tokyo Map
Table 1 shows the precision of INŌ’s Tokyo map, as calculated for each of the four projection methods. Because the average value corresponding to the distortions in the x- and y-directions was less than 20 cm in any of the projection methods, errors were small as a whole.
When looking into each of the x- and y-directions, the error was slightly greater in the y-direction. When looking into the RMS of vector XY, it was the largest in the mercator projection (34.0614 m), and the smallest in the equidistant cylindrical projection (32.6419 m). The error in the y-direction in the equidistant cylindrical projection was notably smaller than those in the other projection methods. It was because the meridians of the equidistant cylindrical projection were equidistant.
Standard deviation represented the dispersion of the statistics. In the x-direction, the equidistant cylindrical projection had a greater dispersion; in the y-direction, on the other hand, the mercator projection had a greater dispersion. In both the x- and y-directions, the maximum value of the error was observed in the equidistant cylindrical projection. In the equidistant cylindrical projection, when looking into the standard deviation, locally more substantial errors occurred in the x-direction.
3.2. Spatial Distribution of Positional Gaps in INŌ’s Tokyo Map
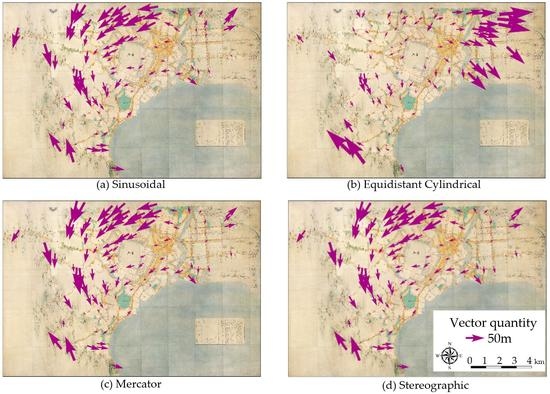
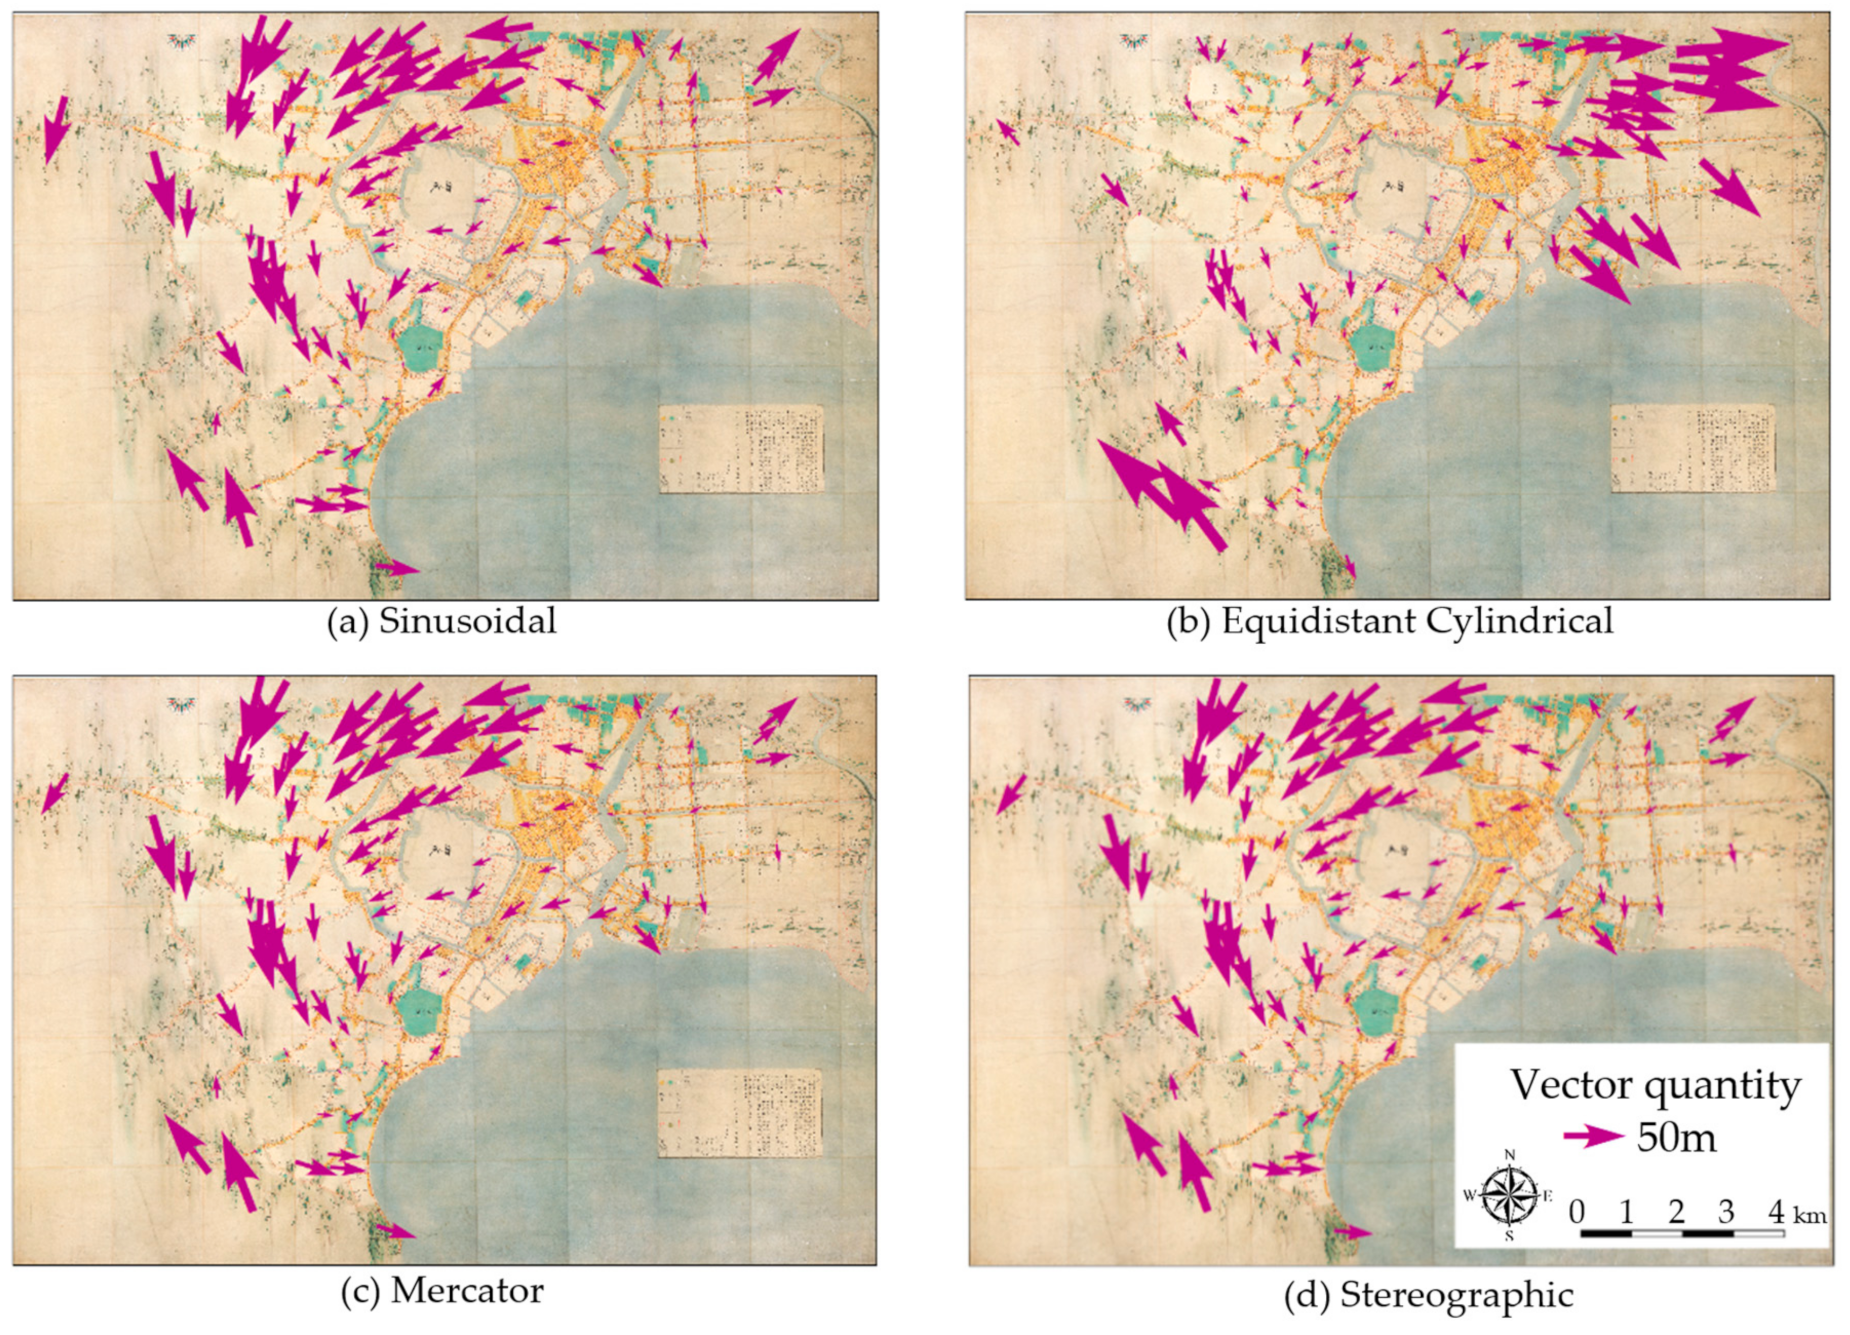
Figure 5 shows the directions of the positional gaps on INŌ’s Tokyo map concerning the coordinates on the present map (x’, y’). The length and thickness were proportional to the vector quantity. As a characteristic of the distortion, we can say that the errors were smaller around the Nihonbashi bridge, and the errors became larger at more distant points from the Nihonbashi bridge in any projection method. The precision around the Nihonbashi bridge improved because that area was surveyed by traveling it many times.
No significant difference in the positional gap was found between the sinusoidal projection (Figure 5a), mercator projection (Figure 5c), and stereographic projection (Figure 5d). All of the figures tended to distort counterclockwise compared with the present maps. The equidistant cylindrical projection (Figure 5b) showed a significant difference from the other three projections. In the equidistant cylindrical projection (Figure 5b), the gaps were small as a whole, although significant errors were observed locally.
The sinusoidal projection (Figure 5a), mercator projection (Figure 5c), and stereographic projection (Figure 5d) had positional gaps that were smaller to the east of the Imperial Palace and larger on the west side. Furthermore, such a trend could be observed because errors of counterclockwise turning around the Imperial Palace excelled. Because the latitude was measured in INŌ’s maps, it is not suitable to conclude that the recognition of the north direction was weak. On the other hand, it is also difficult to consider that the errors would decrease by counterclockwise turning in a similar transformation to align with the scale of INŌ’s Tokyo map. If so, this is because the errors would become more substantial in the southeastern area of the Imperial Palace.
Because the distribution of errors was similar among the four projections, it is concluded that the surveying project maintained a certain level of precision, regardless of the projection method. Although counterclockwise distortion excelled as a whole, there were such points (areas) that did not fit with this pattern. For example, the area around Kameido was displaced in a northeast direction, the area around Meguro was displaced in a northwest direction, and the area around Kiba was displaced in a southern direction. Although we considered that some factors acted on the areas where a local gap occurred, this issue is discussed in detail in Section 3.3.
3.3. Factors of Spatial Distortion in INŌ’s Tokyo Map
The cause of distortion lies in the projection method, surveying technique, or surveying method. In the sinusoidal projection (Figure 5a), the gaps were more significant in the peripheral area. In this analysis, the central meridian was set as a projection parameter of the sinusoidal projection, and passed through the Imperial Palace. Thus the spatial distortion is smaller in the areas around the Imperial Palace. However, The distortion increased in the northern area, and thus it can be understood that the characteristic of the sinusoidal projection was reflected. In the equidistant cylindrical projection (Figure 5b), the distortion increased in proportion with the distance from the Imperial Palace in the east and west directions. In the mercator projection (Figure 5c) and stereographic projection (Figure 5d), the distortion in the suburbs was smaller than the others. However, the spatial distribution of the distortion was similar. Therefore, regarding the influence of the projection method, it is crucial to examine whether the projection had the property of the equidistant.
From the above findings, it is highly probable that INŌ’s Tokyo map was drawn using the equidistant cylindrical projection (Figure 5b), or another method similar to it in the four projection methods.
3.3.1. Effects of Landscape and Surrounding Environment
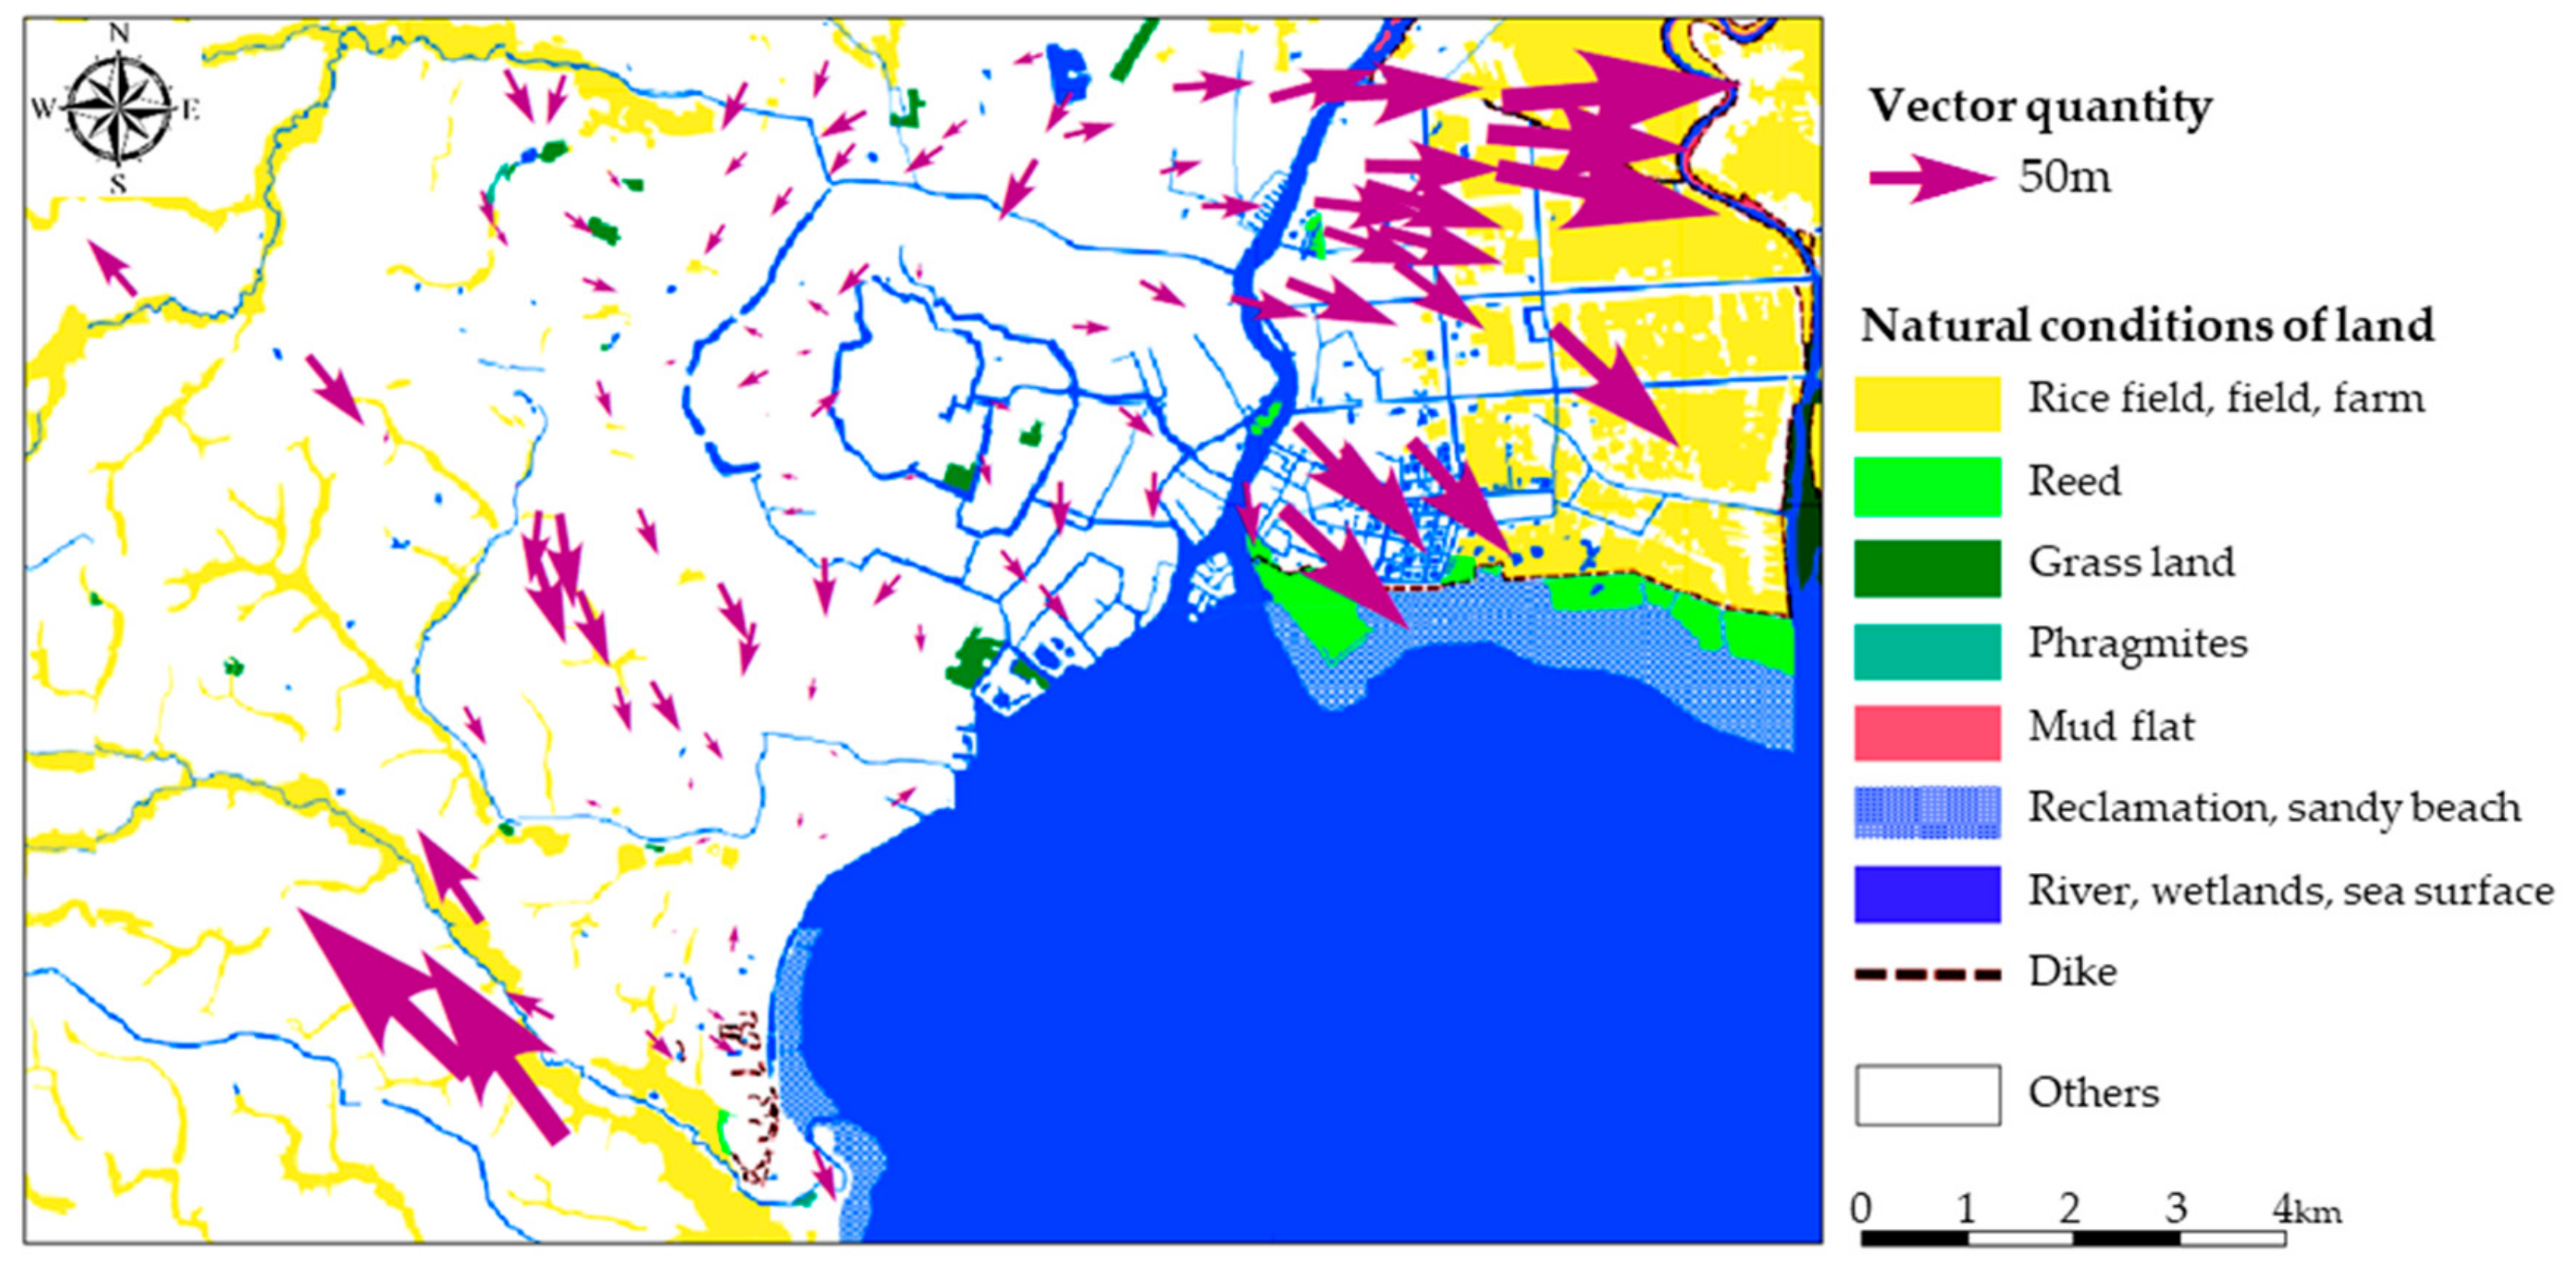
Figure 6 shows examples in four areas, wherein the gaps in CPs on INŌ’s Tokyo map were evident when compared with the present map drawn by the equidistant cylindrical projection (Figure 5b). In the area around Nihonbashi (Figure 6a), where the spatial distortion was relatively small, the distribution of the orange colors to express the crowd of houses was outstanding. Furthermore, the streets seemed to be in a grid form. In the area around Kameido (Figure 6b) and the area around Meguro (Figure 6c), there were the groves of different trees, hills and the low density of the dwellings. There were also roads meandering there. Therefore, it is estimated that the invisible landscape and poor prospects in these areas lowered the surveying precision. In the area around Kiba (Figure 6d), the houses crowded next to the area around the Nihonbashi bridge (Figure 6a). However, this area was surrounded by rivers and the sea, and such a discontinuous space of structures considerably affected the survey precision.
In this study, we paid attention to land use. The natural conditions of the land in that age were reproduced using the distribution map in the Kanto plain, prepared in 1880 to 1886 [22]. Although this map was made approximately 60 years after the preparation of INŌ’s Tokyo map, the natural conditions of the land did not differ so much from those in the age.
Figure 7 shows the gaps that occurred in INŌ’s map, as overlayed on the land condition map. The rice field was outstanding in the area on the east side of the Arakawa river. In the area around Kameido, the wetlands were spreading, wherein feet would not only have become muddy, but the width of the walkway would have also been narrow if it was well arranged. Thus, it shows that surveying was extremely difficult.
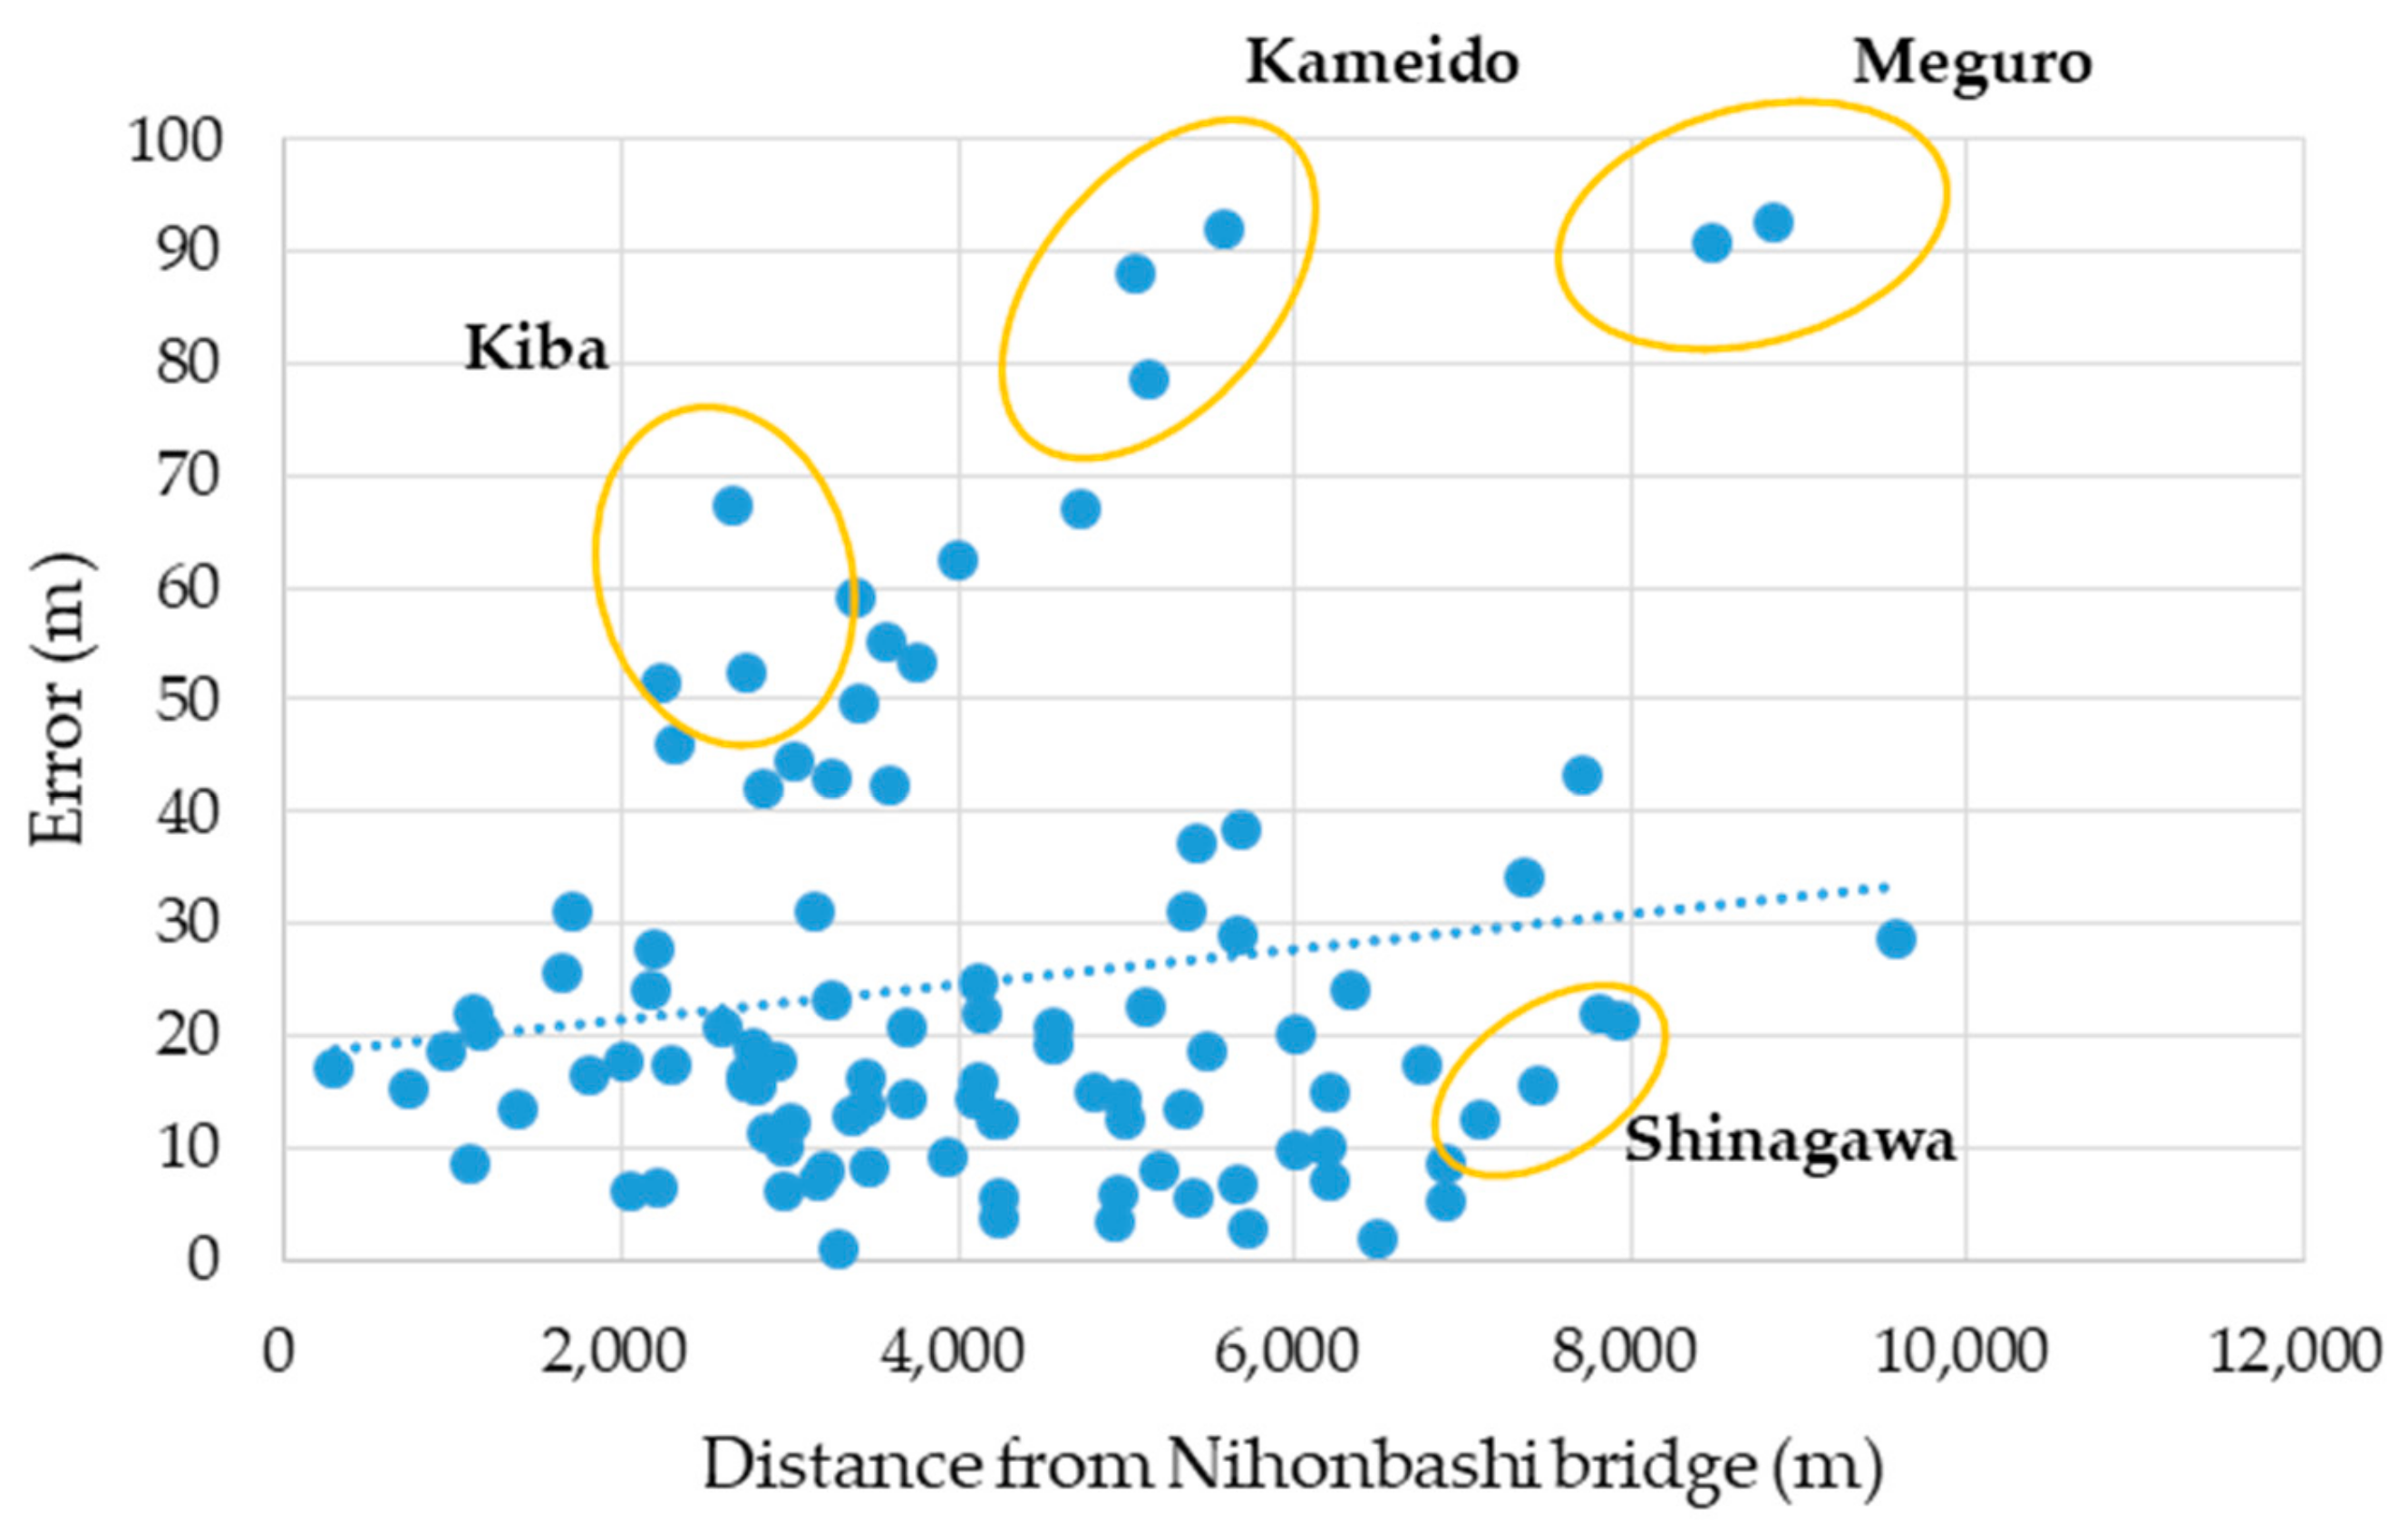
3.3.2. Distortion of the Spatial Distance that Starts from Nihonbashi Bridge
As described in Section 3.2, the surveying for INŌ’s Tokyo map started from Nihonbashi bridge. If so, how did the gaps increase as the CPs became more distant from Nihonbashi bridge? Figure 8 shows the results of calculating the distance of each CP (100 points) from Nihonbashi bridge, and of analyzing the gaps as compared with the present maps drawn by equidistant cylindrical projection. As shown in Figure 6, Kameido and Meguro showed larger gaps. They were considerably distant from Nihonbashi bridge. On the other hand, though Kiba was close to Nihonbashi, Kiba showed significant distortion. Shinagawa showed relatively small gaps, even though it is far from Nihonbashi bridge. It is explained by the fact that Shinagawa was the starting point of the surveying project [13], particularly when surveying the western part of Japan through Tokaido. Shinagawa was a well-known place for people.
4. Discussion
Longitude was not shown in any of INŌ’s maps including INŌ’s Tokyo map. It was because Tadataka Inō was interested in measuring the distance of latitude by one degree and using the measurement of time, which is indispensable for longitude, making it difficult [16]. The reason why previous studies insisted INŌ’s maps were made by sinusoidal projection was that the meridians were measured by the calculation formula, which was the same as that of the sinusoidal projection [11]. On the basis of the later reviews (in and after 1974), because no description of sinusoidal projection was found in the historical materials related to INŌ’s maps, and because meridians are drawn in the form of straight lines, it is hard to say that INŌ’s maps were drawn by taking into consideration of sinusoidal projection [17]. In recent years, regarding INŌ’s maps, more attention has been paid to the map compilation process, rather than the meridian calculation method or projection method. For INŌ’s maps, the survey results were drawn on a rough sketch first. Next, the rough sketch was reduced in size and matched with other sketches. Then it was checked against the astronomical observation result to prepare a map. In other words, we can say that rough sketches drawn as a plane were applied to the map of a wider area.
If INŌ’s Tokyo map was made as a plane according to the study result of [17], the meridians and parallels should be orthogonal. Because the distance in latitude was exact, the distance in longitude caused a gap. The projection method meeting this condition was the equidistant cylindrical projection (Figure 5b). The authors of [17] suggested the possibility that INŌ’s maps were made by an equidistant cylindrical projection, inspired by Kaisei Nihon Yochi Rotei Zenzu. By fully utilizing GIS, our study showed that INŌ’s maps were more likely to the equidistant cylindrical projection.
Geographical conditions including the surrounding environment and landscape, also influenced the actual surveying. When we paid attention to the urban structure of Edo, we found that samurai residences and townsman residences were accumulated in a sphere with a radius of approximately 4 km around the Imperial Palace (old Edo-jo Castle), and the scene of the farm village opened beyond the range of 4 km [23]. The large-scale paddy (rice) field was distributed widely from the northern part to the eastern part of Edo. On the other hand, farmland excelled from the northern part to the western part of Edo [23]. The reason why the surveying precision was lower in the area around Kameido, was that large-scale wetlands and paddy (rice) fields were spreading there (Figure 7). On the other hand, in the area around Shinjuku located outside the urban fringe, the surveying was rather easy because farmland was dominant there. This area was along Koshu way, on which Tadataka Inō seems to have walked repeatedly. Naturally, the spatial distortion was smaller there (Figure 8).
Some previous studies have pointed out that the altitude influenced spatial distortion [24]. However, we considered that the factor hindering surveying was inclination rather than altitude, as we must fully utilize the trigonometric function to calculate the plane distance on a slope, and thus calculation becomes complex. We investigated the actual status by calculating the angle of inclination and by applying a spatial join (nearest-neighbor-joining by one-to-one) with CPs on the present maps, using the 5 m mesh digital altitude model (DEM) of the base map information that was made by aerial laser surveying. As a result, we found a high correlation between the positional gaps and the angle of inclination in the area around Roppongi. However, because differences in altitude are not so significant in Tokyo, no clear correlation was observed between the inclination and the size of the gap. There were places with high precision in Shinagawa and Yotsuya, even if the inclination was prominent.
Lastly, regarding the spatial pattern of distortion, we examined historical maps of Tokyo which were prepared almost at the same time as INŌ’s Tokyo map, and we compared various analyses by the previous studies [3,7]. The research of [3] was Edozu Seihokan, an Edo map published in 1693, whereas the research of [7] was the Tenpo Kaisei Oedo Ōezu, an Edo map published in 1843.
The location where the direction of the gap matched between this study and the previous studies [3,7] was the west side of the Imperial Palace (the area around Yotsuya). In both maps, we confirmed gaps in the western direction. The area around Yotsuya was overestimated in both maps. When looking into INŌ’s Tokyo map, there were blank areas on the west side of the Imperial Palace than on the east side. Blank areas include those of unsurveyed, as well as privately-owned places where surveying was impossible. When looking into the explanatory notes in INŌ’s Tokyo map, we recognize that many samurai residences were located in these blank areas. It was overestimated because this area had an image of a “not well-known place.” It is well-known in the field of behavioral geography that people tend to widely underestimate the spatial distance in familiar places and overestimate the spatial distance in unfamiliar places [25]. Also, in INŌ’s Tokyo map and the map of preceding studies [3,7], it is indicated that distortion excelled in the area around the samurai residences.
5. Conclusions
This study, using INŌ’s Tokyo map prepared in 1817, discussed the spatial distortion of the positions of the features in the map quantitatively, by conducting the overlay analysis with present maps. We explored the factors of spatial distortion by considering the geodetic datum, the projection method, the surveying method of that age, and further miscellaneous geographical conditions.
As a result of the analysis, the distance gap between INŌ’s Tokyo map and the present map was found to be only 30 m. We can say that INŌ’s Tokyo map was made with considerably high precision for a map of the later Edo era. The projection method for INŌ’s Tokyo map was quite similar to the equidistant cylindrical projection.
As for the projection method, INŌ’s Tokyo map matched well with the map displayed by the equidistant cylindrical projection. There are areas with a remarkable spatial distortion in INŌ’s Tokyo map. The surrounding environment at the time of performing the surveying, as well as the geographical conditions such as land-use, was the main factor causing spatial distortions. The precision of maps was influenced by not only factors in physical geography such as the natural conditions of the land and landscape, but also the anthropogeographic factors such as the route of the roads, the distribution of the samurai residences, and the several times of surveying. These findings are only hypothetical at present, and advanced analysis utilizing GIS is required. These remain a future subject of research.
Author Contributions
Conceptualization, Yuki Iwai and Yuji Murayama; writing (original draft preparation), Yuki Iwai and Yuji Murayama; writing (review and technical analysis for spatial analysis and visualization), Yuki Iwai; supervision, Yuji Murayama.
Funding
This study was supported by the Japan Society for the Promotion of Science (JSPS) through Grant-in-Aid for Scientific Research (A) 16H01830 (2016-21).
Acknowledgments
This study made use of “Digital INŌ’s Map” (Copyright © 2015 Tokyo Cartographic, Kawade Shobo Shinsha). The authors are grateful to Mr. Kota Inohara, a counselor of Tokyo Cartographic Co., Ltd., who made the database of the survey lines of INŌ’s maps.
Conflicts of Interest
The authors declare no conflict of interest.
References
- Gregory, I.N.; Ell, P.S. Historical GIS: Technologies, Methodologies, and Scholarship; Cambridge University Press: Cambridge, UK, 2007. [Google Scholar]
- Tsukamoto, A.; Isoda, Y. Analysis of local distortions in a historical map “Rakuchu-Ezu”. Theory Appl. GIS 2011, 15, 111–121. (In Japanese) [Google Scholar] [CrossRef]
- Kojima, T.; Tamagawa, H. A basic study on providing meanings to distortions in historical maps and construction of their correction models. Theory Appl. GIS 2004, 12, 23–33. (In Japanese) [Google Scholar] [CrossRef] [Green Version]
- Shimizu, E.; Fuse, T.; Morichi, S. A study on geometric correction of historical maps. Proc. JSCE 1999, 625, 89–98. (In Japanese) [Google Scholar]
- Hirai, S. GIS analysis of the old maps of castle town. Inf. Process. Soc. Res. Rep. 2009, 10, 1–8. (In Japanese) [Google Scholar]
- Yano, K.; Nakaya, T.; Isoda, I.; Takase, I.; Kawasumi, T.; Matsuoka, K.; Seto, T.; Kawahara, D.; Tsukamoto, A.; Inoue, M.; et al. Virtual Kyoto: 4DGIS comprising spatial and temporal dimensions. Chigaku Zasshi J. Geogr. 2008, 117, 464–478. [Google Scholar] [CrossRef]
- Shimizu, E.; Fuse, T. Landscape Visualization of Edo City: Edo Drawn by Hiroshige and Hokusai, and Edo not Drawn; Kajima Institute Publishing: Tokyo, Japan, 2009. (In Japanese) [Google Scholar]
- Tokyo Geographical Society. A Recent Knowledge of Inō-Tadataka’s Map; Asakura Shoten: Tokyo, Japan, 1998. (In Japanese) [Google Scholar]
- Statuto, D.; Cillis, G.; Picuno, P. Using historical maps within a GIS to analyze two centuries of rural landscape changes in Southern Italy. Land 2017, 6, 65. [Google Scholar] [CrossRef]
- Chías, P.; Abad, T. GIS tools for comparing historical and contemporary landscapes through local maps series. e-Perimetron 2009, 4, 61–72. [Google Scholar]
- Hoyanagi, M. A New Appreciation of the Scientific Achievement of Inō-Tadataka Who Established a Landmark in the History of Land-Survey and Cartography of Japan; Kokon Shoin: Tokyo, Japan, 1974. (In Japanese) [Google Scholar]
- Kanazawa, K. Study on the discrepancies between the Inô’s Chûzu and the modern maps. Map 2000, 38, 13–20. (In Japanese) [Google Scholar]
- Watanabe, I. Japan Travelled on Foot by Tadataka Ino; Chikuma Shinsho: Tokyo, Japan, 1999. (In Japanese) [Google Scholar]
- Suzuki, J. The INŌ’s Map Contents. Available online: https://www.inopedia.tokyo/02dataRm/inoh-map_guide/r_7881751img20100121210257.pdf (accessed on 7 September 2019).
- Murayama, Y. Digital INŌ’s Map; Professional Edition; Kawade Shobo Shinsha: Tokyo, Japan, 2015. (In Japanese) [Google Scholar]
- Hoyanagi, M. Significance and essential features of INŌ’s map in the history of Japanese science and cartograpny Tadataka INŌ’s memorial lecture, in commemoration of the 150th year since his death, in the General Meeting of the Tokyo Geographical Society on May 25, 19. J. Geogr. 1968, 77, 193–222. (In Japanese) [Google Scholar] [CrossRef]
- Hishiyama, T. Projection method in Ino’s maps. Chizu Joho 2017, 37, 1–8. (In Japanese) [Google Scholar]
- GIS Association of Japan (Ed.) The Encyclopedia of Geographic Information Science; Asakura Shoten: Tokyo, Japan, 2004. (In Japanese) [Google Scholar]
- Masaharu, H. Map Projection Method-Geospatial Information Technique; Asakura Shoten: Tokyo, Japan, 2011. (In Japanese) [Google Scholar]
- Hirai, S. (Ed.) An Analysis of the Maps of Early Modern Japanese Castle Towns; Kokon Shoin: Tokyo, Japan, 2019. (In Japanese) [Google Scholar]
- GSI Maps. Available online: https://maps.gsi.go.jp/development/ichiran.html (accessed on 24 June 2019).
- Geospatial Information Authority of Japan. Available online: https://www.gsi.go.jp/bousaichiri/lc_m424 eiji.html (accessed on 24 June 2019).
- Fujii, M.; Yokohari, M.; Watanabe, T. Identification of the distribution pattern of farmlands in Edo. City Plan. Rev. Spec. Issue 2002, 37, 931–936. (In Japanese) [Google Scholar]
- Hirai, S.; Asato, S.; Watanabe, M. (Eds.) An Analysis of Early Modern Japanese Survey Maps; Kokon Shoin: Tokyo, Japan, 2014. (In Japanese) [Google Scholar]
- Okamoto, K. Cognition and Behavior of Urban Space; Kokon Shoin: Tokyo, Japan, 2000. (In Japanese) [Google Scholar]
Figure 1.
The traverse survey by Tadataka Inō [11].
Figure 1.
The traverse survey by Tadataka Inō [11].

Figure 2.
Roads in Tadataka Inō’s (INŌ’s) Tokyo map.

Figure 3.
Control points (CP) used for the similarity transformation of INŌ’s Tokyo map.

Figure 4.
Control points (CPs) for comparison of positional gaps from modern maps.

Figure 5.
Control points (CPs) for a comparison of the positional gaps from modern maps. The projection methods are as follows: (a) Sinusodial; (b) Equidistant Cylindrical; (c) Mercator; and (d) Stereographic.
Figure 5.
Control points (CPs) for a comparison of the positional gaps from modern maps. The projection methods are as follows: (a) Sinusodial; (b) Equidistant Cylindrical; (c) Mercator; and (d) Stereographic.

Figure 6.
Directions of errors as compared with modern maps: (a) Area around Nihonbashi bridge; (b) Area around Kameido; (c) Area around Meguro; and (d) Area around Kiba (enlarged versions of Figure 5b with the equidistant cylindrical projection).
Figure 6.
Directions of errors as compared with modern maps: (a) Area around Nihonbashi bridge; (b) Area around Kameido; (c) Area around Meguro; and (d) Area around Kiba (enlarged versions of Figure 5b with the equidistant cylindrical projection).

Figure 7.
Overlay of gaps (equidistant cylindrical projection) and natural conditions of land (1880 to 1886). Source: GSI map.
Figure 7.
Overlay of gaps (equidistant cylindrical projection) and natural conditions of land (1880 to 1886). Source: GSI map.

Figure 8.
Correlations between the distance from Nihonbashi bridge and the errors (the equidistant cylindrical projection).
Figure 8.
Correlations between the distance from Nihonbashi bridge and the errors (the equidistant cylindrical projection).


Table 1.
The precision of INŌ’s Tokyo map in terms of CPs, compared with modern maps.
| The minimum of |x’ - x|(m) | The minimum of |y’ - y|(m) | The maximum of |x’ - x|(m) | The maximum of |y’- y|(m) | The avg. of |x’ - x|(m) | The avg. of |y’ - y|(m) | The avg. of vector XY(m) | Standard deviation of |x’ - x|(m) | Standard deviation of |y’ - y|(m) | Standard deviation of vector XY(m) | RMS of vector XY(m) | |
|---|---|---|---|---|---|---|---|---|---|---|---|
| Sinusoidal | 0.1257 | 0.1163 | 56.0967 | 64.2631 | 18.2686 | 19.1150 | 29.2880 | 1.3893 | 1.6274 | 1.7251 | 33.9473 |
| Equidistant cylindrical | 0.0525 | 0.1601 | 91.8596 | 72.6375 | 17.3738 | 14.2385 | 24.8916 | 1.9679 | 1.3391 | 2.1223 | 32.6419 |
| Mercator | 0.9594 | 0.3467 | 54.8872 | 63.7984 | 17.5278 | 19.8889 | 29.1878 | 1.3891 | 1.6402 | 1.7646 | 34.0614 |
| Stereographic | 0.1060 | 0.2060 | 54.6158 | 65.4018 | 17.8856 | 18.7952 | 28.6840 | 1.3641 | 1.6023 | 1.7079 | 33.3397 |
© 2019 by the authors. Licensee MDPI, Basel, Switzerland. This article is an open access article distributed under the terms and conditions of the Creative Commons Attribution (CC BY) license (http://creativecommons.org/licenses/by/4.0/).
Share and Cite
MDPI and ACS Style
Iwai, Y.; Murayama, Y. Geographical Analysis on the Projection and Distortion of INŌ’s Tokyo Map in 1817. ISPRS Int. J. Geo-Inf. 2019, 8, 452. https://0-doi-org.brum.beds.ac.uk/10.3390/ijgi8100452
AMA Style
Iwai Y, Murayama Y. Geographical Analysis on the Projection and Distortion of INŌ’s Tokyo Map in 1817. ISPRS International Journal of Geo-Information. 2019; 8(10):452. https://0-doi-org.brum.beds.ac.uk/10.3390/ijgi8100452
Chicago/Turabian StyleIwai, Yuki, and Yuji Murayama. 2019. "Geographical Analysis on the Projection and Distortion of INŌ’s Tokyo Map in 1817" ISPRS International Journal of Geo-Information 8, no. 10: 452. https://0-doi-org.brum.beds.ac.uk/10.3390/ijgi8100452
Note that from the first issue of 2016, this journal uses article numbers instead of page numbers. See further details here.