Article

The Spill Over of Crime from Urban Centers: An Account of the Changing Spatial Distribution of Violent Crime in Guyana

Geospatial Information Sciences, School of Economic, Political and Policy Sciences, the University of Texas at Dallas, Richardson, TX 75080, USA
*
Author to whom correspondence should be addressed.
ISPRS Int. J. Geo-Inf. 2019, 8(11), 481; https://0-doi-org.brum.beds.ac.uk/10.3390/ijgi8110481
Submission received: 6 September 2019 / Revised: 14 October 2019 / Accepted: 20 October 2019 / Published: 25 October 2019
(This article belongs to the Special Issue Urban Crime Mapping and Analysis Using GIS)

Abstract

:
As the rate of crime decelerates in the developed world, the opposite phenomenon is being observed in the developing world, including Latin America and the Caribbean. Crime in Latin America and the Caribbean has been concentrated in urban settings, but the expertise for studying crime and providing guidance on policing remain heavily rooted in the developed world. A hindrance to studying crime in the developing world is the difficulty in obtaining official data, allowing for generalizations on where crime is concentrated to persist. This paper tackles two challenges facing crime analysis in the developing world: the availability of data and an examination of whether crime is concentrated in urban settings. We utilized newspaper archival data to study the spatial distribution of crime in Guyana, South America, across the landscape, and in relation to rural indigenous villages. Three spatial analysis tools, hotspot analysis, mean center, and standard deviation ellipse were used to examine the changing distribution of crime across 20 years. Based on 3900 reports of violent crime, our analyses suggest that the center of the gravity of crime changed over the years, spilling over to indigenous peoples’ landscapes. An examination of murder, where firearms and bladed weapons were the weapons of choice, suggests that these weapons moved beyond the coastal zone. The movement of weapons away from the coast raises concerns for the security of indigenous peoples and their associated wildlife. Our analysis suggests that policing measures should seek to extend towards Amerindian landscapes, and this is perhaps indicative of Latin American states with demographics similar to Guyana’s.

1. Introduction

Tell me how come there’s so much guns in the street an’ none a dem gun neva mek ya?
—Morgan Heritage, Tell Me How Come.
The question posed above by reggae musicians Morgan Heritage centers around why there are so many guns in Jamaica—a country that is not a recognized gun manufacturer—and the related crimes that come with their presence. Questions such as these are common in countries across Latin America and the Caribbean Sea, where the rates of violent crime have steadily increased [1,2]. In fact, Natarajan [3] argued that many of the most serious crime problems are now in developing countries, a contrast to the developed countries, where crime rates have declined [4,5].
For the most part, however, criminologists and crime scientists, most of whom work in developed/Westernized nations, have paid little attention to this problem [3] (although see Shenderovich et al. [6]). Natarajan’s [3] observations on the contrasting treatment of crime in the developed versus developing world were contained in a publication among a series that used data from El Salvador [7,8], India [9], Colombia [10], Brazil [11,12], among other developing countries [13,14], and gave attention to crime studies and analysis in developing world settings. While Natarajan’s [3] argument is relevant and timely, criminology in the developing world has not been entirely neglected. Scholars, including Appiahene-Gyamfi [15,16,17], Araujo [18], Cummings et al. [19], Pujol-Luz et al. [20], Reuter and O’Regan [21], Scabin et al. [22], Souza et al. [23], Spiegel et al. [24], de Melo et al. [25], and Valente [26], have examined various aspects of crime in the developing world. In Amazonia, in particular, the struggle over access to natural resources and the resulting tensions that develop from logging, gold mining, cattle farming, and similar activities tend to dominate the discussion around crime [22]. Beyond simply mapping the cases of deforestation and degradation due to illegal activities, however, there is a growing body of literature aimed at managing crime, albeit those that are environment-related, in various Amazonian settings. A few cases illustrate this point.
First, in addressing the problem of illegal logging in the Anavilhanas National Park, located in the Brazilian state of Amazonas, Scabin et al. [22] noted that there was a connection between the higher intensity of illegal timber harvesting and human settlements. Secondly, Nepstad et al. [27] pointed out that the presence of indigenous lands in the Brazilian Amazon served as a barrier to illegal logging. In fact, [27] pointed out that indigenous territories had similar effects on reducing illegal logging and fire, as has been the case for parks. Thirdly, Spiegel et al. [24], in responding to the high levels of deforestation attributed to illegal mining, examined how geographic information systems (GIS) and shuttle radar imagery could reduce tensions over areas that have been contested for mining. Spiegel et al. [24] observed that there is a pressing need for scholars to focus on crimes against the environment or green criminology [28,29] and that there is a role for GIS tools in mapping locations of interest. Fourthly, and perhaps most importantly, from the perspective of this paper, Souza et al. [23] studied the relationships between the various economic processes of territorial occupation in the Amazon and how they influence the spatial diffusion of homicidal violence, the movements of people and merchandise. Grain production as a driver of territorial occupation did not influence the diffusion of homicidal violence, but Souza et al. [23] reported that the expansion of deforestation and livestock rearing influenced where such violence occurred. These observations appear to go against Weisburd’s [30] laws of crime concentration, which suggest that crime stays within a narrow bandwidth across time, despite strong volatility in crime incidents. Weisburd focused on micro-places—streets, street segments, and addresses—in developing the law of crime concentration. Whether such observations will hold through for macro-places—states, counties, and countries—remains poorly studied. In Amazonia, high-value resource extraction activities that lead to deforestation have been linked to violent crime, but how these vary across space needs more attention. This paper does not track the causes of violent crime directly but rather seeks to track where such crimes have occurred and how they align with Weisburd’s [30] law of crime concentration. Of more significant concern to this paper is the fact that most resource extraction activities within Amazonian contexts tend to occur within indigenous peoples-influenced landscapes [31], and yet, crime’s influence on such landscapes remain unexplored. Examining how Weisburd’s [30] laws of crime concentration hold to tropical settings can be important for developing crime prevention policy.
As evidence continues to mount that crime across Amazonia is increasing [32], the implications of such findings for native peoples need urgent attention. Green criminology, environmental crime, or the study of crimes affecting human and non-human life, ecosystems, and the biosphere [28,29] provide theoretical lenses for studying such crimes. In the case of Guyana, the area of interest for this study, the last three to four decades have seen a wide and diverse range of crimes occur within its borders. Internationally, the most prominent crime to have occurred in Guyana was the Jonestown massacre in 1978 [33], while the plot by Guyanese and men of Guyanese ancestry to bomb John F. Kennedy airport [34] in New York has also gained significant attention. However, the Omai gold mine spill that occurred in Guyana [35], the largest industrial spill of its kind, was the most prominent environmental incident that could potentially be termed a crime. Apart from environmental crimes, earlier studies have pointed towards an upsurge in violent crime in Guyana [19]. In fact, in 2010, a report carried in the Stabroek News [36], one of Guyana’s leading newspapers, pointed out that there was one murder every three days in Guyana, with locations outside of the main municipal centers the site for some of these crimes. Furthermore, the Stabroek News [37] published reports attributed to the Crime Chief of Guyana, who pointed out that geography and low population density were making tackling crime difficult. Despite the signals that there has been an upsurge in crime in Guyana, little has been done, at least from the perspective of the academic literature, to study crime’s spatial distribution in order to guide policing policy and decision-making processes. A key reason for this lag is that the data on crime are not readily and publically available. This is particularly the case for crimes that are committed within rural settings. Access challenges, and geography, as the Crime Chief put it, may prevent our understanding of the crime landscape and how they relate to Weisburd’s laws of crime concentration.
With the foregoing in mind, this paper takes steps towards understanding how the spatial distribution of crime in Guyana has changed relative to indigenous peoples-influenced landscapes. On the backdrop of Weisburd’s [30] law of crime concentration, we hypothesize that over the past two decades or so the concentration of crime events shifted away from micro-places. Shifts in the concentration of crime will have implications for crime relative to indigenous peoples-influenced landscapes. Analyzing whether crime spatial distribution relative to indigenous lands has changed can provide insight into where scholars and police alike can focus their efforts on studying crime. In this regard, our paper, drawing on geographical information systems (GIS) methods, pursues two primary goals. First, using unofficial data derived from newspapers, the spatial distribution of violent crime is examined relative to indigenous lands to determine whether crime’s concentration moved away or ‘shifted’ from the urban landscape. Secondly, we examine how the distribution of murders committed using firearms and bladed weapons has changed relative to indigenous peoples’ lands. This latter focus is critical, as violent crime committed with these weapons can have implications for the well-being of indigenous peoples and the wildlife with which they are associated (environmental crime). The movement of guns into the forested landscape may have implications for a host of environmental crime, for example, hunting, the well-being of wildlife, and the security of indigenous peoples. In this regard, our analysis provides the foundation for assessing crimes on the environment, and how crime may play a role in shaping processes within indigenous-influenced landscapes, areas of study that are currently neglected in the developing world. We make observations as to whether Weisburd’s [30] law of crime concentration may apply to the Guyanese landscape, a country that has a declining population.

2. Materials and Methods

2.1. Study Area

Data for this study were collected for Guyana, South America’s (Figure 1) only English-speaking country. Over the past two decades or so, crime, especially violent cases, has increased in Guyana [19,36]. Concurrent to the increase in crime has been a gradual opening up of the Guyanese frontier for various resource extraction activities, primarily gold mining and logging. As a result of increasing access to the frontier, more people are moving away from the coastal zone, where around 90% of the country’s population currently resides. Most of Guyana’s population reside within the environs of the nine municipal centers (Figure 1). The last census for Guyana suggested that the overall population, of around 746,955 persons, is declining, but that of indigenous nations is growing [38]. The Census characterized the Guyanese population into six major groups, based on their ancestry: Indian, African, European, Chinese, mixed, and Amerindian. Of these groups, the first four live primarily along the coastal zone, while Amerindians, who are indigenous to Guyana, account for around 10.2% of the national population and live in 96 villages (Figure 1), distributed across the forested and forest-edge landscapes.
There are nine Amerindian nations in Guyana [39], and like indigenous peoples-influenced landscapes across Latin America, their villages are located in the same spaces as high natural resource deposits. A large number of villages have remained relatively insulated from the coast, primarily because their villages are located in the forested landscapes of Guyana, where access by road is often limited to fair weather times of the year. For most of these villages, communication is by air and water. Since the 2007–2008 global financial crisis, however, access to Guyana’s forests has improved, with the draw of gold riches strong enough to overcome the challenges surrounding accessibility. As a consequence, the number of crimes committed in Guyana on gold miners, as gold prices have soared, has been on the increase. In a number of instances, as people traverse the newer transportation routes linking Georgetown, the capital of Guyana, to spaces adjacent to indigenous villages, various types of crime, including robberies that lead to murder, have been committed. Therefore, as a consequence of the increase in access to Guyana’s interior, the Guyanese crime landscape, which was traditionally thought to be associated with the coast [19], appears to have been shifting towards the indigenous peoples-influenced landscape. Whether the distribution of crime had shifted towards the forested interior landscapes, the regions where indigenous peoples’ lands are located, remains unexplored and is the subject of this paper. The mapping methods pursued in this paper were chosen to examine how the distribution of crime has moved relative to indigenous lands.
Guyana was chosen as the study site for the paper because the archives of the newspapers are available online in English, the first language of the authors, which made data interpretation more accessible. In addition, with the higher density of Amerindian villages across the landscape, we expect that our analysis may provide insights into the distribution of crime in other countries of Latin America with similar demographics to Guyana. In addition, the first author is native to Guyana and has a good familiarity with the landscape and place names to facilitate geocoding and mapping crimes. The geographically referenced data on the distribution of Amerindian lands, roads, and trails were available online (http://data.gim.gov.gy/layers/?limit=100&offset=0), making it easier to incorporate these datasets into the analysis and visualizations. It should be noted though, that data on the boundaries of municipalities and townships, common areal units for crime analysis elsewhere, were not available for this analysis.

2.2. Data on Crime and Its Collection

At the time of commencing this analysis, official georeferenced crime data for Guyana were not publicly available, as is commonly the case for the United States [40], for example, and other jurisdictions. To obtain public data on crime, our study needed to adopt a different strategy, even though these were unofficial records. A feature of the increasing crime situation in Guyana over the past two decades or so has been the rapidity with which news and other media outlets have reported on these incidents as they unfold. For example, the first author receives updates from Stabroek News (www.stabroeknews.com) as new items emerge, in particular crimes. We tapped into the data on crime that are available in the news and followed the process used by [19] to obtain such data from the online archives of Stabroek News. In this sense, we used media reporting of crime as a proxy of crime levels in the absence of data from the police. The Stabroek News archives were chosen because it is a privately owned daily newspaper with a well-developed reputation for being balanced and independent. While it was not expected that each crime that occurred in Guyana would be captured by Stabroek News, the reporting on crime occurrence locations was expected to be reflective of the reality on the ground given the orientation of the newspaper. Since each crime was not expected to be reported and given the potential that our data collection team may have missed some events, we treated our dataset as a sample. We expected the newspaper to provide a good cross-section of crimes that occurred in Guyana across the years that the archives were available online. Since it is well established that crime is a popular news item and has been linked to increased newspaper sales [41], we expected the reporting on crime events to provide sufficient details to facilitate this study.
The archives of Stabroek News were accessed through two different digital portals. The first was an image-based repository (https://news.google.com/newspapers?nid=1fM7sLBYaPUC&dat=19861121&b_mode=2&hl=en) and covered reports from 1986 to March 2009. Unfortunately, this first resource did not contain reports for every day, and in fact, long periods were unavailable. The second archive (http://www.stabroeknews.com/archives/) contained daily newspapers (with a few exceptions in 2007) from 1 January 2007 to the present day. All data that were available via the two archives for the period January 1986, when the archives first appeared, through to 31 December 2010 were included in our sample. The data on each crime were obtained by manually reading the image-based archives (the first repository) and using a combination of search terms such as “crime”, “robbery”, “murder”, and “guns” and manually reading each record for the second repository. For both archives, we identified each crime and its characteristics, including the date, location, and nature of the offense. At the time of data collection, we used the description of the crime, including reference to the use of weapons, to separate crimes into violent and non-violent categories. Each crime was coded to separate them by the type of crime and the type (s) of weapon (s) that were used in a specific event, where appropriate. The data on each crime were entered into a spreadsheet developed to collect as many details as possible on each crime. The data were collected by the authors (a team of five undergraduate students, one graduate student, and the first author). The archives were separated into annual portions, and each author took responsibility for collecting data from these time frames. For each collector, a sample of ten (10) days was double-checked for accuracy by at least one other person on the team.
Once crime data were obtained and placed into the database, we adopted the classification of crime used by the Federal Bureau of Investigation (FBI) Uniform Crime Reporting (UCR) Program (www.fbi.gov) to identify and define violent crime. According to the UCR, violent crime contains four primary offenses: murder and nonnegligent manslaughter, forcible rape, robbery, and aggravated assault. Based on this definition, violent crimes were those offenses where force is used. In contrast, we classified non-violent crimes as those offenses where force was not used. This paper focused on violent crime and its distribution across the Guyanese landscape.

2.3. Mapping the Changing Distribution of Violent Crime

Once the data on crime were obtained from the newspaper archives by the individual data collectors, they were cleaned and consolidated into a master database. The locational data for each crime were obtained through either using the official gazetteer of places for Guyana or Google Earth. The newspaper reports often contained data on the place where each crime was committed, with, for example, details on the street name, sometimes the house number, the village, or town in which an offense occurred. Where these data were provided, they were compared with the official gazetteer of places and Google Earth to determine a location for each crime. In cases where house numbers and street details were provided, these details were removed from the dataset so as to map each crime at the level of the place (village, town, or city) in which it occurred. In cases where the location of a crime was unclear, or not stated in the reporting, the data collection team examined the contextual data provided within the report to place that crime to the nearest village, town, or other recognized location, where possible. Where locational data were absent, the details on the crime were still recorded to allow us to gain perspective on crime, but such cases were not mapped. The geocoded data, along with the attributes associated with each crime, were saved in a geodatabase and mapped in ArcGIS for analysis.
To study the spatial distribution of crime, we drew on a Hot Spot Analysis clustering function (Getis-Ord Gi) in ArcGIS. Based on work by other scholars in the area [19], we expected hotspots of crime to be present in the vicinity of Georgetown and surrounding areas. The count of crimes at each location in our database was used as the weight to complete the Hot Spot Analysis. To examine the distribution of the data away from the coast and towards indigenous villages, we used two centrographic statistics for spatial data that are commonly used in criminology [42,43]. The first tool was the mean center:
x ¯ = x n
y ¯ = y n
where x ¯ is the mean of the x coordinates of all locations, y ¯ is the mean of the y coordinates, and n is the number of points in the dataset. The mean center was used to provide a sense of the central focal point of the data [42], and how this shifted over time as the number and distribution of violent crime changed. As the mean center can vary based on the characteristics of the dataset, including the presence of outliers [42], and the fact that the boundaries of places were unavailable for analysis, we opted to develop the standard deviational ellipses to assess whether the distribution of violent crimes changed across the Guyanese landscape. The standard ellipses are elliptical in shape, with a long axis running the longest straight line distance from end to end and through the mean center, and a short axis which is perpendicular to the long axis and also runs through the mean center joining the closest edges of the ellipse [42]. The ellipse gives an indication of the dispersal of the points, where a larger ellipse means a greater dispersion of points, but the direction of the longer axis of the ellipse indicates the predominant alignment of the data dispersal. Long narrow ellipses are indicative of a linear data pattern, while rounder ellipses suggest that the point pattern is more evenly distributed in all directions around the mean center [42]. The computation of the mean center and standard deviation ellipse were completed in ArcGIS using the tools for measuring geographic distribution. We assessed changes in the mean center and the standard deviation ellipse to infer how crime’s focus may impact areas beyond Georgetown and other municipal centers (see Figure 1). Beyond computing the mean center for crime, we used Amerindian villages as a proxy for impacts away from Georgetown, the main municipal center, and examined changes in crime’s mean center relative to that of the Amerindian villages’ mean center. For this analysis, we compared the distance of the mean center of Amerindian villages to the five categories of violent crime covered in the analysis. Because the computation was completed for each crime type, the data were disaggregated and, as such, were smaller samples. Because data were absent for some years, the distances to mean centers were compared across the periods 1986–1995, 1996–2000, 2001–2005, and 2006–2010, in roughly five-year intervals, with the exception of the 1986–1995 period.

2.4. The Changing Distribution of Murder

Beyond the distribution of all violent crime, we used murders to assess how crime distribution changed relative to indigenous lands. We focused here on murders committed using guns and bladed weapons. As the sample of murder incidents was smaller than the larger violent crime dataset, these data were aggregated into five five-year intervals for analysis. The three measures (mean center, standard deviation ellipse, and Hot Spot Analysis) were used to examine the distribution of murders across the landscape over time. Murder was chosen as the type of violent crime to assess because of the high number of guns used in their committal, and the movement of guns into the landscape can provide insight into where environmental crime, including the poaching of wildlife, may occur. Currently, the gun permitting process in Guyana is very rigid, with people interested in owning guns having to show that they have a strong security need to qualify. Similarly, hunting is illegal in most contexts. Hunting by indigenous peoples as a part of the traditional lifestyles is legally recognized, with traditional weapons still dominating this practice. The distribution of guns beyond Georgetown and other municipal centers may have implications for indigenous people’s livelihood practices and for the illegal killing of wildlife, such as jaguars (Panthera onca). The movement of guns into the landscape can, therefore, provide insight into where environmental crime may occur and whether Weisburd’s [30] law of crime concentration holds in the Guyanese context.

3. Results

3.1. The Nature of the Archives

The archives of the Stabroek News from 1986–2010 contained reports for a total of 3407 days (out of a possible 9130 days; Table 1) or about 37% of the possible days during the study. Our sample varied in terms of the number of days that were available for data collection each year (see Table 1). As the number of crimes and days reported varied across years, we aggregated the crimes from 1987–1991. While our analysis was completed for five-year intervals, we nevertheless examined each year between 1992 through to 2010 individually in spatial analysis. Even though the archives were written in the respective years under consideration, it was not uncommon to have reports in one year covering crimes committed in a previous year. For example, there were only two crimes covered in 1986, and one of these referred to the tragedy of mass suicide / murder at Jonestown, in the Northwest District of Guyana in 1978. This crime was captured in the archives, even though it did not occur during the time the archives were written. Because the report provided details on an event that occurred outside of our study period, we removed it from further analysis. Reports on crimes that occurred after 1986 but were referenced in a subsequent year were included in our analysis, with the crime being attributed to the year in which it occurred. For example, in June 2006, the newspaper reported the results of a murder trial that began in 1998. As the time that the murder was committed was not contained in the archives, this event was captured and attributed to 1998. For our analysis and data collection, the details provided in the 2006 report were used to understand the nature of the event on the day it occurred in 1998. It was not uncommon for cases like these to lack locational information, and hence, mapping them was not possible, but they provided important context in helping to understand the changing crime landscape in Guyana.
Of the days reported on in the archives, a total of 5992 independent crimes, both violent and non-violent, were reported. Violent crimes, including murders, robberies, sexual assault, and common assault with a weapon, amounted to 3943 crimes, or 65.8% of all crimes reported in the archives from 1986–2010. Robberies dominated the sample, accounting for 31.1% of violent crime and 20.5% of all crimes. Murders were the next most frequently reported crime, accounting for 27% of violent crime and 17.8% of all crimes. Assaults that were committed with a weapon, including stabbing with bladed weapons, wounding with clubs, sticks, fists, chemicals, and common weapons, accounted for 28.3% of violent crimes and 18.6% of all crimes. Sexual assault, including rape, indecent assault, and carnal knowledge, accounted for 8.49% of violent crimes and 5.6% of all crimes.

3.2. Locational Data and Mapping Crimes

As mentioned in the Methods section, location data were not available for all crimes. While a total of 5992 crimes were found in the archives, locational data to allow for the mapping of each crime were only available for 5504 events. Overall, the data in the archives were mapped for 1502 distinct locations across the Guyanese landscape. In some instances, the location of the crime provided was very general; for example, “Georgetown”. In such cases, we used the context provided in the news report to place the crime to the nearest known location. Crimes reported in Georgetown, for example, were given the location contained in the gazetteer for Georgetown. In other cases, such as the crime being committed at the “Mashramani Road Jam”, the article did not provide enough details for us to locate the crime. Mashramani is the annual celebration of Guyana becoming a Republic (23 February 1966), and major celebrations take place in Georgetown, New Amsterdam, and Linden. As there were three possible locations where this crime may have been committed, this crime was not mapped. We also made a note of crimes that were committed on Guyanese territory off the terrestrial area of Guyana, in particular cases of piracy in the Atlantic Ocean. In the case of such crimes, though, it was difficult to map these, as descriptions of location may have included, “25 miles off Shell Beach” and “29 nautical miles east of the Waini River”. While Shell Beach and the Waini River are known physical features to the authors, the places themselves cover a wide area. Therefore, the description of 25 miles off Shell beach or 29 nautical miles east of the Waini River did not provide enough detail for us to place these crimes on the map.

3.3. General Distribution of Crime

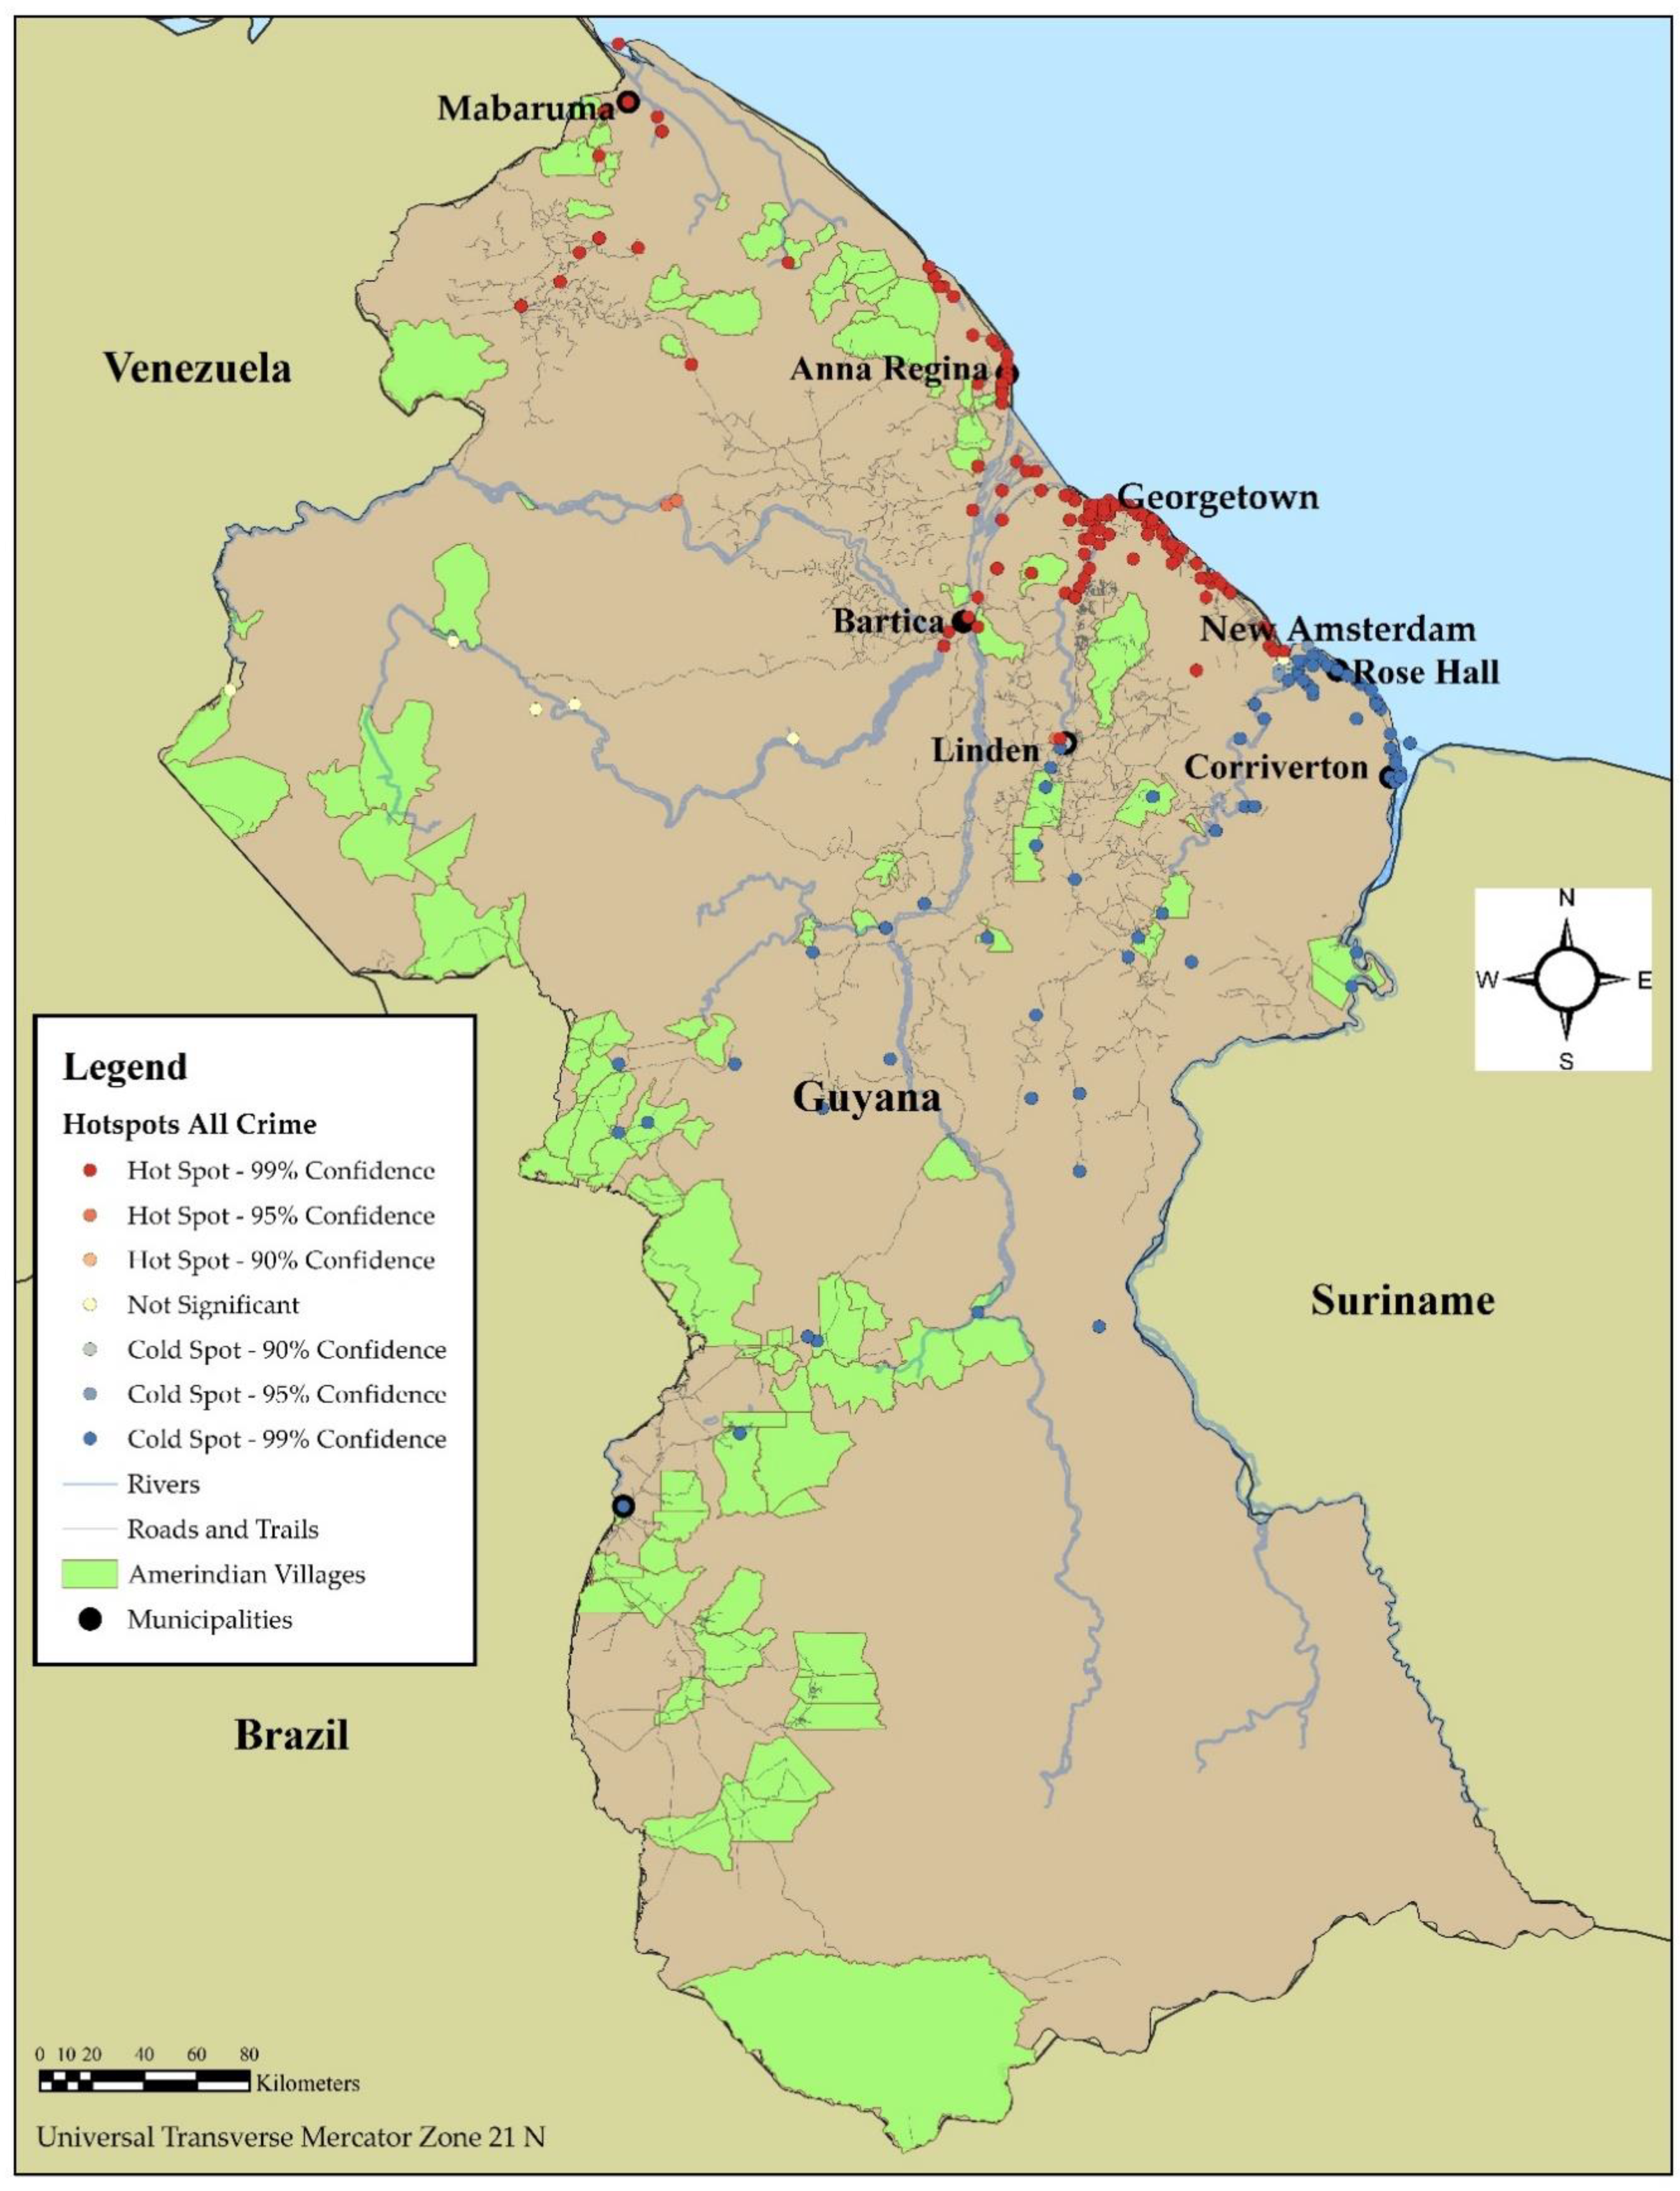
Despite the challenge of being able to accurately map the location of each crime, the data still suggested that crime in Guyana is a coastal feature, clustered around Georgetown and its environs, with significant hotspots along the coast (Figure 2). Of all the crimes that were reported in the archives, around 10% were attributed directly to Georgetown, while an additional 25% occurred within the environs of Georgetown. Overall, as the data for the distribution of violent crime were analyzed for the twenty years, it was observed that the spatial distribution of crime, while centered on Georgetown and its environs, moved away from the coast, stretching northerly and southerly.

3.4. Distance of Crimes Relative to Indigenous Villages

The analysis of the distance between the mean centers of Amerindian villages to the mean center of the five violent crime types suggested that sexual violence (158.12 km) was closest to the villages’ mean center. Murders (161 km) and robbery (164 km) had the second and third closest average distances (Table 2) to the Amerindian village mean centers.

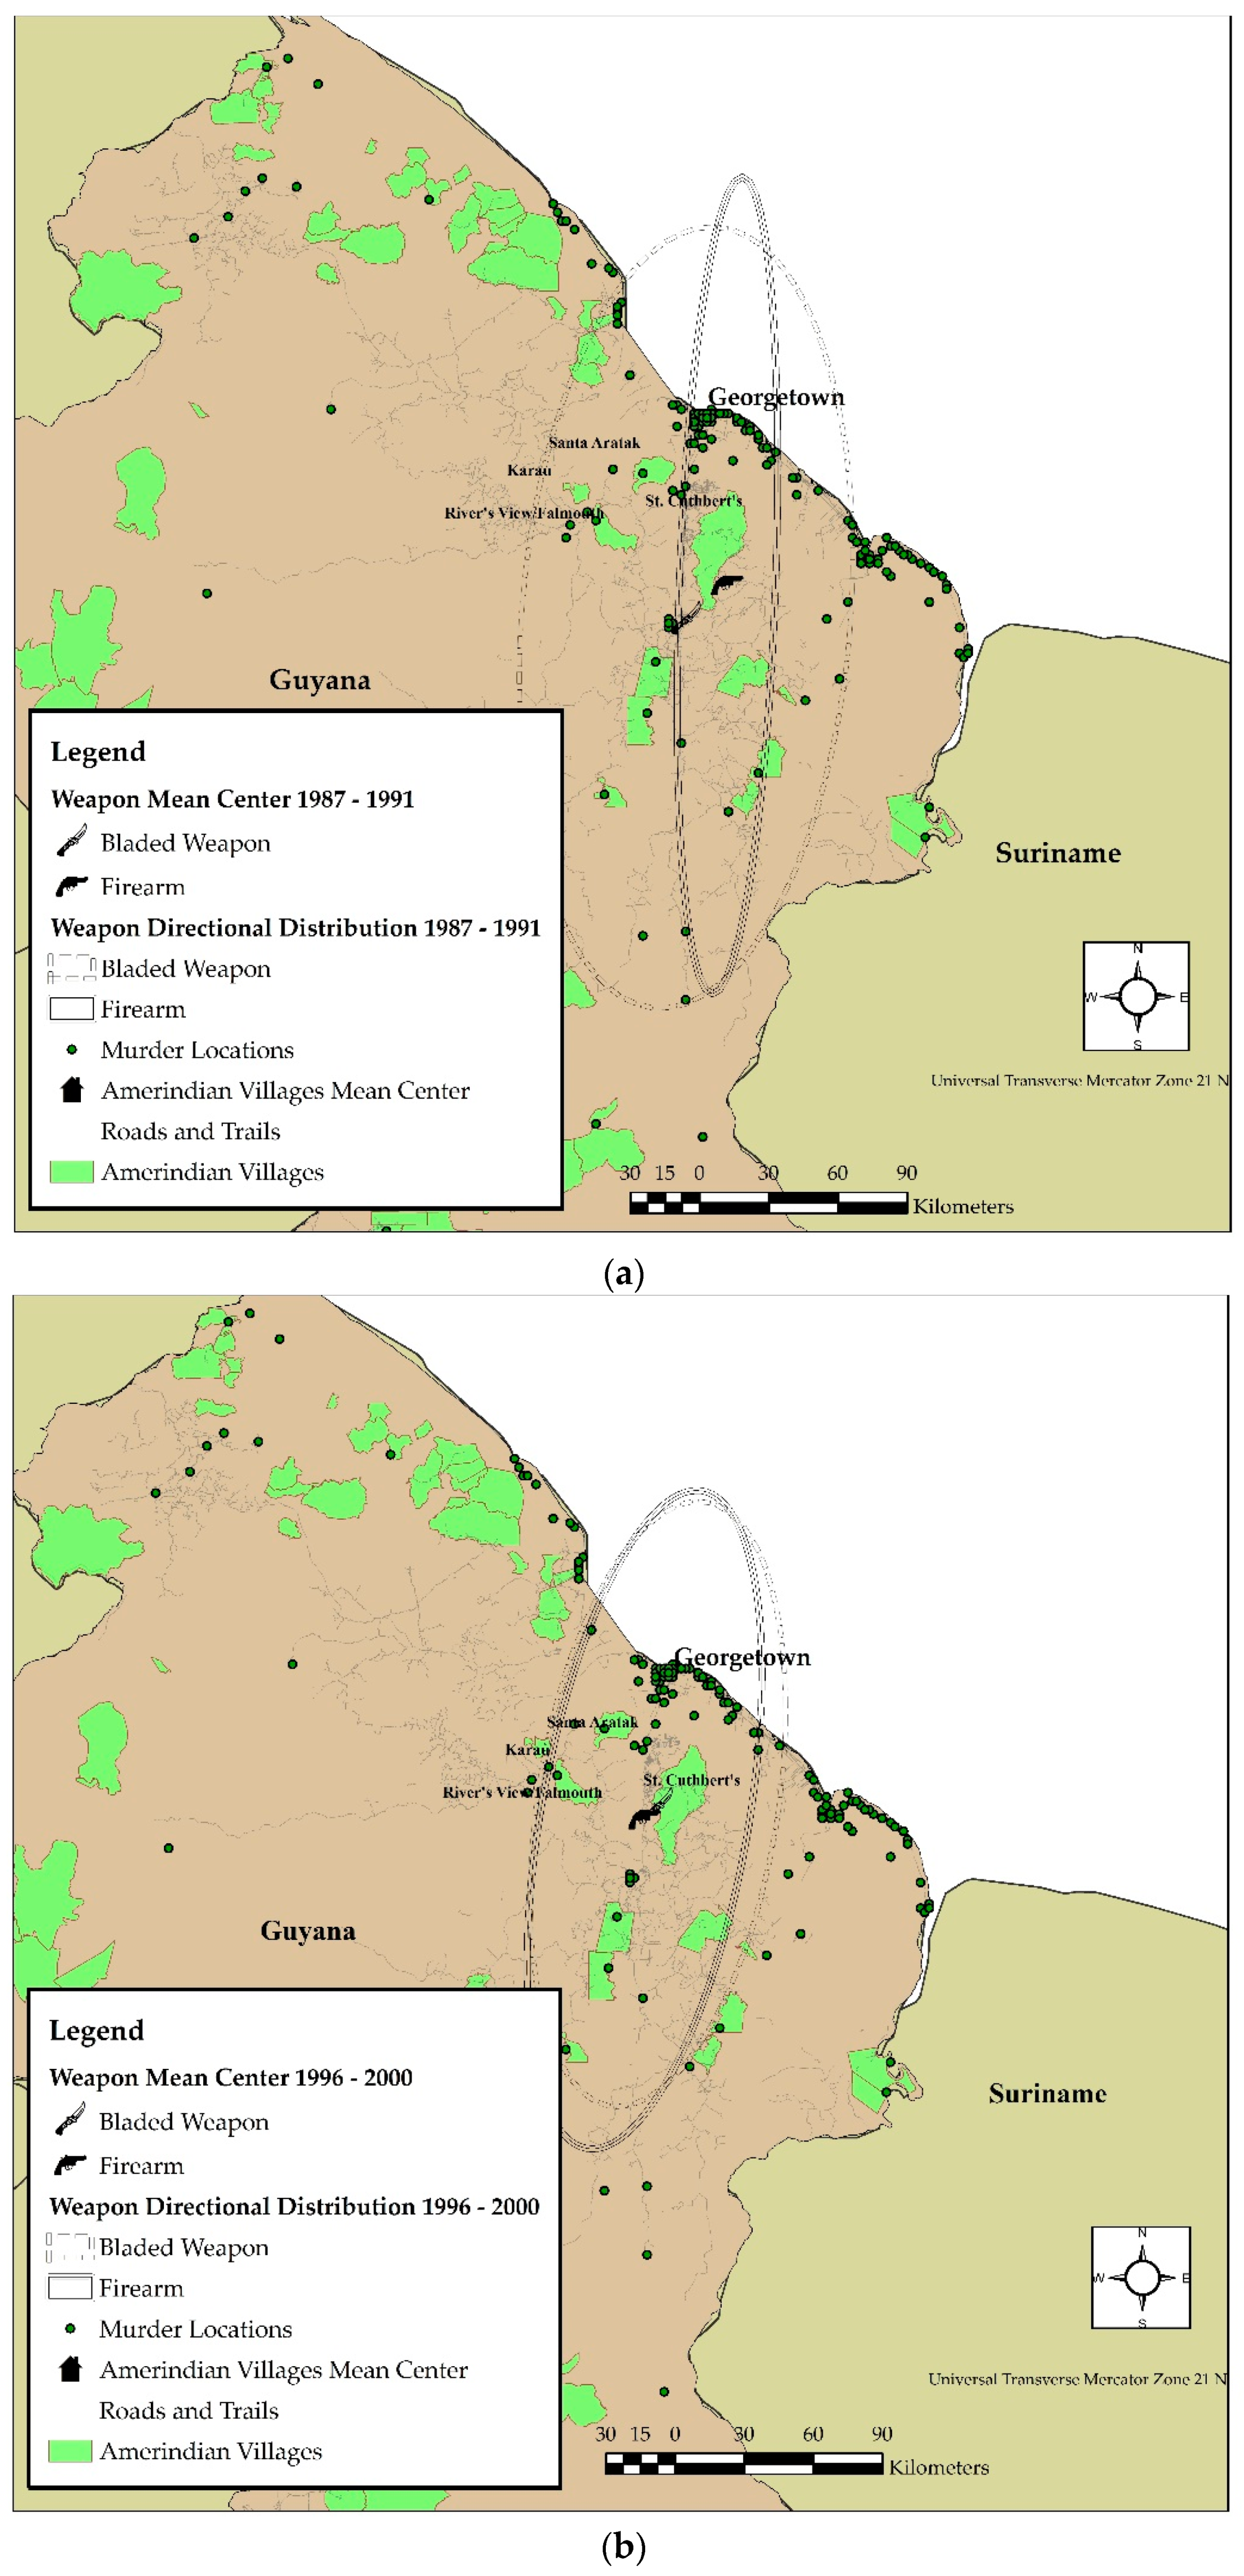
3.5. Description of the Spatial Distribution of Violent Crime

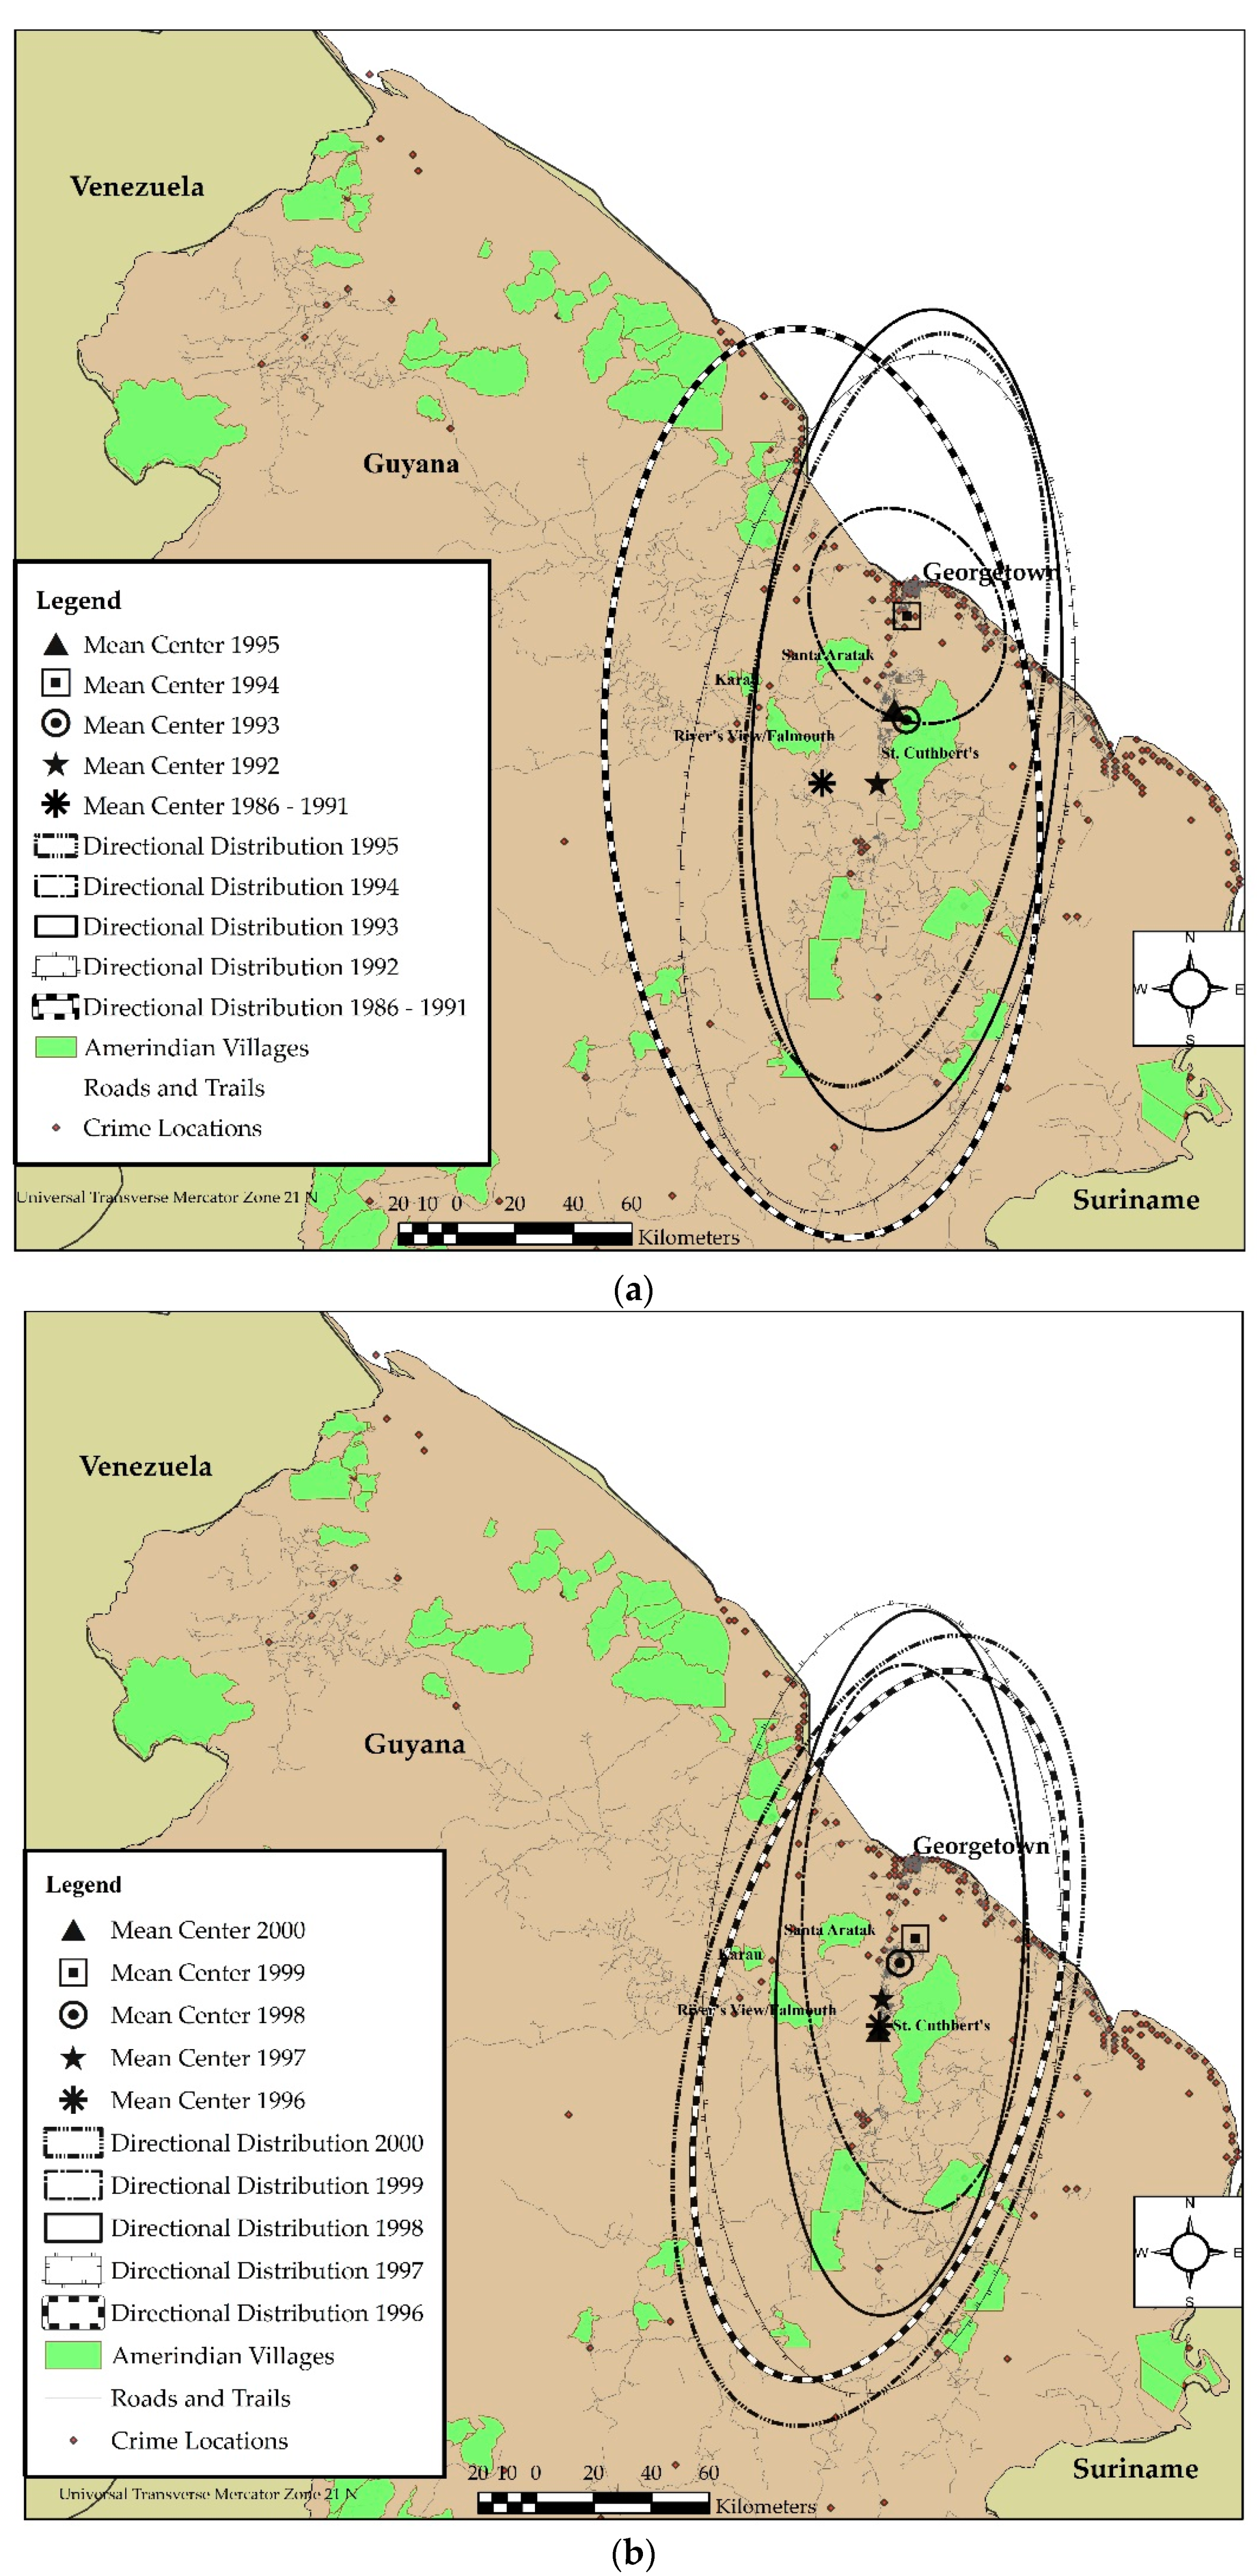
The mean center of all violent crime pivoted around the Amerindian village of St. Cuthbert’s Mission (around 35.4 kilometers south-southwest of Georgetown), moving ever so slightly north and west of the village over the years. However, the mean center varied across the years covered in our analysis. As the period 1986–1991 had few crimes, these were aggregated for the analysis, and it was found that the mean center of crime was located south of River’s View Village and southwest of St. Cuthbert’s Mission during this time (see Figure 3a). In the years 1993, 2001, 2007, 2008, and 2009, the mean center was located firmly within the northern portion of St. Cuthbert’s Mission land. The mean center’s position shifted towards the west of St. Cuthbert’s Mission in 1992, 1995, 1996, 1997, 2004, 2003, and 2010 (see Figure 3b), with the distance from the village varying slightly.
In 1998, 1999, and 2002, the mean center was north of St. Cuthbert’s Mission, while for 1994 and 2005 the location was away from the village. In 1994, the mean center for violent crime was closest to the environs of Georgetown, while in 2005, the mean center was closest to the village of River’s View (see Figure 3a).
Unlike the mean centers, the standard deviation ellipses showed that the distribution of crimes varied across the Guyanese coastal and terrestrial landscapes (see Figure 3a,b,c). In 1994, for example, the ellipse was almost circular, trending slightly from north-northwest to south-southeast. The 1994 ellipse was located across Georgetown. The ellipse covering the period 1986–1991 was wider, relative to those for 1992, 1993, and 1995. Interestingly, it was the 1986–1991 ellipse that covered more area in the period 1986–1995, suggesting that violent crimes were more dispersed, certainly beyond coastal Guyana into the central part of the country. The ellipses for 1992, 1993, and 1995 had similar shapes, trending northeast to the southwest, but varied slightly in their lengths and widths. The ellipses for 1996–2000 (Figure 3b) had different shapes and sizes but trended towards the northeast to southwest. The ellipses for 1998 and 1999 were more linear and, unlike the others, trended more north to south. Unlike the ellipse for 1994, which covered both coastal and inland Guyana, the 1996, 1997, and 2000 ellipses extended to inland Guyana but were more restricted along the coast. The ellipses for the years 2001–2005 showed a steady and gradual increase in coverage from central Guyana to northeastern Guyana (
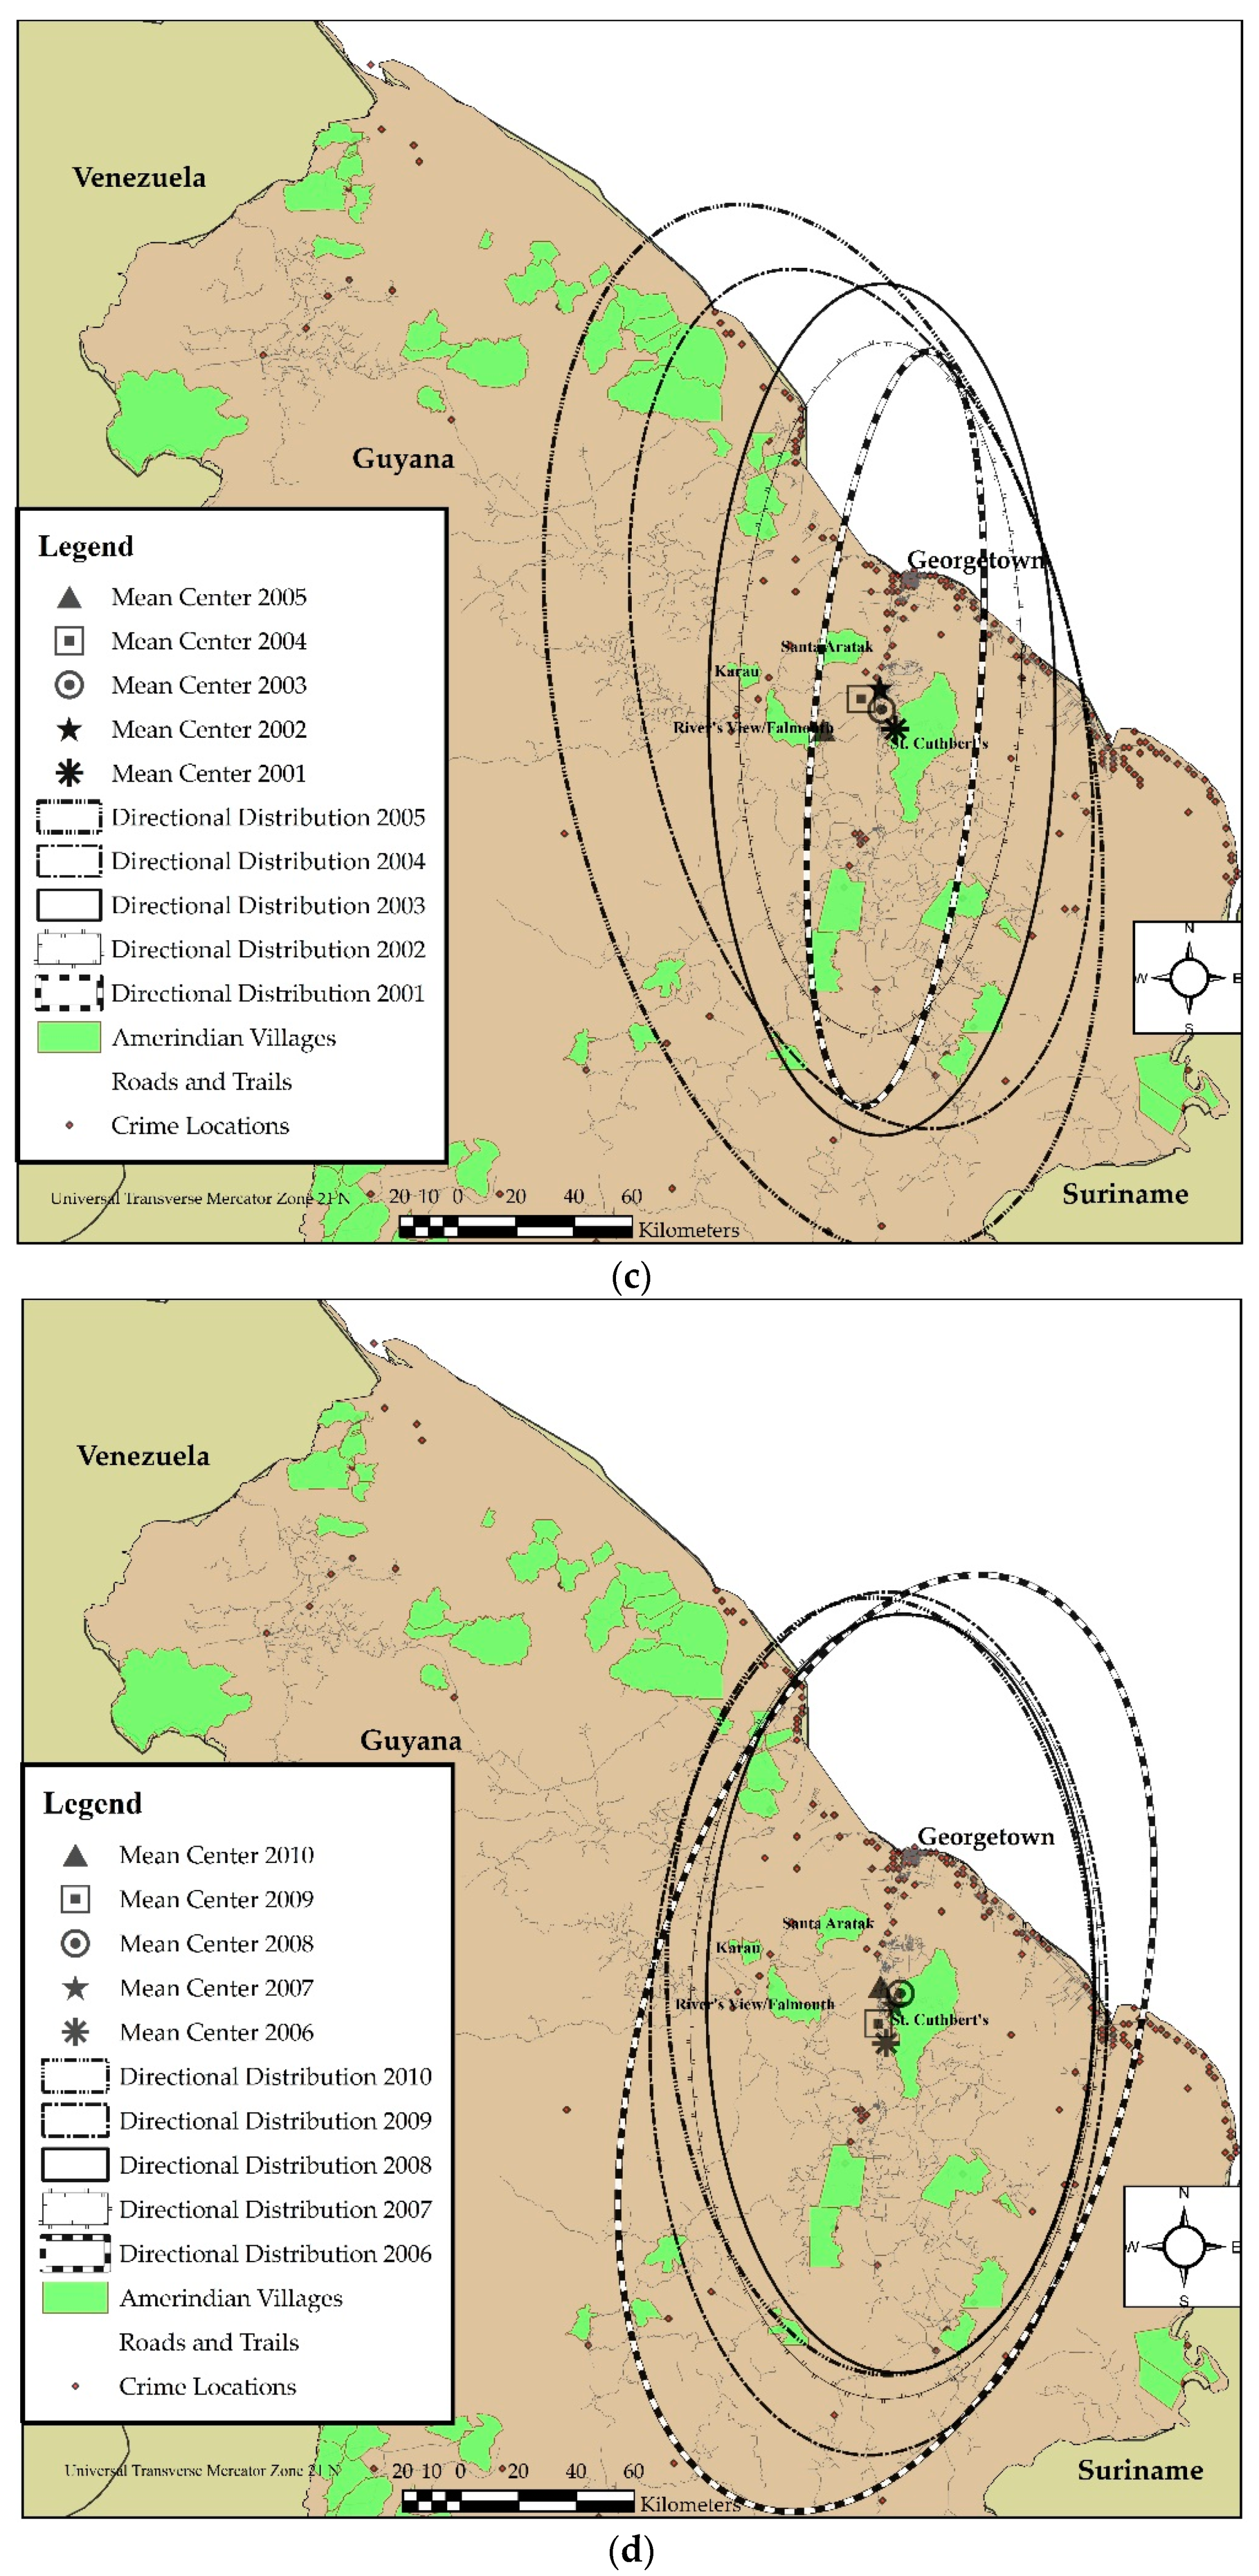
Figure 3c). While the ellipse for 2001 was narrow and restricted along the road network, 2002 was more restricted lengthwise and was extended over more coastal areas. Like 2001 and 2003, 2004 trended more north to south, while 2004 and 2005 extended more toward the northwest and southwest. The ellipses for 2004 and 2005 showed a gradual increase in area covered into central Guyana. The ellipses for the years 2006 to 2010 (Figure 3d) began to show a more definite pattern of crimes moving into the indigenous peoples influenced landscapes relative to the ellipses for 2004 and 2005. The 2006 ellipse extended northeast to southwest and covered more area than any other ellipse during the 2006–2010 period. The ellipses for 2007–2010, the period with the highest reports of violent crime, all trended almost north to south, including portions of the coastal landscape, but also showing a gradual movement into the areas beyond Georgetown. The 2007 and 2008 ellipses were narrower and shorter than the 2009 and 2010. However, for the 2007–2010 period, the 2010 ellipse covered the widest area (see Figure 3d).

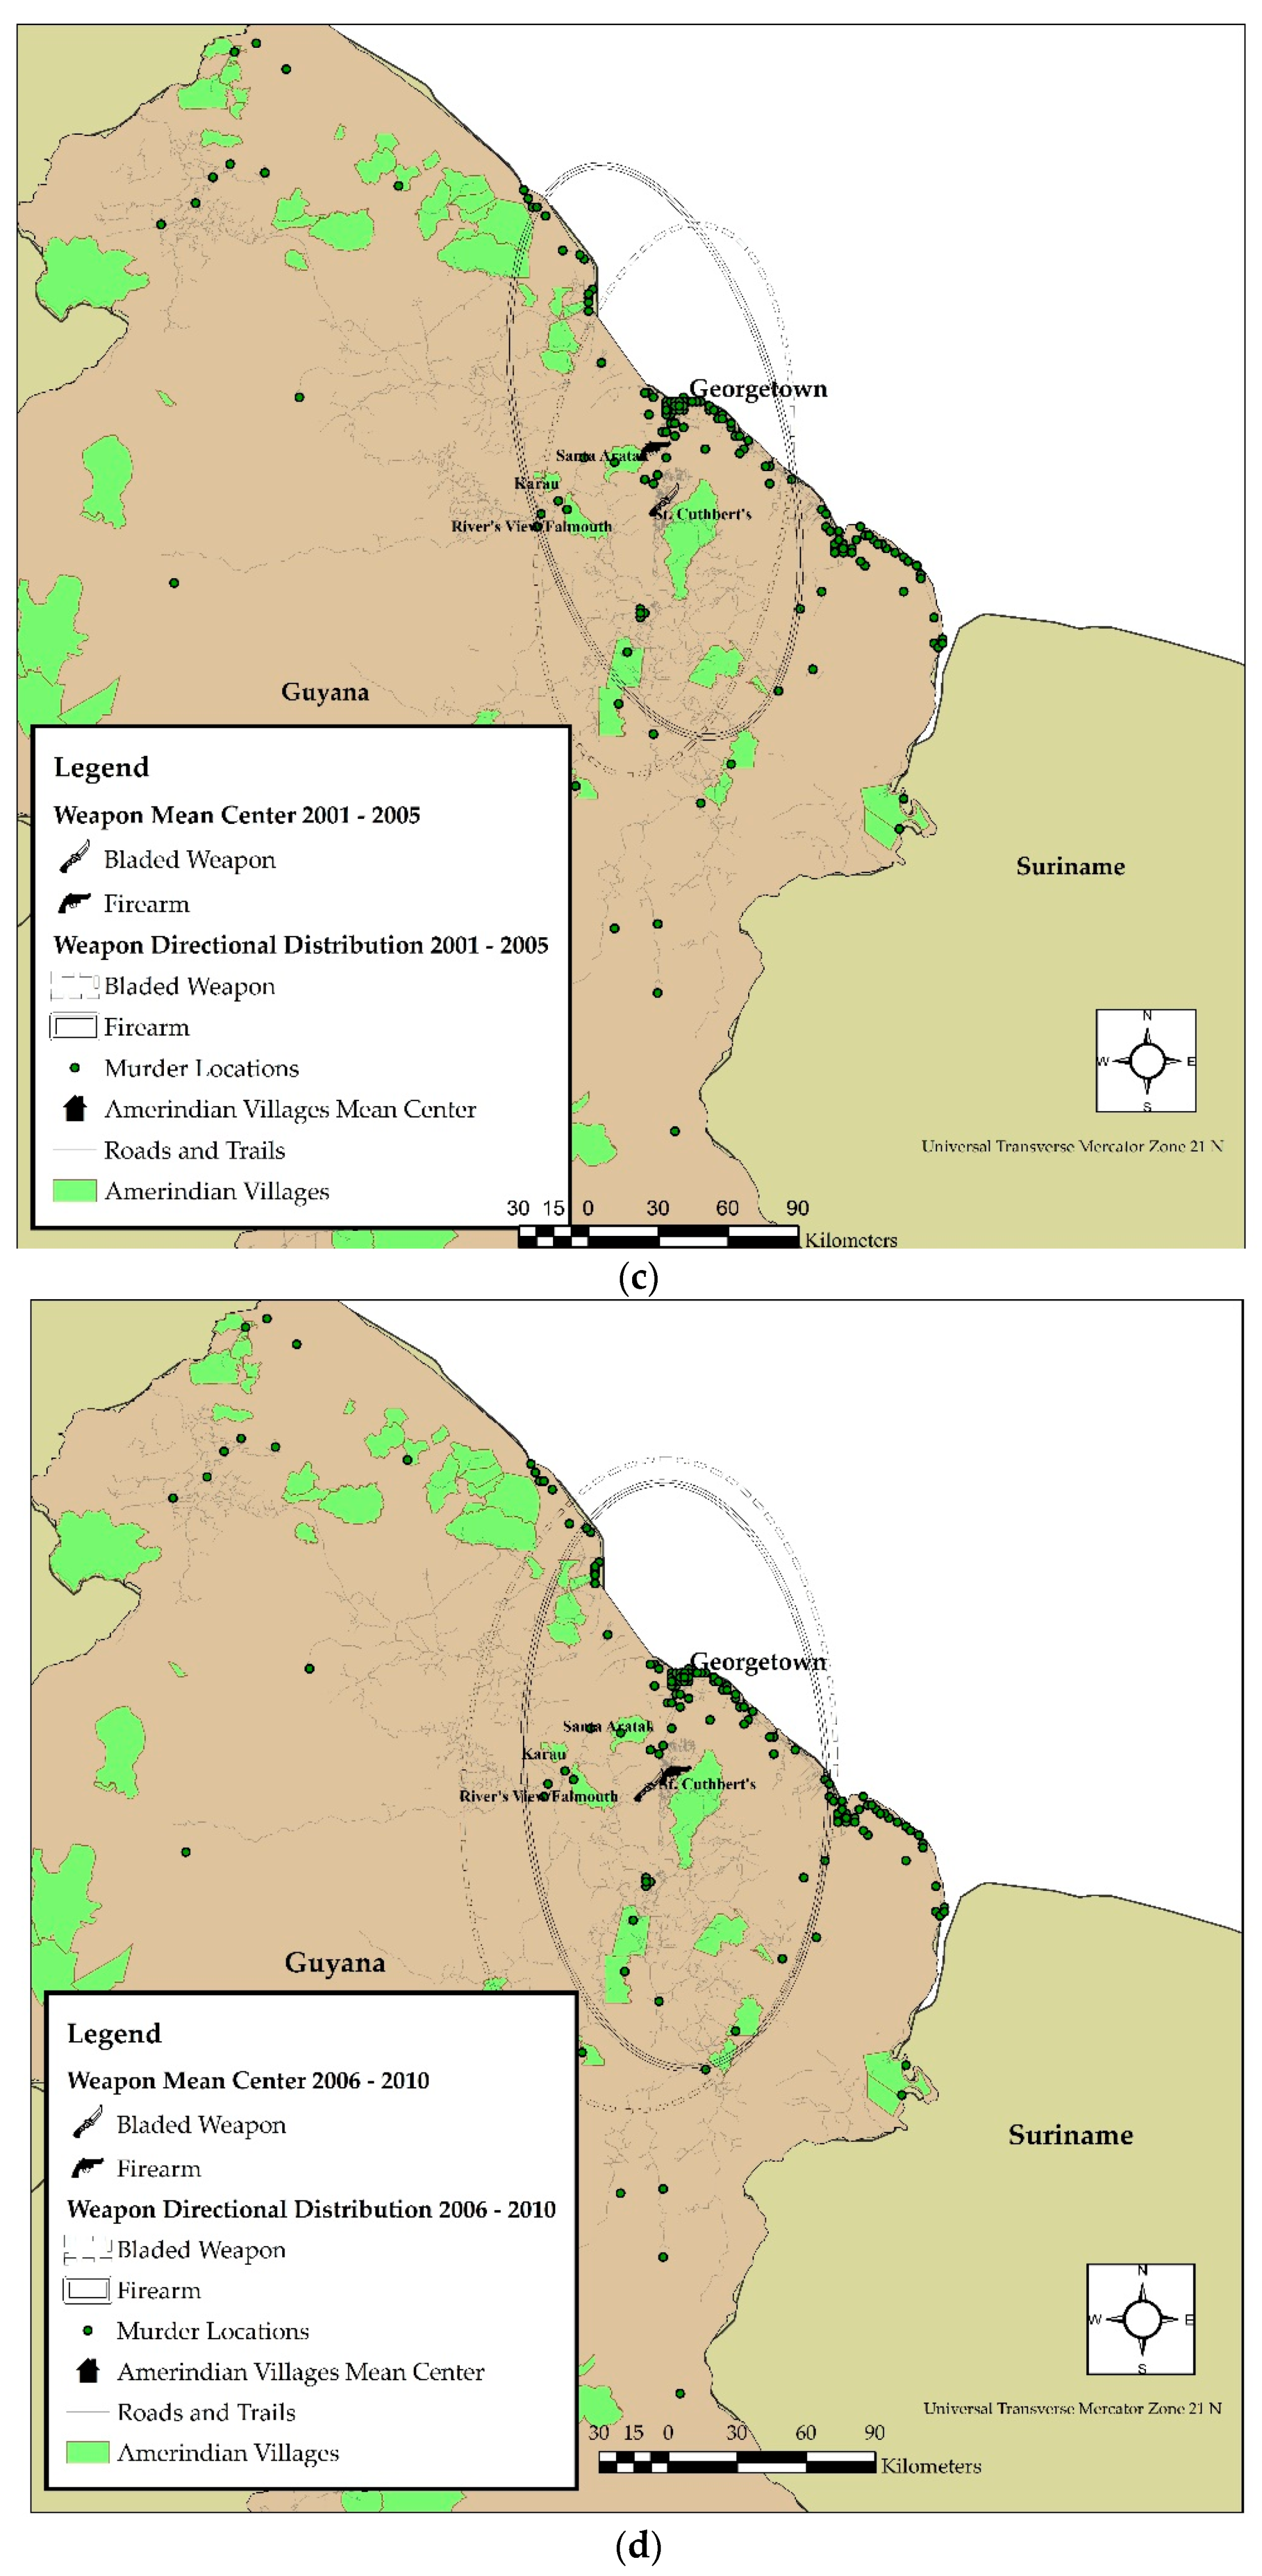
3.6. The Distribution of Murder

When the spatial distribution of murders and the weapons used to commit these acts were considered across the landscape, a wide variation in patterns was observed. In the analysis of the distribution from 1987–1991 (Figure 4a), bladed weapons extended into central Guyana, covered a wider area of the country, and trended in an almost northeast to southwesterly direction. In contrast, firearms had a much narrower distribution and trended north to south. The mean center for both weapons was outside of St. Cuthbert’s Mission village, with firearms to the northeast of the village’s boundary and bladed weapons to the southwest. For the period 1996–2000 (Figure 4b), the ellipses for bladed weapons and firearms trended in the same northeast to southwesterly direction, with bladed weapons wider than firearms. However, firearms extended further into central Guyana than bladed weapons. The mean center for bladed weapons was on St. Cuthbert’s Mission lands, while firearms were west of the village lands. The patterns for the two types of weapons had a noticeable contrast in the 2001–2005 period (Figure 4c). While bladed weapons trended from the northeast to the southwest, firearms trended from the northwest to southeast but covered more areas along coastal Guyana and less inland. The mean center for the two weapons shifted further north during this period, with bladed weapons northwest of St. Cuthbert’s Mission and firearms east of the village of Santa Aratak. For the period 2006–2010 (Figure 4d), bladed weapons covered more area than firearms. Bladed weapons extended further into central and coastal Guyana than firearms (Figure 4d). For this period, the mean center for both weapons moved back south, with firearms almost on the lands of St. Cuthbert’s Mission’s northwestern boundary, while bladed weapons were further west of St. Cuthbert’s Mission (Figure 4d). Overall, our analysis showed that even though coastal Guyana accounted for the majority of crimes, the center of gravity of these crimes shifted over the years to stretch into indigenous peoples-influenced landscapes.

4. Discussion and Conclusions

This paper had two primary goals: (1) to examine the spatial distribution of violent crimes across Guyana and the relationship with indigenous lands; and (2) to examine the spatial distribution of murders committed using firearms and bladed weapons. Our analyses were based on the media reporting of crime, and we acknowledge that this dataset had challenges. Media houses and editors, for example, may be biased towards one type of crime over another, and therefore some types of crime may be given more coverage than others. We acknowledge too, that in our case the media reporting on crime was used as a proxy and we only obtained data from one media source. These points mean that our data do not give a comprehensive view of crime in Guyana. Yet, we believe our data provided a good sample from which we could draw some conclusions, for Guyana specifically and our understanding of the spatial distribution of crime more broadly. Through the process of examining the two goals we set out to address, several observations were made, and these are summarized below.
Firstly, the observation that the mean center of violent crime was located almost consistently on top of the Amerindian village of St. Cuthbert’s Mission raises concerns from a safety and law enforcement perspective. While the archives contained no data on violent crime occurring in St. Cuthbert’s, the distribution of violent crimes relative to the village requires additional investigation. Did our analysis, using centrographic tools, provide any insights into how the people of St. Cuthbert’s Mission view crime? In coastal Guyana, for example, people often take measures to prevent crime, including placing metal grills on doors and windows. Are similar measures being taken in St. Cuthbert’s Mission? Future work will seek to determine, from St. Cuthbert’s Mission and nearby villages, whether concerns exist for their safety and the measures that are being taken to prevent crime, relative to those seen in Georgetown and other coastal areas. When the first author visited St. Cuthbert’s Mission in spring 2019, there were no signals of violent crime in the village, but the non-violent crime of a businesswoman being sold counterfeit United States dollars was still being discussed among residents [44]. St. Cuthbert’s Mission has clear and direct links to Georgetown, meaning it is more accessible than many other villages across the country. The implications of this accessibility will be investigated as part of a future research agenda. Undoubtedly though, the results of our analysis set up the conditions for understanding how crime is perceived within indigenous villages and whether there were observations of increased crimes within their villages that have not been reported in the newspaper we examined. As efforts are ongoing to map crime [24], from environmental [22] to homicides [23] across Amazonia, our future work will continue this movement to understand how crime impacts indigenous peoples influenced landscapes.
Secondly, that fact firearms and bladed weapons had standard deviation ellipses that varied across the landscape (see Figure 4), moving away from the coast, has implications for crime against the environment [29,30]. Firearms getting closer to indigenous villages can impact traditional hunting practices and threaten wildlife protection. Currently, indigenous peoples across Guyana have varying levels of dependence on wild game for food, with many still hunting as a part of their traditional livelihood practices [45]. The movement of guns into indigenous peoples’ landscapes, carried by people who may have a different value for wildlife, can create competition over game species and wildlife protection. Based on the observation of crime concentration it appears as though the macro-level distribution of crime does now follow Weisburd’s [30] law. Our analysis did not have the benefit of small streets and towns to extensively examine crime distribution within micro-places, yet we note that the movement of crime away from the coast could be triggered by a number of processes, including as people move into the forested for gold mining and other resource extraction activities. Gold miners, for example, tend to move into the forest in search of gold of the police and other social services [46]. Cummings [46] noted that because gold miners move ahead of the security services, many become vulnerable to banditry. To protect themselves, many gold miners take dogs into the forests, which then predisposes conflict with top predators, primarily jaguars (Panthera onca) and pumas (Puma concolor). While the standard deviation ellipse shows that guns are moving into the forests, the impacts on environmental crime will be a subject that will be addressed as a part of future research. Whether Weisburd’s laws of crime concentration are relevant to this landscape or perhaps other criminological theories will be the subject of future exploration. Understanding how the changes observed in crime patterns in the Guyanese context relate to observations in criminology, such as people’s lifestyles, routine activities, and opportunities for committing crime [47,48,49], will be examined in the future. Such analyses will provide insight into where people may become vulnerable to criminal activity across space and time and develop predictive models to inform policing decision-making.
Thirdly, the newspaper archives allowed us to capture details on nearly 6000 crimes from only 37% of the days between 1986 and 2010. While capturing only 37% of days within the study period, the sample nevertheless provided us with a large volume of data from which we could gain insights into the spatial patterns of crime in Guyana. There was a contradiction in our observation of spatial patterns. While the use of mean centers and standard deviation ellipses showed that Weisburd’s laws may not be relevant to our dataset at the macro-place level, Hot Spot Analysis suggested a need for deeper analysis within micro-places. In fact, Hot Spot Analysis (Figure 2) not only showed that crime was concentrated along the Guyanese coast, there were also hotspots in the gold mining areas of northern Guyana. The observation of crime along the coast is consistent with the findings of the work of Cummings et al. [19], who used a much smaller sample (just over 600 violent crimes) to show that crime was concentrated around Georgetown. In this regard, the data derived from the media signal a need to look at both coastal (around Georgetown) and forested landscape micro-place crime patterns. These observations can potentially allow Guyanese law enforcement agencies to observe the areas that appear to host high levels of crime. Future work will seek to work with the law enforcement agencies to examine the crime patterns at both micro- and macro-places.
Finally, obtaining data from the archives was a time-consuming and laborious process, which could lead to data collection errors. Fortunately, only a small fraction of our sample could not be spatially referenced. Beyond the time required to collect the data from the archives, and the instances of not being able to determine the location where a crime was committed, other scholars seeking to collect data on crime for other developing country settings should be encouraged that our data were useful in allowing us to analyze the spatial nature of crime. Data from the media has long been identified as important for scientific research see [50,51,52,53,54,55] and our analysis re-affirmed this point. However, we must also note that beyond the Stabroek News, there are three additional newspapers with online archives that can be used to crosscheck details on crime in Guyana. Future work will seek to obtain data from the archives of additional newspapers to compare how they report on the same crime event and, in turn, assess the newspapers’ reliability in reporting on crime.
In the final analysis, our work shows that guns and crime patterns have shifted towards indigenous peoples’ influenced landscapes. The porous nature of Guyana’s borders makes knowing the direction from which guns are arriving into the country a difficult task, but what is certain is that the center of gravity of such crime is changing, bringing violence closer to indigenous villages and, as Souza et al. [23] observed, following the deforestation frontier. Furthermore, recent studies in North America [47] have shown that gun policy in the United States impacted the movement of guns to, and subsequently the levels of crime in, Mexico. In the case of Guyana, guns used for crime on the coast can be later used to commit crimes in rural areas, and examining this question will be a part of future research. Developing policy to respond to the movement of gun-related crime is critical to protect indigenous peoples’ livelihood practices, including the wildlife on which they depend for food. Our work will continue to study how factors at both the local and global levels shape the spatial distribution of crime in Guyana.

Author Contributions

The paper was conceptualized by Cummings and Markandey. All authors collected data, while Markandey and Cummings completed the methodology and wrote the initial manuscript.

Funding

This research received no external funding.

Acknowledgments

We are grateful to Stabroek News and the Guyana Chronicle for making their archives freely available online. Das and Cummings received a University of Texas at Dallas Undergraduate Research award that contributed to completing this work. We thank the four anonymous reviewers whose comments and feedback made this a much stronger paper.

Conflicts of Interest

The authors declare no conflict of interest.

References

  1. Gagne, D. InSight Crime’s 2015 Latin America Homicide Round-up. 2016. Available online: http://www.insightcrime.org/news-analysis/insight-crime-homicide-round-up-2015-latin-america-caribbean (accessed on 29 May 2019).
  2. Gurney, K. Why are the World’s Most Violent Cities in Latin America? 2014. Available online: http://www.insightcrime.org/news-analysis/why-world-most-violent-cities-latin-america (accessed on 29 May 2019).
  3. Natarajan, M. Crime in developing countries: The contribution of crime science. Crime Sci. 2016, 5. [Google Scholar] [CrossRef]
  4. Farrell, G.; Tseloni, A.; Mailley, J.; Tilley, N. The Crime Drop and the Security Hypothesis. J. Res. Crime Delinquency 2011, 48, 147–175. [Google Scholar] [CrossRef] [Green Version]
  5. Elonheimo, H. Evidence for the crime drop: Survey findings from two Finnish cities between 1992 and 2013. J. Scand. Stud. Criminol. Crime Prev. 2014, 15, 209–217. [Google Scholar] [CrossRef]
  6. Shenderovich, Y.; Eisner, M.; Mikton, C.; Gardner, F.; Liu, J.; Murray, J. Methods for conducting systematic reviews of risk factors in low- and middle-income countries. BMC Med. Res. Methodol. 2016, 16, 32. [Google Scholar] [CrossRef] [PubMed]
  7. Natarajan, M.; Clarke, R.; Carcach, C.; Ponce, C.; De Sanfeliú, M.B.; Polanco, D.E.; Chávez, M.; Shi, M. Situational prevention and public transport crime in El Salvador. Crime Sci. 2015, 4, 29. [Google Scholar] [CrossRef]
  8. Carcach, C. A spatio-temporal model of homicide in El Salvador. Crime Sci. 2015, 4, 58. [Google Scholar] [CrossRef]
  9. Natarajan, M. Rapid assessment of “eve teasing” (sexual harassment) of young women during the commute to college In India. Crime Sci. 2016, 5, 6. [Google Scholar] [CrossRef]
  10. Stubbert, C.H.; Pires, S.F.; Guerette, R.T. Crime science and crime epidemics in developing countries: A reflection on kidnapping for ransom in Colombia, South America. Crime Sci. 2016, 4, 23. [Google Scholar] [CrossRef]
  11. Oliveira, E.; Silva, B.F.A.; Prates, M.O. Street drug markets beyond favelas in Belo Horizonte, Brazil. Crime Sci. 2016, 4, 36. [Google Scholar] [CrossRef]
  12. Chainey, S.P.; Da Silva, B.F.A.; Silva, B.F.A. Examining the extent of repeat and near repeat victimisation of domestic burglaries in Belo Horizonte, Brazil. Crime Sci. 2016, 5, 411. [Google Scholar] [CrossRef]
  13. Marteache, N.; Viollaz, J.; Petrossian, G.A. Factors influencing the choice of a safe haven for offloading illegally caught fish: A comparative analysis of developed and developing economies. Crime Sci. 2015, 4, 199. [Google Scholar] [CrossRef]
  14. Shane, J.M.; Piza, E.L.; Mandala, M. Situational crime prevention and worldwide piracy: A cross-continent analysis. Crime Sci. 2015, 4, 317. [Google Scholar] [CrossRef]
  15. Appiahene-Gyamfi, J. Violent crime in Ghana: The case of robbery. J. Crim. Justice 1998, 26, 409–424. [Google Scholar] [CrossRef]
  16. Appiahene-Gyamfi, J. An analyses of the broad crime trends and patterns in Ghana. J. Crim. Justice 2002, 30, 229–243. [Google Scholar] [CrossRef]
  17. Appiahene-Gyamfi, J. Interpersonal violent crime in Ghana: The case of assault in Accra. J. Crim. Justice 2007, 35, 419–431. [Google Scholar] [CrossRef]
  18. Araújo, R. The Drug Trade, the Black Economy, and Society in Western Amazonia. Int. Soc. Sci. J. 2001, 53, 451–457. [Google Scholar] [CrossRef]
  19. Cummings, A.R.; Piquero, A.R.; Accetturo, P.W. Insights into the Nature and Spatial Distribution of Guyanese Crime. Deviant Behav. 2016, 39, 1–15. [Google Scholar] [CrossRef]
  20. Pujol-Luz, J.R.; Marques, H.; Ururahy-Rodrigues, A.; Rafael, J.A.; Santana, F.H.; Arantes, L.C.; Constantino, R. A forensic entomology case from the Amazon rain forest of Brazil. J. Forensic Sci. 2006, 51, 1151–1153. [Google Scholar] [CrossRef]
  21. Reuter, P.; O’Regan, D. Smuggling wildlife in the Americas: Scale, methods, and links to other organised crimes. Glob. Crime 2017, 18, 77–99. [Google Scholar] [CrossRef]
  22. Scabin, A.B.; Costa, F.R.C.; Schöngart, J. The spatial distribution of illegal logging in the Anavilhanas archipelago (Central Amazonia) and logging impacts on species. Environ. Conserv. 2011, 39, 111–121. [Google Scholar] [CrossRef]
  23. Souza, P.F.; Xavier, D.R.; Rican, S.; De Matos, V.P.; Barcellos, C. The Expansion of the Economic Frontier and the Diffusion of Violence in the Amazon. Int. J. Environ. Res. Public Heal. 2015, 12, 5862–5885. [Google Scholar] [CrossRef] [PubMed] [Green Version]
  24. Spiegel, S.J.; Ribeiro, C.A.A.S.; Sousa, R.; Veiga, M.M. Mapping Spaces of Environmental Dispute: GIS, Mining, and Surveillance in the Amazon. Ann. Assoc. Am. Geogr. 2012, 102, 320–349. [Google Scholar] [CrossRef]
  25. De Melo, S.N.; Andresen, M.A.; Matias, L.F. Repeat and near-repeat victimization in Campinas, Brazil: New explanations from the Global South. Secur. J. 2018, 31, 364–380. [Google Scholar] [CrossRef]
  26. Valente, R. Spatial and temporal patterns of violent crime in a Brazilian state capital: A quantitative analysis focusing on micro places and small units of time. Appl. Geogr. 2019, 103, 90–97. [Google Scholar] [CrossRef]
  27. Nepstad, D.; Schwartzman, S.; Bamberger, B.; Santilli, M.; Ray, D.; Schlesinger, P.; Lefebvre, P.; Alencar, A.; Prinz, E.; Fiske, G.; et al. Inhibition of Amazon deforestation and fire by parks and indigenous lands. Conserv. Boil. 2006, 20, 65–73. [Google Scholar] [CrossRef]
  28. Brisman, A.; South, N. Green Criminology and Environmental Crimes and Harms. Sociol. Compass 2019, 13, e12650. [Google Scholar] [CrossRef]
  29. Nurse, A. Green criminology: Shining a critical lens on environmental harm. Palgrave Commun. 2017, 3, 10. [Google Scholar] [CrossRef]
  30. Weisburd, D. The law of crime concentration and the criminology of place. Criminology 2015, 53, 133–157. [Google Scholar] [CrossRef]
  31. Colchester, M.; La Rose, J.; James, K. Mining and Amerindians in Guyana; The North-South Institute: Ottawa, ON, Canada; Amerindian Peoples Association: Georgetown, Guyana, 2002. [Google Scholar]
  32. Riccio, V.; Fraga, P.; Zogahib, A.; Aufiero, M. Crime and Insecurity in Amazonas: Citizens and Officers’ Views. Sortuz Oñati J. Emerg. Socio Leg. Stud. 2016, 8, 35–50. [Google Scholar]
  33. Stephenson, D. Dear People: Remembering Jonestown: Selections from the Peoples Temple Collection at the California Historical Society; Heyday Books: Berkeley, CA, USA, 2005. [Google Scholar]
  34. Buckley, C.; Rashbaum, W.K. 4 men accused of plot to blow up Kennedy Airport terminals and fuel lines. NY Times 2007, 3, A30. Available online: https://www.nytimes.com/2007/06/03/nyregion/03plot.html?mtrref=www.google.com&gwh=E0E1C53F7970A2B3F53E5E94501718C2&gwt=pay (accessed on 29 May 2019).
  35. Ramraj, R. The Omai disaster in Guyana. Geogr. Bull. Gamma Theta Upsilon 2001, 43, 83–90. [Google Scholar]
  36. Stabroek News. One Murder every Three Days so far this Year. 2010. Available online: https://www.stabroeknews.com/2010/news/stories/06/22/one-murder-every-three-days-so-far-this-year/ (accessed on 29 May 2019).
  37. Stabroek News. Geography, Low Population Density make Tackling Interior Crime Difficult-Crime Chief. 2010. Available online: https://www.stabroeknews.com/2010/news/stories/05/30/82673/ (accessed on 29 May 2019).
  38. Guyana Bureau of Statistics. Population & Housing Census; Bureau of Statistics: Georgetown, Guyana, 2012. Available online: http://www.statisticsguyana.gov.gy/census.html (accessed on 29 May 2019).
  39. Bulkan, J. The Struggle for Recognition of the Indigenous Voice: Amerindians in Guyanese Politics. Round Table 2013, 102, 367–380. [Google Scholar] [CrossRef]
  40. Pyrooz, D.C.; Decker, S.H.; Wolfe, S.E.; Shjarback, J.A. Was there a Ferguson Effect on crime rates in large U.S. cities? J. Crim. Justice 2016, 46, 1–8. [Google Scholar] [CrossRef]
  41. Hayward, K.; Young, J. Cultural Criminology. In The Oxford Handbook of Criminology, 5th ed.; Maguire, M., Morgan, R., Reiner, R., Eds.; Oxford University Press: Oxford, UK, 2012; pp. 113–149. [Google Scholar]
  42. Chainey, S.; Ratcliffe, J. GIS and Crime Mapping; John Wiley & Sons: Hoboken, NJ, USA, 2005. [Google Scholar]
  43. Eck, J.; Chainey, S.; Cameron, J.; Leitner, M.; Wilson, R. Mapping Crime: Understanding Hotspots; National Institute of Justice: Washington, DC, USA, 2005. Available online: http://discovery.ucl.ac.uk/11291/1/11291.pdf (accessed on 29 May 2019).
  44. iNewsGuyana.com, St Cuthbert’s Mission Businesswoman Says She Purchased US$1,400 in Counterfeit Money. 2018. Available online: https://www.inewsguyana.com/st-cuthberts-mission-businesswoman-says-she-purchased-us1400-in-counterfeit-money/ (accessed on 5 September 2019).
  45. Read, J.M.; Fragoso, J.M.V.; Silvius, K.M.; Luzar, J.; Overman, H.; Cummings, A.; Giery, S.T.; de Oliveira, L.F. Space, Place, and Hunting Patterns among Indigenous Peoples of the Guyanese Rupununi Region. J. Lat. Am. Geogr. 2016, 9, 213–243. [Google Scholar] [CrossRef]
  46. Cummings, A.R. Man versus cat: an analysis of fears, emotions and other drivers that lead to jaguar-human conflict in Guyana. Report to National Geographic Society- Big Cats Initiative.
  47. Sampson, R.J.; Raudenbush, S.W.; Earls, F. Neighborhoods and Violent Crime: A Multilevel Study of Collective Efficacy. Science 1997, 277, 918–924. [Google Scholar] [CrossRef]
  48. Cohen, L.E.; Felson, M. Social change and crime rate trends: A routine activity approach. Am. Sociol. Rev. 1979, 44, 588–608. [Google Scholar] [CrossRef]
  49. Schmidt, N.M.; Tchetgen Tchetgen, E.J.; Ehntholt, A.; Almeida, J.; Nguyen, Q.C.; Molnar, B.E.; Azrael, D.; Osypuk, T.L. Does neighborhood collective efficacy for families change over time? The Boston Neighborhood Survey. J. Commun. Psychol. 2014, 42, 61–79. [Google Scholar] [CrossRef]
  50. Ader, C.R. A Longitudinal Study of Agenda Setting for the Issue of Environmental Pollution. J. Mass Commun. Q. 1995, 72, 300–311. [Google Scholar] [CrossRef]
  51. Davis, J.J. The Effects of Message Framing on Response to Environmental Communications. J. Mass Commun. Q. 1995, 72, 285–299. [Google Scholar] [CrossRef]
  52. Gilbert, S.A. A Response to “Old-Growth Forests on Network News: News Sources and the Framing of an Environmental Controversy”. J. Mass Commun. Q. 1997, 74, 883–885. [Google Scholar] [CrossRef]
  53. Hester, J.B.; Gonzenbach, W.J. The environment: TV news, real-world cues, and public opinion over time. Mass Commun. Rev. 1995, 22, 5–20. [Google Scholar]
  54. Liebler, C.M.; Bendix, J. Old-Growth Forests on Network News: News Sources and the Framing of An Environmental Controversy. J. Mass Commun. Q. 1996, 73, 53–65. [Google Scholar] [CrossRef] [Green Version]
  55. Olsen, M.S.; Osmundsen, T.C. Media framing of aquaculture. Mar. Policy 2017, 76, 19–27. [Google Scholar] [CrossRef]
Figure 1. Study area with the distribution of Amerindian villages across the landscape depicted.
Ijgi 08 00481 g001
Figure 2. A hotspot analysis of violent crime in Guyana from 1986–2010.
Ijgi 08 00481 g002
Figure 3. The distribution of mean centers and standard deviational ellipse: (a) (top): 1986–1995; (b) (second from top): 1996–2000; (c) (third from top): 2001–2005; and (d) (bottom): 2006–2010.
Ijgi 08 00481 g003aIjgi 08 00481 g003b
Figure 4. The distribution of murders as inflicted by firearms and bladed weapons; (a) (top left): 1986–1995; (b) (top right): 1996–2000; (c) (bottom left): 2001–2005; and (d) (bottom right): 2006–2010.
Ijgi 08 00481 g004aIjgi 08 00481 g004b
Table 1. A description of the archives and the number of reports on violent crime they contained.
YearNumber of Reported DaysNumber of Reported CrimesViolent Crimes
1986422
19872353
19885766
19894522
19904453
19914951
1992148317143
1993114208106
19941989140
199521913182
1996229250149
1997251272172
1998273387210
1999223928
200016217686
20013215872
200284307200
2003101374204
2004537258
2005396255
200666543
2007305589386
20083651184797
2009365581487
2010365704580
Total340759923915
Table 2. The distance between the mean center of violent crimes and Amerindian villages’ mean center.
Types of Crime and Mean Distance to Amerindian Village Mean Centers (distances are in km)
TimeframeAll Violent CrimeMurdersSexual ViolenceDomestic ViolenceAssaultRobbery
1986–1995163.67148.06140.33186.04178.31169.3
1996–2000165.9164.79177.35199.88167.53164.31
2001–2005163.5170.91154.49180.73167.04152.72
2006–2010164.15163.34160.29162.38168.17164.95
Mean 164.15160.93158.12182.26170.26163.75

