Article

Analysis of Tourism Hotspot Behaviour Based on Geolocated Travel Blog Data: The Case of Qyer

1
School of Information Technology, Lucerne University of Applied Sciences and Arts, 6343 Rotkreuz, Switzerland
2
Institute of Tourism, Lucerne University of Applied Sciences and Arts, 6002 Lucerne, Switzerland
*
Author to whom correspondence should be addressed.
ISPRS Int. J. Geo-Inf. 2019, 8(11), 493; https://0-doi-org.brum.beds.ac.uk/10.3390/ijgi8110493
Submission received: 28 August 2019 / Revised: 16 October 2019 / Accepted: 24 October 2019 / Published: 1 November 2019
(This article belongs to the Special Issue Convergence of GIS and Social Media)

Abstract

:
We contribute a system design and a generalized formal methodology to segment tourists based on their geolocated blogging behaviour according to their interests in identified tourist hotspots. Thus, it is possible to identify and target groups that are possibly interested in alternative destinations to relieve overtourism. A pilot application in a case study of Chinese travel in Switzerland by analysing Qyer travel blog data demonstrates the potential of our method. Accordingly, we contribute four conclusions supported by empirical data. First, our method can enable discovery of plausible geographical distributions of tourist hotspots, which validates the plausibility of the data and its collection. Second, our method discovered statistically significant stochastic dependencies that meaningfully differentiate the observed user base, which demonstrates its value for segmentation. Furthermore, the case study contributes two practical insights for tourism management. Third, Chinese independent travellers, which are the main target group of Qyer, are mainly interested in the discovered travel hotspots, similar to tourists on packaged tours, but also show interest in alternative places. Fourth, the proposed user segmentation revealed two clusters based on users’ social media activity level. For tourism research, users within the second cluster are of interest, which are defined by two segmentation attributes: they blogged about more than just one location, and they have followers. These tourists are significantly more likely to be interested in alternative destinations out of the hotspot axis. Knowing this can help define a target group for marketing activities to promote alternative destinations.

1. Introduction

With the development of social media over the last two decades, unstructured data have become increasingly relevant for scientific research. Data on opinions and interests are publicly available in the form of user-generated content (UGC). These data can be collected and consolidated, information can be extracted for tourism research, and data analysis such as geographical distribution or user segmentation can be performed. Therefore, social media mining (SMM) can be valuable for answering behavioural questions related to tourism research directly from data. Tourism is a wide area of study, which brings with it the question on the use of appropriate methods. Traditional methodological approaches include a broad spectrum of usable research methods which include both quantitative and qualitative approaches. Ideally, due to its multidimensionality tourism as a field of research is tackled with various approaches complementing each other. As such, data science and engineering methods can be applied to extract relevant knowledge about the social media behaviour of tourists complementing traditional research methods. Interesting dimensions of social media analysis are time (trends), region (geodata), users and user groups (influencers), moods (sentiment analysis), and social structures (network analysis). Analysing these dimensions enhances the understanding of the social media context of tourists and tourism destinations. However, whereas SMM makes use of external and unstructured big data, social science usually focuses on the analysis of structured data collected internally, such as empirical surveys. Being a relatively new field, SMM for computational social science raises methodological questions that need to be answered to strengthen its acceptance. For instance, it is unclear how unstructured and semi-structured data can be consolidated to derive conceptual statements that support answering scientific questions. New methods and systems need to be developed and evaluated to generate knowledge from social media data.
One field of study to which SMM can be applied is tourism research. In fact, Bauder [1] proposes a research agenda for the use of big data in tourism geography. Accordingly, SMM can be used to retrieve information about visitors’ travel behaviour. The global tourism industry—particularly the demand for urban tourism—is booming. As a result, popular city destinations, city centres, and tourism facilities attract a growing number of tourists, giving rise to crowding phenomena [2] and generating negative effects on the affected destinations. Consequently, it is argued that tourist activity should be monitored and regulated accordingly to mitigate these effects. Researchers therefore emphasize the need for more detailed information about visitors’ travel patterns to estimate visitor flows and introduce adequate measures [3,4]. To cope with the crowding phenomenon known as one implication of overtourism, it could be helpful to promote alternative destinations. To that end, it is important to know what differentiates tourists who are interested in alternative destinations from tourists that are only interested in hotspots. Consequentially, an approach against overtourism is to detect hotspots and to identify tourist segments who are interested in other, less well-known places so that these segments can be targeted to distribute tourism streams more evenly. However, existing approaches to data collection such as surveys and polls are unable to capture travel behaviour comprehensively or accurately reflect travel patterns. Social media sites have proven useful to analyse and predict tourist behavioural patterns at specific destinations [5]. For example, Vu, Li, Law and Ye [6] analysed socially generated and user-contributed geotagged photos publicly available on the Internet to map and visualize the travel behaviour of inbound tourists to Hong Kong. Furthermore, Gàrcia-Palomares, Gutiérrez, and Mìnguez [7] have shown that main tourist attractions can be identified with the help of geotagged photographs. However, it is yet to be established how social media users can be segmented based on their geolocated blogging behaviour and how these segments correlate with interest in places outside of tourist hotspots.
Therefore, the aim of this study is to segment tourists based on their content-generating behaviour on geolocated travel blogs and identify those who are more interested in places other than tourist hotspots. The research goal is a contribution to geolocated social media data use methodology. This entails the detection of the main tourist attractions from geolocated social media data and implies a further development in methodology to find the features of geolocated social media users who form a possible target group interested in alternative travel destinations. With this knowledge, marketing activities can be supported to mitigate the effects of overtourism. Epistemologically, to answer these research questions, we performed design-oriented information systems research according to Oesterle et al. (2010). We contribute a system design to achieve the research goals in the case of the travel blog Qyer.com, theorize further from the specific case and provide a generalized formal methodology for hotspot detection and tourist segmentation regarding travel hotspot behaviour from geolocated travel blog data. We evaluate our system and method through a pilot application in the case of Chinese travellers on Qyer. China as a source market was chosen based on its importance for the Swiss tourism industry. The number of overnights generated by Mainland Chinese travellers in Switzerland increased by 500% within the last decade. With this case study, we can answer a scientific question from tourism research: who is interested in exploring alternative destinations outside of tourist hotspots? Thus, this research contributes insights on both the proposed method and the observed phenomena, resulting in empirical data and a demonstration that significant segmentations of travel blog users can be established with our method based on attributes found only on geolocated social media.
Accordingly, we describe a case study collecting empirical data from the Chinese social media platform Qyer.com. We detected tourist hotspots for Chinese travellers in Switzerland, segmented tourists based on their social media behaviour, and analysed the dependency between the identified segments and interest in less well-known places. We were able to identify a segment of tourists that are significantly more interested in alternative destinations. Based on our findings, we conceptualized a formal methodology for tourist segmentation based on geolocated social media that is generalizable to other destinations and travel blogs. With this method, it is possible to (1) detect destinations at risk for overtourism, (2) identify possible tourist segmentations based on social media behaviour, (3) correlate possible segmentation features with interest in alternative destinations and (4) use this knowledge to target the segments directly on social media to promote visits to alternative destinations and relieve tourist hotspots.
This article is organized into six sections. Following the introduction, in Section 2, we describe the potential of data science and big data for computational social science and provide an overview of existing approaches to answer scientific questions directly from social media data and geolocated data in the field of tourism research. In Section 3, we describe in detail the sourcing, collection, consolidation, and analysis of the data from the Qyer travel blog, and then we describe the formal general methodology for hotspot detection and tourist segmentation from geolocated travel blogs. In Section 4, we present the empirical results of this study according to the proposed method. In Section 5, we interpret the meaning of the resulting data. In Section 6, we summarize the main conclusions that are supported by our data. Furthermore, we discuss limitations of this study and provide an outlook on possible further research.

2. Literature Review

2.1. Data Science and Big Data for Social Science Research

Historically, statistical data has been in short supply, and generating knowledge from data has necessitated manually sampling and codifying the data. Now, with the ubiquity of information systems, data are generated abundantly, even excessively; the term big data has been applied to this phenomenon. Provost and Fawcett [8] define big data simply as data sets that are too large for traditional data processing. With increasing volume, the enormous number of observations in big data sets makes conclusions from data astonishingly reliable although, epistemologically, there are many open questions about the validity of data-driven insights [9]. However, according to the 5V model of big data by Demchenko, Grosso, Laat and Membrey [10], volume is not the only criterion; velocity, variety, veracity and value are also big data challenges. Kitchin and McArdle [11] analysed the ontological notion of big data and concluded that there are multiple forms of big data that do not share the same characteristics. In this sense, data sets with unusual formats and unstructured content, such as social media data, represent big data challenges if they require non-traditional data engineering methods.
Data science is defined as “the extraction of actionable knowledge directly from data through a process of discovery, or hypothesis formulation and hypothesis testing” [12]. According to Chang [12] the quality of data science results is measured by their predictive power and by their ability to generalize data analysis results to yet-unobserved events. According to Provost and Fawcett [8], data science methods can be applied to refine data sets that have been engineered from big data. With the results of these methods, knowledge and insight can be applied for data-driven decision making. In data-driven scientific research, Frické [13] found that big data permits larger sample sizes and cheaper, more extensive testing of theories; however, it can also lead to passive data collection instead of experimentation and testing and to unsound statistical fiddling. Therefore, in data science, as in any other scientific data analysis, care must be taken to interpret engineered data sets without speculation, as objectively as possible and to only draw conclusions that are directly supported by the data.
Regardless, using big data and data science methods, large quantities of data are available online for knowledge generation. Big data methods are becoming more applicable for social science studies [14], although new epistemological approaches are needed to validate data science methods that allow for big data analytics to generate scientific knowledge [15,16]. In the emerging method of computational social science [17], data science methods are more oriented towards explanation than prediction, and big data is frequently textual instead of relational. In contrast to data collection with surveys, which intervene with the social processes that are the object of study, social big data occur without intervention by researchers and can be observed directly. Of particular interest for social science is SMM, because human subjects publicly share data about themselves and their behaviour that can be collected and analysed. According to Ghani, Hamid, Targio-Hashem and Ahmed [18], data sources for social media analysis include microblogs, news articles, blog posts, Internet fora, reviews and Q&A posts. Based on this data, descriptive, diagnostic, predictive and prescriptive analyses can be performed. Possible analysis techniques include predictive modelling, sentiment analysis, social network analysis and text mining. If user content is geotagged, we can add geographical data analysis as another technique. In general, social media data are user-centred and user-generated and thus readily available for analysis and knowledge generation about social phenomena.

2.2. Social Media Mining for Tourism Research

In general, travel products are associated with higher risks not only because of their intangibility but also because they typically involve higher costs and complex choices [19]. To mitigate these risks, travellers tend to gather a great deal of information before deciding on a purchase. Because tourism services are experience-based products and cannot be evaluated prior to their consumption, consumers tend to rely more on the recommendations and reviews of others. Social media has fundamentally changed the way tourists find, trust and collaboratively produce information about tourism suppliers and destinations. Social media applications, such as blogs, electronic social networks and aggregators of UGC, are especially influential in supporting the creation and exchange of user-generated travel information, opinions and recommendations [20,21,22,23]. One outcome of this use of UGC is its potential impact on traveller empowerment and, consequently, on travel planning behaviour [24,25]. Consequently, SMM has become an increasingly relevant topic to researchers. The analysis of social media data to study travel-related behaviour is a novel yet well documented field; the first investigation into this topic was published by Pan, MacLaurin and Crotts [26], who aimed to discover destination experiences of tourists through travel blogs. More recently, gaining insights related to tourism through SMM has been the focus of several studies. These studies largely rely on two different types data sources: textual content, such as reviews and opinions [27,28,29], and visual content such as images and video [30]. It has to be kept in mind that the nature of social media platforms may impact the comments contributed, as platforms may differ in terms of the expected amount of interaction with other users and length of comments permitted [31]. However, Tilly, Fischbach and Schoder [32] discuss and support the reliability of UGC as displayed on social media platforms.
Chinese tourists’ social media is not only popular for providing information, but also for exchanging experiences [33]. As a result, the analysis of Chinese social media and blogs has become interesting to researchers, mainly because online reporting may act as key signposts shaping tourist behaviour from China as the market diversifies [34]. Almost all studies carried out recently have been restricted to text in English. There are a few exceptions of researchers who examined Chinese sources; for instance, Cheng and Edwards [35] examined tourism-related posts on the Chinese microblog service, Sina Weibo, using a visual analytic approach. Tse and Zhang [29] analysed blog and microblog contents created by mainland Chinese visitors sharing their Hong Kong experiences. Their results include profiles of the bloggers by their usage patterns and provides insights into the image of Hong Kong as a destination. Chen, Plaza and Urbistondo [36] processed unstructured Chinese content to derive general sentiment and relevant topics regarding destinations through user comments on social media. With regards to Switzerland, a study by Liu, Shan, Glassey, Balet and Fang [37] examined the behaviours of Chinese tourists using a semantic analysis approach, explored the demographics of the travellers and identified similarities and differences between first-time and repeat visitors.

2.3. Geolocated Data Mining for Tourist Behaviour Analysis

Of interest to researchers and practitioners of tourism management are geotagged data sources. Their main areas of interest can be recognized: tourist hotspot detection, tourist movement patterns and tourist segmentation. First, many studies use geolocated data to detect tourism density and activity areas. Garcia-Palomares et al. [7] used photo-sharing services to identify and analyse the main tourist attractions in eight major European cities. Salas-Olmedo, Moya-Gómez, García-Palomares and Gutiérrez [38] analysed the big data generated by tourists in cities. They point out that traditionally, tourist behaviour is measured by surveys, but that big data offers new opportunities. The study uses data from Panoramio, Foursquare and Twitter to detect tourist hotspots and categorize areas of Madrid according to activities. Hale [39] and Kim et al. [40] used geolocated photo data from Flickr to generate tourism heat maps and detect tourism hotspots.
Second, sites that use geolocated data such as Flickr and Twitter are analysed to extract tourist behavioural patterns [41]. For instance, Girardin, Calabrese, Fiore and Ratti [42] traced tourist movements in Rome based on Flickr uploads. Miah et al. [5] also used geotagged photos to analyse and predict tourist behavioural patterns in Melbourne, Australia. Meanwhile, Shi, Serdyukov, Hanjalic and Larson [43] used geotagged photos sourced from Flickr to recommend landmarks to individual users who reflected their specific tastes. Chareyron, Rugna and Cousin [44] analysed Internet image databases and to reconstruct tourist paths based on GPS coordinates and timestamps. Hu, Li, Yang and Jiang [45] analysed geotagged Tweets with a graph-based approach to detect tourist movement patterns in New York City.
Third, some studies on tourist segmentation from data exist. For example, Chen, Zhu, Xie, Huang and Huang [46] analysed passenger name records of flight data with the goal of generating marketing segments for airlines. Kim, Lehto and Morrison [47] analysed survey data to establish gender differences in online travel searches. Park and Pan [48] analysed proprietary company data to categorize types of flying to predict where an airline would next schedule a one-stop flight. The study by Chareyron et al. [44] is mainly a work on tourist movement patterns. Most studies on tourist segmentation or do not use geolocated data for segmentation. Exceptions are studies by Karagiorgou, Pfoser and Skoutas [49] who propose a novel method to generate a geosemantic network from geotagged Twitter data for user segmentation, and Kladou and Mavragani [50], who applied a small-data approach to 203 TripAdvisor reviews to asses destination images from UGC. However, to our knowledge, the methodology we propose to segment tourists based on geolocated social media activity regarding tourist hotspot interest is novel.

3. Method

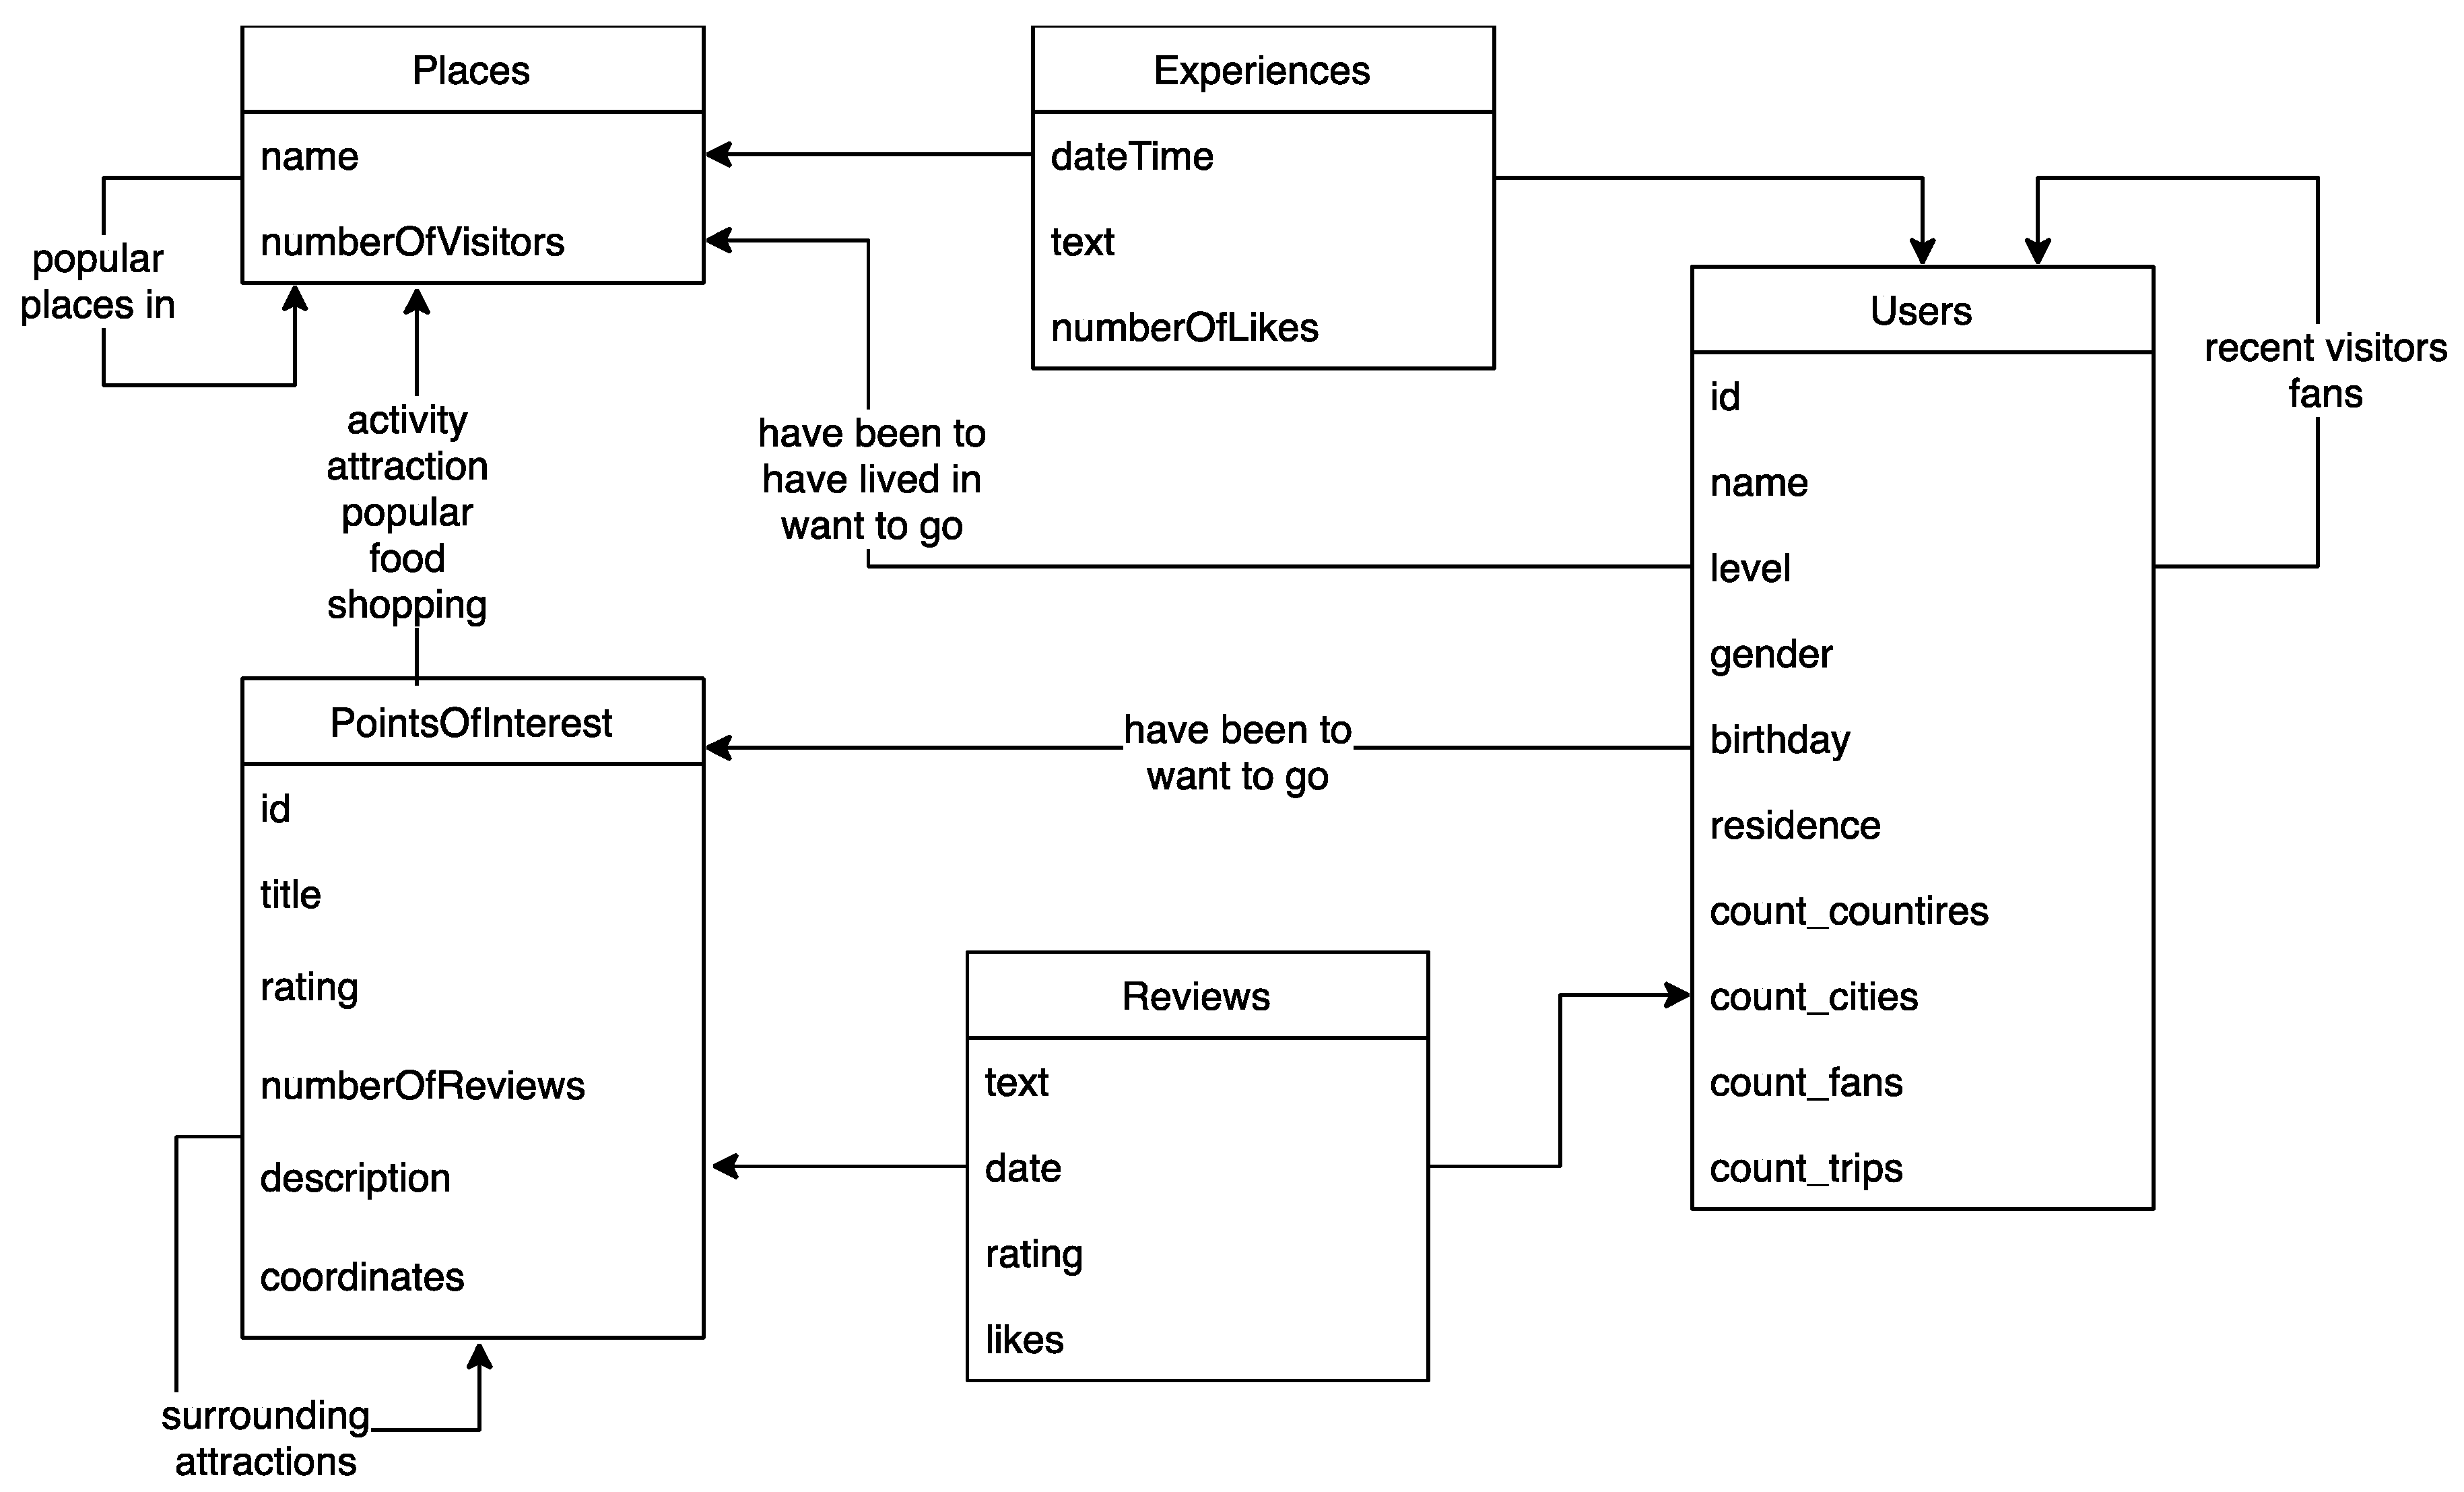
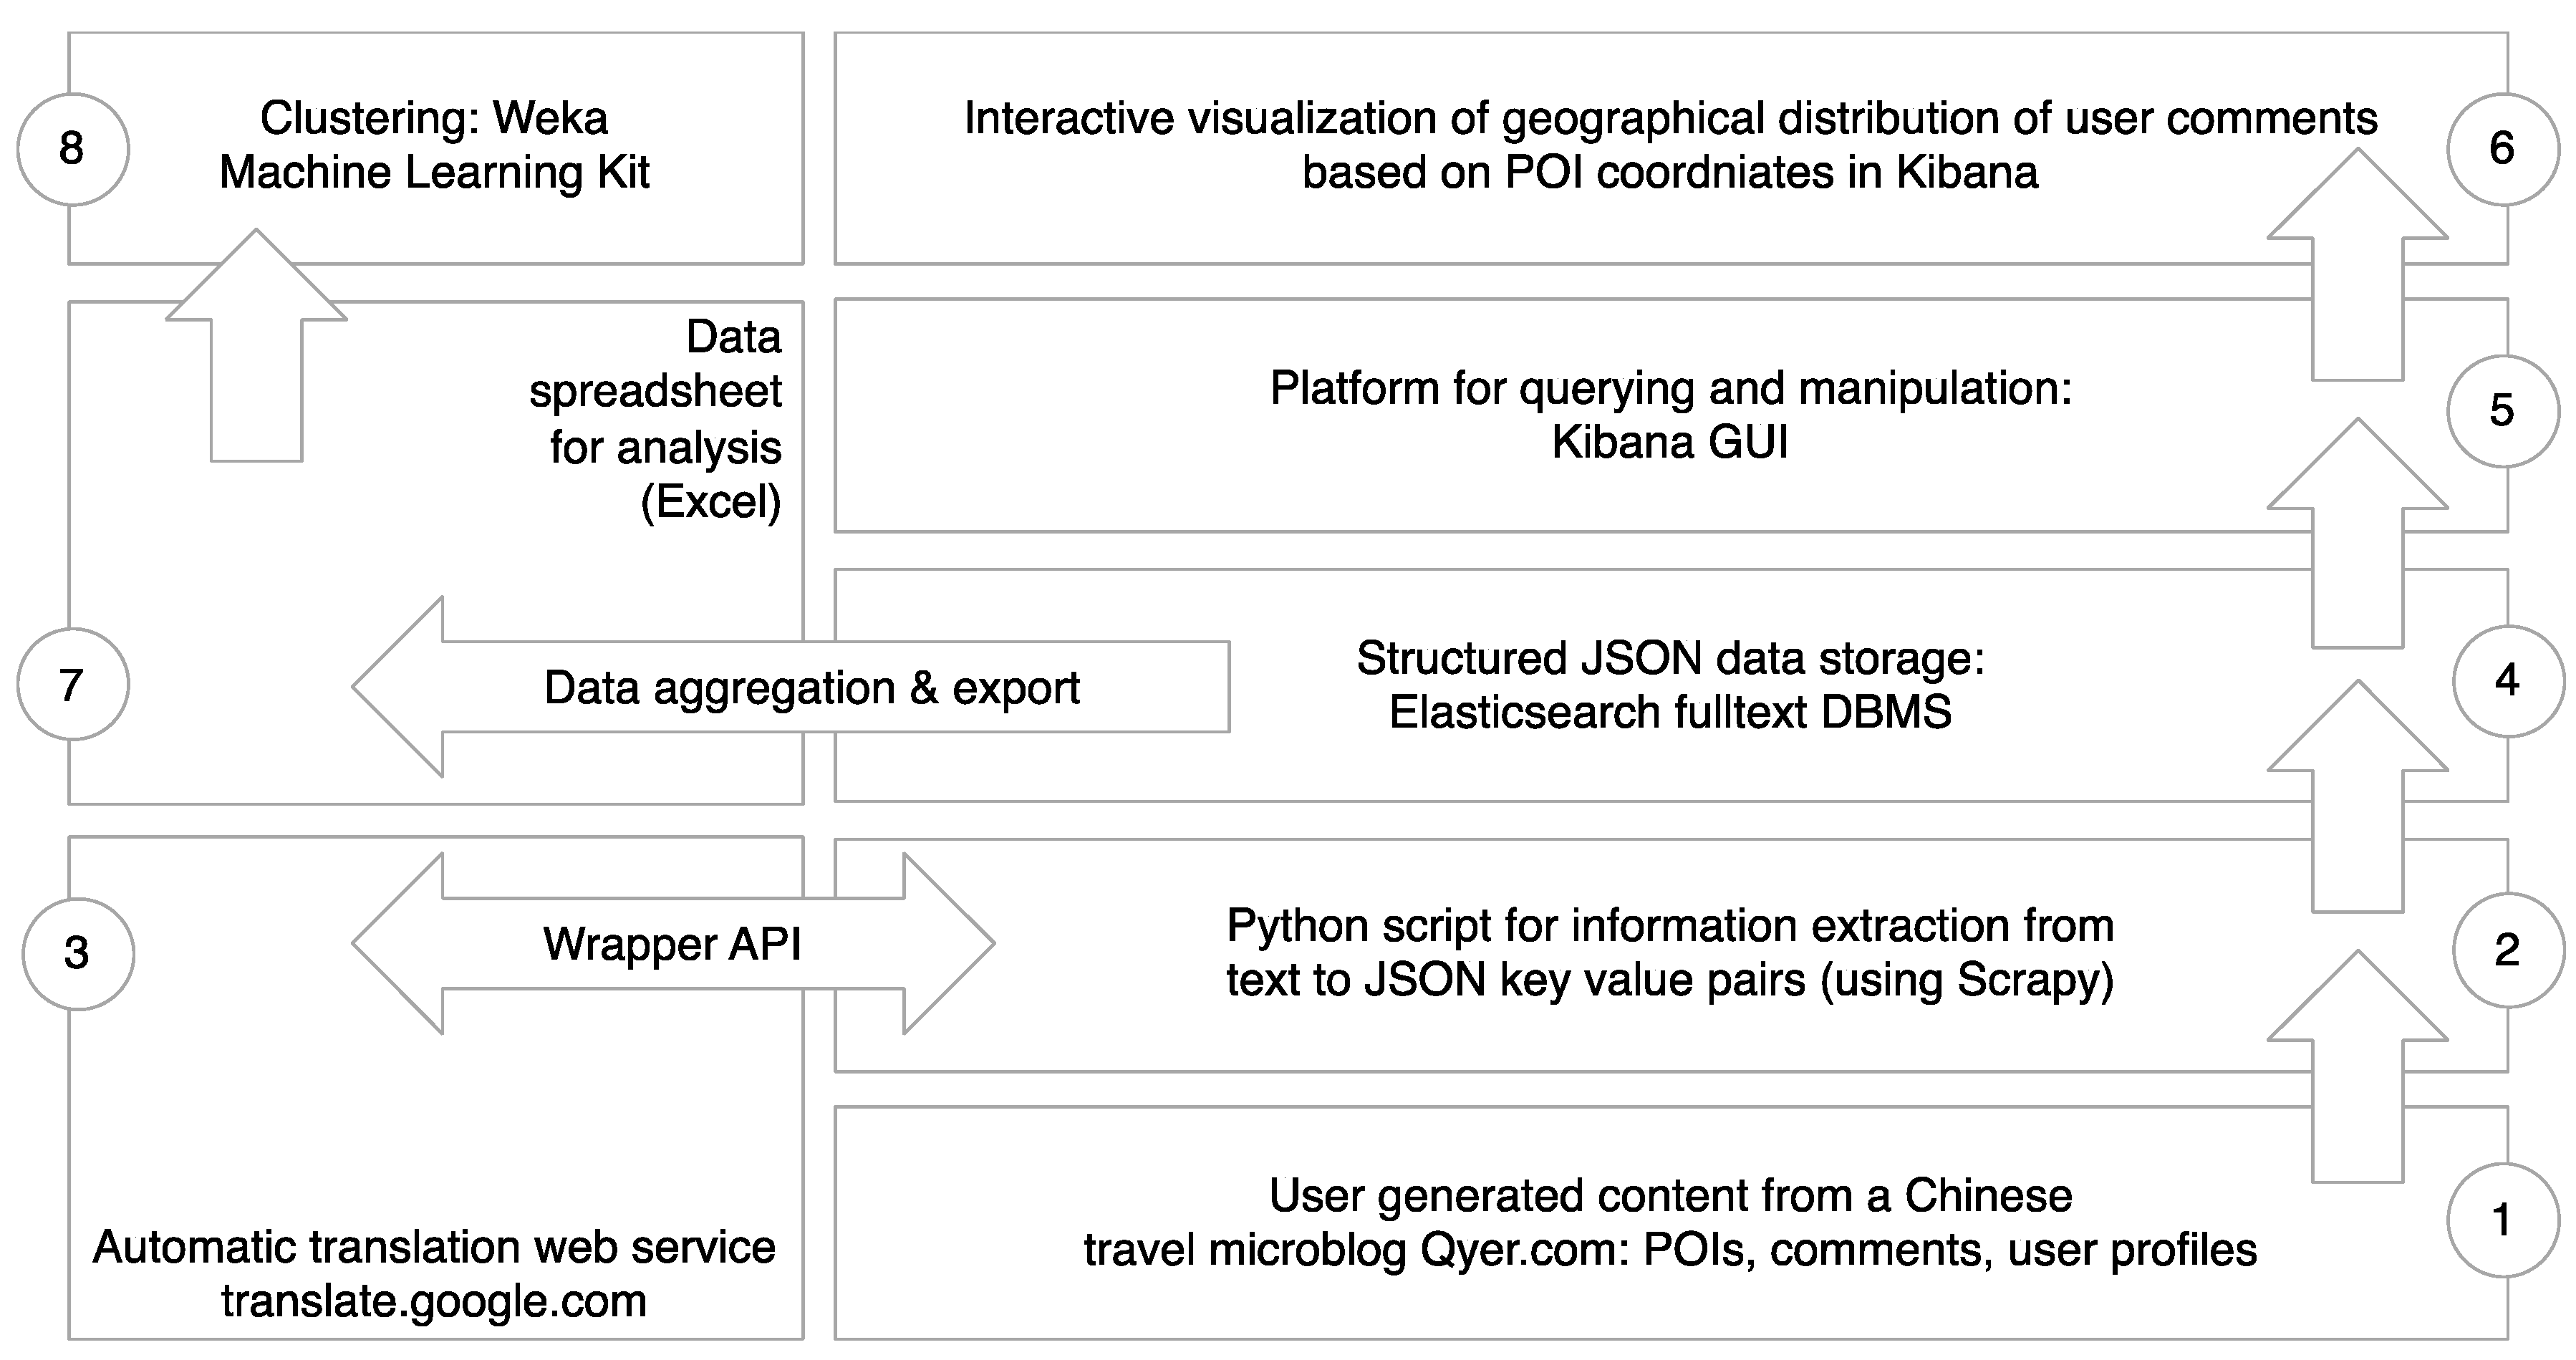
3.1. System Design for Data Collection: The Case of Qyer.com

Data collection from geolocated social media depends on new forms of data system engineering. Therefore, we present a system design as a solution to achieve our research goals. This study aims at detecting tourism hotspots in travel blogs and segmenting tourists based on this data. As a case study, we focused on Chinese travellers in Switzerland. As a data source, there are several social media platforms taken into account. However, Western technology companies that have tried to penetrate the Chinese market have achieved mixed results at best. Thus, the Chinese technology industry is dominated by local companies such as Tencent, Alibaba and Baidu, which could be considered the Chinese versions of Facebook, Amazon and Google, respectively [51]. Therefore, Chinese social media platforms and travel blogs were the primary targets of this study. Important selection criteria included accessing a manageable, reliable and representative sample. At the primary stage, two Chinese social media platforms, Qyer and Sina Weibo, were selected after reviewing a number of possibilities. According to Ge and Gretzel [52], these two platforms are the most popular among independent Chinese travellers. On the one hand, Sina Weibo offers microblog services similar to Twitter, where users can release news or upload pictures via web pages, mobile clients and text messages. The tourism part of Sina Weibo is an important social media platform for promoting tourism. On the other hand, Qyer represents a tourist community mostly oriented towards independent travellers. Qyer provides users with value-added products related to outbound travel, including such core products as itinerary assistants, forums and tips for travel on a shoestring budget via community-based platforms and UGC [53]. Qyer was chosen as the platform in our study for the following four reasons. First, Qyer specializes in providing a forum for discussing outbound independent travel [33,51]. Second, social networking sites for travel, such as Qyer, are used by Chinese tourism consumers throughout the whole travel process, which includes collecting information before travelling, broadcasting the journey in real time, sharing travel experiences and providing travel notes and tips after travelling [53]. Qyer offers interactive, consumer-driven content, which is fundamental for our analysis. Third, the geographically tagged, user-generated points of interest (POIs) with associated comments facilitate an in-depth view of the traveller’s experience [54,55]. Finally, given Qyer’s focus on outbound travel, less irrelevant information would be collected as opposed to an approach using a more general social media platform.
Qyer does not provide any official way to gather its publicly available data. Therefore, web scraping was the method used for information extraction, which is an automated process that programmatically browses publicly available web pages and downloads the requested information in a structured way. The data engineering process started with an analysis of the Qyer website to create a data model that serves as a basis for the data collection software. The underlying structure of the data stored by Qyer is not visible to the user. For transformation and analysis, a relational data structure based on the available entities had to be reverse engineered. Figure 1 shows the structured data model conceptualized by analysing the website qualitatively. Based on the data model, a web crawler was programmed in Python that starts at a predefined location on the target website and crawls all directly linked information such as places, POIs, user comments (reviews) and user data recursively. The Scrapy library was used for the scraping; this library allows the utilization of hypertext markup language (HTML) tag patterns that are used on the target website to structure its content. By using the available HTML tag patterns, the web crawler can target specific parts of information required for later analysis, thus making use of the semi-structured nature of web and social media data. Additionally, this application sends the raw Chinese text to a translation engine (e.g., Google translate) using a wrapper application programming interface (API). On Qyer, every POI has its own page with reviews (comments) and ratings from users. To gather this data, our script started with the Qyer page for Switzerland and then recursively crawled all linked places and POIs, corresponding user reviews and connected user profiles, including user attributes from the Qyer website.
The method for data collection, storage, visualization and analysis can be explained by the following system design components, whose numbers correspond to those illustrated in Figure 2. (1) As discussed before, data about locations (places and POIs), user profiles and users’ reviews of locations were crawled from the Qyer microblog. (2) For this, a Python application was developed to interpret the semi-structured information in the HTML code of the website using the API Scrapy to transform the text of the web pages into structured key value pairs in Java Object Notation (JSON) format. Every data record represents information about a particular review, including POI, place, user ID, user attributes, the contents of the user reviews and the geographical coordinates of the POIs (geographical coordinates with latitudinal and longitudinal degrees) available publicly in the HTML source. (3) The Chinese content in the JSON structure was sent to an automatic translation web service to be automatically translated from Chinese to English. (4) The structured and translated data were stored in a full text search database system (Elasticsearch) so that they could be efficiently queried, manipulated, reorganized and visualized. (5) A web-based user frontend (Kibana) that allowed visual and interactive querying, manipulation and visualization was used for online analytical processing. (6) On the Kibana platform, the geographical annotations of the user comments (via their relationships to geotagged POIs) were applied to visualize the distribution of reviews on an interactive heat map with zoom functionality. (7) To further analyse the data, a structured data table including all data was exported from the database to a spreadsheet file. In the process, the data were aggregated from single reviews to the granularity of users and from single POIs to places where, in addition to sociodemographic and social media information, an indicator was constructed for each place, which was 1 if the user had commented on that place or 0 if they had not. This matrix provided a geographic interest profile for all users. (8) This user profile matrix was loaded into a machine learning toolkit (Weka), and an EM clustering was performed to generate meaningful segmentation of the observed Chinese tourists. The machine-generated clusters were then analysed and evaluated exploratively and visually to discover meaningful segmentation variables. A formal analysis of the proposed method is described in the following section.

3.2. Theorizing and Generalization: Formal Methodology

Based on the specific case designed to achieve the research goal for the Qyer travel blog, a formal methodology for hotspot detection and tourist segmentation based on geolocated social media data can be theorized that is generalizable to other data sources and other markets. From a data engineering perspective, those formula are a theoretical contribution, modelling the methodology and representing generalizable knowledge produced by our research. Other researchers and practitioners can apply these formulae and reproduce our methods on travel blog data other than those from Qyer.com.
Conceptually, a travel blog B can be formalized as a tuple B = ( C , L , U , λ , γ ,   υ C , υ L , φ , X U ) . The components of this tuple are sets and mappings defined as follows:
  • C = { c 1 ,   c 2 , , c | C | } is a set of comments (posts, reviews) by users about locations interesting for tourism;
  • L = { l 1 ,   l 2 , , l | L | } is a set of locations (sights, places) the users comment on and thus show their interest in. These locations possibly have a nested granular structure, such as places that contain POIs These locations are the object of travel hotspot detection;
  • U = { u 1 ,   u 2 , , u | U | } is a set of users who post these comments; these users are the object of tourist segmentation;
  • λ : C L is a mapping indicating the location that a comment is about;
  • γ : L P ( C ) is the inverse function λ 1 mapping a location to a set of comments that are about that location;
  • υ C : C U is a mapping indicating the user who is the author of a comment;
  • υ L : L P ( U ) is a mapping indicating the set of users who commented on a location;
  • φ : U P ( U ) is a mapping indicating, for each user, the set of users who follow them on the social network (i.e., subscribe to their content);
  • X U = { X 1 , X 2 , ,   X | X U | } is a set of analytic variables X i : U d o m ( X i ) that represent data about the users. These features are candidates for classification predicates to segment the user base of the travel blog.
Within this framework, we propose to detect tourist hotspots by sampling a probability distribution, as defined in Formula (1). For this, the number of comments per location is computed, as defined in Formula (2). Whereas the probability only reflects the relative frequency of one event, the complementary cumulative distribution function (CCDF) indicates the proportion of the data generated by the most frequent places. If tourism hotspots exist, a long-tail distribution of comments over places will be recognizable in the data, and a few hotspot locations will cover half of the cumulative distribution, whereas the large majority of locations will be found in the tail. As an example threshold, if less than 5% of locations cover more than 50% of blog posts, we can assume that these locations are tourist hotspots. This threshold can be defined by tourism experts. In our case, we defined it empirically by visualizing the distribution, as seen in Figure 3. Accordingly, the CCDF can be computed according to Formula (3).
p ( λ ( · ) = l i ) = # γ ( l i ) / | C | ,       i = 1 ,   ,   | L |
# γ ( l i ) = | { c C   |   λ ( C ) = l i } |
C C D F ( l i ) p ( # γ ( ) # γ ( l i ) ) = | { c C   |   λ ( c ) = l k   # γ ( l k ) # γ ( l i ) ) } | / | C |
For tourist segmentation, we propose to compute a user-centric clustering approach based on a user profile matrix M with dimensions | U | × | X U | . On this data matrix, a clustering algorithm can partition the user records into k disjoint subsets. We propose to use the estimation maximization (EM) clustering algorithm [56], as it is probabilistic and returns good estimates of feature means and standard deviations for the resulting clusters. The EM algorithm generates a partition of the input space, S = { S 1 ,   S 2 ,   ,   S k } , by iteratively estimating probabilities of cluster memberships based on mixed probability distribution models, as well as maximizing the likelihood of the data, given the clusters. As output, the WEKA implementation of the EM algorithm describes the clusters by computing the means for every feature in X U and the standard deviations for all generated clusters. Based on this information, it is possible to deduce the prototypical attributes of user segments. Thus, with this proposed framework, a basic segmentation of the user base of a travel blog B can be derived, and the typical user features X i : U d o m ( X i ) for the discovered segments can be revealed.
The EM algorithm provides the basis to identify and manually select features for further analysis. However, we propose to further analyse selected important features X i X U X U manually and visually with the following procedure. First, to visually explore a feature of interest, a sampled distribution can be calculated, as defined by Formula (4). We assume categorical features.
p ( X i = x )
This distribution can be plotted to visualize and recognize which feature domain subsets x i j d o m ( X i ) segment the user base prototypically in particular dimensions.
Second, to examine the association of a feature of interest with travel behaviour and interest in alternative destinations, based on the recognized segmentation characteristics in the form of selected feature domain subsets, the coefficient of determination ( R 2 ) can be computed between the popularity of a location, measured by the number of commenting users per location # υ L ( · ) defined by Formula (5) and the percentage of users commenting on a location having a certain characteristic, p ( x i j   |   l ) defined in Formula (6), where x i j is a particularly meaningful subset of characteristics of the domain of feature X i to be analysed. This procedure can be repeated for every feature of interest.
# υ L ( l ) = | { u U   |   c C :   υ C ( c ) = u λ ( c ) = l } |
p ( x i j   |   l ) = | { u U   | c C :   υ C ( c ) = u λ ( c ) = l X i ( u ) x i j } | / # υ L ( l )
The resulting coefficient of determination can be computed as the square of the Pearson correlation coefficient between the two values, formalized by Formula (7). However, for meaningful results, we propose to consider only data points for locations with a sufficient number of users (e.g., 50 or larger), denoted by the set L .
R 2 ( x i j ) = c o r r ( # υ L ( · ) , p ( x i j   | · ) ) 2 = ( l L ( # υ L ( l ) l k L # υ L ( l k ) | L | ) ( p ( x i j   |   l ) l k L p ( x i j   | l k ) | L | ) l L ( # υ L ( l ) l k L # υ L ( l k ) | L | ) 2 l L ( p ( x i j   |   l ) l k L p ( x i j   |   l k ) | L | ) 2 )
This R 2 statistic indicates the degree of linear dependencies between quantitative location interest, # υ L ( · ) and the distribution of user characteristics per location, p ( x i j   | · ) . The significance of this correlation can be estimated using Student’s t-distribution based on the t-value defined in Formula (8).
t = R | L | 2 1 R 2
Third, to find characteristics associated with interest in alternative destinations, once a set of interesting segmentation characteristics are found in the previous steps, the association of the segments with tourism hotspot behaviour can be analysed. We propose to evaluate the stochastic dependency between a user segmentation X based on a combination of meaningful user segmentation feature domain subsets and the indication of interest in places outside the hotspot axis Y . For this, a χ 2 independence test can be calculated based on two binary variables X and Y . The independent variable X : U { 0 , 1 } can be derived by a Boolean conjunction of meaningful partitions of user characteristics X i ( u ) by subsets x i j derived in steps one and two, as defined in Formula (9).
X ( u ) X i X U X i ( u ) x i j
The dependent variable Y : U { 0 , 1 } indicates whether a user has commented on an alternative destination. This variable can be derived by partitioning the locations into two sets according to their number of comments and by indicating whether each user has commented on the subset of locations with a complementary cumulative relative frequency of comments lower than a given threshold θ (e.g., ½), as defined by Formula (10).
Y ( u ) {   1 i f   l : u υ L ( l ) C C D F ( l ) > θ 0 e l s e .
To test the strength of association between the two variables, a cross tabulation of X and Y is performed, leading to four empirical numbers of users # X 1 Y 1 , # X 1 Y 0 , # X 0 Y 1 and # X 0 Y 0 , each equal to the cardinality of the subset of users satisfying the corresponding Boolean truth values of the predicates X and Y ; as shown in Formula (11). For example, # X 1 Y 1 is the number of users that show characteristic X and also satisfy the target Y.
# X a Y b =   u U ( ( 1 a ) + ( 2 a 1 ) X ( u ) ) ( ( 1 b ) + ( 2 b 1 ) Y ( u ) ) , a { 0 , 1 } ,   b { 0 , 1 }
The expected numbers, given independence, can be calculated according to Formula (12).
E ( X a Y b ) = ( i ϵ { 0 , 1 } # X a Y i j ϵ { 0 , 1 } # X j Y b ) / | U | a { 0 , 1 } ,   b { 0 , 1 }
The corresponding χ 2 statistic can be calculated according to Formula (13).
χ 2 = i ϵ { 0 , 1 } j ϵ { 0 , 1 } ( # X i Y j E ( X i Y j ) ) 2 E ( X i Y j )
The null hypothesis for the χ 2 test is that the two variables X and Y are independent. If the corresponding χ 2 statistic is significantly large, there is a high probability that the interest in places outside the hotspot axis Y is actually dependent on the previously defined user segmentation X . We discuss the results of a pilot application of this methodology in the following section.

4. Results

In the following subsections, we describe the results from the pilot application of our system for data collection and analysis, as well as our method for explorative analysis for segmentation. As a use case, we analysed data from the Chinese geolocated travel blog Qyer linked to POIs in Switzerland. First, we analysed the geographical distribution of Qyer UGC to gain insights on travel hotspots for Chinese tourists in Switzerland. Second, we segmented the users according to their social media activity to gain insights on what differentiates users with interests in less frequently commented on places, with the aim of using these insights to define a target group for managing overtourism.

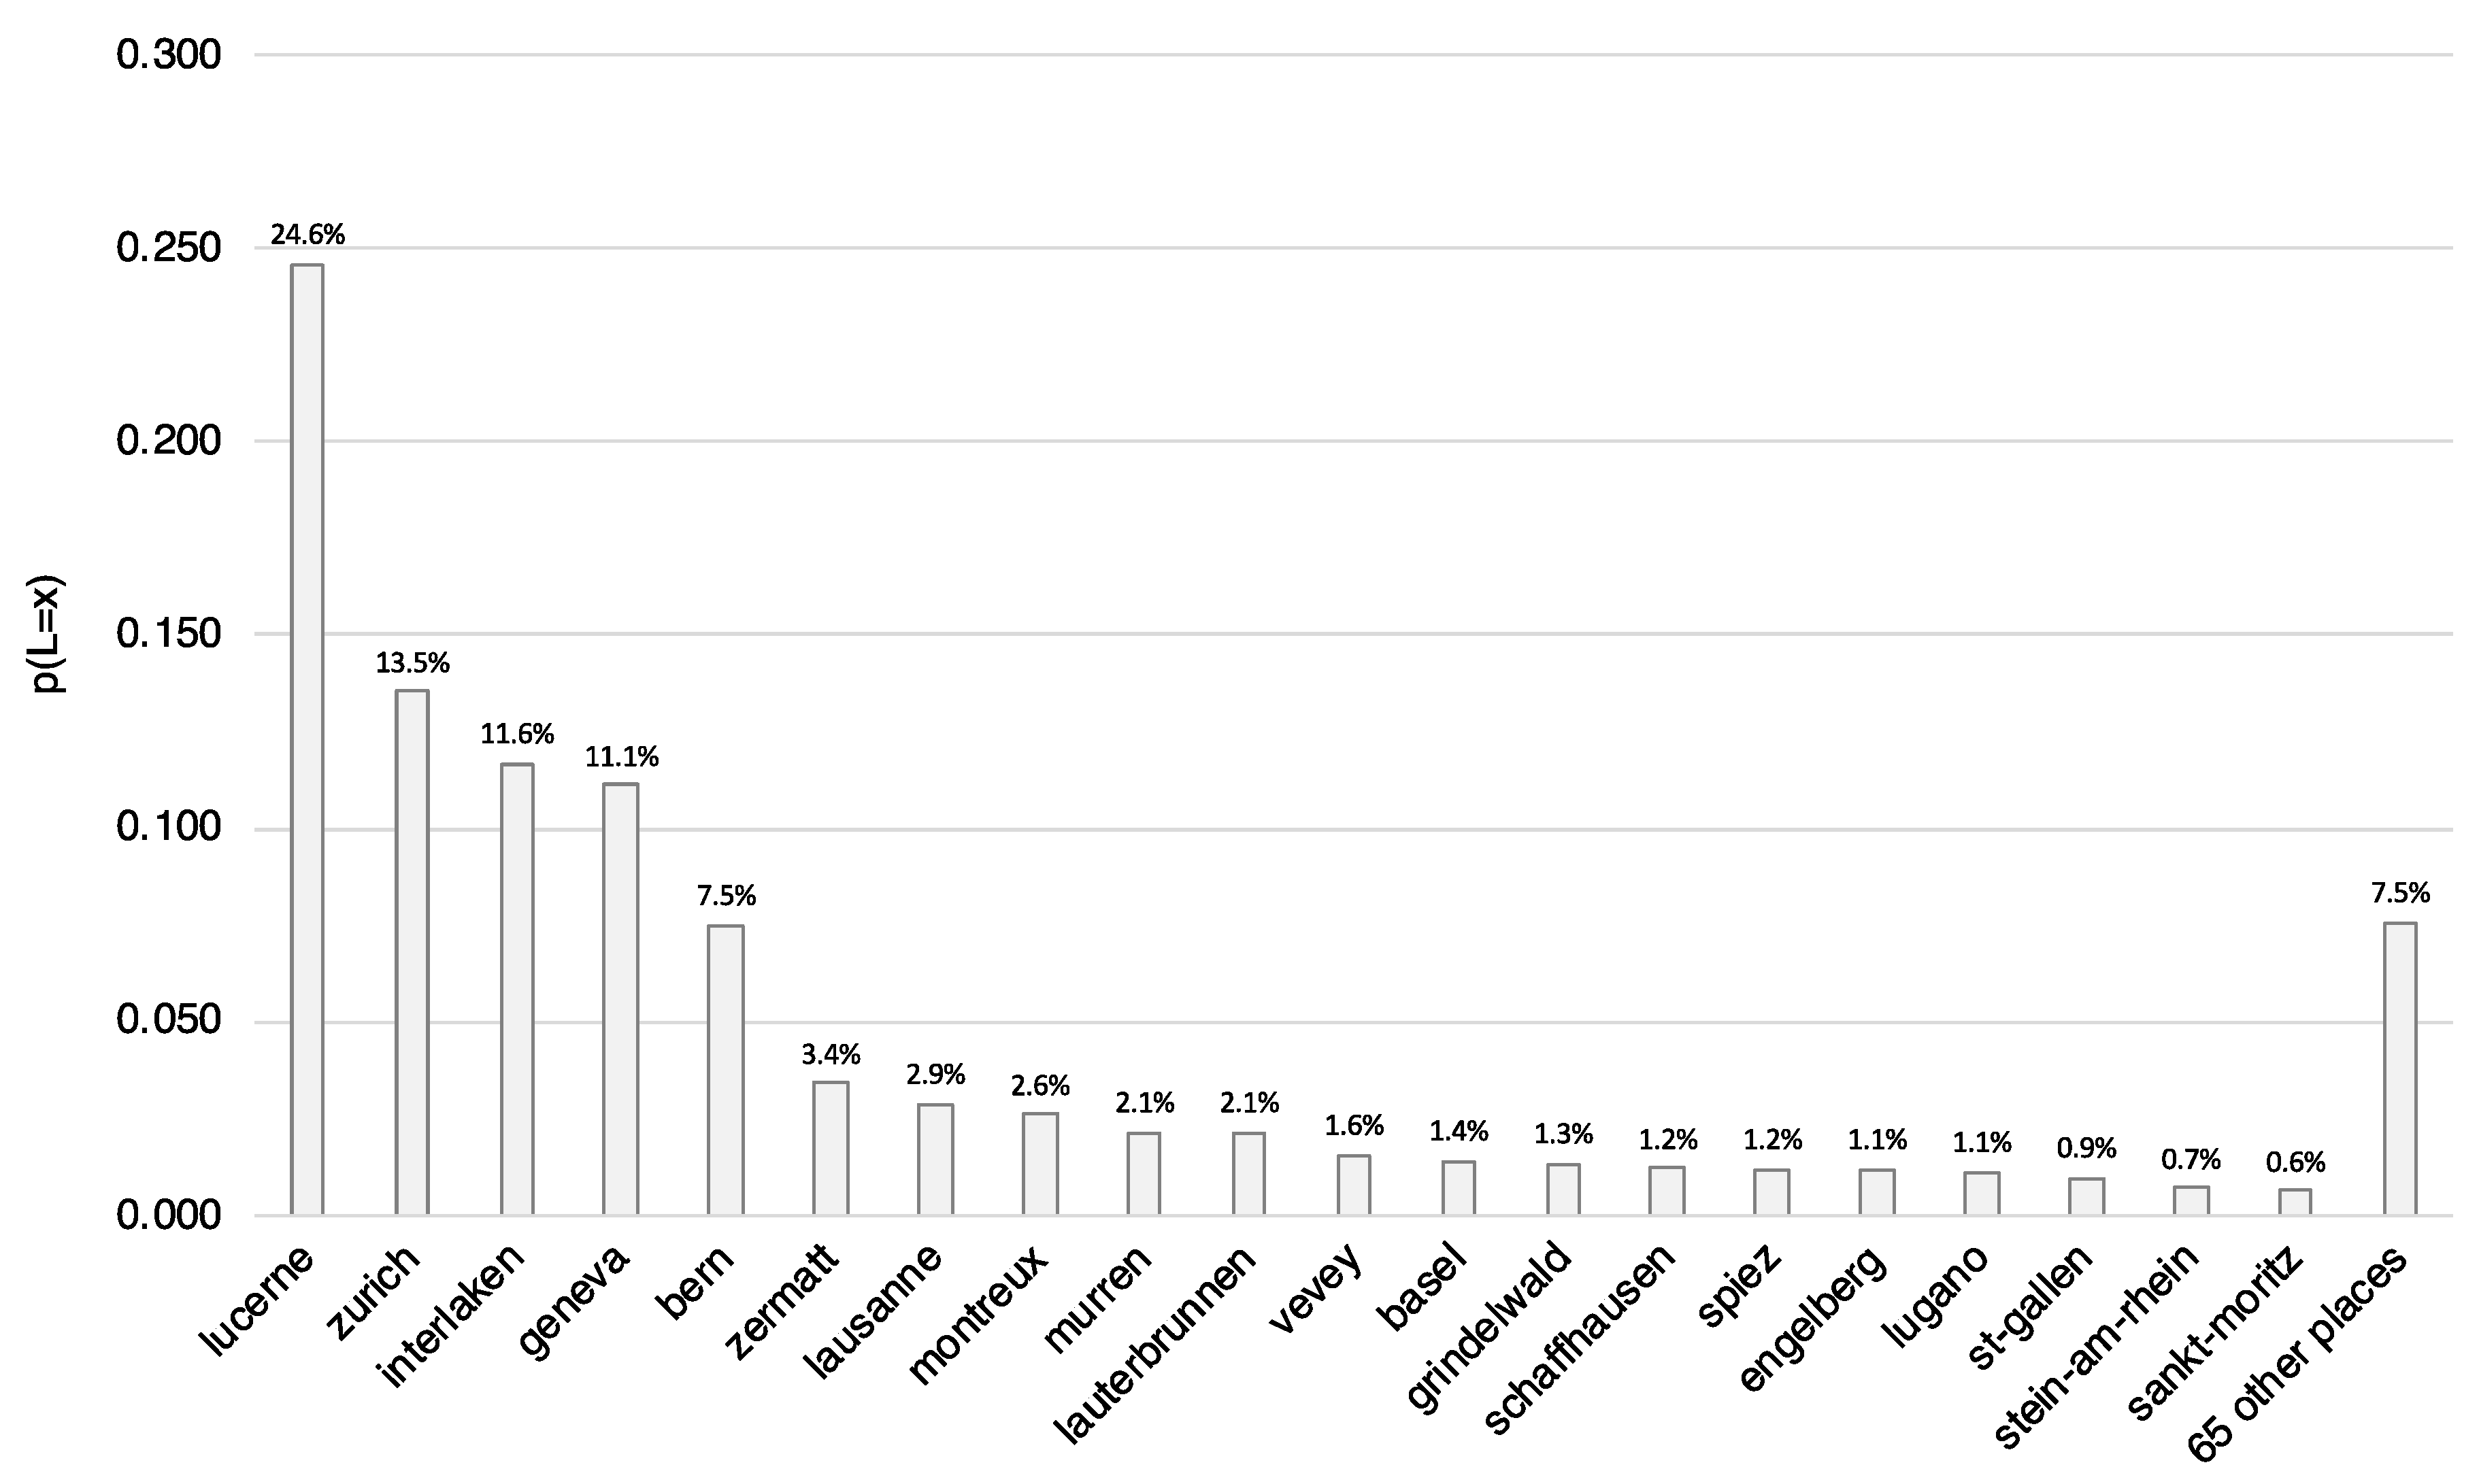
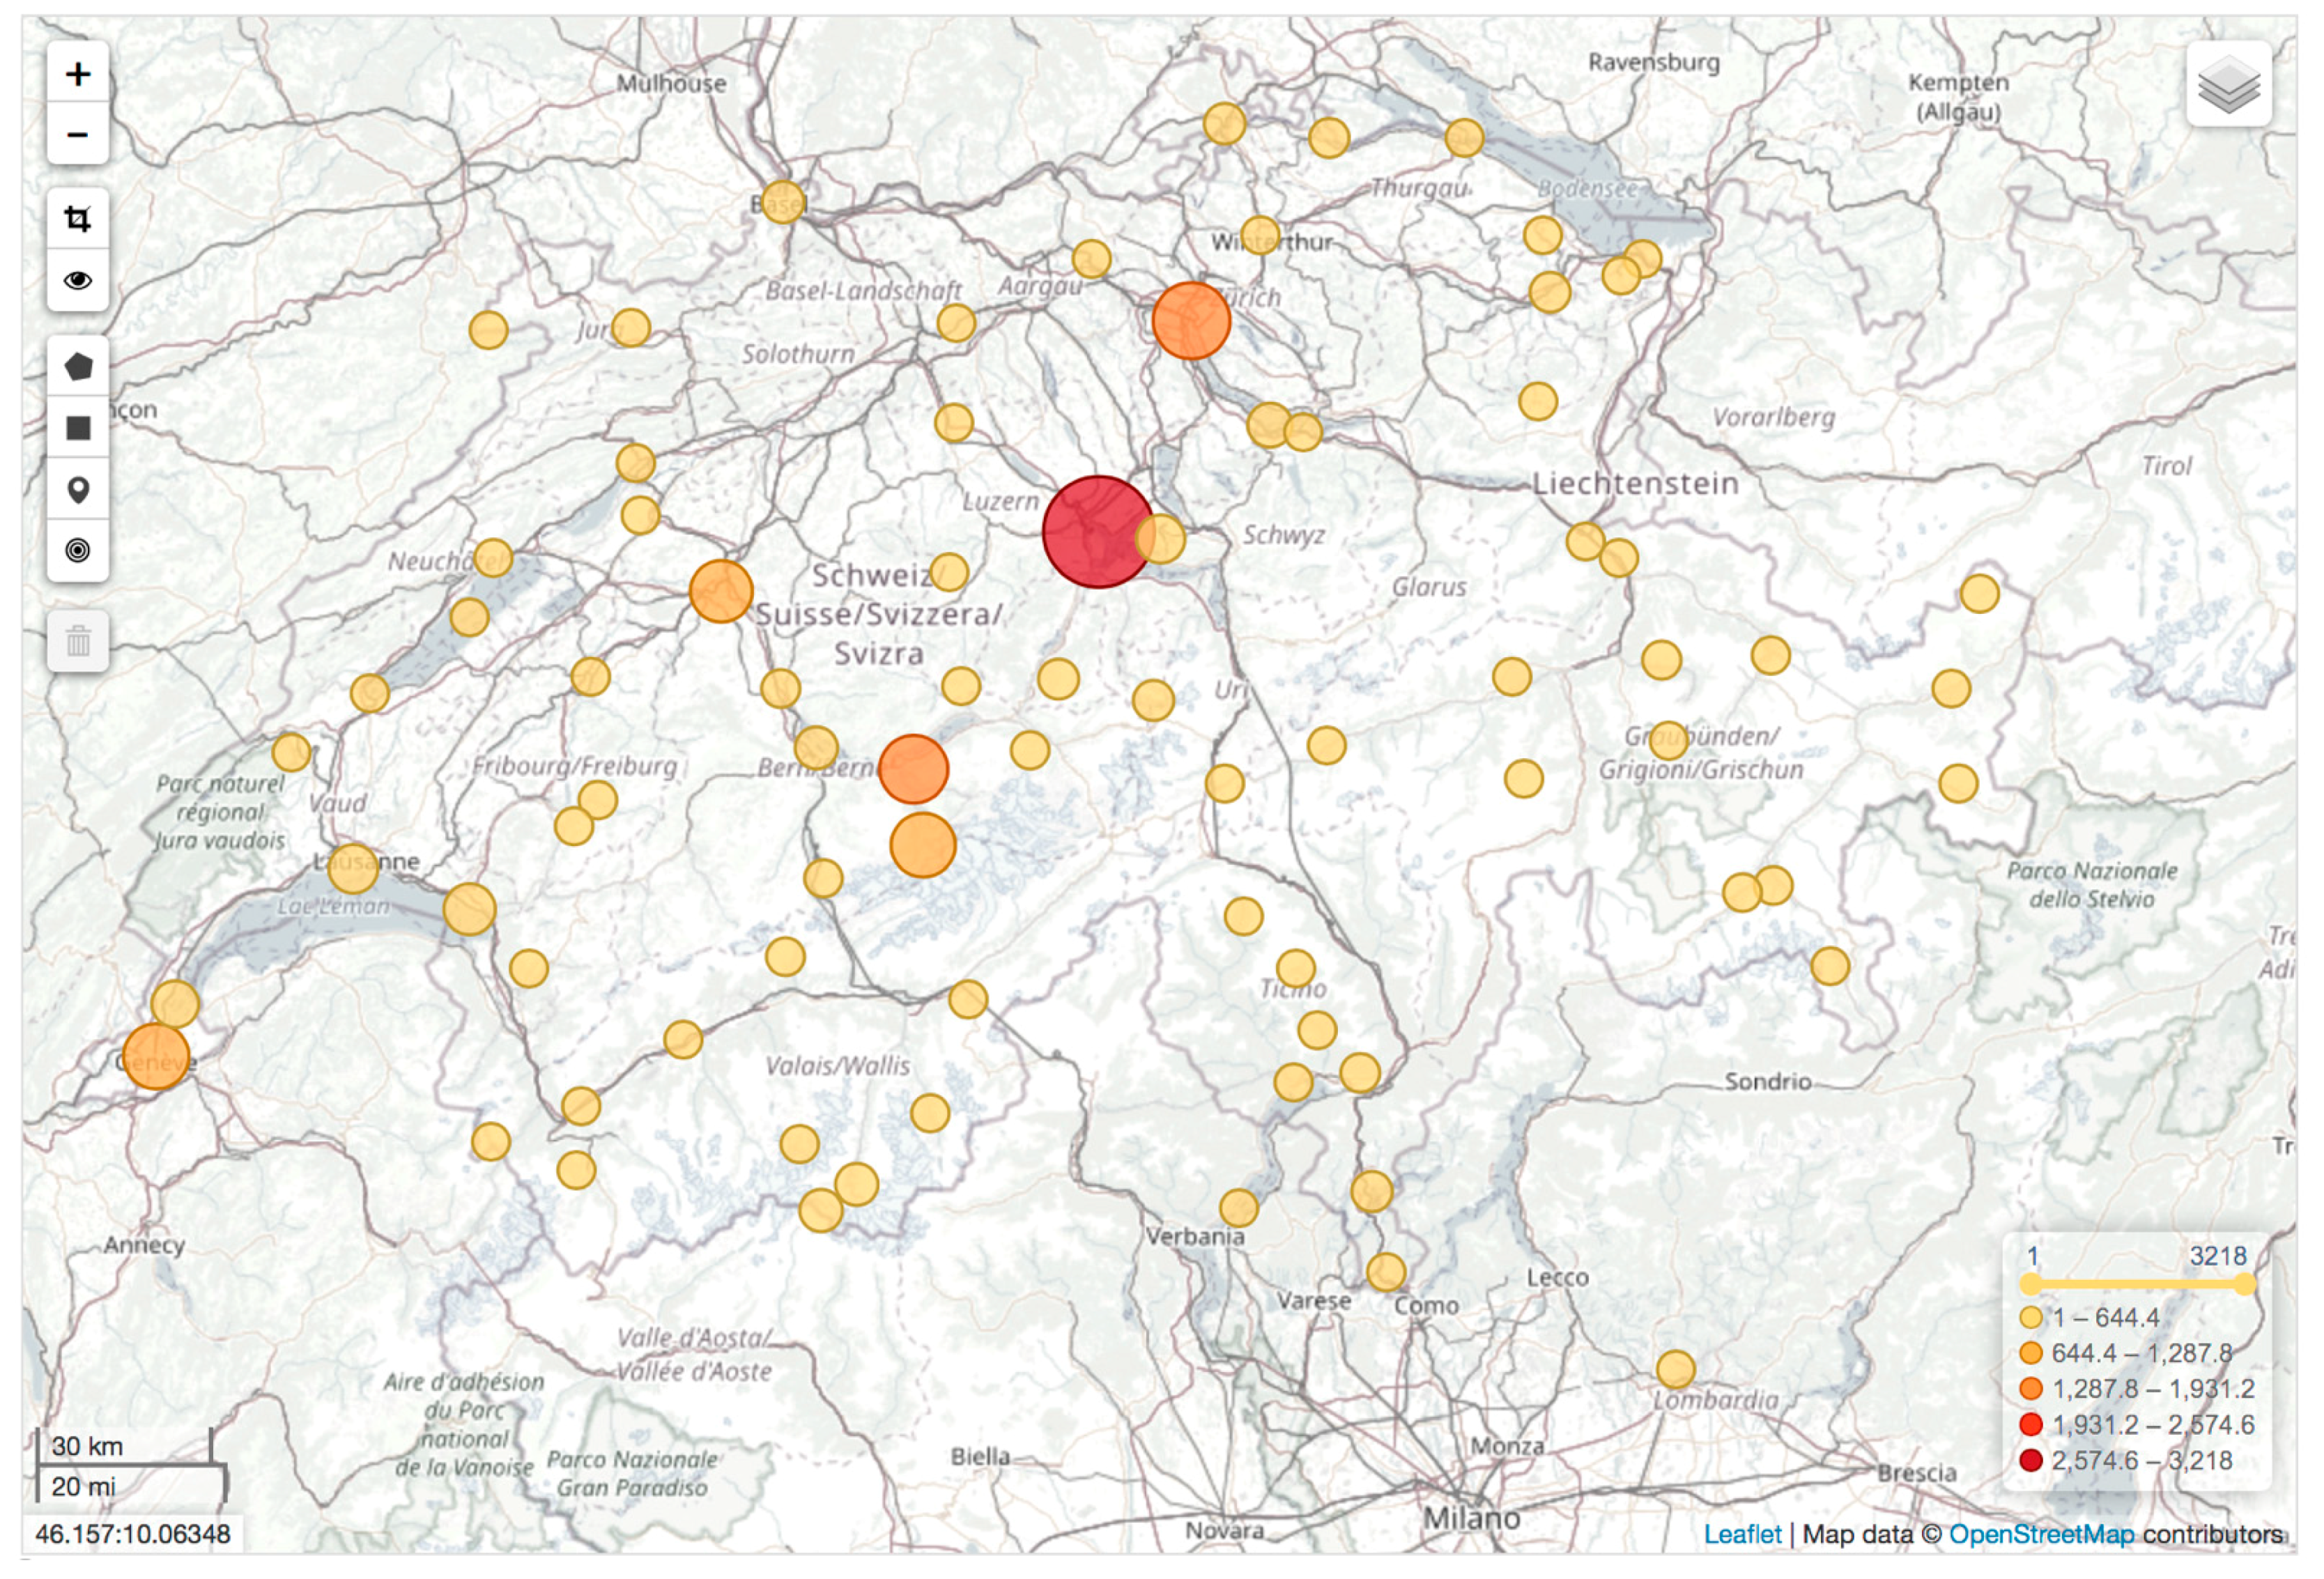
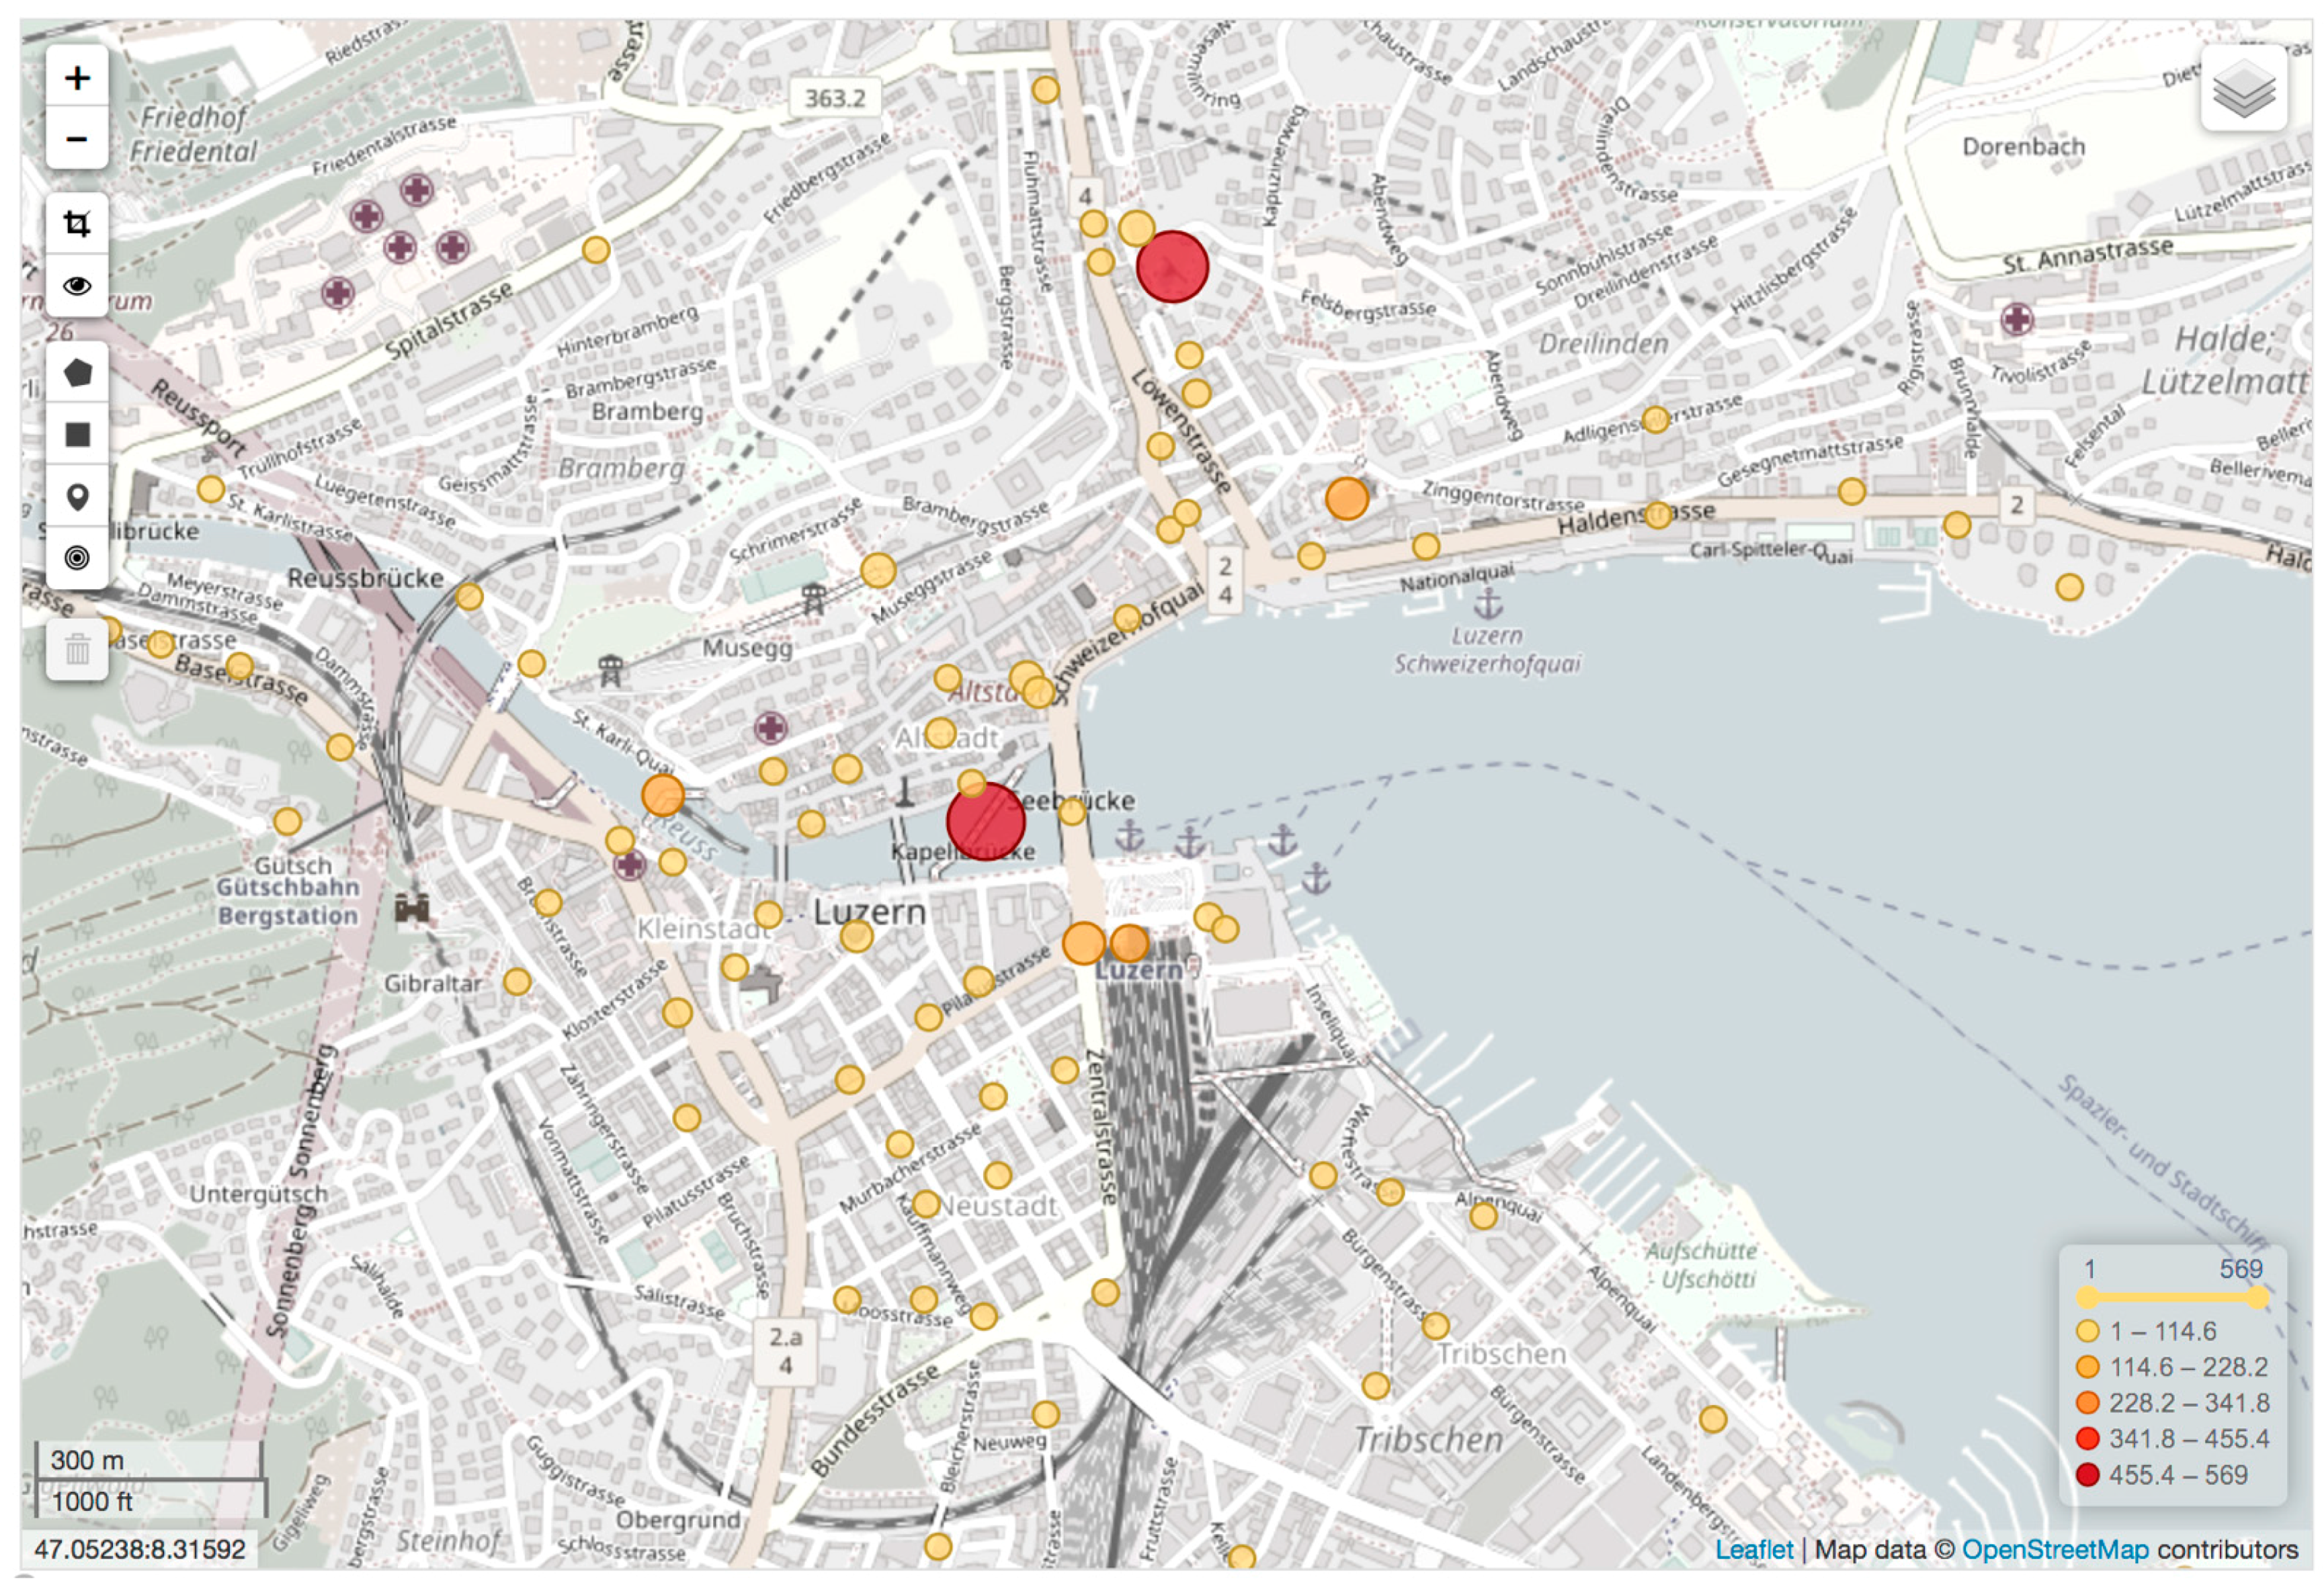
4.1. Tourist Hotspots: Geographical Distribution of Geolocated Blog Posts on Qyer

We collected a total of 15,136 comments on Qyer published by 2894 users about POIs in Switzerland. In total, 1290 POIs were commented on between 26 February 2012 and 2 November 2017, belonging to 85 places or towns. This dataset is available as Supplementary Material. 61% of users who disclosed their gender were female. The average age of this sample was 32.5 years (SD = 10.9). 57% of users who disclosed their age were between 26 and 35 years old. 40% of all users preferred not to disclose their gender, and 60% did not disclose their age.
On Qyer, users have the ability to express their opinion and provide feedback about certain POIs in the form of comments, also called reviews. These comments represent UGC, which is publicly available to all users. In addition, each comment includes an exact timestamp indicating when the comment was published. Qyer also provides the GPS coordinates of each POI. This allows an analysis of geographical distribution of UGC. Thus, we counted the number of comments per POI and place. The sampled distribution, aggregated to places, is shown in Figure 3, which shows a long-tail distribution. Ninety percent of all Qyer comments are linked to 17 out of 85 places; the majority (60.8%) of all comments are linked to Lucerne, Zurich, Interlaken and Geneva (4.7% of all places).
These data enable the interactive visualization of the frequency of UGC for each POI, as explained in Section 3.1. The result is shown in Figure 4 and Figure 5. The colour and the size of the markers indicate the number of comments collected per POI. For the purpose of an overview, the POIs are pictured in an aggregated form. The resulting heatmap has a zoom functionality, as illustrated in Figure 5 that shows the most frequently commented POIs in Lucerne. Overall, in Figure 4 the majority of POIs commented in Switzerland are within the periphery of Lucerne, Zurich, Interlaken and Geneva. The number of comments in the region of Lucerne clearly stands out with a gap between it and other destinations. Disregarding the number of comments, the markers are evenly distributed over the populated areas. The POIs generally seem to be located in either a more urban or a more mountainous area.
With this high cumulative frequency, these four locations can be considered tourism hotspots according to the definition of Formula 10 (θ = 1/2) in Section 3.2. Although this method for hotspot detection is not the main focus of this study, it serves two purposes. First, we used it for validating the data by cross-referencing it to overnight statistics, and second, we applied it as a dependent variable for the exploratory data analysis process to model segments regarding tourist hotspot behaviour. This process is described in the next section.

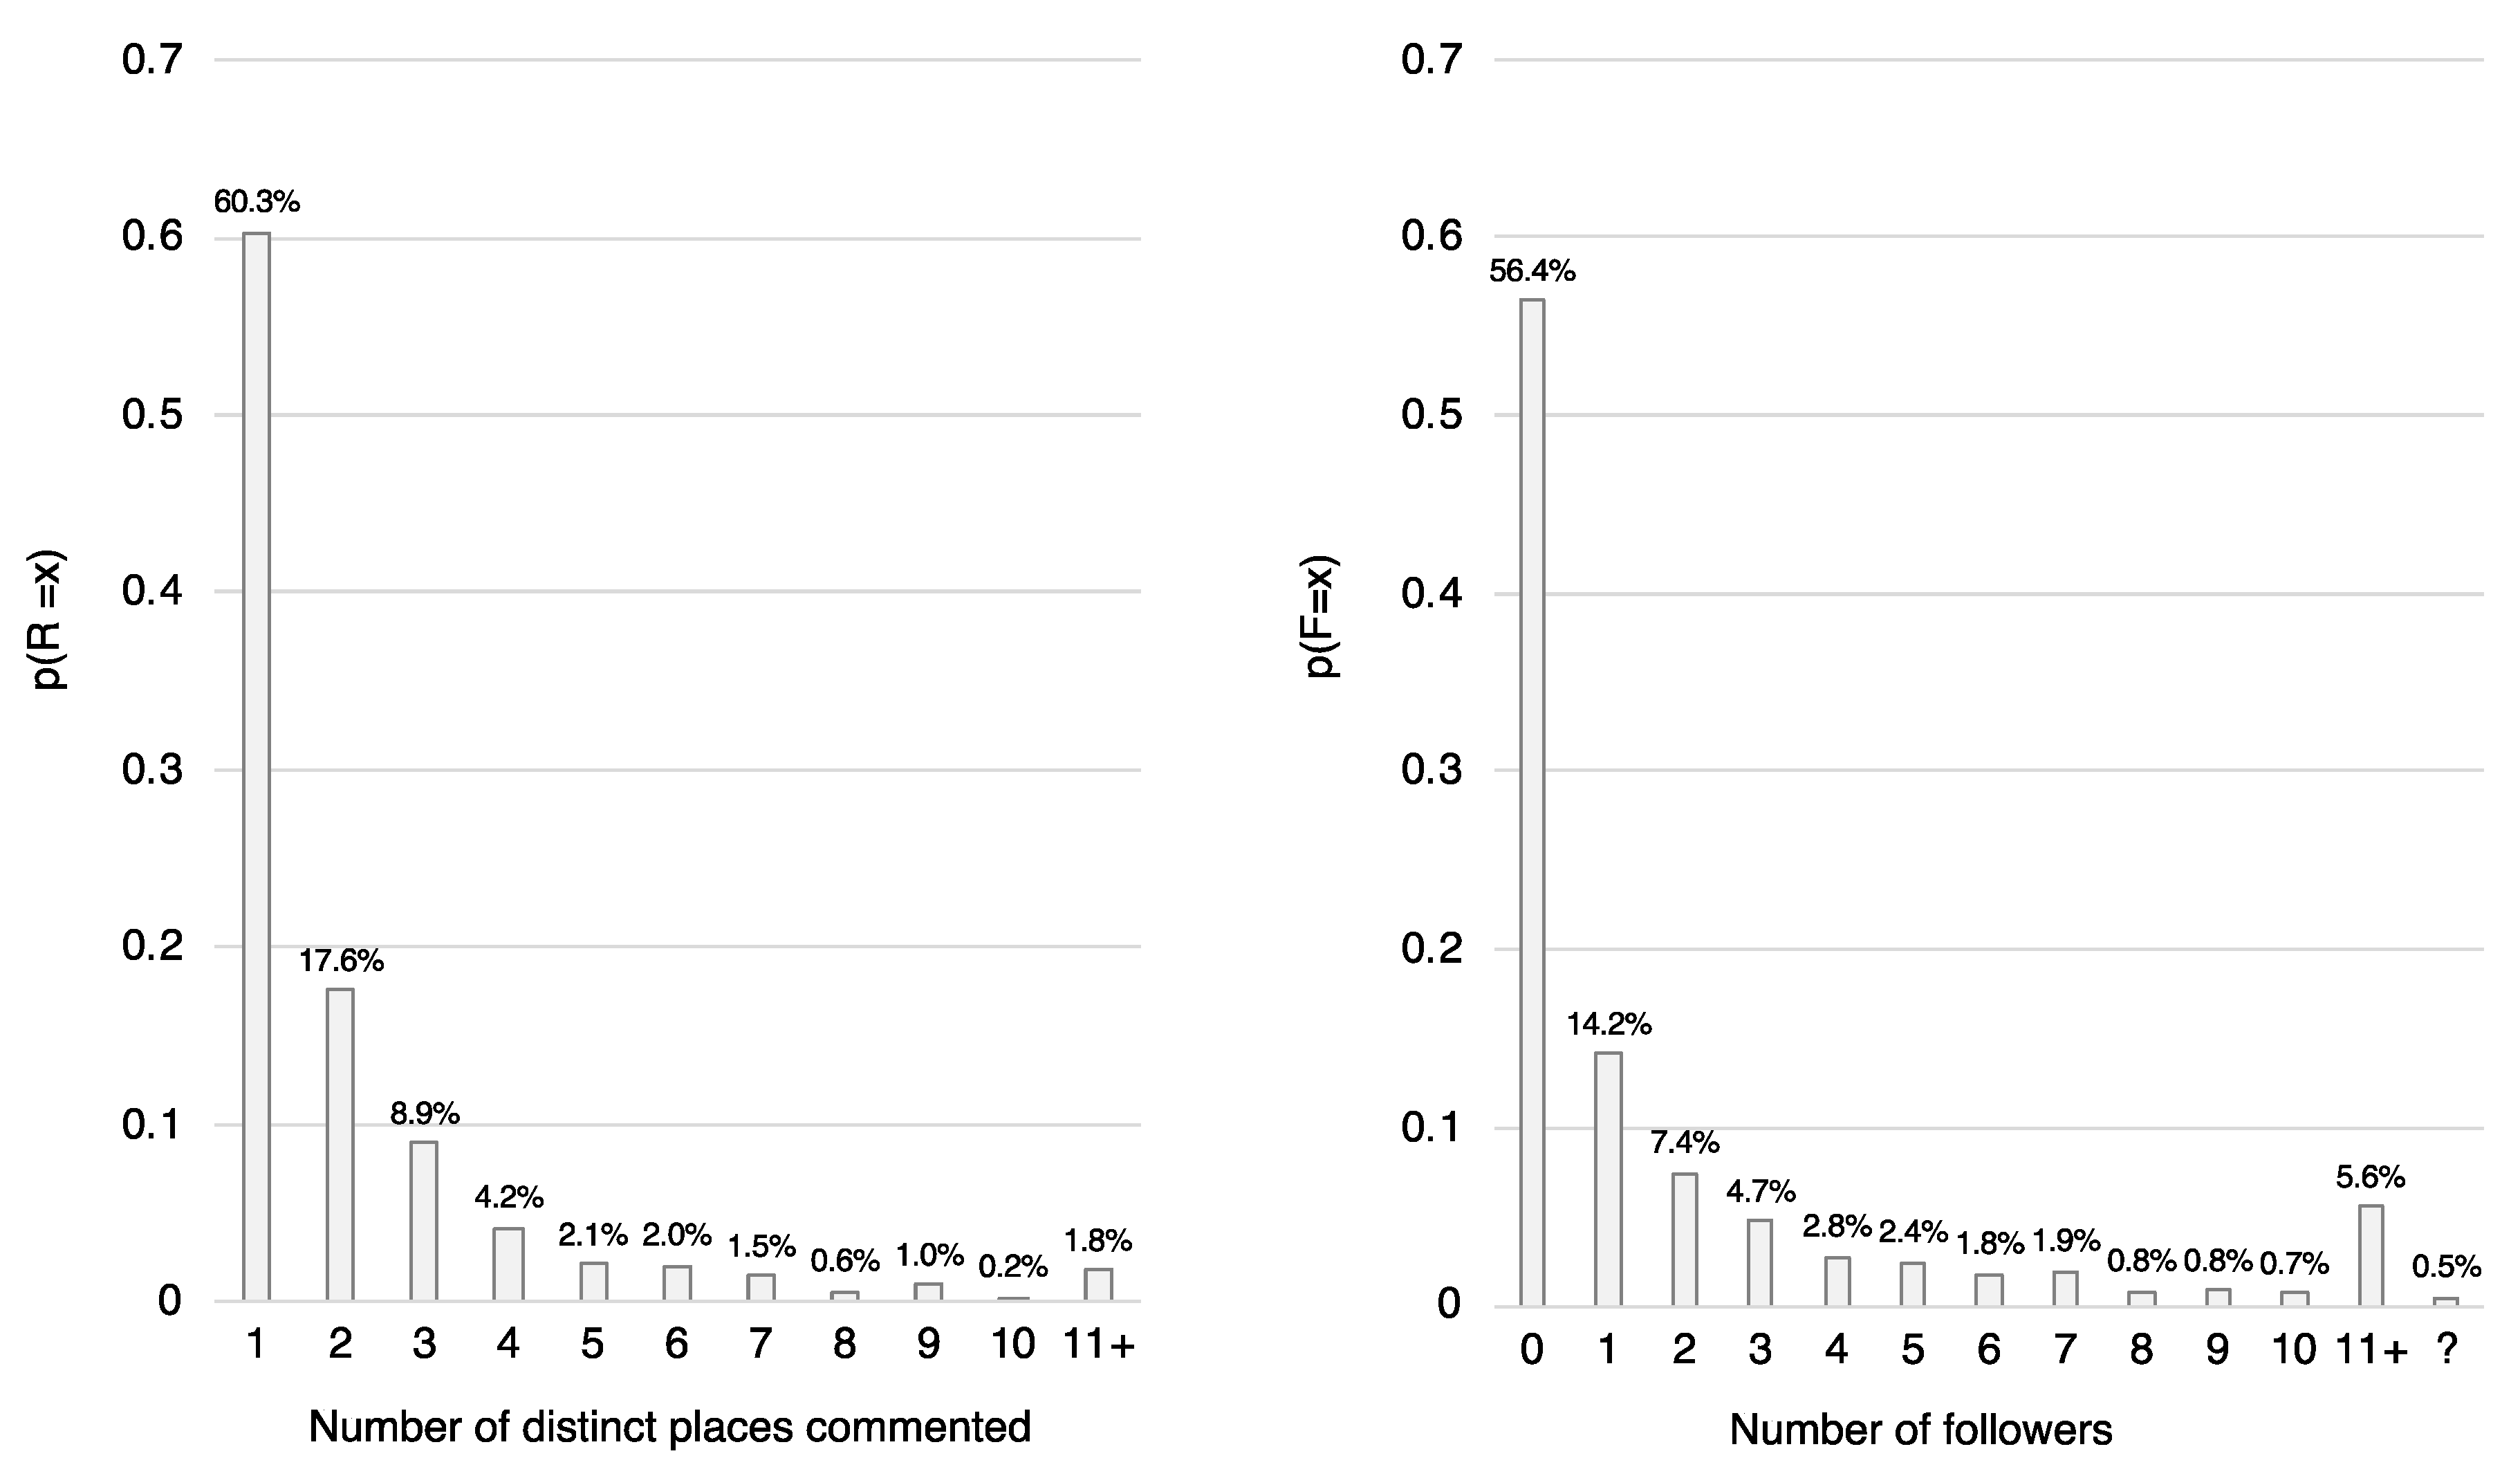
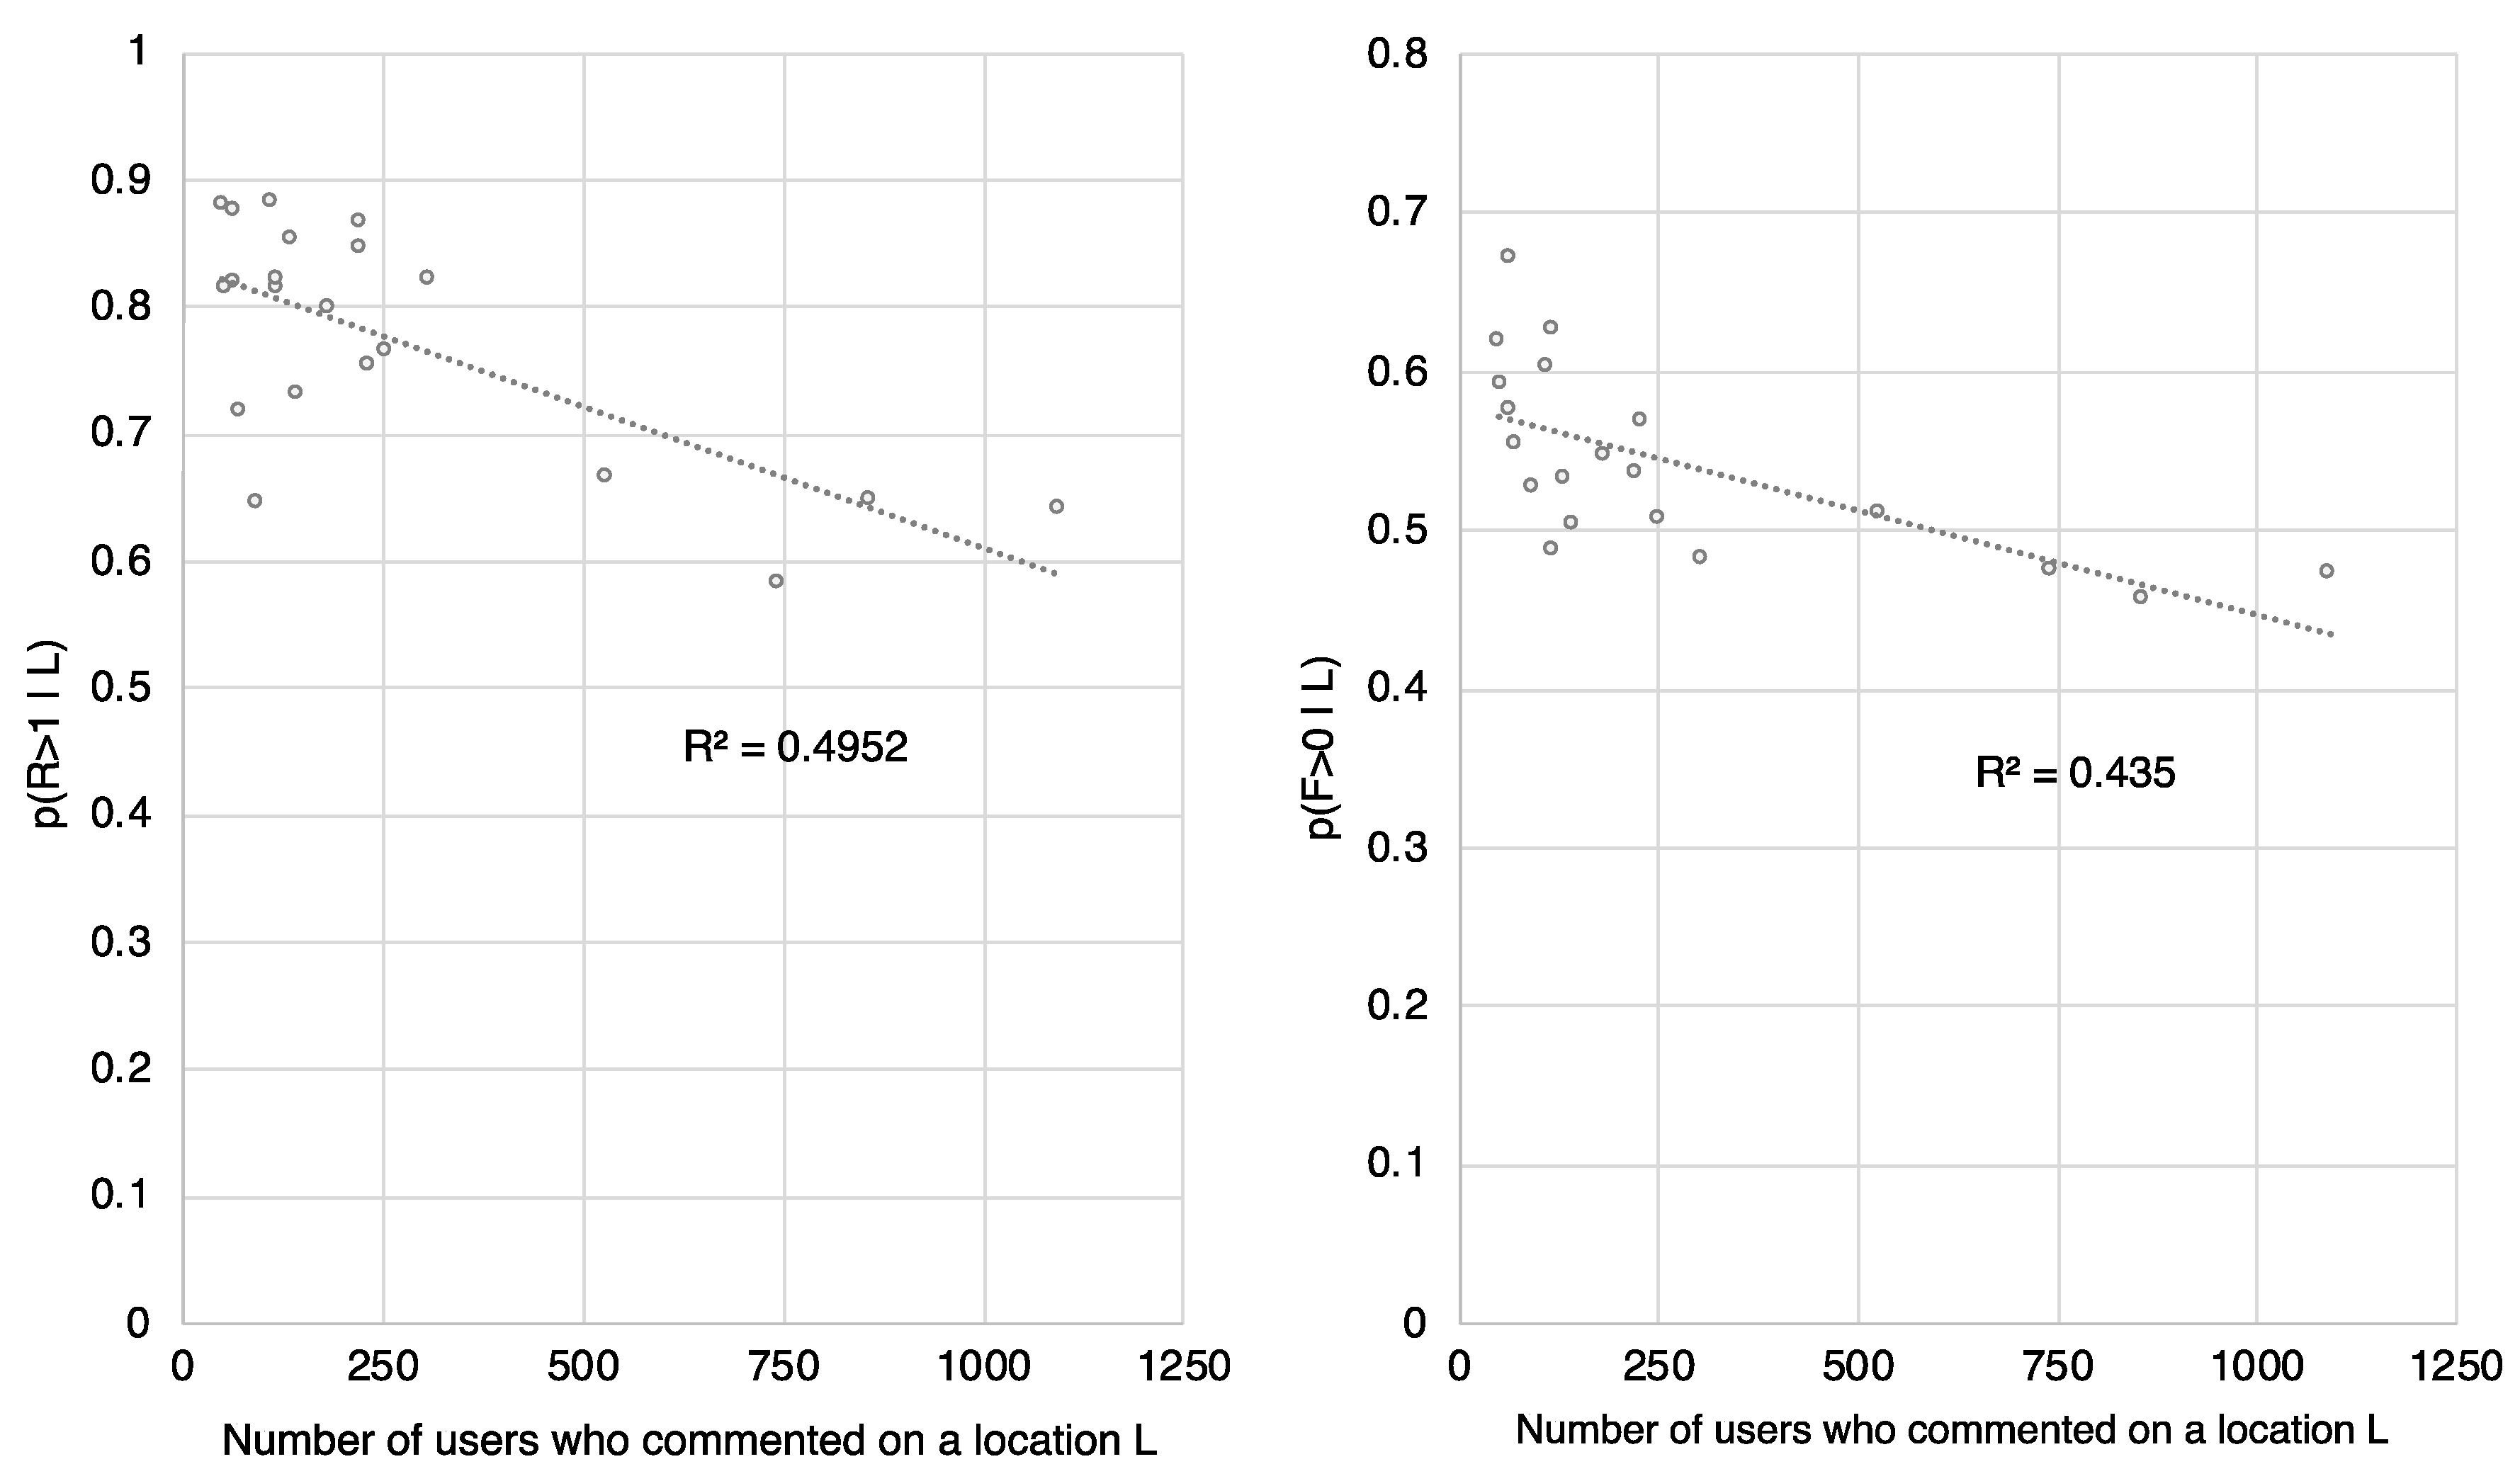
4.2. Tourist Segmentation Regarding Hotspot Interest Using Social Media Activity Features

The data gathered on Qyer consisted of single records, each representing one blog post linked to one user and one POI. Many POIs can belong to a geographical region called a place or location. To analyse users with interests in hotspots versus alternative destinations, we summarized the blog post data to build user profiles consisting of one record per user. Thus we aggregated the data from the granularity of single reviews of single POIs to the level of users and the places they showed interest in. Users possibly posted multiple reviews of places with multiple POIs. Accordingly, we derived user location interest indicators I i L : U { 0 , 1 } ,   i = 1 ,   ,   | L | that indicate, for every location L i , whether a user U k U has commented on this particular location at least once. Also, we included the number of comments per user, c : U and the number of commented or reviewed places per user, R : U , both of which can be directly derived from the data within the proposed framework. Furthermore, we observed the number of followers F : U that a user has, indicating the interest of the social network in content generated by a particular user, where F ( u ) = | φ ( u ) | . Other variables were the sociodemographic indicators age a : U and gender g : U { m ,   f } , however because of many missing values the data quality was not satisfying. The result of the data aggregation was a user travel profile matrix, where, in addition to user profile data such as age, gender and the number of followers, there is an indicator for whether each user has commented on each of the 85 places found on Qyer. To find a meaningful segmentation of this travel profile matrix, we chose a data-driven approach. Using a machine learning toolkit, an EM clustering with k=2 of this user travel matrix on these attributes generated two user segments. According to the output of the clustering algorithm, the most significant distinctive features for the two clusters were social media activity, especially the number of followers, and the number of distinct places in Switzerland commented on by the user.
In the following, we analyse these two representative variables in detail so as to evaluate if they provide significant characteristics for the tourist segmentation in the Qyer social network. According to the clustering algorithm result, our hypothesis is that the number of followers, F, and the number of distinct places commented on, R, meaningfully segment the travel profile matrix of the user base. To test this hypothesis, we analysed the difference in interest in tourist destinations according to their number of followers, as well as their number of commented on places, respectively.
Firstly, there is an evident divide in the observed social media user group when it comes to followers and reviews. The left side of Figure 6 indicates the percentage of users as a function of the number of distinct places reviewed (R). For example, 17.6% of the users commented on two places. As can be seen, most users (60.3%) only comment on exactly one place in Switzerland. Analogically, the right side of Figure 6 shows the percentage of the user base as a function of the number of followers (F) on the social medium Qyer, as indicated on their user profile. For example, 14.2% of the observed users have one follower. As observed, most users (56%) do not have any followers. Clearly, the two features R = 1 and F = 0 provide a very sharply contrasting division of the user base, and this can be applied for a segmentation analysis.
Secondly, as illustrated on the left side of Figure 7, the data show that users who commented on more than one place (R > 1) have a higher likelihood of being interested in less popular places outside the hotspot areas. The majority of users who only commented on exactly one place commented on one of the hotspots Lucerne, Interlaken, Zurich and Geneva. The percentage of users who commented on more than one place tends to be larger for places with more frequent comments. In fact, as visualized by the left side of Figure 7, the inverse correlation between the popularity of a location measured by the number of commenting users # υ L ( · ) (cf. Formula (5)) and the percentage of users who commented on more than one place   p ( R > 1   |   L ) (cf. Formula (6)) is statistically significant, (R2 = 0.495, p << 0.01).
Thirdly, as illustrated on the right side of Figure 7, the data also show that Qyer users who actually have followers (F > 0), who are a minority, are also more likely to be interested in less well-known places outside of the hotspot axis. Again, as visualized on the right side in Figure 7, the correlation between the popularity of a location, measured by the number of commenting users # υ L ( · ) (cf. Formula (5)) and the percentage of users who have followers, p ( F > 0   |   l ) (cf. Formula (6)) is significant (R2 = 0.435, p < 0.01). It is evident that less popular places are more likely to have proportionally more comments from users with followers.
Fourthly, it is evident in the data that the subgroup of Qyer users who are active on social media, who commented on more than one place and who have followers ( R > 1 F > 0 ) are far more likely to be interested in alternative POIs in Switzerland. Generally, of the 2894 users, we observed that only 1459 (50.4%) commented on a place outside the hotspot areas of Zurich, Lucerne, Interlaken and Geneva. We defined these four areas as hotspots because they are differentiated from other places by the median number of comments, and because they can be visually recognized as outliers in Figure 7. As we have seen, most users have no followers, and most users commented only on one place. Table 1 shows that only 587 users have at least one follower and have commented on more than one place. Interestingly, as shown in Table 2, of all the 587 users in this segment of active social media users ( R > 1 F > 0 ) , 477 (81%) commented on alternative places outside the hotspot axis. This difference from the expected value of 295 is statistically highly significant (χ2 = 280.26, p << 0.01).

5. Discussion

According to our proposed methodology, we collected data about the users and their travel interests by means of their comments on individual geotagged POIs. A declarative analysis of the geographical distribution of user comments on Qyer has addressed the question of which geographical places and POIs in Switzerland microblogs users commented on the most. A segmentation analysis studied how interest in hotspots versus alternative destinations can be differentiated.
First, regarding tourism hotspot detection, we found that most UGC content is uploaded from Lucerne, Zurich, Interlaken and Geneva. In addition, we found a long-tail distribution of places from which only very little UGC is uploaded. This result appears to be plausible because the measured number of overnights generated by Chinese travellers follows a similar long-tail distribution. The same destinations (e.g., Lucerne, Zurich, Interlaken and Geneva) generate the bulk share of all overnights, whereas a large number of destinations have only a small share [57]. A similar geographical distribution of UGC is also presented by Liu et al. [37], who found that most content on the Chinese platform Weibo is uploaded in close proximity to a few selected cities and places in Switzerland, such as Zurich, Lucerne and Interlaken. Based on a semantic analysis, they claimed that content uploaded from the aforementioned cities is most likely uploaded by first-time visitors and group travellers. They further argue that content from less frequently visited places is more likely to have been uploaded by return visitors and independent travellers. A traveller who visits a destination a second time may already have seen the hotspots, so they are likely to spend more time visiting other less popular places. Our data confirm this distribution pattern of UGC. Subsequently, our results suggest that, independent of their travel arrangement choices, Chinese tourists prefer to visit locations in close proximity to hotspots. However, unlike packaged travellers, the users we observed on Qyer, who are likely to be mostly independent travellers because of the website’s focus [33], also additionally visited a few lesser known locations. This interpretation of the results was also discussed with tourism practitioners. Based on the results of our analysis and the feedback received from tourism practitioners, we challenge the preconception that independent Chinese travellers differ significantly from Chinese packaged travellers in terms of the places and attractions they choose to visit. Independent travellers on Qyer differ from packaged travellers in terms of their travel behaviour only insofar as they combine visiting hotspots with visiting lesser known attractions. This behaviour is linked to the fact that independent travellers tend to stay longer in a destination than packaged travellers and therefore have more time available to explore [58].
Second, regarding tourist segmentation, our method identified two clusters of users on Qyer that correlate significantly with interest in tourism hotspots. The majority of users fall within the first cluster. Said users have no followers or only commented on one place, or both. Based on this finding, we argue that most of the observed tourists use social media in a passive manner as a source of information rather than a platform to share their own travel experiences, in contrast to other researchers who identified sharing and being helpful to fellow travellers as two key factors [55]. Yet, studies have also shown that certain consumers groups are willing to share their knowledge with peers on the Internet [59]. In this case we see that there is a minority of users who fall within this second cluster. These users comment on multiple places, which means that they explore and share, and they have followers, meaning that their travel experiences are of interest to other travellers. It is evident in the data that this user segment is significantly more interested in less popular places outside the hotspot axis. We can call this group explorers and influencers. As studies have shown, for businesses it is not only important to provide the identified precursors to encourage such behaviour but also identify these consumer groups. The identification of these users has theoretical as well as practical implications. From a tourism practitioner’s point of view, it should be of interest that a large proportion of users on Qyer seemingly use the platform as a source of information and not as a method to share their own travel experiences. Targeting users who share their travel experiences and have many followers can be considered part of a marketing strategy to promote visits to alternative destinations, or less frequently visited places, to relieve travel hotspots from the effects of overtourism. From a researcher’s perspective, the results show that users who are active on social media are more likely to explore places outside of the hotspots. This hints at a new theory of social media influencers and travel hotspots that could be explored as further research.
Third, regarding methodology, we gained insights on the value of our proposed system and method through a pilot application, which answered a scientific question in tourism management on how to segment tourists based on geolocated social media activity regarding their interest in alternative destinations. The application of big data analysis for social science research is rather new, and epistemological approaches are needed to evaluate methods for data-driven knowledge generation. In this study, we adopted an abductive, data-driven science approach. We generated a hypothesis about possible segmentations using an unsupervised machine learning algorithm to gain insights on a meaningful segmentation of the user data we collected. We then tested the machine-generated hypothesis with human-understandable statistics. Interestingly, with this method, a clear, statistically significant segmentation of the social media user base emerged. This fact validates our proposed method and qualitatively demonstrates that segmentation according to social media usage data is feasible and meaningful. Nevertheless, there are some lessons based on expert reviews with social scientists and industry practitioners. Firstly, the choice of data source is fundamental to any data science project. In our study, Qyer seems to be a platform for individual travelling, and it is not directly possible to gather data about group travellers because it is not evident which Qyer users travel in groups, if any. Secondly, for decision support, receiving the relevant questions from management is a challenge in itself. There is a gap between technologically possible data science methods and the everyday reality of industry practitioners. This gap became particularly evident when the researchers discussed the data with tourism authorities to promote a change in tourism behaviour based on the results obtained. Thirdly, in our case, the comprehensibility of the data analysis results was of key importance. By working with experts from tourism management, we had the insight that simpler but understandable analyses are often better suited for industrial applications. Data-driven decision-making requires trust in the data analysis, and this trust is often better established if the decision makers understand the analysis methods that led to the results. To apply SMM for decision support, the comprehensibility of explanations might be more important than predictive power. Fourthly, using big data for computational social science, the question of the correspondence of data with reality must be addressed explicitly and clearly. This is, in essence, an epistemological question that is fundamental to this emerging discipline. It is central for data scientists to remain objective and to only draw conclusions that can be directly supported by empirical data. In our case, we cross-referenced our data with other studies based on additional social media and classical statistics, and we used exploratory data analysis to explain and visualize results from clustering methods using comprehensible descriptive and inductive statistics.

6. Conclusions

We contribute a system design for detecting tourism hotspots and for segmenting tourists based on their interests in these hotspots, in the case of the geolocated social medium Qyer.com. We theorize our solution towards a generalized formal methodology that can be applied to other geolocated travel blogs. We demonstrate the potential of our system and method through pilot application, analysing Chinese tourism in Switzerland. The following methodological and practical knowledge can be concluded from our research. From an information systems perspective, firstly, our system design and formal methodology for hotspot detection from geolocated social media resulted in plausible geographical distributions of tourism hotspots, as validated by cross-references. This study confirmed the known geographical long-tail distribution of interest, including the hotspot areas of Lucerne, Zurich, Interlaken and Geneva, validating the plausibility of the data and its analysis. Secondly, in the case study, by application of our proposed method we discovered a highly significant stochastic dependence, thus providing evidence for the value or our proposed methodology for segmentation. From a tourism management perspective, thirdly, we can conclude that Chinese independent travellers, which are the main target group of Qyer, are mainly interested in discovering travel hotspots in the same way as packaged tourists are; in addition, they show interest in other, less popular places. Fourthly, we found that social media activity, as measured by the number of followers and the number of distinct commented locations, is a very selective criteria to segment the observed users regarding their interest in travel hotspots versus alternative destinations. Users who are more active, who comment on different places and who have followers are a minority. However, these more active users are significantly more interested in alternative destinations outside the hotspot axis. This information can be applied to define a target group for online marketing to promote alternative travel destinations with the goal to reduce overtourism in travel hotspots.
Nevertheless, this study is not without its limitations. First, there are uncertainties in terms of the user base of Qyer and its representativeness. Even though Qyer is known to be a platform where independent Chinese travellers share their experiences, the possibility that packaged travellers are also active on Qyer cannot be eliminated. Furthermore, it is unknown whether the sample is biased towards other subgroups of Chinese outbound travellers, such as budget travellers. In fact, research has shown that different social media platforms target different user groups [60,61]. Overall, there are various uncertainties in terms of the representativeness of the entire visitor population as there is a lack of data covering the behaviour and characteristics of the visiting population, which would be necessary to validate the sample. Second, the fact that a user has commented on a place or POI does not necessarily mean that this user has visited the place or POI to which the comment refers, even if this indicates interest. Third, even though Qyer does provide a timestamp for every comment, we found that users tend to upload their comments on various places and POIs at the same time. It is likely that they upload their posts upon return to their accommodations, where Internet access is available to them. As a result, it is impossible to retrace visitor flows and evaluate the length of stay. Finally, it was not possible to separate Chinese residents of Switzerland from the Chinese tourists in Switzerland. Residents could be those visiting less popular areas.
Regarding future research directions, the hotspots detected in this paper do not necessarily imply that the respective destinations experience effects of overtourism. There are various factors, e.,g. population size, history of a tourism destination, distribution of the value added, that leverage the symptoms of overtourism. Thus, the detected hotspots in this paper should be critically evaluated based on additional criteria. In fact, there are major issues associated with social media and blog data. The information gained from these sources may be always biased, which is an issue often associated with generalizations. So, in future studies, we plan to put even more efforts on validating/evaluating the data we used.
Furthermore, a qualitative analysis of explorative influencers might provide an adequate separation of users into independent travellers and packaged travellers so as to provide additional insights into the travel behaviour of independent Chinese travellers. A method to identify multiple visitors can lead to the possible differentiation of packaged and individual travellers as this new trend toward individualized travel has subsequently led to the emergence of new customer segments and thus constitutes new business opportunities. As was found in previous studies, the travel arrangement chosen by Chinese travellers significantly influences their information search behaviour, image perception and activities undertaken [62]. Furthermore, future analysis of UGC on Qyer linked to less well-known POIs should be investigated more deeply. To this end, an influencer analysis is possible with the existing data, and POIs that are relatively popular among users with many followers can be identified, and their characteristics can be recognized. As further points of research, other social media platforms such as Ctrip and Tripadvisor can be analysed according to our proposed method. Thus, it is possible to draw more samples from the population to improve the estimate of the true probability distribution.

Supplementary Materials

The dataset supporting the conclusions of this article is available in the Zenodo repository, https://zenodo.org/record/2272050#.XbgNVi1oS-U.

Author Contributions

Michael Kaufmann initiated and led the research project. Michael Kaufmann designed, planned and managed the development of the data engineering approach, analysed the resulting data and created all of the tables and figures. Michael Kaufmann authored all text on aspects of data engineering, formal methodology and data analysis. Patrick Siegfried implemented the information system software for data collection and information visualization. He acquired all the data for the study and prepared it for analysis. Lukas Huck was a major contributor in writing the manuscript regarding the tourism aspects of this paper. Lukas Huck wrote parts of the literature review, the methods, the results and contributions. Lukas Huck also helped analyse the results from a social science perspective. Jürg Stettler played a major role in formulating the scientific research question. He was the main contributor in conceptualizing the research design and analysing, as well as interpreting, the results from a social science perspective. Jürg Stettler also provided an extensive feedback on the written content. All authors read and approved the final manuscript.

Funding

The work described in this paper was funded by Zug Estates AG and by the State Secretariat for Economic Affairs (SECO) of Switzerland under InnoTour grant number 579.

Acknowledgments

The software system for data collection and visualization was programmed by Patrick Siegfried. We thank Benjamin Haymond for proof-reading the manuscript. The following tourism practitioners helped discuss the results and interpretation of the data: Frédéric Füssenich of Engelberg-Titlis Tourismus AG; Werner Lüönd, SGV AG; and Fabio Schwarz, Beat Wälti, and Mark Meier of Luzern Tourismus AG.

Conflicts of Interest

The authors declare no conflict of interest.

References

  1. Bauder, M. Engage! A Research Agenda for Big Data in Tourism Geography. In A Research Agenda for Tourism Geographies; Müller, D., Ed.; Edward Elgar Publishing Limited: Cheltenham, UK, 2019; pp. 149–157. Available online: https://www.elgaronline.com/view/edcoll/9781786439307/9781786439307.00023.xml (accessed on 28 October 2019).
  2. Riganti, P.; Nijkamp, P. Congestion in popular tourist areas: A multi attribute experimental choice analysis of willingness-to-wait in Amsterdam. Tour. Econ. 2008, 14, 25–44. [Google Scholar] [CrossRef]
  3. Orsi, F.; Geneletti, D. Using geotagged photographs and GIS analysis to estimate visitor flows in natural areas. J. Nat. Conversat. 2013, 21, 359–368. [Google Scholar] [CrossRef]
  4. Kerourio, P. Overtourism: The necessary regulation of tourist activity. Espaces Tour. Loisirs 2018, 344, 118–127. [Google Scholar]
  5. Miah, S.J.; Vu, H.Q.; Gammack, J.; McGrath, M. A big data analytics method for tourist behaviour analysis. Inf. Manag. 2016, 54, 771–785. [Google Scholar] [CrossRef]
  6. Vu, H.Q.; Li, G.; Law, R.; Ye, B.H. Exploring the travel behaviors of inbound tourists to Hong Kong using geotagged photos. Tour. Manag. 2015, 46, 222–232. [Google Scholar] [CrossRef]
  7. Garcìa-Palomares, J.C.; Gutiérrez, J.; Mìnguez, C. Identification of tourist hot spots based on social networks: A comparative analysis of European metropolises using photo-sharing services and GIS. Appl. Geogr. 2015, 63, 408–417. [Google Scholar] [CrossRef]
  8. Provost, F.; Fawcett, T. Data science and its relationship to Big Data and data-driven decision making. Big Data 2013, 1, 51–59. [Google Scholar] [CrossRef]
  9. Wheeler, G. Machine Epistemology and Big Data. In The Routledge Companion to Philosophy of Social Science; McIntyre, L., Rosenberg, A., Eds.; Routledge: Abingdon, UK, 2017. [Google Scholar]
  10. Demchenko, Y.; Grosso, P.; de Laat, C.; Membrey, P. Addressing big data issues in Scientific Data Infrastructure. In Proceedings of the 2013 International Conference on Collaboration Technologies and Systems (CTS), San Diego, CA, USA, 20–24 May 2013; pp. 48–55. [Google Scholar] [CrossRef]
  11. Kitchin, R.; McArdle, G. What makes Big Data, Big Data? Exploring the ontological characteristics of 26 datasets. Big Data Soc. 2016, 3. [Google Scholar] [CrossRef]
  12. Chang, W.L. NIST Big Data Interoperability Framework: Volume 1, Definitions. Available online: http://nvlpubs.nist.gov/nistpubs/SpecialPublications/NIST.SP.1500-1.pdf (accessed on 20 October 2019).
  13. Frické, M. Big data and its epistemology. J. Assoc. Inf. Sci. Technol. 2015, 66, 651–661. [Google Scholar] [CrossRef]
  14. Oswald, F.L.; Putka, D.J. Big data methods in the social sciences. Curr. Opin. Behav. Sci. 2017, 18, 103–106. [Google Scholar] [CrossRef]
  15. Kitchin, R. Big Data, new epistemologies and paradigm shifts. Big Data Soc. 2014, 1, 2053951714528481. [Google Scholar] [CrossRef]
  16. Floridi, L. Big data and their epistemological challenge. Philos. Technol. 2012, 25, 435–437. [Google Scholar] [CrossRef]
  17. Shah, D.V.; Cappella, J.N.; Neuman, W.R. Big Data, digital media, and computational social science: Possibilities and perils. Am. Acad. Polit. Soc. Sci. 2015, 659, 6–13. [Google Scholar] [CrossRef]
  18. Ghani, N.A.; Hamid, S.; Targio Hashem, I.A.; Ahmed, E. Social media big data analytics: A survey. Comput. Hum. Behav. 2018, 101, 417–428. [Google Scholar] [CrossRef]
  19. Lin, P.-J.; Jones, E.; Westwood, S. Perceived risk and risk-relievers in online travel purchase intentions. J. Hosp. Mark. Manag. 2009, 18, 782–810. [Google Scholar] [CrossRef]
  20. Fakharyan, M. The influence of online word of mouth communications on tourists’ attitudes toward Islamic destinations and travel intention: Evidence from Iran. Afr. J. Bus. Manag. 2012, 6, 10381–10388. [Google Scholar] [CrossRef]
  21. Lin, T.M.Y.; Fang, C.-H. The effects of perceived risk on the world-of-mouth communication dyad. Soc. Behav. Personal. Int. J. 2006, 34, 1207–1216. [Google Scholar] [CrossRef]
  22. Marchiori, E.; Cantoni, L. The role of prior experience in the perception of a tourism destination in user-generated content. J. Destin. Mark. Manag. 2015, 4, 194–201. [Google Scholar] [CrossRef]
  23. Mendes-Filho, L.; Mills, A.M.; Tan, F.B.; Milne, S. Empowering the traveler: An examination of the impact of user-generated content on travel planning. J. Travel Tour. Mark. 2018, 35, 425–436. [Google Scholar] [CrossRef]
  24. Ayeh, J.K.; Au, N.; Law, R. Investigating cross-national heterogeneity in the adoption of online hotel reviews. Int. J. Hosp. Manag. 2016, 55, 142–153. [Google Scholar] [CrossRef]
  25. Mauri, A.G.; Minazzi, R. Web reviews influence on expectations and purchasing intentions of hotel potential customers. Int. J. Hosp. Manag. 2013, 34, 99–107. [Google Scholar] [CrossRef]
  26. Pan, B.; MacLaurin, T.; Crotts, J.C. Travel blogs and the implications for destination marketing. J. Travel Res. 2007, 46, 35–45. [Google Scholar] [CrossRef]
  27. Jani, D.; Hwang, Y.-H. User-generated destination image through weblogs: A comparison of pre- and post-visit images. Asia Pac. J. Tour. Res. 2011, 16, 339–356. [Google Scholar] [CrossRef]
  28. Oliveira, E.; Panyik, E. Content, context and co-creation: Digital challenges in destination branding with references to Portugal as a tourist destination. J. Vacat. Mark. 2015, 21, 53–74. [Google Scholar] [CrossRef]
  29. Tse, T.S.; Zhang, E.Y. Analysis of blogs and microblogs: A case study of Chinese bloggers sharing their Hong Kong travel experiences. Asia Pac. J. Tour. Res. 2013, 18, 314–329. [Google Scholar] [CrossRef]
  30. Stepchenkova, S.; Zhan, F. Visual destination images of Peru: Comparative content analysis of DMO and user-generated photography. Tour. Manag. 2013, 36, 590–601. [Google Scholar] [CrossRef]
  31. Schweidel, D.A.; Moe, W.W. Listening in on social media: A joint model of sentiment and venue format choice. J. Mark. Res. 2014, 51, 387–402. [Google Scholar] [CrossRef]
  32. Tilly, R.; Fischbach, K.; Schoder, D. Mineable or messy? Assessing the quality of macro-level tourism information derived from social media. Electr. Mark. 2015, 25, 227–241. [Google Scholar] [CrossRef]
  33. Xiang, Y. The characteristics of independent Chinese outbound tourists. Tour. Plan. Dev. 2013, 10, 134–148. [Google Scholar] [CrossRef]
  34. Pearce, P.L.; Wu, M.-Y.; Chen, T. The spectacular and the mundane: Chinese tourists’ online representations of an iconic landscape journey. J. Destin. Mark. Manag. 2015, 4, 24–35. [Google Scholar] [CrossRef]
  35. Cheng, M.; Edwards, D. Social media in tourism: A visual analytic approach. Curr. Issues Tour. 2015, 18, 1080–1087. [Google Scholar] [CrossRef]
  36. Chen, F.W.; Plaza, A.G.; Urbistondo, P.A. Automatically extracting tourism-related opinion from Chinese social media. Curr. Issues Tour. 2017, 20, 1070–1087. [Google Scholar] [CrossRef]
  37. Liu, Z.; Shan, J.; Glassey Balet, N.; Fang, G. Semantic social media analysis of Chinese tourists in Switzerland. Inf. Technol. Tour. 2017, 17, 183–202. [Google Scholar] [CrossRef]
  38. Salas-Olmedo, M.H.; Moya-Gómez, B.; García-Palomares, J.C.; Gutiérrez, J. Tourists’ digital footprint in cities: Comparing Big Data sources. Tour. Manag. 2018, 66, 13–25. [Google Scholar] [CrossRef]
  39. Hale, B.W. Mapping potential environmental impacts from tourists using data from social media: A case study in the Westfjords of Iceland. Environ. Manag. 2018, 62, 446–457. [Google Scholar] [CrossRef]
  40. Kim, Y.; Kim, C.; Lee, D.K.; Lee, H.; Andrada, R.I.T. Quantifying nature-based tourism in protected areas in developing countries by using social big data. Tour. Manag. 2019, 72, 249–256. [Google Scholar] [CrossRef]
  41. Brand, T.; Bendler, J.; Neumann, D. Social media analytics and value creation in urban smart tourism ecosystems. Inf. Manag. 2017, 54, 703–713. [Google Scholar] [CrossRef]
  42. Girardin, F.; Calabrese, F.D.; Fiore, C.; Ratti, J. Digital footprinting: Uncovering tourists with user-Generated content. IEEE Pervasive Comput. 2008, 7, 36–43. [Google Scholar] [CrossRef]
  43. Shi, Y.; Serdyukov, P.; Hanjalic, A.; Larson, M. Personalized landmark recommendation based on geotags from photo sharing sites. In Proceedings of the 5th AAAI Conference on Weblogs and Social Media, Barcelona, Spain, 17–21 July 2011; pp. 622–625. [Google Scholar] [CrossRef]
  44. Chareyron, G.; Rugna, J.D.; Cousin, S. Smart travel guide: From internet image database to intelligent system. In Multimedia on Mobile Devices 2011; and Multimedia Content Access: Algorithms and Systems V, Proceedings of the IS&T/SPIE Electronic Imaging, San Francisco Airport, California, United States 23–27 January 2011; SPIE: Bellingham, WA, USA, 2011. [Google Scholar] [CrossRef]
  45. Hu, F.; Li, Z.; Yang, C.; Jiang, Y. A graph-based approach to detecting tourist movement patterns using social media data. Cartogr. Geogr. Inf. Sci. 2019, 46, 368–382. [Google Scholar] [CrossRef]
  46. Chen, S.; Zhu, J.; Xie, Q.; Huang, W.; Huang, Y. Understanding airline passenger behavior through PNR, SOW and webtrends data analysis. In Proceedings of the 2015 IEEE First International Conference on Big Data Computing Service and Applications, Redwood City, CA, USA, 30 March–2 April 2015; pp. 323–328. [Google Scholar] [CrossRef]
  47. Kim, D.-Y.; Lehto, X.Y.; Morrison, A.M. Gender differences in online travel information search: Implications for marketing communications on the internet. Tour. Manag. 2007, 28, 423–433. [Google Scholar] [CrossRef]
  48. Park, S.Y.; Pan, B. Identifying the next non-stop flying market with a big data approach. Tour. Manag. 2018, 66, 411–421. [Google Scholar] [CrossRef]
  49. Karagiorgou, S.; Pfoser, D.; Skoutas, D. Geosemantic network-of-interest construction using social media data. In Proceedings of the Eighth International Conference on Geographic Information Science, Vienna, Austria, 24–26 September 2014; pp. 109–125. [Google Scholar]
  50. Kladou, S.; Mavragani, E. Assessing destination image: An online marketing approach and the case of TripAdvisor. J. Destin. Mark. Manag. 2015, 4, 187–193. [Google Scholar] [CrossRef] [Green Version]
  51. Wein, J. A Deep Dive into Ctrip And the China Online Travel Market. Available online: https://research.skift.com/reports/deep-dive-ctrip-china-online-travel-market-2017/ (accessed on 31 October 2019).
  52. Ge, J.; Gretzel, U. A new cultural revolution: Chinese consumers’ internet and social media use. In Advances in Social Media for Travel, Tourism Advances in Social Media for Travel, Tourism and Hospitality: New Perspectives, Practice and Cases; Sigala, M., Gretzel, U., Eds.; Routledge: New York, NY, USA, 2018. [Google Scholar]
  53. Shen, H.; Xing, L. Application of social media among chinese outbound tourists: Platforms and behaviors. In Advances in Hospitality and Tourism. Chinese Outbound Tourism 2.0; Li, X., Ed.; Apple Academic Press: Burlington, ON, Canada, 2016; pp. 260–271. [Google Scholar]
  54. Fugmann, R.; Aceves, B. Under control: Performing Chinese outbound tourism to germany. Tour. Plan. Dev. 2013, 10, 159–168. [Google Scholar] [CrossRef]
  55. Wu, M.-Y.; Pearce, P.L. Tourism blogging motivations. J. Travel Res. 2016, 55, 537–549. [Google Scholar] [CrossRef]
  56. Dempster, A.P.; Laird, N.M.; Rubin, D.B. Maximum likelihood from incomplete data via the EM algorithm. J. R. Stat. Soc. Ser. B 1977, 39, 1–38. [Google Scholar] [CrossRef]
  57. Swiss Federal Statistical Office (BfS). Tourist Accommodation Statistics. Available online: https://www.bfs.admin.ch/bfs/en/home/statistics/tourism/tourist-accommodation.html (accessed on 17 January 2019).
  58. Bai, B.; Jang, S.S.; Cai, L.A.; O’leary, J.T. Determinants of travel mode choice of senior travelers to the United States. J. Hosp. Leis. Mark. 2001, 8, 147–168. [Google Scholar] [CrossRef]
  59. Bilgihan, A.; Barreda, A.; Okumus, F.; Nusair, K. Consumer perception of knowledge-sharing in travel-related online social networks. Tour. Manag. 2016, 52, 287–296. [Google Scholar] [CrossRef]
  60. Juhàsz, L.; Hochmair, H. Comparing the spatial and temporal activity patterns between Snapchat, Twitter and Flickr in Florida. Giforum 2019, 1, 134–147. [Google Scholar] [CrossRef]
  61. Norman, P.; Pickering, C.M. Using volunteered geographic information to assess park visitation: Comparing three on-line platforms. Appl. Geogr. 2017, 89, 163–172. [Google Scholar] [CrossRef]
  62. Liu, X.; Li, J.J.; Yang, Y. Travel arrangement as a moderator in image–satisfaction–behavior relations. J. Vacat. Mark. 2015, 21, 225–236. [Google Scholar] [CrossRef]
Figure 1. Reverse engineered structural data model for information extraction from the Qyer weblog. Rectangles represent entity sets, including their attributes, and arrows symbolize relationship sets instantiated by references found on the website.
Ijgi 08 00493 g001
Figure 2. System architecture for data collection, consolidation and analysis.
Ijgi 08 00493 g002
Figure 3. The relative frequency of geotagged Qyer reviews (user comments) of places in Switzerland shows a long-tail distribution (n = 15,136).
Ijgi 08 00493 g003
Figure 4. Screenshot: Frequency of comments by users per point of interest visualized on an interactive map of Switzerland. The colour and size of the markers indicate the number of comments collected per POI (data: 26 February, 2012 to 2 November, 2017).
Ijgi 08 00493 g004
Figure 5. Screenshot: Frequency of comments by users in an interactive heatmap zoomed to the area of Lucerne.
Ijgi 08 00493 g005
Figure 6. The left side indicates the sampled distribution of the number of distinct places about which users posted a review, R. The right side shows the sampled distribution of the variable F, the number of followers a user has on the social medium Qyer. Most users (60%) only commented on one place in Switzerland. Also, the majority of observed users (56%) have no followers. (n = 2984).
Ijgi 08 00493 g006
Figure 7. The scatterplot on the left side shows the correlation between popularity of locations L, measured by the number of users who commented on that location, and percentage of those users who have commented on more than one place, p ( R > 1   |   L ) . The graphic on the right side visualizes the correlation between location popularity and the percentage of users commenting on location x who have followers, p ( F > 0   |   L ) . The 21 most frequently commented on places that were reviewed by at least 50 users were taken into account as data points. The likelihood of having followers ( F > 0 ) and reviewing multiple places ( R > 1 ) tends to be higher for users commenting on alternative destinations with lower number of comments.
Ijgi 08 00493 g007
Table 1. Cross-tabulation of Qyer users based on their number of followers Fi and their number of reviewed places Ri.
Ri > 1Ri = 1Σ
Fi > 05876741261
Fi = 056310701633
Σ115017442894
Table 2. Cross-tabulation of Qyer users by their membership in the focus segment S = {i | Fi > 0}∩{i | Ri > 1} and their microblogging behaviour in relation to tourism hotspots.
iS iSΣ
reviewed alternative destinations4779821459
reviewed only hotspots11013251435
Σ58723072894

