1. Introduction
Autonomous vehicles have attracted significant research attention, with the research led by Google and global automotive companies such as Uber, Tesla, and Audi. Currently, semi-autonomous Level 3 automobiles can be purchased. This level, which has been set by the American Society of Automotive Engineers (SAE), allows drivers to enjoy semi-autonomous driving on specific roads, while maintaining a frontal gaze. For autonomous driving, a control system that supports a high-precision lane-level road map is required to monitor the operation status of autonomous vehicles in the research stage. Lane recognition using sensors, such as cameras, can be affected by various factors, such as climate and lighting, and requires considerable manual work; research on automating this process is ongoing. The demand for high-precision maps is increasing, for creating road maps not only from pointer clouds [
1,
2,
3], but also from images acquired through UAVs [
4].
Vector map-based systems [
5,
6,
7] and tile map-based systems [
8,
9,
10], such as Google Maps [
11] and Map X [
12], have been developed to monitor vehicle position. Studies [
13,
14] on creating lane-level maps for vehicle navigation and using high-precision maps for vehicle self-localization have also been conducted. However, the design of existing 19th-level Google and other map services has limitations when using the map as a high-resolution precision display for driving vehicle position at the lane-level. Moreover, an ideal map should provide information on roads, autonomous vehicles, and Internet of Things (IOT) facilities that support autonomous driving.
The purpose of this study was to construct a high-precision 20th-level map for autonomous driving, to test the accuracy of the high-precision map through actual operation and monitoring, and to design a 20th-level map suitable for controlling autonomous vehicles. In addition, this study aimed to review state-of-the-art technologies necessary for automating the construction of high-precision maps as the test bed expands. This study was part of the “Building a Testbed for Pilot Operation of Autonomous Vehicles” project. The study site was Gyeonggi Province, the most populous municipality in Korea.
This paper reports the definition and design process of the schema and the construction and editing of a high-precision digital map and unmanned aerial vehicle (UAV) orthoimages that constitute the map. Moreover, the accuracy of the map is evaluated, and it is verified whether a lane error occurs during the operation through the position data of the autonomous vehicles.
The rest of this paper is organized as follows.
Section 2 presents a literature survey related to the monitoring system of driving vehicles, accuracy of maps, and automation technology of high-precision maps.
Section 3 explains the data building process of the high-precision digital map and UAV orthoimages.
Section 4 describes the base map design. In
Section 5, a method to measure the accuracy of the high-precision map is presented, including the measurement results, and the lane errors in autonomous vehicles are verified through an built-in control system. Finally,
Section 6 discusses the implications of the findings of the study and plans for future research.
2. Literature Survey
This section discusses previous studies related to the monitoring system of driving vehicles, accuracy of maps, and road marking extraction.
2.1. System and Map for Monitoring Vehicles
In the early 1990s, GPS (Global Positioning System)- and GSM (Global System for Mobile Communications)-based vehicle monitoring systems were used to prevent theft and fraud of expensive cars. At the time, GPS had a precision of up to 10 m for precise positioning service (PPS) and up to 30 m for standard positioning service (SPS) [
15]. An accuracy of 30 m was sufficient to achieve the objectives, because the focus was on the approximate location of the vehicles and not on their control.
These vehicle monitoring systems have been developed as a system that can determine the real-time location of a moving vehicle, such as shuttles [
6,
16], or observe the movement trajectory through a PC environment [
5,
10,
17] or the Web [
8,
9,
18,
19]. Moreover, they have been employed for urban traffic control, road engineering survey, and city control survey [
16,
17,
18]. These were implemented as a system [
8,
9,
18,
19] using Google Maps and a system [
5,
10,
17] using Map X, rather than creating a map directly. These studies were limited to the implementation of a system that simply displays the GPS position in the system, with no study on location accuracy. GPS has a problem in that the location accuracy of the vehicles is poor because of the reflection of radio waves from buildings and forests, and a map matching study [
20,
21,
22] was conducted to minimize such errors.
2.2. Accuracy of the Generated Digital Map
Generally, the accuracy of precision maps depends on the accuracy of real time-kinematic (RTK). The error in the RTK position solution can be predicted using the dilution of precision (DOP) [
23]. The DOP is a numerical representation of the expected position error due to the geometric constellation of the satellites. However, the DOP only indicates the level of expected position error, not the actual position error. The position error can be represented using the coordinate quality (CQ), which converts the DOP into meters [
24,
25]. CQ is the DOP matrix multiplied by the root mean square (RMS) of the range measurement error for each satellite. At this time, as the RMS cannot be calculated from the actual GPS receiver, the standard deviation is obtained and multiplied instead. Therefore, CQ does not include the bias components of the position error. However, normally, with a CQ of 0.1 or less, bias errors are rarely induced within a few centimeters. Therefore, we can assume that the RTK position solution is accurate when the CQ is small enough.
In this paper, the accuracy of the generated digital map was verified using the position information of the RTK. In a section with a CQ of 0.1 or less, the distance between the location of the RTK and the lane within the precision map was extracted to calculate the lateral position error. Assuming that the RTK position solution is correct, the calculated lateral position error can be considered an error in the precision map.
2.3. Road Marking Extraction from Three-Dimensional (3D) Mobile Laser Scanning
The technology of extracting road markings from point cloud data acquired through a mobile laser scanner (MLS) has been widely used in road management, providing improved navigation information for autonomous vehicles. However, the road marking extraction algorithm using statistical techniques has poor performance, because of subject distortion due to the difference in the materials, and roughness due to the curvature of the road surface. To solve this problem, studies are being conducted [
26,
27,
28] on automatic lane extraction using point clouds, including the use of AI (Artificial Intelligence) technology.
Wen et al. [
29] proposed a method consisting of three steps: Road sign detection, classification, and completion using deep learning. The road marking extraction step was simplified to a binary classification problem, which was divided into road and non-road marking points. Subsequently, they developed a road sign detection algorithm. To give robustness to the difference in illuminance, point cloud data collected based on various intensities were used as learning data. In the classification stage, multi-sized clustering and CNN (Convolutional Neural Network)-based classification techniques were developed to detect large road markings, such as lanes and crosswalks, and remaining small road markings. In the completion stage, they proposed a combination of deep learning-based and context-based methods to overcome the complexity of rule-based algorithms and limitations in actual application. The deep learning-based method uses a conditional generative adversarial network (cGAN) to infer complete road markings from incomplete road markings. Through experiments, the precision, recall, and F1-score for road marking extraction were 95.97, 87.52, and 91.55%, respectively, and the error rate of classification was 4.07%.
3. Creation of Base Map Data
Creating most base maps requires high-precision digital mapping. The maps themselves are based on a general map and orthoimages taken by a drone. This section describes the construction of high-precision digital maps (digital topographic maps) and orthoimages, which are the basic data for map creation, before explaining the map design and schema definition.
3.1. Creation of a High-Precision Digital Map
Precise maps for autonomous vehicles are being built by leading map builders. A precise map has its own structure that defines road information necessary for autonomous driving. The HERE map [
30] describes the road map, road structure, and spatial composition based on the existing road centerline concept. The TomTom map [
31] also defines information on the structure and composition of roads, lane markings, traffic signs, and surrounding facilities based on the concept of lanes. It also defines the properties of RoadDNA. In Korea, the National Geographic Information Institute is constructing a map with the precision required for autonomous driving. A high-precision digital map in this research was constructed following the guidelines of the National Geographical Institute’s precision map [
32].
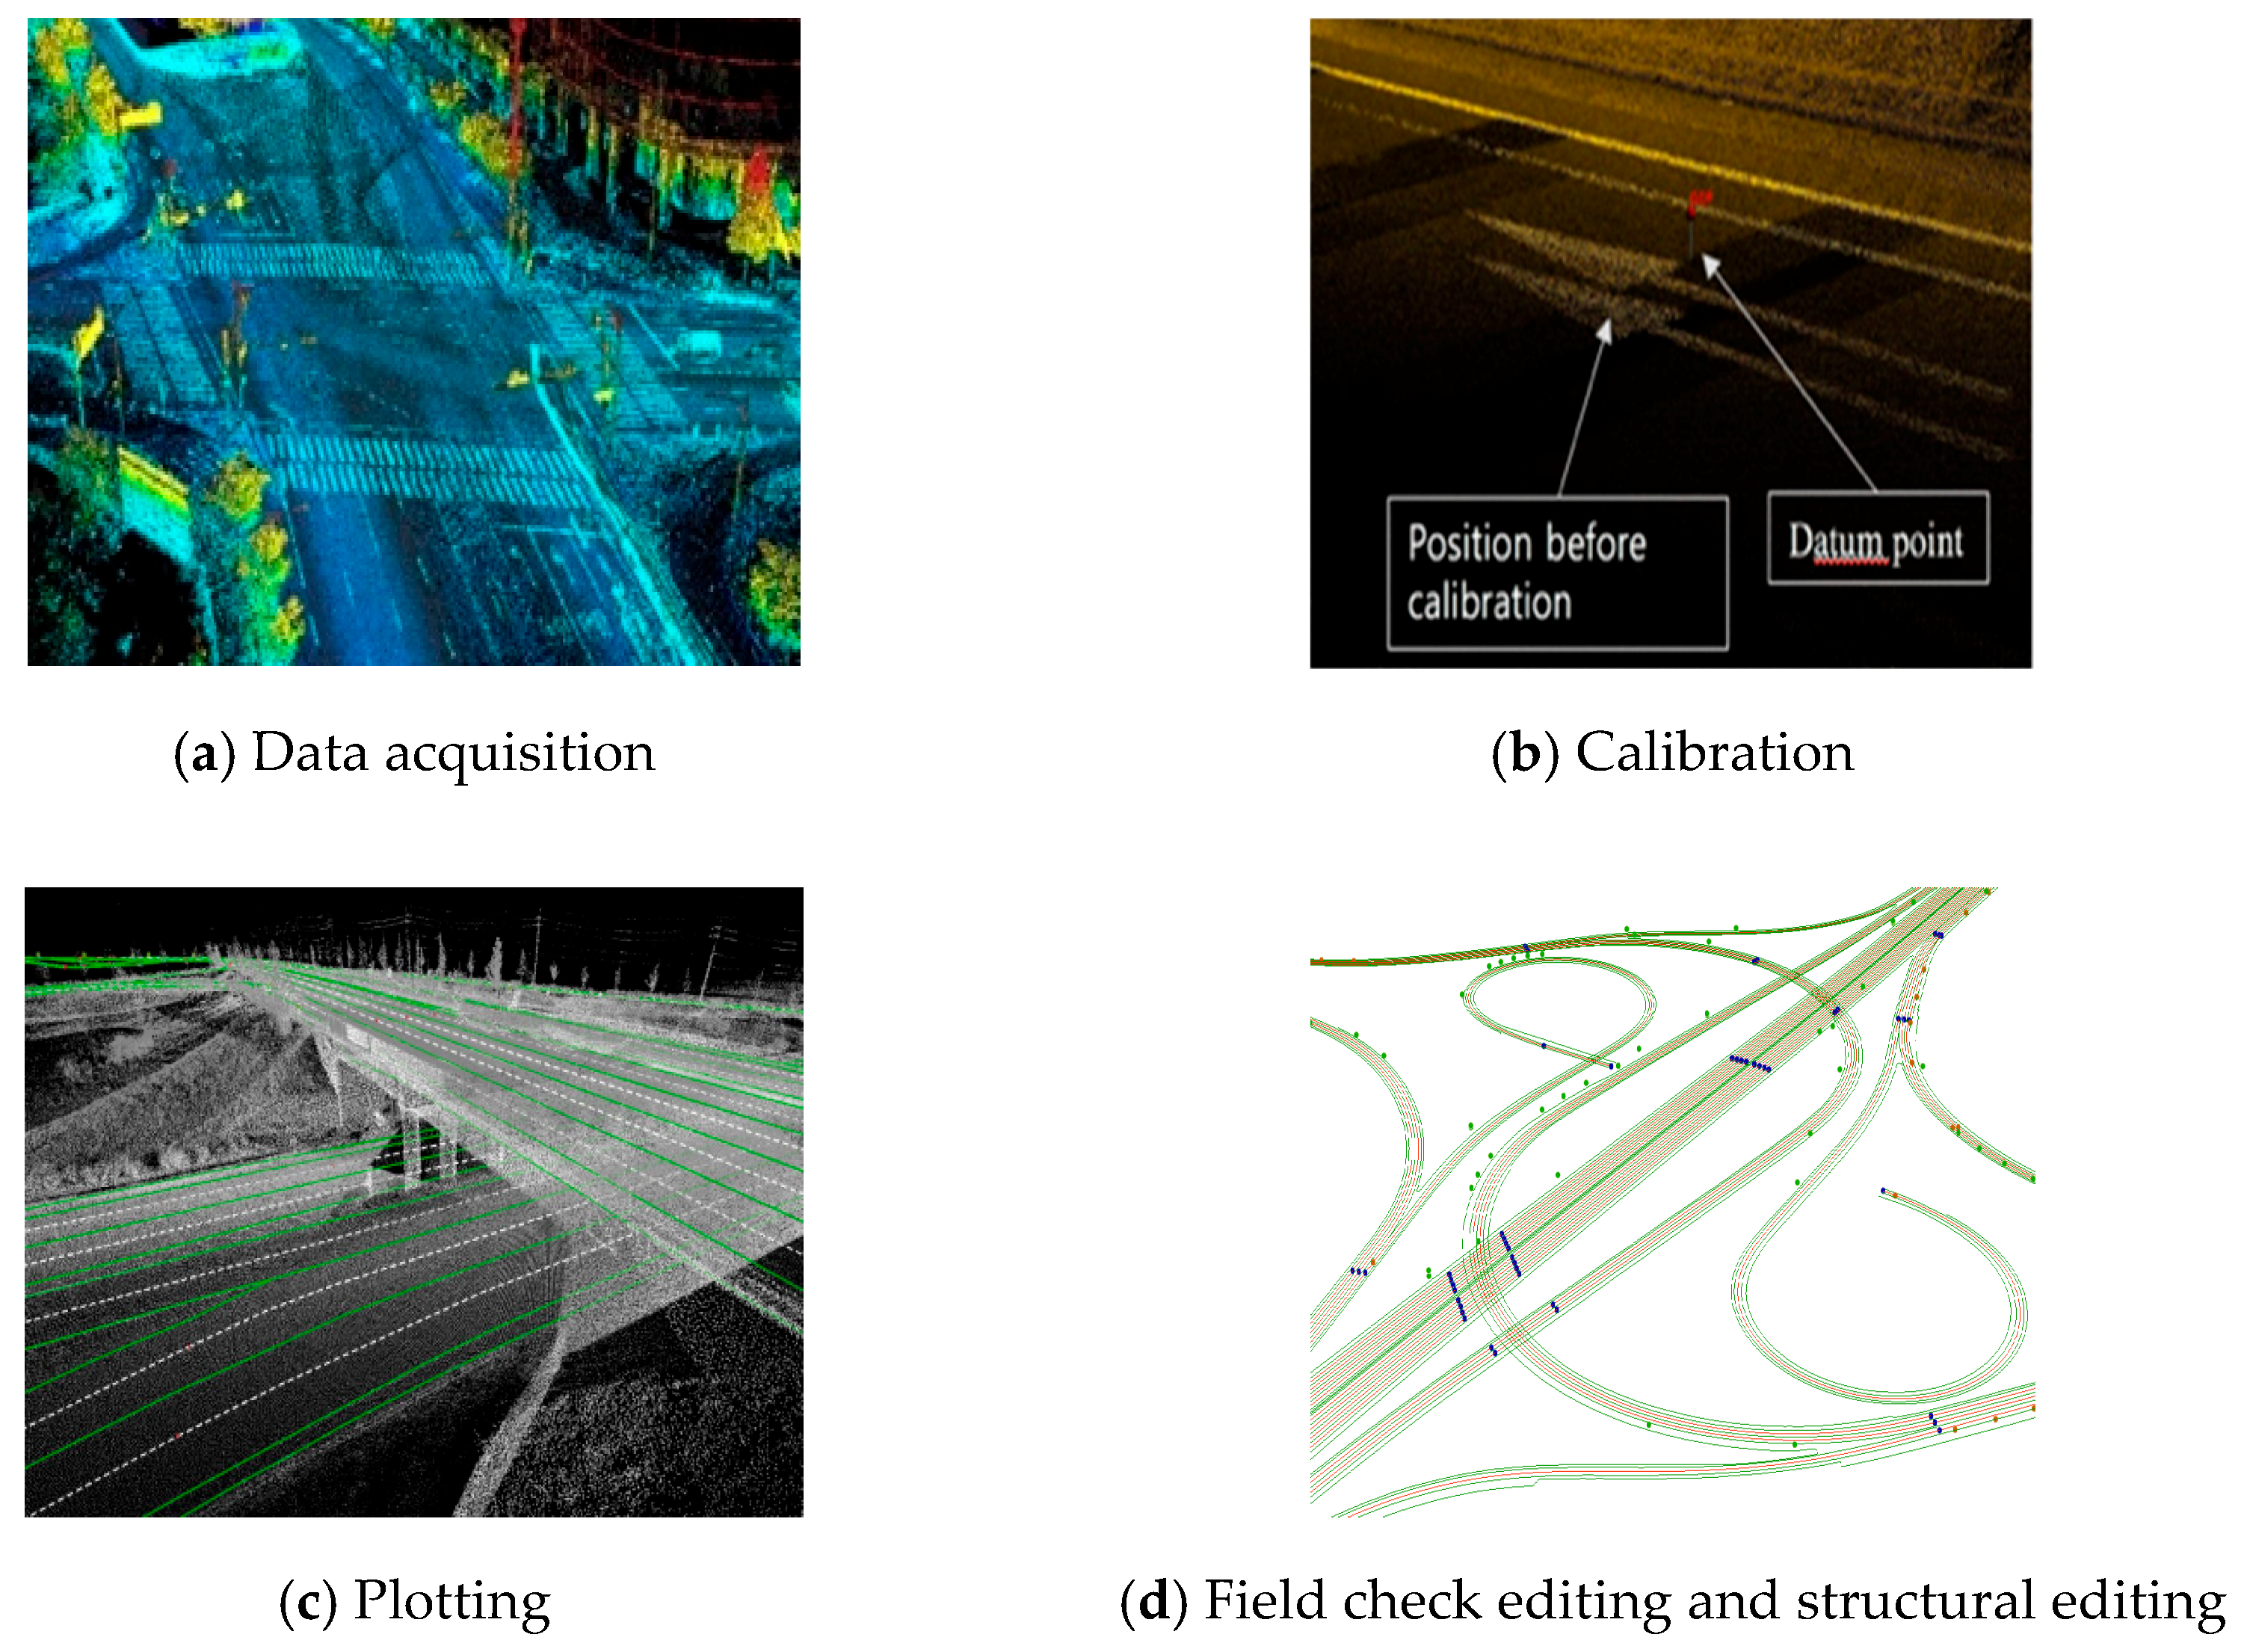
The high-precision digital map is created using the point cloud data, shown in
Figure 1a, collected from the Global Navigation Satellite System (GNSS), inertial navigation unit (INS), and laser (Lidar) sensors. In general, urban regions (high buildings) are GPS shadow areas, with relatively large errors, as shown in
Figure 1b. These errors were reduced mainly by post-processing the mobile mapping system (MMS)-measured Lidar data and GPS/INS data using the ground control point (GCP) as the reference point. In the plotting process, shown in
Figure 1c, the data were loaded in a point cloud plotting instrument. With this instrument, lanes were extracted in lines using the solid dotted car lanes as a reference, and the center point of the traffic markings was extracted from the dotted data. Finally, in
Figure 1d, the map was completed by field check editing, which involves extracting the objects and editing and correcting the entered data, and structural editing, which involves entering the attribute information.
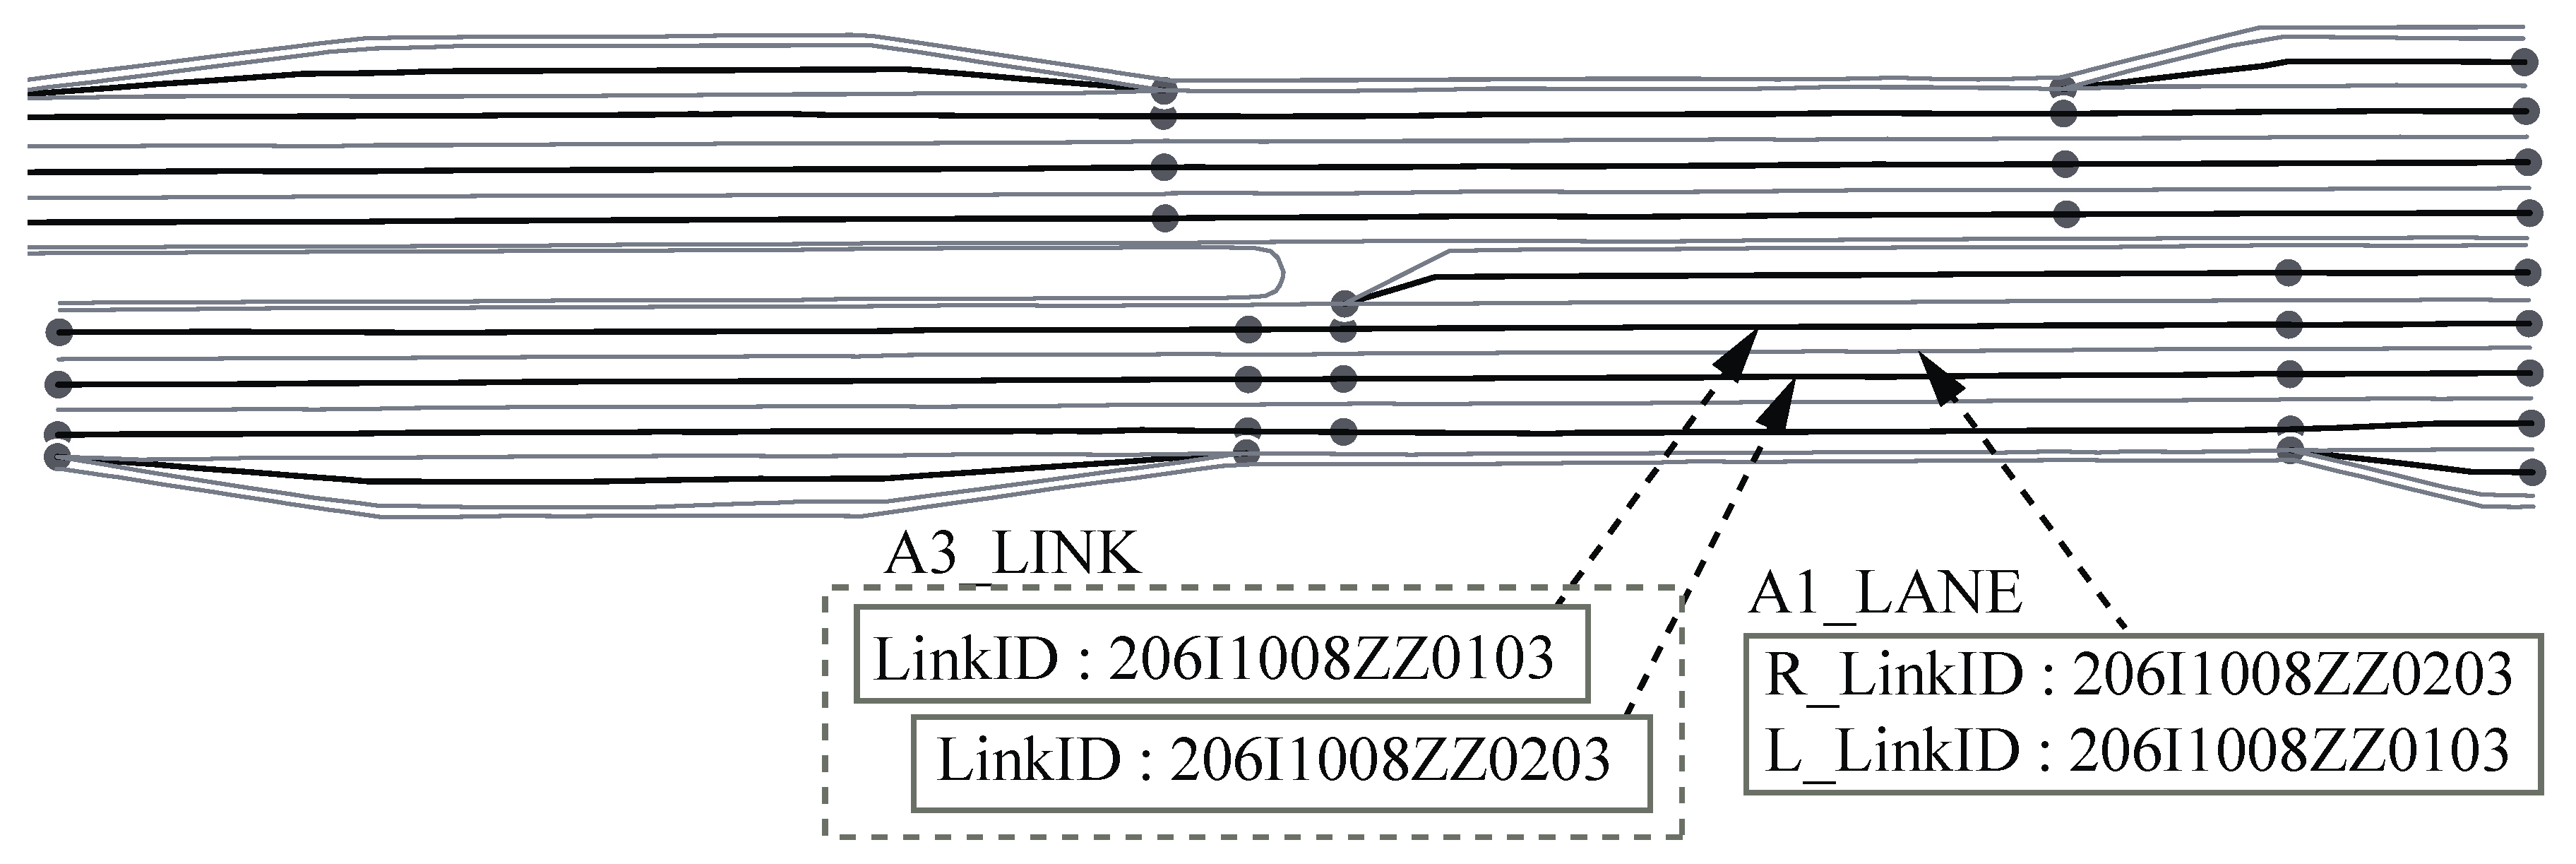
Table 1 lists the 11 layers involved in constructing the high-precision map for autonomous vehicles. The items include road markings (e.g., lane markings), road facilities, road safety markings, road stripes signals, no-autonomous driving zones, and roadside facilities. Different layers have a link relationship through the LinkID property of A3_LINK layer as shown in
Figure 2.
3.2. Creation of Orthoimages
3.2.1. Orthoimage Shooting
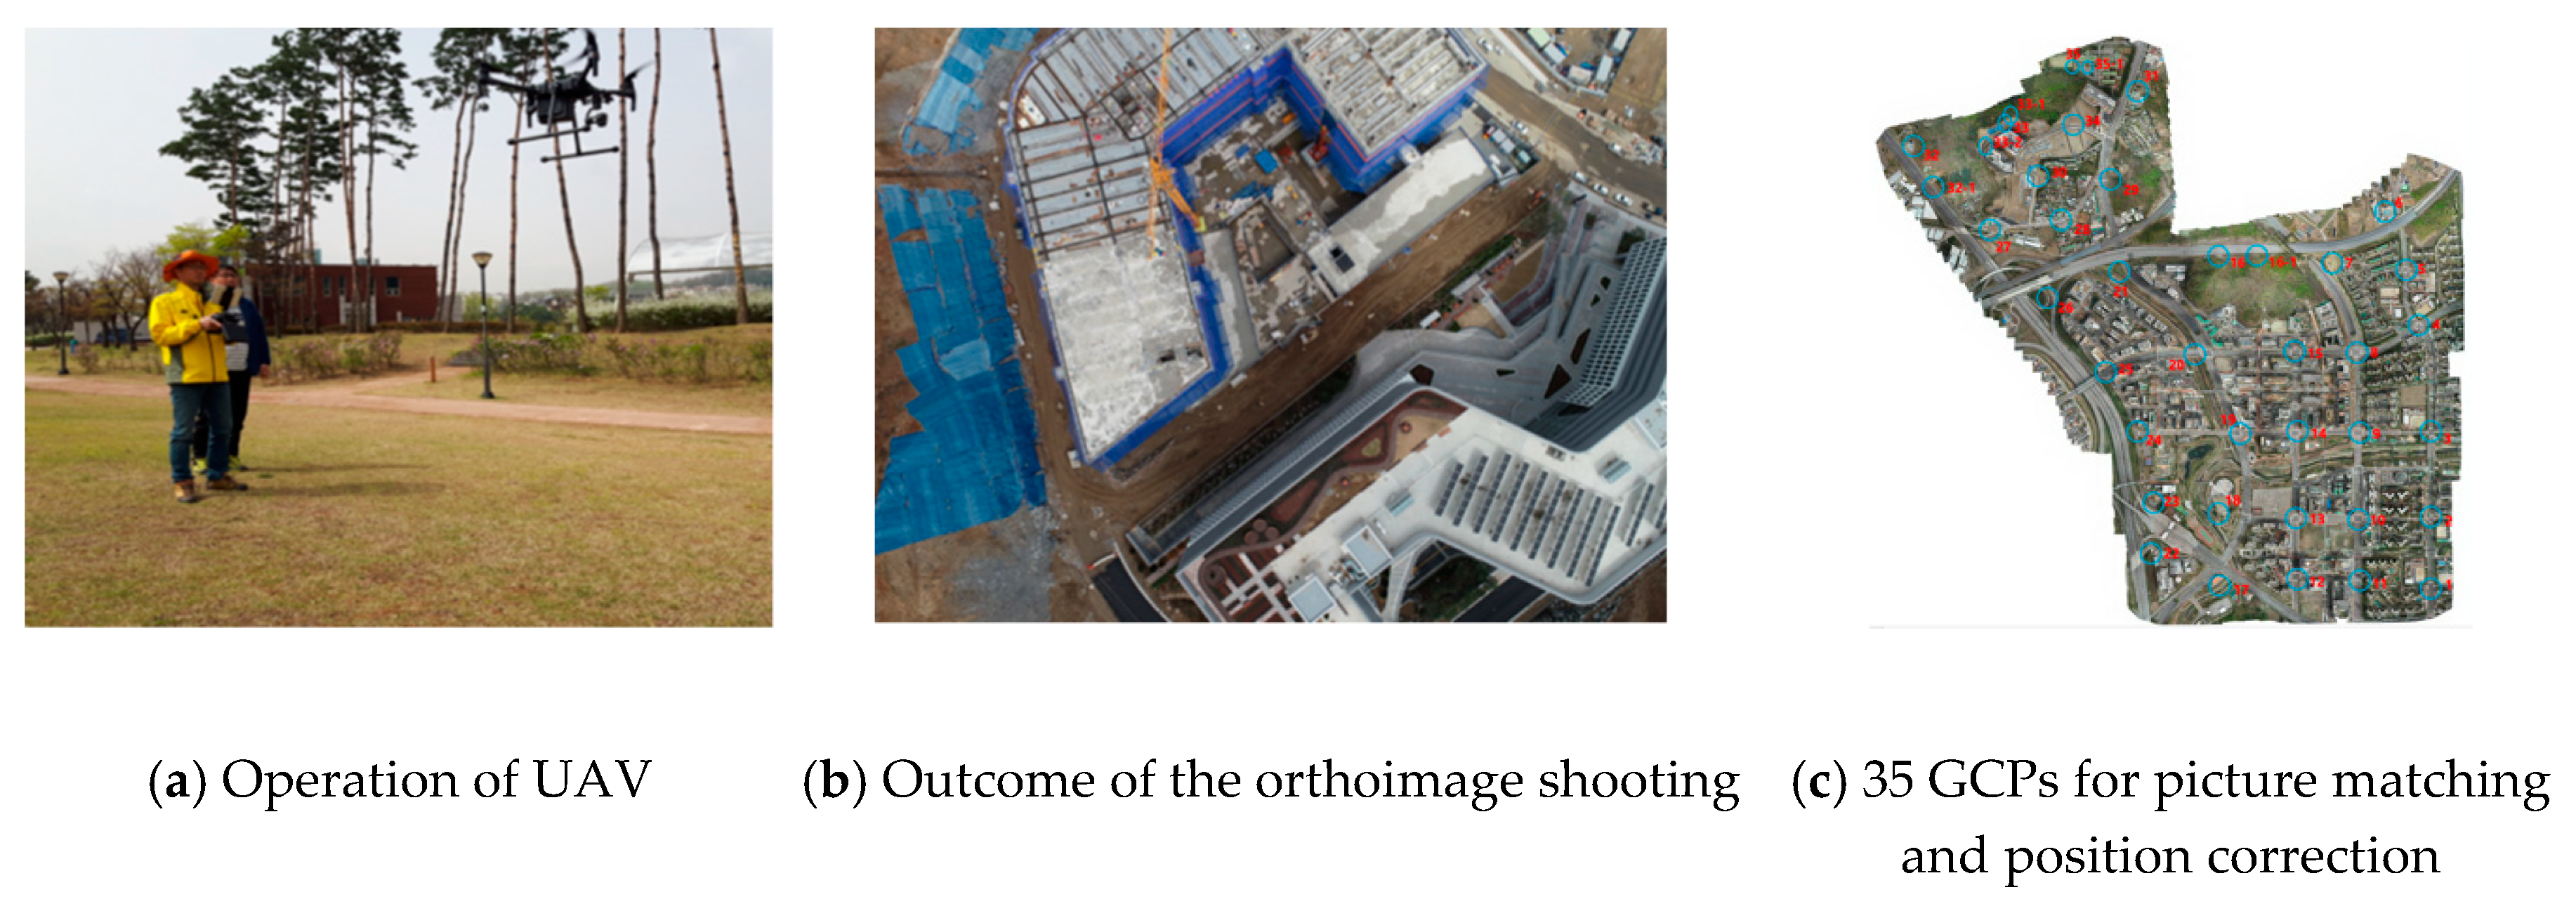
The orthoimages were taken using a rotor UAV (DJI matrice 210 model) equipped with a 2000-pixel camera(zenmuse x4s) and an RTK system.
The 35 GCPs, as shown in
Figure 3c, were installed on the ground for picture matching and position correction. The flight altitude was maintained below 150 m, and the flight speed was maintained at 18 m/s.
Figure 3a shows the operation of the UAV.
Figure 3b shows the results.
3.2.2. Orthoimage Editing
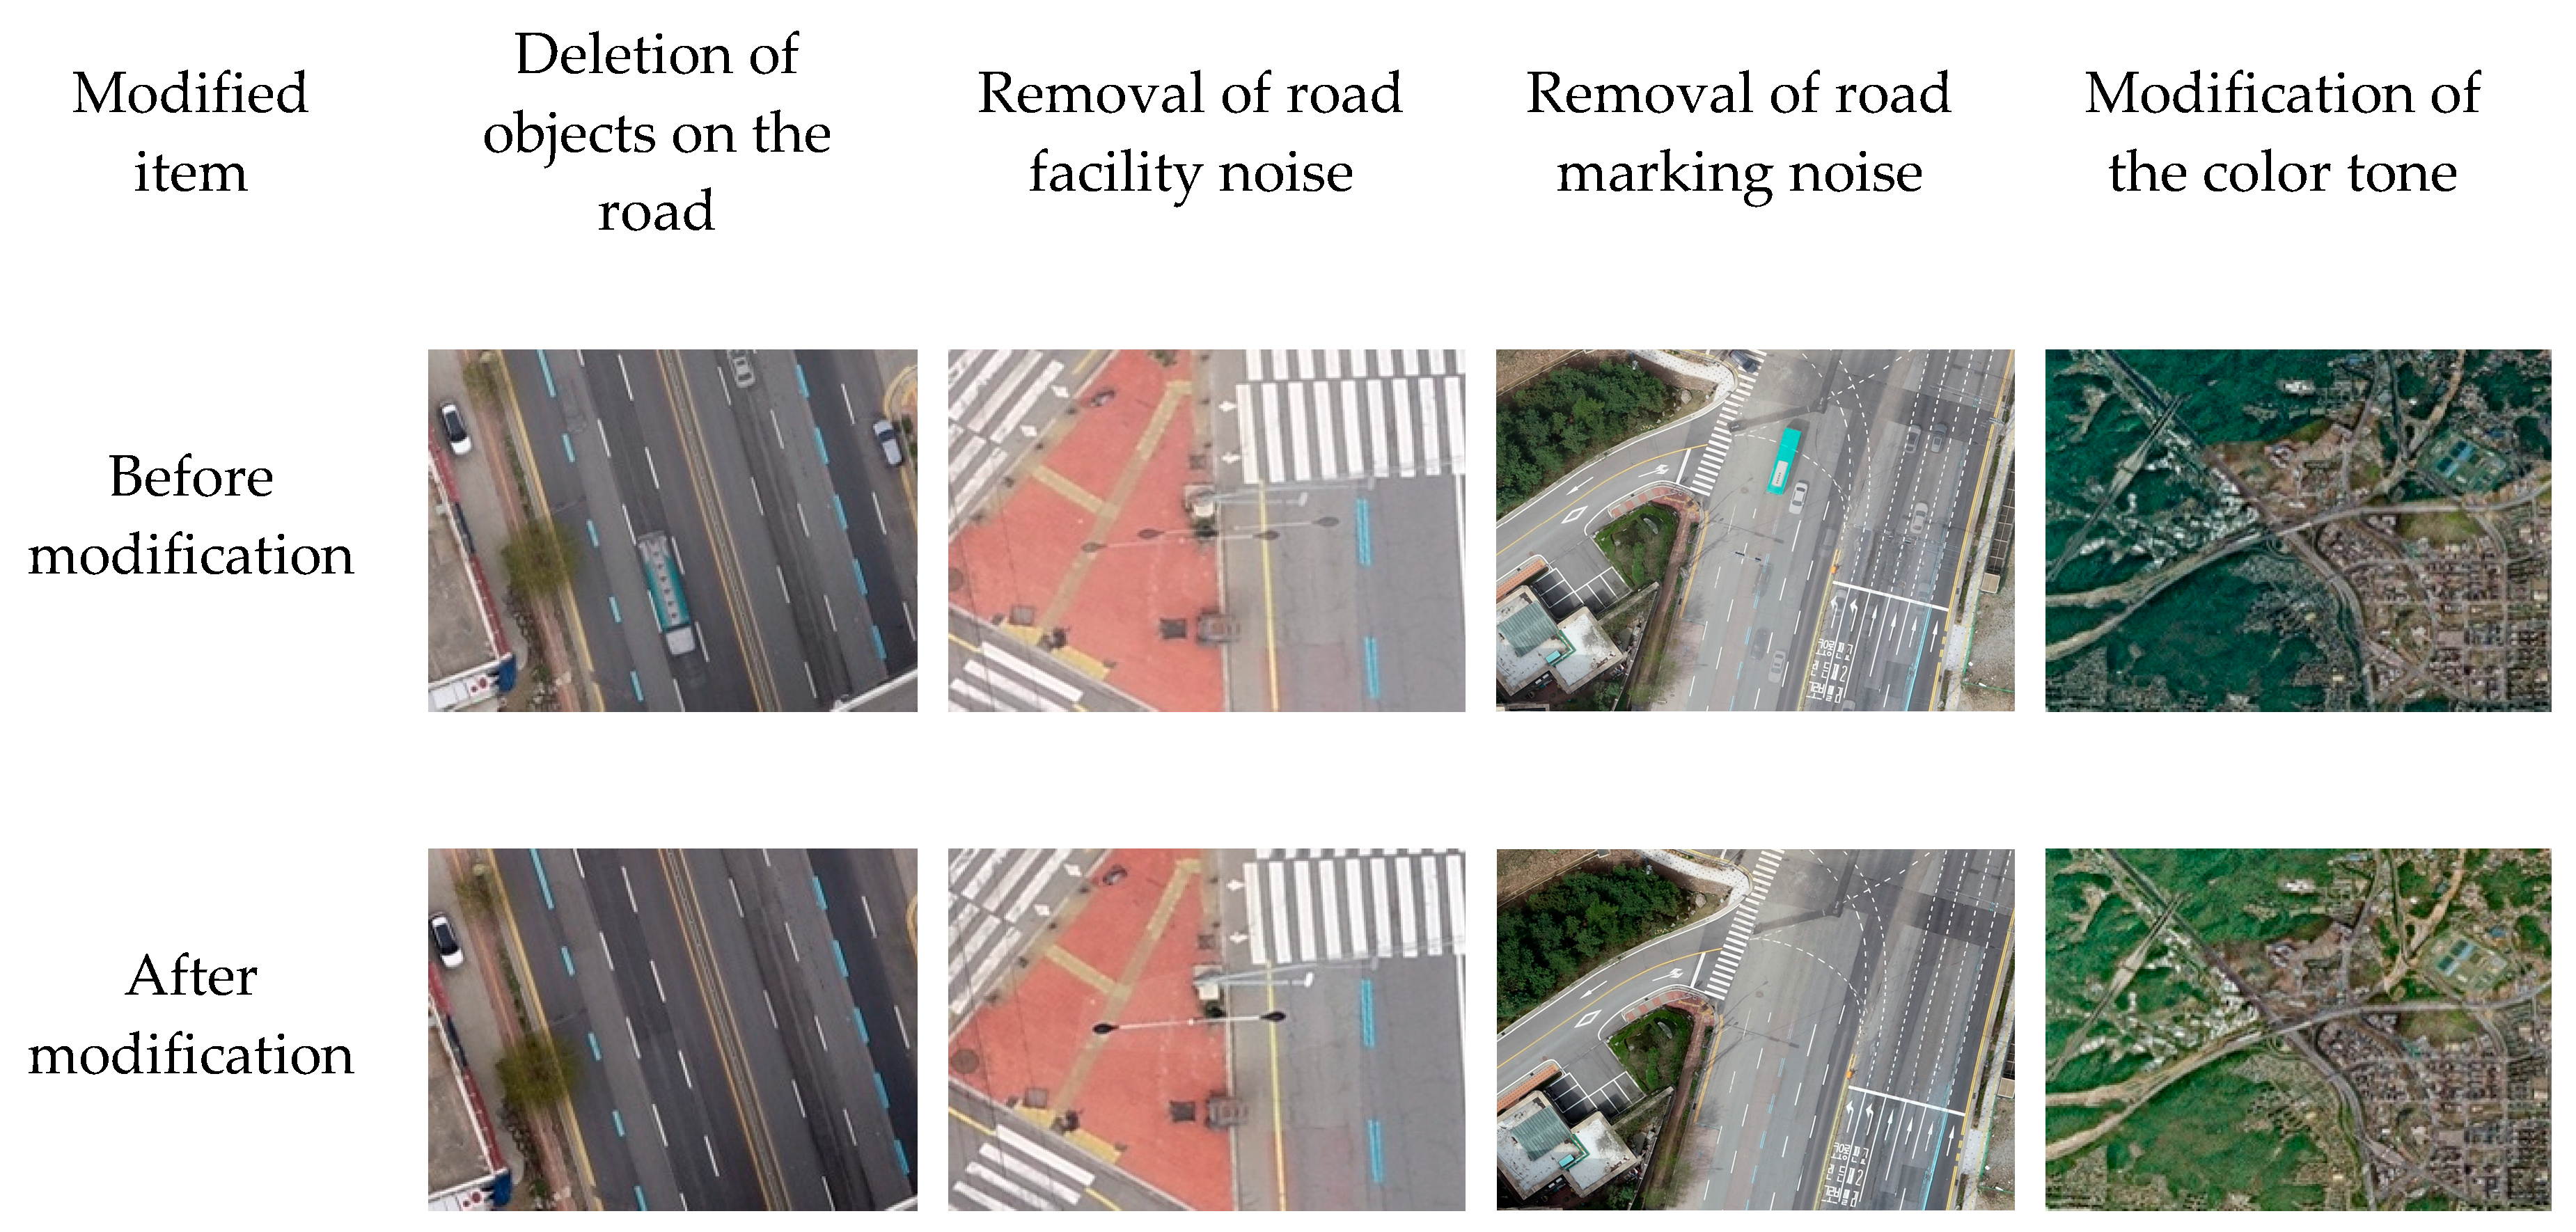
A tile map was created from 15 to 20 levels in the previously created orthoimages using ArcGIS Desktop, and it was loaded into the monitoring system. Various problems occurred when magnifying the 4.8 cm image to the 20th level. These included overlapping of running cars and lanes, noise from road facilities due to different shooting angles, and differences in color tone with the 1:5000 map in regions other than the shooting target. In particular, the overlapping of cars and lanes caused visual inconvenience when monitoring the autonomous vehicles. Therefore, the overlapped vehicles and lanes were manually deleted from the 2840 individual images before matching. Finally, the images matched with Pix4d were corrected, as shown in
Figure 4.
4. Base Map Design
This chapter explains the cycle of the base map that constitutes the monitoring system, including the definition of the dissemination layer used in the design of the base map. A literature review was conducted, and Google Maps, the Korean national map platform Baro e-map [
33], and maps accessed via representative Korean portal sites [
34,
35] were analyzed. The maps showed little difference in terms of their design and schema. Currently, the information provided by the national and local traffic monitoring systems in Korea is based on web cam maps; no map has been specifically designed for traffic monitoring. The proposed design utilizes the Baro e-map, which has no restrictions on reuse. Significant differences in the map design and cycle would confuse users. Therefore, the existing schema was modified to suit autonomous vehicle monitoring, and the 20-level schema and design that are not included in the existing schema were added.
4.1. Definition of Dissemination Level Stage
In terms of the zoom-in/zoom-out level of the high-precision digital map, Web Map Service (WMS) levels were used. Considering the project coverage, the dataset was built in six stages to ensure that the map was properly expressed at 15–20 levels, as listed in
Table 2. The dissemination cycle was distinguished between a fixed cycle and a general cycle. The dissemination in each level, labeling treatment, and icon insertion was set considering the cases of fixed dissemination at all levels or the dissemination at a certain level.
4.2. Detailed Editing of High-Precision Map
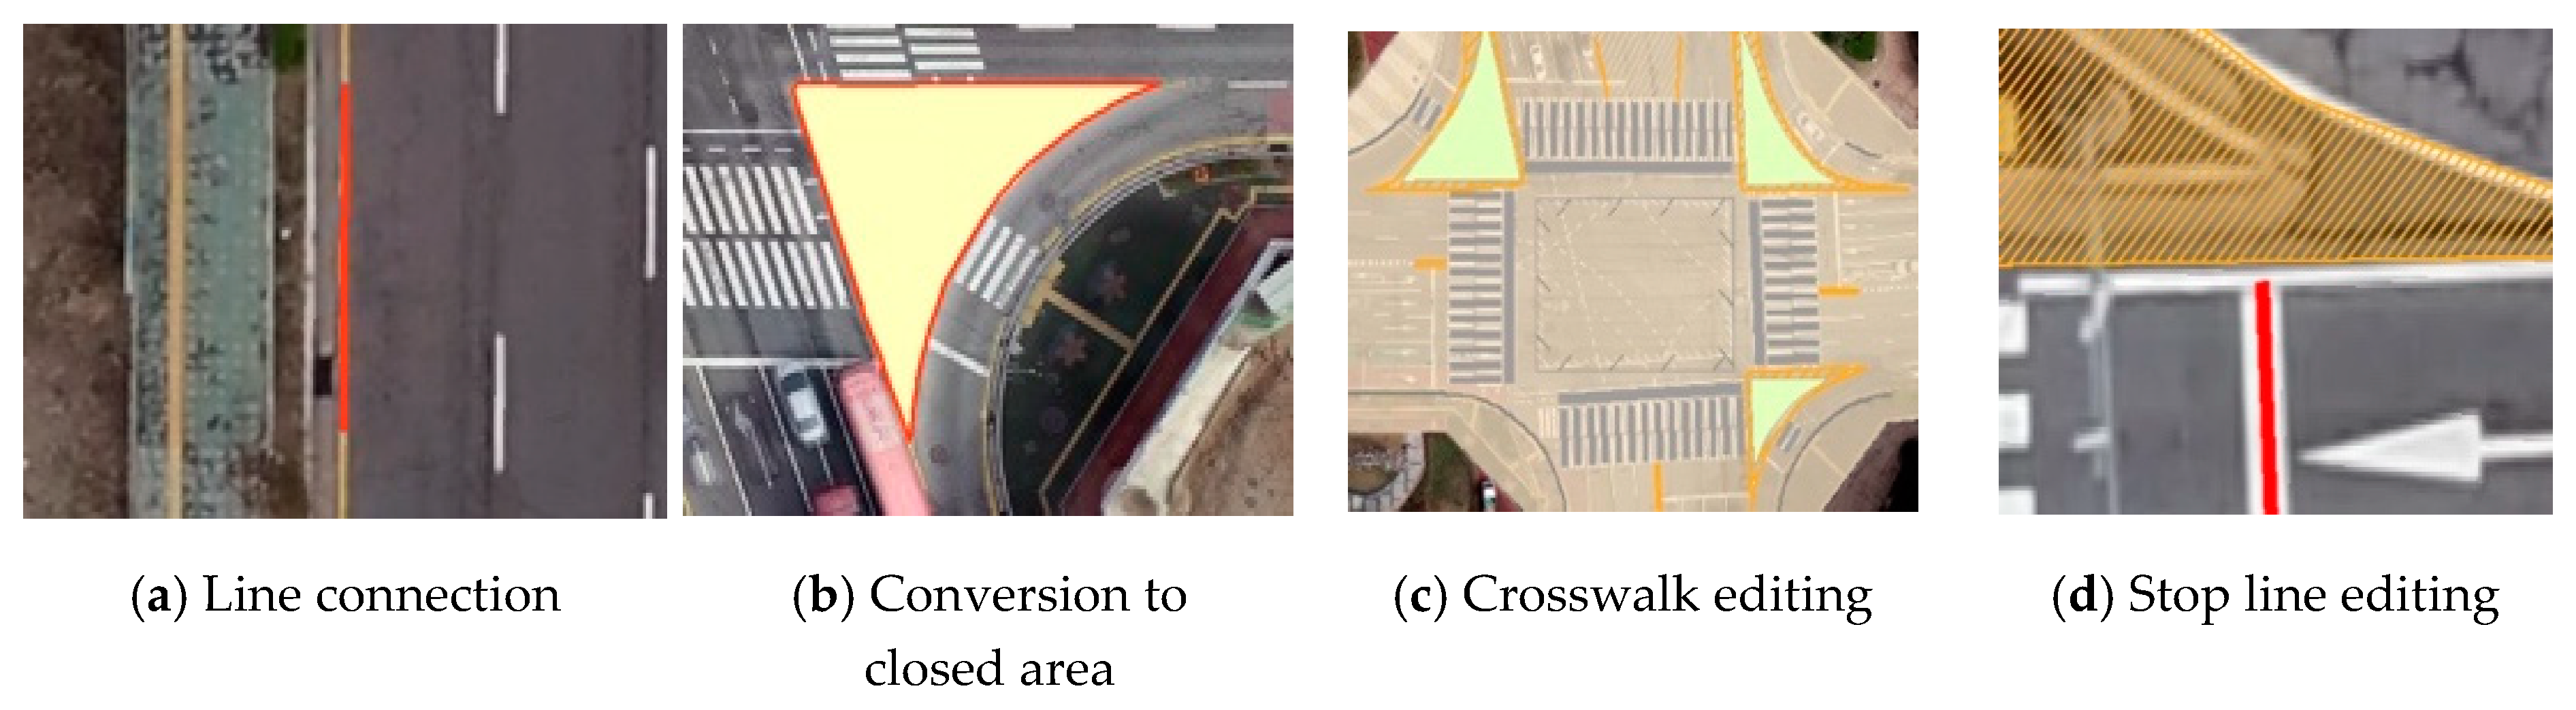
As shown in
Figure 5, additional editing of the high-precision digital map described in the previous chapter was conducted to use it as a tile map for autonomous vehicle monitoring. For a smooth linear design pattern, the disconnected lines were connected. When connecting the lines, the actual appearance of the lines was used, because the meanings of the lines differ according to their shape, color, and type (i.e., double or single). Safety zones, green zones, traffic islands, and concrete curbs were depicted as closed areas. Crosswalks were edited in a rectangular shape and made to replicate those in the study area. Finally, duplication removal and line connection editing were applied to the stop lines, regardless of the type of stop line (signal stop line or crosswalk stop line). The endpoints of the stop lines were edited such that they touched the neighboring lane.
4.3. Design of Tile Map
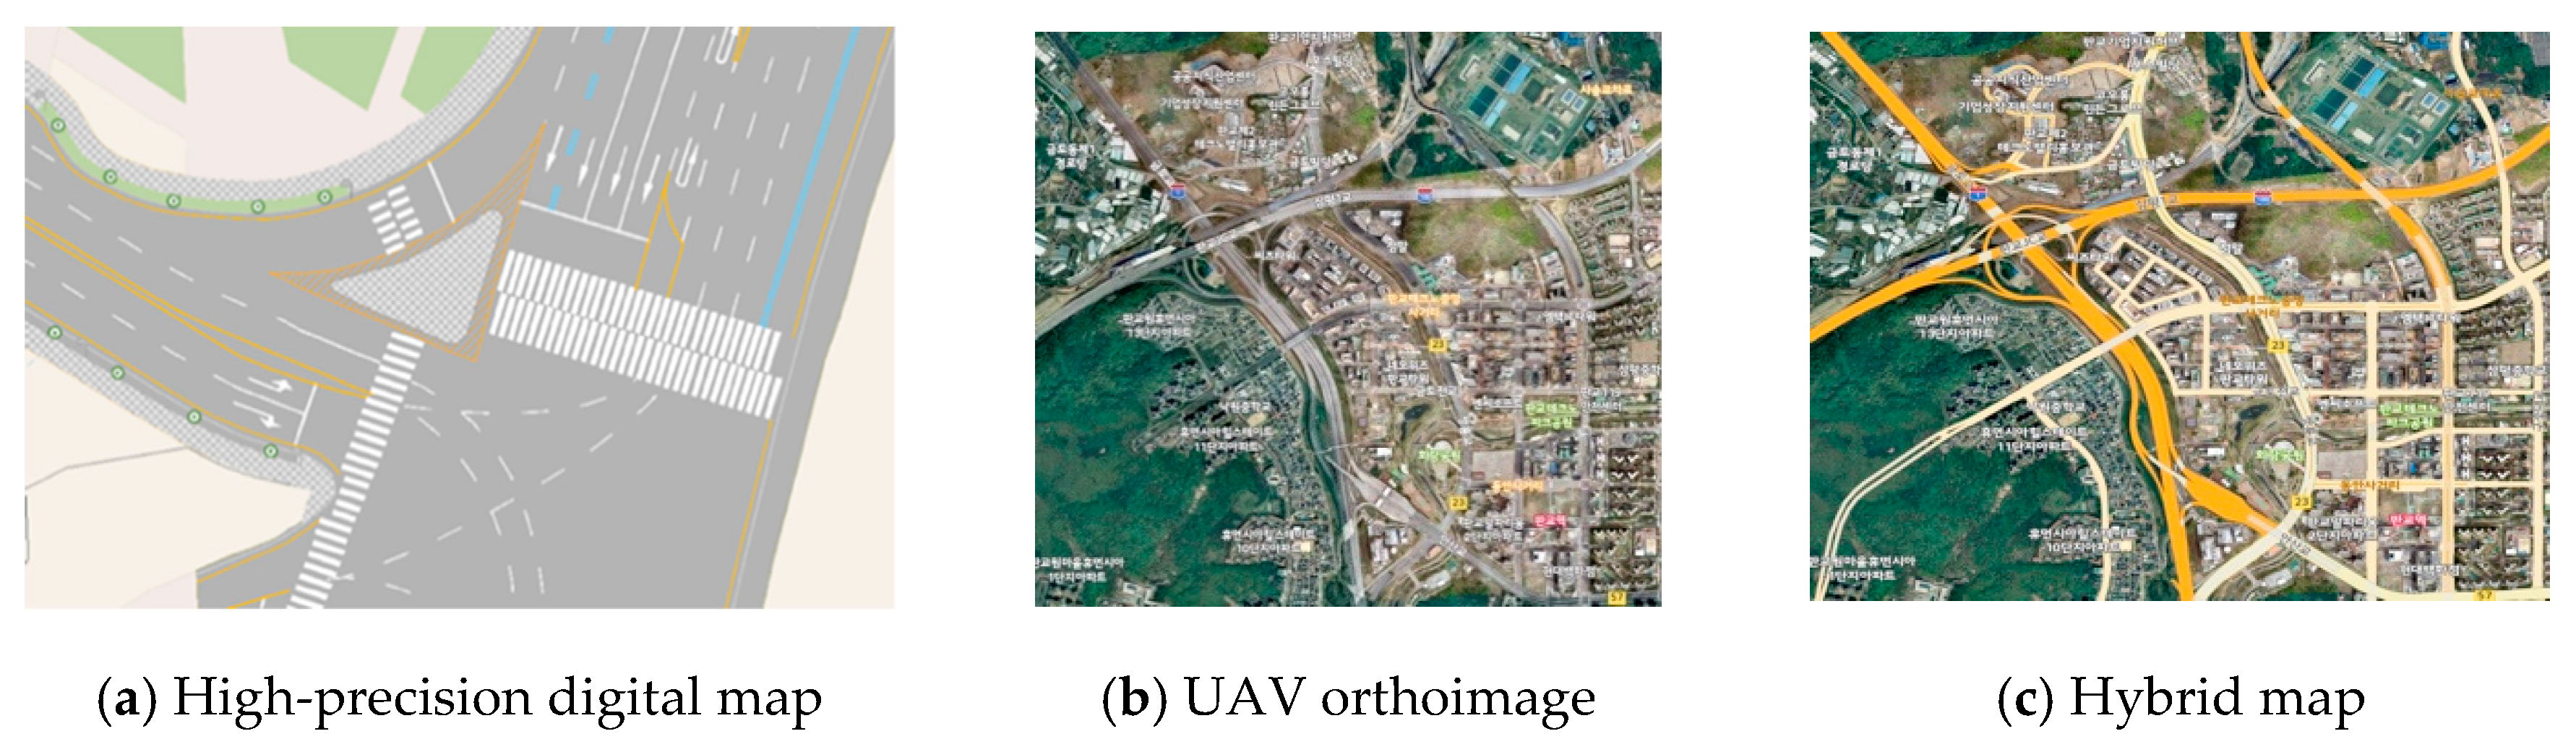
Similar to the existing map, the base map in this study was created using a digital map and orthoimages. In addition, a hybrid type of base map was designed that combined the advantages of the high-precision digital maps and orthoimages.
Figure 6 shows examples of three types of base maps. An orthoimage has an advantage in that it can realistically provide information about the area surrounding the roads. However, it gives rise to visual discomfort when providing information of 20-level high-resolution because of traces of roadworks and deleted lanes, even after removing noise by editing the road images. To solve this problem, a hybrid map was created, where the road part was inputted as high-precision digital data, and the surrounding area was built in an orthoimage.
4.4. Base Map Design and Tile Map Performance
In this study, the schema and design of the base map were based on the Baro e-map. As listed in
Table 3, 84 designs were newly added for monitoring the autonomous vehicles. The following aspects were considered in the design: Synchronization with topography in the study area, delivery of monitoring information with intuitive design, and user readability based on the size of the monitoring system image.
Table 4 lists the performance results of the tile map of each base map. The high-precision digital map, hybrid map, and orthoimage are composed of 83, 38, and 8 layers, respectively.
Table 5 gives an example of the composition of the layers of the high-precision digital map. The map tile service was built in compliance with OGC 07-057r7 [
36].
5. Precision Verification for the High-Precision Digital Map
In the previous sections, we explained the process of acquiring map data and designing the map. In this section, the accuracy of the map is evaluated to check whether lane-level control is possible. The lane error is verified through the location of the vehicle using RTK and INS.
5.1. Precision Measurement of High-Precision Maps
In this study, the accuracy of the map was verified through the Korea Testing Laboratory (KTL), which is a government certification organization. For the verification method, after selecting four street lamps, as shown in
Figure 7a, on the road, we measured the outline of the column using a laser tracker (Leica/AT401), as shown in
Figure 7b, and compared it with the distance measured using the laser distance sensor of the MMS vehicle.
Table 6 lists the measured distances between the four streetlights obtained using the laser tracker.
Table 7 lists the distances of the streetlights on the map drawn to the Lidar points of the MMS vehicle.
Table 8 lists the difference between the two distances. The maximum distance deviation was measured to be ±81.95 mm. This result satisfies the maximum deviation (±100 mm) of the precision map.
5.2. Lane Error Verification
The maps were then loaded into the monitoring system of an autonomous vehicle. As shown in
Figure 8, the location of the autonomous vehicle, point of interest (POI), information about IOT sensors on the road, and up-to-date information on traffic lights were collected during autonomous driving on a real road.
The accuracy of the high-precision digital map was verified using the vehicle trajectory. The vehicle trajectory was obtained from GPS/INS, and the GPS/INS used was Ekinox2-D. The RTK/INS mode of Ekinox2-D has an accuracy of within 20 cm when the outage duration is 16 s [
37].
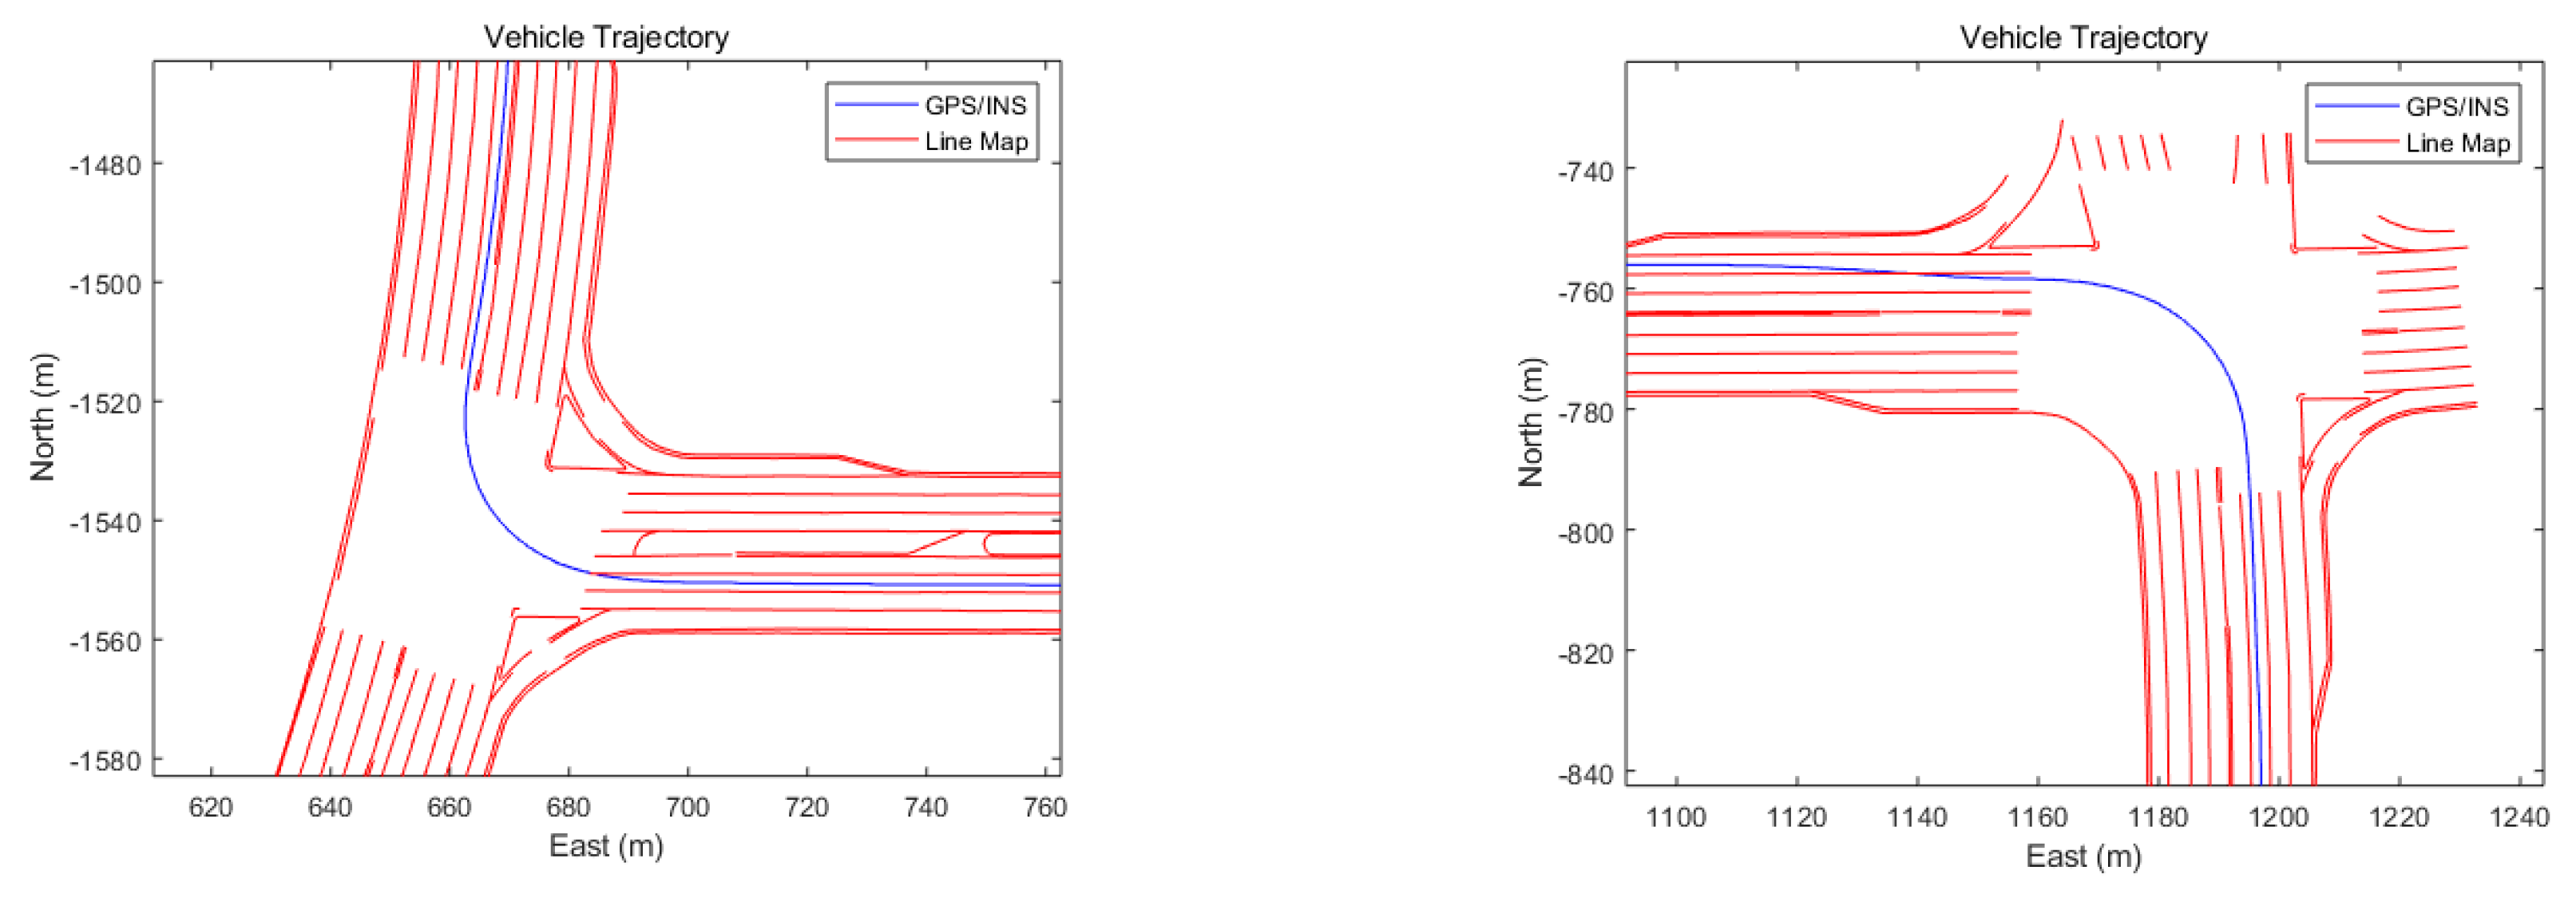
Figure 9 shows the RTK/INS position projected onto a high-precision digital map. The RTK/INS trajectory can be well observed at the center of both the lanes. During the driving test, the vehicle traveled along the center of the two lanes.
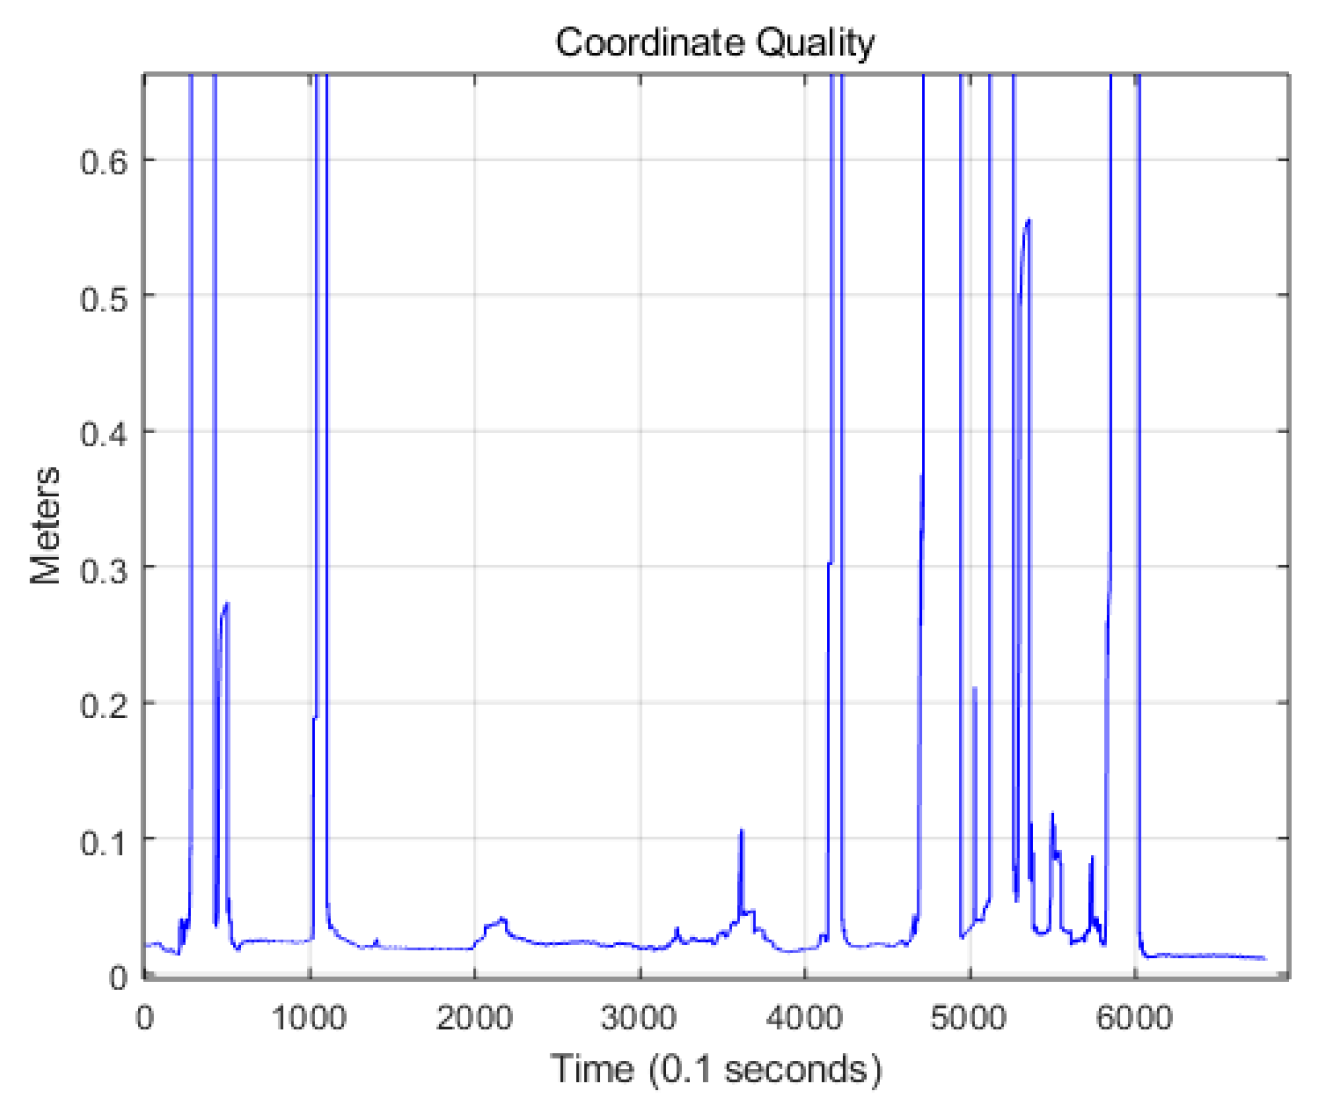
Figure 10 shows the CQ for the RTK/INS position. CQ is an index indicating the precision of the GPS position [
24,
25]. Generally, when CQ is less than 0.1, the RTK position solution is mostly a fixed solution. The accuracy of the fixed solution is within 10 cm [
38,
39]. Therefore, when CQ is less than 0.1, the RTK position accuracy can be less than 10 cm. As the outage duration of the RTK is within 10 s in most cases, the position accuracy for the RTK/INS is within 30 cm in most sections.
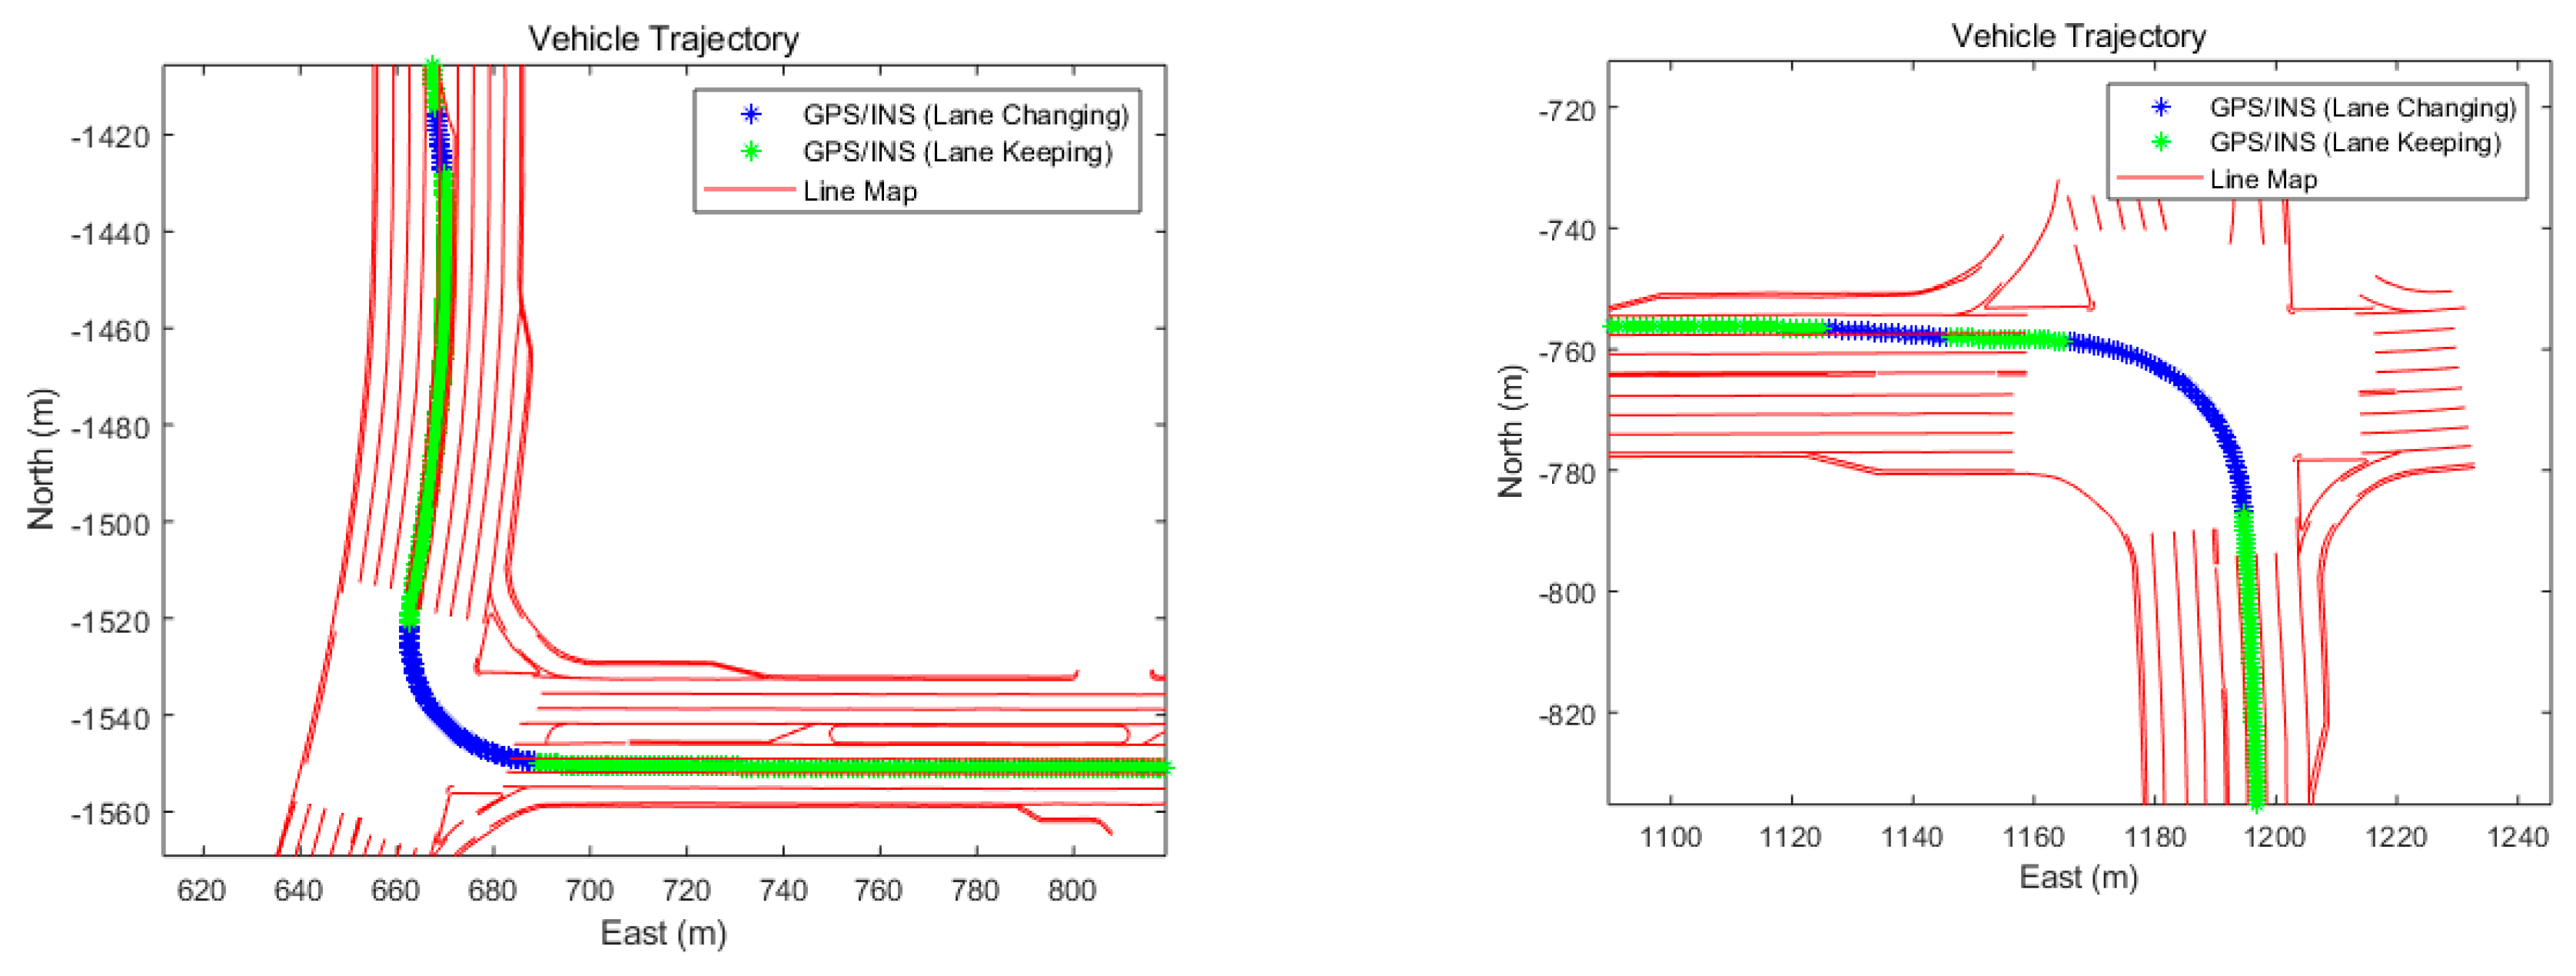
Figure 8 shows the result of dividing the vehicle driving trajectory into a lane change section and a lane keeping section.
Figure 11 shows the result of dividing the vehicle driving trajectory into lane change section and lane keeping section. The blue stars represent the lane change section, and the green stars represent the lane keeping section. Therefore, the lateral position error of the RTK/INS can be obtained by calculating the distance between the two lanes and the RTK/INS position in the green section. At this time, it is assumed that the vehicle travels along the center of the two lanes in the green section.
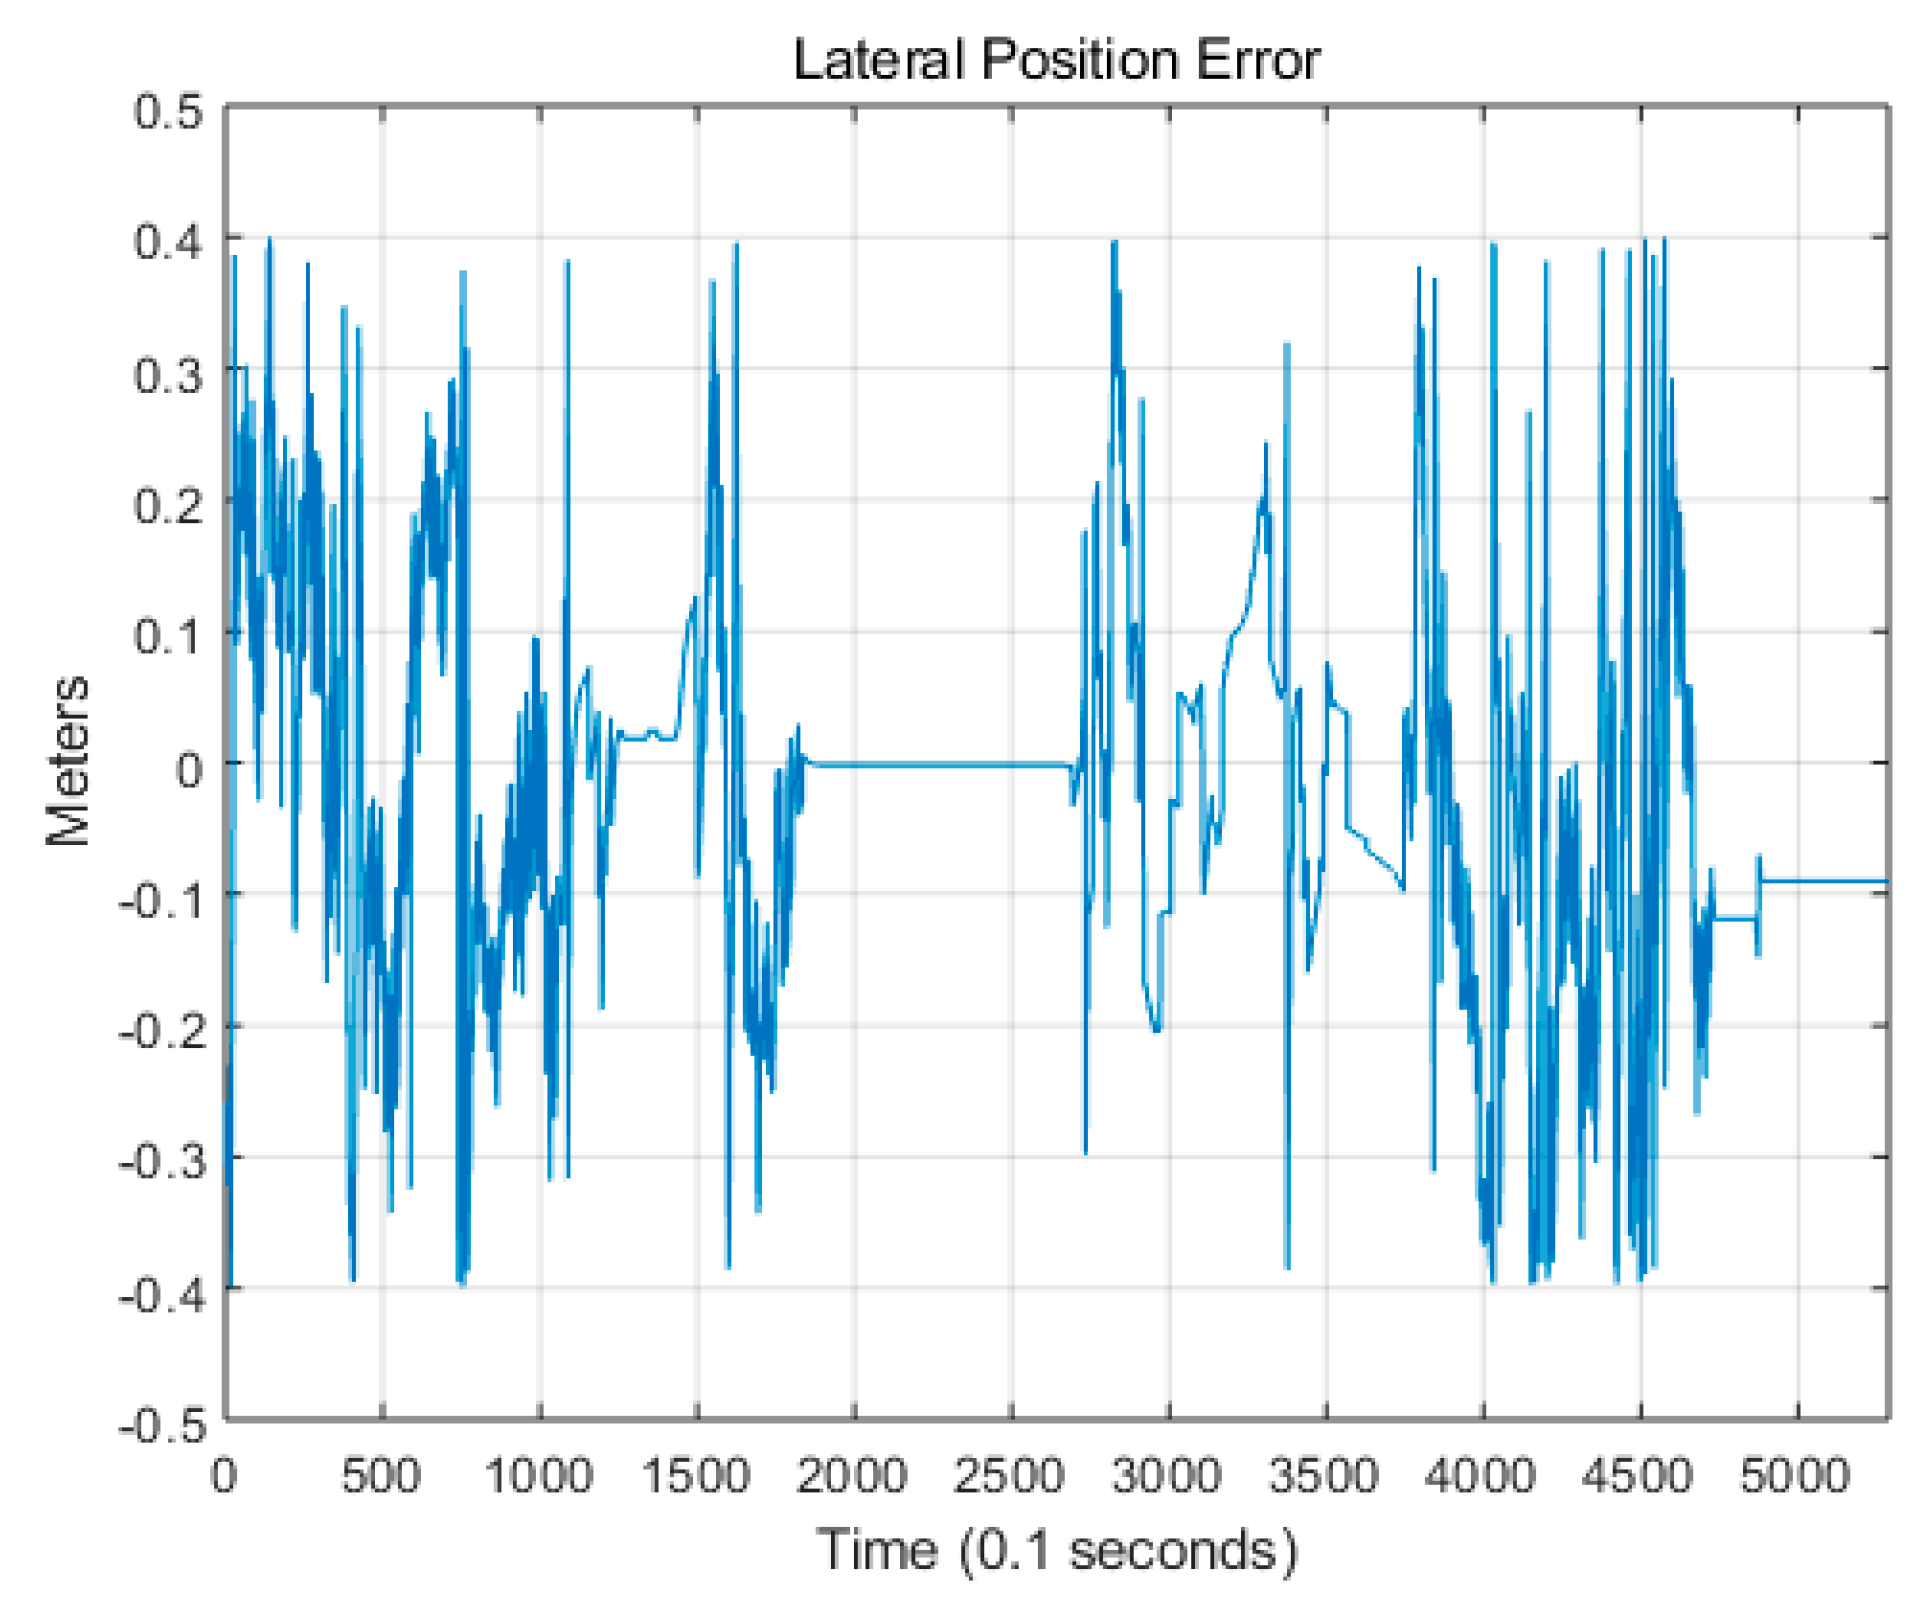
Figure 12 shows the lateral position error of the RTK/INS for a high-precision digital map in the green section.
There are several methods of error analysis [
40,
41]. In this paper, we used root mean square error (RMSE) to find absolute. In the green section of
Figure 11, the RMS lateral position error of RTK/INS is 13.9 cm. This is similar to the expected position error of the RTK/INS. From this result, we can indirectly verify the accuracy of the high-precision digital map. Therefore, a lane-level monitoring of autonomous vehicles can be made using a high-precision digital map.
6. Conclusions
This study defined and designed a schema that satisfies the requirements of a 20-level high-precision map as a base map for an autonomous vehicle monitoring system. The study was based on the schema of an existing national map platform (Baro e-map). The design and schema were modified to fulfill the requirements of autonomous vehicles, and 20 new levels were added. Finally, three types of base maps were constructed: A 20-level high-precision digital map, a UAV orthoimage map, and a hybrid map that combines the former maps.
The high-precision map created using the MMS vehicle was verified using a laser tracker through a national certification organization. The verification result was ±81.95 mm, which satisfied the target of ±100 mm. The accuracy of the high-precision digital map was also verified by analyzing the position error of the RTK/INS. The lateral position error of the RTK/INS was mostly within 30 cm, and the RMS error was 13.9 cm. This result was similar to the expected position error of the RTK/INS, thus demonstrating the accuracy of the high-precision digital map. Therefore, a high-precision digital map can be used for lane-level monitoring of autonomous vehicles.
We built a system for monitoring an autonomous vehicle moving along a planned lane, in addition to an existing control system for vehicle location only. Although much research has been conducted on technologies for mapping autonomous vehicles, this study, which was based on test bed and operation data, was conducted to determine whether high-precision maps and 20-level maps can help control autonomous vehicles.
The present study has some limitations. First, no survey on the needs of actual users of the controller was conducted because of the short project duration. This limitation will be addressed in the future when controllers operate the monitoring system. Second, much of the work during the data construction process of the high-precision digital map and UAV orthoimage was done manually. Updating the map is important in the case of map data for providing up-to-date information. Further studies are required to shed light on collecting up-to-date data, such as utilizing black boxes and communication technologies, and editing the same in a timely and cost-efficient manner.


