1. Introduction
Urban green spaces and public green parks are strategically important for the quality of life in our increasingly urbanized society. Indeed, increasing empirical proof has shown that the existence of natural resources (e.g., parks, forests, and green spaces) and components (e.g., plants and water) in urban environments contribute to living standards in many aspects, including the purification of air and water, the filtration of air and noise, and the stability of the microclimate [
1]. Urban areas currently account for half of the global population and are expected to grow to two-thirds of the world’s population by 2050 [
2]. With this fast urbanization of cities, an emphasis is being placed on ensuring the well-being of urban residents [
3]. In response, urban planners are attempting to integrate green places into urban areas since green spaces are believed to enhance the health and quality of life of residents in urban areas. Many urban planners and decision-makers have intended to make residential public spaces livable [
4]. Livability, however, is highly dependent on the values of the people and their expectations, so planners must try to understand these expectations on an individual scale [
5]. In urban environments, parks play a multipurpose role that offers social, financial, and environmental benefits [
6]. In the 19th century, the first public open spaces were developed in the United Kingdom and the United States with the objective of improving the health and dignity of the working class who were living in miserable conditions [
7]. The value of green spaces was also expressed in the latest UN Sustainable Development Goals, which include the specific objective of providing all urban inhabitants with affordable green spaces [
8]. Given the significance of green spaces, researchers have also shown interest in this subject, increasingly so in recent years [
9].
Every city is special in its features, and this complexity is a fundamental aspect of all cities [
10]. One complicating aspect is the continuous mobility of hundreds of thousands or even millions of individuals who are spending more time in public areas, such as green parks. In addition, urban green spaces affect people differently [
11], partially as environmental services [
12]. It is apparent that access to green spaces or parks is directly linked to the well-being of urban residents in terms of physical and mental health [
13]. This influence is evidenced by changes in air quality [
14], climate [
15], social cohesion [
16], and stress mitigation [
17]. Features and facilities [
18], security and access [
19], or even area or perceived greenness [
20] are the most appropriate considerations for parks. In designing livable, sustainable, and healthy cities, accessibility to urban green spaces is becoming increasingly relevant [
21,
22]. National Recreation and Park Association (NRPA) has stated that parks and recreation have three characteristics that make them vital services in societies: economic value, environmental and health advantages, and social importance [
23]. According to Casandra Campbell [
24], parks serve eight important functions: rainwater collection, minimization of the urban heat island effect, community center, breathable air, mental health improvement, a place for physical exercise, a place for children to be outside, and protection of natural ecosystems.
Parks or green areas are surely the best way to motivate individuals to become involved in physical activities. In this study, we examined the spatiotemporal behavior of visitors to green parks. We assessed 157 parks with about 30,000 user check-ins using a location-based social network (LBSN) service called Sina Weibo, also referred to as
Weibo [
25]. Established in August 2009, Weibo is among the largest social media platforms and a popular microblogging site in China that enables users to post their day-to-day activities to share with their social group. The word “check-in” indicates that a user voluntarily shares or confirms his or her location on the LBSN by broadcasting where they are—generally through a location-sensing mobile device—while engaging in some activity [
26].
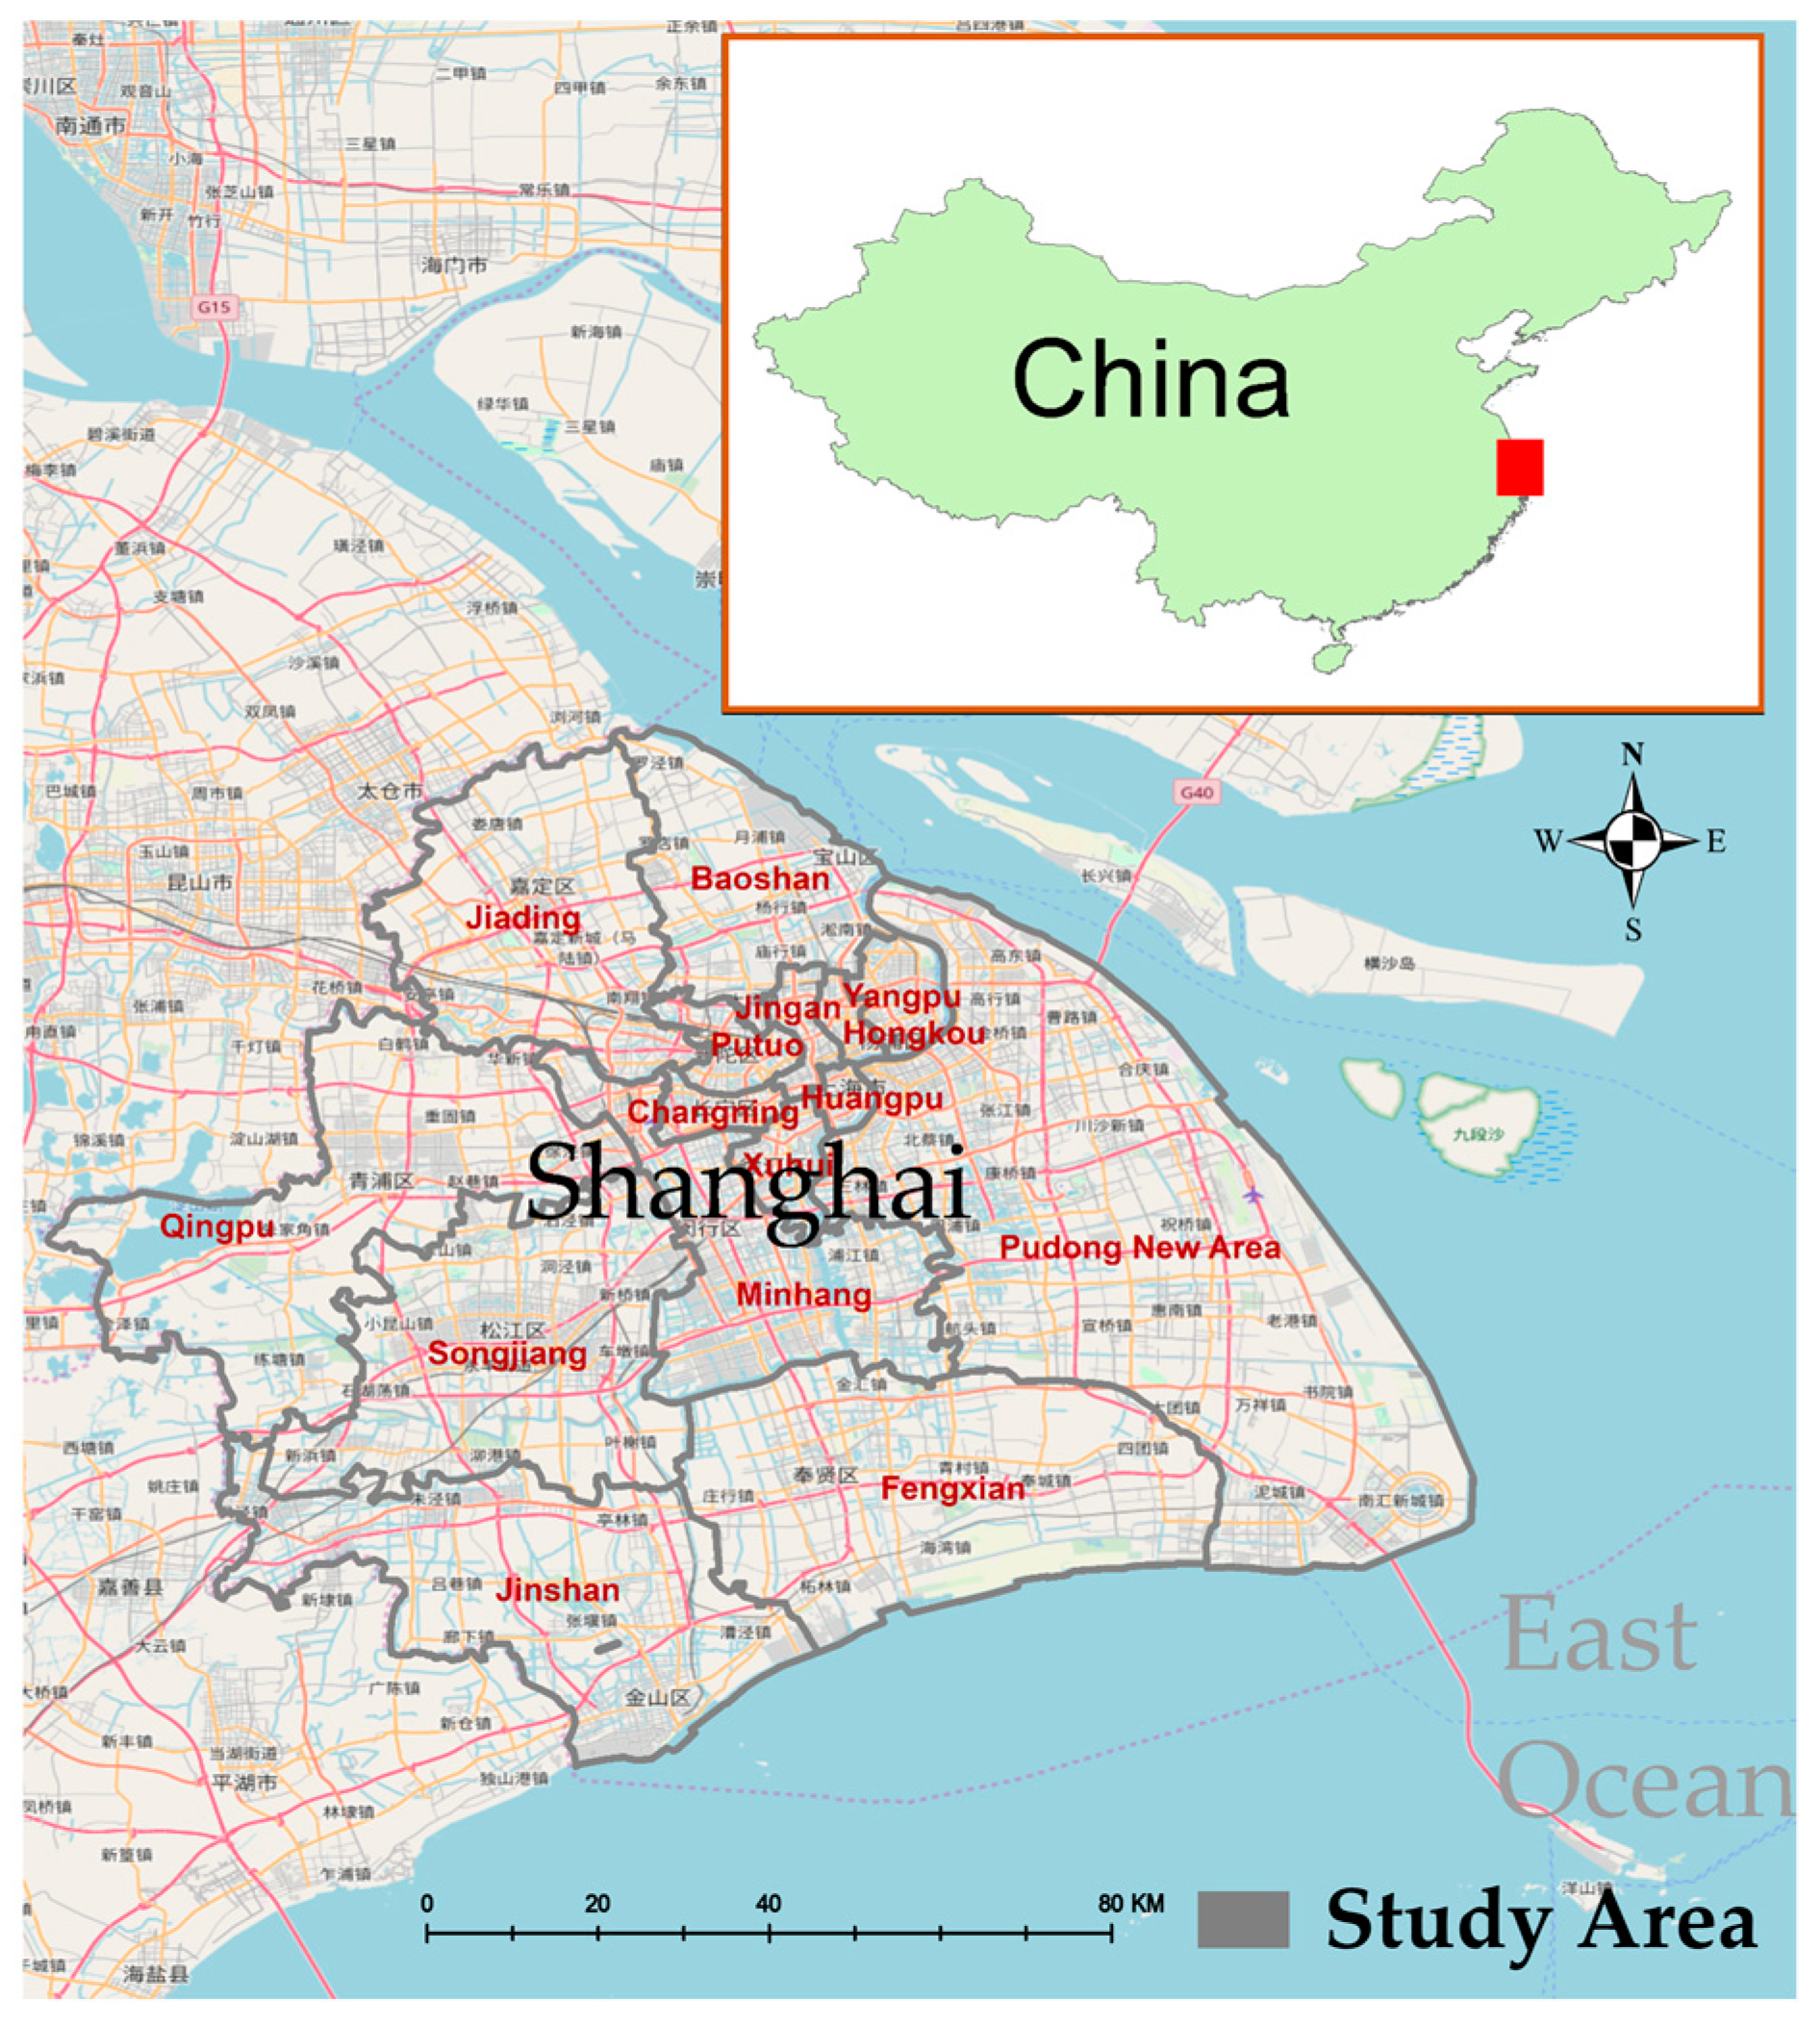
In this empirical research, we aimed to investigate the impacts of green space visits on the check-in behavior of users. We used a sample of data to study green park-related check-in behavior, such as liking and disliking, as a representation of the general public’s behavior or interests in certain activities while utilizing park facilities. In the same manner, we aimed to answer the following study questions: (i) What are the spatial characteristics of the selected parks, and how do these characteristics relate to park visits? (ii) How does the time of day and season of visits to green spaces affect the general public’s behavior toward parks? (iii) How does the temperature affect the general public’s behavior toward green park visits? In order to better understand the connection between green space and user behavior, we investigated the spatiotemporal patterns of users in urban green spaces using a large-scale dataset from July 2016 to June 2017. The study was carried out within the municipal boundaries of Shanghai city located to the southeast of China. Our main findings show the check-in distribution of users in different parks and interesting changes in behavior depending on the time of day in 24 h, the interval of the day, and the day of the week. In addition, we explored seasonal effects on the public’s behavior toward green spaces to reflect real-life trends. By studying these factors, the utilization of urban green space and its variation over a range of temporal scales can be examined. This approach to capturing the behavior of visitors in urban green space is an effort to overcome constraints in previous studies. This strategy paves the way for using crowdsourced and social network data in socio-ecological research rather than relying on the outcomes of subjective reporting and observational data.
The rest of this paper is organized as follows.
Section 2 presents an overview of studies on green parks.
Section 3 describes our study area and the dataset that we used for our research. In
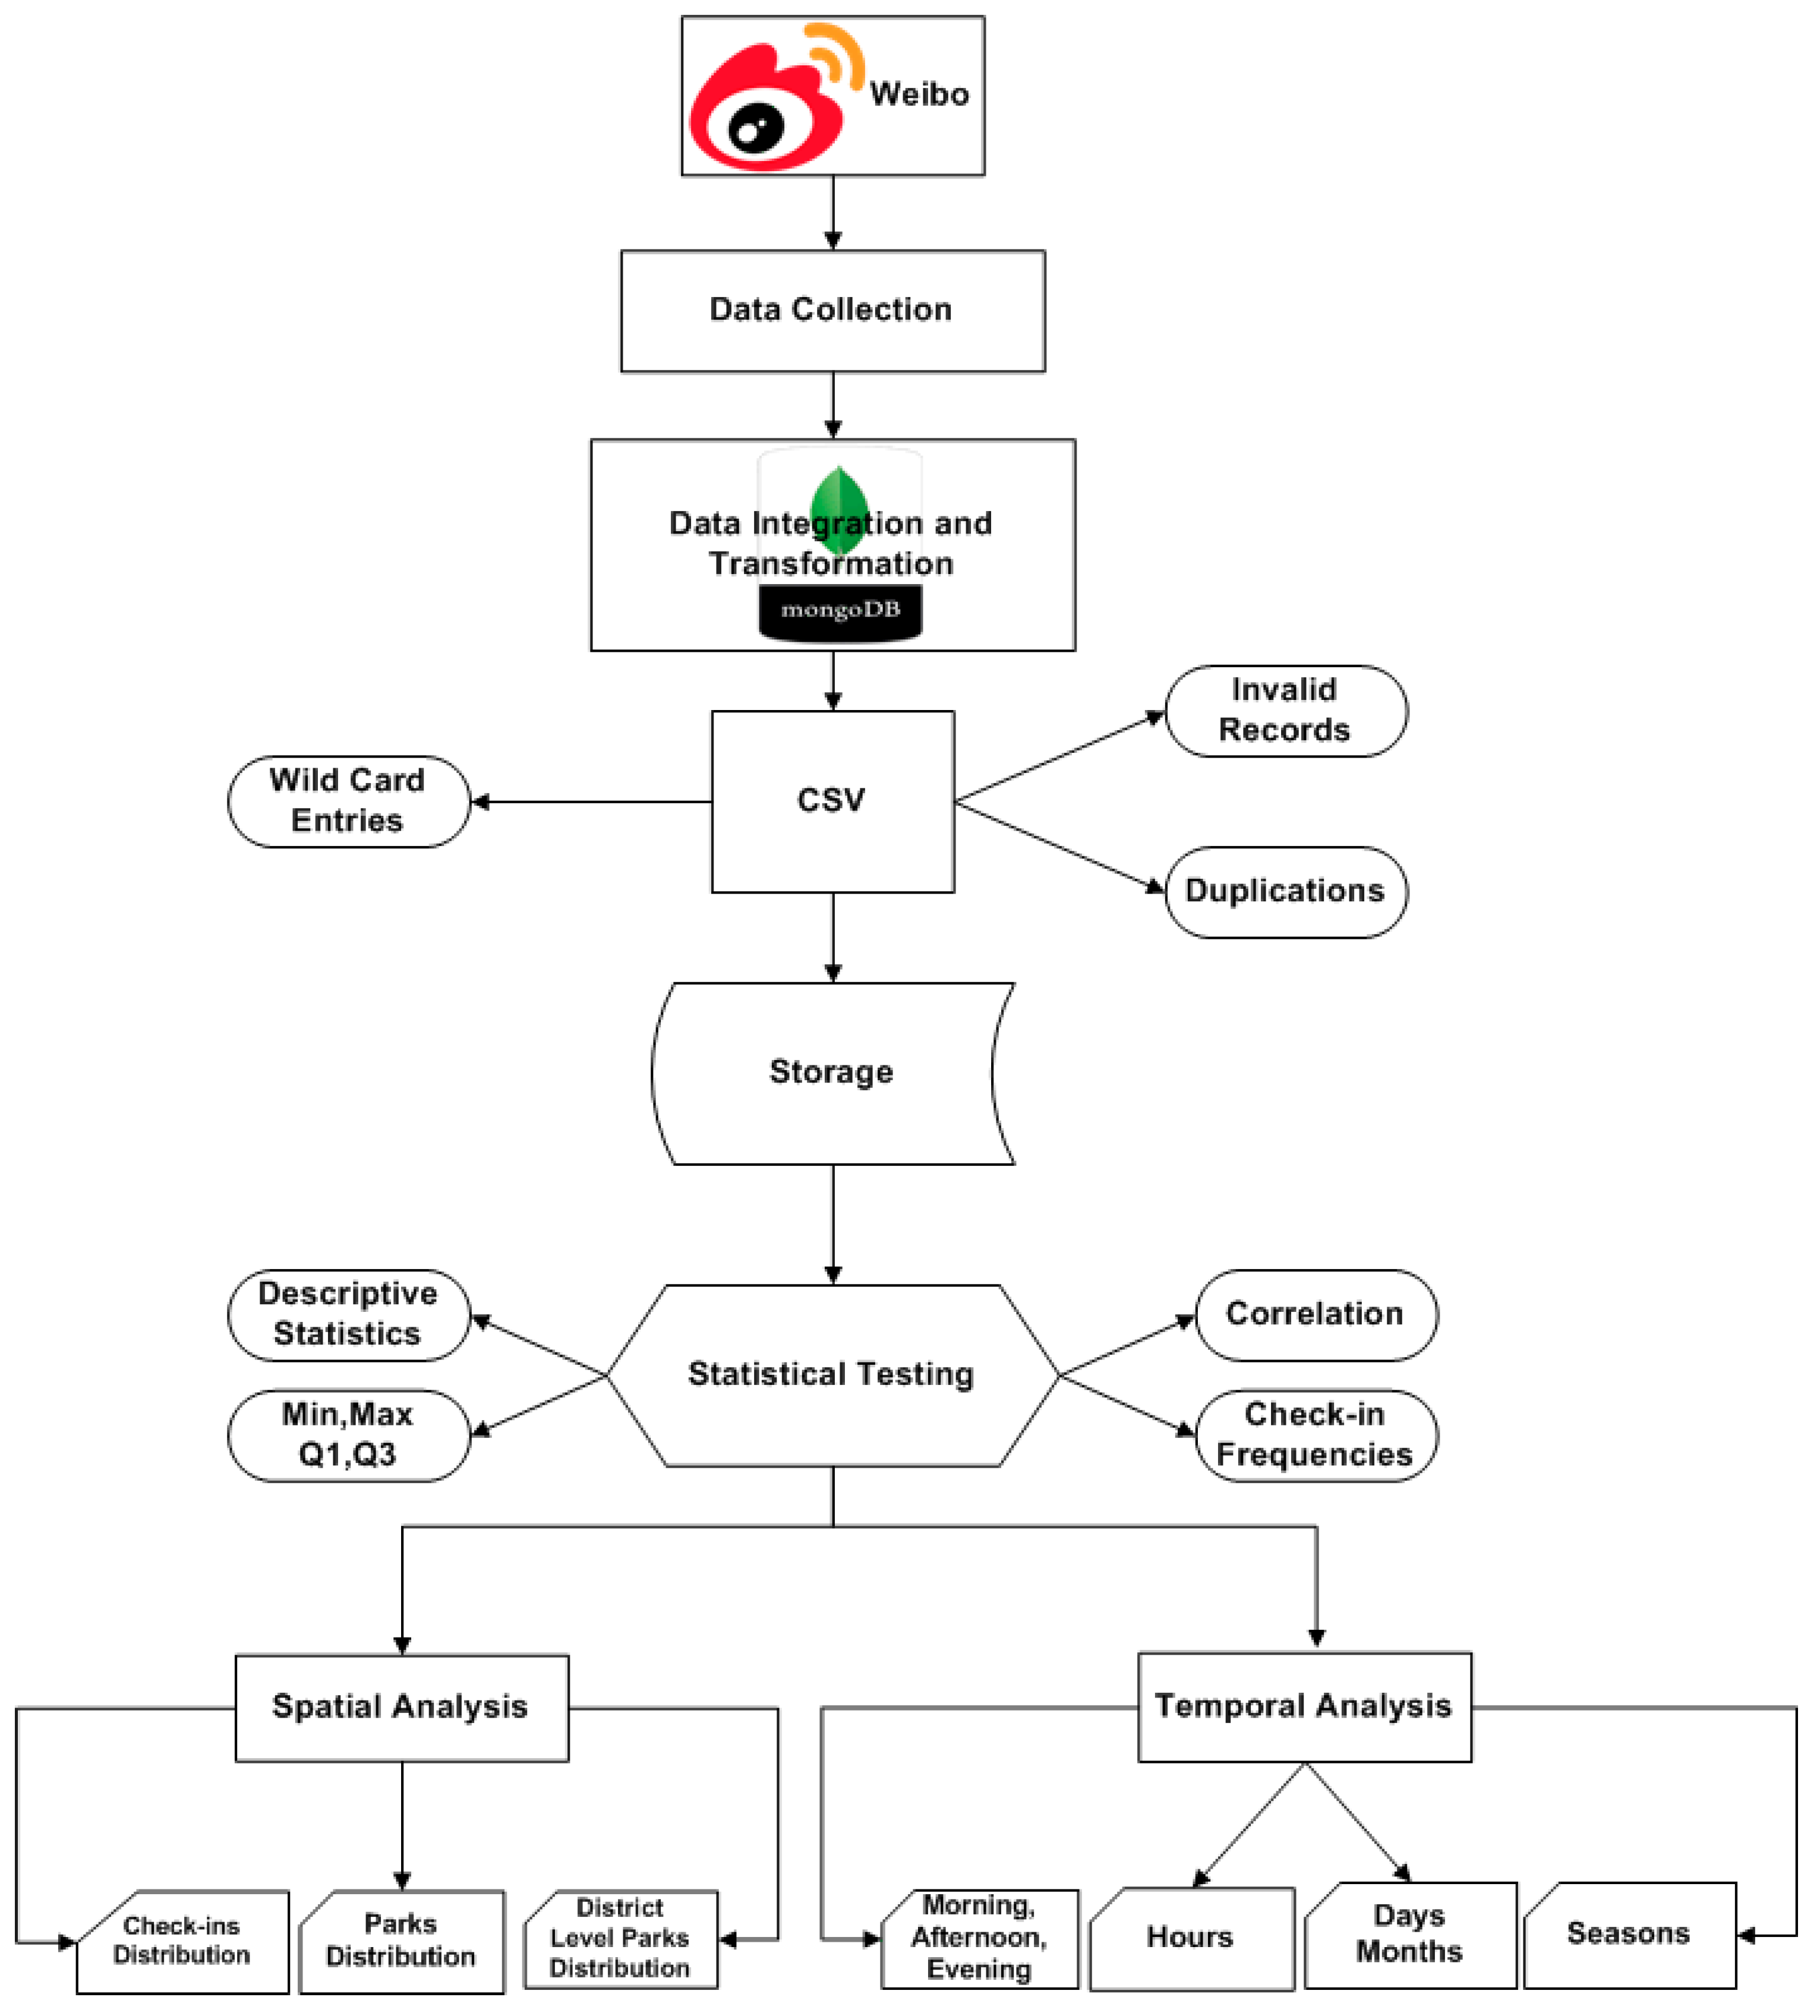
Section 4, we discuss the process of dataset collection and the analysis framework, and
Section 5 highlights the outcomes of our research using Weibo data.
Section 6 provides a discussion on the obtained results, and finally,
Section 7 concludes and summarizes the paper and describes future work.
2. Related Work
The population pressure has risen in metropolitan areas worldwide, with individuals thronging the cities in search of a better life. The total population in urban areas in 2019 is estimated to be 2.26 billion, 53% of the world’s urban population [
27]. There is no doubt that urbanization has an important effect on ecology, economy, and society at local, regional, and global scales. Studies have noted the major effect of urban green areas, including urban forestry, green parks, play areas, domestic gardens, open areas along the road, and urban vegetation [
28]. Besides their intrinsic advantage, they also promote the construction of high-quality human settlements since green spaces serve as the city’s “lungs” [
29]. Given the significance of green areas, they have attracted researchers’ interest in recent years [
30]. Previous research has addressed the expressive advantages of green spaces in urban regions [
31]. These studies have mainly employed user polls, questionnaires, and case studies, which are traditionally either small in scale or require explicit user involvement. Furthermore, these traditional techniques often make it time-consuming and expensive for investigators to conduct a participant-involved longitudinal study or fine-grained research.
Parks also encourage people to experience open spaces for leisure practices that support emotional stability and enhance the standard of life [
32]. In other words, the accessibility of affordable and pleasant green spaces is an essential component of urban living standards. In the urban framework, green spaces provide areas such as parks, gardens, urban forests, nature preserves, waterway paths, and playgrounds, as well as other casual green areas [
33]. Unplanned and unofficial settlements in most developing cities have led to increased social and spatial inequality, consumption of resources, and environmental destruction [
34]. Accessibility can be simply defined by how quickly or far an individual has to travel. In densely populated regions, when park facilities satisfy high requirements for park services, the supply is considered sufficient; therefore, the accessibility in these places is considered convenient. This shows that parks are accessible if they are planned according to the spatial distribution and population of the urban area [
35].
Over the past few years, various analytical attempts to use social media data have been made for urban planning purposes, and the fields of application are vibrant and increasing, varying from simple tasks to rather complex analysis, such as urban shape and function identification. In particular, Weibo, Facebook, Twitter, and other big data platforms have been used to evaluate human behavior and mobility, with measurements varying from inter-urban to global [
36] since it is almost impossible to identify finer temporal and spatial levels of these two phenomena using traditional techniques, such as survey questions or in-situ observations. In addition, LBSN data can be used for sociospatial analysis [
37] with methods such as the extraction of users’ tweet content or the exploration of emotions and their differences over time and space [
38] while also considering health aspects, such as diet or physical exercise. Campagna [
39] proposed the concept of “Social Media Geographic Information” as a means of investigating “people’s perceptions” and people’s views and interests in time and space to support spatial scheduling and geo-design using spatiotemporal analysis. With data sources other than surveys, such as mobile data, it is possible to more appropriately describe the spatiotemporal aspects of the urban setting [
40].
The accessibility of data has been the main obstacle in LBSN studies, mainly because of personal privacy and security. With the capability of LBSNs, sharing the current geolocation of users and their friends introduces major concerns about users’ privacy. Privacy is a matter of not only the individual but also organizational or institutional users who share their details in LBSNs. Sometimes, users share their private data voluntarily, while other times, the data can be obtained extrinsically by providing some rewards and advantages to users for their information. The location of a user can be identified through LBSN services such as WeChat Nearby, Google Latitude, and Fire Eagle. Some LBSN services provide features that identify his or her friend’s location, as well [
41].
The kernel density estimation (KDE) approach has been used for the spatial modeling of geolocation data, and it provides a more general and flexible framework for spatial density estimation. KDE has been used to examine environmental characteristics such as health resources [
42], the food environment [
43], and park access. It increases the access count or distance measurements by converting point data into something akin to a continuous surface and permitting the density of a feature to be estimated at any point on the surface of the map [
44]. The authors in [
45] researched connections between destination allocation, walking speed, and sufficient physical activity using KDE. KDE has also been used to study the allocation of locations such as food shops in relation to variables such as Body Mass Indexing (BMI) [
46], obesity [
47], and nutritional intake [
48]. In [
49], the researchers used the KDE method to investigate the comparative significance of external factors linked to the spatial and temporal distribution of users in urban green areas. Given the good spatial and temporal scale, the detection and assessment of incidents or disasters and their impact on regular urban planning routines are another excellent potential use of social media network data [
50].
5. Results
Shanghai City is among the world’s fastest-growing cities, with a population of 22,125,000 in an area of 4,015 square kilometers [
27]. The total number of green spaces in the Shanghai municipal boundaries is 366 [
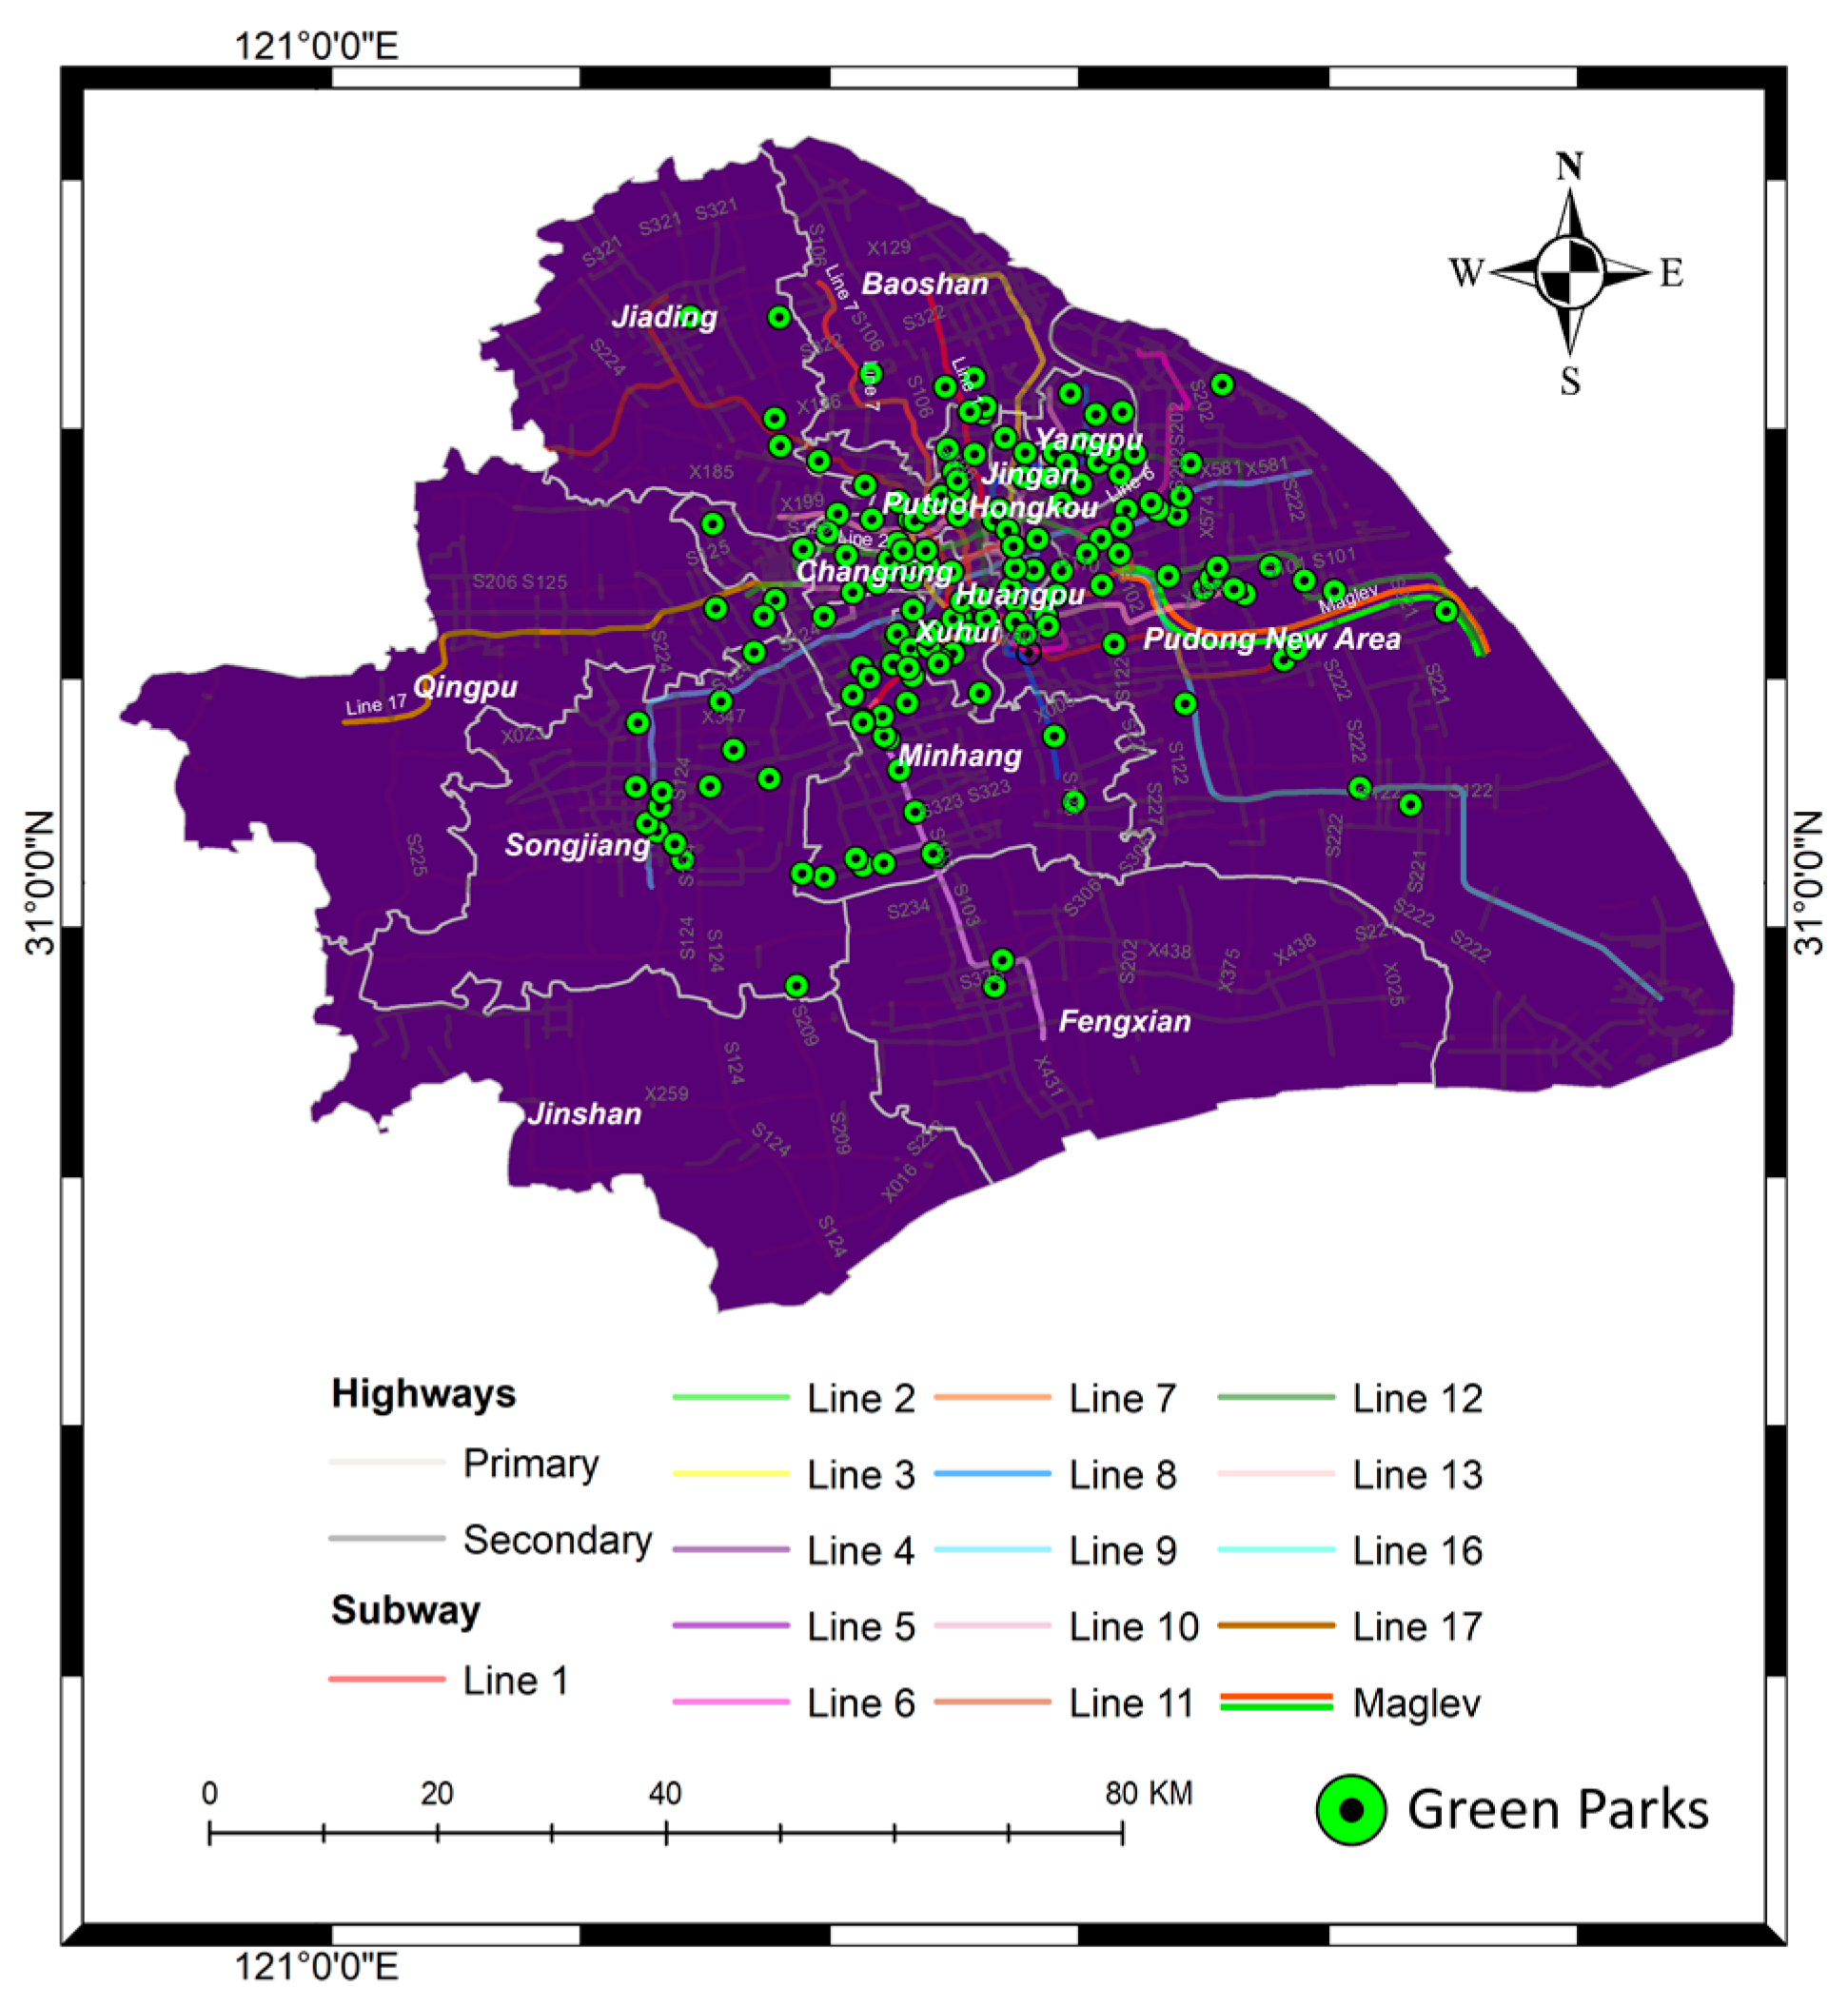
55], which motivates the residents of the city to engage in healthy activities. After filtering the data collected from Weibo, 157 green parks were selected for this study.
The distribution of green parks considered in this study can be seen in
Figure 4, which clearly indicates that the parks are sparsely distributed all over Shanghai City, except for the downtown area, which includes the districts Changning, Hongkou, Huangpu, Jingan, Pudong New Area, Putuo, and Xuhui [
58].
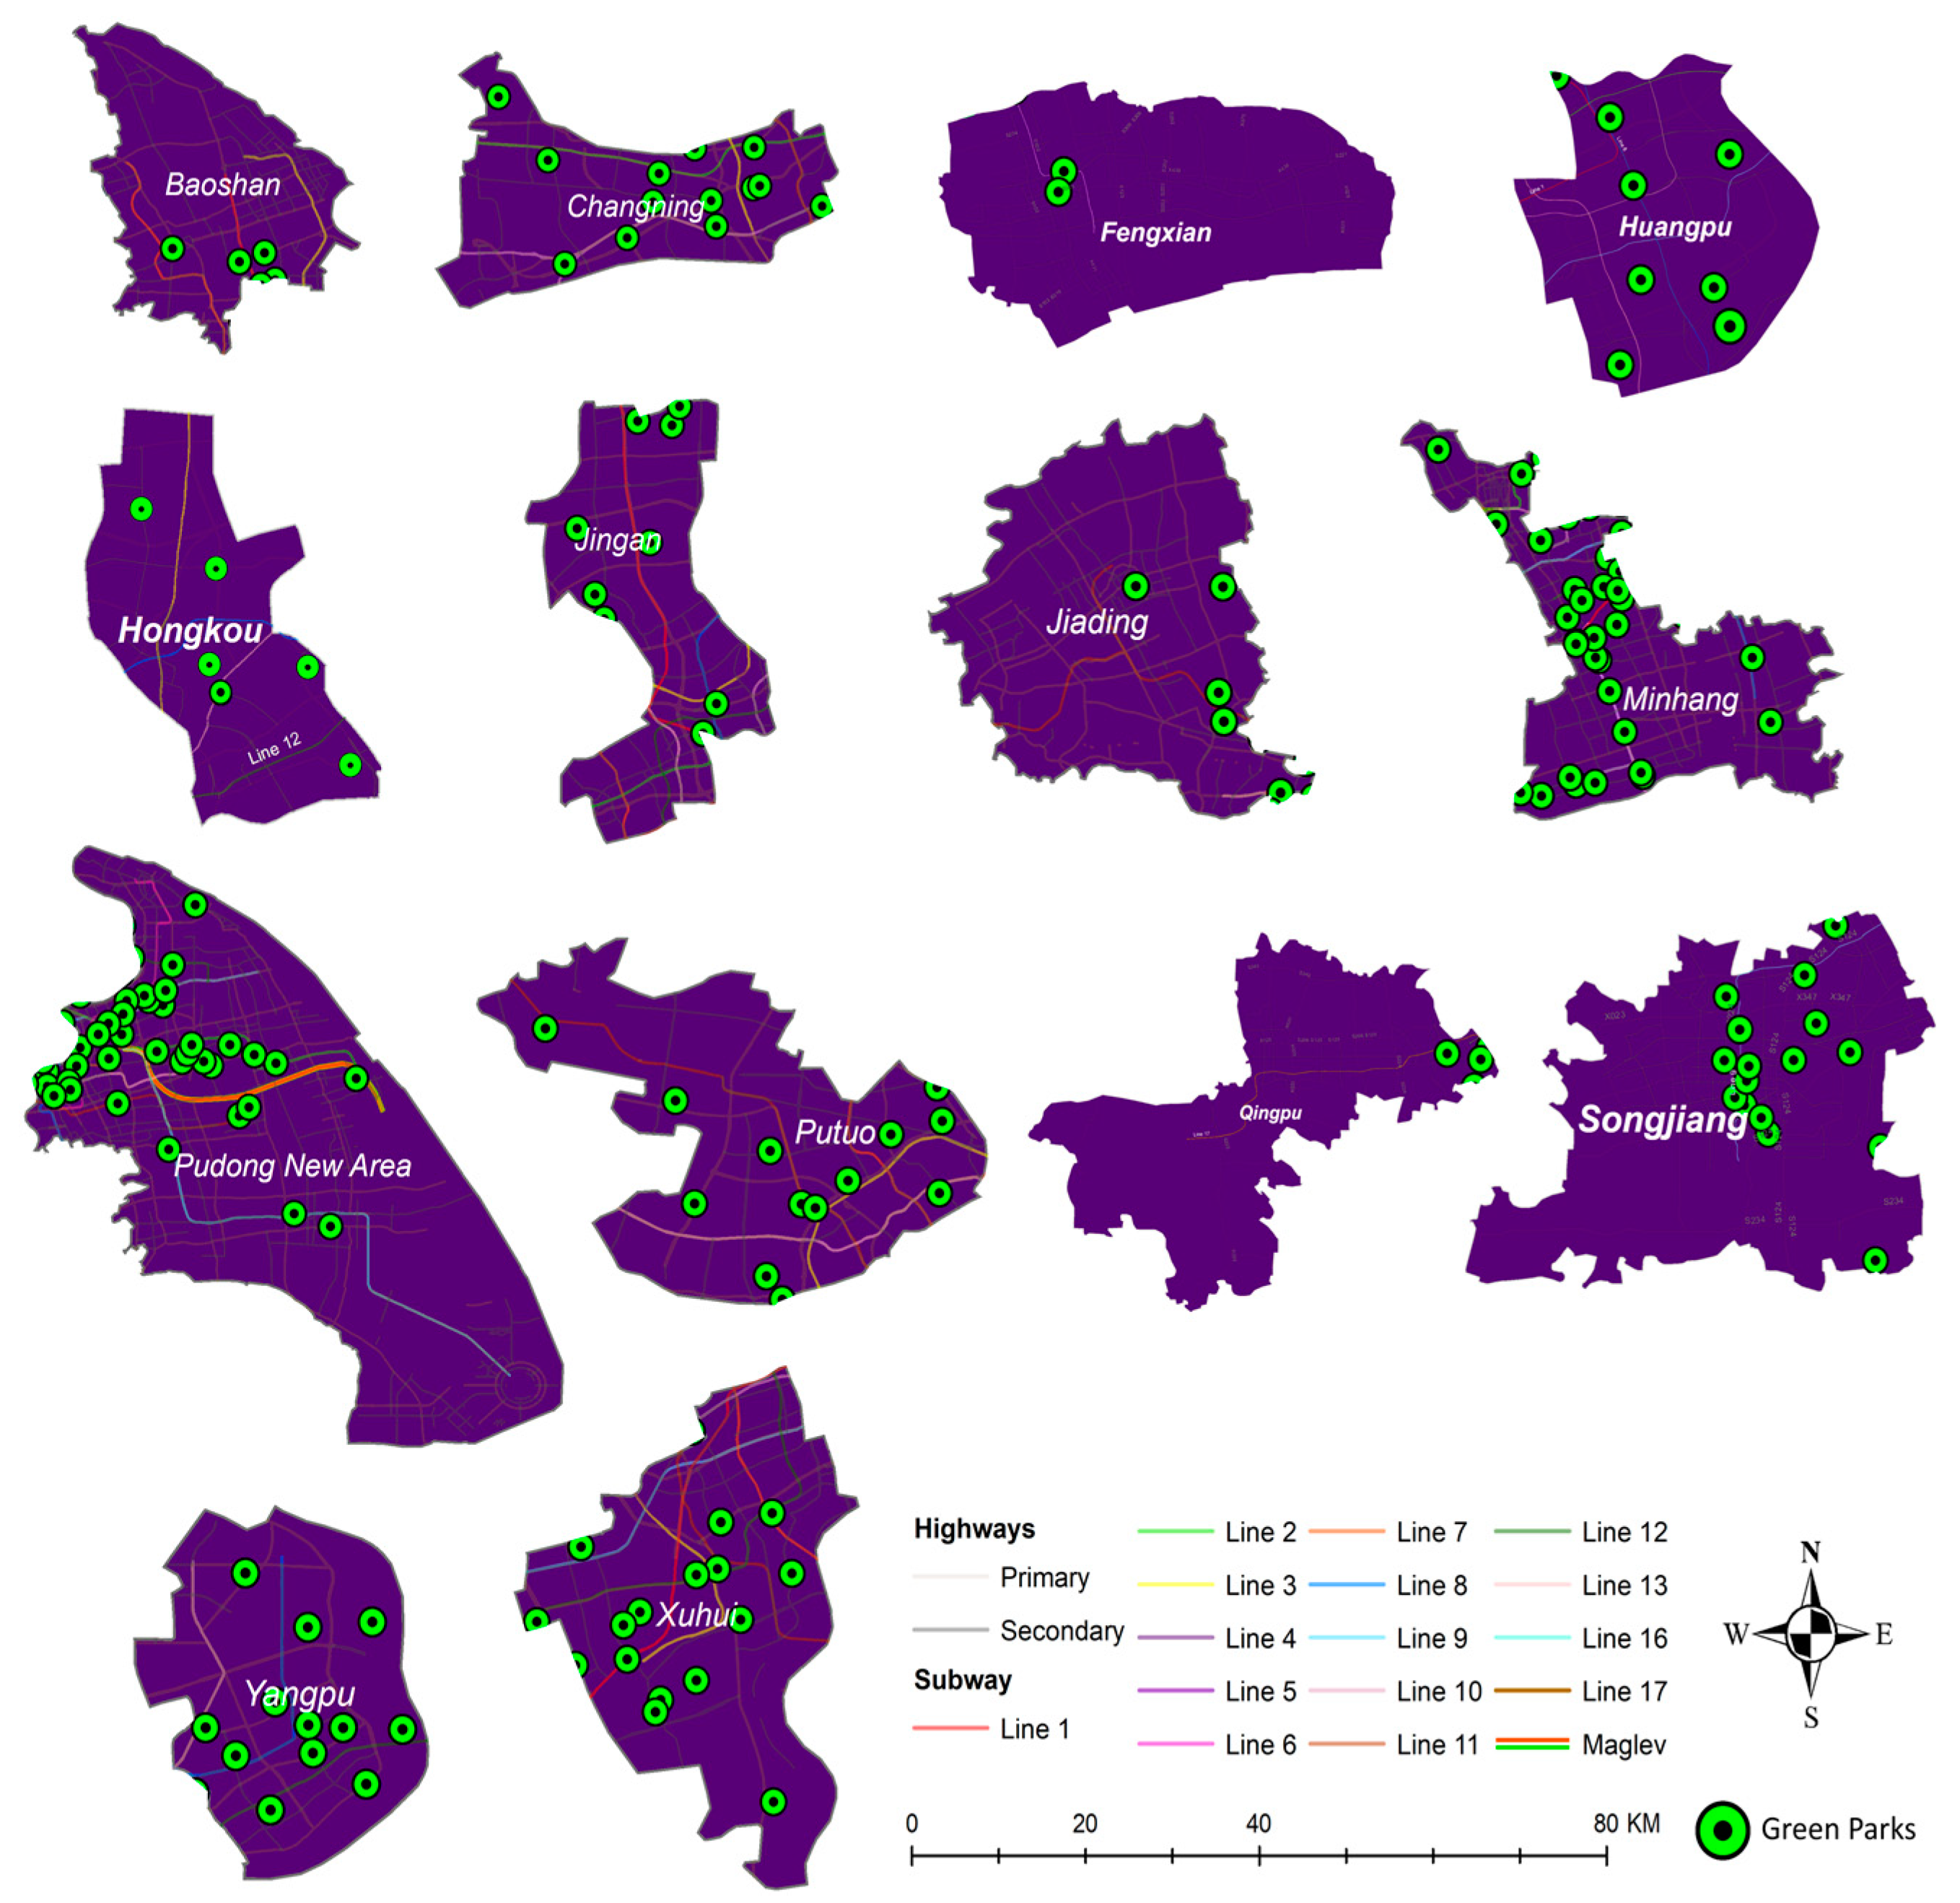
For a more specific overview of green parks’ distribution in Shanghai City, the green parks were broken down to the district level.
Figure 5 shows that the distribution of parks in the district of Pudong is the highest, followed by the district of Minhang. One reason for such behavior is that these districts are larger in size compared with the other districts. Another point to be noted is that the distribution of parks is higher in the downtown area compared with suburban areas.
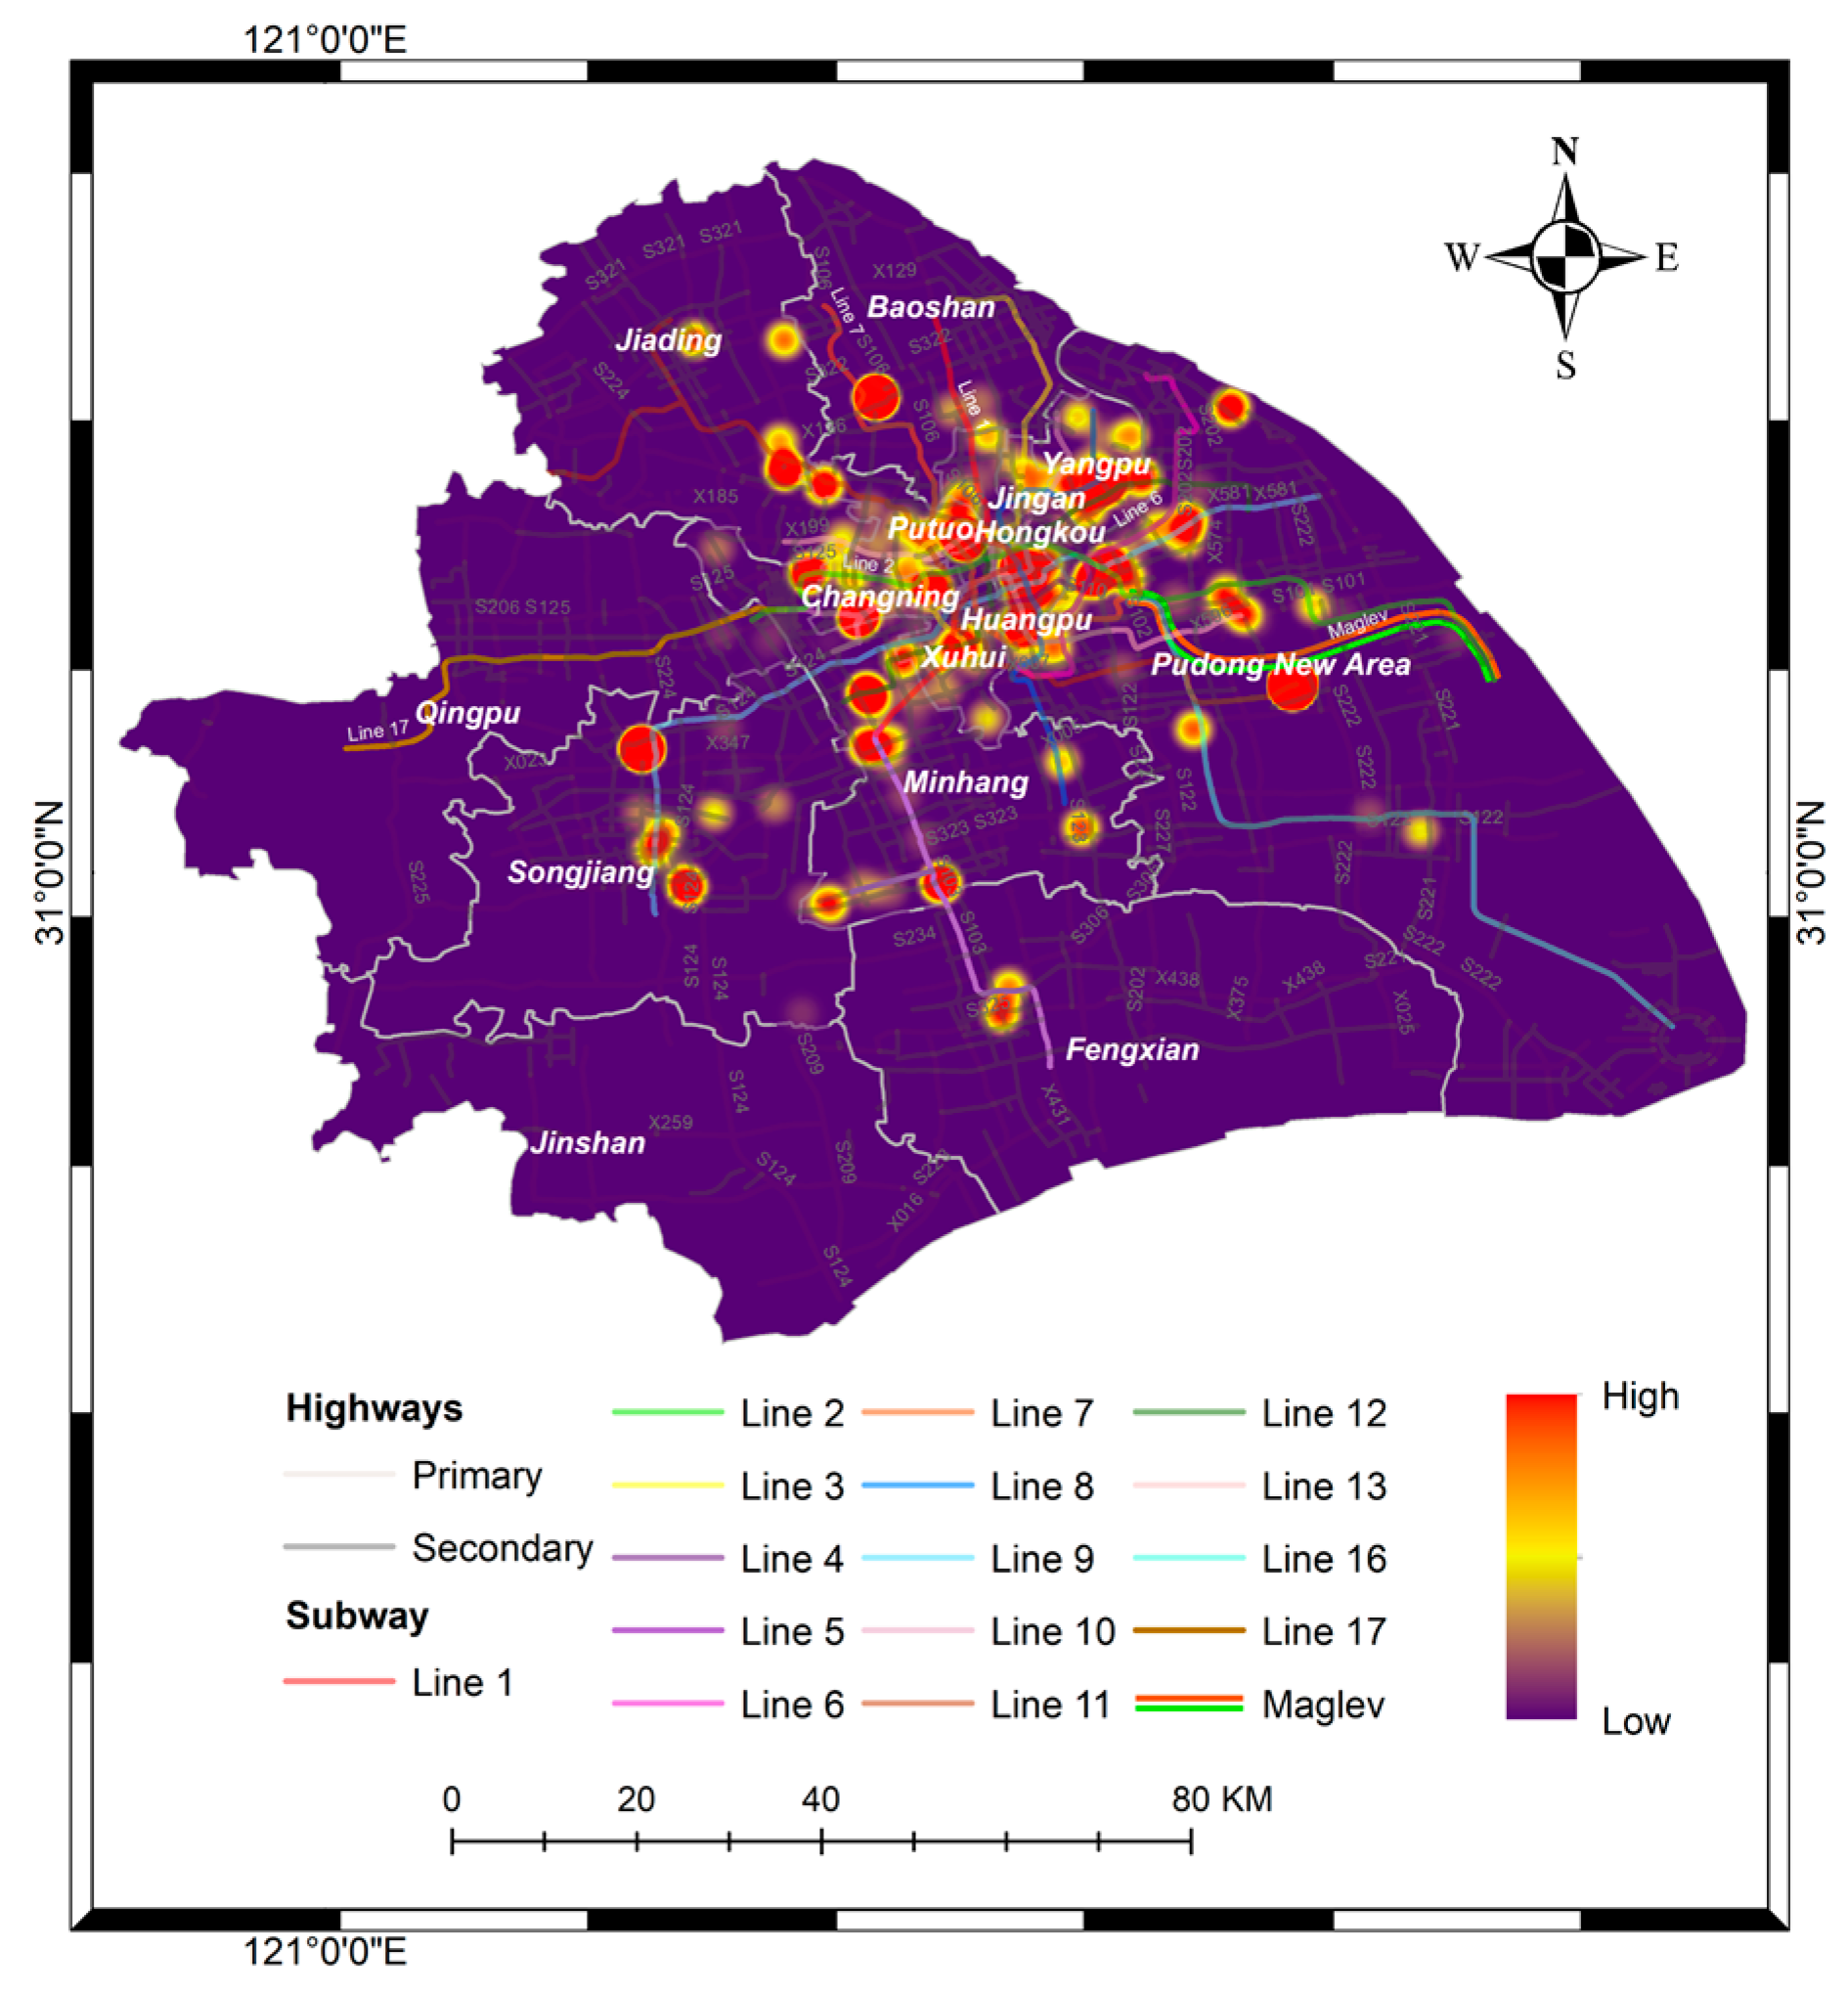
To examine the Weibo geolocation check-in dataset, we used KDE to analyze the spatial distribution of check-in data, and ArcGIS was used for visualization.
Figure 6 shows the overall check-in density in Shanghai from July 2016 to June 2017. The areas shaded in red indicate a higher density of people, higher activity frequency, and higher concentration of social media use. It is no surprise that the green spaces in the city center have large clusters of activity.
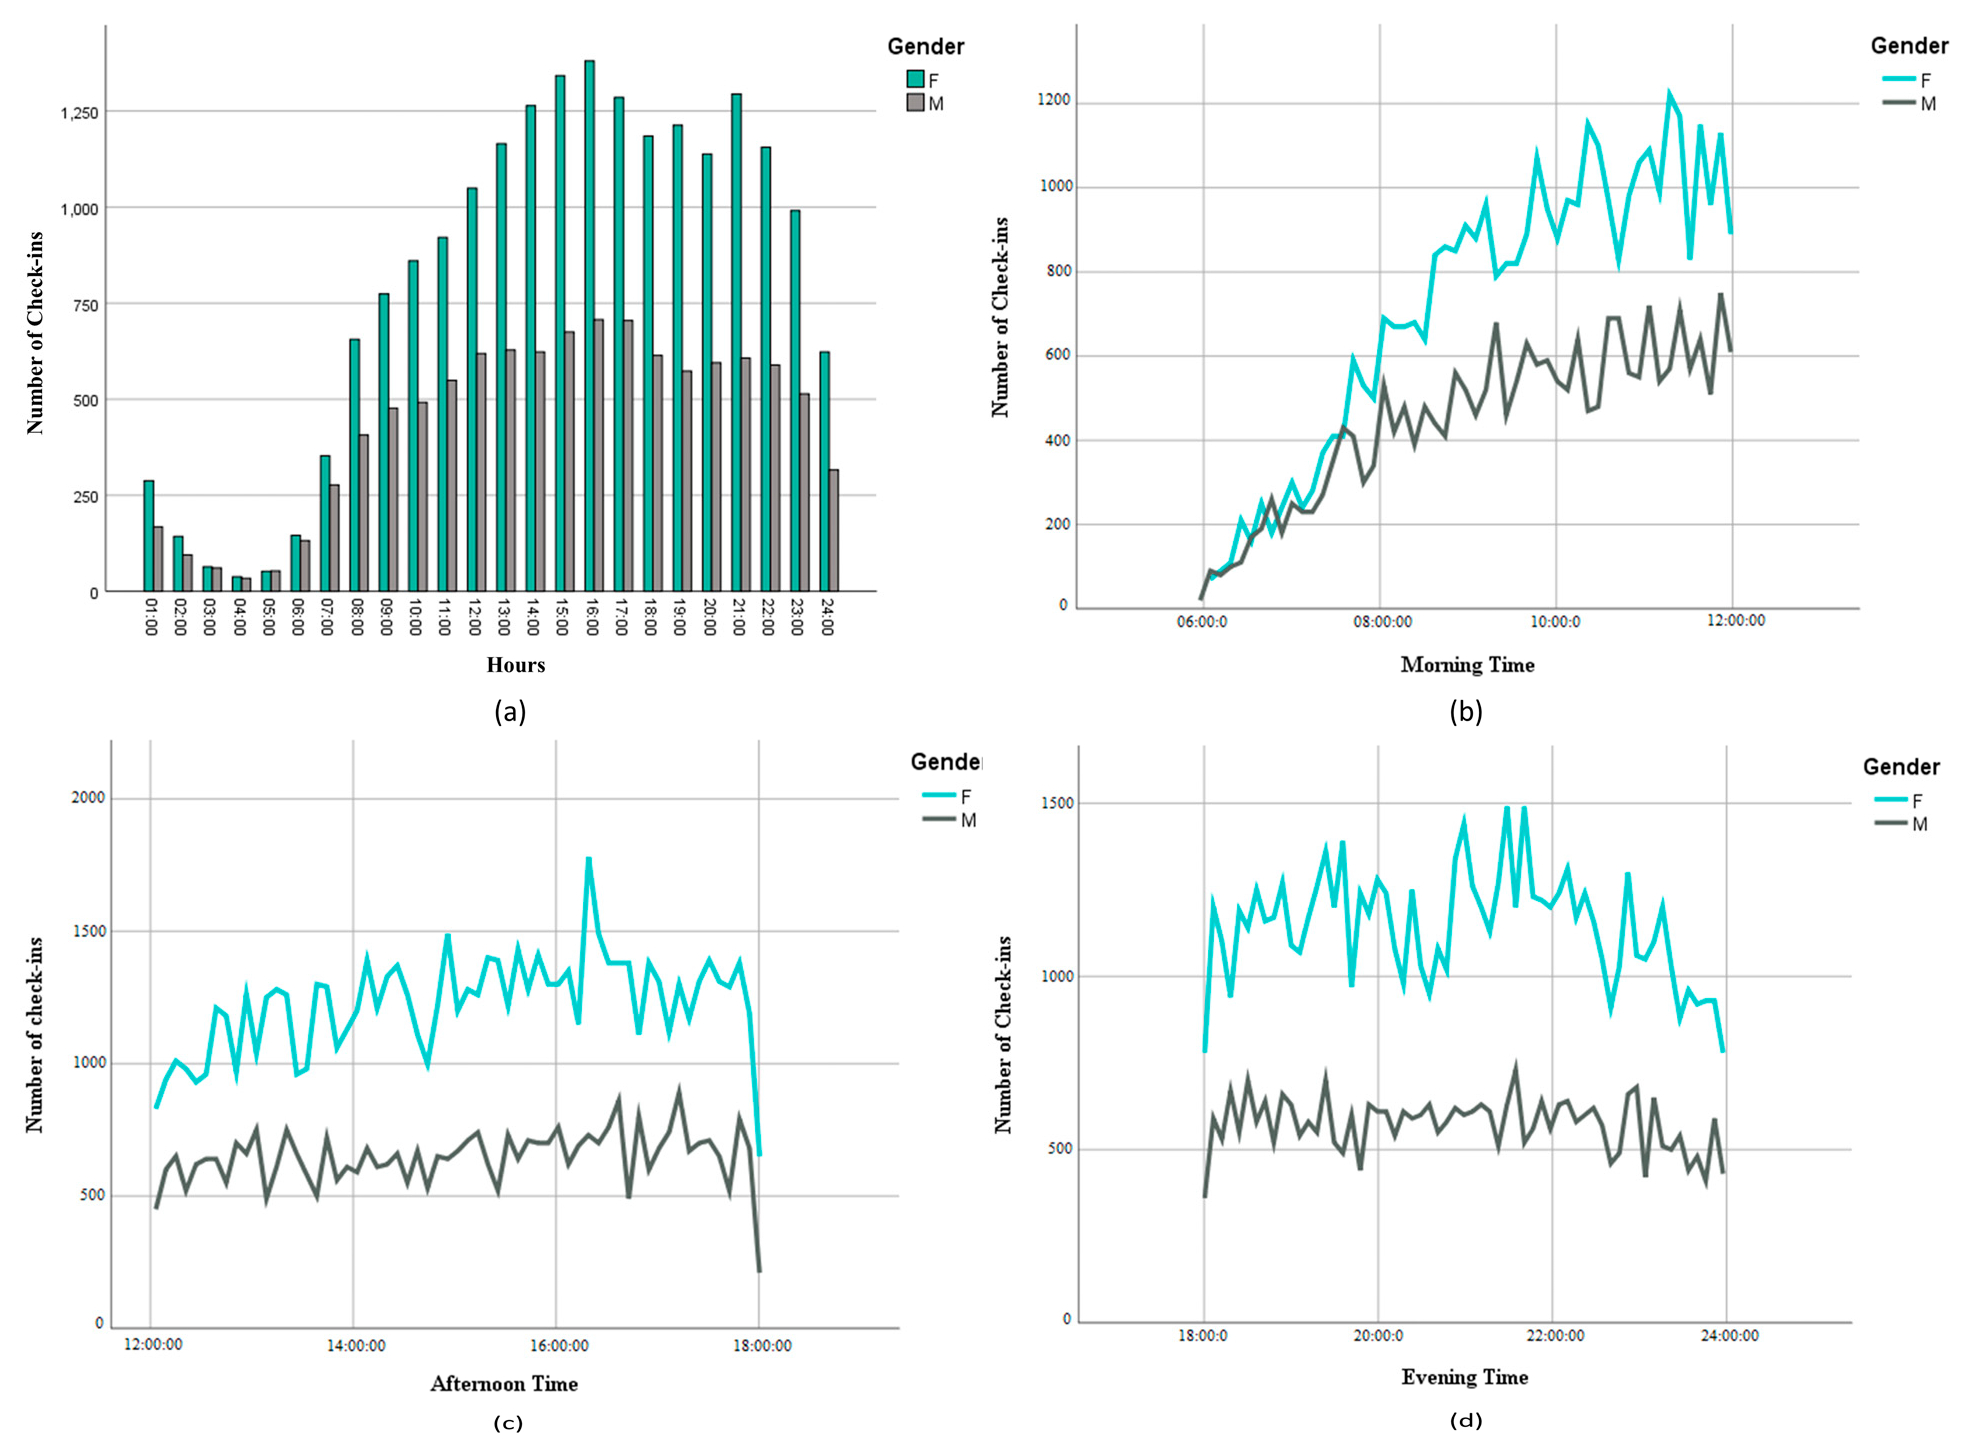
To analyze visitors’ temporal distribution features, we split a day into three intervals according to the rhythms of daily life. In 157 urban green parks, we analyzed the numbers of visitors according to daily time intervals, namely, morning, afternoon, and evening, to measure temporal differences and variations during a 24 h day.
Figure 7 reveals temporal differences in the number of visitors in 24 h and in three intervals of the day. Among the parks considered in the research, visitors were present during all three intervals of the day, but the highest number of check-ins was recorded at 16:00. The trend also continuously increased until midnight. This finding shows that green parks in Shanghai have rapidly become important recreational destinations for Shanghai citizens.
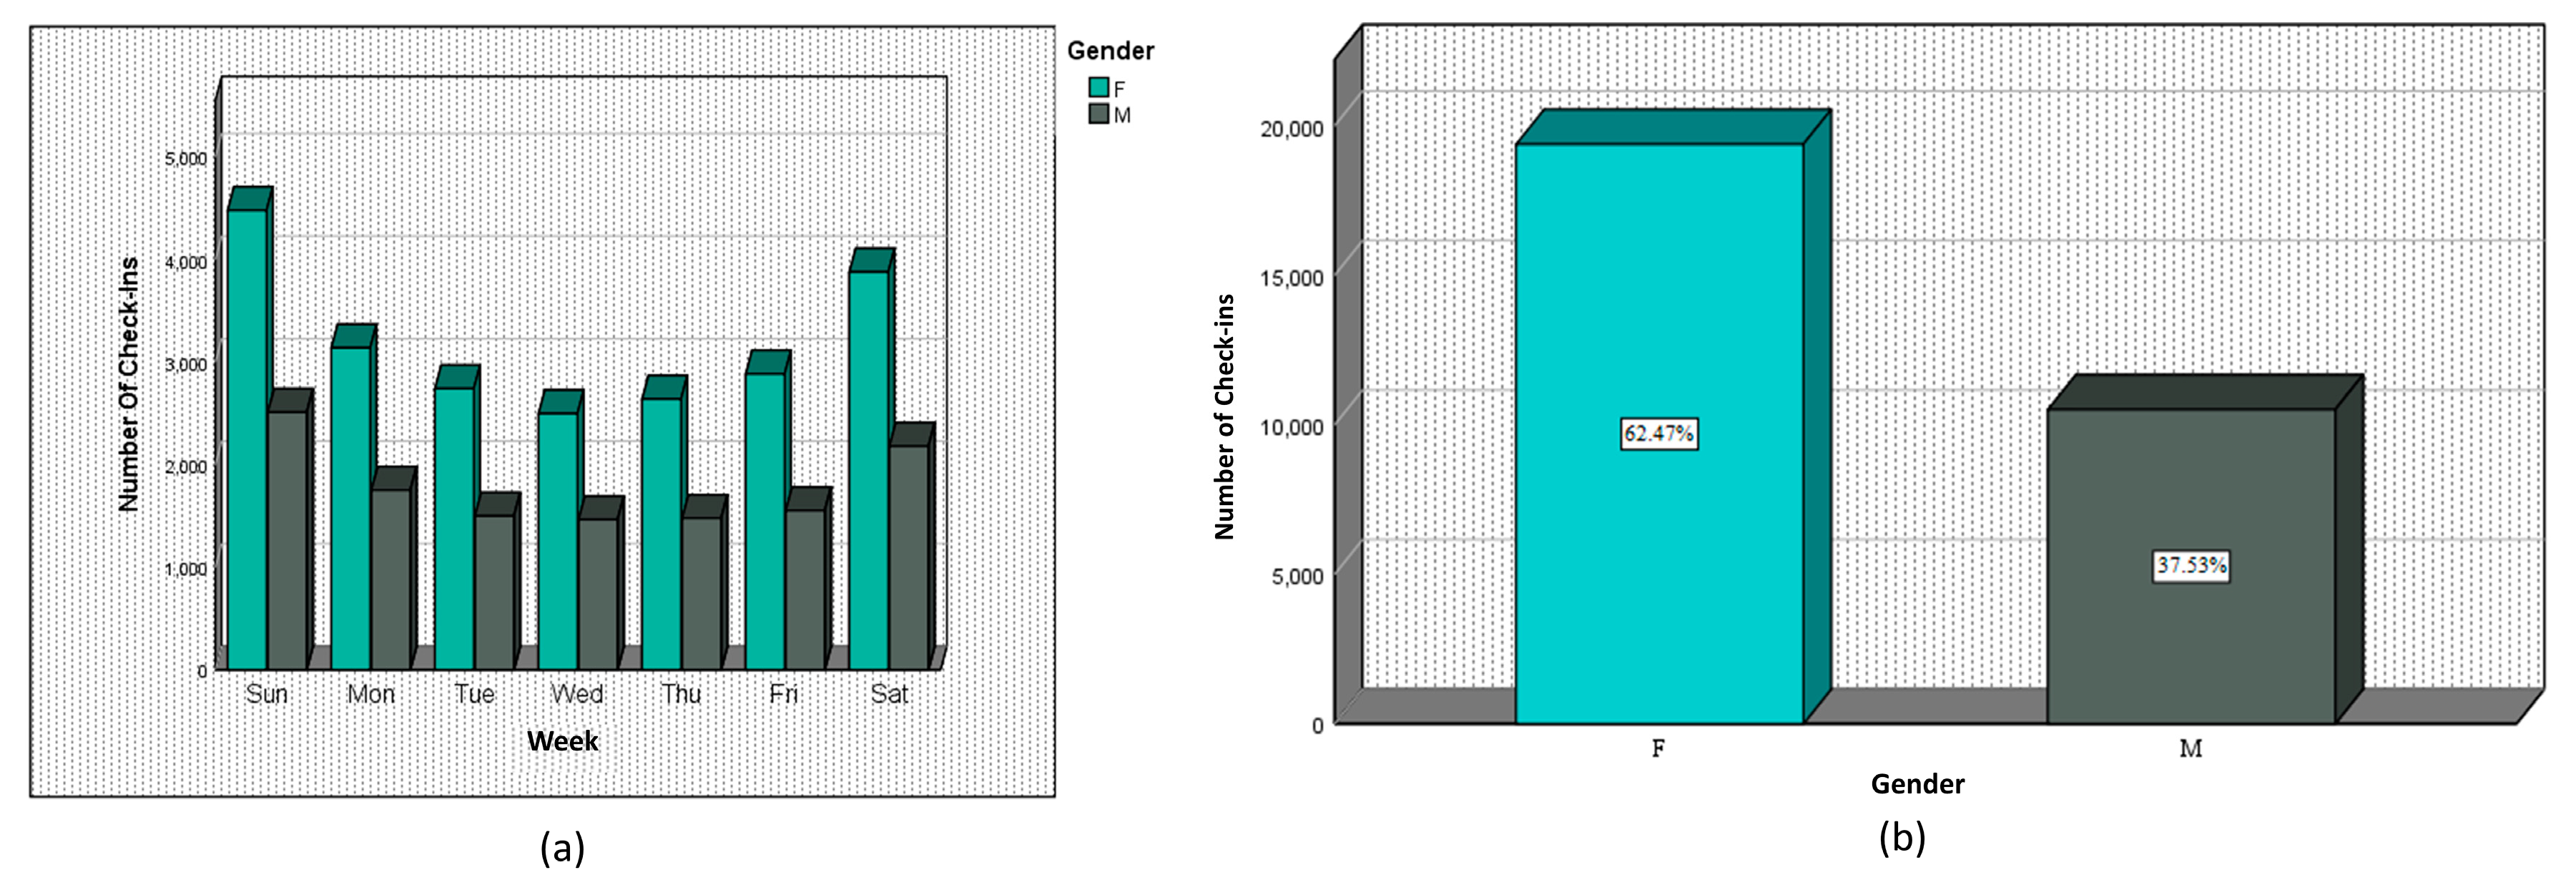
The weekly patterns are quite normal, with nearly the same numbers of check-ins for each weekday and a much higher number on weekends.
Figure 8a presents the general weekly check-in pattern, which indicates that female users prefer to use Weibo more than male users throughout the week and on weekends.
We analyzed gender (male and female) data in Shanghai to explore differences in check-in frequency and behavior.
Figure 8b reveals the gender check-in density in Shanghai. It is noted that female visitors prefer to use Weibo compared with male visitors; therefore, the outcome in
Figure 8a is supported.
Male and female user check-ins were compared for different days of the week as well as different districts to evaluate the variation between male and female users in Shanghai. We used the relative difference (dr) [
70] to calculate gender-based differences for different Shanghai districts and different days of the week. This metric is mostly used as a quantitative indicator of quality control and quality assurance and is determined as follows.
Table 7 and
Table 8 show the outcomes of the relative difference measured by using differences between male and female users for different days of the week and districts. The results are displayed at the cumulative level. We computed the gender differences in the number of check-ins by day of the week and districts as a percentage of total accumulated check-ins generated in the study period.
Table 7 shows the relative differences for the days of the week, which were computed using Equation (3). For Tuesday and Friday, the comparative difference values are considerably higher than the values for other days.
The results in
Table 8 show that the gender difference in the number of check-ins is relatively significant in the districts Fengxian, Qingpu, and Xuhui. The results indicate that female users are much more likely than male users to use Weibo on all days of the week and in all districts. In addition, as shown in
Figure 6, a high concentration of check-ins is located at the district boundaries linked to the center of the city. One of the reasons could be the availability of financial and commercial activities. Finally, all the findings indicate that female users are more likely than males to use Weibo in our study area.
Table 9 demonstrates the mean and standard deviation among the various district groups and shows the distribution and spread of male and female users around the mean. The number of females in each district is higher than that of males, and significant variation is found in the sample.
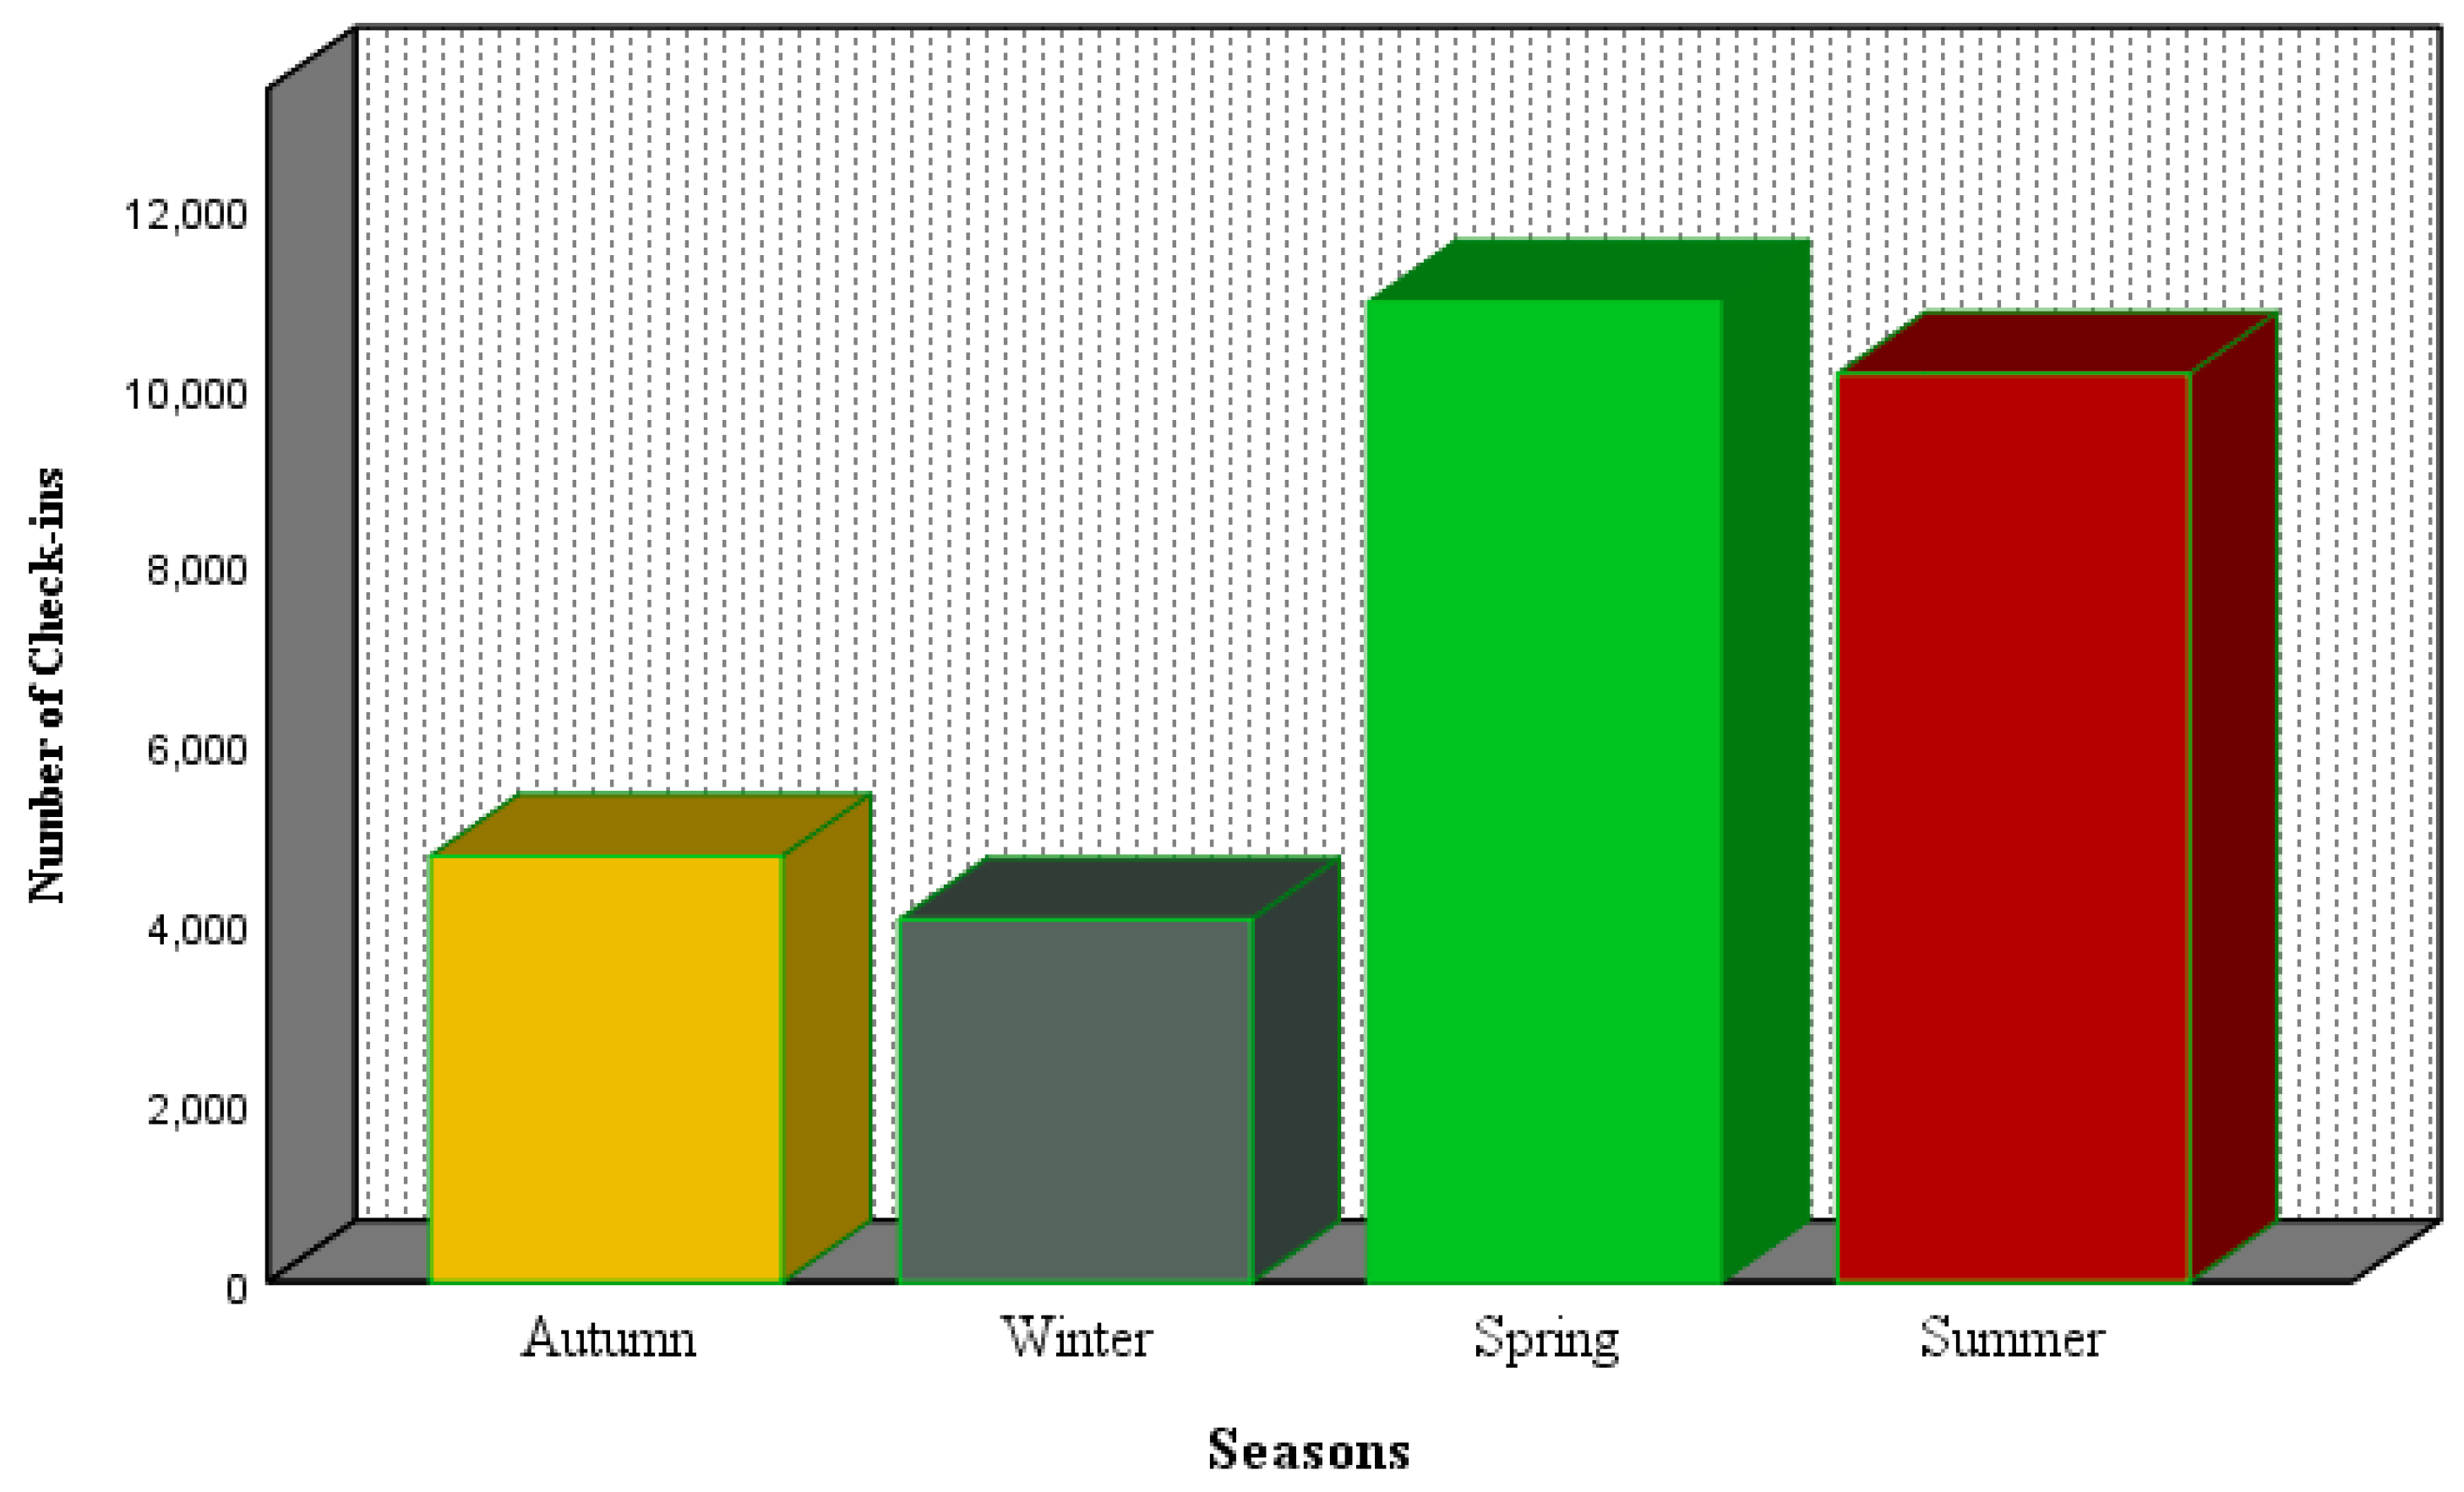
Seasonal variations in visitors to green parks for autumn, winter, spring, and summer were examined. Prominent seasonal variations in user check-ins were identified, and several factors were explored in an attempt to explain these variations, in accordance with similar studies [
5,
71]. The seasonal distribution in
Figure 9 shows that a greater proportion of check-ins are made in parks during summer and spring. It is interesting to note that winter check-ins are slightly lower than autumn check-ins.
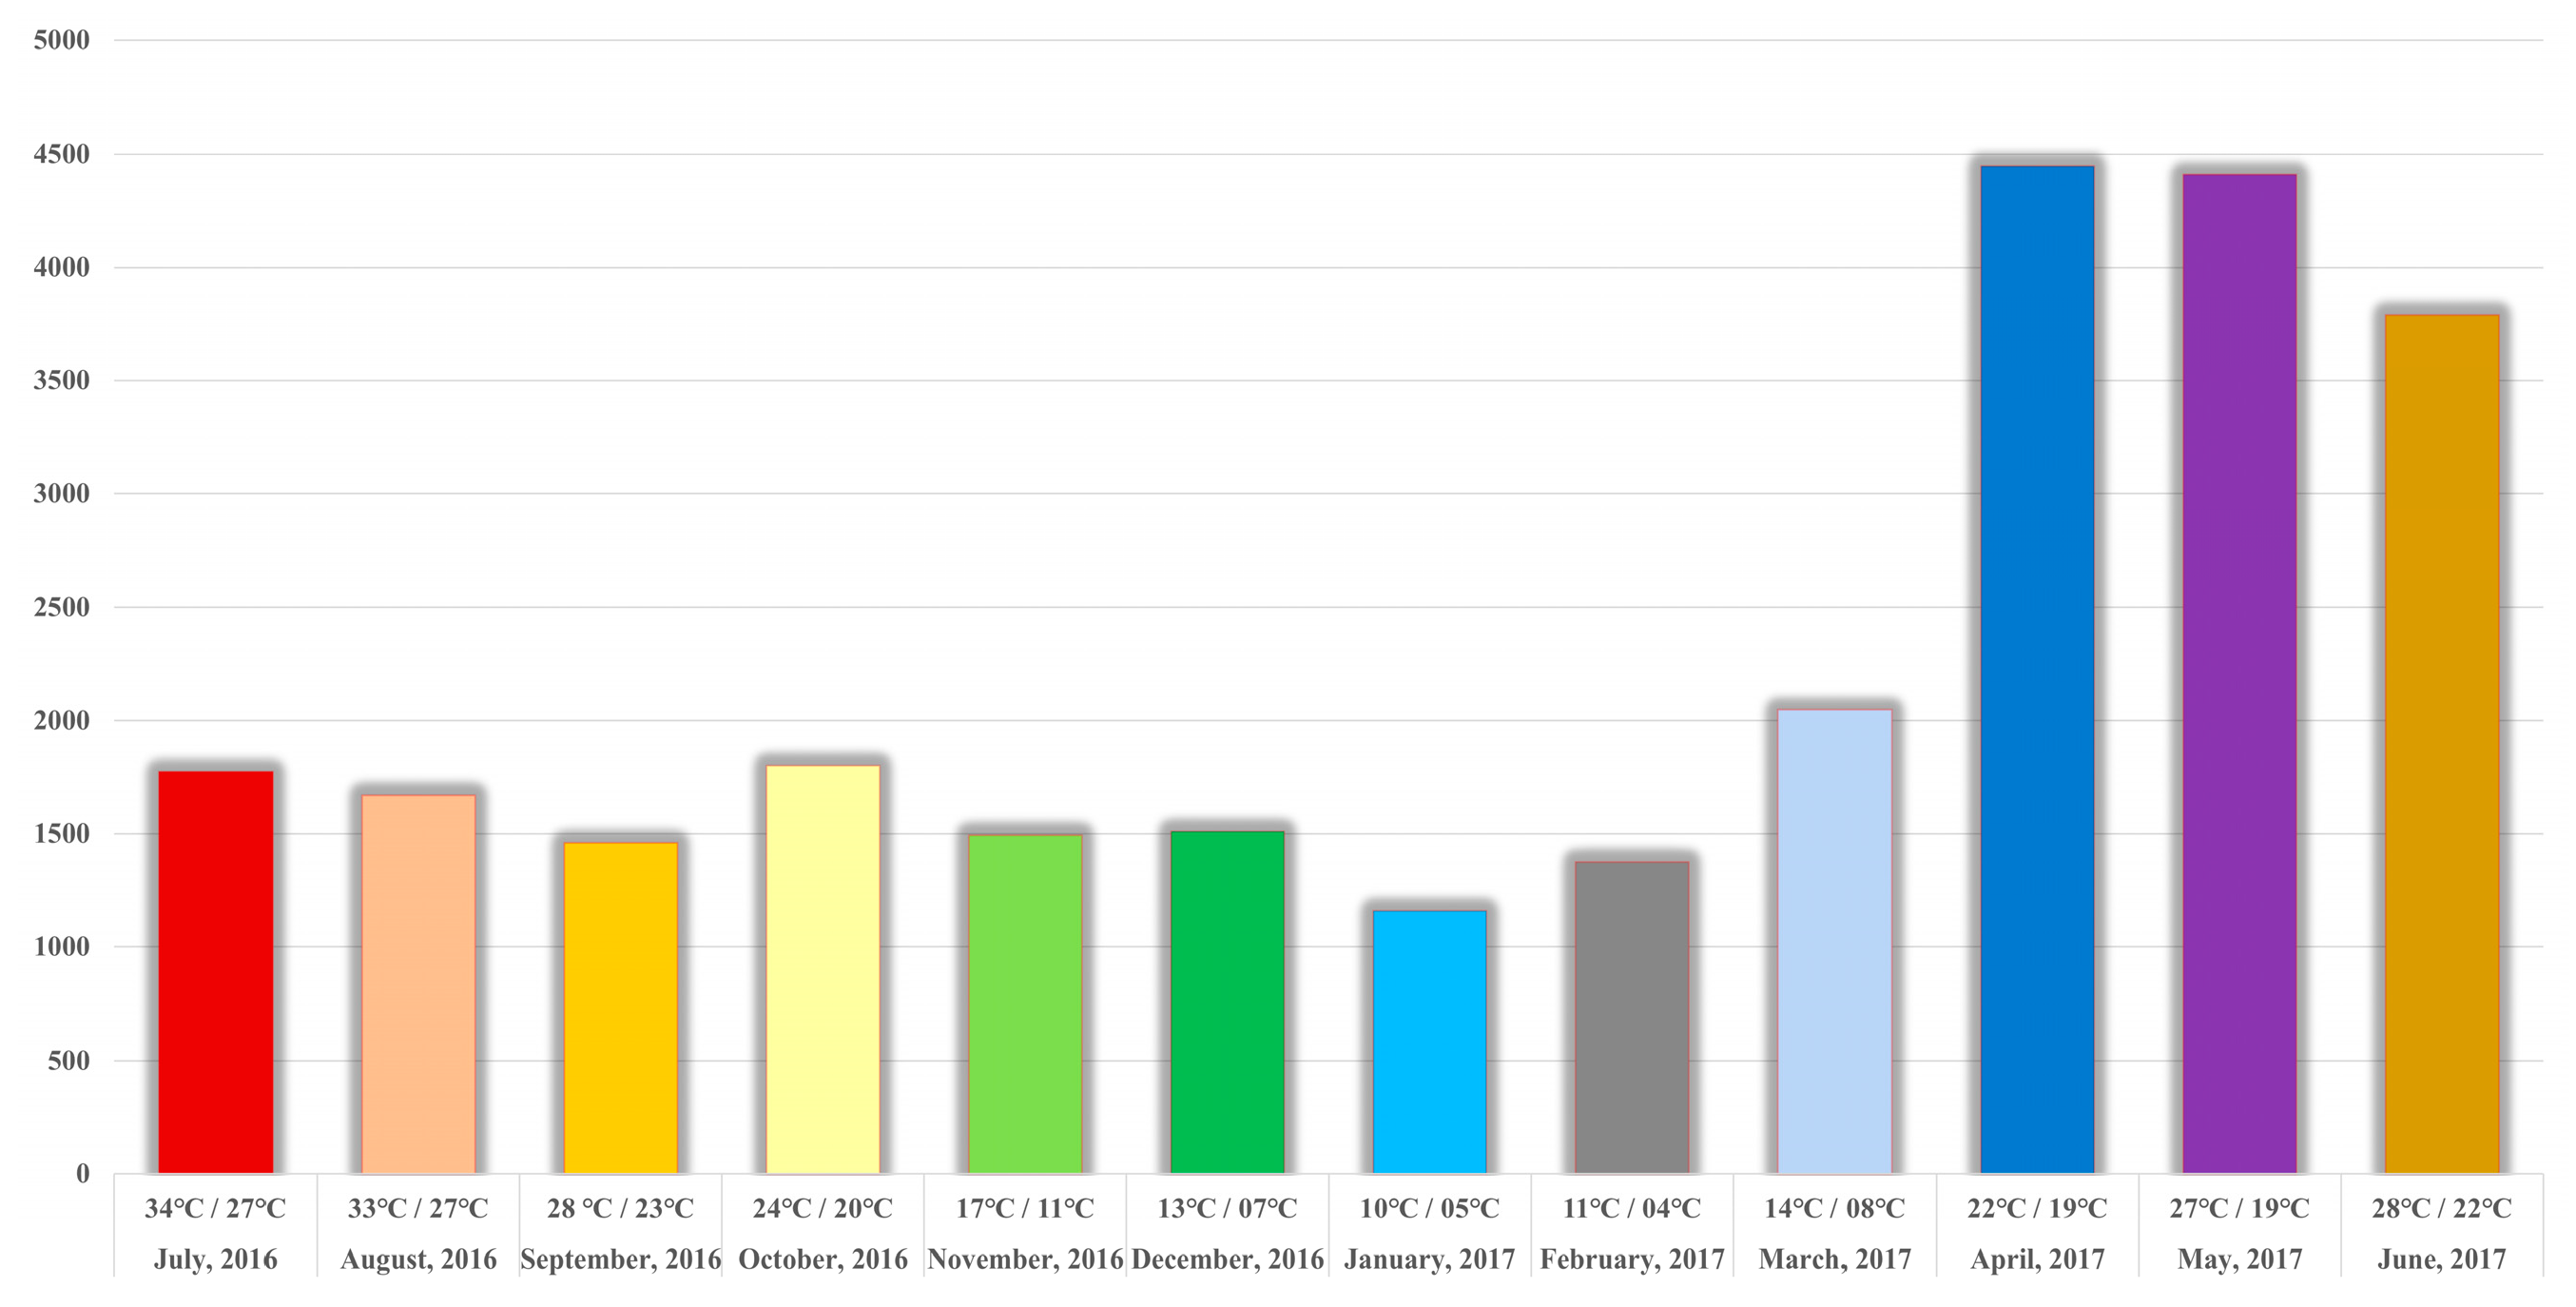
Previous research has shown that the influence of temperature varies in relation to park visitors and physical activities. Some studies have identified temperature as an important factor for explaining the variability in park visits between seasons [
30].
Figure 10 shows the overall park visiting behaviors during the study period. The temperature has a significant effect on the frequency of check-ins for each month. There are many factors that can influence the determination of an individual’s reaction to the climate and its impact on a person’s involvement in outdoor activities. The check-ins are much higher during the months of April, May, and June, which supports the results for seasonal variation that indicate that spring and summer have a large number of check-ins.
6. Discussion
The analysis reveals that Weibo data constitute a useful resource for assessing the features of urban green parks and analyzing spatiotemporal aspects. The benefit of using social media data for analyzing urban green space is that we can extract qualitative and large-scale information for a whole city in more detail.
Some green parks in Shanghai are always crowded, whereas others have fewer visitors. This research aimed to determine the behavioral modifications of park visitors by verifying that the use of green spaces can be influenced by weather or seasons. We investigated the spatiotemporal pattern of the distribution of check-ins in green parks in Shanghai. In this research, we performed an in-depth empirical analysis of check-in behavior using trend graphs and density maps constructed from LBSN data. The spatiotemporal patterns of check-ins were investigated from different perspectives, including differences based on gender, day of the week, and hour of the day. From the temporal perspective, the number of visitors in green parks varied within the day and among the three intervals of the day. From the spatial perspective, the level of spatial agglomeration in urban green parks was greater in the center of the city because this is also the center of activity for other activities [
58]. In particular, spatial agglomeration was the highest in the districts Changning and Hongkou.
This study used geotagged social media check-in data as a proxy to estimate the number of urban park visits in Shanghai, which was used as a case study. This technique is more time-efficient than time-and labor-intensive surveys and can provide exceptional spatial coverage. However, this technique has its own constraints. We did not have access to observed visitor rates, so we were unable to assess whether there was a strong correlation between check-in data and visitations observed in the planning and evaluation of urban areas. The connection between the check-in frequency of Weibo and actual visitation may vary across green parks. A major issue is that, in contrast to traditional census data, social media data generally do not directly provide certain demographic information such as ethnicity and marital status. However, there are ways to extract these variables indirectly [
37].
The key reasons for increasing urbanization are the ever-growing population and booming industrialization [
72]. Despite the potential of LBSN data to assess the characteristics of urban parks and analyze spatial, temporal, and content-specific aspects, the representativeness of the gathered information does have limitations due to contradictions in the georeferenced locations of the users. However, we can infer that at least the population extremes in age (very young and old) and social situations minimize the use of LBSNs; therefore, their influence on the general public’s behavior is minimal in the data. In urban planning and the analysis of urban green parks, geotagged data and demographic data, such as age and ethnicity, are significant factors. It is a problem that social media data typically do not directly provide information that includes names, home addresses, phone numbers, or email addresses—all of which are attainable from conventional census data—but there are ways to collect this information indirectly [
37]. In our case, besides the general representativeness issue, the main limitation is the low number of check-ins per user while visiting a park. This resulted in a less than an ideal number of data points per user.
To the best of our knowledge, this research might be the first case study using Weibo data to analyze the use of urban green parks by using check-in behavior for a large number of green parks in Shanghai. The broad spatial coverage of this study provides useful information that could enhance urban green space planning and development in other large cities. The efficient use of urban green areas has substantial potential to encourage moderate to vigorous physical activities among urban inhabitants. These results emphasize the significance of the use of urban green parks in order to improve the health of urban residents around the world.
7. Conclusions and Future Work
Urban green spaces are areas in which people can participate in health-enhancing physical activities. Using geotagged data from social media platforms to evaluate the variation in visitation allows for the coverage of a larger geographical area compared with conventional techniques, such as visitor surveys and on-site counting. We analyzed the spatiotemporal pattern of urban green areas in Shanghai by using a Weibo dataset. In the present research, which used intensity maps and trends using LBSN data, we conducted an in-depth empirical analysis of check-in behavior. The findings reveal the check-in distribution of users in parks, and the results show that the parks located in the downtown area are more crowded than parks in other districts. The analysis of the seasonal effects on the public’s behavior toward green parks indicates that the number of check-ins is much higher in spring and summer than autumn and winter. The number of Weibo users based on the hour of day and interval of the day (morning, afternoon, evening) reveals that the peak time of park utilization is from noon to the evening. Interesting variations in user behavior based on temperature effects were observed, and the patterns show that April, May, and June are the most popular months in terms of check-ins. Finally, gender-based differences in green park visitors were calculated, and results show that female users are more active in their utilization of social media services while visiting green parks. More facilities such as transport and the area of the park can attract more visitors since this study shows that the visitors to parks in the downtown area are denser compared with other regions. These results can be helpful in urban city planning for green spaces by accounting for the priorities of visitors.
Further research can be carried out using the technique and outcomes of this study. Possible future directions for measuring the patterns of recreational visits to urban green parks include the use of geotagged photographic data to establish patterns of recreational activities. The current research approach can provide more informative results for the behavioral transitions of park visitors if user-profile information such as age, income, marital status, and hometown city can be acquired in the future. Similarly, social media content posted by park users can be further interpreted to help recognize the emotions or feelings of visitors and assess the numerous advantages that urban parks provide. Furthermore, similar research can be carried out in other megacities to evaluate common problems that affect the use of urban green spaces.

 ,
, 


