1. Introduction
Since the first artificial satellites were launched, there have been several advances in the area of environmental sustainability, especially in developing countries such as Brazil [
1]. Space agencies have been tracking individual satellites, placed in orbit, to obtain a synoptic view with a multitude of spectral signatures that are used to provide a rapid understanding of the dynamics of land use/cover (LUC) changes, ranging from a regional to a continental scale [
2]. The quality and flexibility of the large amount of spatial information can assist the scientific community in a wide range of environmental applications: deforestation modelling [
3], monitoring disasters [
4], estimation of total water body [
5] and making a biodiversity assessment of agriculture [
6,
7]. As a result, some studies have led to the design of thematic maps to assist their scientific research by highlighting spatio-temporal patterns in urban and rural areas.
Brazil is one of the quality-assured [
8] and spatially extensive examples of a country that has taken advantage of remote sensing to maintain Earth’s natural resources by creating thematic maps with open source software. Brazil’s continuous data-based monitoring programs of clear-cut deforestation (
PRODES) [
9], and the alert warning system for near-real time deforestation detection (
DETER) [
10,
11], conducted by the Brazilian National Institute for Space Research (INPE), have operated in response to evidence of shifts in anthropology resulting from changes in native vegetation and laid the groundwork for a detailed examination. Since 1988, PRODES has systematically estimated the official annual rates (
http://www.obt.inpe.br/OBT/assuntos/programas/amazonia/prodes) based on the known deforestation increment areas. DETER addresses the sparser and scattered deforestation activities on a daily basis in constrast with PRODES [
12].
Technical requirements have triggered a concern on the part of government agencies to improve the interoperable web services that are employed so that they can be used to discover, retrieve, integrate and share a large amount of digitalized spatial data across different locations in an effective way [
13,
14,
15]. This top-down approach, known as Spatial Data Infrastructure (SDI), relies on the technologies, principles, policies, specifications and people involved in the established procedures and mechanisms adopted in every initiative (e.g., INSPIRE (
https://inspire.ec.europa.eu/), US NSDI (
https://www.fgdc.gov/nsdi/nsdi.html)) to provide non-proprietary access to both time stamped and topologically structured data [
16,
17]. The first attempts at developing SDIs focused on monolithic processes (i.e., large single web applications) with centralized governance and data management based on space, time and thematic attributes [
18]. However, the SDIs did not follow the recent technological trends in their attempt to answer more precise questions (e.g., the availability of data in specific regions, or the use of specific thematic parameters in defined periods of time) which are raised by those users that either do not have a background in geo-informatics or seek to analyze these data in an easier way [
19].
This is because SDIs rely on web service interface standards to exchange spatial data via Hyper Text Transport Protocol (HTTP), which hampers the power boost of analytics with regard to pre-defined libraries designed for script languages such as
Python and
R. This means that there is still a need to transform current infrastructure-based approaches into algorithmic strategies with flexible, modularised and advanced analytical methods [
20]. Apart from the fact that novel object-oriented interfaces that are guided by statistical analysis include a partial configuration of core and back-end enhancements (e.g., the management for semi- and unstructured datasets), they still might be able to overcome the challenges posed by data analytic capabilities. In addition, the new Big Data era requires less complex services and reproducible environments for rapid analysis [
21,
22].
What needs to be emphasized here is that an analysis of heterogeneous scientific data [
19,
20] that scale dynamically [
23] result in a great effort to harmonize, pre-process and analyze the coupled spatial data after downloading them from SDIs [
24]. In summary, the challenges faced when developing an SDI to disseminate deforestation data have the following very distinct aims: (1) to adapt the heterogeneous environmental programs to the emergence and expansion of novel SDIs [
25]; (2) to handle the integrated and adaptive management of spatial data [
26]; and, (3) to be aware of constant innovative technological advances regardless of the platform that is used, as long as it remains generic and flexible with a certain degree of modularity [
27].
Our hypothesis is to build on the research findings of a previous study [
28] and design a spatial data analytics infrastructure called TerraBrasilis (
http://terrabrasilis.dpi.inpe.br), that splits the main components of SDI into micro-services. It is an ongoing project in so far as it is designed for both a fully automated building and deployment process to leverage dynamic scenarios such as those that require fine spatio-temporal resolution. TerraBrasilis is a web-based platform that seeks to arrange, access and disseminate spatial data from thematic maps produced by INPE environmental projects. It seeks to satisfy the requirements of GIS (geographic information system) interoperability standards and ensure compliance with the Brazilian National Spatial Data Infrastructure (INDE), while at the same time employing ubiquitous and more cost-effective analytical Application Programming Interfaces (API). The underlying purpose of developing these APIs is to increase data availability since they allow users to adjust their analysis to specific regions without further prefiltering of geometry clipping. The second aim relies on an analysis based on analytic capabilities in the environment which can make ready-to-use methods easier, and thus, allow a shift from traditional SDIs to a spatial data analytics infrastructure. As a result, less processing time is necessary to aggregate different data in spatial on-demand and display them in the visualization layers.
Thus, the main research contributions made by this study can be summarized as follows:
Engineering and designing requirements at an architectural level to implement and assess an open-source SDI across a cluster of virtualized computer resources. This entails using a micro-services architecture (a) to improve fault tolerance in unstable computer network scenarios, (b) to add simplicity so that new changes can be incremented, and (c) to make it easier to deploy and maintain;
Making continuous thematic mapping projects more available (such as DETER and PRODES) to provide information not only by means of conventional GIS interoperability but also through semi- and unstructured formats in the analytics environment;
Making an improvement in the TerraBrasilis platform; this is based on the lessons that can be learnt from the examination of deforested areas taken from a real-world deforestation scenario such as that found in Brazil.
2. A Spatial Data Infrastructure for Big Earth Observation Data Analytics
SDIs can be defined as a means of employing technologies, policies, standards and stakeholders to assist in providing access to spatial data [
29] and enabling them to be disseminated. SDIs are centralized from the standpoint of data management. They also support multi-participant involvement in long-term environmental projects. Examples of initiatives such as INSPIRE and NSDI illustrate the efforts made by government agencies to catalog, discover and download datasets with different scales [
17]. However, SDIs still require enhancements for analyzing scientific data [
19,
20], which scale dynamically from heterogeneous sources [
23] and must be harmonized and pre-processed when they appear in a large quantity [
24]. One solution involves carrying out a consistent kind of processing with the server-side model which is able to avoid the data communication overhead between the client and server. This feature requires novel approaches called big Earth observation data (BEOD) architectures.
BEOD architectures were designed to break away from the standardized web services used in SDIs since it is not clear yet whether or not they can adjust to new Big Data era that has emerged [
30]. This is the case with Google Earth Engine (GEE) which is built on top of the Map-Reduce model, one of the most efficient user-friendly platforms for widely distributed and concurrent computing and large-scale analysis [
31]. Its non-proprietary spatial variations [
32,
33,
34] and alternative interfaces for image processing [
35,
36] raise cutting-edge challenges for back-end computing. Since there is a lack of skilled labor in the computing infrastructure (e.g., for replication, redundancy and communication), scientists have relied on cloud providers to virtualize computer resources. The classic example in the private sphere that adopts a platform-independent approach, is Amazon Elastic Compute Cloud (EC2) [
37,
38], which is transforming the Earth-Science domain by enhancing scientific reproducibility and preparing analysis-ready-data for the next GIS generation such as CloudGIS [
39].
Since spatio-temporal data suffered over a long time from a lack of scientific representation, multidimensional array databases have emerged as useful alternatives. SciDB [
40] relies on the mathematical concept ofa 3-D array and improves interoperability at the algebraic level [
41]. In another example, Rasdaman [
42] provides similar features with an SQL-like lightweight interface, which include, tuning parameters such as vertical partitioning and compression in a chunk-based storage mechanism [
43,
44]. These functionalities deploy an overlapping strategy to balance computational load and memory consumption. This means that they can store data between many computing nodes with high availability and perform multiple aggregated tasks of great complexity independently. There is an emerging logical model called data cube which is also designed to remove the burden from scientists of having to compile BEOD and offer “analysis ready data” (ARD) [
45]. This term stands for providing Earth Observation data with a reduced learning curve in real time for data wrangling satellite imagery and the reuse of processing methods for analysis [
46,
47,
48].
Inlight of this, our studyhas made a significant advance by enhancing the capabilities needed for conducting a complex analysis within SDIs [
49]. Their limitations with regard to dealing with incremental programming and carrying out a scalable innovative analysis, can be overcome bymeans of statistical software packages such as those contained in the CRAN repository (
https://cran.r-project.org/). In addition, if a database design is created it makes it faster and easier to conduct an analysis than using the structured data formats provided by standard web services (e.g., Sensor Observation Service). These analytical and functional requirements are incorporated by SDIs along with the web mapping and cataloguing services. This means that an analysis-friendly environment allows spatial data and their particular features to be handled in a much more sophisticated way than only relying on infrastructure-based implementations.
3. The Requirements of Spatial Data Infrastructure for Producing Thematic Maps for Dissemination
The requirements of SDI for thematic mapping correspond to the structure and behavioral patterns needed to establish priorities and draw up the guidelines for developing a system [
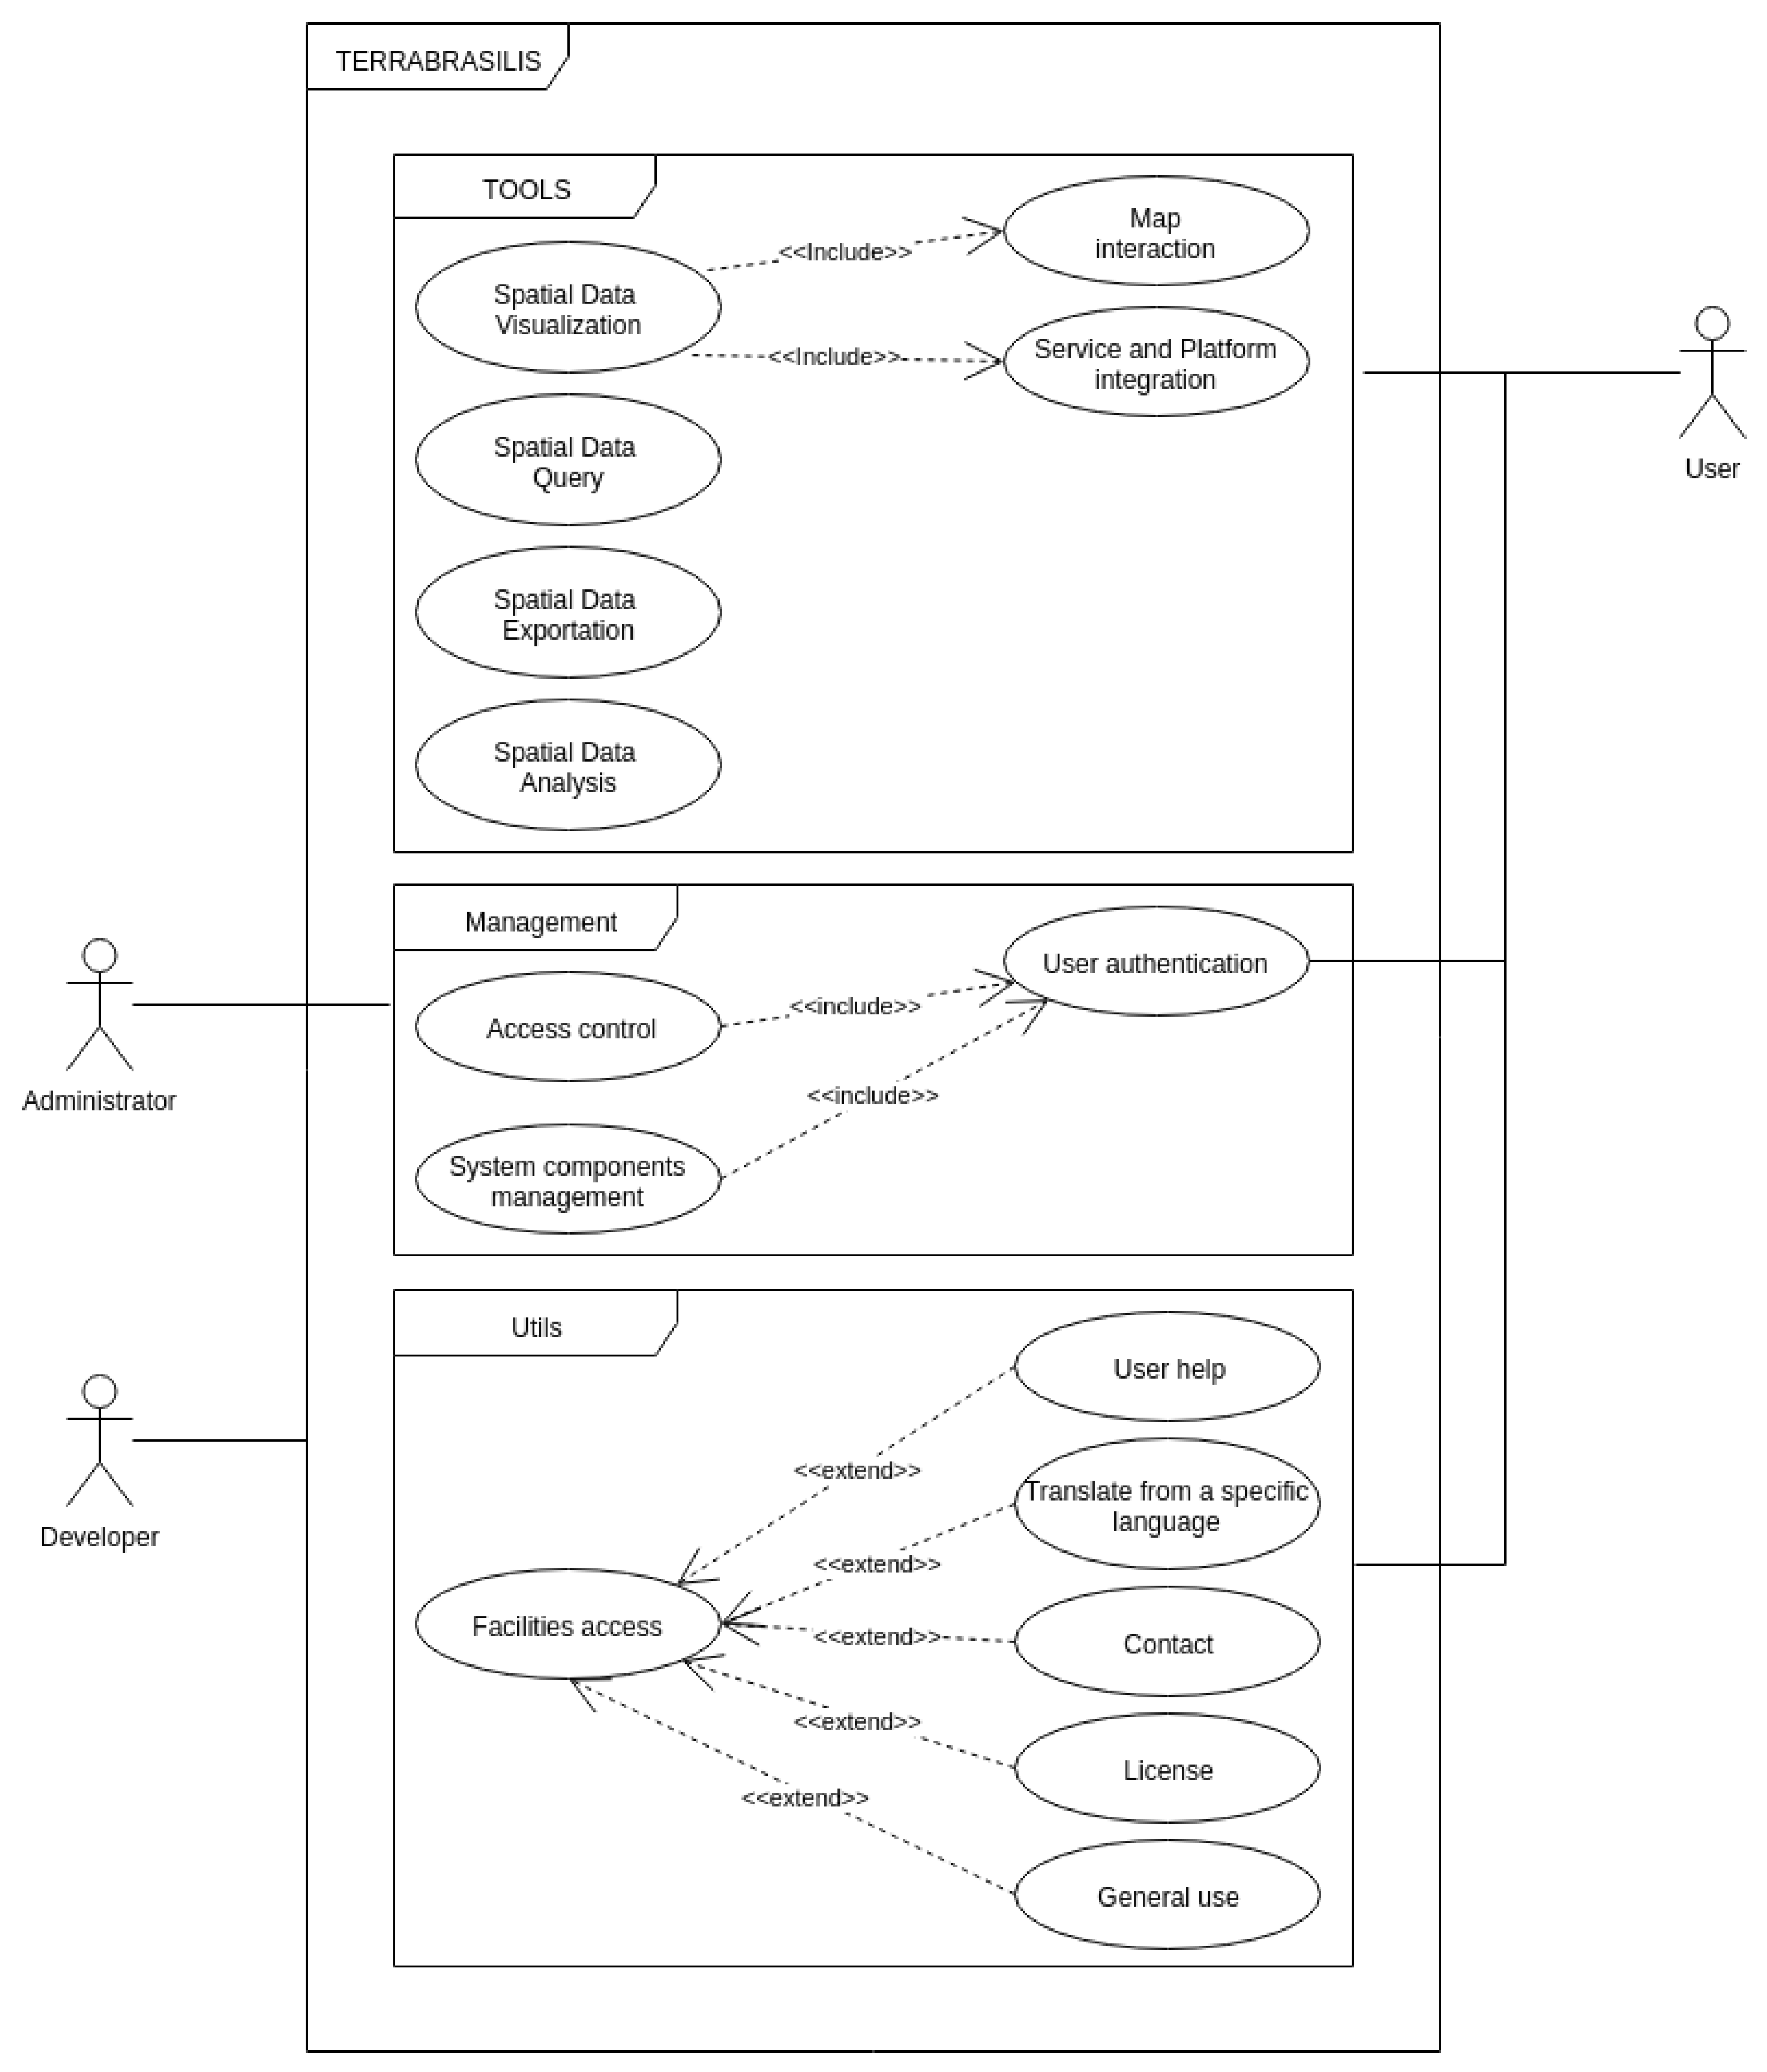
50]. By means of an evolving analytical model designed from a business perspective, this task synthesizes the basic functional and non-functional requirements that can represent the dynamics of LUC applications and additional features inherent in domain-related software. With this in mind, our aim is to summarize the principal functions (
Figure 1) specified by three key players: the developer, administrator and user. The functional requirements include the following: spatial data visualization with maps and dashboards, different integrated services, security access control mechanisms, administration and governance management, metadata query and storage tools, exporting large databases, and data analysis. At the same time, the approach adopted for non-functional requirements includes the following attributes: (1) quality, (2) performance, (3) security, (4) usability, (5) testability, and (6) traceability.
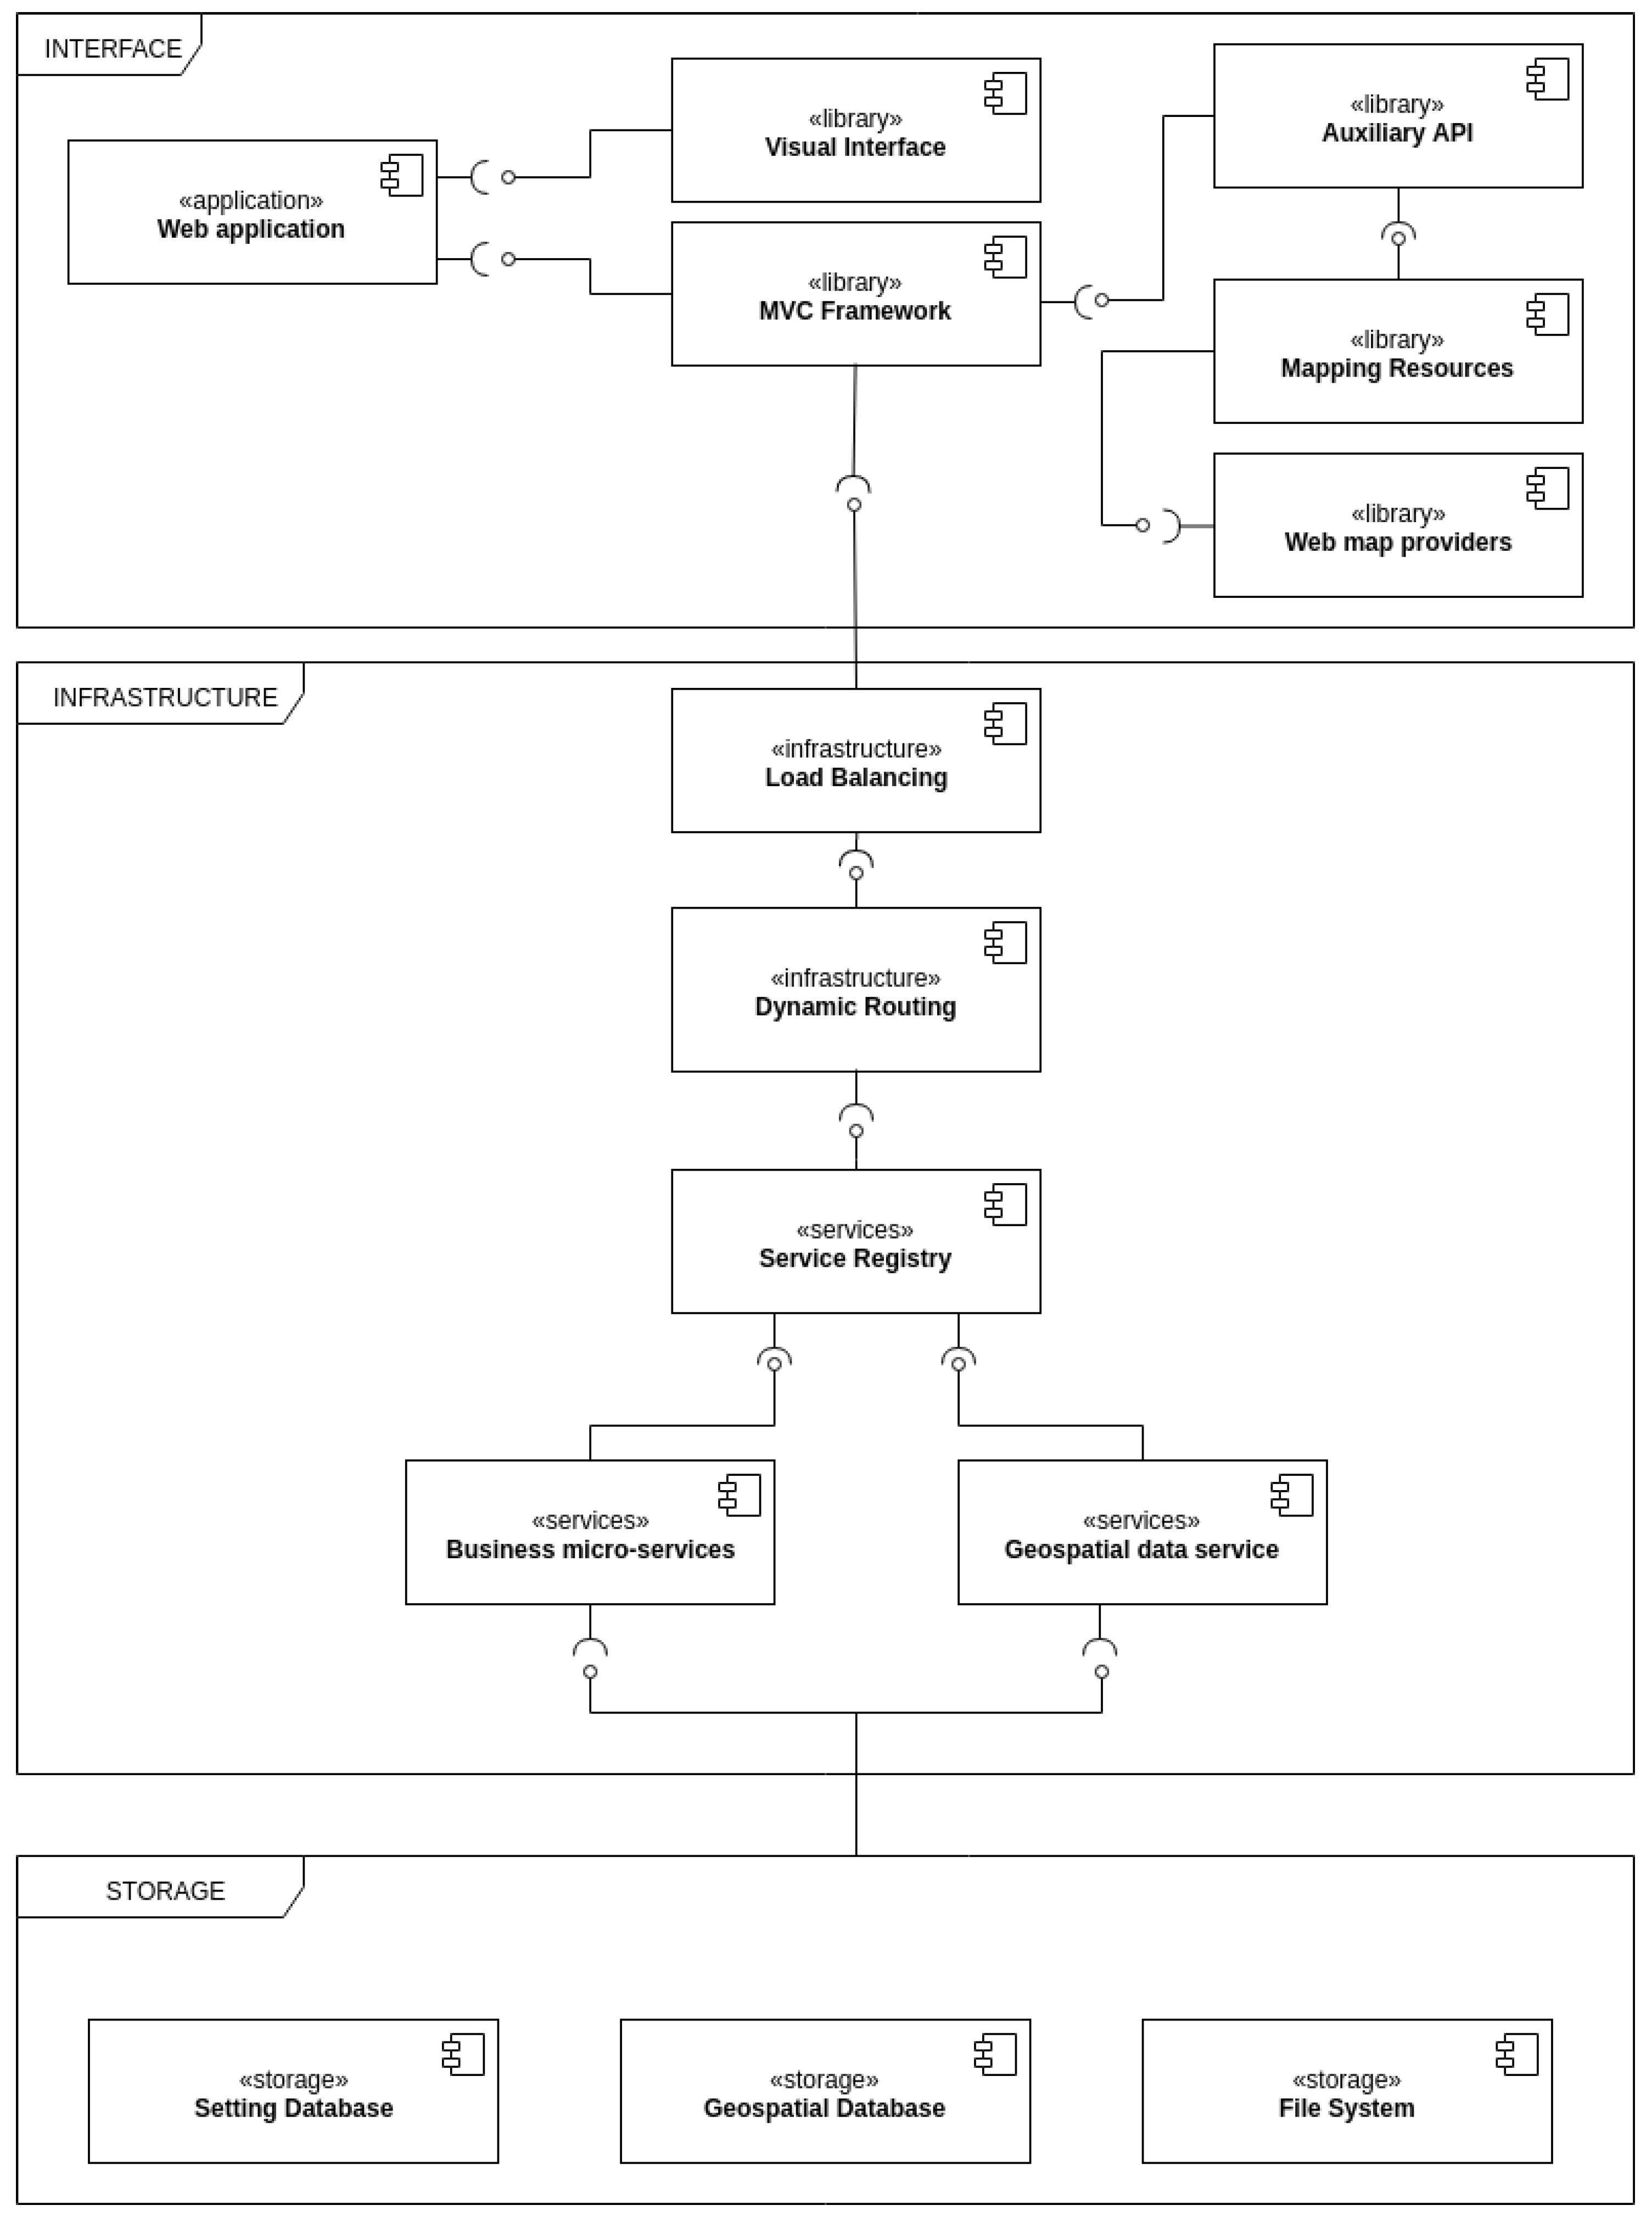
In addition, we designed a structured diagram (
Figure 2) with three packages (interface, infrastructure and storage) to represent the software components at both a business and technical architectural level. Each of these components contains stereotypes represented by
«» and is connected to a mounting connector to represent the provider or customer of the information/service. The interface package contains the web application core component that is connected to both the visual interface and the model-view-controller (MVC) framework. The MVC framework plays a key role since it brokers the use of the service and is connected to the load balancing component in the infrastructure package. As well as this, the MVC framework is connected to the auxiliary libraries, together with the mapping resources and their web map providers.
In the infrastructure package, the micro-service approach helps to improve scalability and dynamism through individual service management based on the payload required. This means that the greater the amount of services that change individually, the lower is the impact on the infrastructure. The load balancing and dynamic routing component is able to balance the load for each service. The routing component uses the service registry, which is regarded as a database with service instances and their locations. The registry enables service instances to be activated at startup and canceled at shutdown. In addition, the service registry checks the integrity of the service instances to enable their requests. Business micro-services can assist with requests that involve application business logic, while geospatial data services cover all requests that involve geospatial data. Both services communicate with the storage package, which contains three key components: the configuration database, geospatial database, and file system.
4. TerraBrasilis: A Spatial Data Analytics Infrastructure
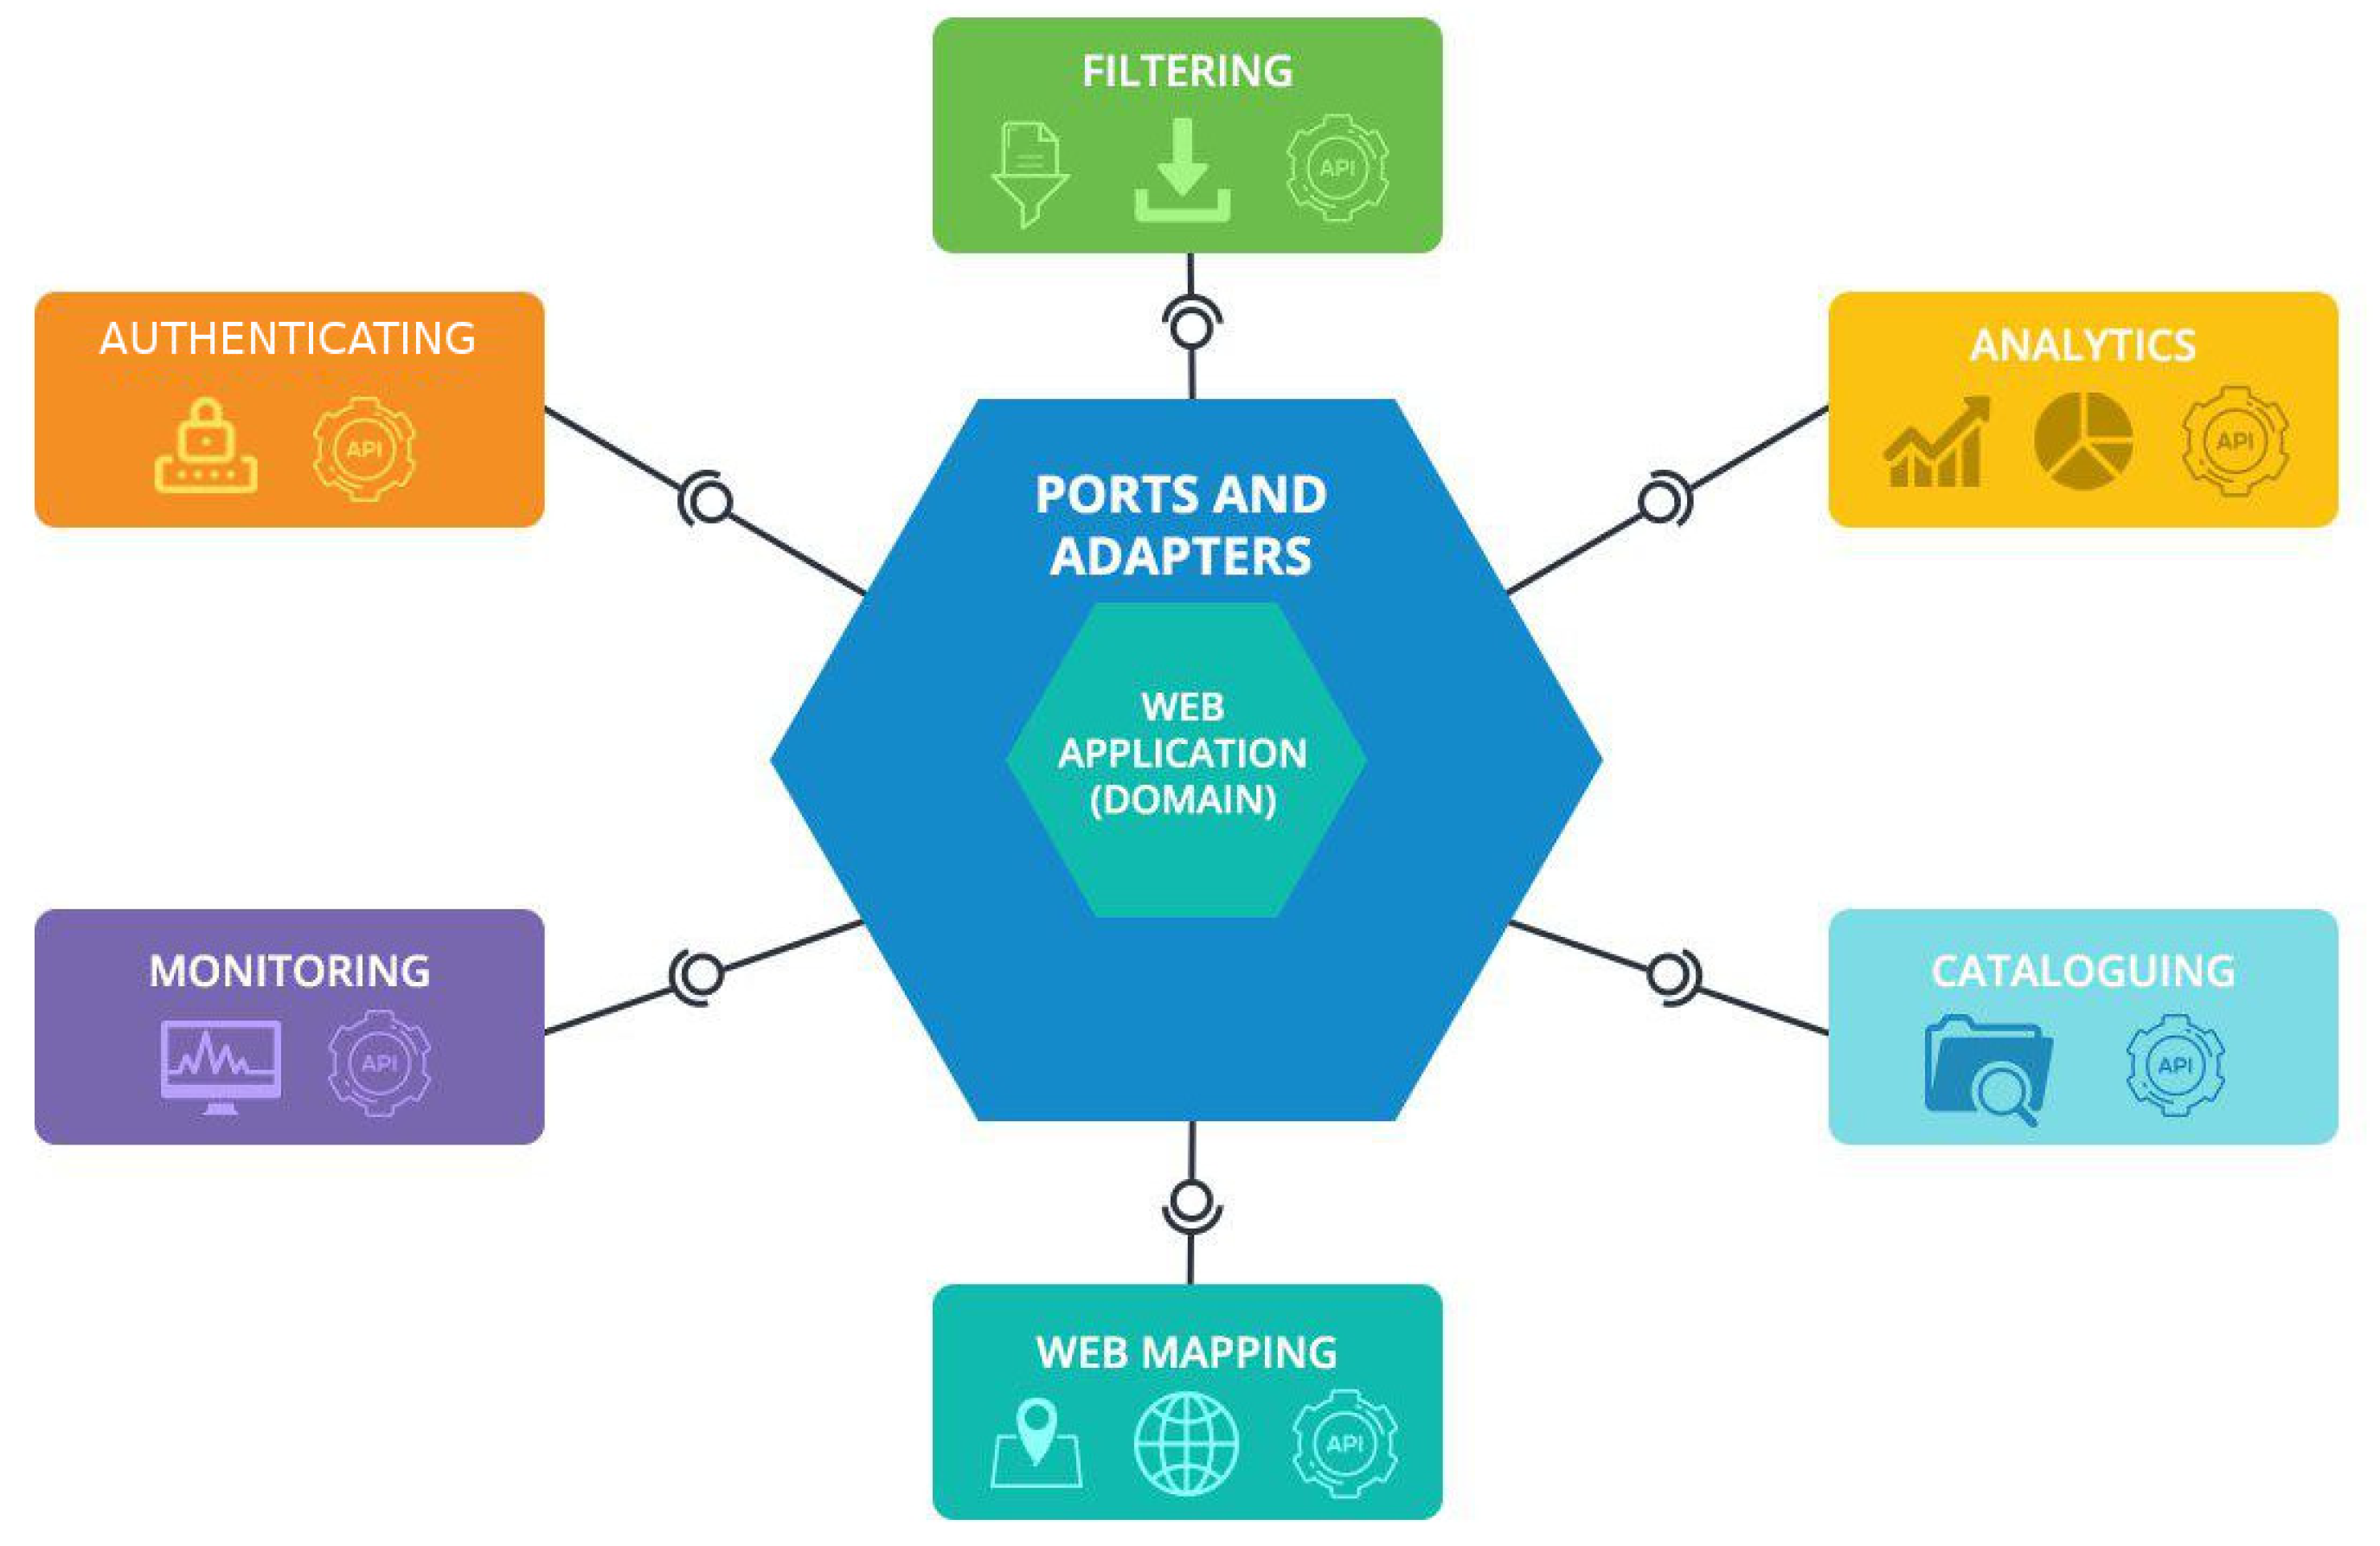
We have built TerraBrasilis based on the basis of the following set of six distributed services across a cluster of machines: (1) web mapping; (2) cataloguing; (3) analytics; (4) filtering; (5) monitoring; and, (6) authentication. They are decoupled from technological constraints caused by specific domain-based SDIs. TerraBrasilis has a hexagonal architecture with adapters that hide the inner complexity of its domain model from each service. These adapters transform exchanged data into generic invocation objects so that they can be understood by web application logic and forwarded back to the respective service by means of a specific output format. This hierarchical style of development allows services to be replaceable (e.g., by undergoing changes in technology) and extensible (e.g., by revealing novel functionalities) without affecting, or being affected by the web application core.
Figure 3 depicts the high-level representation of the TerraBrasilis layered architecture.
These services are wrapped up in virtualized packages, called containers, by using a lightweight operating-system-level virtualization. Furthermore, in this way a software-as-a-service approach can be adopted through which the services can be put together with their dependencies. Services can roughlybe divided into four key areas with regard to both the reliability of the computing environment and future deployments in different information technology (IT) infrastructures. First, TerraBrasilis maintains GIS interoperability by complying with internationally recognized open standards for spatial data exchange, in which are stored in an object-relational database and connected to a spatial service plug-in (see
Section 4.1). Second, TerraBrasilis is in conformance with INDE specifications since it is a government web portal that is designed to disseminate spatial data (see
Section 4.2). Third, it offers structural graphic designs with quick filtering of multi-dimensional datasets sent in the analytics interface by a Representational State Transfer (REST) (see
Section 4.3). Fourth, we monitor modularised and digitally authenticated services to provide measurement resource metrics and thus establish a data-driven culture (see
Section 4.4). Finally, TerraBrasilis can enhance traditional spatial analysis since it enables efficient algorithms to solve interdisciplinary problems (see
Section 4.5).
4.1. Interoperability of the Geographic Information System
TerraBrasilis contains an open source map server (
GeoServer (
http://terrabrasilis.dpi.inpe.br/geoserver/web/) for displaying interoperable spatial data. This map server is designed for GIS interoperability. It is a
Java software implementation, compliant with Open Geospatial Consortium (OGC) standards such as Web Feature Service (WFS) and Web Map Service (WMS). By using these protocols, users can customize the manipulation of vector and raster datasets to deliver near-real time and flexible custom styled maps. Its capabilities include security mechanisms in a robust and scalable production environment. In addition,
GeoServer allows an efficient exploration of configuration options (e.g., database connection pooling, tiling cache server and styling of map features on request) through low-cost scripting. Finally, it eliminates redundant request processing and avoids the need to conform to complex schemes.
TerraBrasilis also integrates customized mapping API
https://github.com/Terrabrasilis/terrabrasilis-api procedures and utilities (
https://github.com/Terrabrasilis/terrabrasilis-util) as a simple means of creating interactive maps. These maps can be used across platforms with different screen resolutions and are given configuration parameters, at start up. They are then stored in a No-SQL database called
MongoDB, provided by a business API implemented in
Java. Its source code is well-documented and allows other technical staff to extend its existing plug-ins.
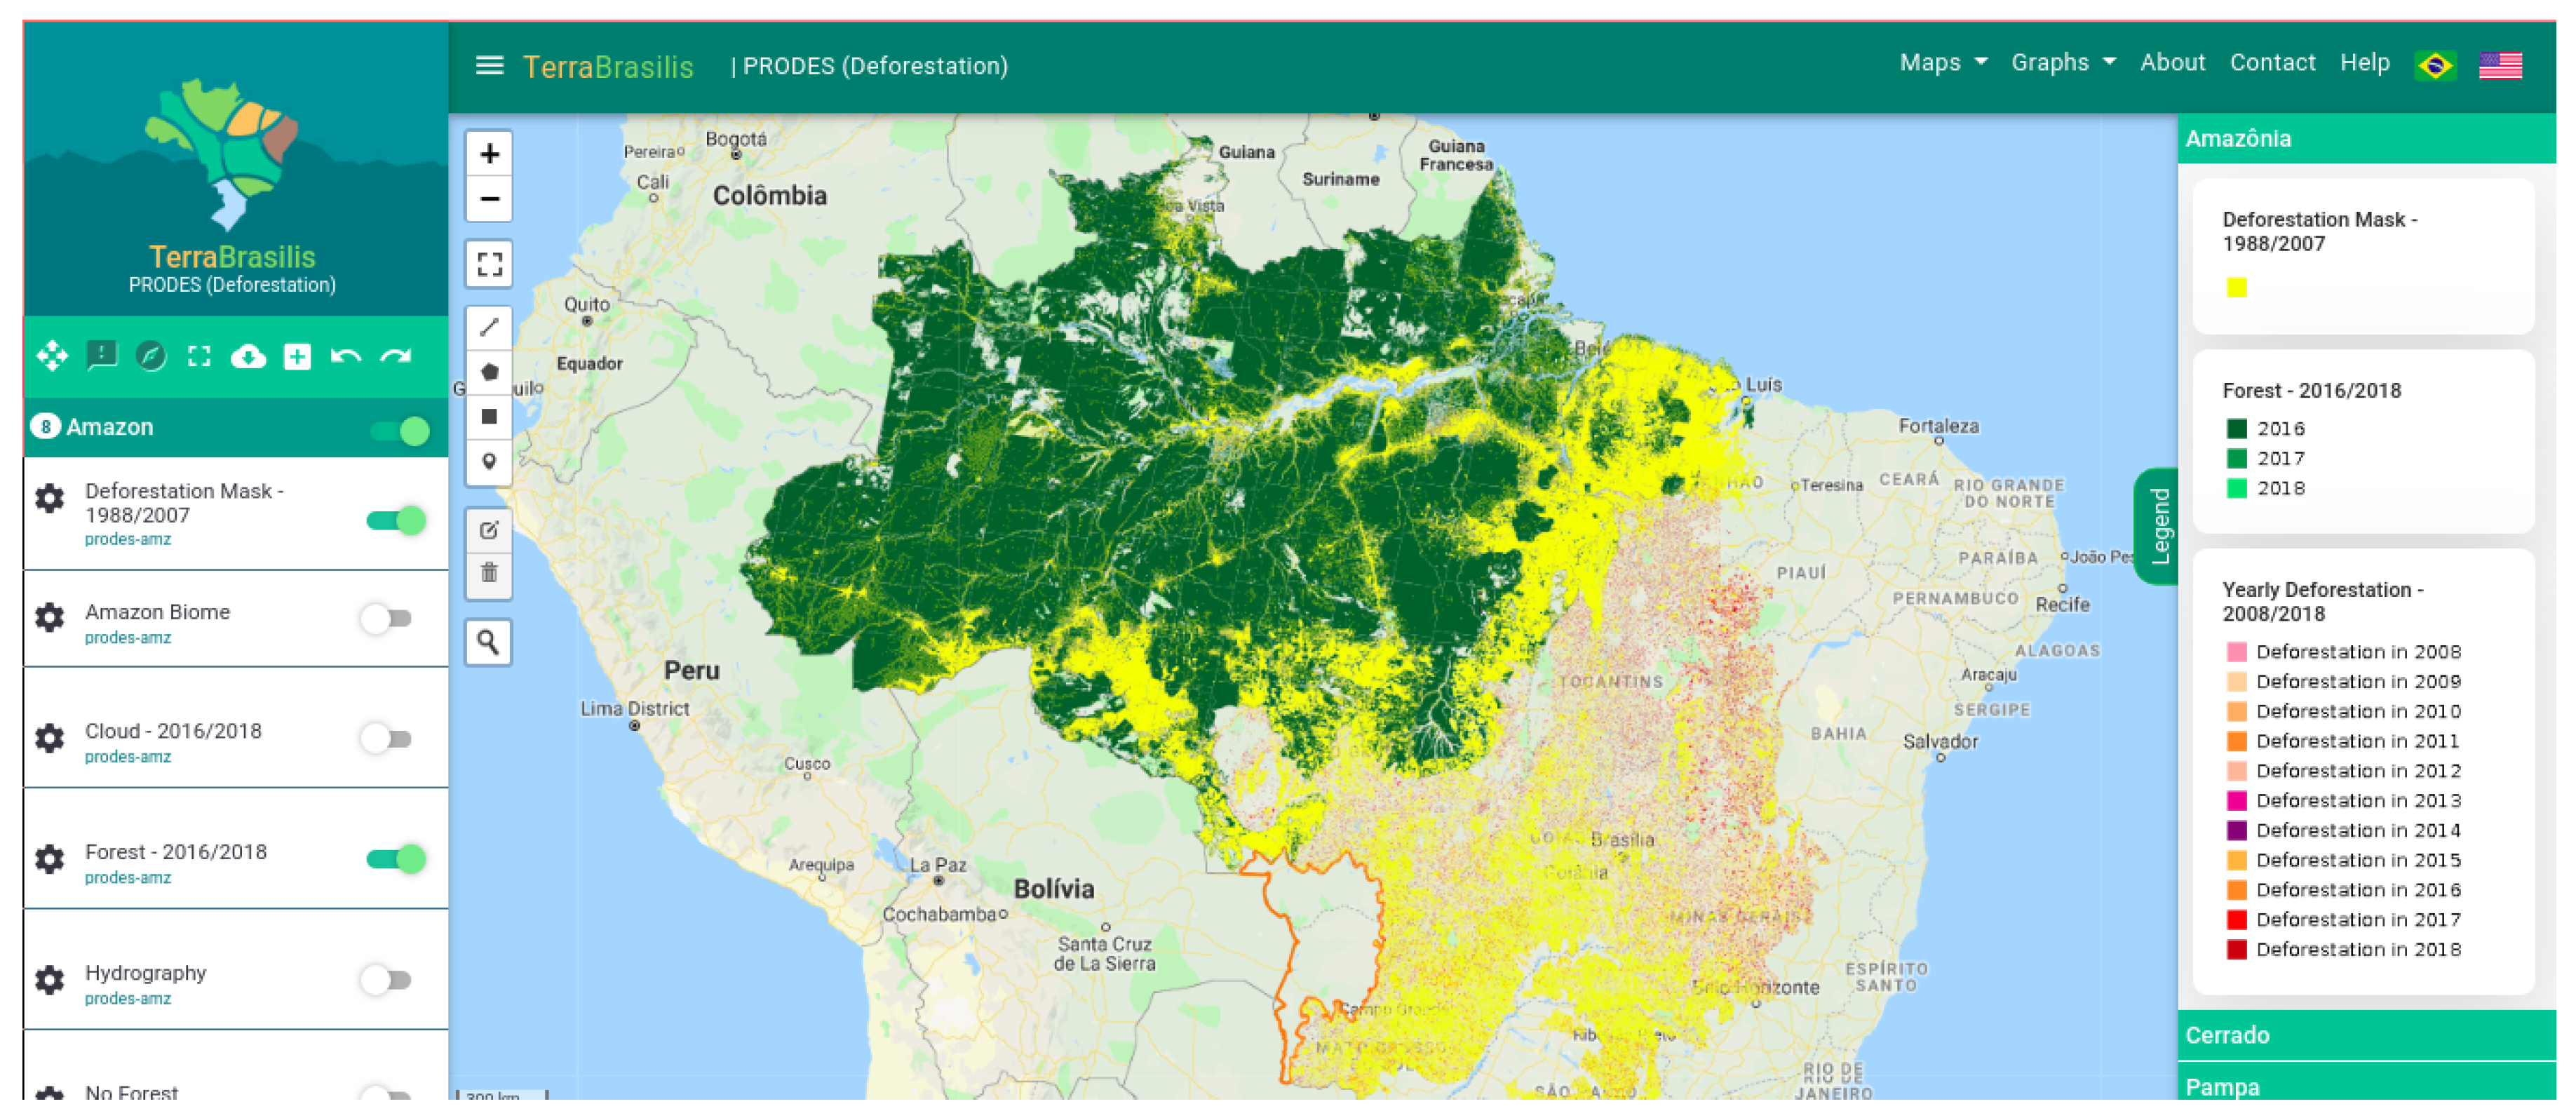
Figure 4 represents the general map controls that are implemented in
Javascript to handle, change, select, add and remove satellite baselayers and deforestation overlayers. The map options include clickable/draggable control methods for dealing with the map zoom level, drawing polygons and markers, and transforming a place name into a spatial coordinate by means of a short-form gazetteer. There is a side navigation menu containing a layer tree, with a list of subjects, where each layer contains specific tools such as basic information in pop-ups, metadata, a transparency slider, a time component and a download button.
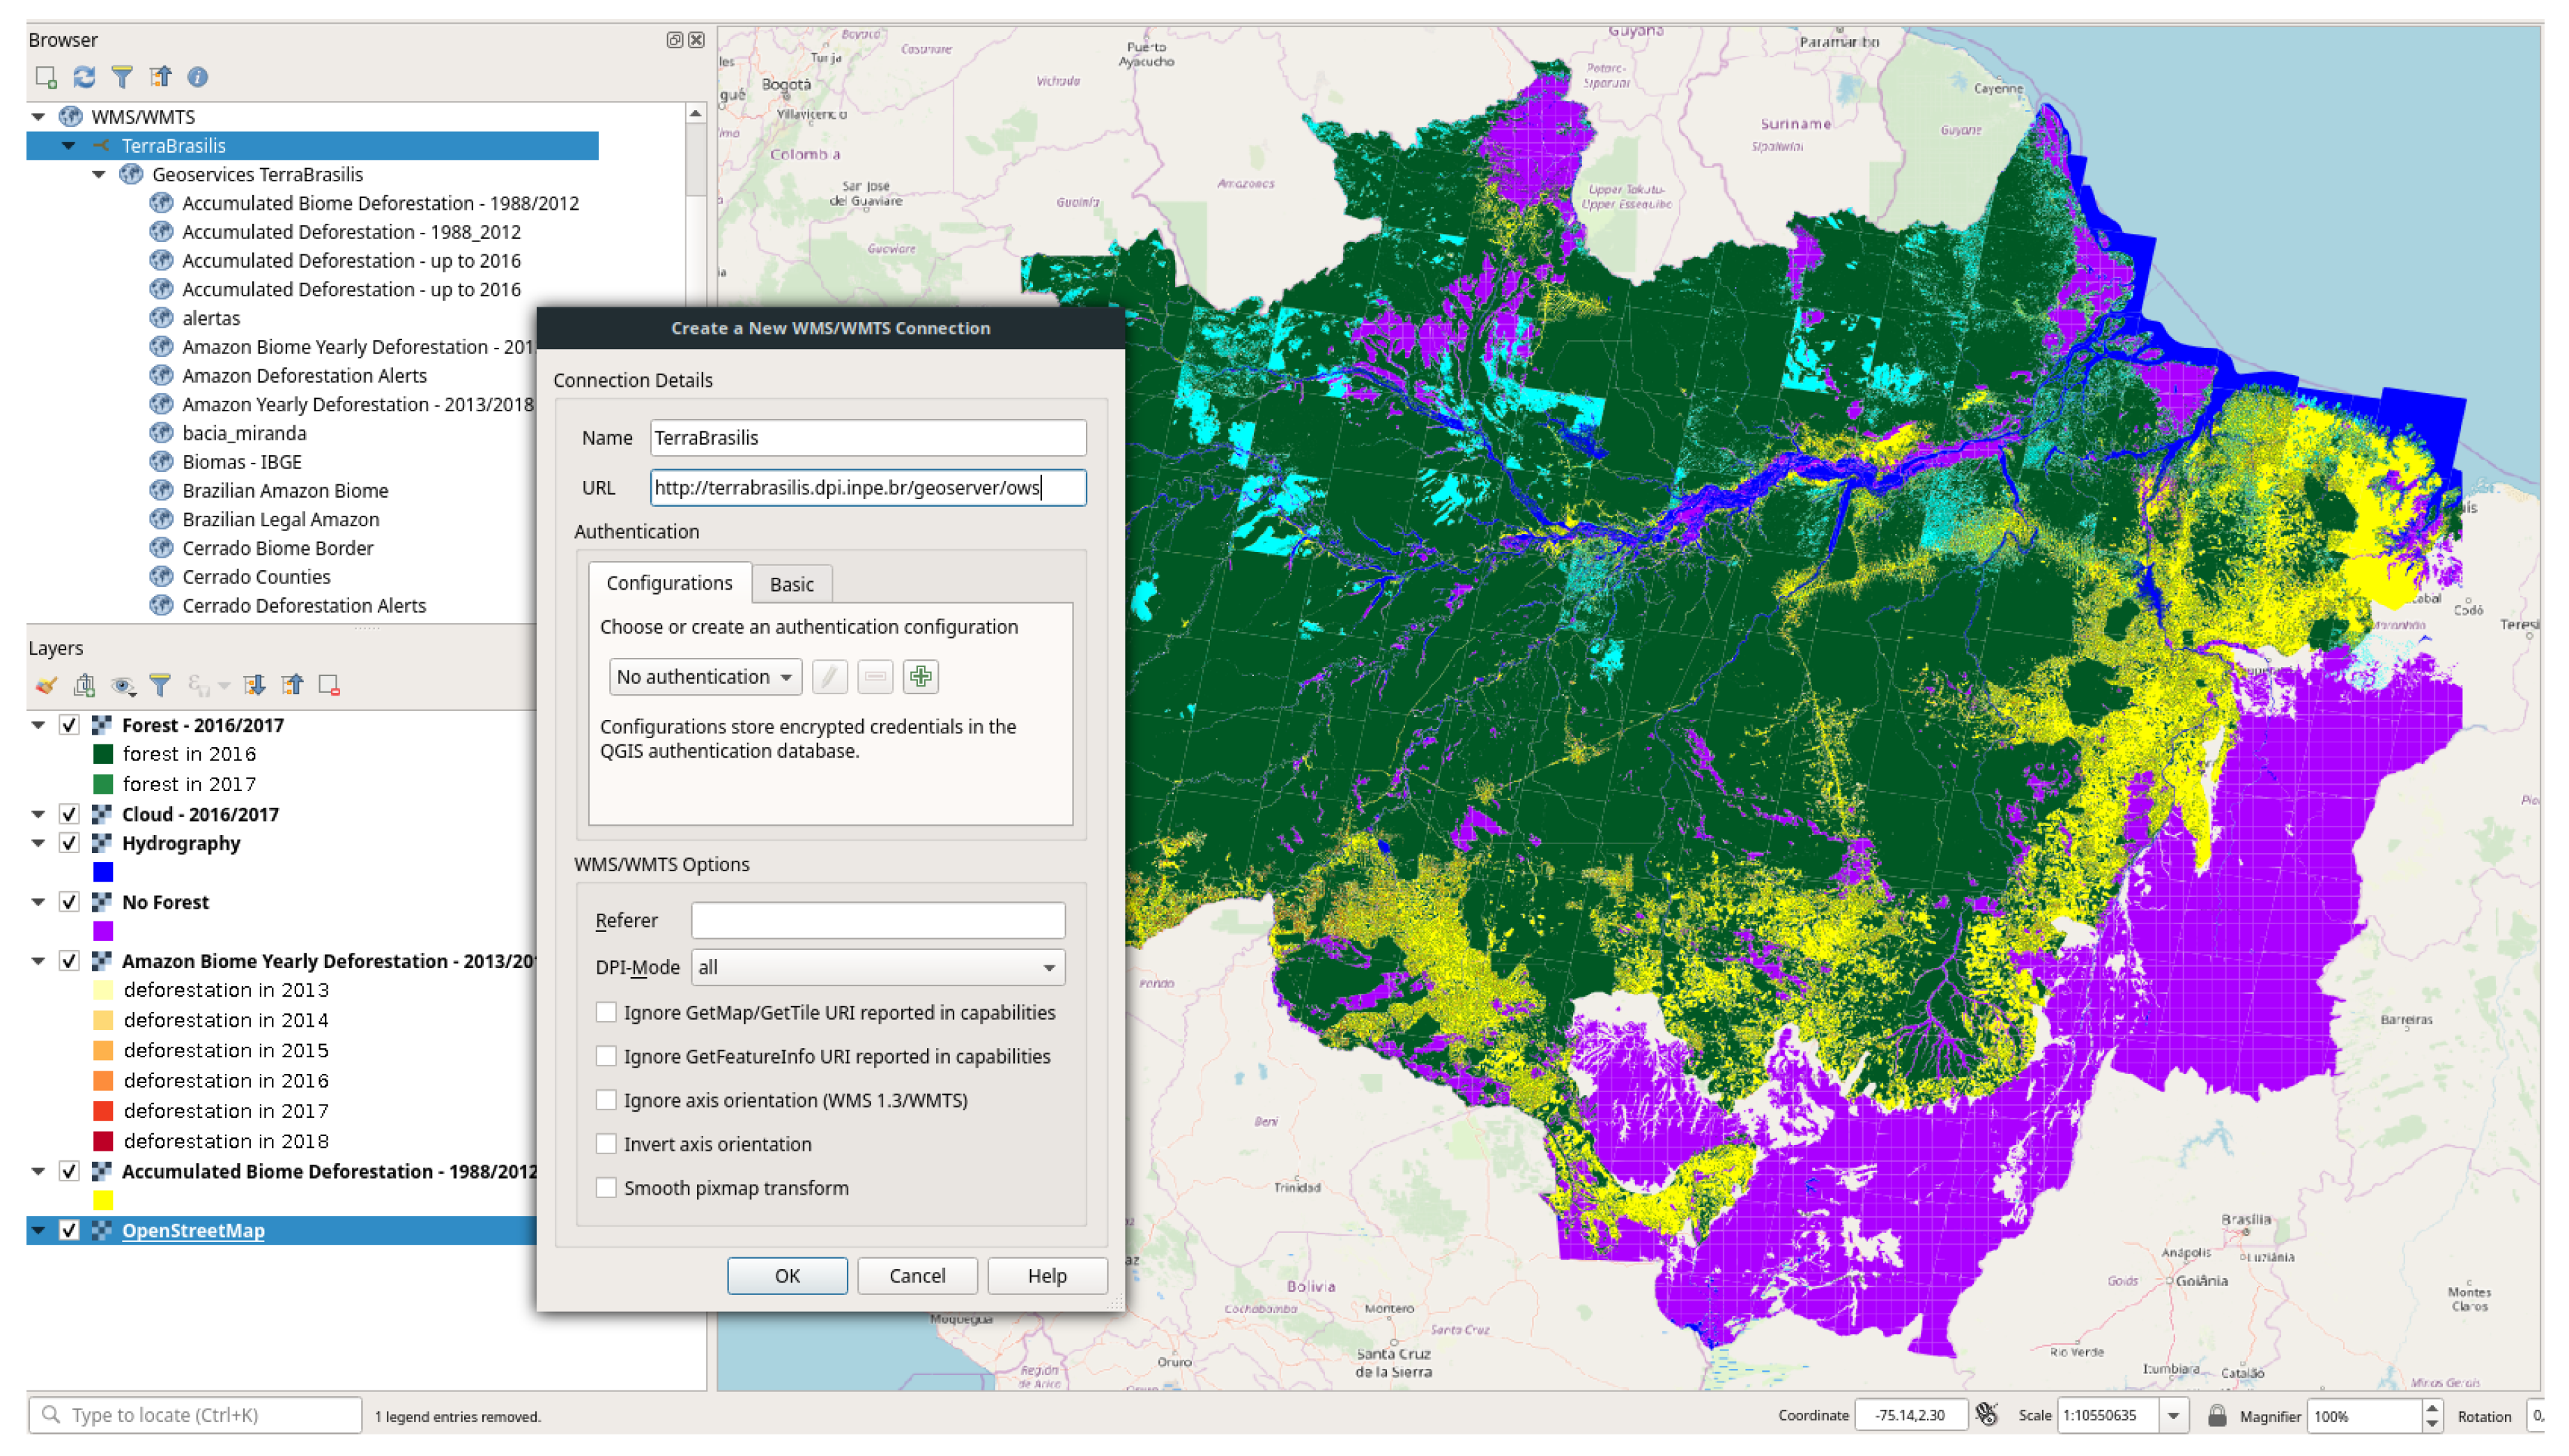
With the aid of the standard protocols, users can also retrieve layers using any GIS platform (e.g.,
QGIS and
ArcGIS). For example, they can create a WMS connection to add a new layer from the TerraBrasilis map server within their desktop with no authentication configuration, i.e., without having to store encrypted credentials in the GIS database.
Figure 5 shows a current WMS connection that uses QGIS to obtain deforestation layers.
4.2. Compliance with the Brazilian National Spatial Data Infrastructure
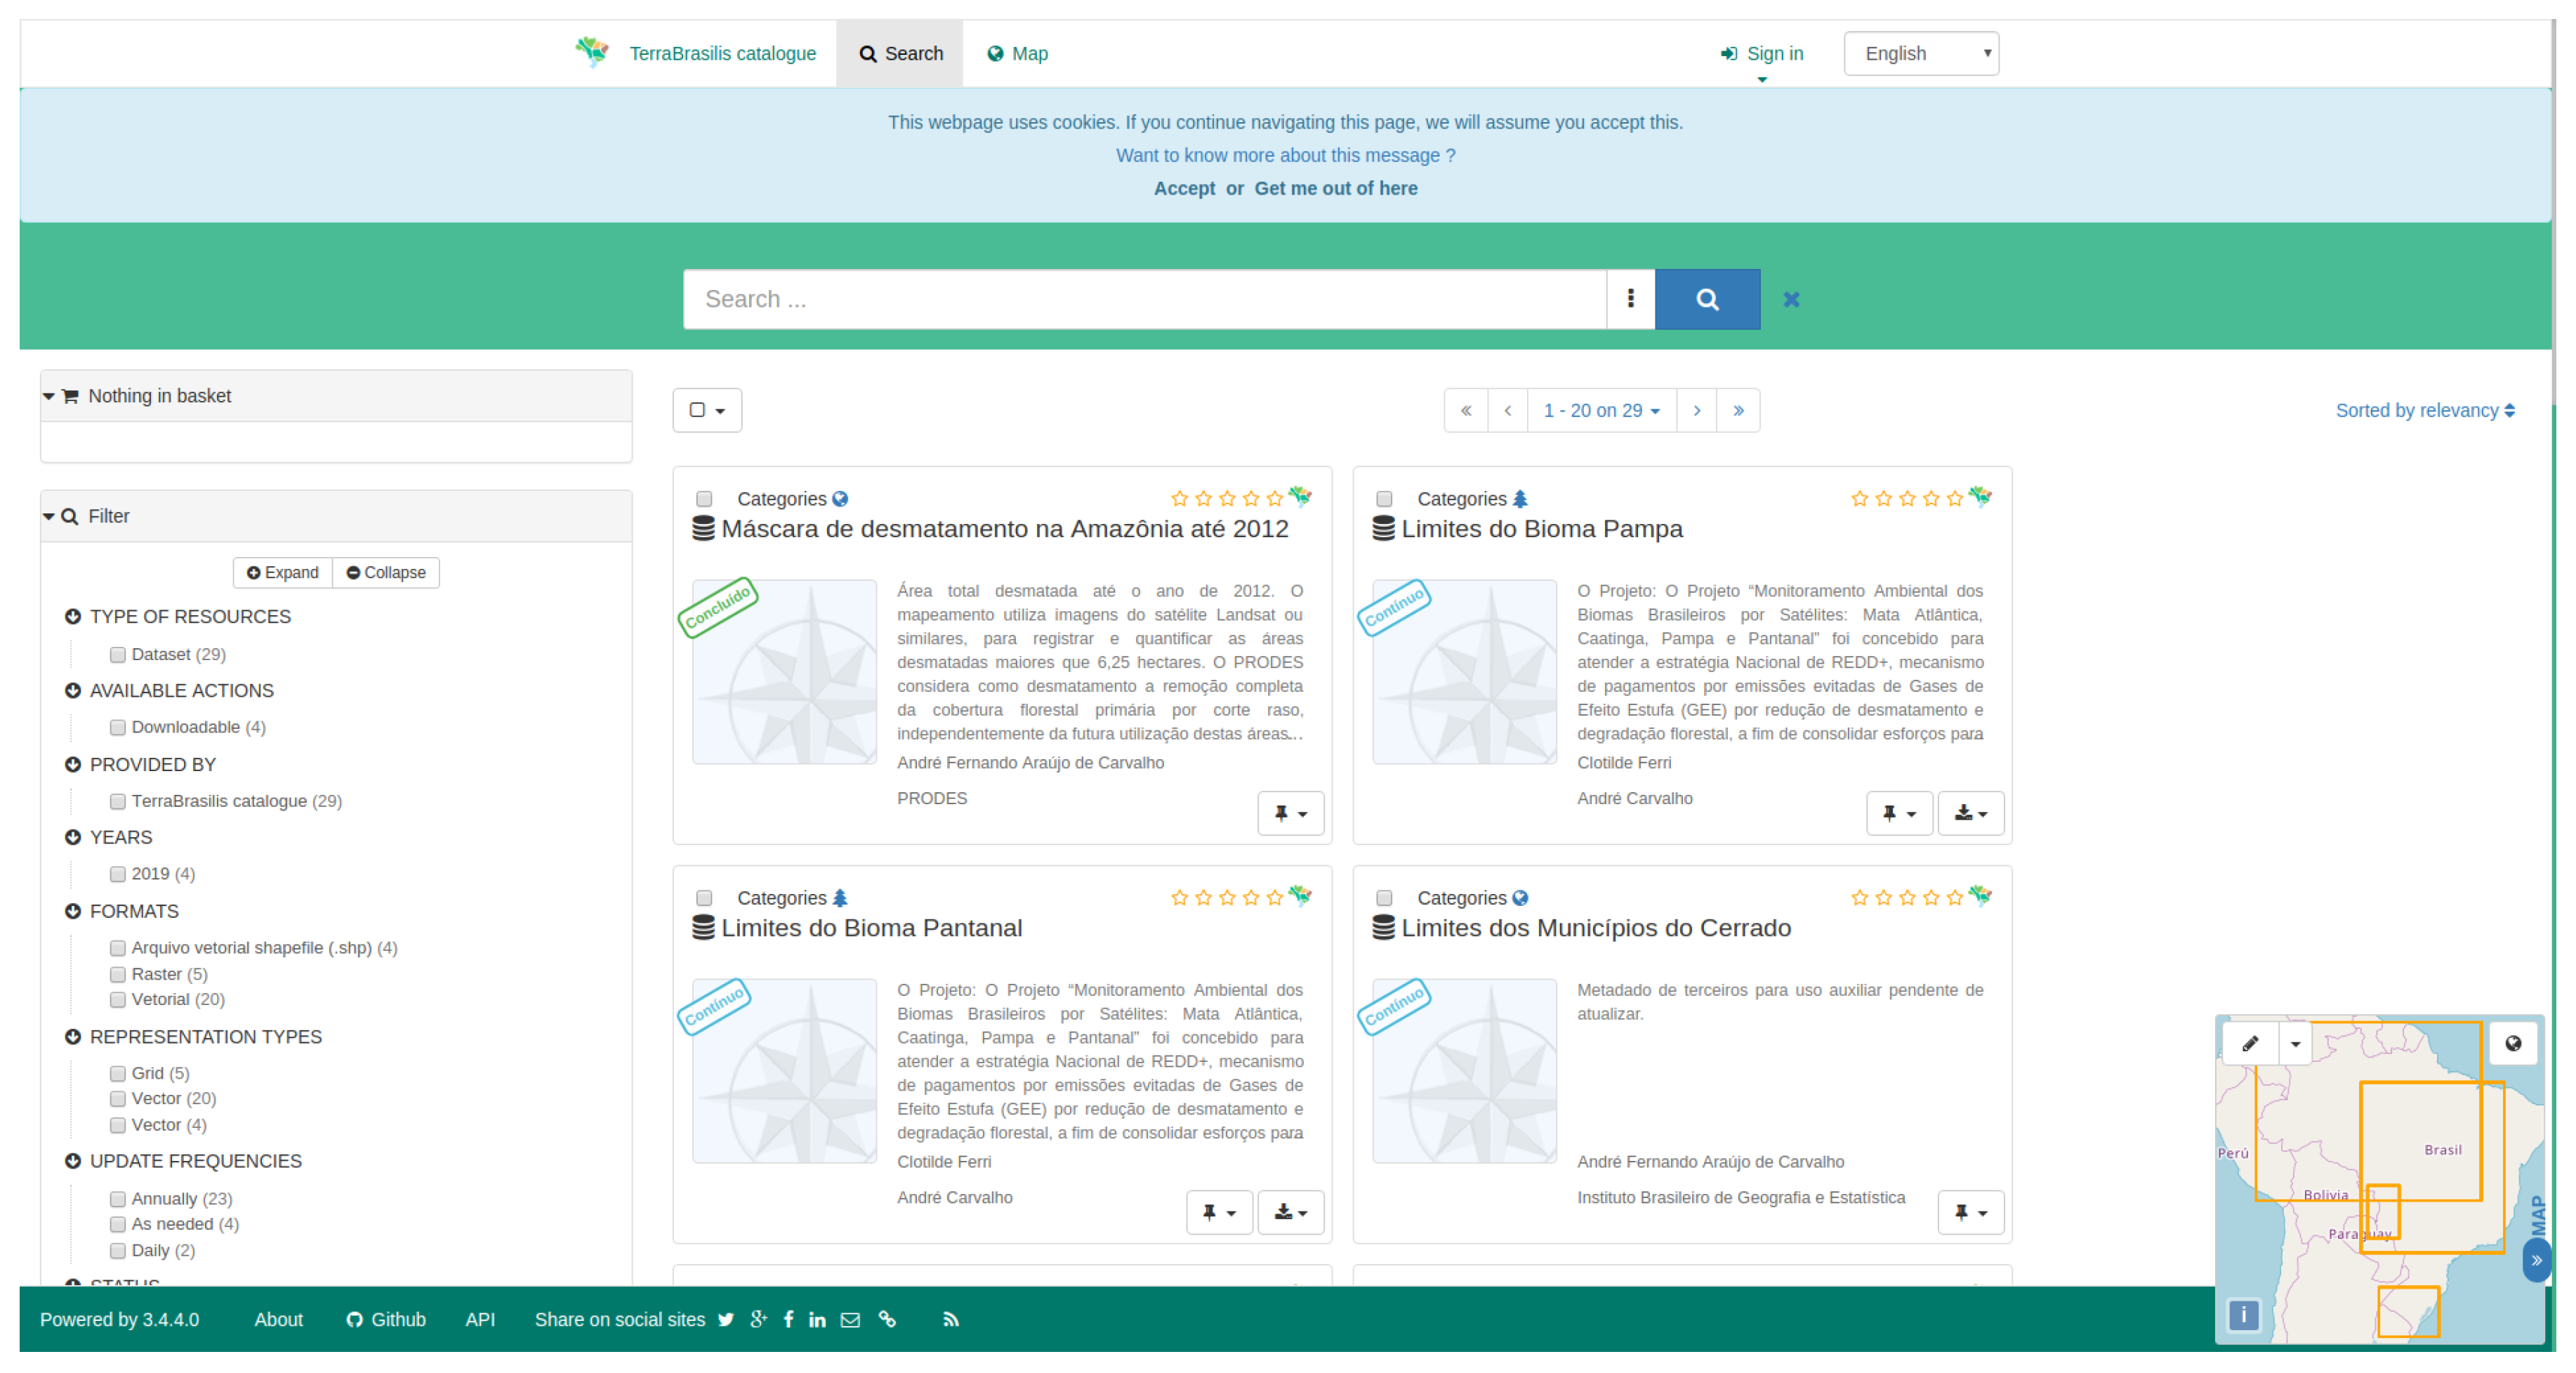
TerraBrasilis provides technical information and details about each layer through a robust catalog application that allow these data to be harmonized and handled by anyone with access to the Internet even if they lack any specialized knowledge. It has a full-text search engine with a map viewer for the spatially referenced layers, although it describes non spatial datasets. The metadata editor, also known as
Geonetwork (
http://terrabrasilis.dpi.inpe.br/geonetwork/srv/eng/catalog.search#/home), complies with a set of ISO standards (e.g., 19110/115/119) with geographic metadata guidelines to publish any content type online. However, only the administrators are able to manage the user and groups account permissions, or add, validate and suggest enhancements to improvethe metadata quality. In addition, they can use a dashboard to schedule metadata harvesting and have quick access to the catalog configuration. As can be seen in
Figure 6, each map layer has information related to the following: update frequency, representation type, scale, the coordinate reference system, format, lineage, contact, the identifier and metadata information. This kind of information is based on the implementation of the Brazilian Geospatial Metadata profile (MGB Profile) requested by INDE.
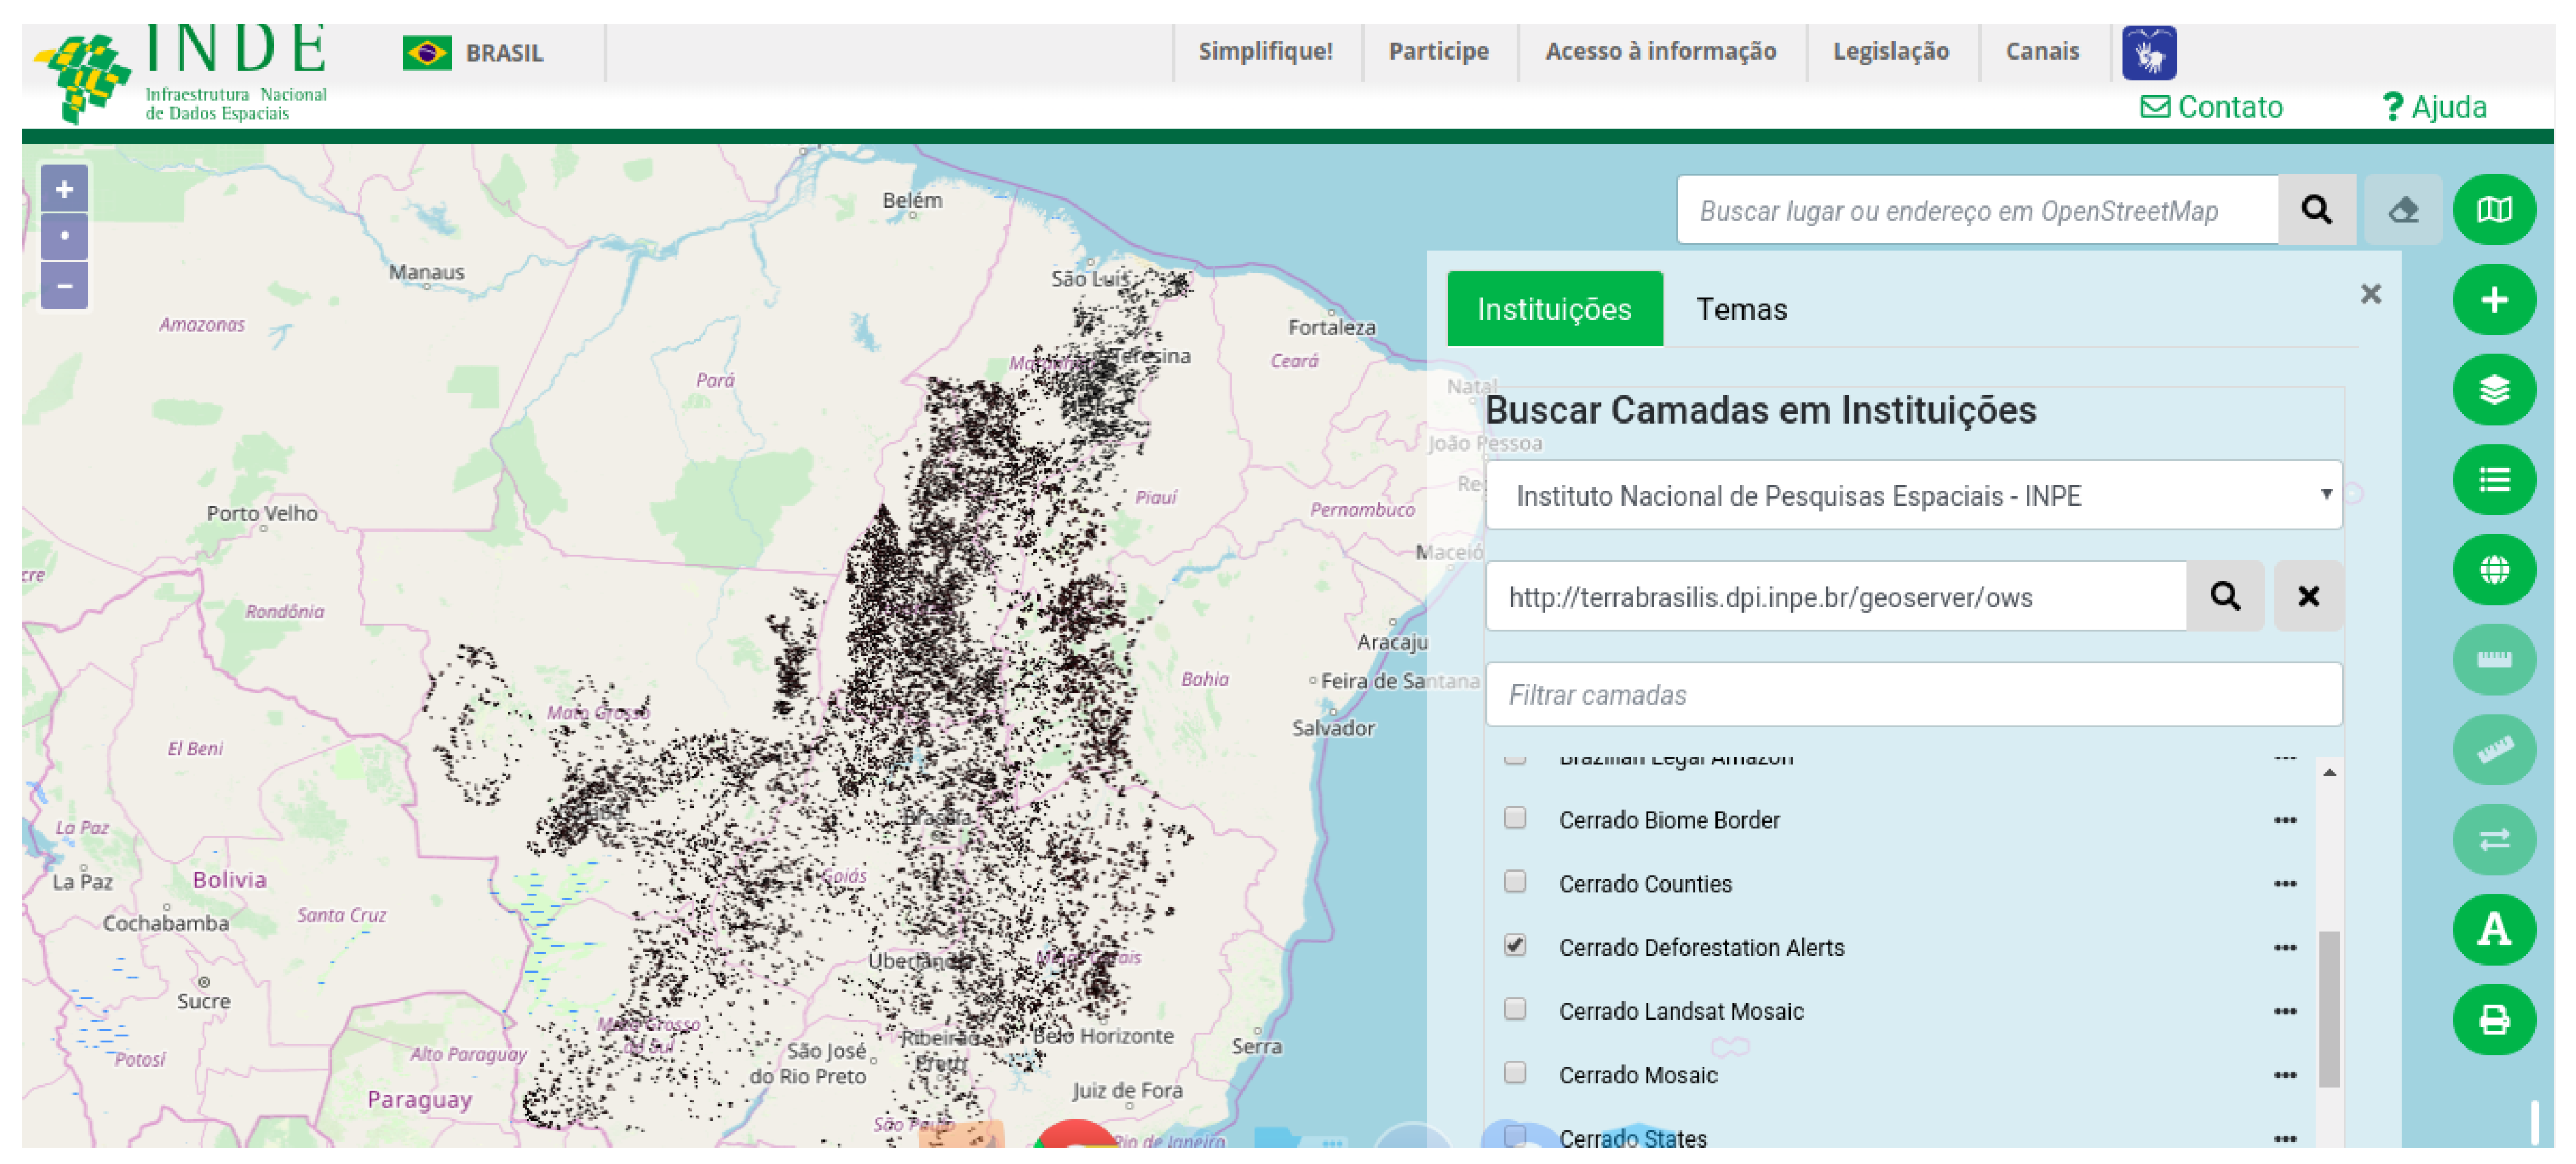
INDE has its own geo-portal to visualize registered catalog servers with the metadatabase and their data services. It also has a search engine mechanism for receiving data from several Brazilian public institutions such as IBGE, IBAMA and INPE. This is because the INDE specifications are in accordance with international spatial web service standards.
Figure 7 shows how an INDE visualizer that is integrated with the Cerrado deforestation layer can be stored in map server that belongs to TerraBrasilis.
4.3. Graphics for Visualization of Multi-Dimensional Data
As a supplementary feature of the map layers, TerraBrasilis provides dashboards to show how the multi-dimensional data can be visualized by adopting an incremental data-driven filtering approach. By implementing these dashboards, a million of records can be effectively explored. They contain flexible charts with coordinated views and smooth transitions. Moreover, the transformed features of the graphic design is a means of summarizing dynamic behaviors and animations. They provide a lively style-friendly format for fast interactions. Their source code includes reusable components and are in an open software registry
https://www.npmjs.com/package/terrabrasilis-api file. As well as this, its declarative programming and functional implementation reduces the overhead of graphic variations.
The implementation is a variant of the grammar of graphics [
51] (the layered grammar of graphics [
52]) embedded in a non-proprietary
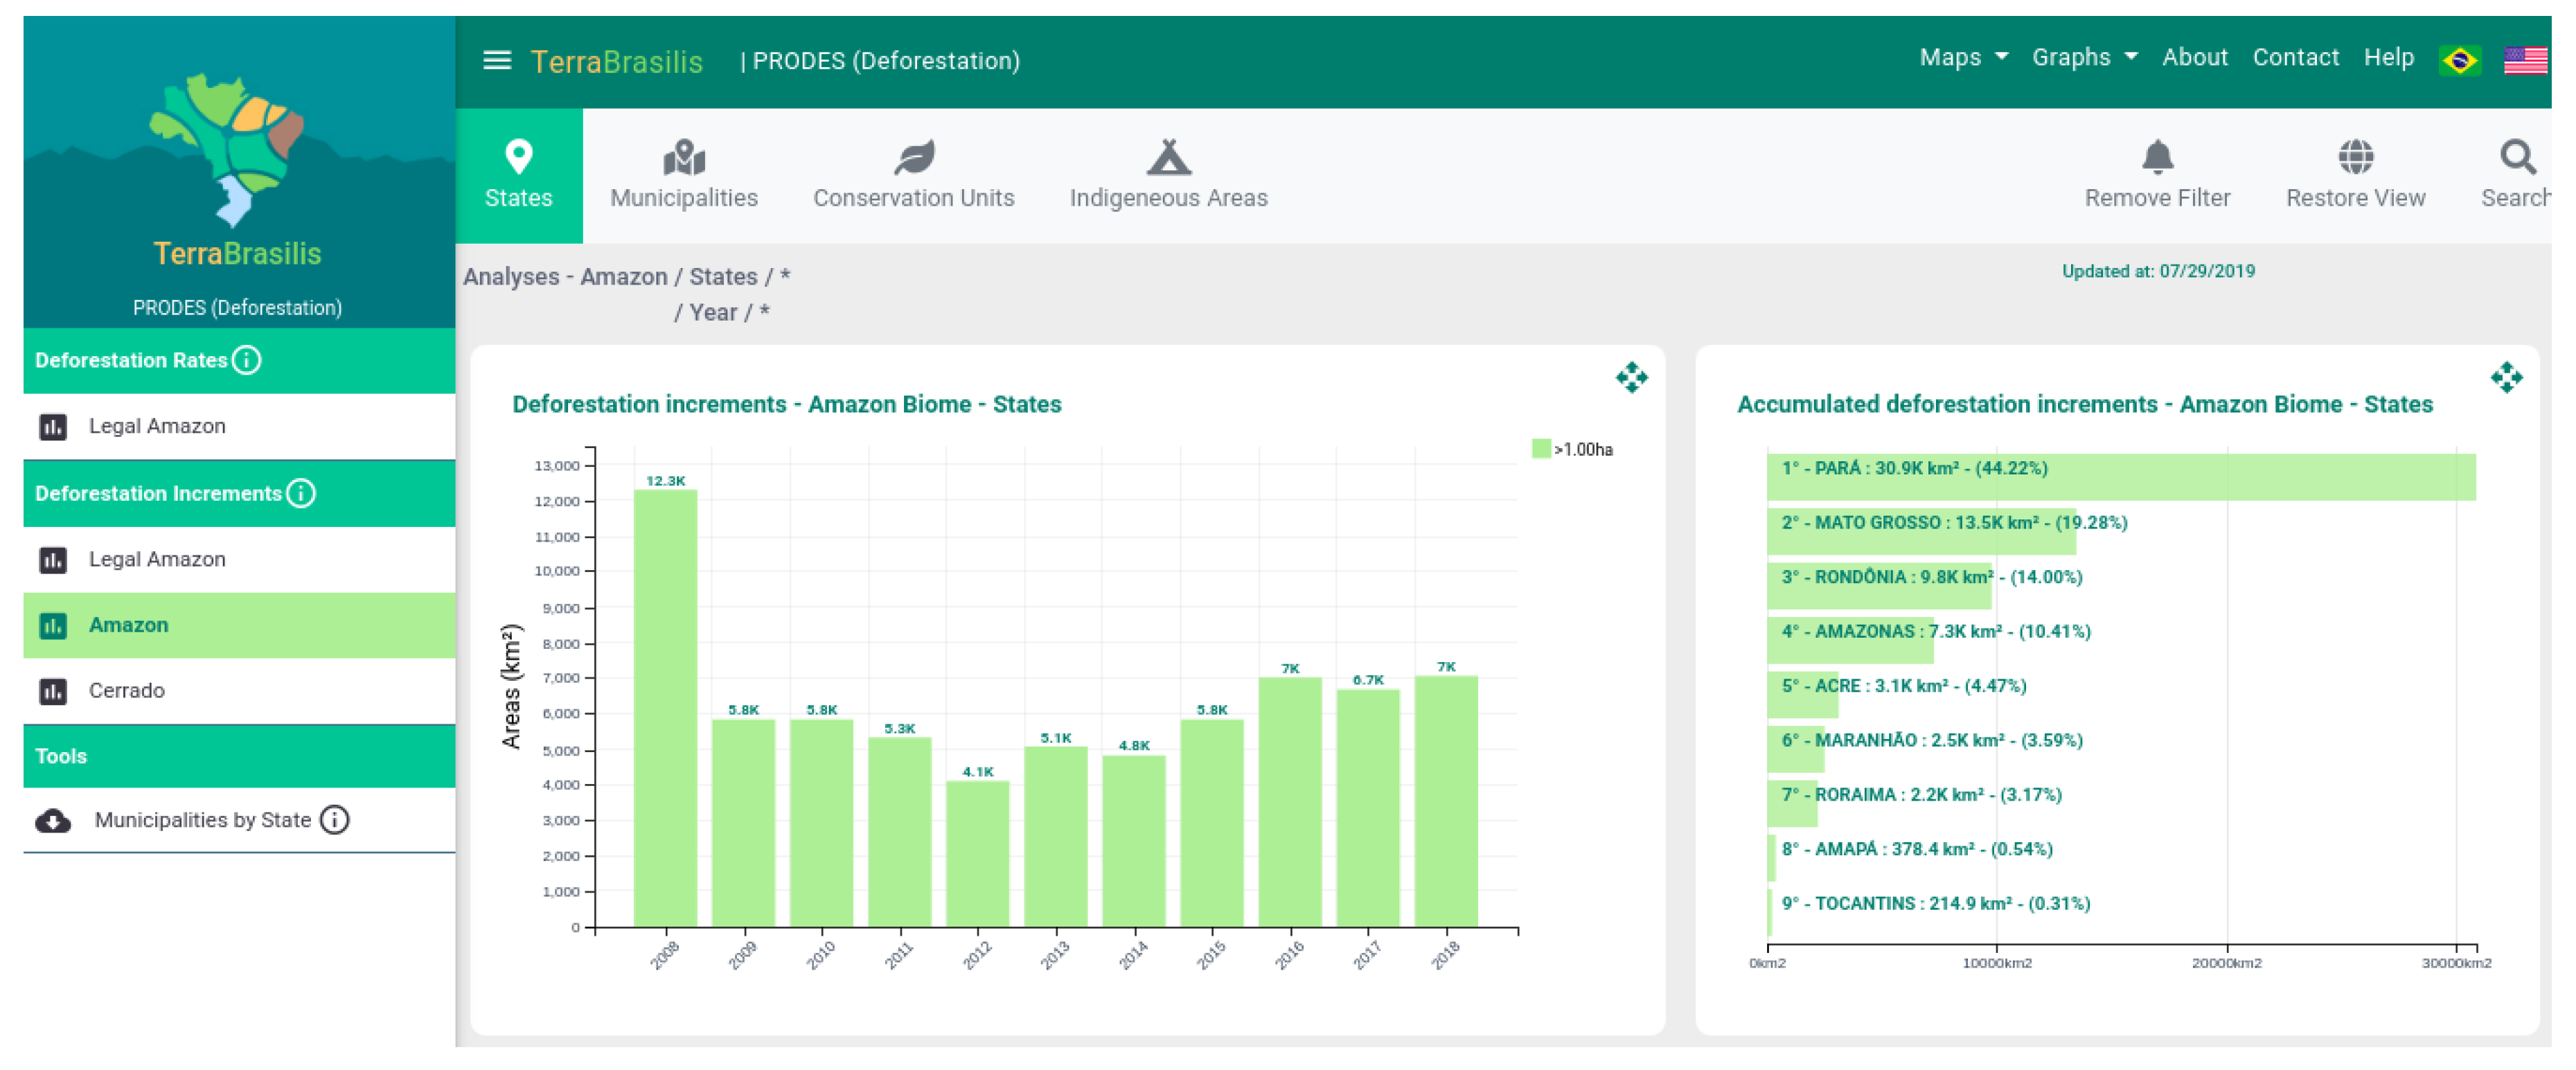
JavaScript library that can provide full capabilities of web standards. Its main goal is to build graphics in a formal structure for statistical purposes. Through a perception of elementary graphical elements (e.g., position, length, angle, slope, area, volume, color and density) and their respective degree of accuracy, users can visualize quantitative information in a concise way. This kind of visualization helps to acquire more meaningful and deeper perceptions from spatial data. The following charts exemplify this through an analysis of deforestation data (see
Figure 8).
The dashboard analytics for the disseminating of deforestation contain a tab for each place of interest, including federation units, municipalities, conservation zones and indigenous areas. It displays a vertical bar chart with temporal aggregation data, a horizontal bar chart with absolute values, a choropleth map with spatially aggregated data, a time series comparison and a Table with the deforestation areas per years
http://terrabrasilis.dpi.inpe.br/app/dashboard/deforestation/biomes/amazon/increments showing annual variations. All the graphs provide snapshots of a specific biome (e.g., Cerrado or Amazon). As well as, the presentation of deforestation increment areas and rates, there are also additional tools to meet the needs of particular users such as the downloading of cross-filtered data (e.g., which municipalities by states).
A model database was created to generalize and answer the tripod survey questions based on the question words
“what” (e.g., which
classes),
“where” (e.g., which
place of interests or
locality) and
“when” (e.g., which
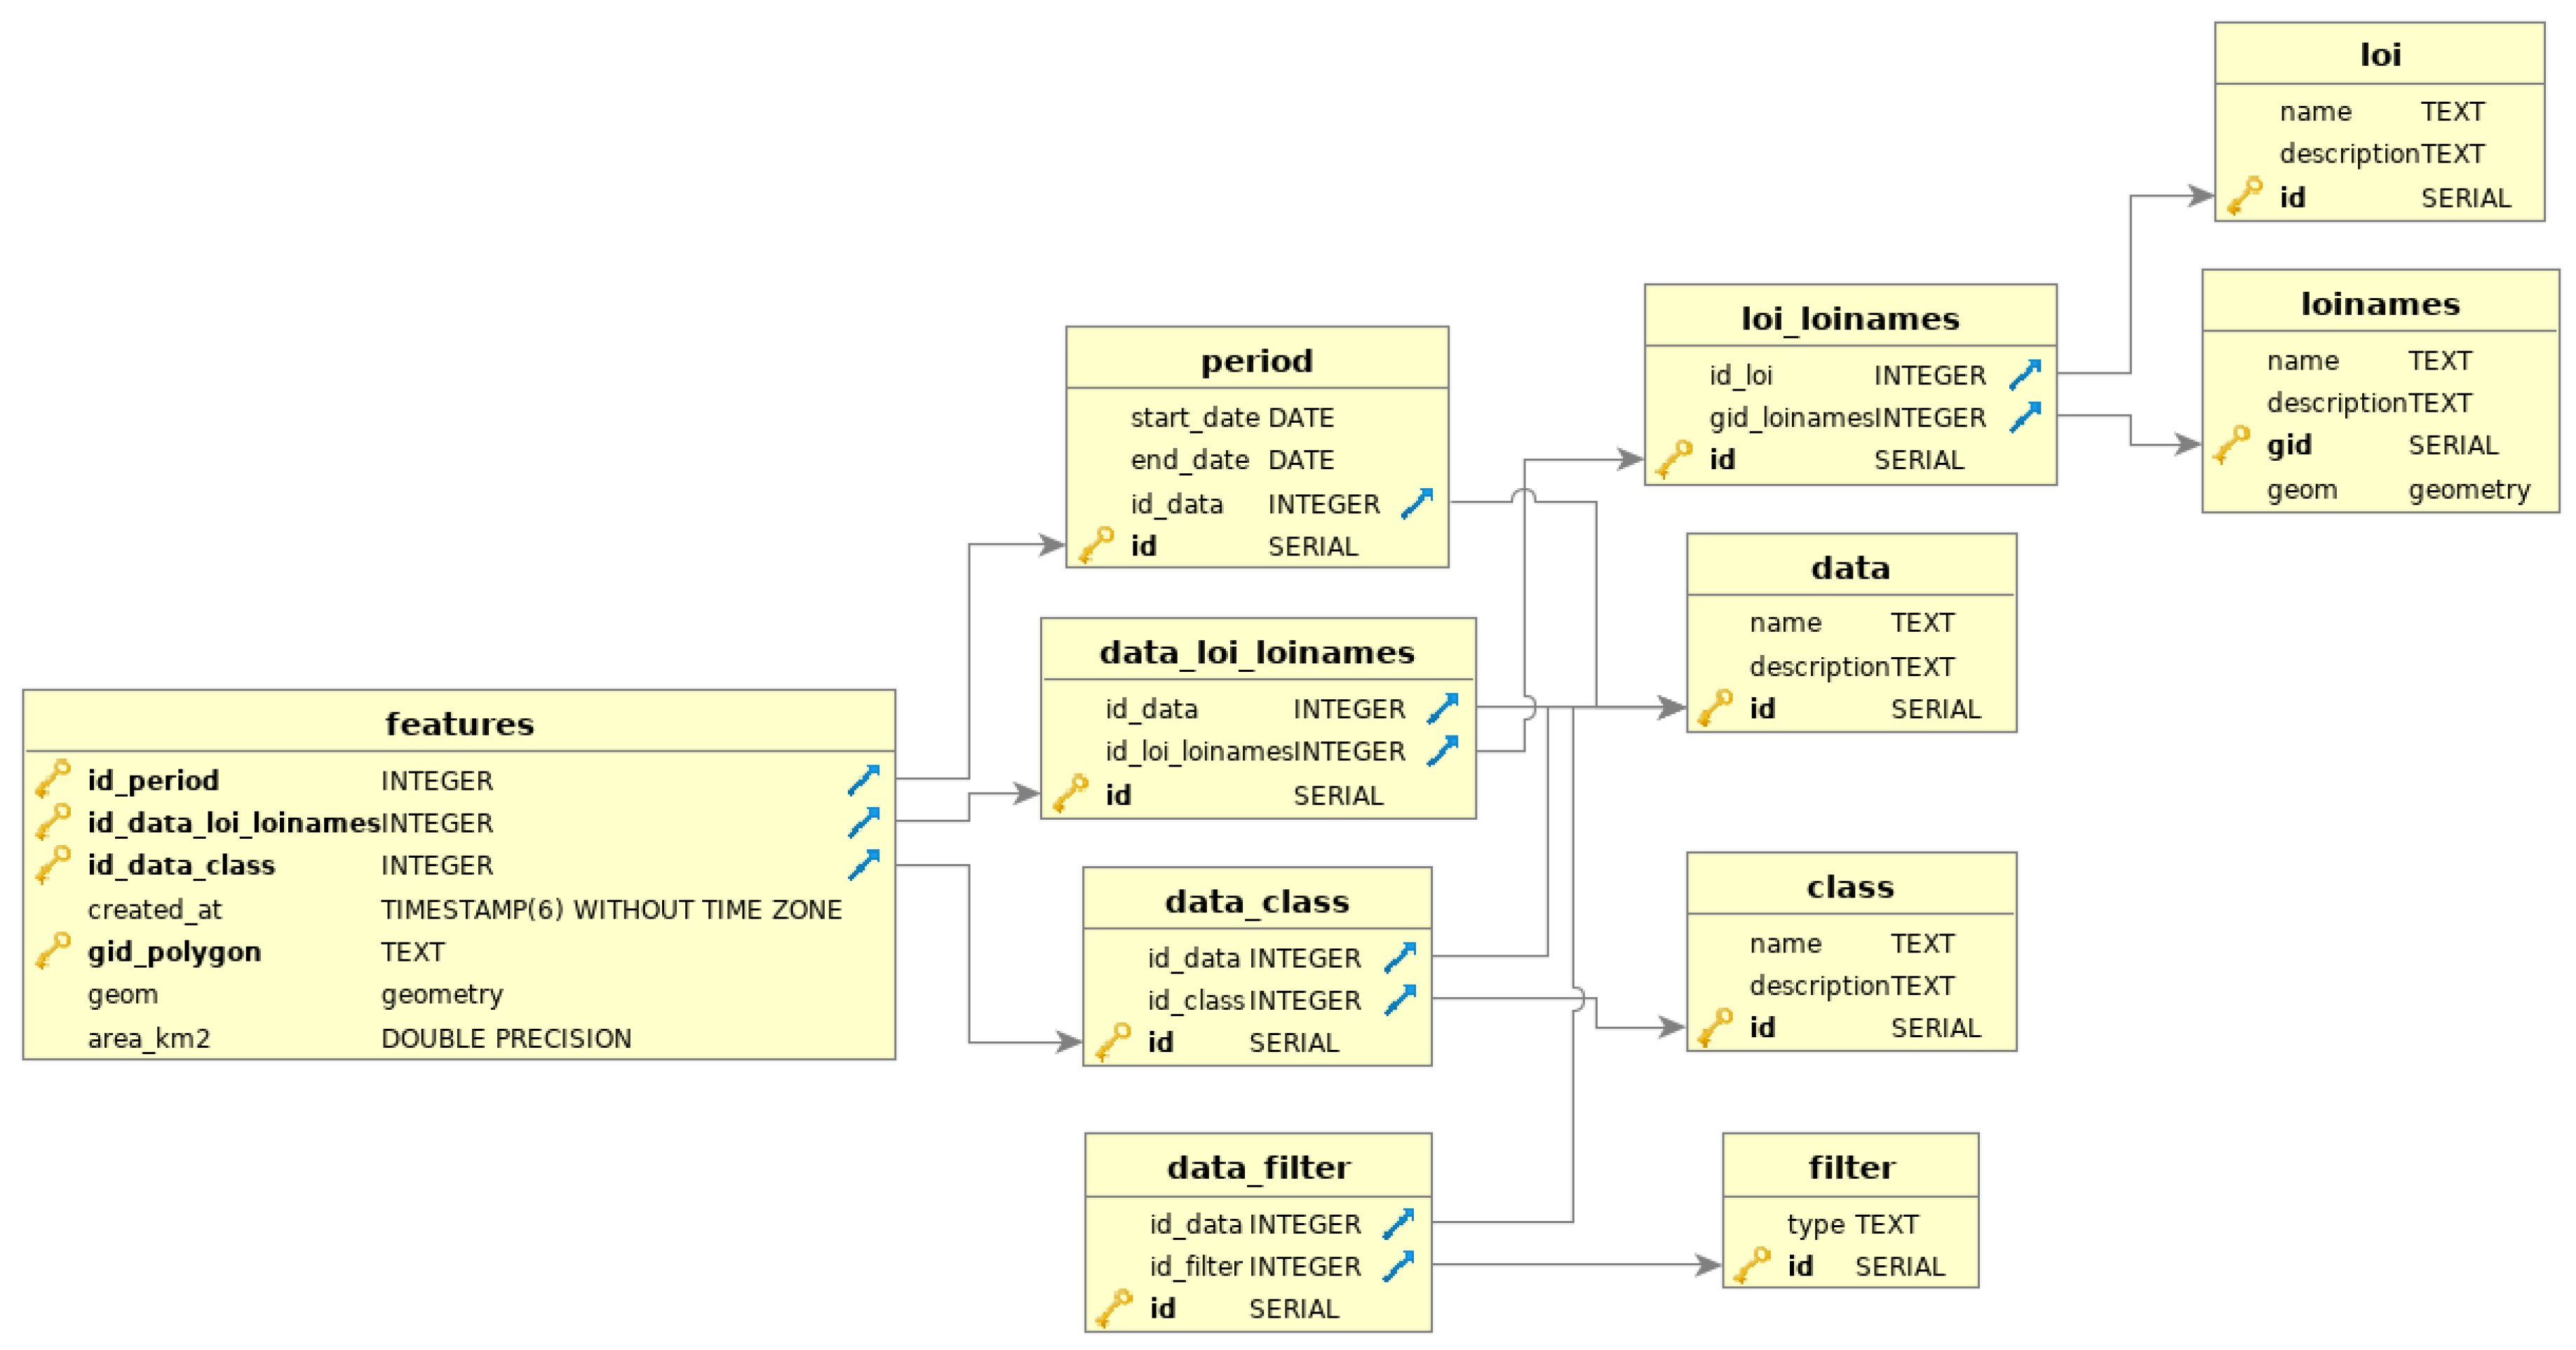
periods) contained in the dashboards, and this includes different datasets that provide additional filters (e.g., features over 6.5 hectares) and applications information (e.g., the PRODES Cerrado) information. Since it is time consuming to intersect a plethora of spatial polygons of a complex nature that change over time and in different place of interests, we created a
features table to store the final output with the
classes,
periods and
local of interests.
Figure 9 shows this organization and the measures taken to abstract these concepts and aggregate the spatial data operations that often occur in different thematic maps.
4.4. A Decentralized, Virtualized and Authorized Monitoring Platform
TerraBrasilis contains an advanced monitoring stack of services that is optimized to deal with the unified metrics of physical assets over time. The platform automates a rapid and secure deployment of services, including the analysis of the availability (e.g., reachability), responsiveness (e.g., latency), and consumption (e.g., bandwidth load) of computing resources such as memory, CPU, the file system, and the network. On the basis of this information, it can provide not only a holistic view of TerraBrasilis in a healthy way but also provide consistent and predictable warning alerts before it completely reaches its saturation point. These measures are centralized in a time series database called InfluxDB. This database stores data about the performance monitoring, which is especially important in environments with unstable scenarios. Its proven resistance against potential attacks and resource misuse, means that it can provide continuous changes in a sustainable and scalable manner.
The virtualized containers with services (e.g., Geoserver, Geonetwork, MongoDB, Redis, PostgreSQL) allow the collection, aggregation and processing of their resource usage by the monitoring platform in background. A Google application called Cadvisor performs these kinds of tasks and stores the information inside InfluxDB. Cadvisor also assists in the automated recovery from service failures. All the historical information was summarized by leveraging a flexible service called Grafana to show which data is connected with InfluxDB. The security of the container services was ensured by providing an encryption between the parties that use a compact and self-contained authentication on the client side that is based on signed tokens.
4.5. Conducting Spatial Data Analysis
An API was designed to accompany this new paradigm called Data Science. This involves scientists initially collecting raw data, and then cleaning and pre-processing it so as to conduct an exploratory data analysis with basic statistics and plots; following this, statistical models are classified and validated by means of machine learning algorithms. The purpose of the API is not only to supply the visualization layer discussed above with multi-dimensional data but also to empower scientists working within a scripts analytics environment such as R. This analytics API increases the thematic mapping data available, which previously was only sent to GIS experts in response to WMS and WFS HTTP requests. The API follows a design pattern in which there is a responsibility segregation between where the updates in the raw thematic mapping data occur (those that are stored in a relational and “normalized” database called PostgreSQL), and ready-to-exhibit output data are queried (those stored in an in-memory and “denormalized” database called Redis). This additional cache layer allows us to separate “writes” and “reads” operationsindependently. This representation speeds up data recovery, and avoids bottlenecks when daily and seasonal flat data access reaches its peaks, therefore, we decided to replicate the thematic mapping data.
The updates in the “write” model are asynchronous andsporadic, and triggered when there is a change in domain rules while the cache layer synchronizes the updated information so that it can feed the visualization layer in a periodic and scheduled process. In addition, it is unnecessary to query and return all the data whenever an application starts up. In contrast, we can only query a fraction of the data to save a precious time in the visualization layer. For example, users can check deforestation data from a wide range of places of interests and periods when there is no need to load all of them at once. The application responsible for feeding data from PostgreSQL to Redis is a Java program, while the one responsible for querying data from Redis anddelivering them dynamically into the visualization layer is a Javascript application.
This alternative analytics API can be employed to answer the following questions: (1) what are the stored thematic mapping datasets (e.g., PRODES from Cerrado)?, (2) which places (e.g., federation units, municipalities, conservation zones, and indigenous areas) and places of interest (e.g., Mato Grosso, Amazonas, Pará) do they contain?, (3) what periods of time (e.g., from 1988 to 2000, from 2010 to 2012, from 2016 to 2017) do they correlate with?, which classes are they (e.g., deforestation, pastureland, soyabean) linked with?, and (4) which filters (e.g., for areas of land above 6.5 hectares) do they use for processing? With these back-end enhancements, the analytics API is able to provide a flexible and rapid delivery of semi- and unstructured datasets, particularly for those that do not have a GIS expertise (see
Listing 1).
Listing 1: TerraBrasilis Analytics API Calls.
Listing 1: TerraBrasilis Analytics API Calls.
GET apiPath/list_datasets
GET apiPath/configuration/list_locals
GET apiPath/configuration/list_local_of_interests
GET apiPath/configuration/list_classes
GET apiPath/configuration/list_periods
GET apiPath/configuration/list_filters
GET apiPath/data/...class_name.../...local_of_interest_id...
GET apiPath/data/query?class=...loiname=...startdate=...enddate=... |
Since analytics environments help to improve the interoperability of analytics API, we created an
R client (shown here using a
Jupyter notebook, which is essential to explore reproducibility. The
R package abstracts the manipulation of handlers with customized headers as inputs to curl
https://curl.haxx.se/ requests to endpoint resources. These server responses are in
JSON format and transformed into a tidy version data, one table has all the required attributes in which each observation represents a column with a suitable name, and each observation represents a row. With this information, we can then explore all of the thematic mapping data.
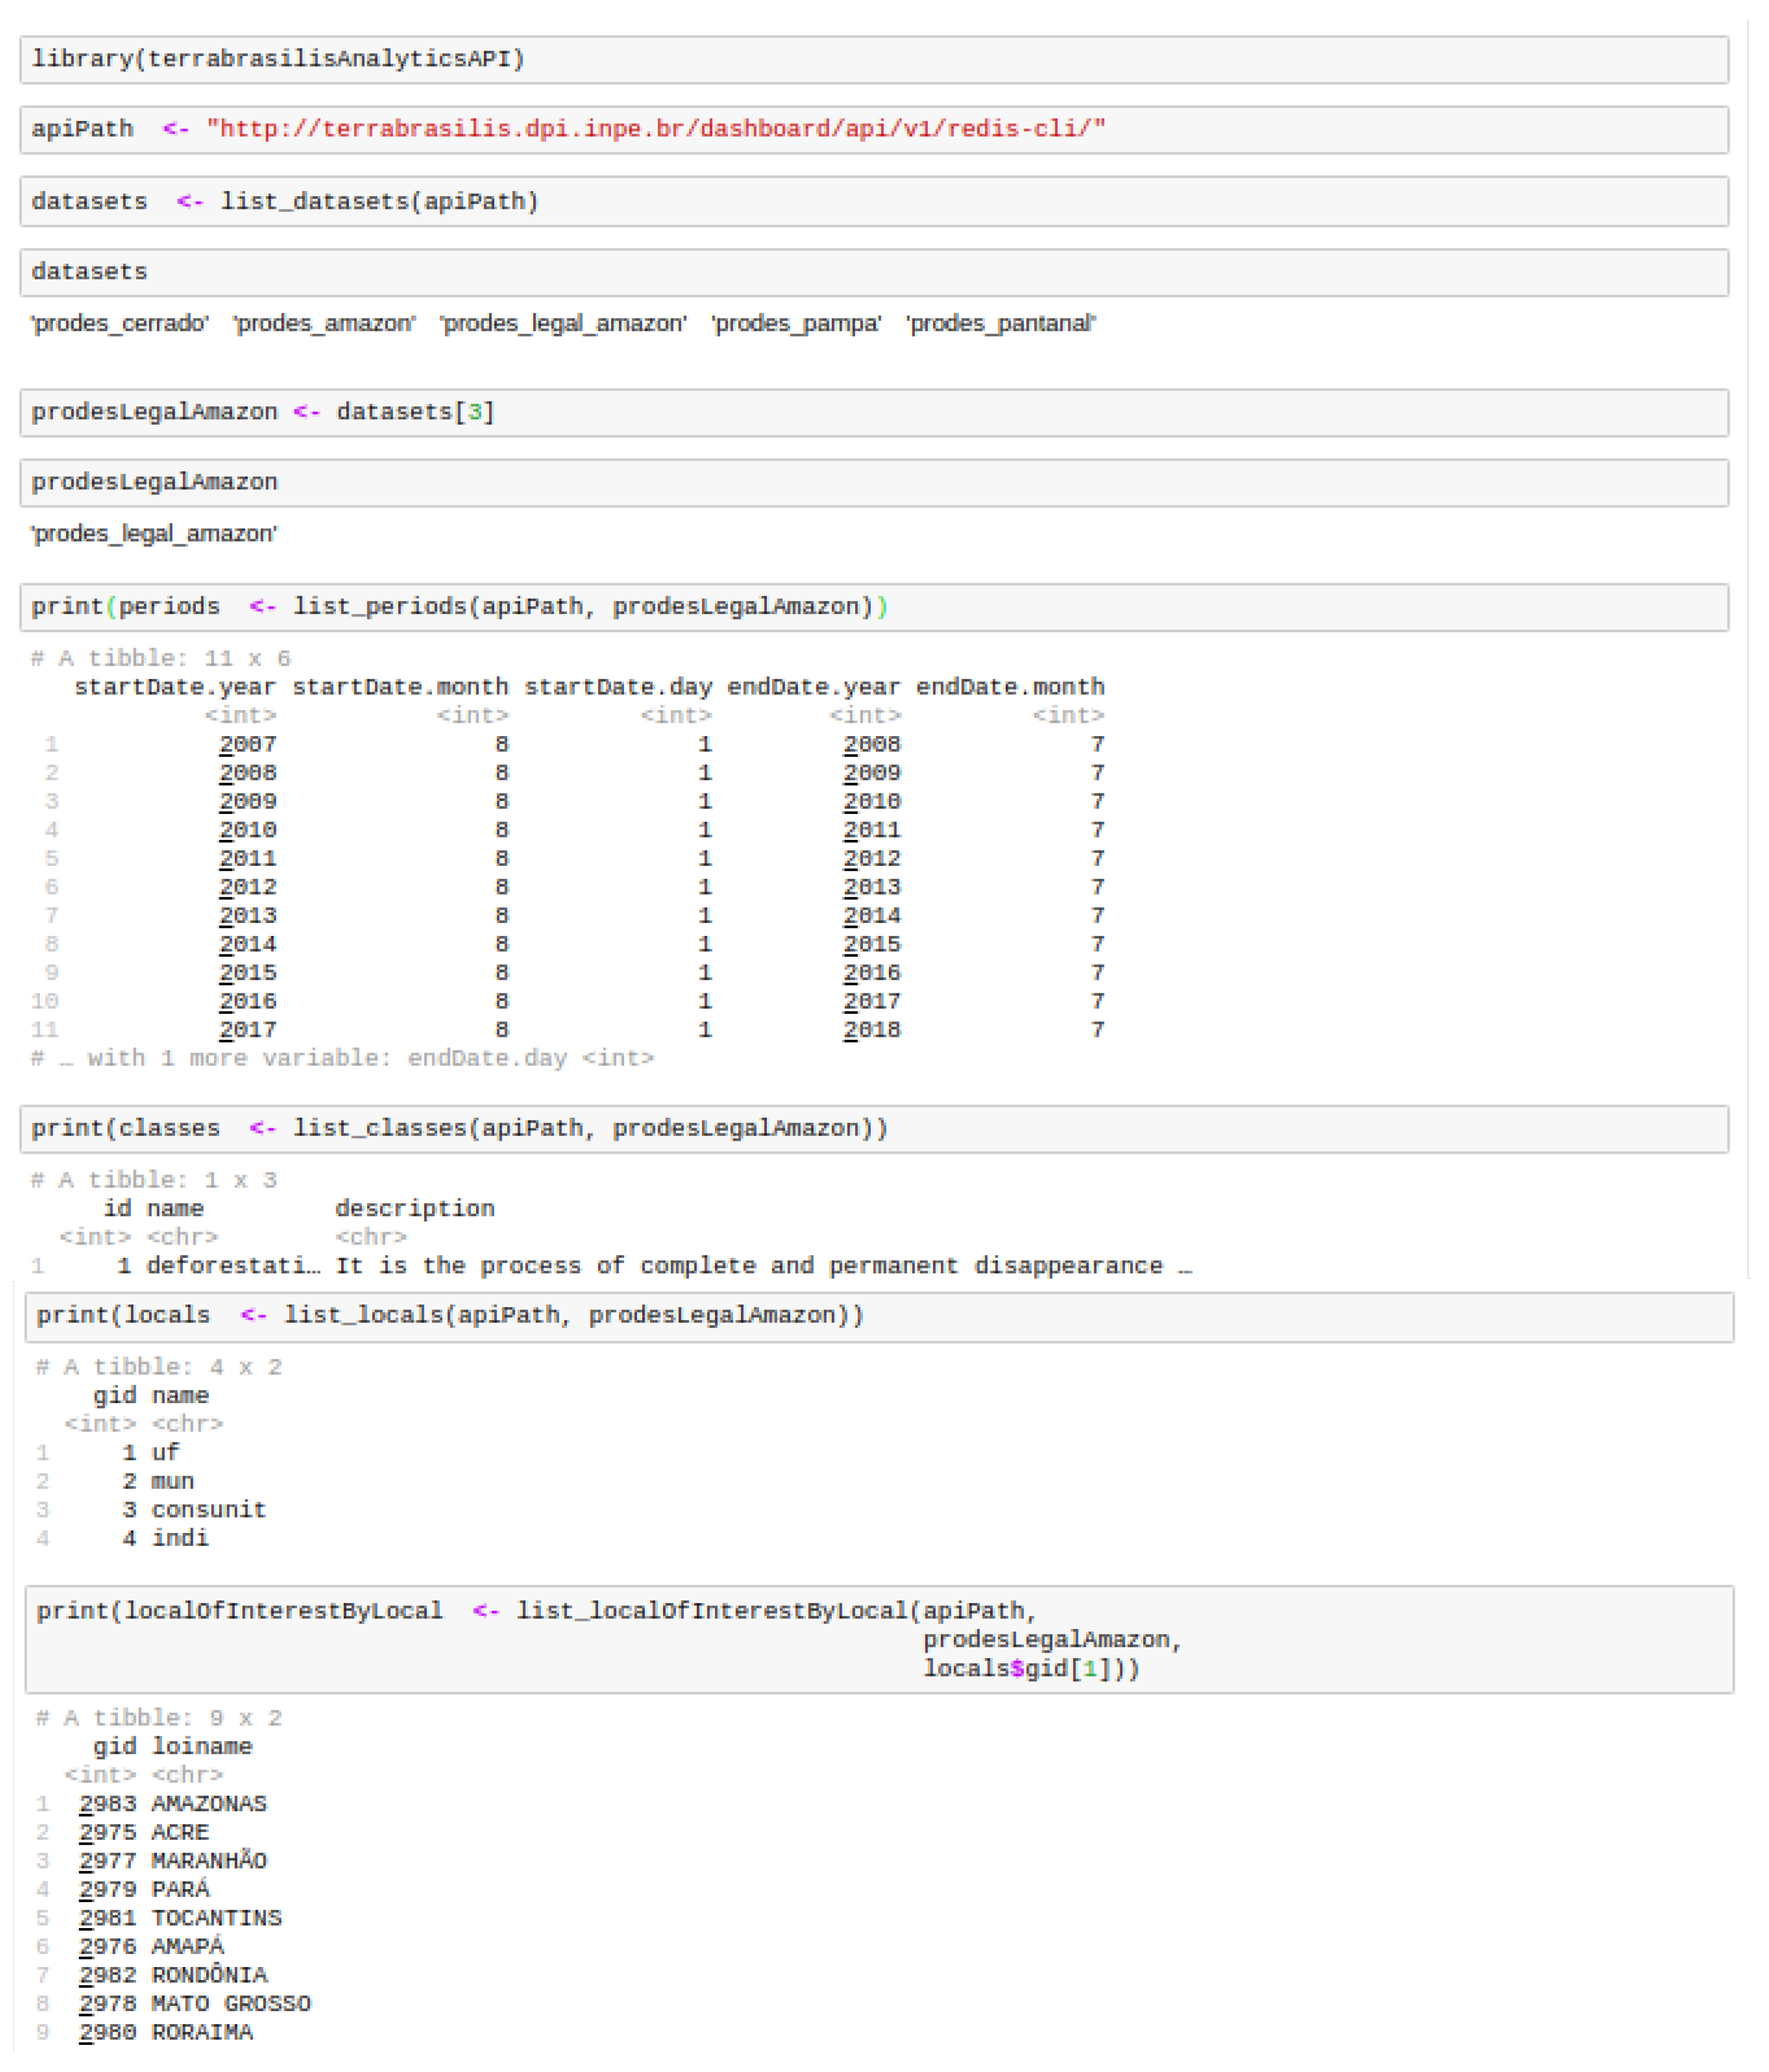
Figure 10 shows the first stages of the installation and the loading of the
terrabrasilisAnalyticsAPI R package. A variable
apiPath is responsible for defining the Analytics API path. After this, it is possible to list datasets. On the basis of this information, users can make specific requests to other API endpoints. These requests involve the intervals, localities and classes contained in the datasets.
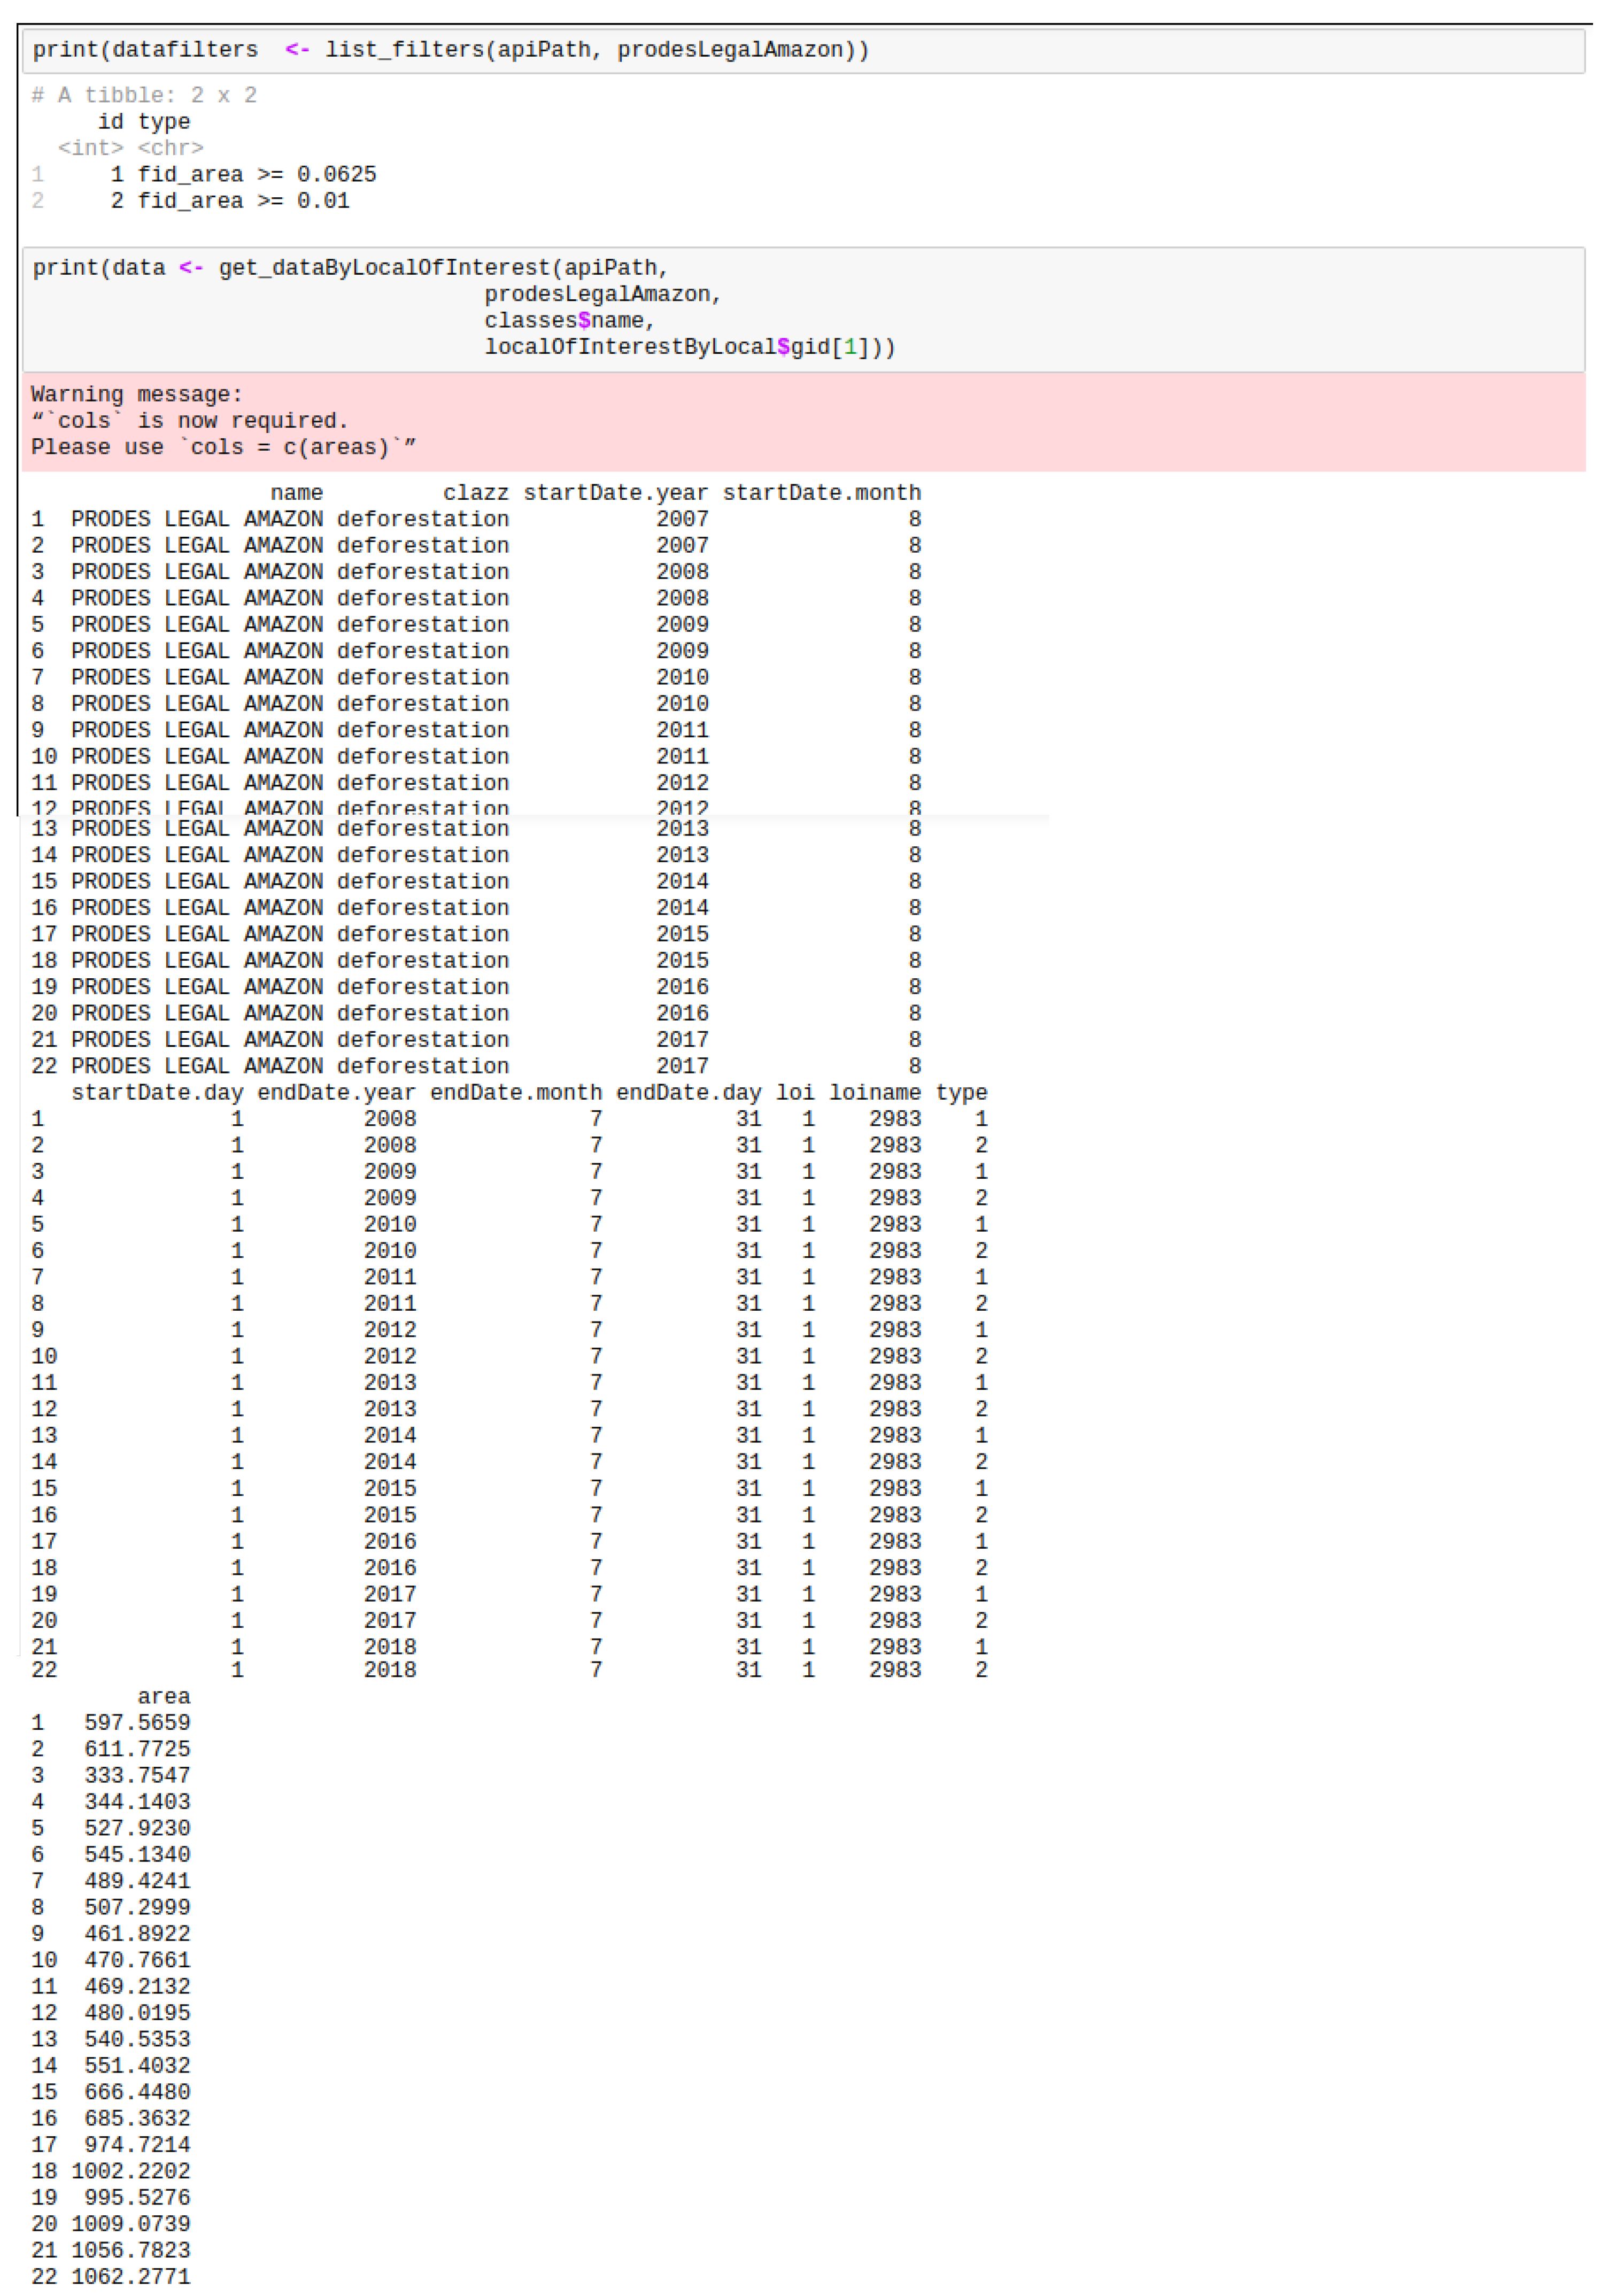
Figure 11 shows how to obtain final data through the acquisition of other parameters. After obtaining places such asthe state, municipality, conservation zone and indigeneous areas, we included less granularity with regard to places of interests. Owing to their compatibility with other environmental programs, specific filters are available for all of the data. With this in mind, users can input those information to the function as parameters so that they can receiveas much data as they desire.
5. Experiments
In this section, we begin by designing the experimental setup and describe how the server runtime environment was configured when the TerraBrasilis micro-services were deployed. In addition, we depict the resource usage datasets that were collected from the TerraBrasilis working monitoring system. Following this, there is an analysis of a load testing report that takes account of the latency and scalability with regard to the users’ requests for web applications with similar purposes which is then compared with the performance of TerraBrasilis. We also show the performance testing SDI of our APIs (business, analytics, and synchronization) under real-life load conditions. After this, there is an explanation of how we tuned our spatial database to carry out complex spatial data operations without overloading the server. Finally, a complex analysis is conducted to highlight how analytics APIs can be used.
These tests were chosen based on the basis of the initial parameters that were defined for the server-side spatial data processing. We wanted to compare their performance with those that are employed for spatial data processing on the client-side. The performance testing serves as a means of measuring the TerraBrasilis quality since it is designed to evaluate how the resources are managed. In view of this, we linked the micro-services analytics API, analytical database and analytics feeder to represent the analytics component. The business API, business database, map server cluster mode and map server single mode comprise the web mapping component. The metadata catalog represents the cataloguing component. The Home, Core Web Application and Daily Data Sync are represented in all the micro-services components.
5.1. Experimental Setup
Runtime Environment: TerraBrasilis was deployed on a virtualized server using
Proxmox (
https://www.proxmox.com/en/) with two Xeon cores (R) CPU E5-2650 v3 2.3GHz and 96 GB RAM memory. The server contains two disks with 600GB SAS plus and six disks with 1.2TB SAS 10K. It is runningPROXMOX 5.1 release.
Dataset: this is based on ISO/IEC 9126 which defines a set of parameters to standardize a software quality assessment. Detailed information was collected about CPU, memory, the file system and network usage in each of our container’s micro-services to measure the efficiency of TerraBrasilis. The timeframe analyzed was from 1 January 2019 time (UTC 00:00:00) to 22 July 2019 time UTC 10:00:00.
5.2. Performance Analysis
Each measurement comprises a resource description SDI, its associated container hostname identifier and a field set containing successive values with time-stamps. The datasets that resulted from the near-real time monitoring of specific micro-services were taken from InfluxDB with a familiar query syntax using Grafana. The main micro-services responsible for the working core of TerraBrasilis were analyzed. These included the following: the analytics API, the analytics database (Redis), the analytics feeder, the business API, the business database (MongoDB), the synchronization client of deforestation alerts that supply map and dashboard alerts, both the map server (GeoServer) configurations in which the first was in a cluster mode while the latter was in a single instance mode, the metadata catalogue (Geonetwork), the web application core and the home website.
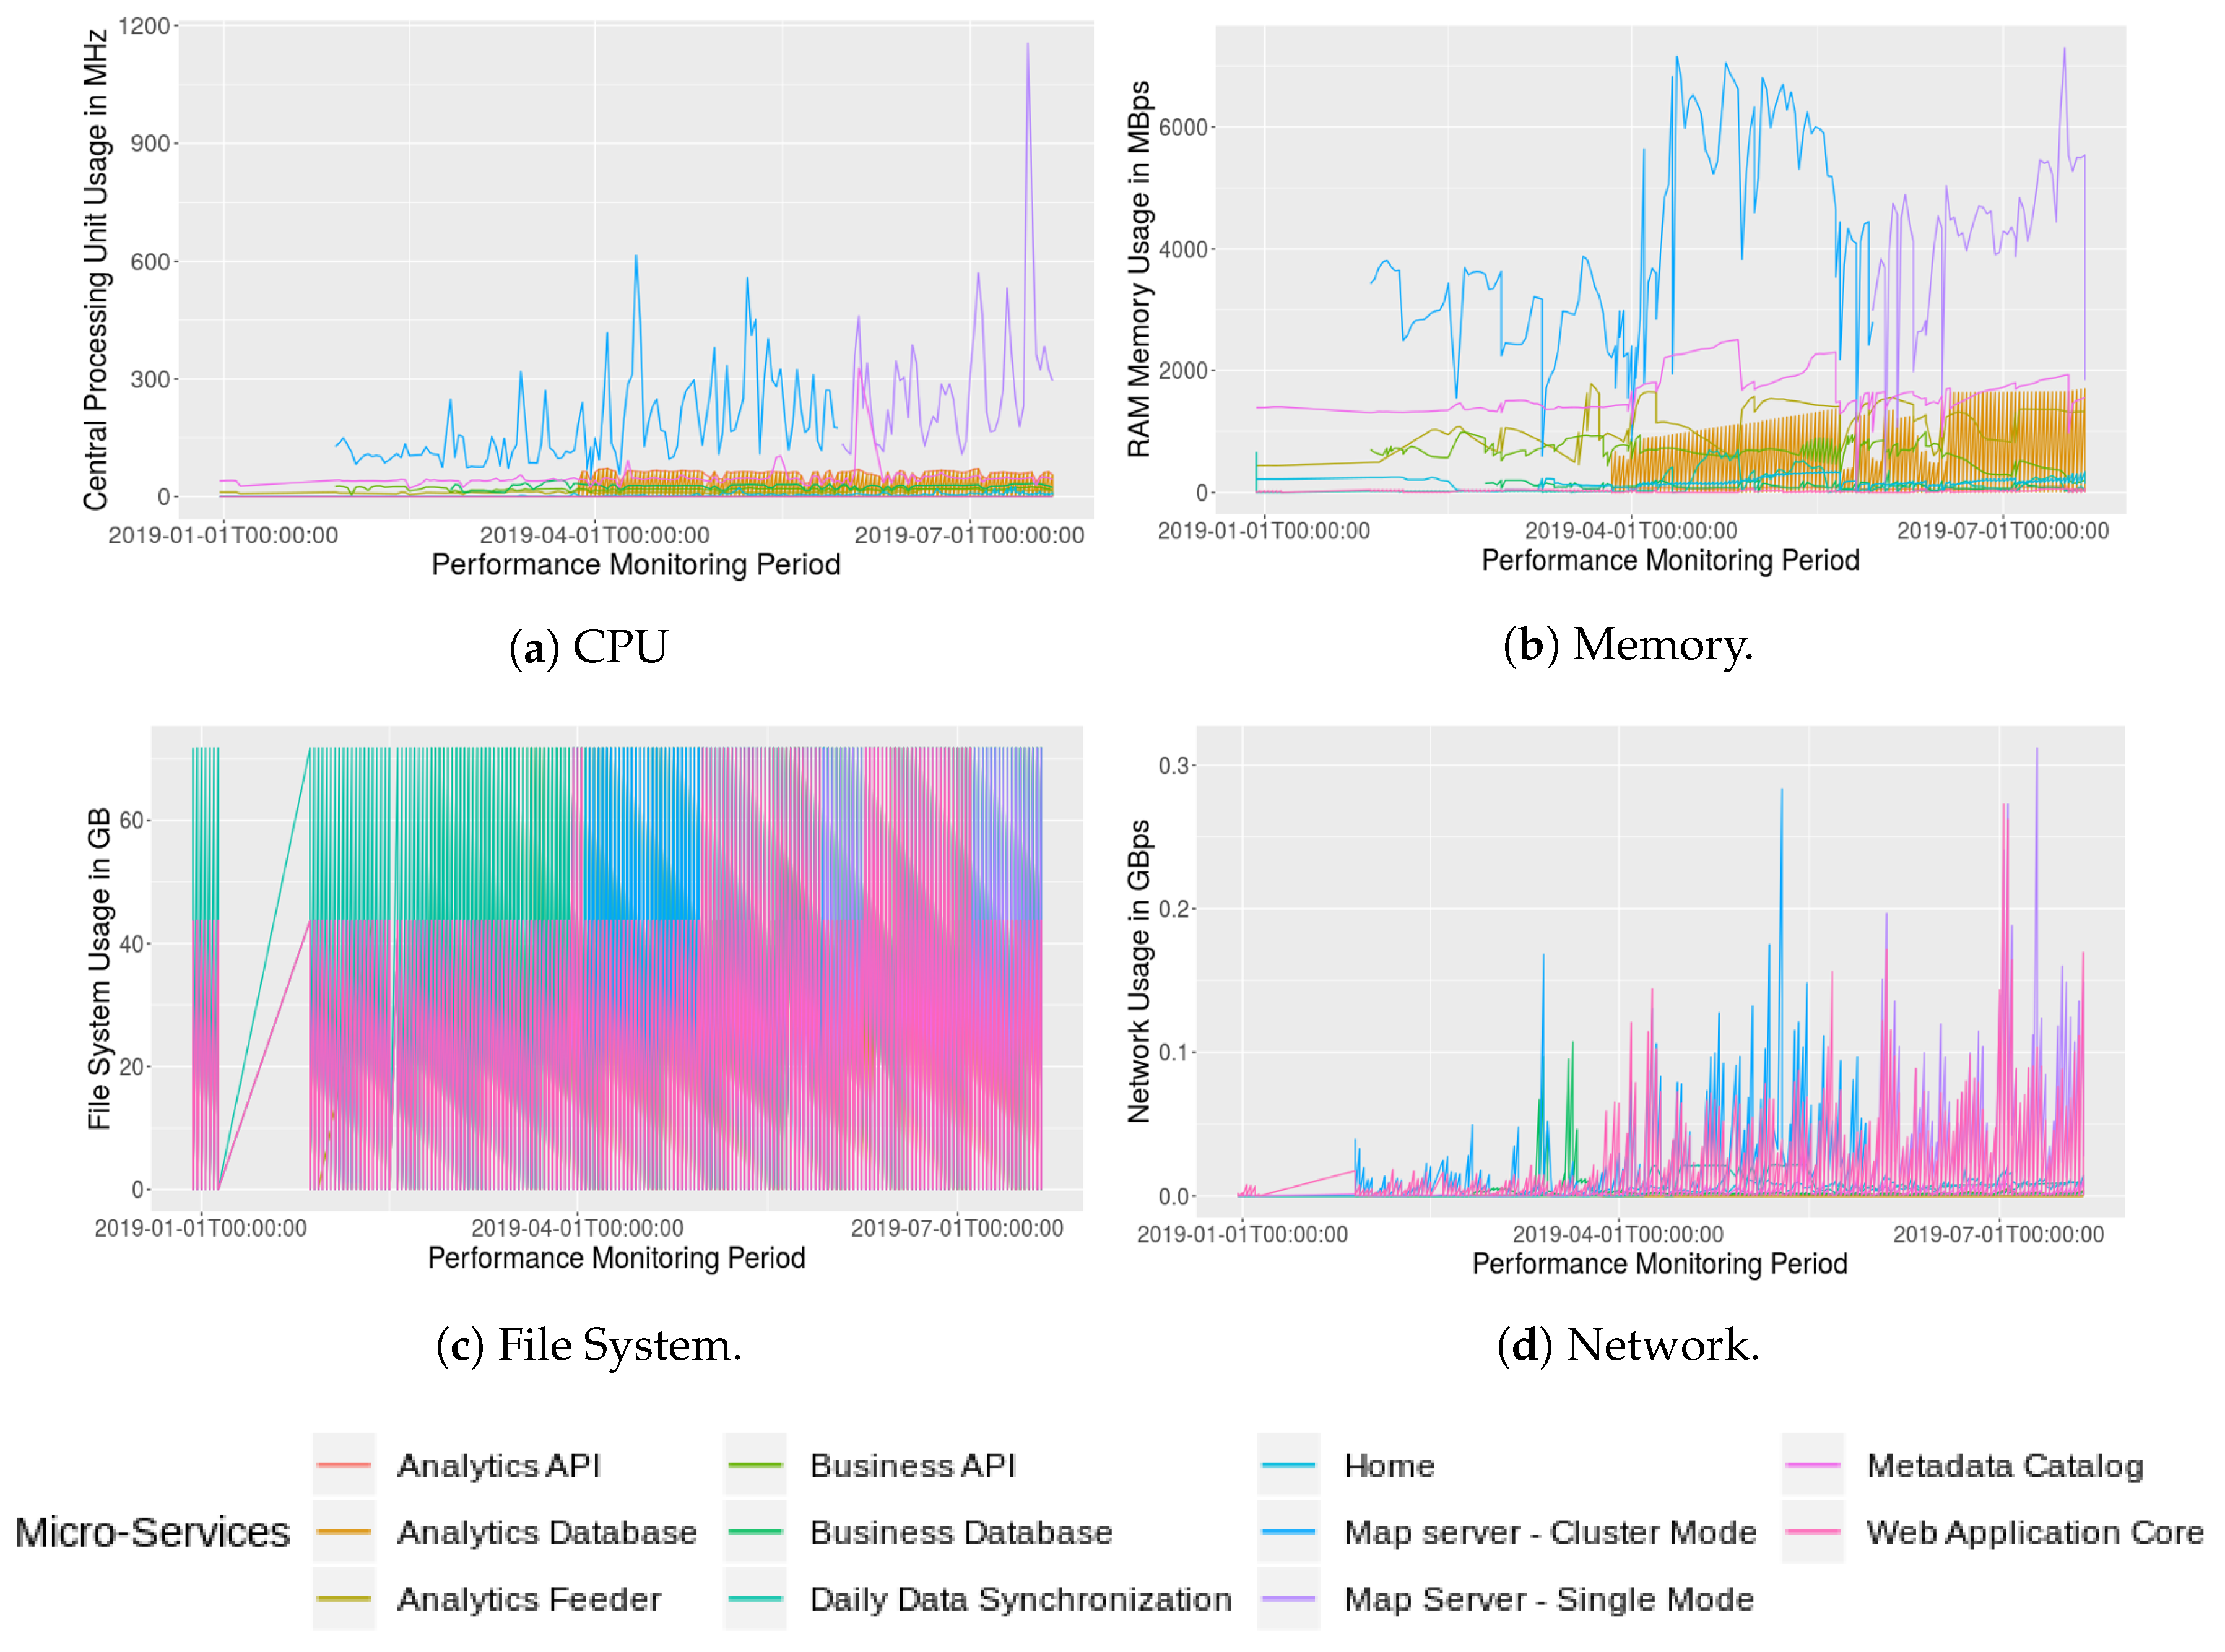
Figure 12 shows how the map server (
GeoServer) makes more use of CPU and memory resources than other micro-services. Map server configurations (cluster and single modes) have very high peaks since the maps interoperability requires access to their data whenever an user comes in, which is a part of the TerraBrasilis’ routine approval requests. Both CPU and memory make a clear distinction between episodic and periodic calls, the former is the case of the business API while the latter is the case of the analytics API. The second receives intermittent inputs every 5 min from its feeder program. We only analyzed data from January 2019 although the TerraBrasilis alpha release occurred in October 2018. The beta release occurred in March 2019 with subsequent new patches. This includes, for instance, the downgrade map server, from cluster to a single instance mode because of its high complexity in the first mode. The file system resources remained stable with around 70 GB in use. The cluster mode map server, however, achieved high values mainly with regard to the network although the monitored noise data were rejected. For example, we found six overheated values and one underheated value of CPU usage. We also removed any measures that were not available such as those obtained when TerraBrasilis operations were unstable.
Table 1 provides a summary of how these micro-services resources are used. CPU is used less in the web application core, while the single instance mode of the map server has the highest rates with the highest mean and standard deviation. In addition, once a day we had to estimate the efficiency of the service responsible for (1) synchronizing the remote alert data, and (2) incorporating it into the TerraBrasilis spatial data storage system (
PostgreSQL) and map server. Memory resource usage has a similar behaviour. As well as the web application, the business database and analytics database are the most efficient since they have almost 0 MB of usage. While the file system displays uniform values for all the analyzed micro-services, they have similar alternate network values. We approximated the minimum values to 0 in the network and file system owing to the large number of mantissa digits.
5.3. Web Application Load Testing
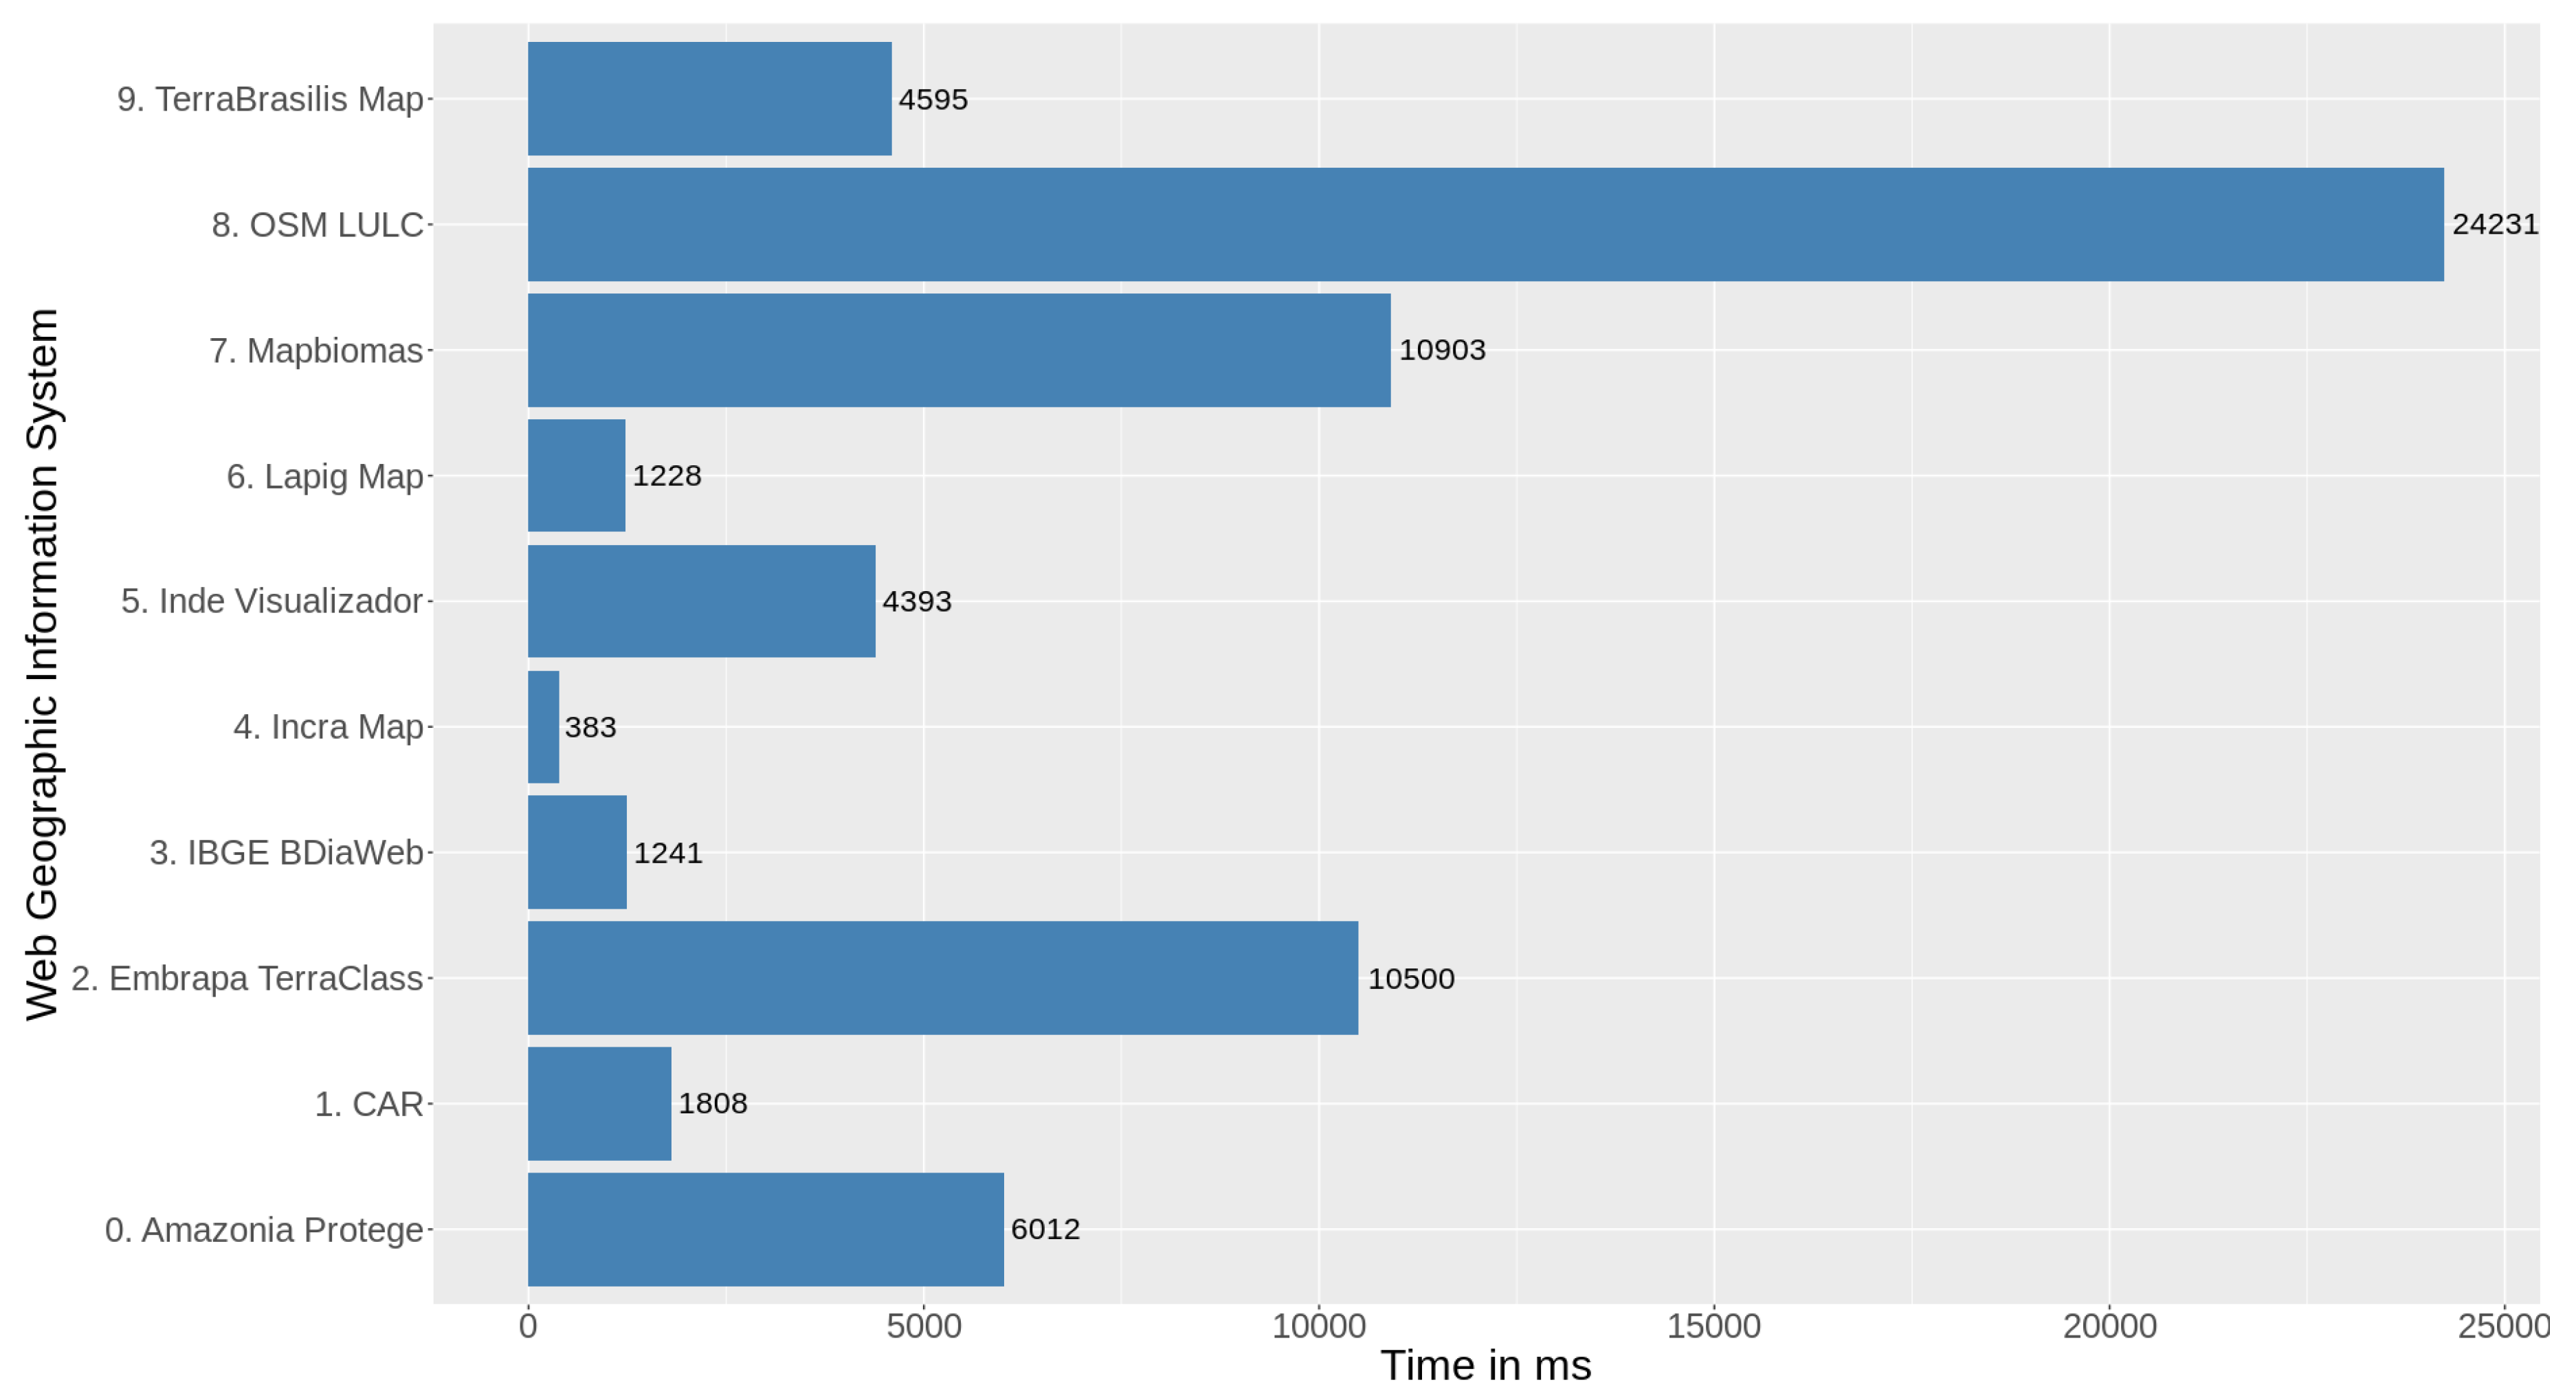
Unstable conditions were introduced such as those provided by load testing to detect and repair any features that were impairing the runtime performance of TerraBrasilis. This strategy helped us to determine whether our audience finds it more satisfactory than other similar web applications. We estimated the median time performance for fetching all the static files (e.g.,
CSS,
JavaScript, images) so that the users could have a smooth interactive experience. These metrics represent 100 sample requests that are repeatedly emulated by 10 users with a ramp-up period of 10 seconds for a loop to run 10 times. This simulates the behaviour of a web browser. TerraBrasilis loads quickly compared with data infrastrature that receive a similar number of bytes received per second (see
Figure 13). The list contains web mapping applications such as those provided by: IBGE (
https://bdiaweb.ibge.gov.br/#/consulta/vegetacao), INPE (
http://terrabrasilis.dpi.inpe.br), Terraclass (
https://www.terraclass.gov.br/webgis/), INDE (
https://visualizador.inde.gov.br/), LAPIG (
http://maps.lapig.iesa.ufg.br/lapig.html), MapBiomas (
http://mapbiomas.org/map), CAR (
http://www.car.gov.br/publico/imoveis/index), Open Street Map (OSM) LUC (
https://osmlanduse.org/#8/8.18828/49.16024/0/), Incra (
http://acervofundiario.incra.gov.br/i3geo/interface/openlayers.htm), and Amazonia Protege (
http://www.amazoniaprotege.mpf.mp.br/).
MapBiomas is a collaborative project formed of an interdisciplinary group based on the Google Earth Engine(
https://earthengine.google.com/) platform. Its main aim is to provide automated classification capabilities to carry out thematic mapping from Brazil’s biomes throughout the annual LUC series. Amazonia Protege is a project aimed at combating illegal deforestation in the Brazilian Amazon rainforest by means of satellite imagery and cross-validation based on public data. Unlike Amazonia Protege, CAR provides a method for filtering spatial data from the National Rural Environmental Registry System (SICAR). As well as this, Incra has a web portal for displaying the Brazilian land database and integrated services so that access can be obtained to geospatial and statistical data.
From a more academic perspective, OSM LUC can serve as a tool with data provided by volunteers. IBGE also has an interactive LUC data portal. Its distinguishing feature is that it can allow an analysis to be conducted that is based on spatial grids. It can also be integrated with other statistical databases and its main objective is to assess what economic activities can be undertaken with Brazil’s natural resources. With regard to the user interface, the geo-forestry institutional portal was found to be a good source of ideas, although it was not possible to test its web GIS as it is not a sufficiently complex analytical tool for large data.
Table 2 refers to the audition software created to provide actionable tips on our front-end implementations. The Incra Map achieved minimum values since it has no loading overlayer at startup, while OSM LULC obtained the worst results because of its distance from the server and the amount of OSM data to load. All the throughput is very similar because of the used networking capability. Embrapa TerraClass and INDE Visualizador did not respond in 2 and 1 of the requests, respectively, which might represent that they had reached their saturation point. We set the baseline for the experiment on 25 July at 19:00p.m. UTC 3. We did not intend to run a stress test although some web application’s reached their saturation points. Finally, the web applications were in operation during the tests, which their load could be therefore compromised if lots of users were online simultaneously.
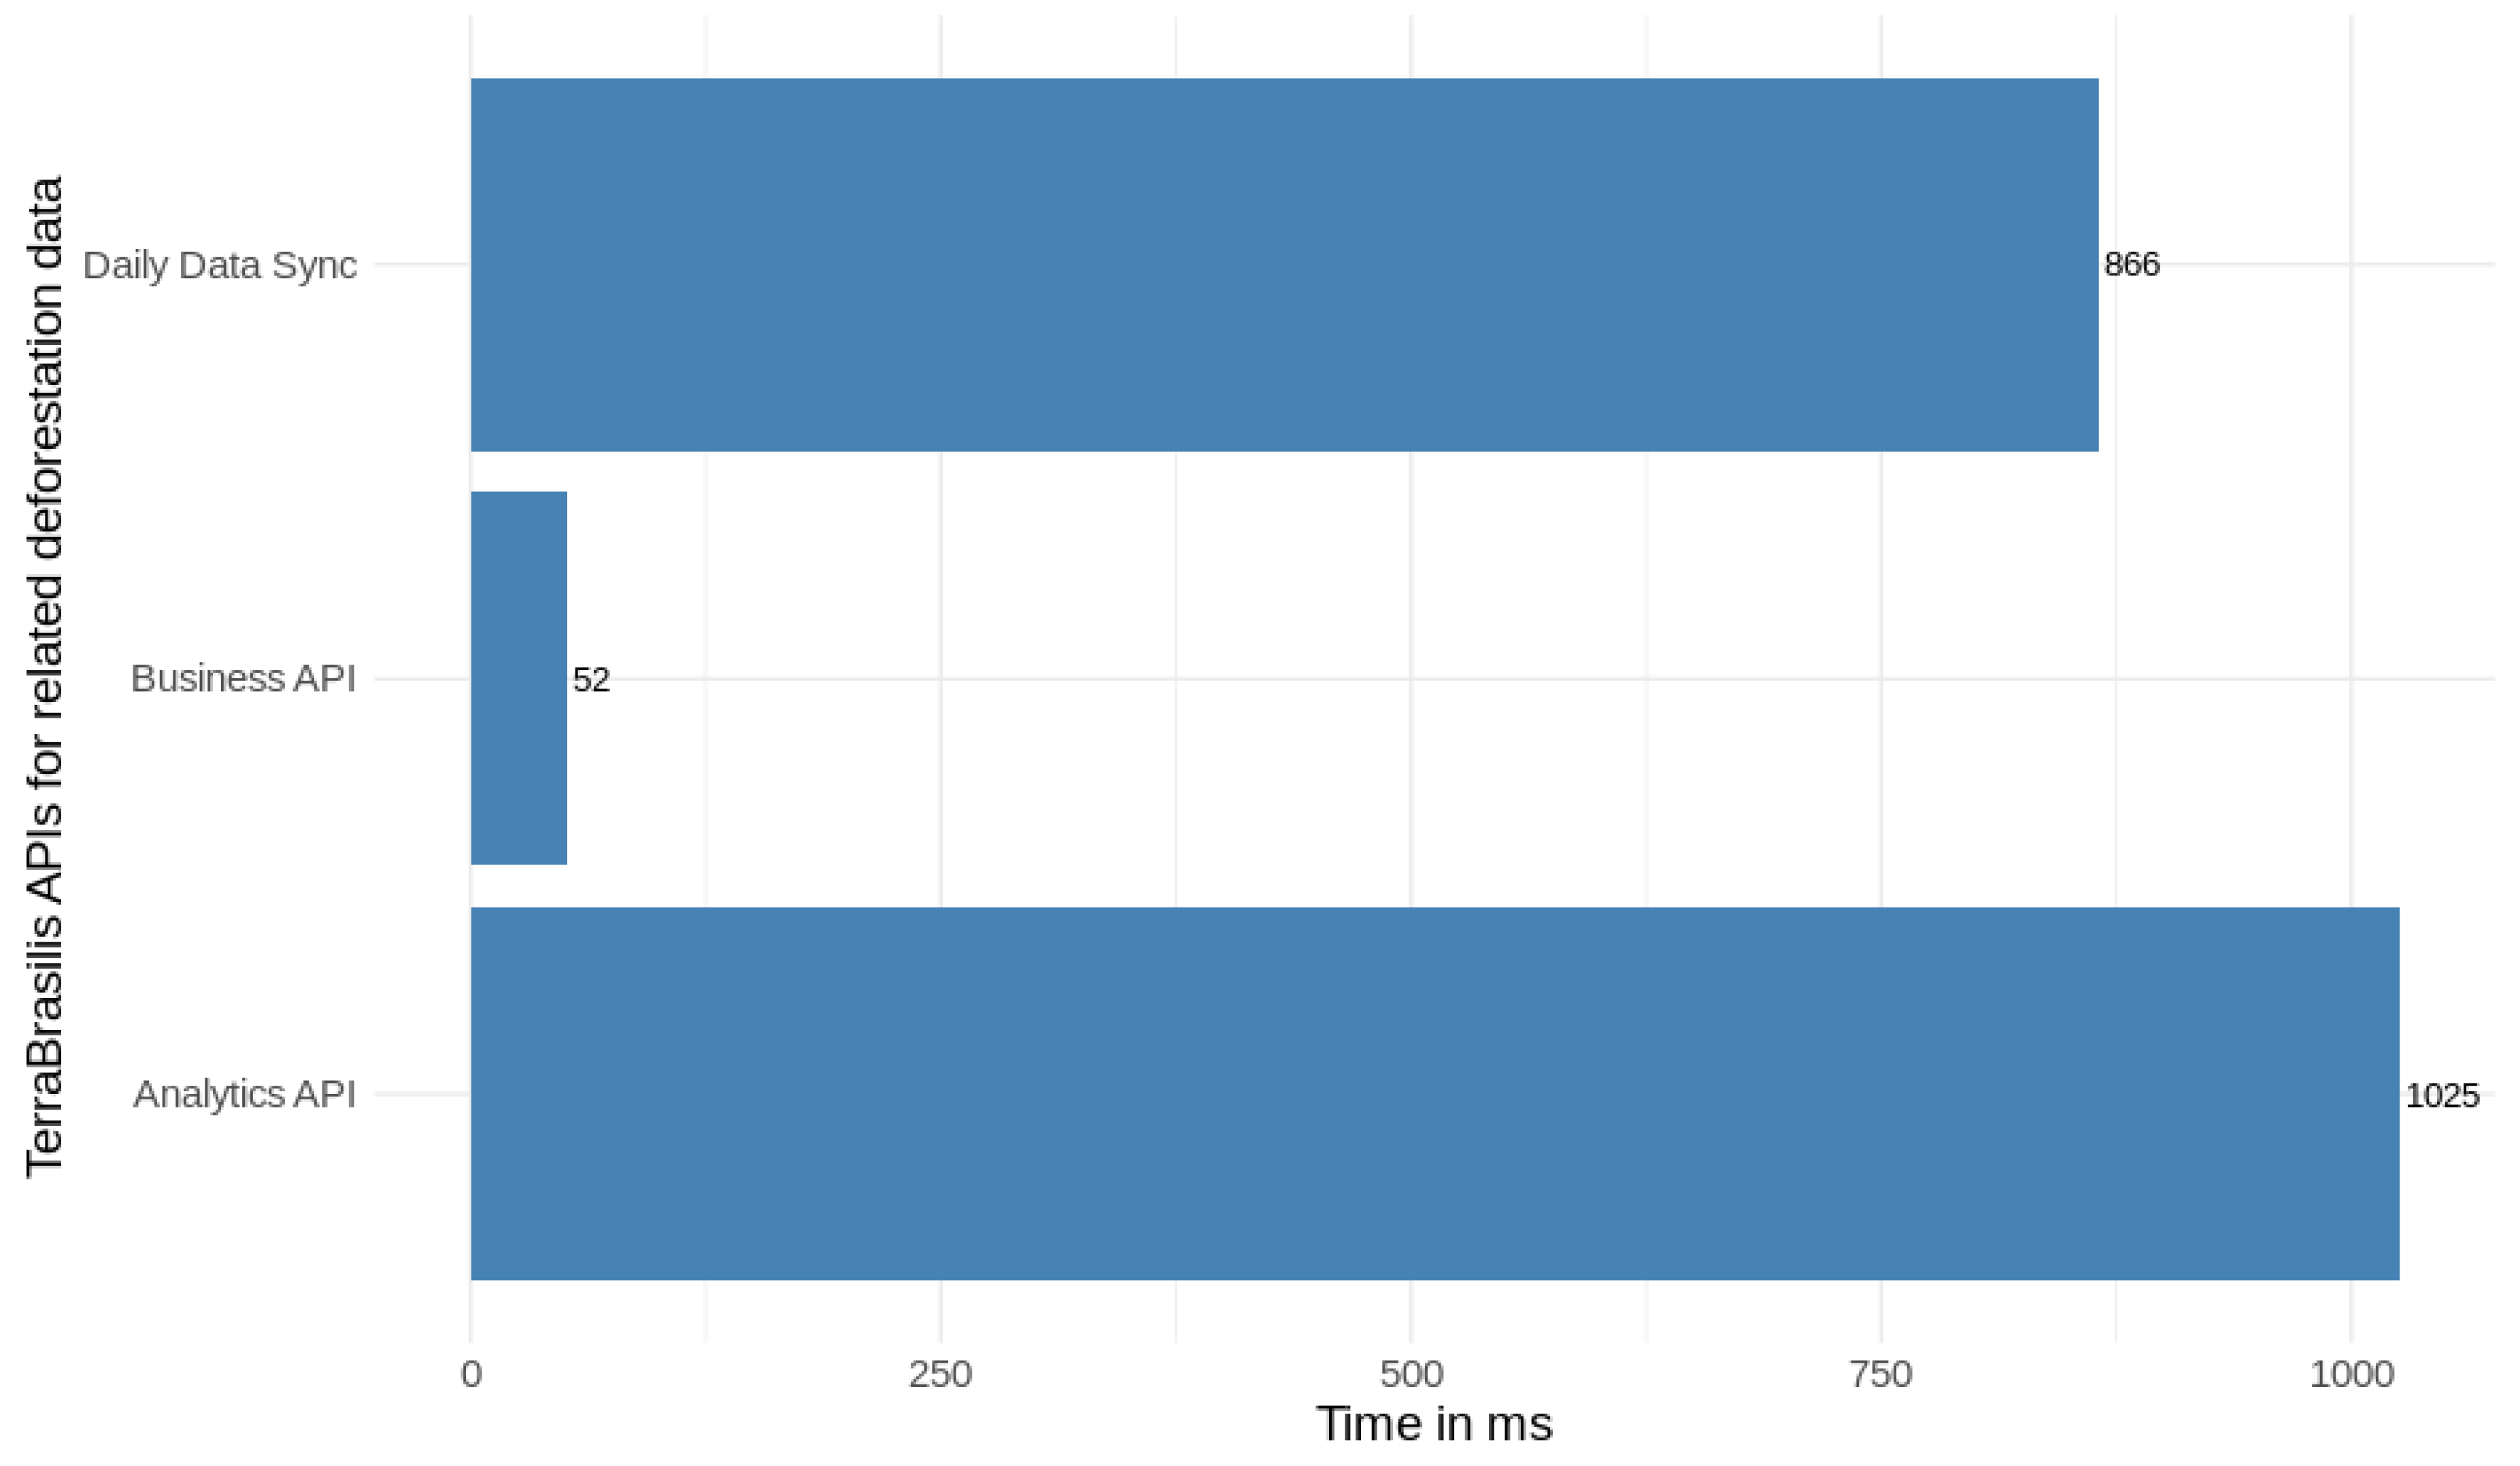
The web application load testing which is treated here as a front-end test was supplemented by back-end implementation testing which involved three APIs (business API, analytics API, and the client synchronization of deforestation alerts). It also underwent a good deal of network performance monitoring to maintain its responsiveness effectively no matter how widely distributed our resources were.
Figure 14 depicts the differences in performance achieved by these three micro-services.
In summary, as in the previous test we performed 100 requests by emulating 10 users at the same time with a 10 s ramp-up in a loop count of 10 times (see
Table 3). All of them responded with a suitable degree of availability (# Error 0% equal to 0.00). Since the business API provides information about the layers that are loaded inside the map, we thought that this kind of test could directly complement the previous one to find the performance of TerraBrasilis through a full stack implementation. Since we did not have any information about the back-end developments of other web applications, we did not consider testing their back-end APIs.
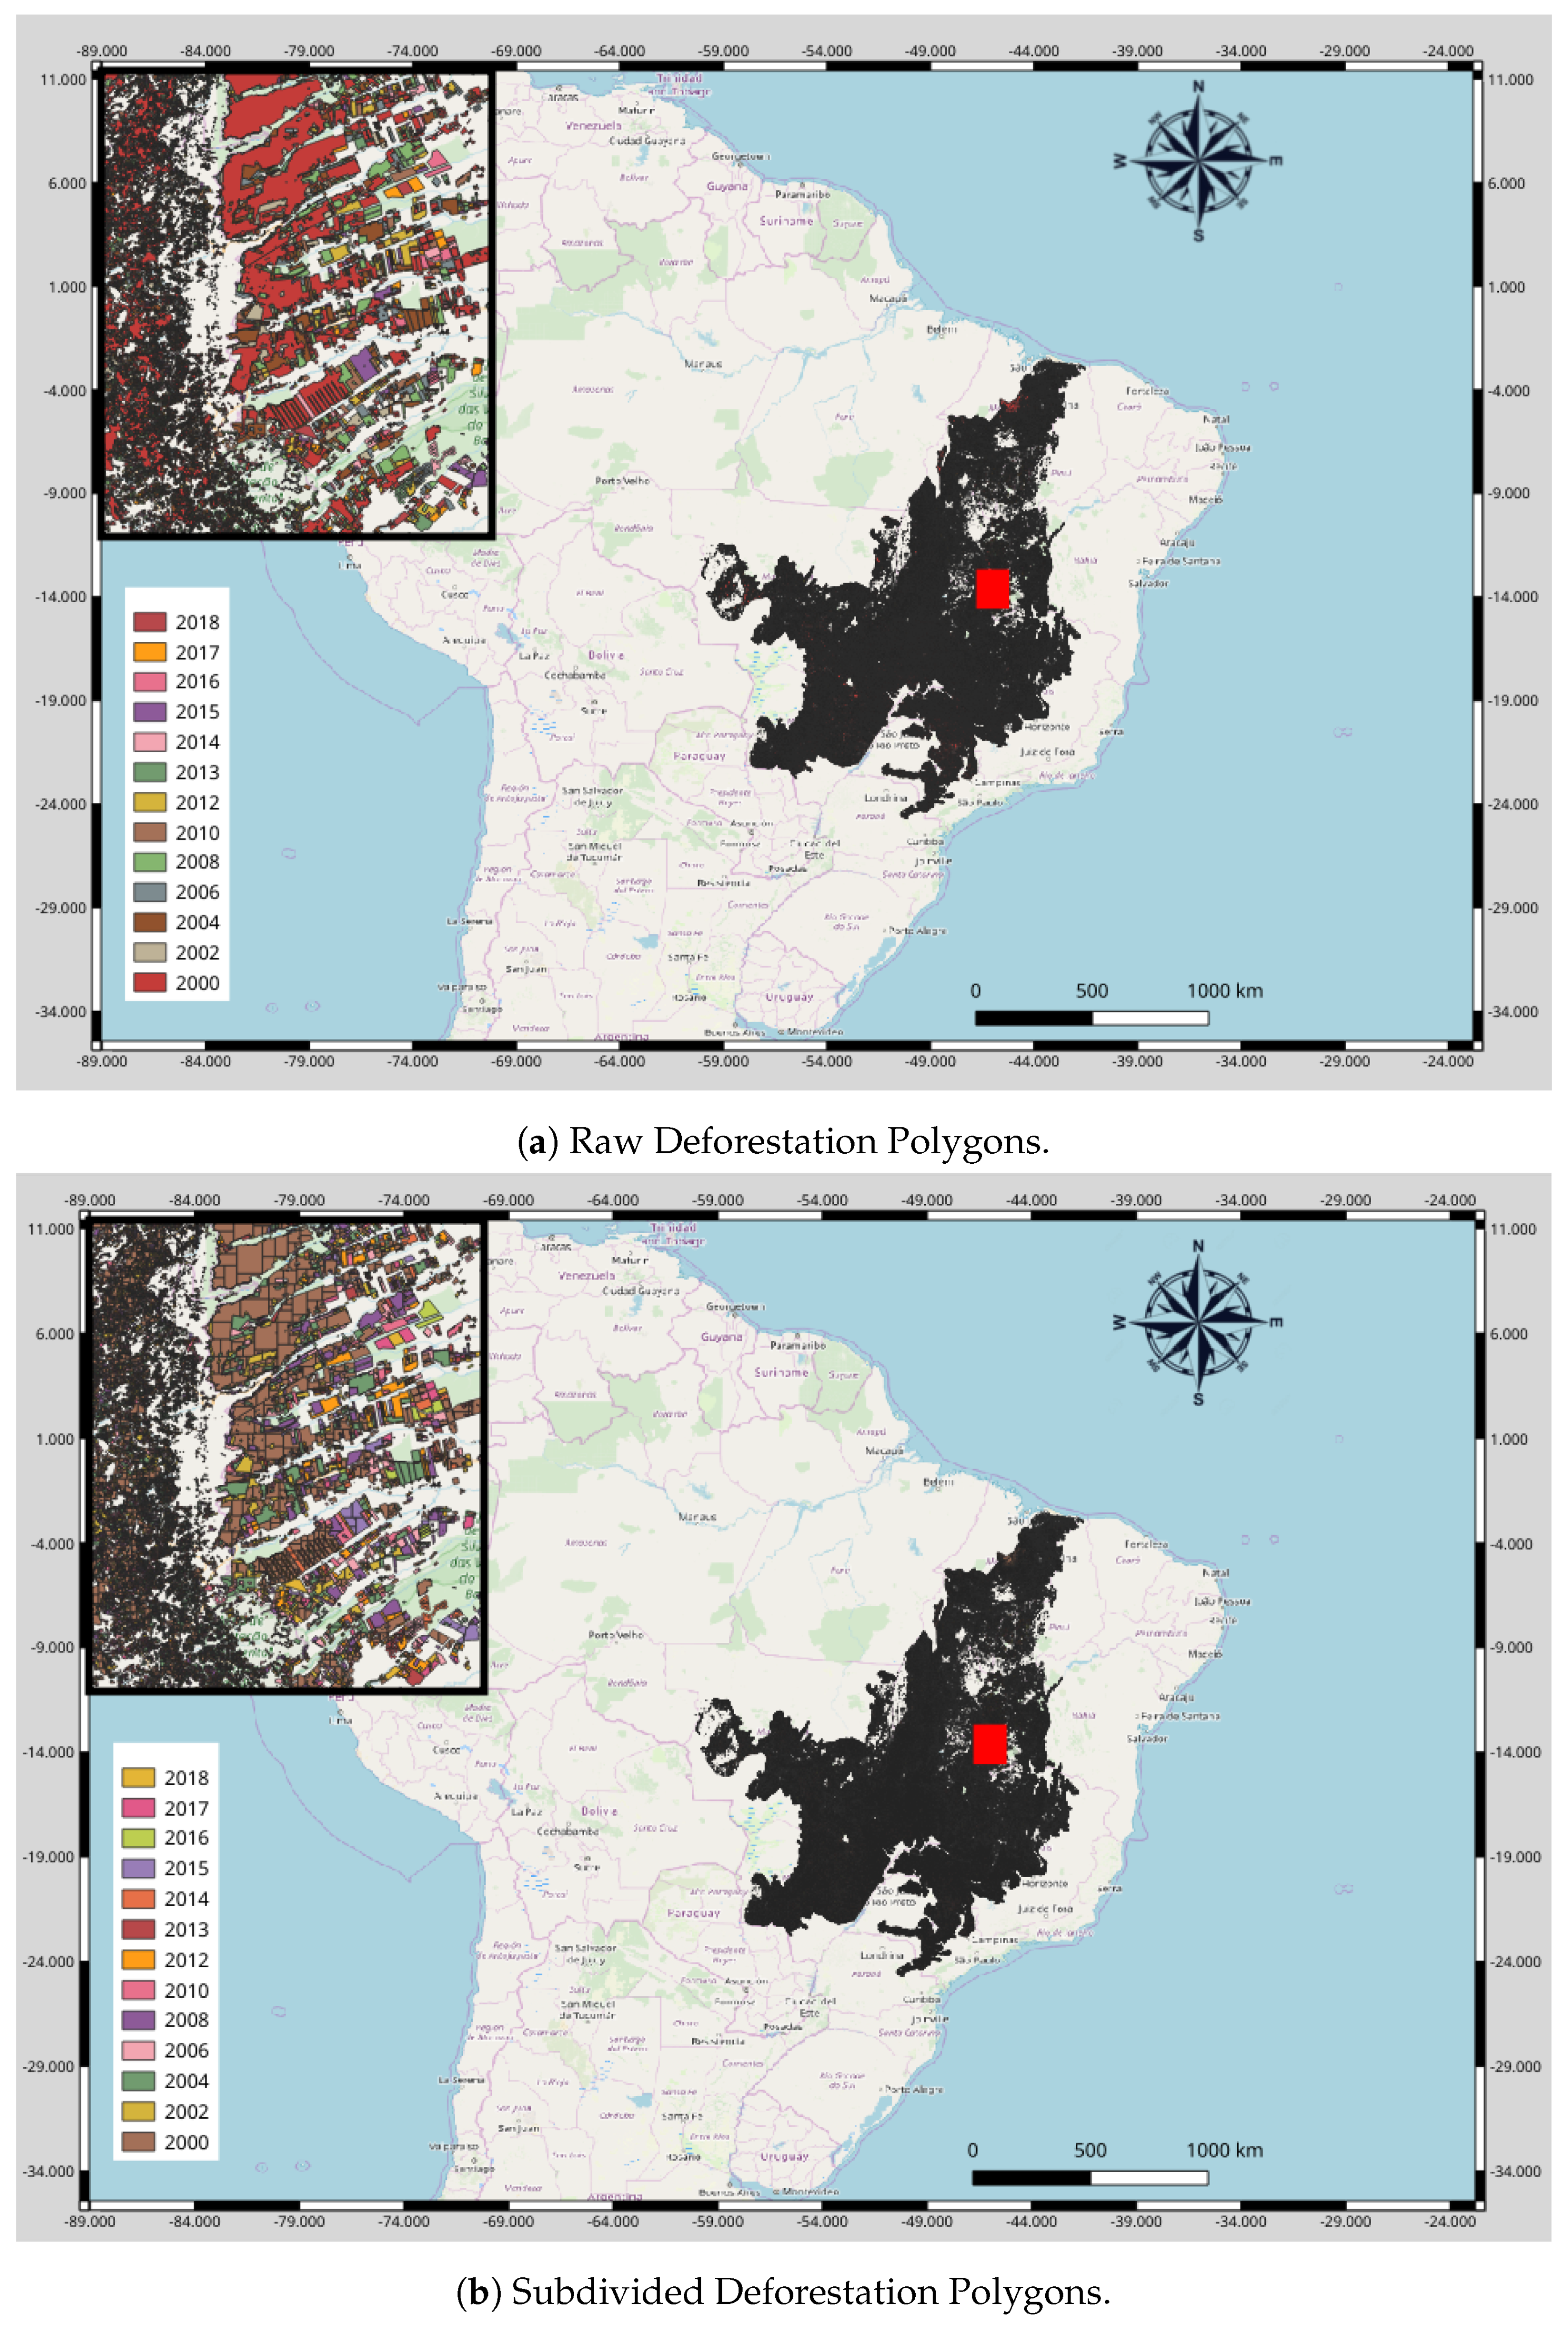
5.4. Subdividing Raw Data to Speed Up Spatial Data Operations
When handling the vectorial incremental data with large features produced by PRODES, it was crucial to create spatial indexes beforehand, since databases are faster to compare bounding box than any other feature format. More than this, small rather than large bounding boxes allow a better processing time. In view of this, we have shrunk each PRODES feature recursively until they have (at most) 256 vertices (
https://postgis.net/docs/ST_Subdivide.html) each to optimize our intersection operations.
Figure 15 makes a comparison between raw and subdivided PRODES data.
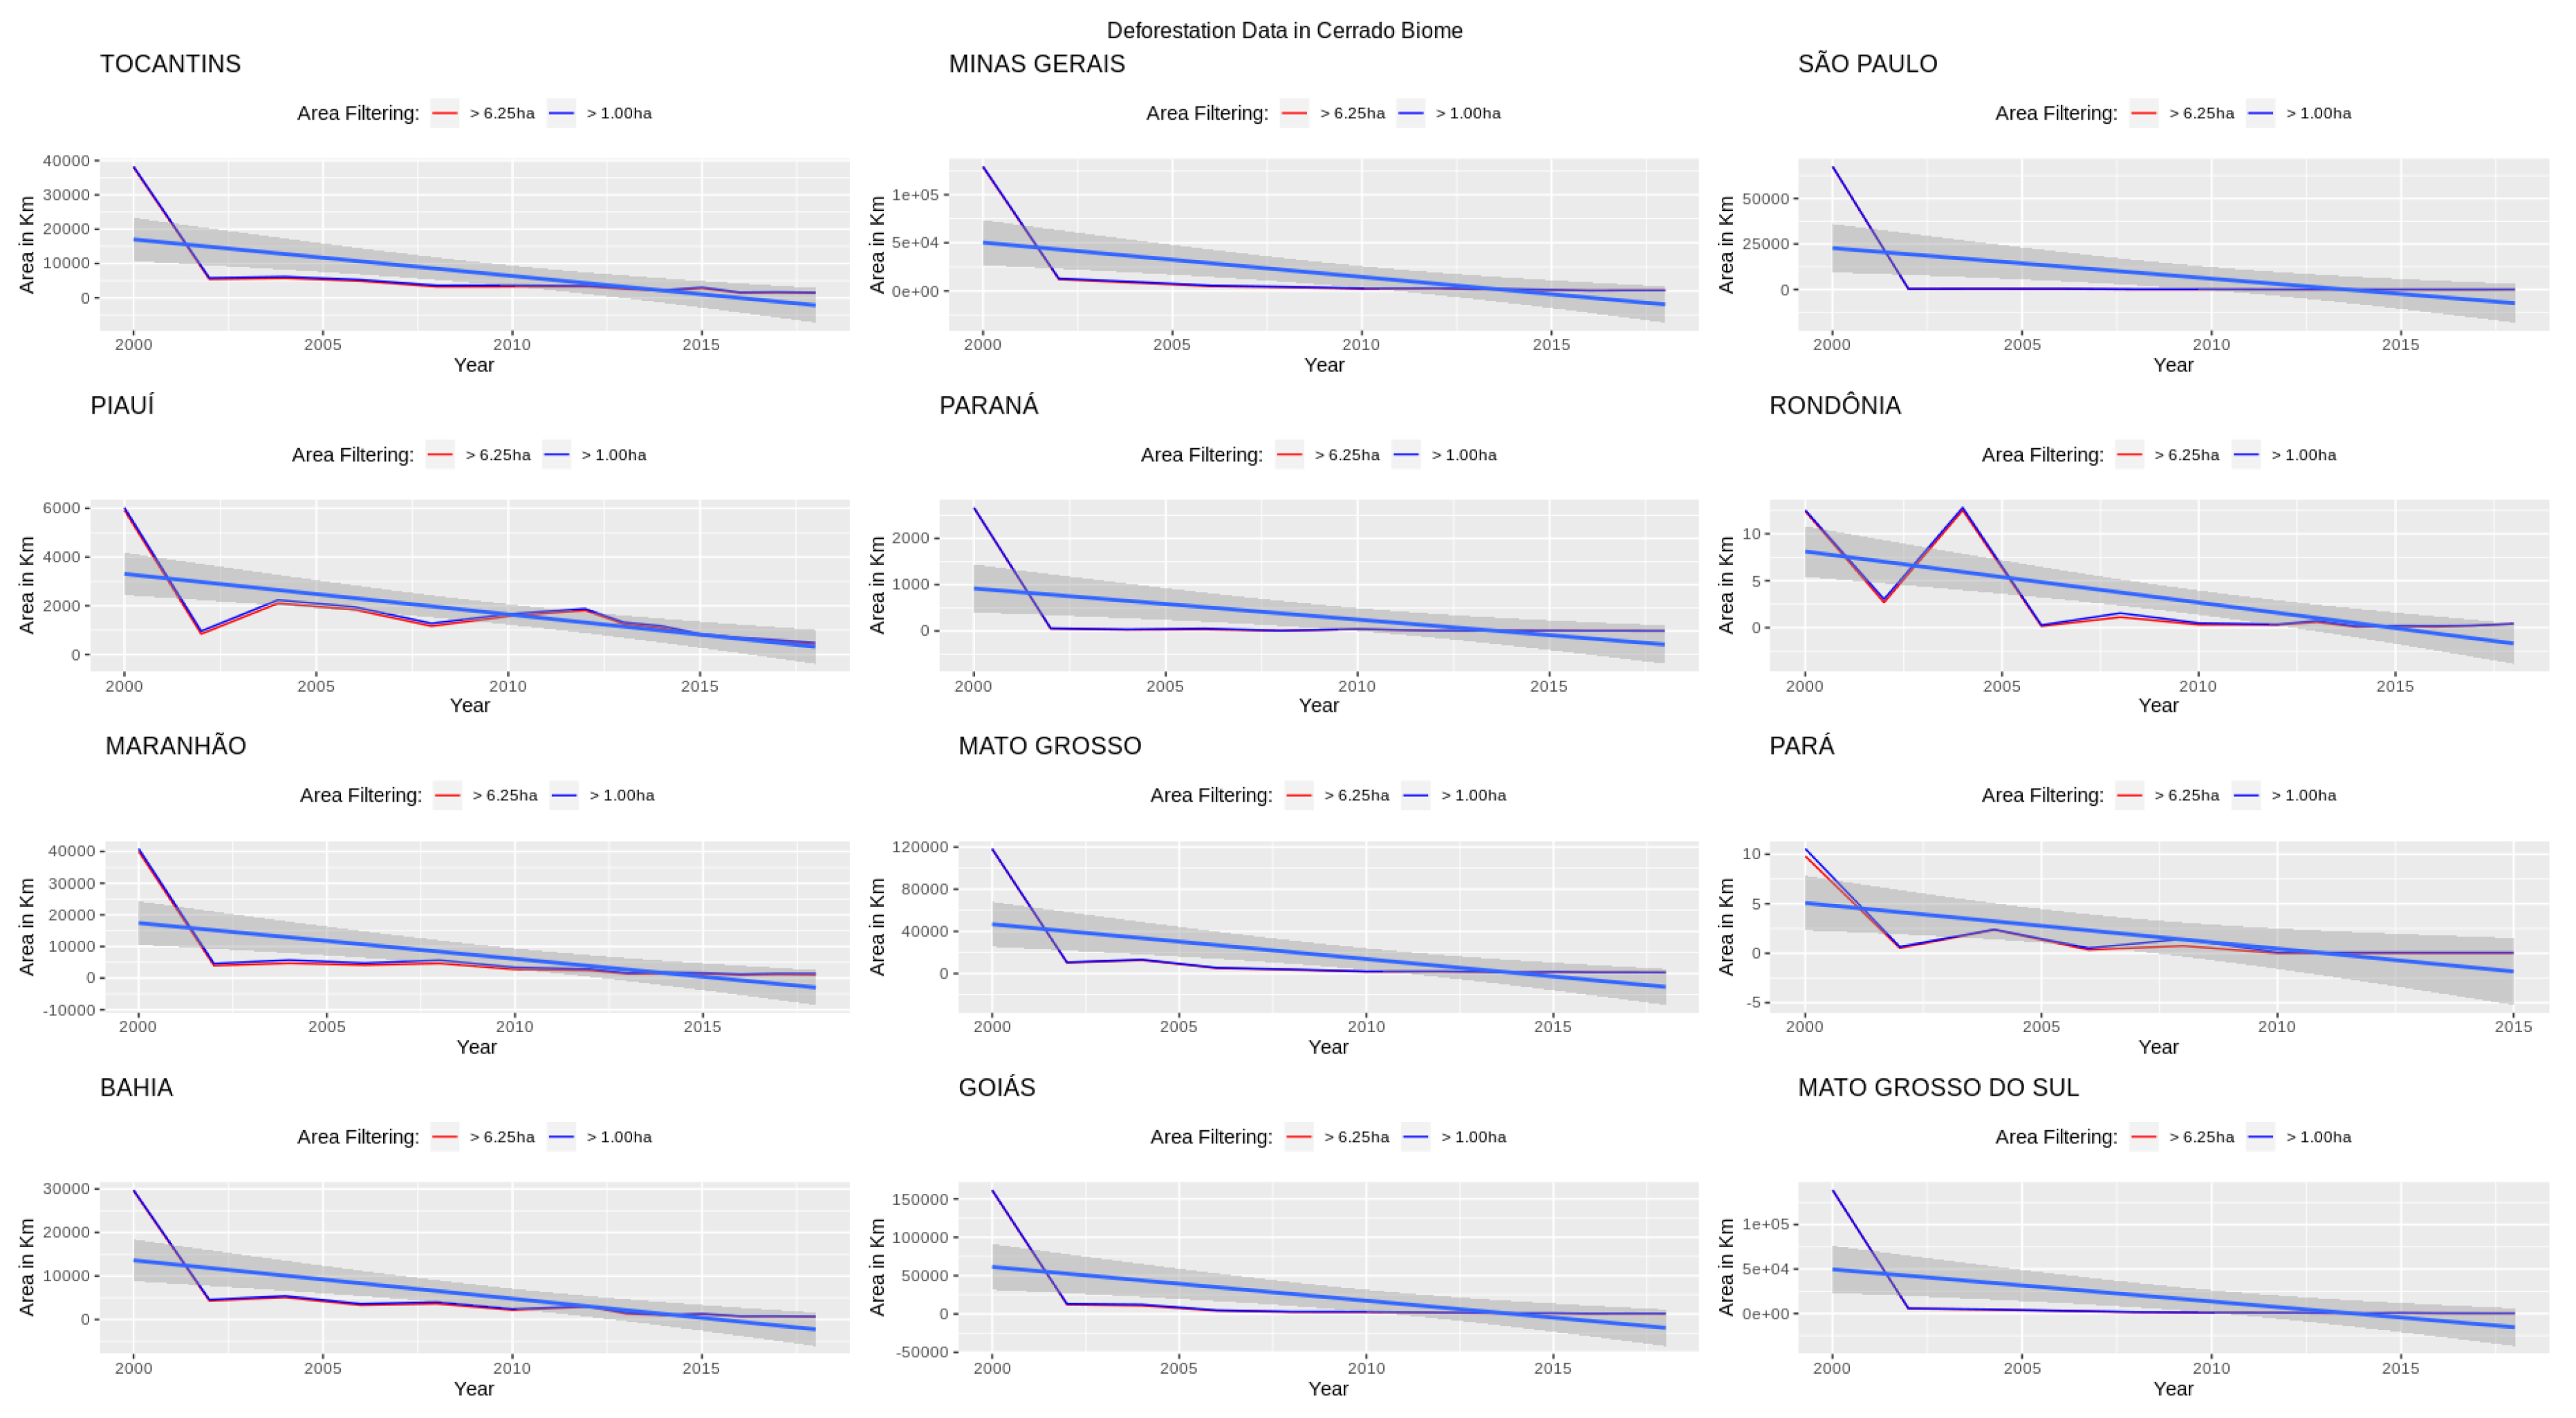
5.5. From the Basics to Advanced Analysis Using TerraBrasilis Analytics APIs
After defining the path for TerraBrasilis Analytics API and obtaining all the datasets, we defined the variables needed to gather data related to periods, localities, places of interests, classes and filters from the PRODES Cerrado. With this in mind, we created a tidy data for request input and obtained deforestation data from all the places of interest (Tocantins, Minas Gerais, São Paulo, Piauí, Paraná, Rondônia, Maranhão, Mato Grosso, Pará, Bahia, Goiás, Mato Grosso do Sul) or from one specific place (states).
Figure 16 shows an update loop of plots (
https://github.com/Terrabrasilis/terrabrasilisAnalyticsAPI/blob/master/demo/linear-regression.R) to gather analytics API data from all the Cerrado biome States, except forthe Federal District, and a simple linear regression within it.
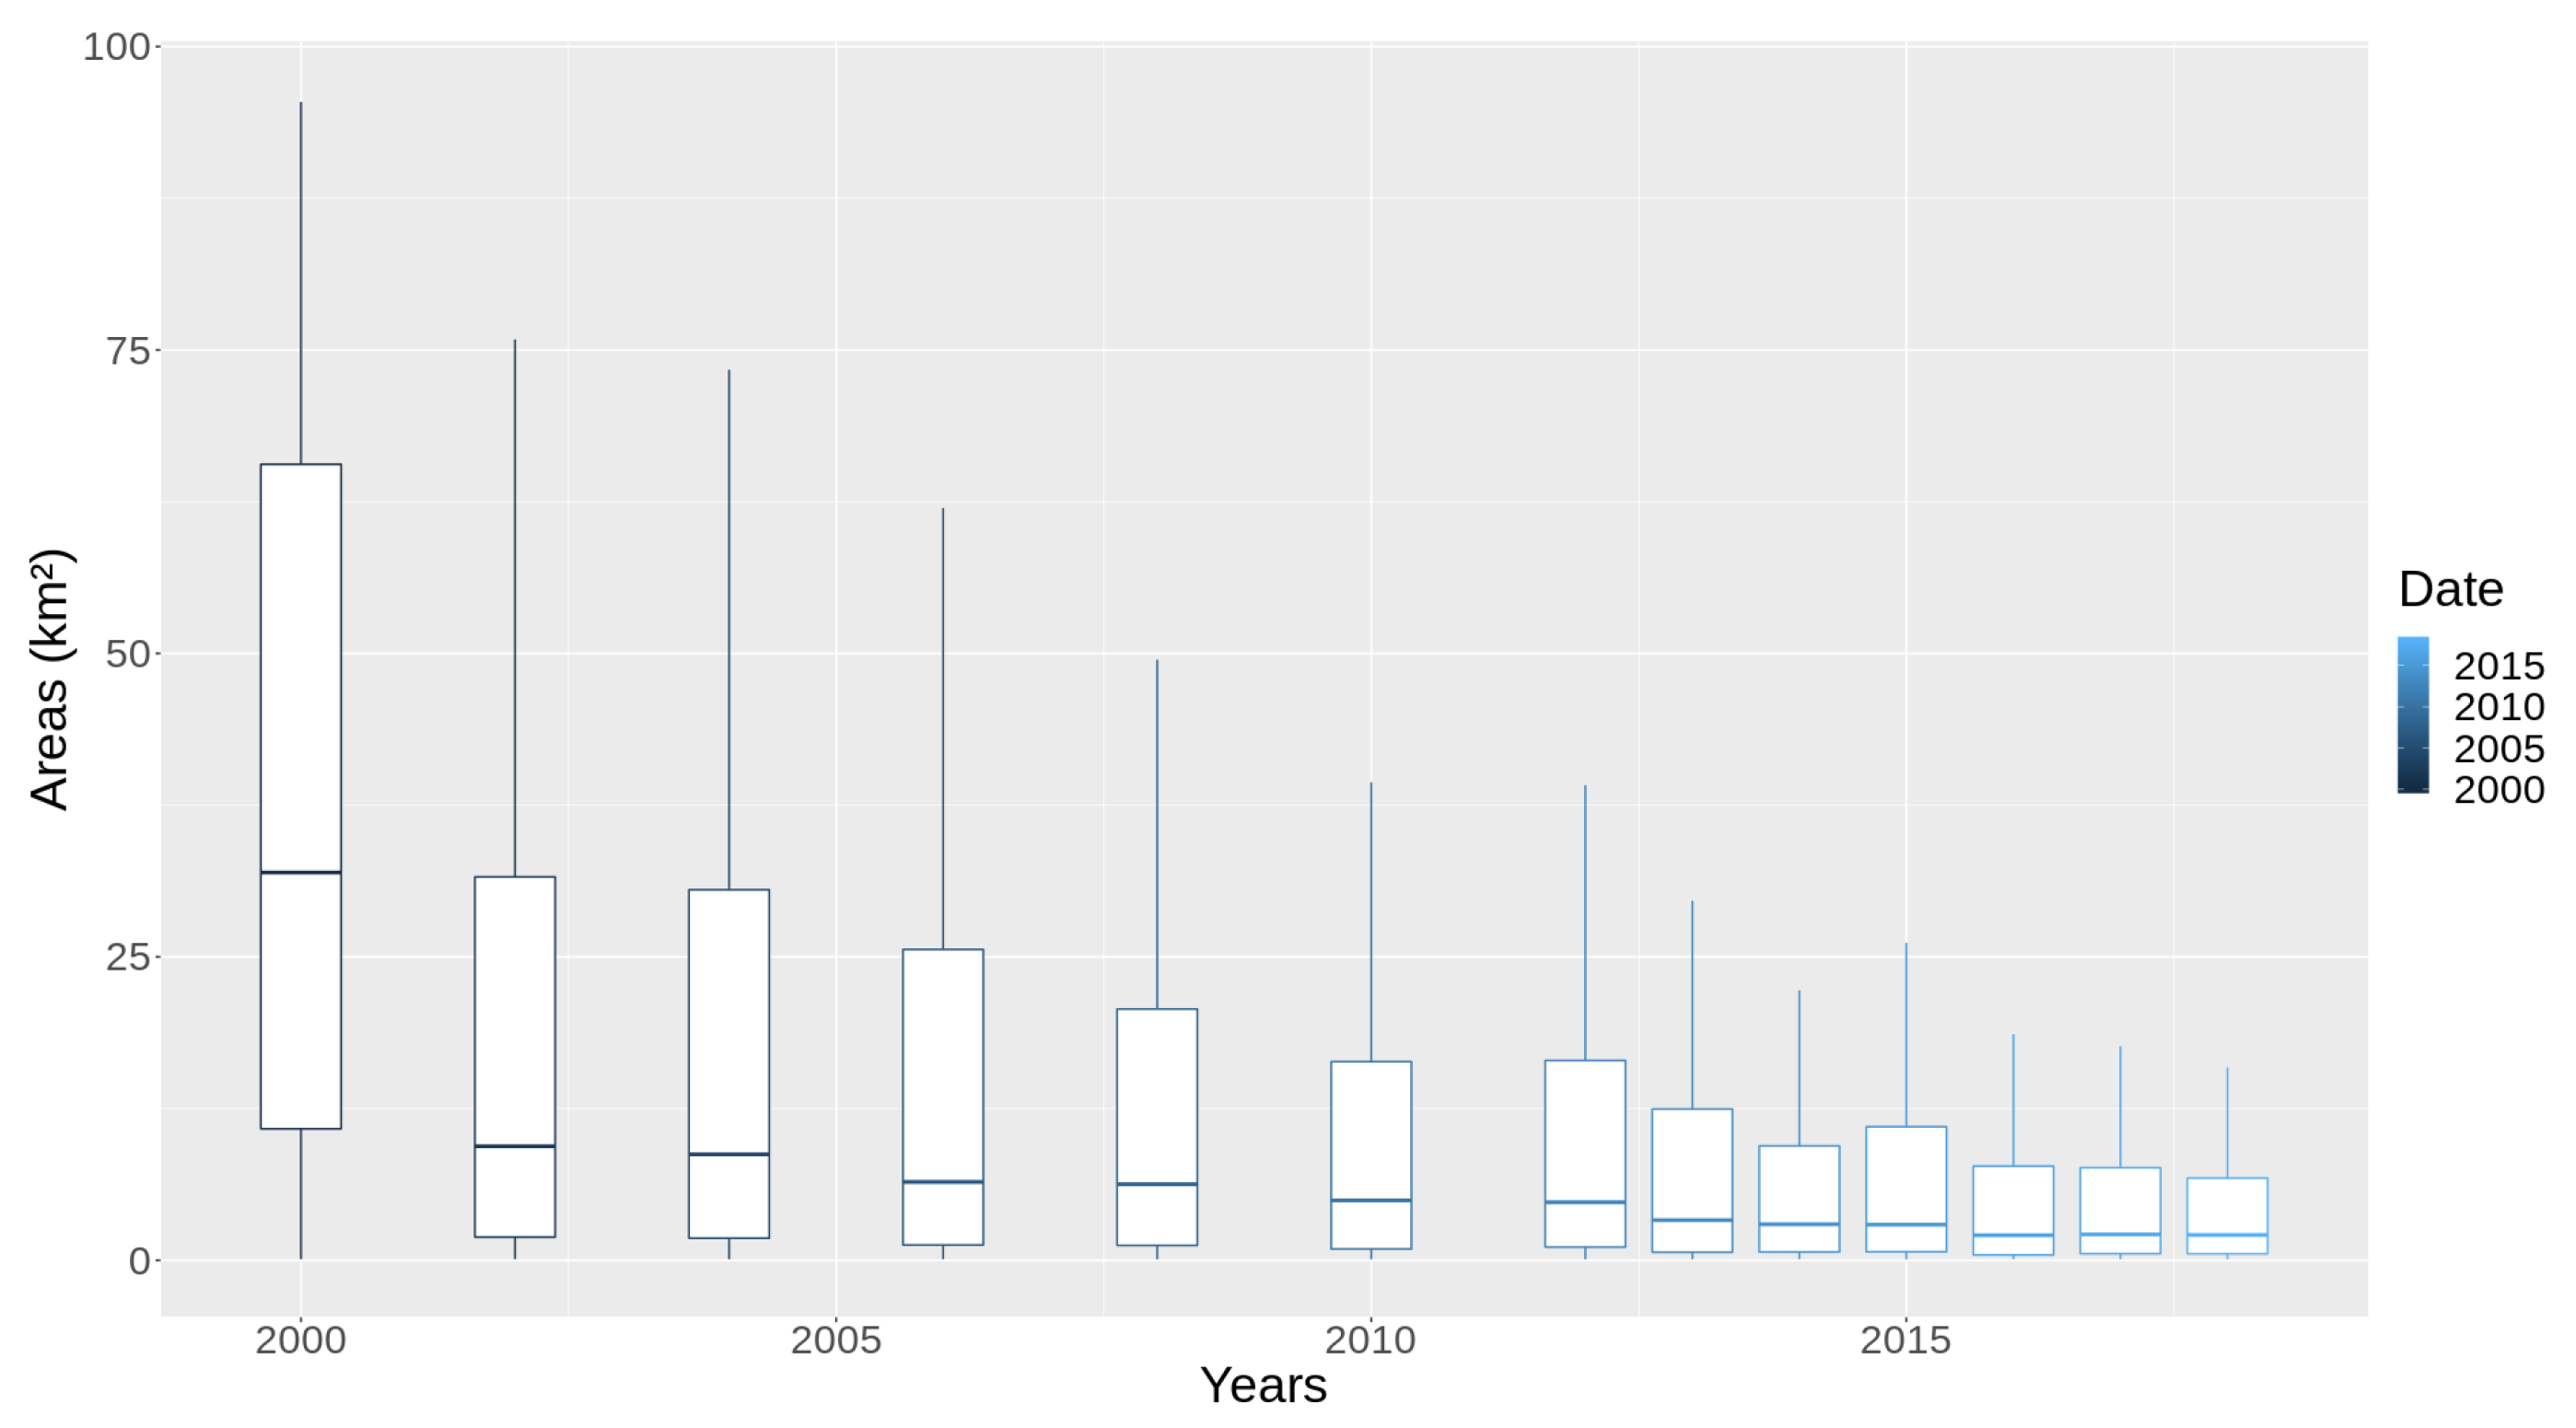
Figure 17 also represents a trend that has emerged from a non-parametric analysis of each PRODES year in the Cerrado municipalities. It follows the pattern of distribution found in all the areas of deforestation, such as dispersion, skewness in the data and the outliers. The latter extrapolates the view of the graphic. The demo code is available in the
R package (
https://github.com/Terrabrasilis/terrabrasilisAnalyticsAPI/blob/master/demo/boxplot.R). We used the blue gradient color scheme to differentiate between each year.
7. Conclusions
Our development of TerraBrasilis involved assessing the functional and non-functional requirements for the historical clear-cut deforestation rates and increments, and early warning alerts in near-real time. This particularly applies to potentially dangerous suppression of forests. This task combined the use of technological devices at an architectural level to represent the dynamics of mapping projects and the examination of additional features inherent in domain-related systems.
On the basis of the characteristics outlined here, we implemented and then assessed an open-source SDI within a cluster of virtualized containers by means of a micro-services architecture. The results providedevidence that TerraBrasilis is fast and lightweight. In addition, it provides APIs that interact with GIS and analytics environments. As a result, we were able to increase the web application availability of DETER and PRODES by optimizing a spatial index for a fast web application loading performance. Finally, it should be noted that TerraBrasilis was designed to improve its fault tolerance in unstable computer network scenarios and make it simpler to increment new functionalities.

 ,
, 


