1. Introduction
Research about fear of crime in the United States, often conducted on a large scale in the form of quantitative surveys, has found that people tend to perceive crime as increasing although crime rates have been decreasing [
1]. However, these claims often lack a nuanced understanding of the spatial variations in perception of safety at the neighborhood level in an urban context. Researchers have begun to develop methods to analyze crime and perceptions of safety at the neighborhood level with geographic information systems (GIS) [
2,
3].
Why is perception of safety important to understand in the context of urban neighborhoods? Warr notes that fear of crime is not necessarily negative, as it can lead to increased protection and higher levels of safety for an individual or a group of people [
4]. However, when this fear grows disproportionate to the actual risk, the consequences may have serious implications for individual- and neighborhood-level vitality [
4,
5]. These consequences include increases in physical (vacant buildings, broken windows, trash, abandoned vehicles) and social (panhandling, loud neighbors) disorder that eventually leads to more serious crimes, as outlined in the well-known Broken Windows theory [
6]. In addition, it carries implications for individual- and neighborhood-level health as well as potential issues for urban planners, community-based organizations, and stakeholders interested in improving neighborhoods [
7]. The body of literature on factors of crime fear divides them into three main categories: (1) environmental cues, (2) demographic factors, and (3) neighborhood structure. Environmental theories about fear of crime point to a variety of external factors that may trigger an emotional response interpreted as fear. Physical cues such as incivilities or signs of social disorder may play a role in the way that people fear a space [
8]. This may include the presence of trash, graffiti, abandoned buildings, poor lighting, loitering, etc. Certain demographic groups may feel more vulnerable in their environment than others [
9,
10]. For example, past studies have found that while men are most likely to be victimized in crimes, their perceptions of fear are often far less than other demographic groups, especially women [
11]. Several studies have examined the role that gender plays in perceptions of safety, with mixed results [
12,
13,
14]. While two studies examining gender perceptions in the United States found that females are more fearful [
13,
14], a study from New Zealand found that fear of crime is higher in males [
12].
Neighborhood structure is also a factor in theories about influences on crime. A study has shown that a strong neighborhood structure and social cohesiveness lead to a reduced fear of crime [
15]. Studies spanning multiple disciplines have found that length of stay in a neighborhood plays a role in establishing social cohesiveness and integration [
16,
17,
18]. However, the topic remains contested as others have found this factor to be insignificant when analyzing geographies of fear [
19]. One study examined the links between the violence exposure, length of residence, and perceptions of safety in low-income neighborhoods in New Haven, Connecticut. Researchers found that new residents were more likely to feel unsafe than long-term residents [
20]. Other studies argue that the fear of crime is contextual and that residents living around crime and violence tend to have low fear, whereas residents living in low-crime areas tend to have high fear [
21]. Despite the importance that scholars have placed on understanding perceptions of safety, few studies have combined surveys and sketch mapping with GIS analysis. Curtis et al. [
2] tested visual, descriptive, and statistical methods for integrating sketch maps of fear in Los Angeles gang neighborhoods with GIS. The authors noted the importance of disaggregating data by different respondent variables in order to examine the spatial variability that may be influenced by these factors. To ask people about their geographies of fear, researchers used terms such as “unsafe” [
22,
23,
24], “comfort” [
24], and avoidance mapping [
9,
25].
The number of studies that used GIS and spatial analysis to compare the fear of crime with recorded crime data is still quite limited. Lopez and Lukinbeal [
26] used a method of aggregating polygons to grid cells about the size of a block in order to compare police perceptions of high crime areas to resident perceptions of safety in Phoenix, Arizona. The authors found police perception more heavily influenced by reported crimes, whereas residents perceived crime in areas where no crime was reported. A study of crime statistics and fear of crime on a university campus in Texas aggregated point data to grid cells and found that fear of crime aligned with burglary and theft occurrences, but was exaggerated for sexual assault and harassment [
27]. Another study used semi-transparency and spatial overlay in GIS to conduct a visual assessment of the degree of overlap between different types of crime and areas of “collective avoidance” in an Australian city [
25]. Research conducted in the city of Ostrava (Czech Republic) used an online map-based questionnaire with 1551 respondents to compare perceived crime hotspots and recorded crime hotspots [
28]. They employed Local Moran’s I statistic to identify clusters of perceived and recorded crimes and overlaid them on a map. Another study conducted in two neighborhoods in the City of Tshwane (South Africa) used interviews, focus groups, and crime hotspot mapping and found that most people were not fearful of crime but often avoided parks and other open spaces, although the crime level there may not have been necessarily high [
29].
This paper aims to contribute to this body of literature and proposes a methodology for analyzing maps of reported crime and perception of safety, which is useful to practitioners positioned to design interventions to improve neighborhood quality of life. Specifically, this paper aims to answer two questions: (1) Are there differences in crime perception by gender and length of residency in the neighborhood? and (2) What differences exist in spatial pattern of recorded crime and safety perception in the community? To address these questions, the next section describes the study area and data, followed by the explanation of methods and results. The paper concludes with a discussion of results in the context of previous studies and their implications for future research and policy.
2. Materials and Methods
The study area, only 1.4 km
2, extends through one of the most densely populated residential sections of the city. The main land-use types in the area are multi-family residential, commercial (small shops and eateries), and recreational (University Park). The area also includes Clark University and four schools. The majority of residents are Latino and African American, and the neighborhood’s poverty rate is more than double that of the city as a whole. In 2010, the total population of the area was 3841 [
30].
This neighborhood was known to be a persistent violent crime hotspot. The project area contained less than 3% of the city’s population, but represented almost 17% of all reported incidents and 24% of all arrests (Worcester Police Department (WPD) Crime Analysis Unit). The high incidence of criminal activity instilled a sense of fear among residents resulting in physical and social isolation and disengagement from community life. These factors prompted the Main South Community Development Corporation and its partners (Clark University, the Boys & Girls Club of Worcester, and the Worcester Police Department) to pursue a grant from the Bureau of Justice Assistance, the policy development arm of the U.S. Department of Justice [
31,
32].
2.1. Police-Reported Crime
The Worcester Police Department provided data on reported crime for September 2014 through May 2017, corresponding with the planning and implementation phases of the Byrne Criminal Justice Innovation (BCJI) project. Records included information on type of crime, descriptive information on each person involved in the incident, date and time, and addresses for each incident. For the analysis, we included only violent crimes (robbery, aggravated assault, murders, and gunshots) and social disorder crimes (destruction/damage, vandalism of property, drug/narcotic violation, drug equipment violation, prostitution, disorderly conduct, and trespass of real property) where there was either a victim or an arrest. Each reported crime was mapped using the Worcester Address Locator, which has an accuracy of about 90% at matching addresses with spatial locations in GIS. The remaining 10% of addresses were manually verified and mapped. In total, there were 7831 social disorder crimes and 3608 violent crimes reported and mapped for the whole city of Worcester for the period of this study. Of those citywide numbers, 594 social disorder crimes and 267 violent crimes reported were located within the study area.
2.2. Perception of Unsafe Areas
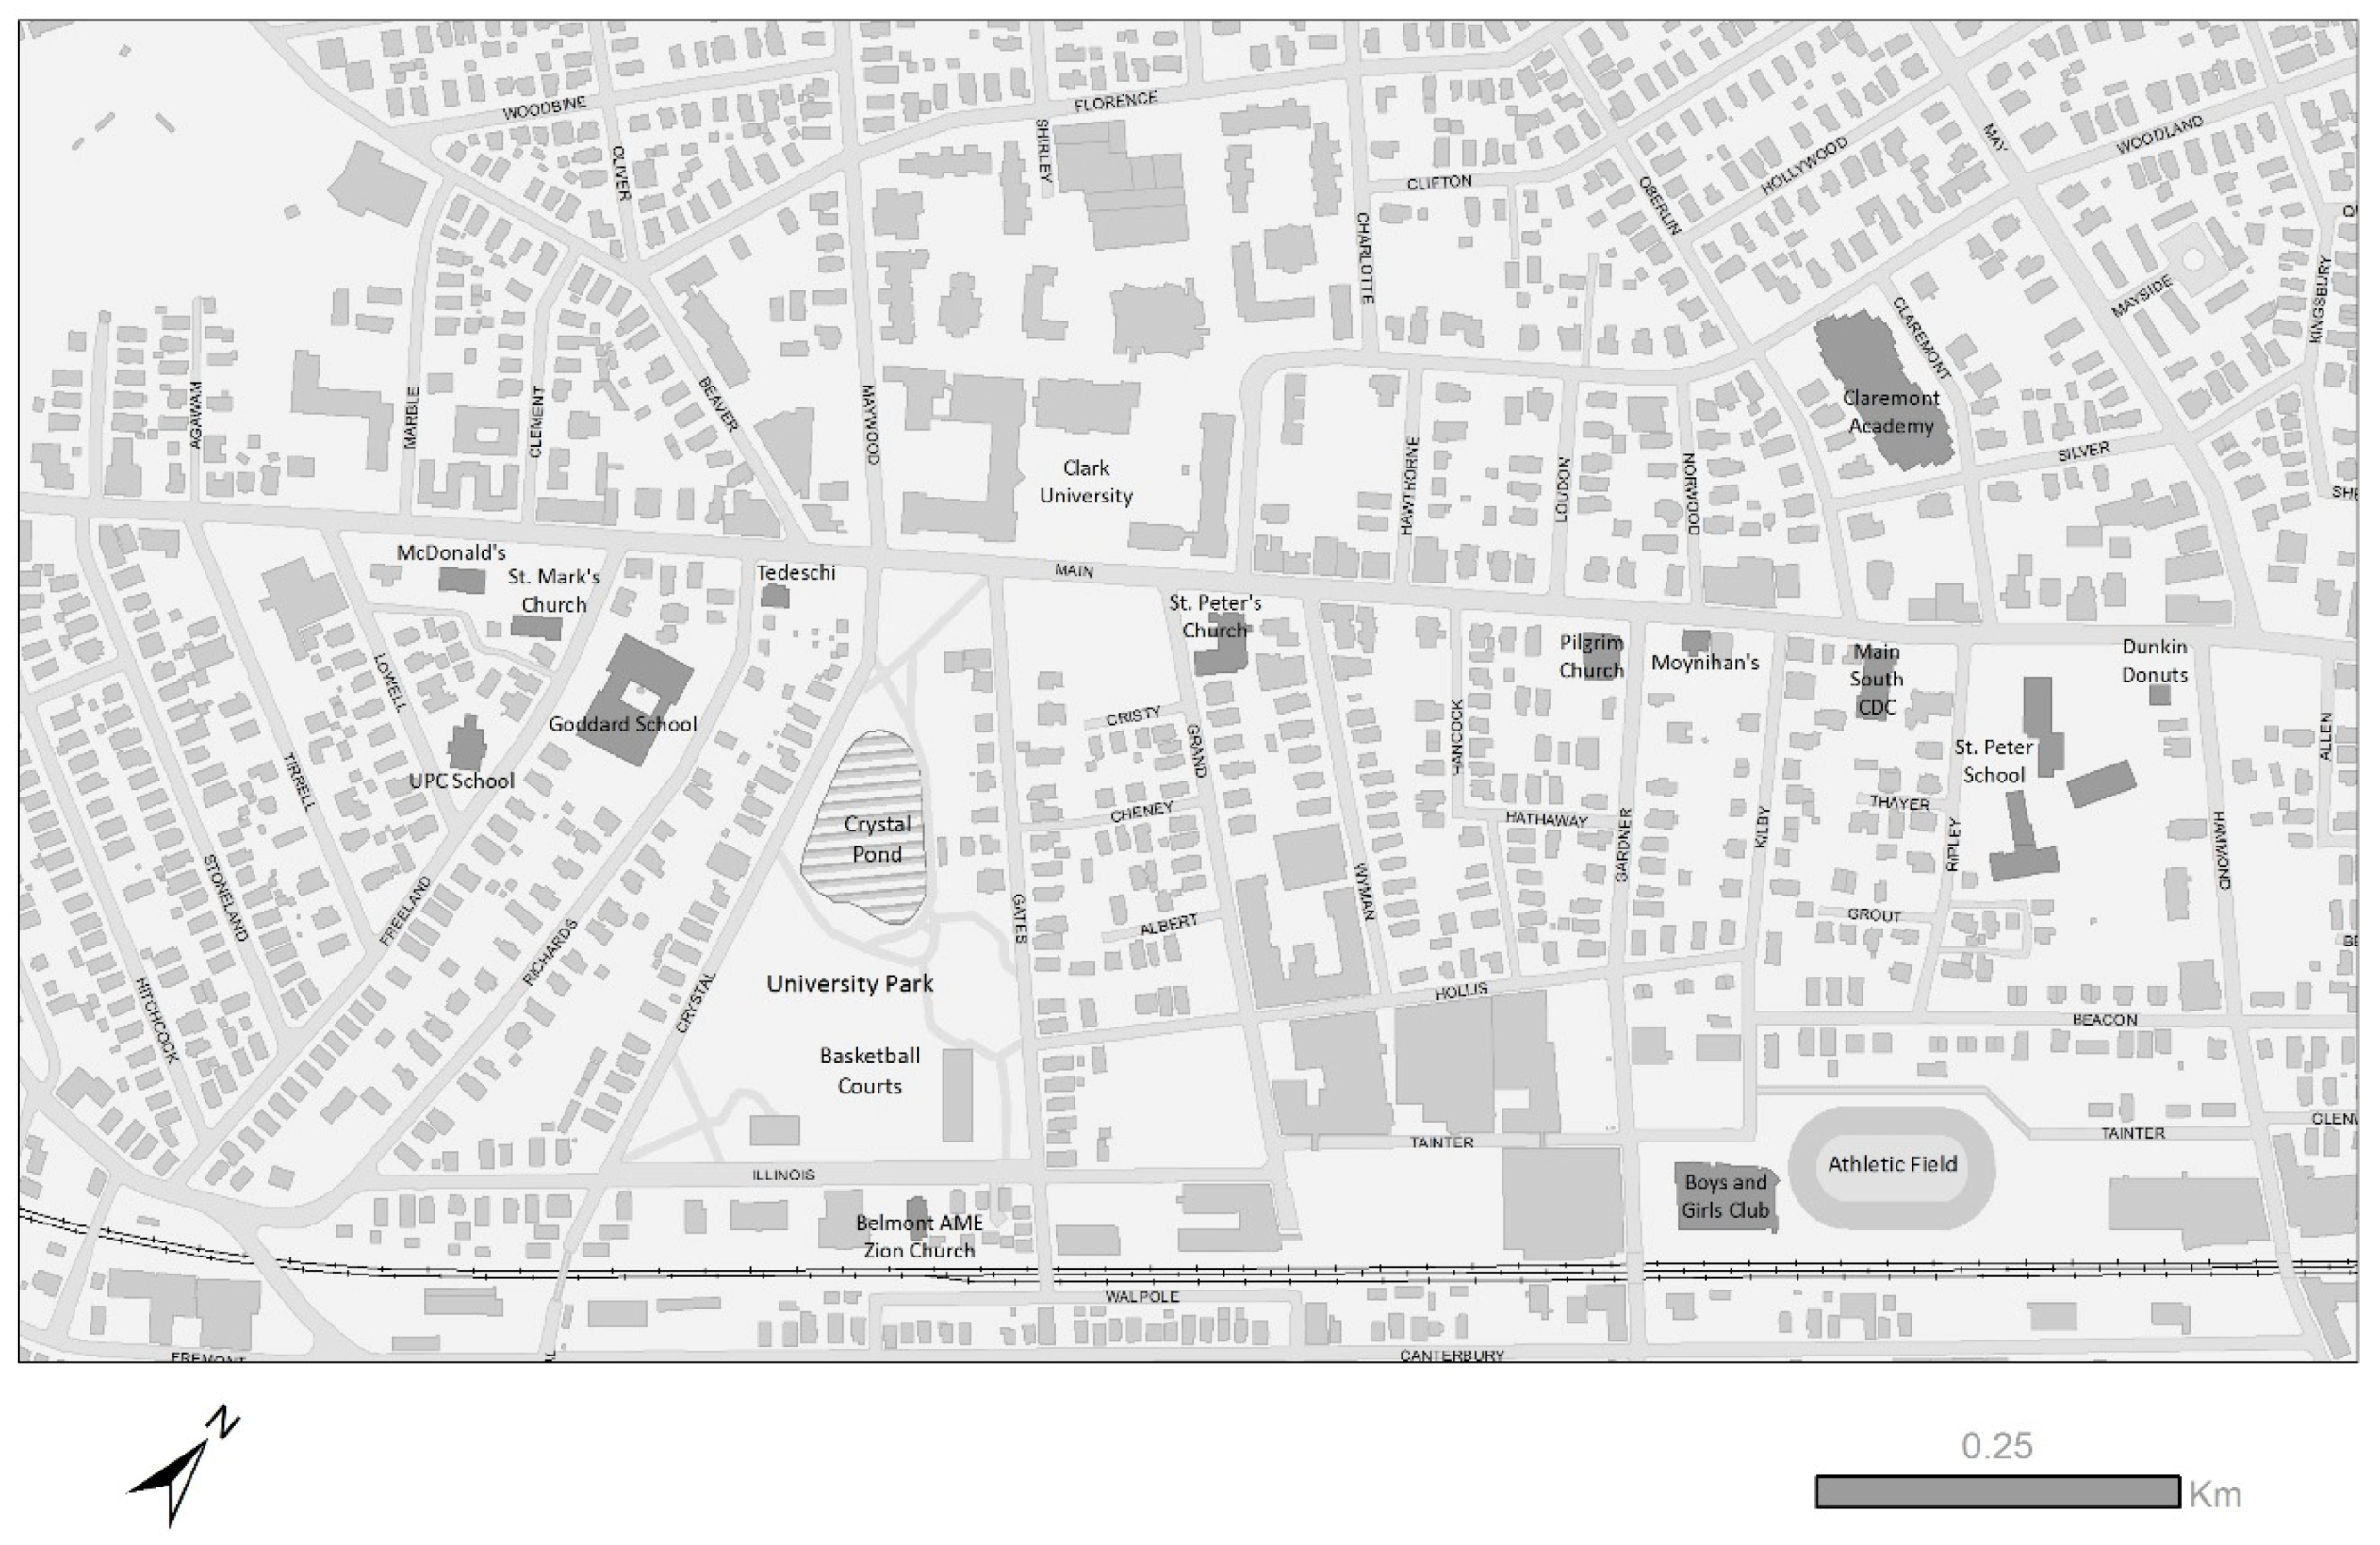
As a part of the BCJI project, we created a survey to collect both quantitative and qualitative information from residents about their perceptions of the neighborhood. Our original design was to conduct door-to-door surveys and attempt sampling across the entire target area. We supplemented the door-to-door approach with attending events and meetings at local churches, schools, and Boys & Girls Club. We periodically reviewed the geographic coverage of surveys and conducted additional household surveys in areas without many surveys. The survey was available in English, Spanish, and Vietnamese in order to capture a more representative sample of the population. As part of the survey, we asked respondents to mark areas where they felt unsafe on a sketch map that encompassed the project area, as well as a buffer zone of approximately 2000 feet around it. We also asked the respondents to explain why they felt unsafe in these areas. The maps included streets with labels, buildings, and local landmarks (
Figure 1). During spring 2015 and fall 2017, we collected 118 surveys from adult residents (over 18 years old). Racial/ethnic and age distribution of the respondents approximates demographic characteristics of the population in this neighborhood. Respondents’ age ranged from 19 to 81, with a mean age of 41, and 80% of them were non-white. All respondents indicated their gender, but four did not respond to the question about length of residency in the neighborhood.
Table 1 summarizes information about survey respondents.
2.3. Methods
In order to compare reported crimes (point data) and perceptions of unsafe areas (polygons), we aggregated data to grid cells. First, we produced a crime density map showing crime intensity as a continuous surface. This method is useful because many of the points overlap, as multiple incidences sometimes occurred at the same location. Crime density was calculated using the Kernel Density tool in ArcGIS 10.7 (ESRI, Redlands, CA, USA) which is a widely used tool for crime mapping [
33,
34,
35].
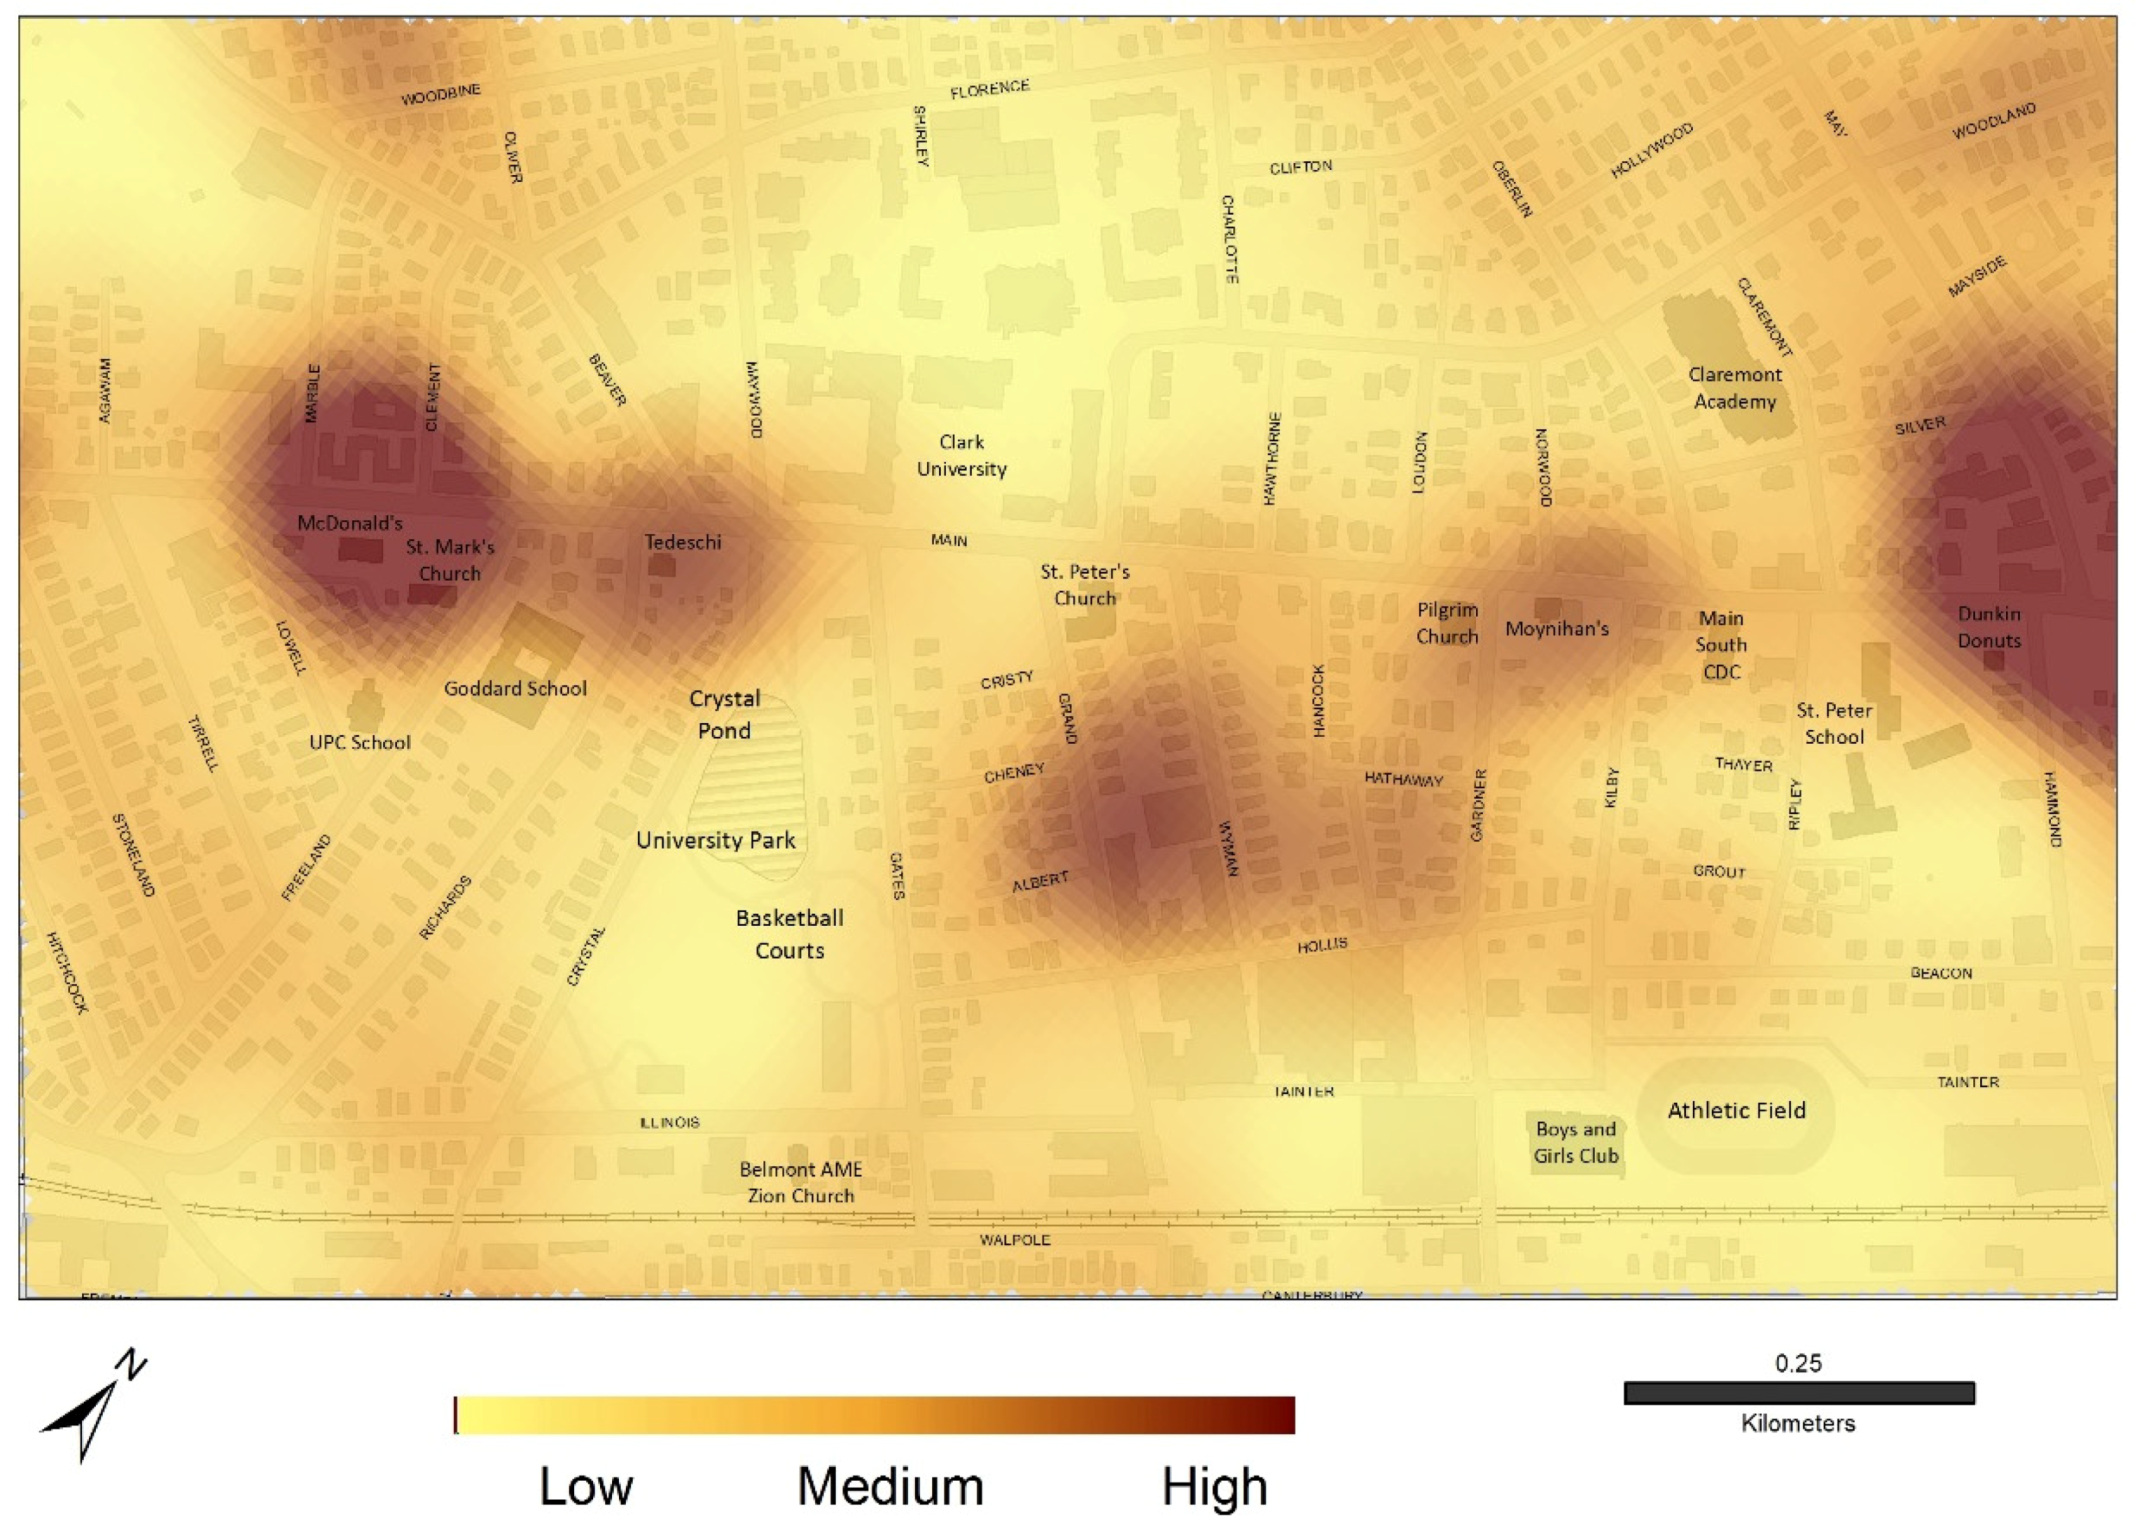
The tool calculates the density of points by fitting a smoothly curved surface around each individual point of crime. The value of this surface is highest at the location of the point and decreases as the distance from the point reaches the extent of the search radius chosen. The density at each cell is calculated by adding the values of the kernel surfaces that overlay the cell. For our analysis, we used a small cell size (10 × 10 m) and search radius of 150 m. Other studies of crime and fear of crime used a similarly small search radius in kernel density calculations in Wollongong, Australia [
9,
25] and Delaware [
36]. A small cell size and search radius display more detailed and localized crime density areas [
33]. Visually, this shows places on the map with a darker color as having a higher intensity of crime and lighter colors representing a lower intensity of crime (see
Figure 2).
As a second step, we digitized paper sketch maps and represented unsafe areas as polygons. We created one composite perception map, which combined all sketch maps, and a series of thematic perception maps—based on gender (male or female) and the length of residency in the neighborhood (less than 4 years; 4–10 years; more than 10 years). We then aggregated polygons in these maps into 10 × 10 m grids, with the value of each grid cell corresponding to the number of times an unsafe area intersected it. We chose 10 × 10 m grids to minimize the loss of fine-scale details of the sketch maps [
25] and to maintain consistency with the crime density map. Each pixel in the aggregated grid showed the number of times a location was marked as unsafe by survey respondents.
Since the number of respondents varied between groups (
Table 1), we normalized these aggregated grids by dividing the value of each pixel by the sum of all values in the grid and multiplying the result by 100. The normalized pixel values allowed comparisons among different respondent groups. We chose to normalize by the sum of all values in the grid, and not by the number of respondents in each subgroup, because many respondents marked more than one unsafe location on the map. In order to compare crime intensity to perception of safety, we reclassified the crime density map and each perception map into three categories—low, medium, and high (
Figure S1, Supplementary Materials). In a recent study of crime and crime perception on a university campus [
27], researchers also reclassified crime perception maps into three categories using a quantile classification method. In our study, we used the equal interval classification method, because it divided the entire range of values into three equal-sized categories that were easy to interpret.
We then intersected the reclassified crime density map with each reclassified perception map. There were nine possible combinations of categories on these intersected maps (
Table 2). To quantify the results, we calculated percent of the study area falling into each of the nine categories on each map.
3. Results
To answer the first research question (Are there differences in safety perception by gender and length of residency in the neighborhood?), we visually compared a series of perception maps. First, we combined all sketch maps and created a composite safety perception map. This map shows certain areas as unsafe, including the University Park, the whole length of Main Street within the study area, and Kilby Street. The highest number of respondents marked a segment of Main Street adjacent to Clark University and the central part of the University Park (immediately south of the Crystal Pond) as unsafe on sketch maps (
Figure 3a).
Two male and female perception maps show similar patterns overall (
Figure 3b,c), but when they are reclassified into three categories, subtle differences between them begin to emerge—for example, male respondents marked a larger area within University Park as “high crime” than did female respondents. Furthermore, Kilby Street fell into the “medium crime” category on male maps, whereas it was classified as “low crime” on female maps. It is possible that males have stronger fear of that street because it is associated with the Kilby Street gang. (
Figure S1c,d, Supplementary Materials).
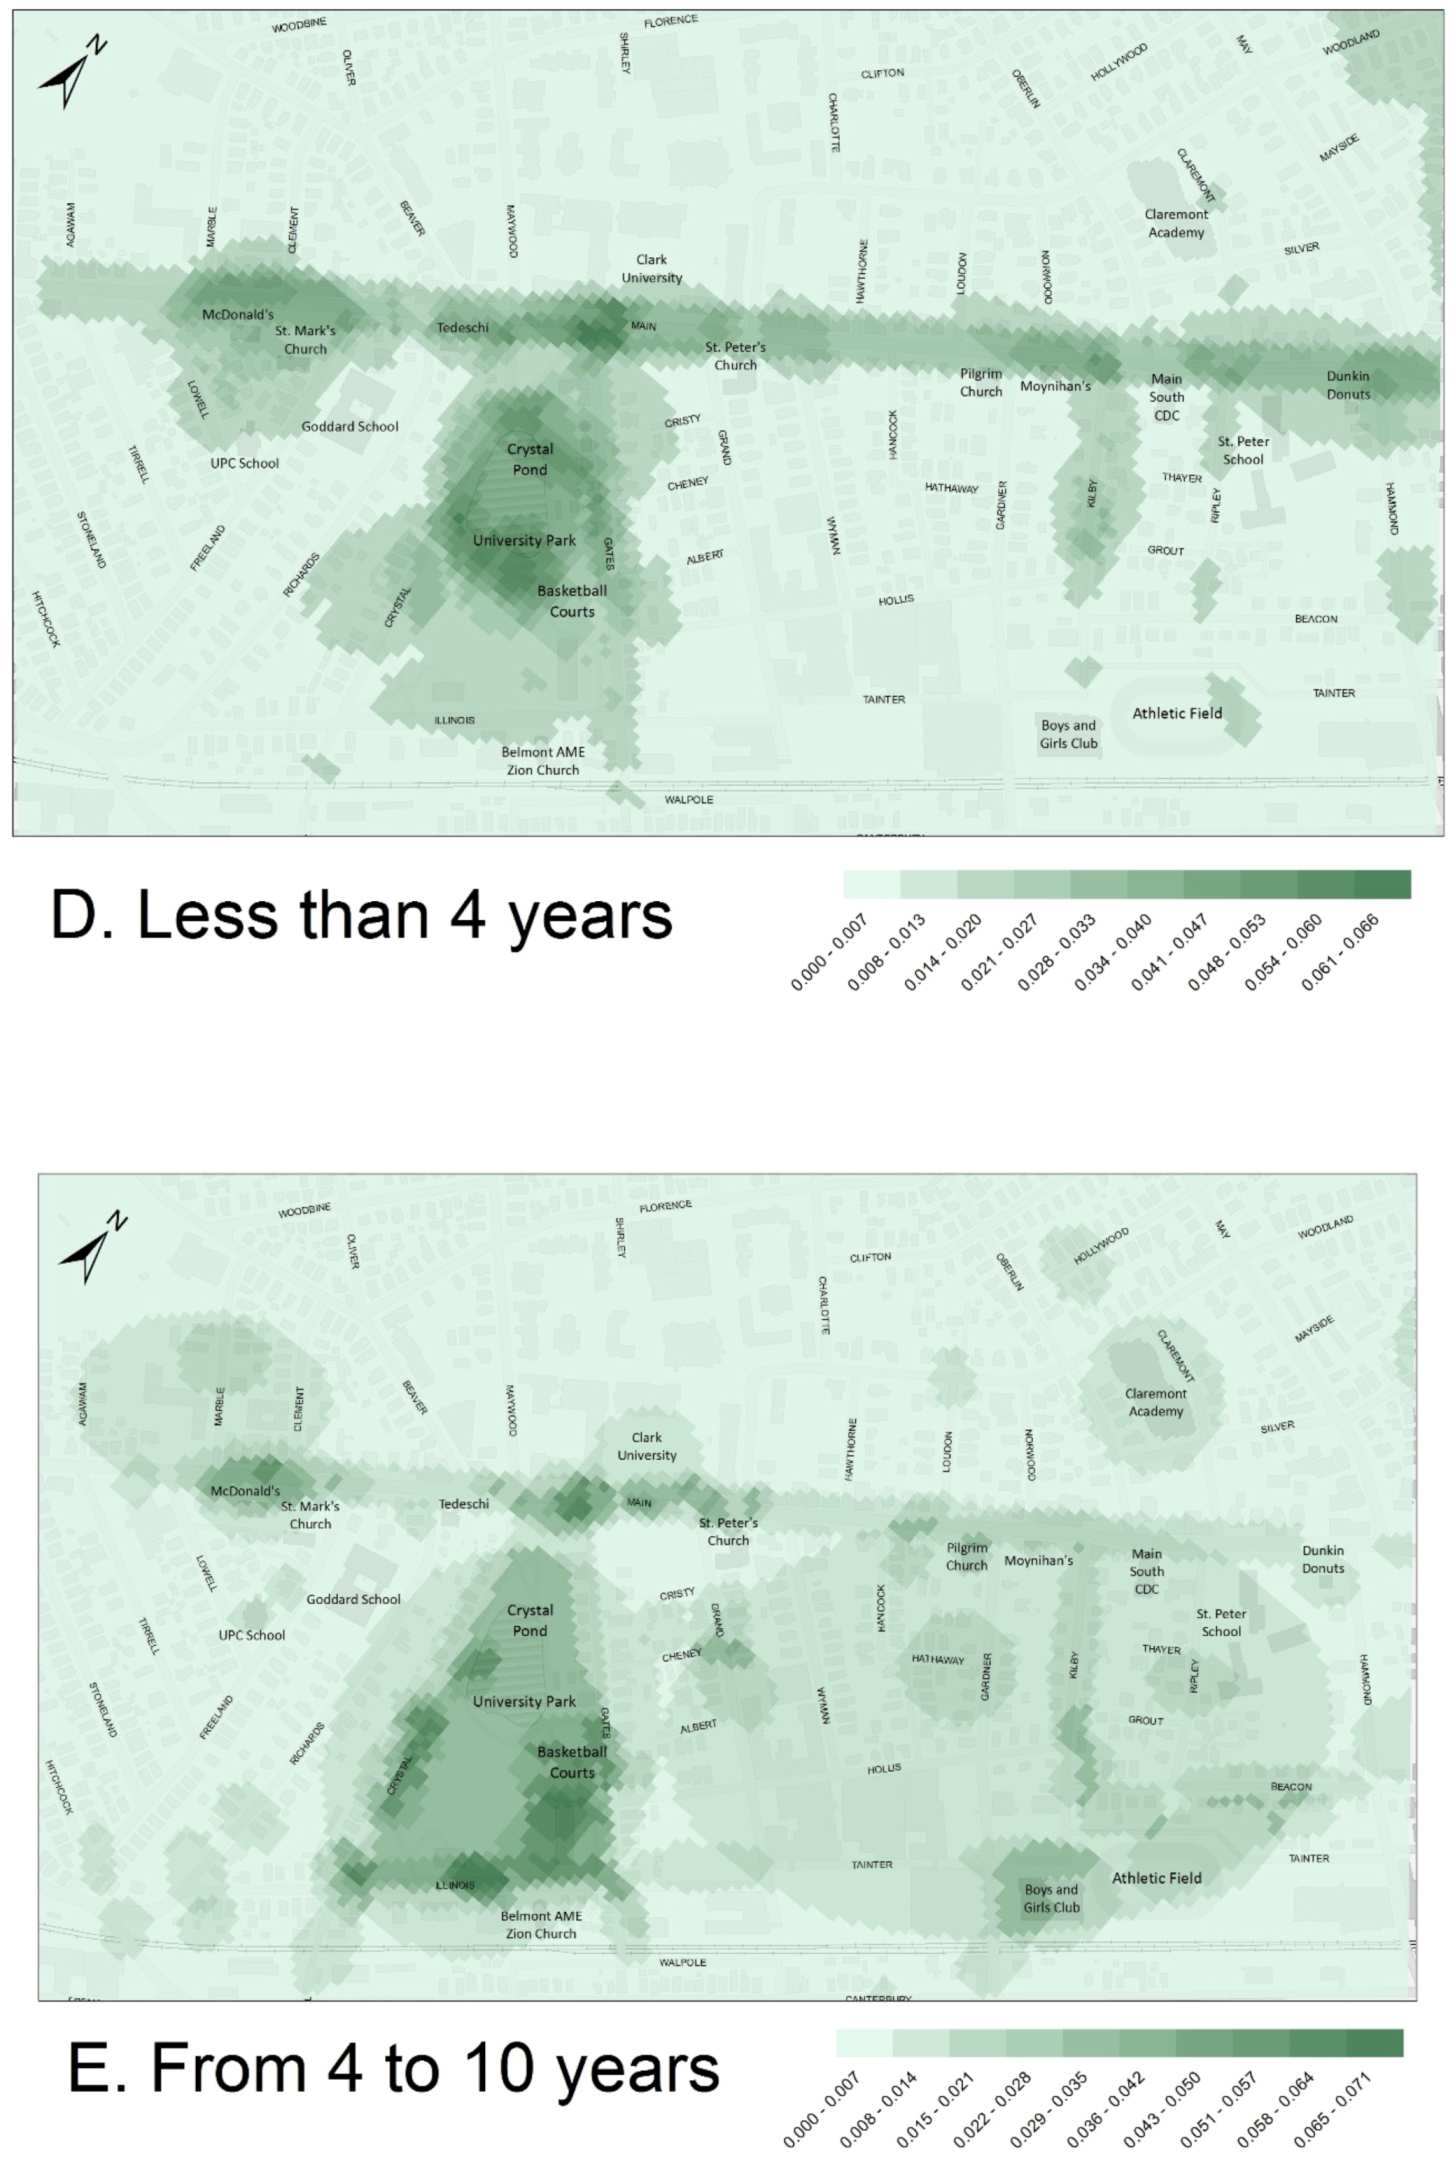
When perceptions are mapped based on length of residency in the neighborhood, different patterns emerge. For example, residents who have been in the area less than four years marked more areas as unsafe compared to residents who have lived there longer. The “less than 4 years” map shows the entire Main Street and the entire University Park as medium or highly unsafe (
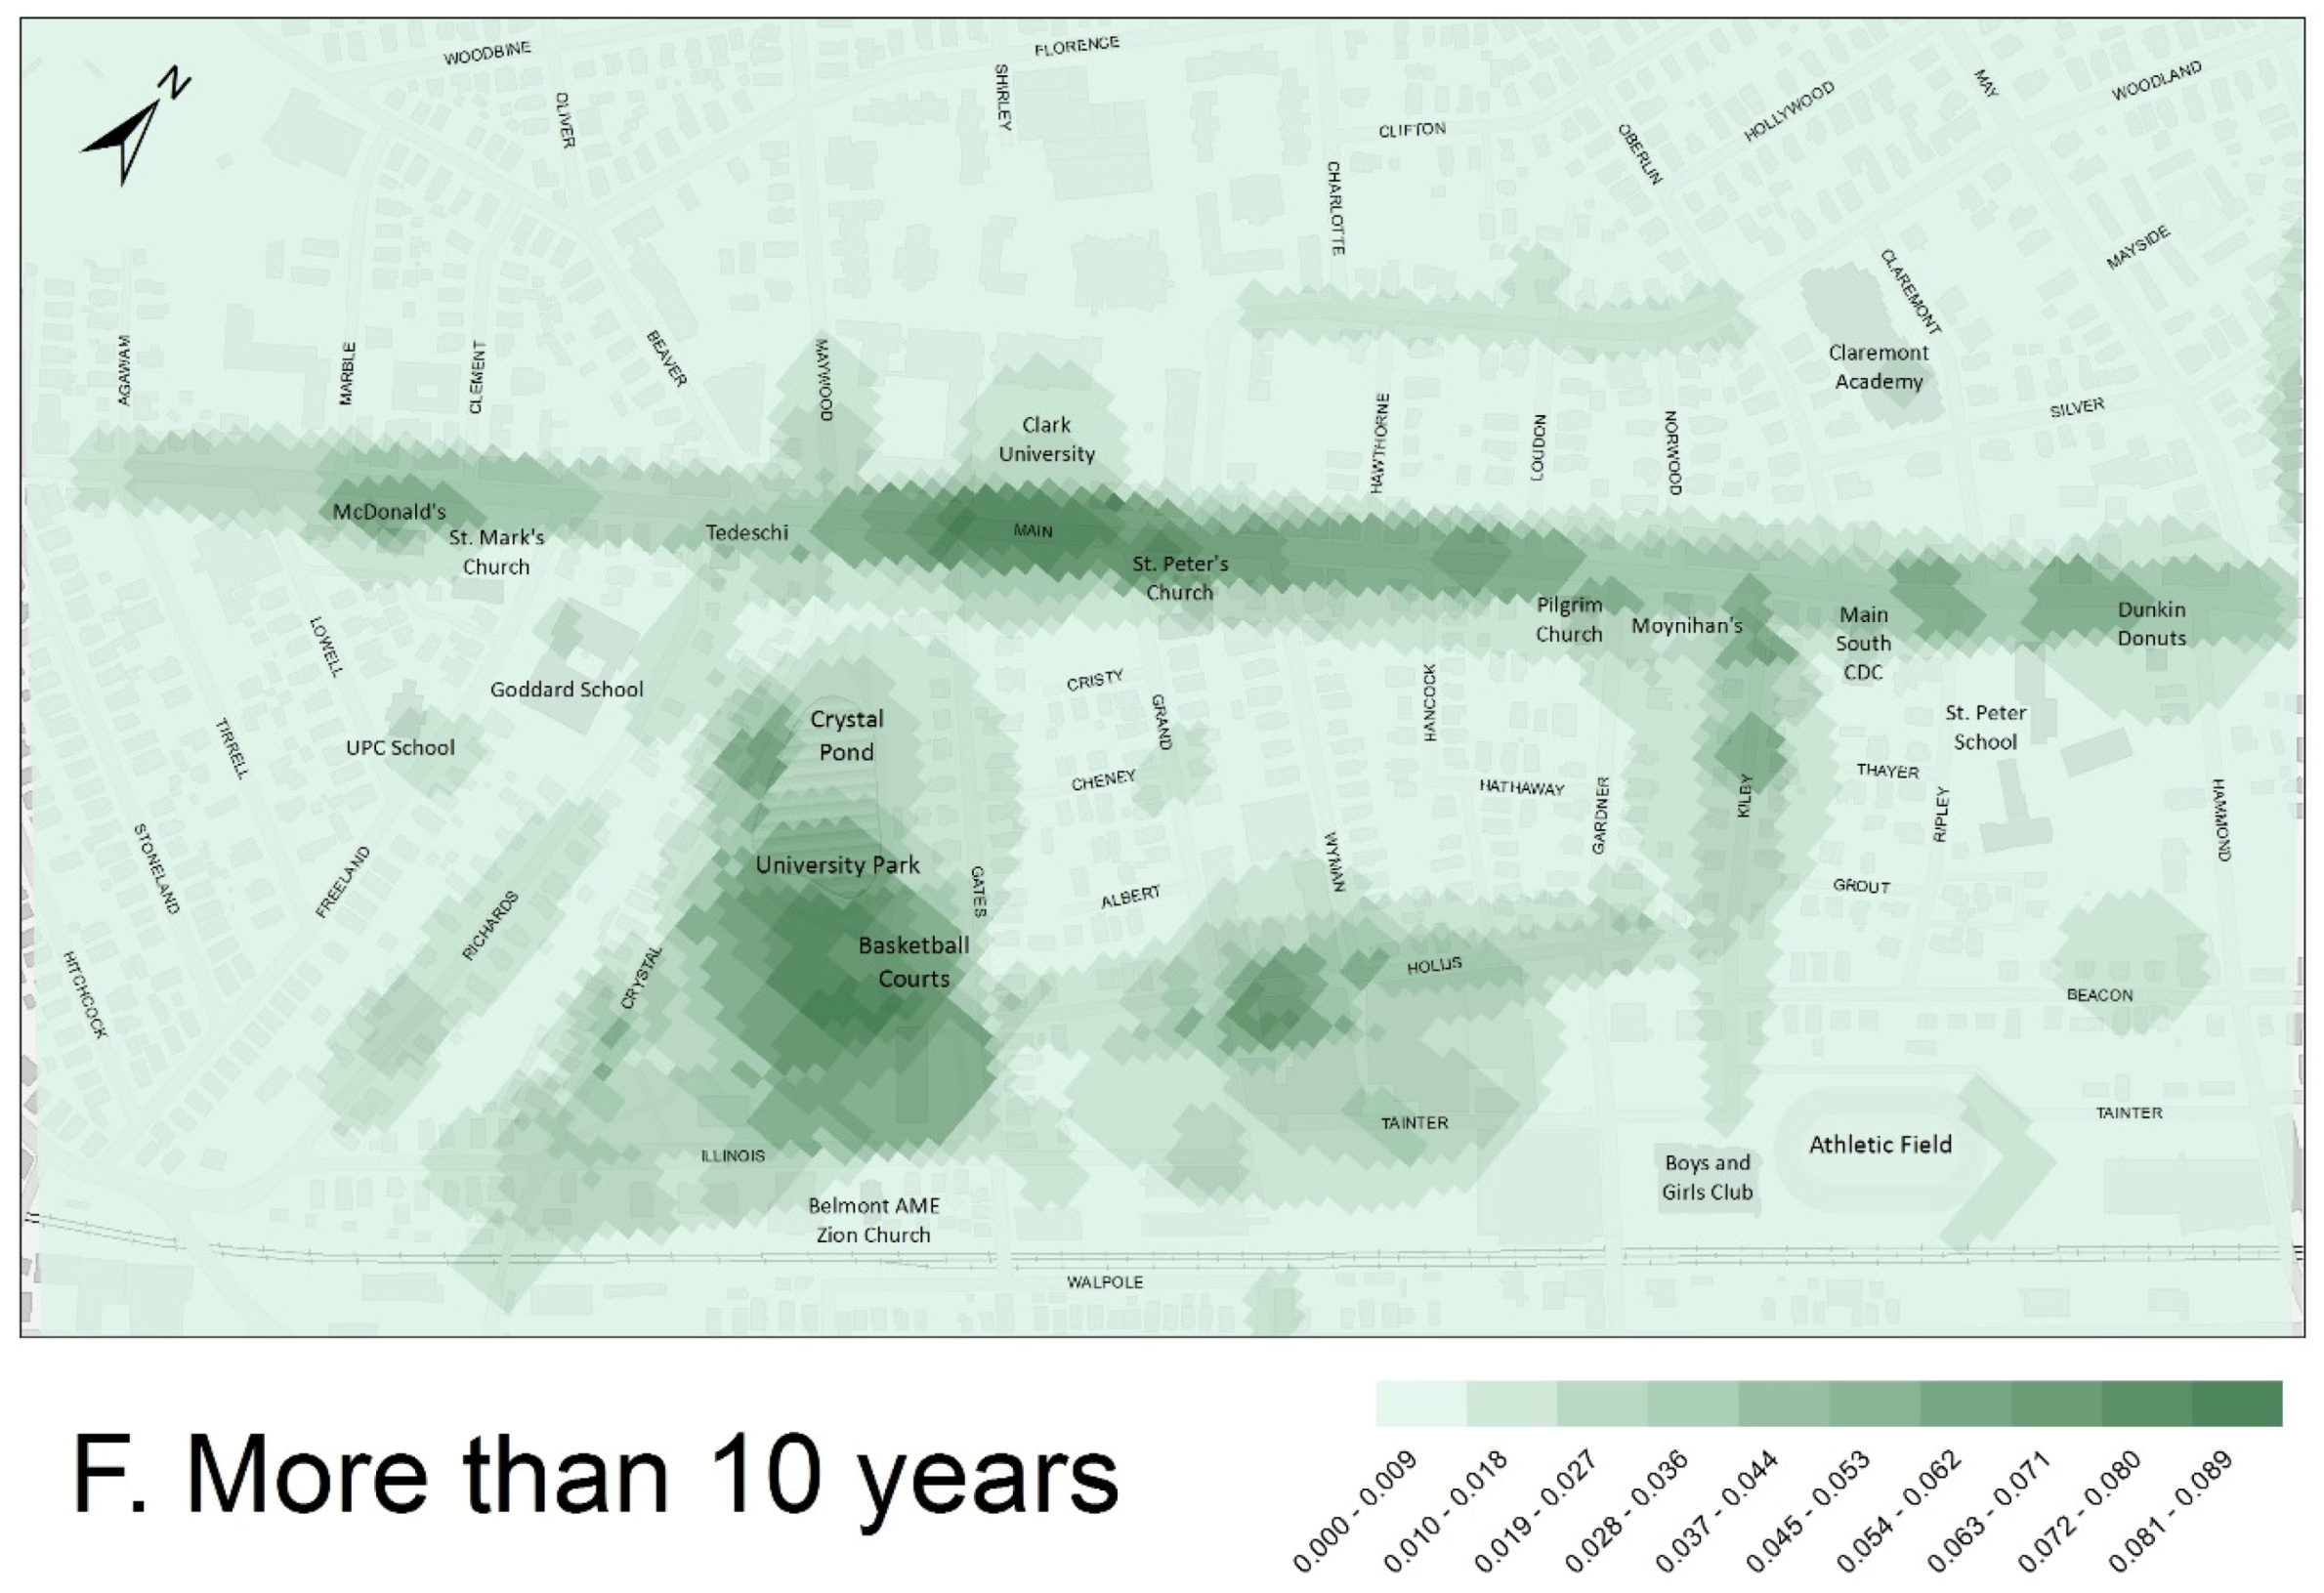
Figure S1e, Supplementary Materials). It is interesting to note that the residents who lived 4–10 years in the area marked fewer unsafe areas on their sketch maps, than the people who lived there 10+ years (
Figure S1f,g, Supplementary Materials).
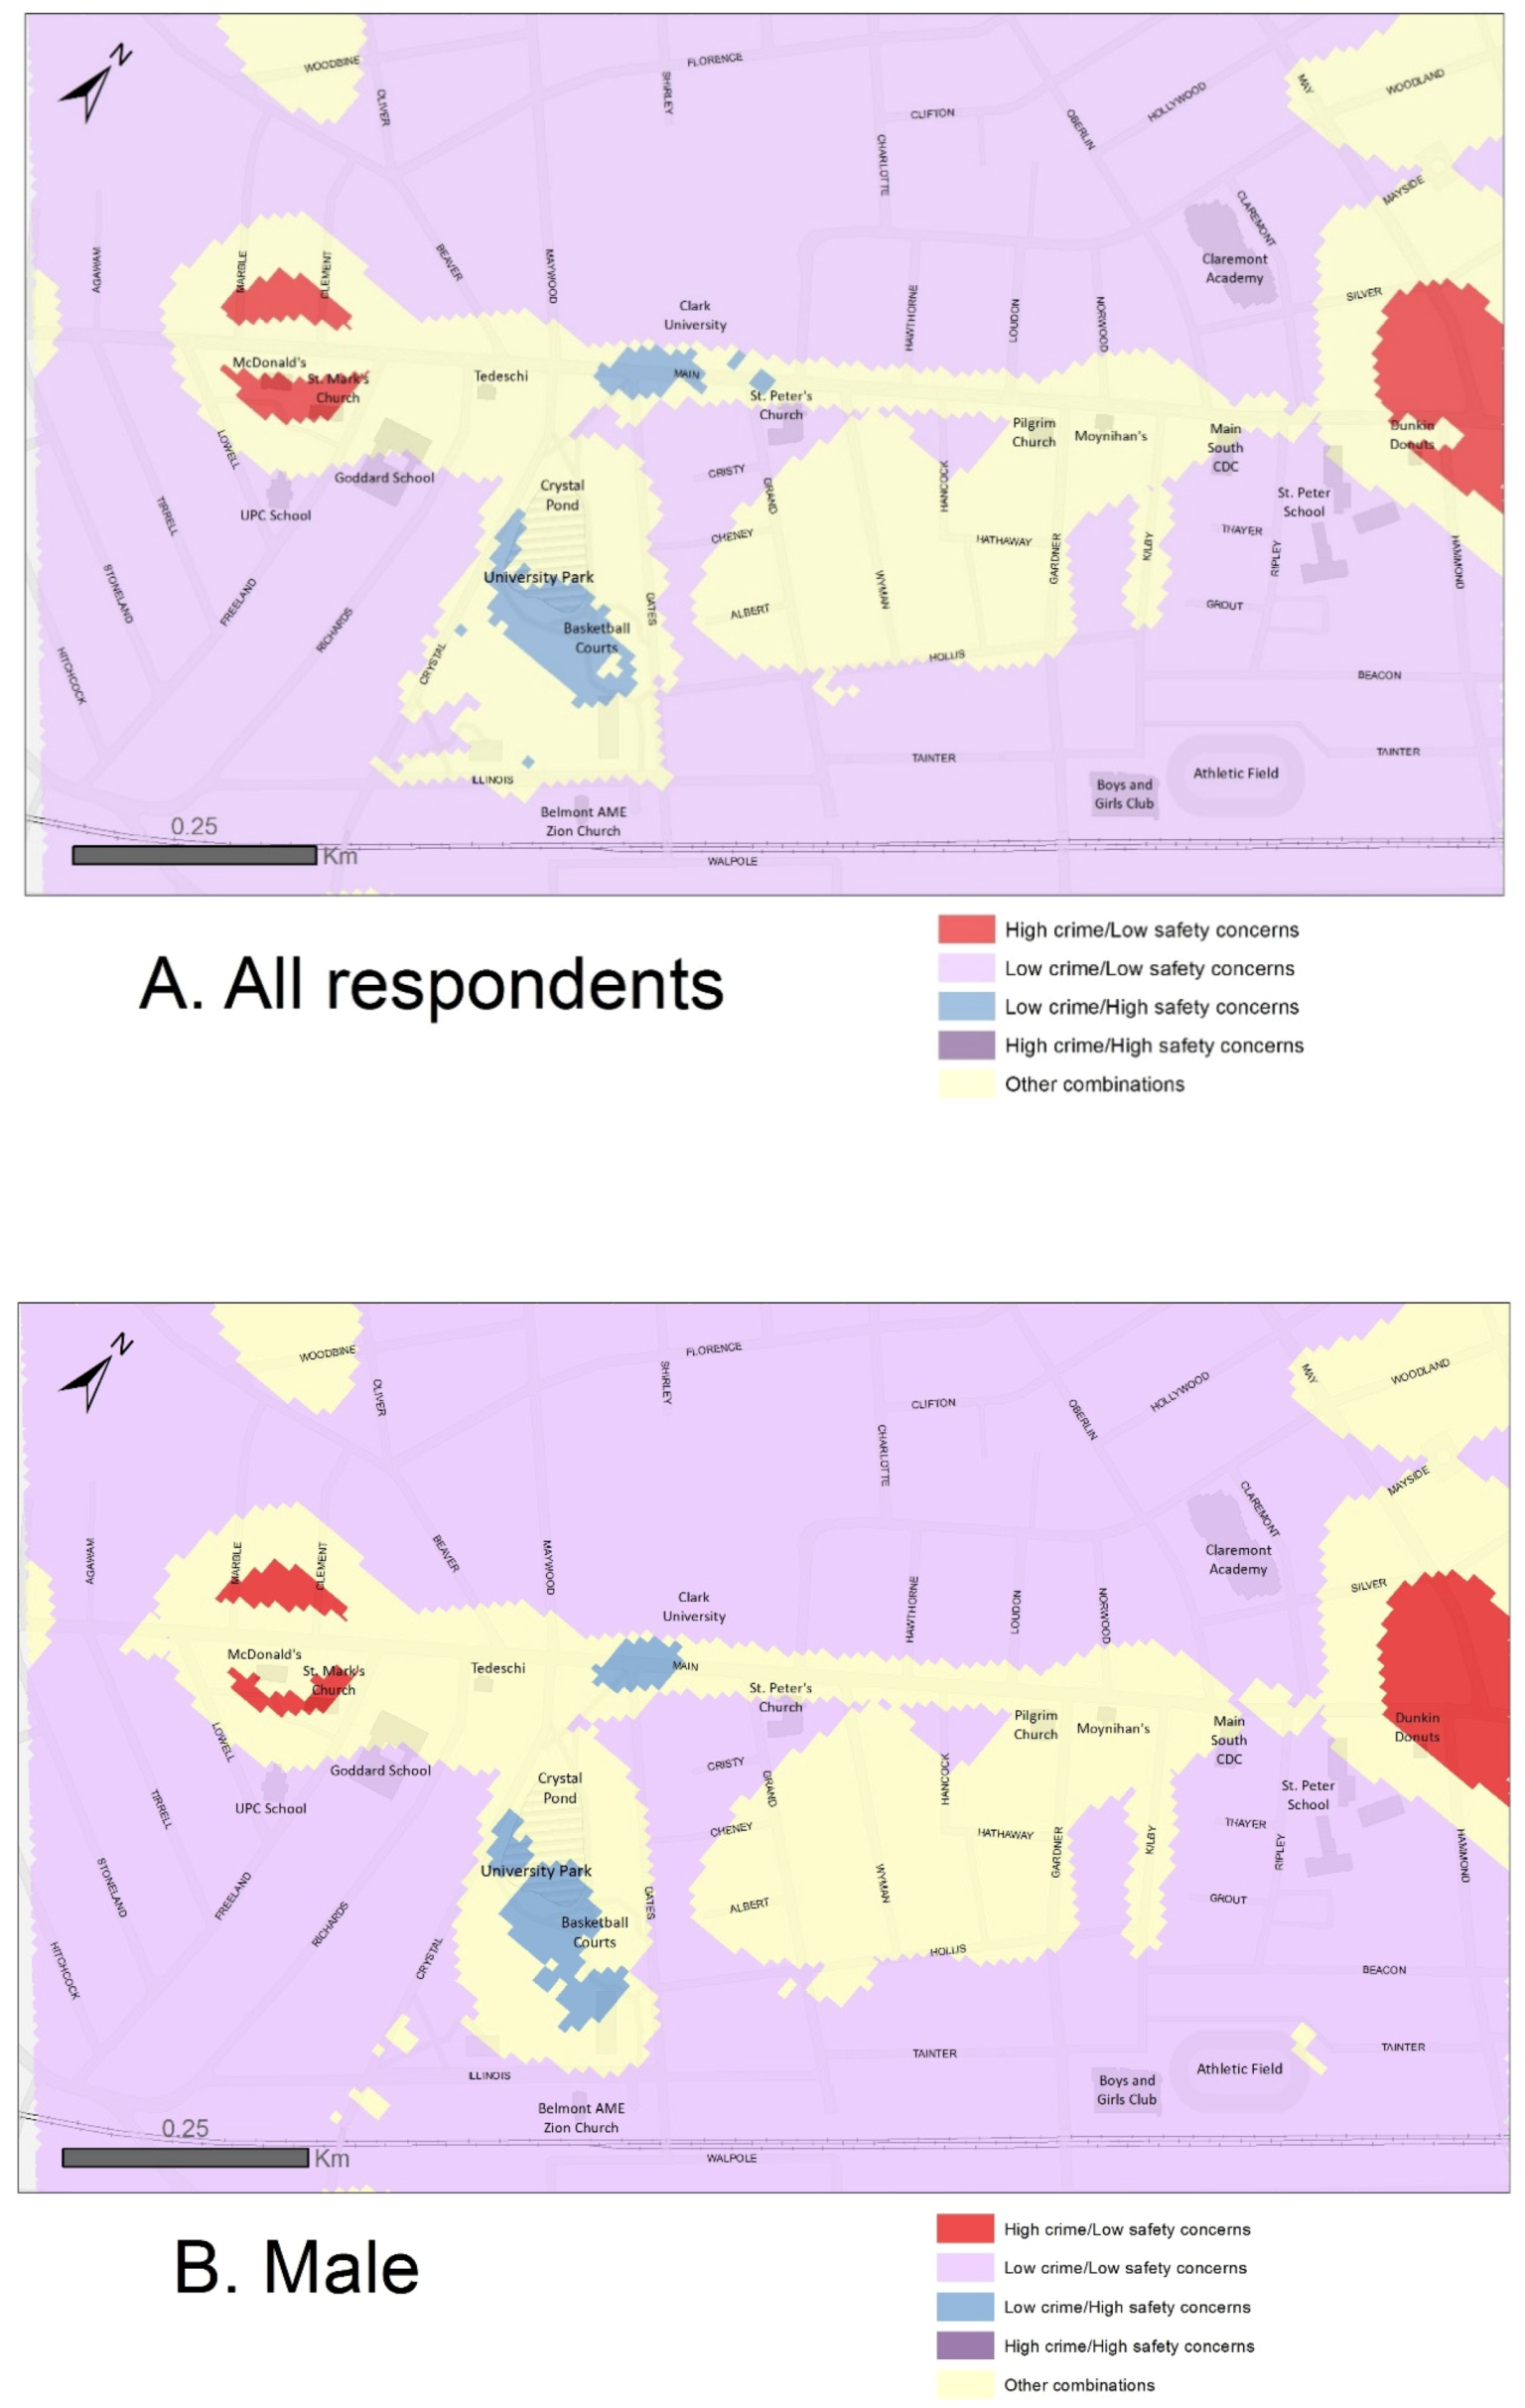
To answer the second question (What differences exist in spatial pattern of recorded crime and safety perception in the community?), we overlaid each perception map with the crime density map, to show combinations of crime level and perceived safety level. To simplify visual analysis of maps and to highlight the intersection between low and high categories of recorded crime and safety perception, we displayed five combinations that included a medium category (ML, MM, MH, LM, HM) as one color (yellow) on the map. We also calculated percent of study area in these overlay categories for each map (
Table 3).
On all overlay maps, the majority of the study area falls into the “low crime/low safety concerns” category (between 71% and 76%). The other three categories of interest occupy a much smaller area on the maps, and some maps do not show all categories. For example, “high crime/high safety concerns” is only present on less than 4 years of residency maps. Below, we discuss categories on overlay maps in more detail.
When all surveys are overlaid with the crime density map, two large areas of “mismatch” between the recorded crime and safety perception appear—one on the western side, near McDonald’s, and the other near the eastern edge of the study area near Dunkin Donuts (
Figure 4a). Residents did not perceive these two areas of the highest crime density as unsafe. The opposite pattern presents in the University Park and on Main Street near Clark University; in these areas, the perception of being unsafe is high but recorded crime level is low.
Overlay maps for male and female respondents are similar (
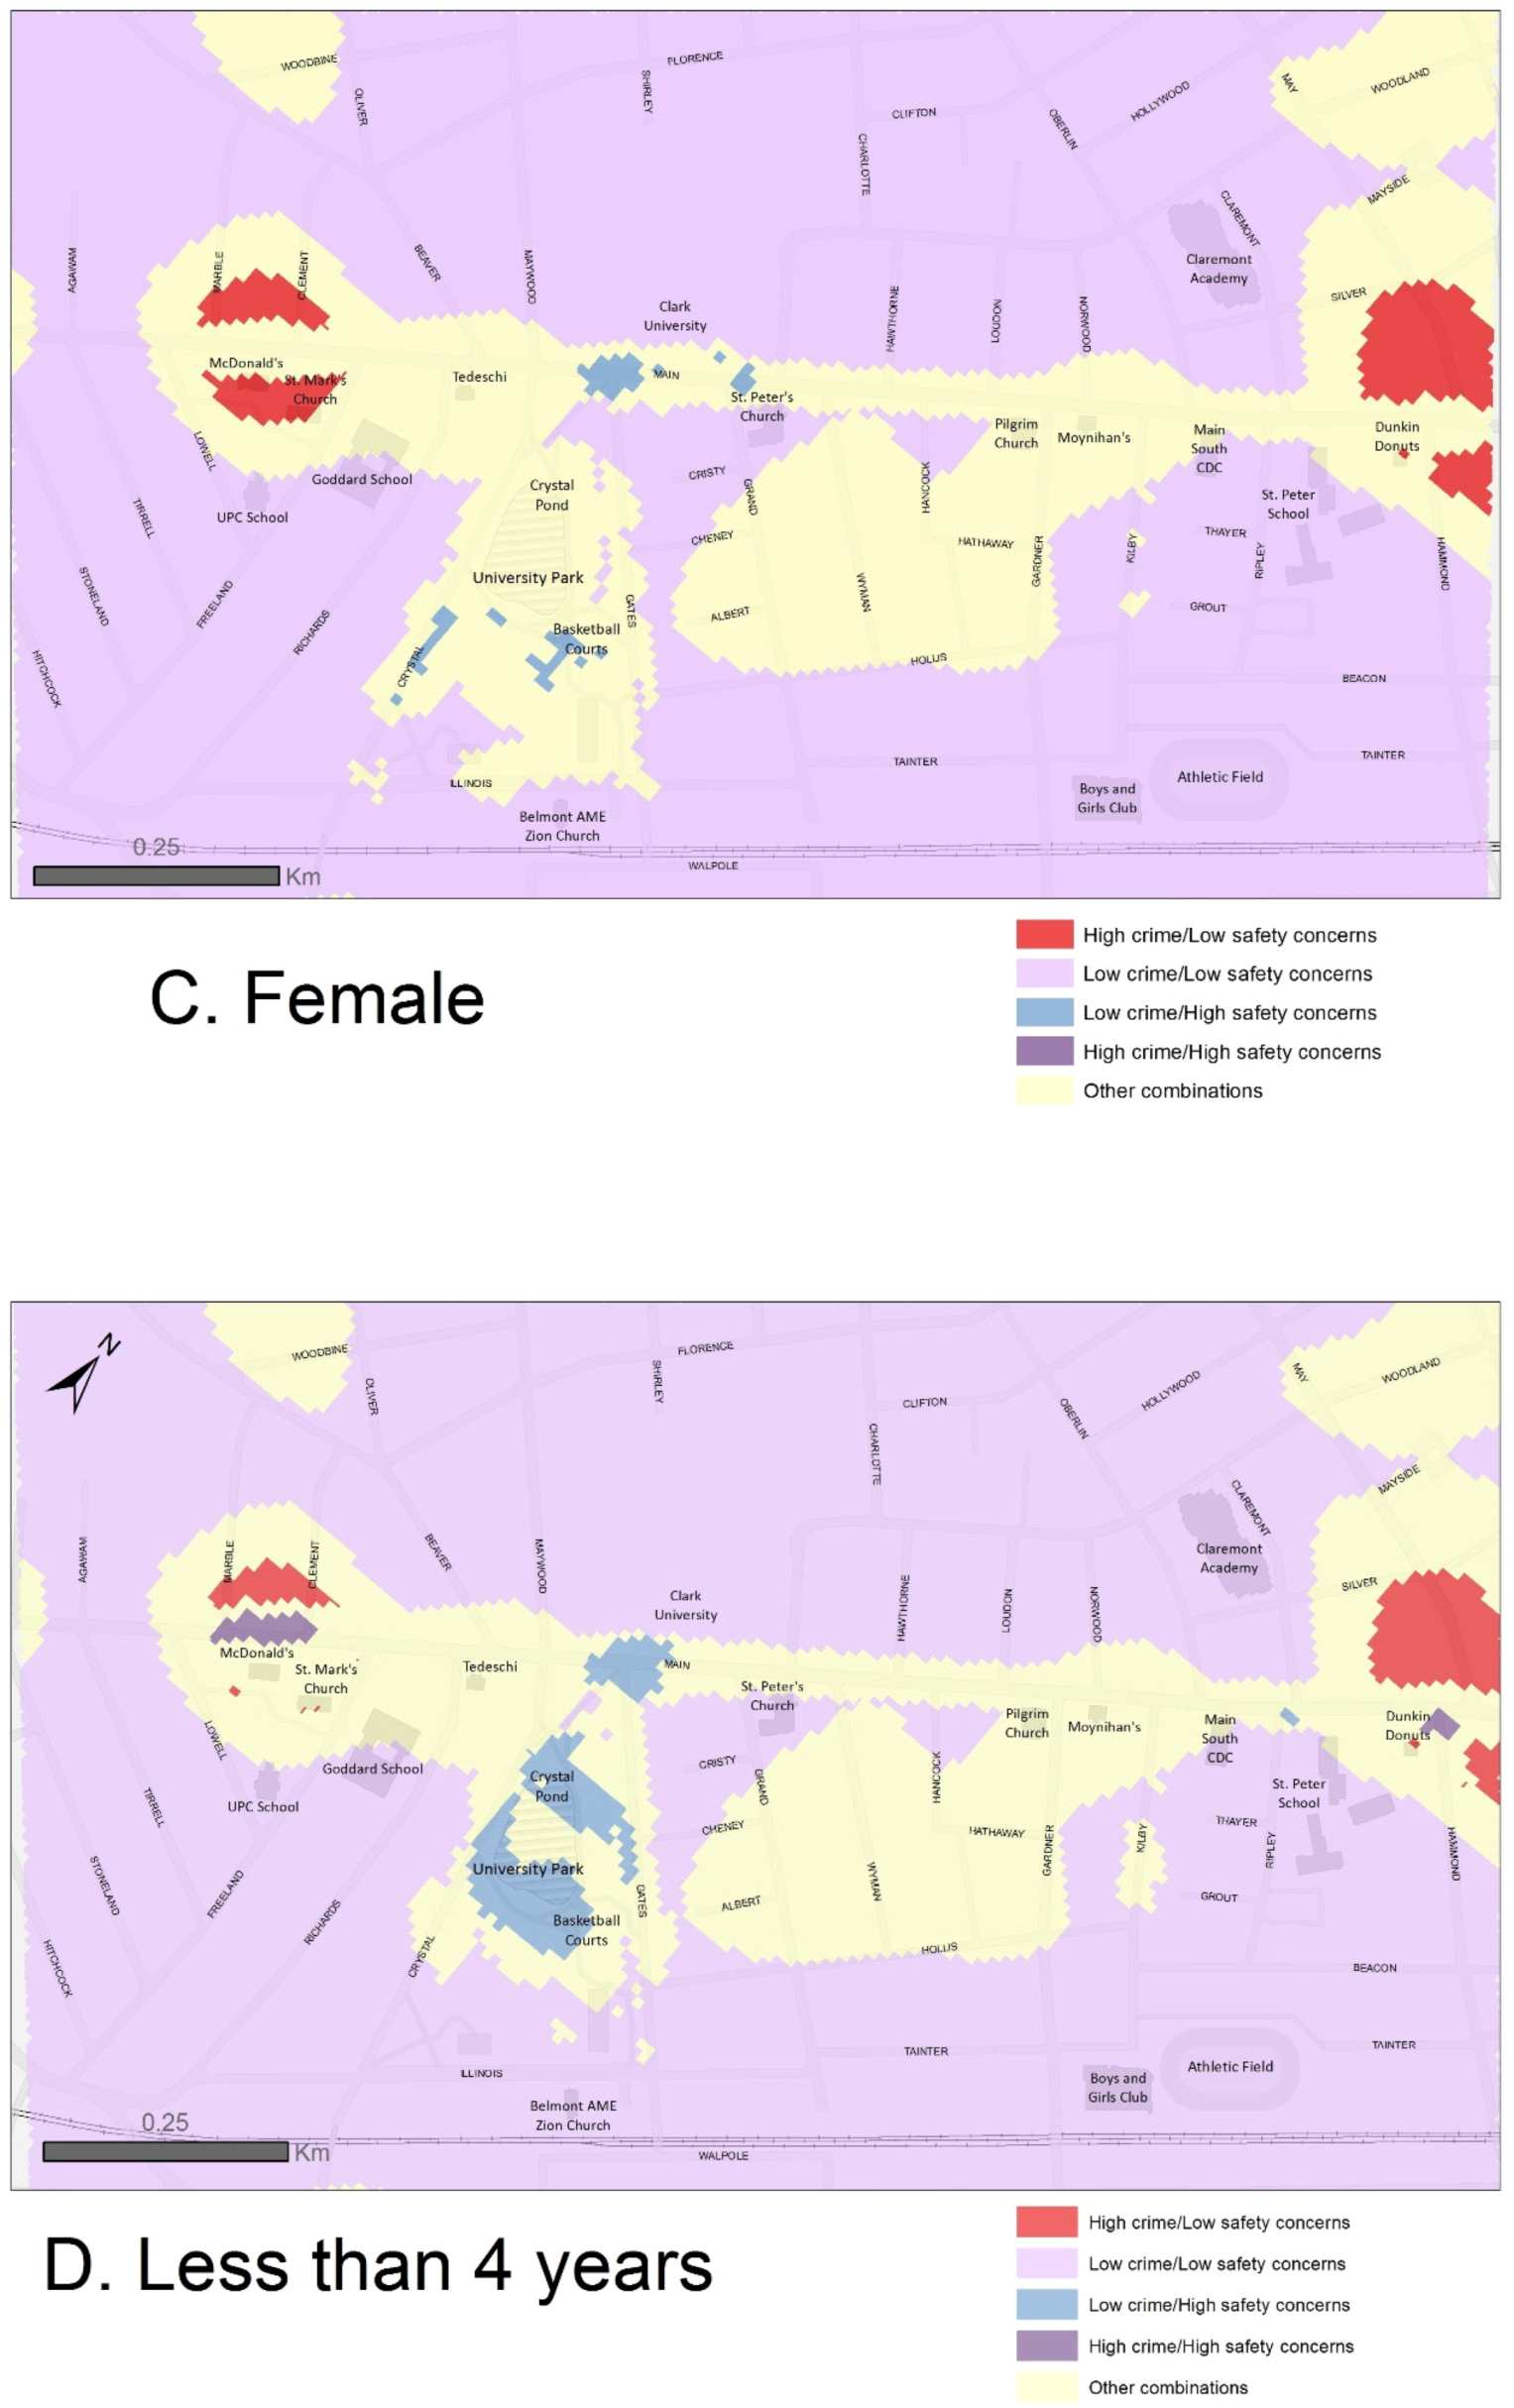
Figure 4b,c), with the exception of a small area near St. Peter’s Church, which was categorized as “low crime, high safety concerns” only on the female map. In the University Park area, the spatial mismatch between crime and safety concerns is more pronounced for male respondents. Of the three overlay maps related to the length of residency, only one showed spatial match between areas of high reported crime and high safety concerns, that is, for residents who lived 4 years or less in the neighborhood (
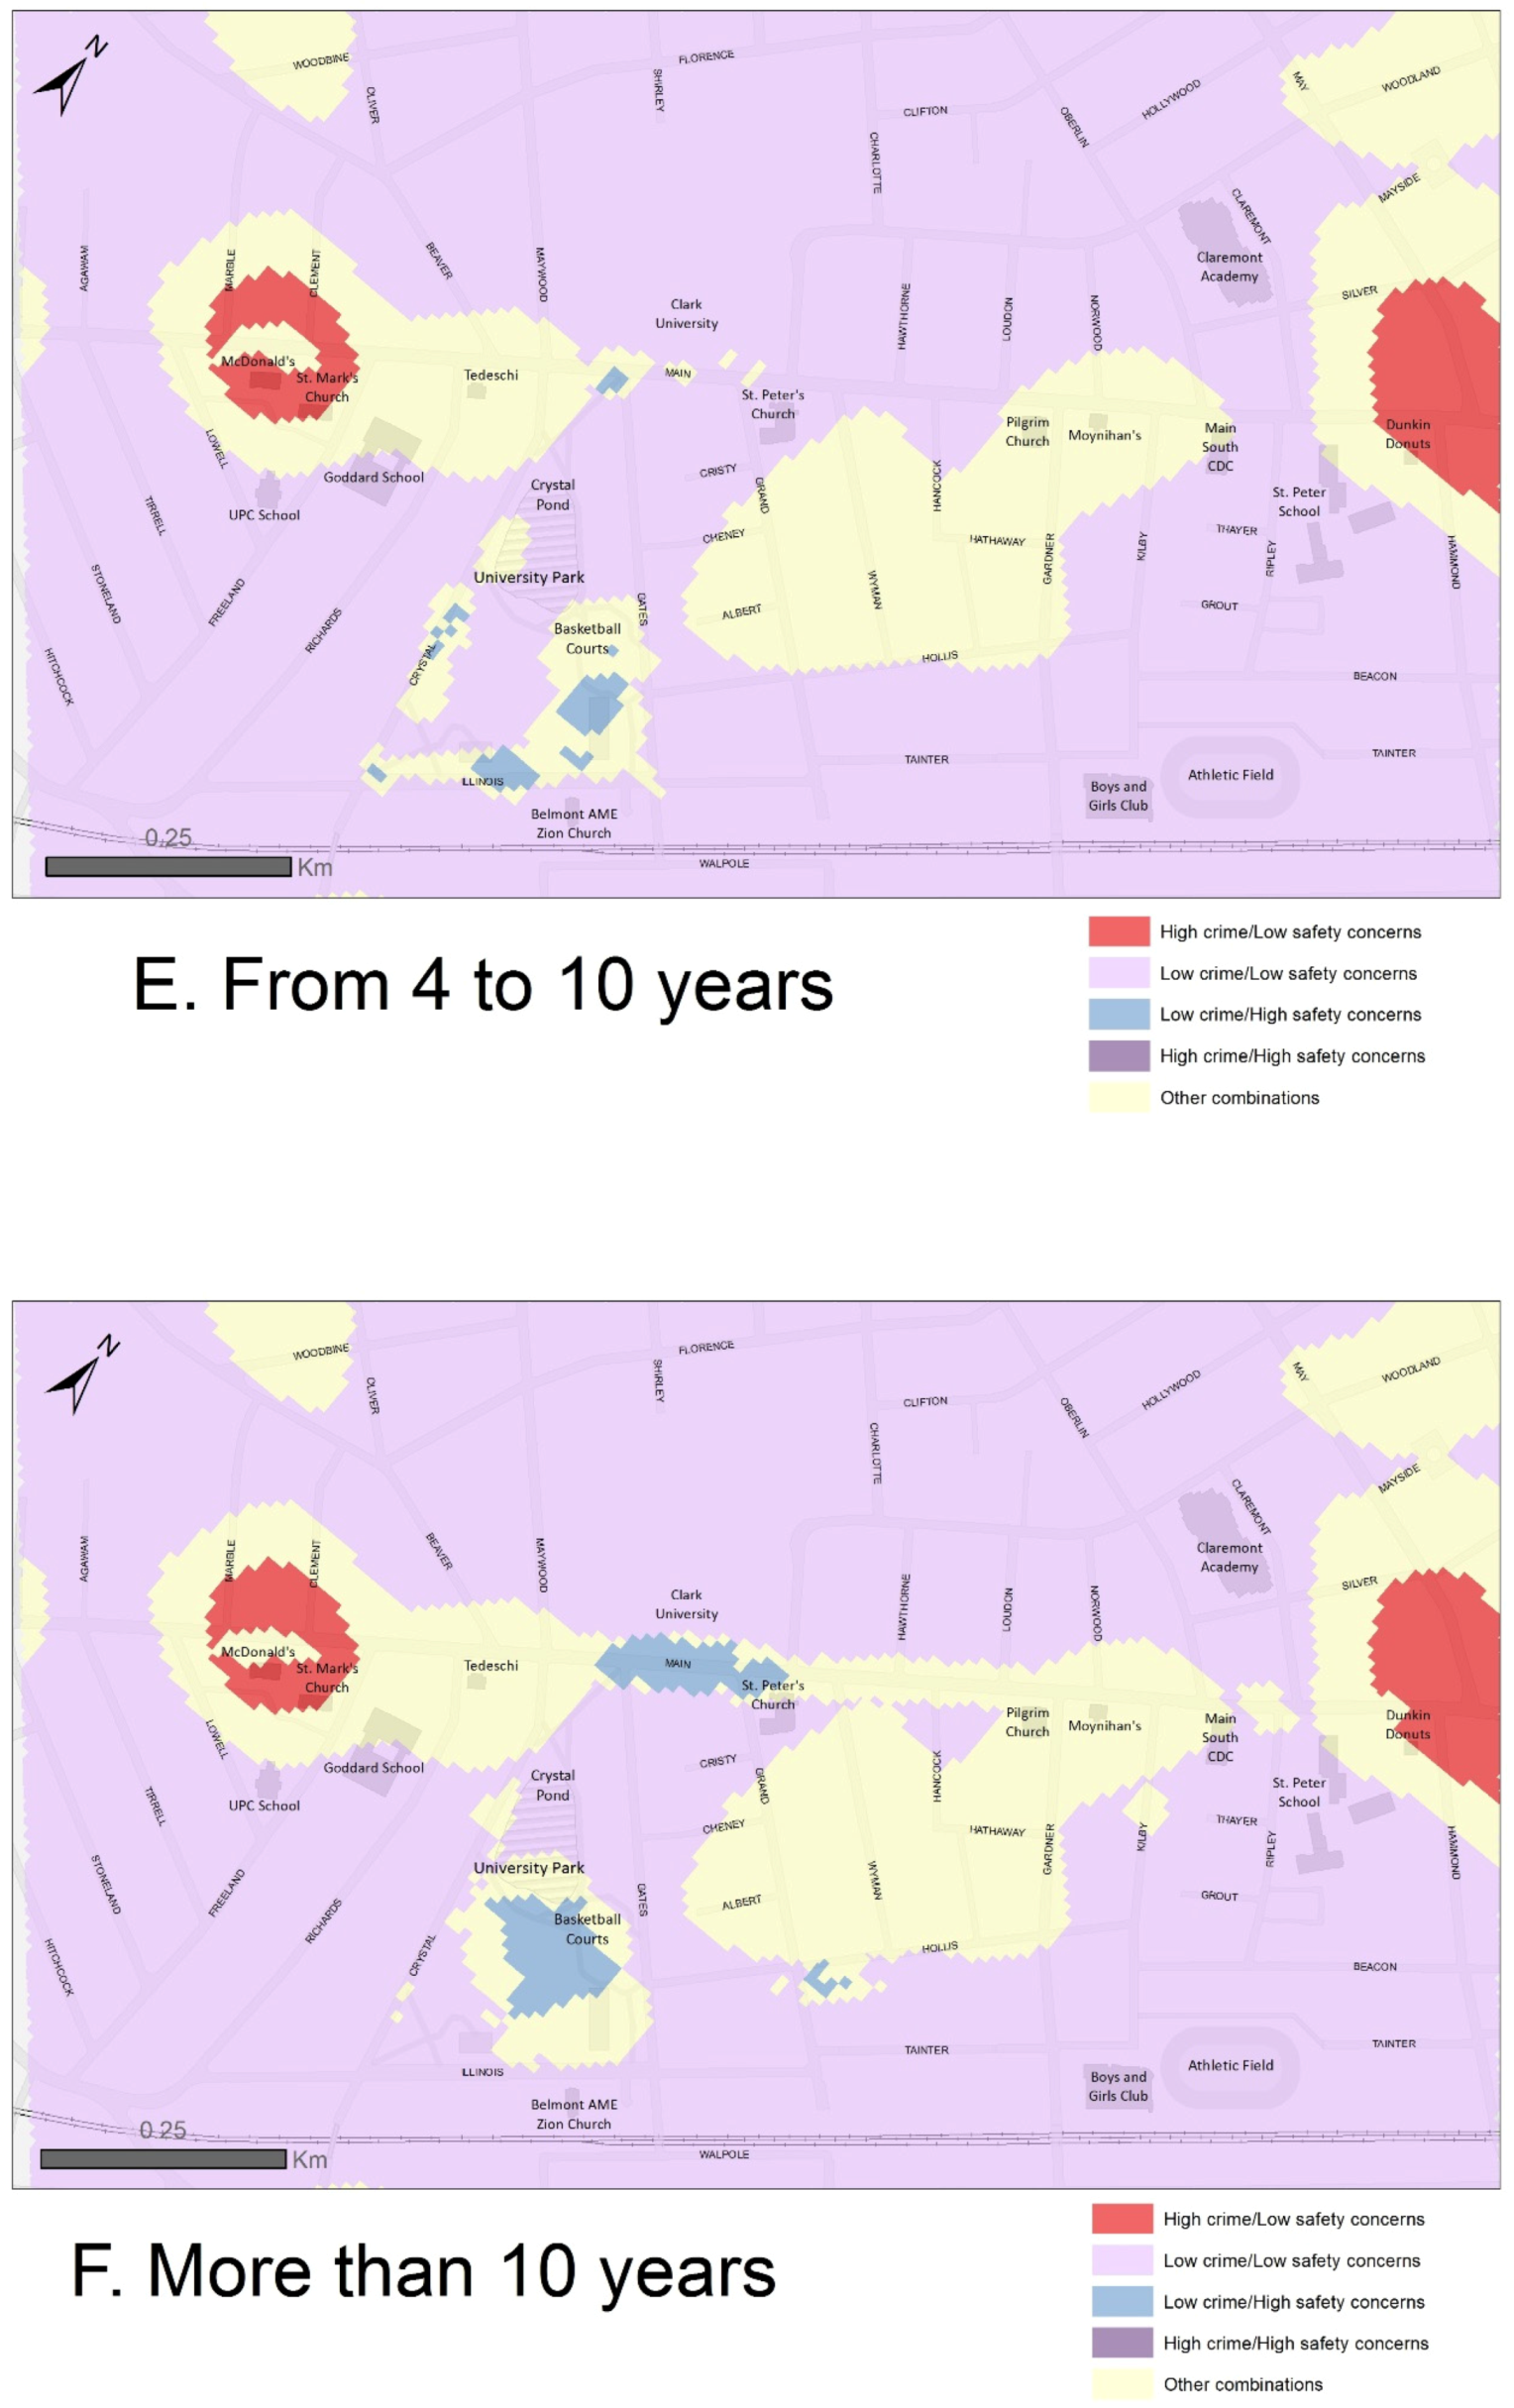
Figure 4d). Residents who lived in the neighborhood longer than 4 years perceived these areas as medium or low safety concerns (
Figure 4e,f). On the other hand, areas of spatial mismatch (low crime perceived as high crime concerns) occupy the largest area on two maps, that is, for respondents who lived in the neighborhood less than 4 years, but also more than 10 years (
Figure 4d,f).
4. Discussion
This research was conducted in the context of the Byrne Criminal Justice Innovation Program (BCJIP). The project’s overarching goal was to reduce gang-related criminal activity and social disorder in the target area by reasserting residents’ physical and social control of public spaces and promoting opportunities for positive youth development while addressing the needs of disengaged youth. Our objective was to identify and analyze crime hotspots (areas of high crime density) in the neighborhood and then formulate strategies to improve conditions in those areas.
Crime hotspots were identified using police data and supplemented with residents’ perceptions collected through a household survey with neighborhood safety sketch maps. Based on our analysis, we concluded that residents largely felt safe in the target area. Bivariate maps showed that the strength of the relation between perceived safety and reported crime varied, and that gender and length of residency were significant factors that shaped perceptions of safety.
While our study asked similar questions about perception by gender and length of residency as previous studies, it is hard to compare our findings to those of other researchers because of the difference in scale and methodology. Three previous studies on gender perception used multivariate statistical analysis on a national or city scale, with sample sizes ranging from 1000 to 8000 [
12,
13,
14]. They did not use mapping to compare unsafe spaces with recorded crime. Our study found that the two gender perception maps were very similar, with the exception of several specific locations. In terms of length of residency, residents who lived in the area less than four years marked more areas as unsafe compared to longer-term residents. This finding is similar to the Guo and Wu study in New Haven [
20].
Household survey responses may shed some light on the reasons underlying the reported crime perceptions. Survey respondents cited drug users and transactions as their most frequent concern by far. Mention was made of needles in Crystal Park, in several parking lots, and close to the Boys & Girls Club. Prostitution was the second most frequent concern in surveys. Individuals identified as sex workers were frequently referred to as “bad people.” Several respondents described areas as dangerous for young women and, sometimes in the same response, named women who were sex workers as part of the reason they felt unsafe. Other reasons for feeling unsafe were hearing gunshots, homelessness, panhandling, speeding, and robbery. Responses regarding robberies frequently involved witnessing a robbery or experiencing theft of or related to motor vehicles. Fear of purse being grabbed was also indicated.
It is important to address limitations related to our methodological choices. We used square grids as the unit of analysis because they provide a common format for aggregating and comparing point (police data) and polygon (sketch maps) data. However, with any spatial aggregation the modifiable areal unit problem (MAUP) arises. This means that the statistical results will change depending on the size, shape, and orientation of the aggregation units [
37]. Several recent studies addressed this issue by applying a multiscale framework grounded in information theory and complex systems to model urban crime [
37,
38,
39]. This framework uses different spatiotemporal scales and applies multifractal analysis, risk terrain modeling, and urban scaling to “suggest characteristic scales for crime dynamic modeling purposes” [
37]. This technique was beyond the scope of our work, but we hope that more GIS-based studies will apply this framework to crime analysis in the future.
Instead of simply counting the number of recorded crime points in each grid cell, we chose to use kernel density, because it accounted for crime in the neighboring grids and helped in the smoothing (better generalization) of spatial data by generating continuous surfaces. Because our methodology combines human-drawn polygons with algorithmically calculated density raster grids, scale should be considered in evaluating the results.
Another limitation is related to the inherent uncertainty associated with spatial data. On the sketch maps, many residents tended to mark perceived unsafe areas tightly around their specific areas of concern, such as a problematic parking lot or store. In some cases, survey participants seeking to designate a street as unsafe seemed to circle the street name label on the map as opposed to marking a section of or entire length of the street.
In contrast, the crime density maps produced from police data show elevated crime risk areas that fall off gradually around clusters of incident points. This difference may produce doughnut-shaped artifacts in the overlay maps in which a ring is classified as “high crime, low crime concerns” even though residents accurately perceived the elevated crime risk at the center of the ring. In other words, survey participants may have a more focused perception of crime risk, one that may be constrained by the geography of an urban landscape, while the crime density ebbs evenly without respect to obstacles such as buildings and fences.
In this study, we represented boundaries of the unsafe polygons drawn by the respondents as “hard” boundaries. In reality, there is spatial uncertainty associated with these spatial boundaries, based on personal interpretation of the question (mark on the map where you feel unsafe) and personal perception and knowledge of the neighborhood. Future research could apply a fuzzy set approach to capture the uncertainty of spatial boundaries [
40]. Fuzzy membership functions and fuzzy overlay tools exist in GIS software (TerrSet, ArcGIS Pro) and have been applied to multi-criteria evaluation and suitability mapping [
41] but not in the context of crime perception research. These limitations notwithstanding, our study contributes to the body of literature on mapping crime and safety. It underscores the importance of fine-scale data collection methodologies such as sketch maps, which can complement and sometimes replace traditional data sources. It proposes a spatially explicit methodology for comparing recorded crime and safety perceptions that can be reproduced in other studies. During data collection and analysis, we worked closely with our community partners to make sure our analytical approaches were transparent and intuitive, because they are the main audience for this work. We used an equal interval reclassification of continuous maps (crime density and perception maps) and converted them into categorical maps with three classes (low, medium, high). The logic behind this reclassification method is clear and easy to understand.
Previous studies used semi-transparency [
9] and bivariate mapping [
21] to visually analyze spatial agreements and differences between crime and safety perception maps. These studies provided a narrative or a qualitative description of the degree of overlap between maps (weak, medium, strong). In our study, we illustrated how researchers and practitioners can measure differences and similarities between maps as percent of the study area within each combination of map categories.
We identified two related implications of our findings that should be of interest to community development practitioners. First, recorded crime as measured by police data is an imperfect proxy for neighborhood safety. As evident in the mismatches between recorded crime and feelings of safety, residents have a more complex understanding of what makes a space seem safe or unsafe and this perception differs according to the identity of the resident. Second, comprehensive community-based development initiatives should be prepared to develop differentiated strategies that address a broad range of safety perceptions and crime experiences among a diverse group of residents. Such initiatives may include developing free programs and events in public spaces that have low reported crime but nonetheless are perceived as unsafe. The goal of these initiatives is to encourage local social networking and to change perceptions of safety among residents. After the analysis presented in this paper, Main South Community Development Corporation decided to collaborate with 20 local organizations to provide concerts, outdoor exercise classes, playgroups, and a farmers’ market in University Park during summer and fall. Preliminary results indicate that more residents are now using the park and feeling safe there. More research is needed to compare the effectiveness of community-based initiatives and practices designed to reduce perceived disorder and to strengthen the sense of control among residents.

 ,
, 


