Analysis of Bird Flyways in 3D


Department of Civil, Environmental and Mechanical Engineering, University of Trento, 38123 Trento, Italy
*
Author to whom correspondence should be addressed.
†
Current address: Dipartimento di Scienze e Tecnologie Agrarie, Alimentari Ambientali e Forestali, Università degli Studi di Firenze, 50144 Firenze, Italy.
ISPRS Int. J. Geo-Inf. 2019, 8(12), 535; https://0-doi-org.brum.beds.ac.uk/10.3390/ijgi8120535
Submission received: 24 October 2019
/
Revised: 17 November 2019
/
Accepted: 24 November 2019
/
Published: 27 November 2019
(This article belongs to the Special Issue Free and Open Source Tools for Geospatial Analysis and Mapping)
Abstract
:Bird migration is a long studied phenomenon that involves animals moving back and forth from wintering sites and to reproductive grounds. Several studies have focused on identifying the timing, physiology and evolution of migration, but a spatial approach to understand the migratory routes is still an open challenge. Geographic Information Systems (GIS) can provide the tools to explore such a complicated issue. Birds usually move from the wintering sites to spring breeding grounds in multiple flights, stopping at intermediate sites to rest and refuel, being unable to cover the distance in a single travel. The choice of stopover sites by birds depends not only on their ecological features but also on their position and visibility along main migratory flyways. In this work, we calculated the possible migratory routes that minimize the distance covered or the elevation gaps for birds crossing the Southern Alps, simulating the flight within a network connecting potential stopover sites and other relevant point of passage, using the shortest path computation. Subsequently, we performed a visibility analysis along the identified flyways to understand which stopover sites, belonging to the Natura2000 network, were visible for a bird in an area with complex morphology. Data available from ringing stations confirm the selection or avoidance of some stopover sites based on their en route visibility. The knowledge of bird flyways and stopover sites has implications for conservation as well as for planning, especially for wind farms or other infrastructures.

1. Introduction
In Europe, birds migrate in autumn from central or northern Europe towards southern African wintering areas (post-nuptial migration) while, in spring, the species come back towards reproduction and nesting areas (pre-nuptial migration) [1]. During these periodic mass movements between Europe and Africa, many species of birds must face a long journey encountering threats and obstacles represented by geographic barriers such as the Alps, the Mediterranean Sea, and the Sahara Desert (the latter for long range migratory birds). During spring migration, many individuals, driven by reproductive instinct, pass through the Alps following a shorter route than circumventing the same mountain chain. However, this choice requests more energy since the birds must fly at higher elevations to overtake the mountains. During the crossing of the Alps the birds must regain the energy lost during the flight, thus the presence of suitable stopover areas is crucial [1,2,3]. For many birds, spring and autumn migration routes can be different and during the travel toward wintering areas they can actually circumvent the Alpine chain. Nevertheless, many birds pass through the Alps and researchers are trying to understand the reasons [4]. Trophic availability in the Alpine area seems to play a fundamental role in this migratory route [5,6]. Alpine valleys are relatively more natural than the surrounding European plains, which are interspersed by intensive agriculture and urbanization. During spring migration, some birds, driven by their reproductive instinct, try to move as quickly as they can towards northern reproduction sites passing through the Alps following a shorter route than circumventing the same mountain chain [1].
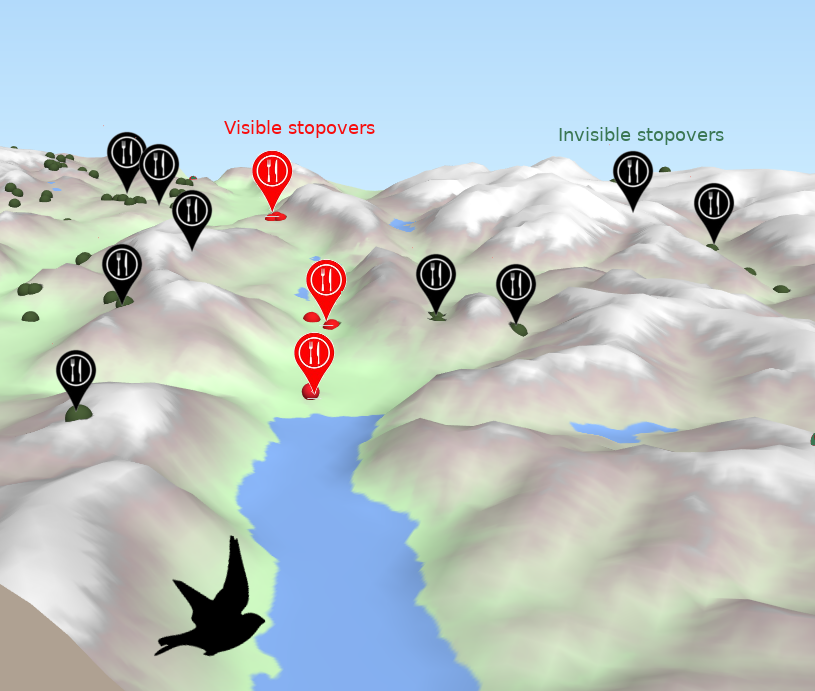
Birds usually moves in multiple steps, stopping at intermediate sites to rest and refuel, being unable to cover the distance in a single flight. The choice of stopover sites by birds depends not only on their ecological features but also on their position and visibility along main migratory flyways.
Although some authors suggested that visibility may play a major role in the choice of stopovers [7,8], the materialization of a concept such as visibility is not very simple. In fact, only few have tried to take into account visibility in a quantitative way. For instance, Åkesson et al. (2001) proved that the visibility of the stars is important for triggering the migration for warblers. They also suggested that horizontal visibility is likely to be important for migration and future research should be addressed in this direction.
Geomatics can provide the tools to explore such a complicated issue. In this work, we combined GIS capabilities, the biological knowledge of the species, and field records to obtain information about migration paths in the Alps. In this work, we calculated the possible migratory routes that minimize the distance covered or the elevation gaps for birds crossing the Southern Alps, simulating the flight within a network connecting potential stopover sites and other relevant point of passage. The underling hypothesis is that the animals try to cover the maximum possible distance towards the north minimizing the efforts. In this context, in which we consider only mountain morphology, the optimum path is the one that tries to avoid mountains and higher passes and to maintain the direction towards the north while minimizing elevation variations. Spatial path optimization is one of the most treated aspects in GIS studies to address a variety of issues [9,10]. One of the most widely used models is the shortest path problem (SPP), which finds the least cost path from one node in a network to another (Daskin 1995). We adapted the approach proposed by Downs and Horner (2008) [11], and we considered migratory routes as a network of stopovers that connect origin and destination habitats.
Subsequently, we performed a visibility analysis along the identified flyways, in order to understand which stopover sites were visible for a bird in an area with complex morphology. Finally we used the data from ringing stations to confirm the selection or avoidance of some stopover sites based on their en route visibility.
Study Area
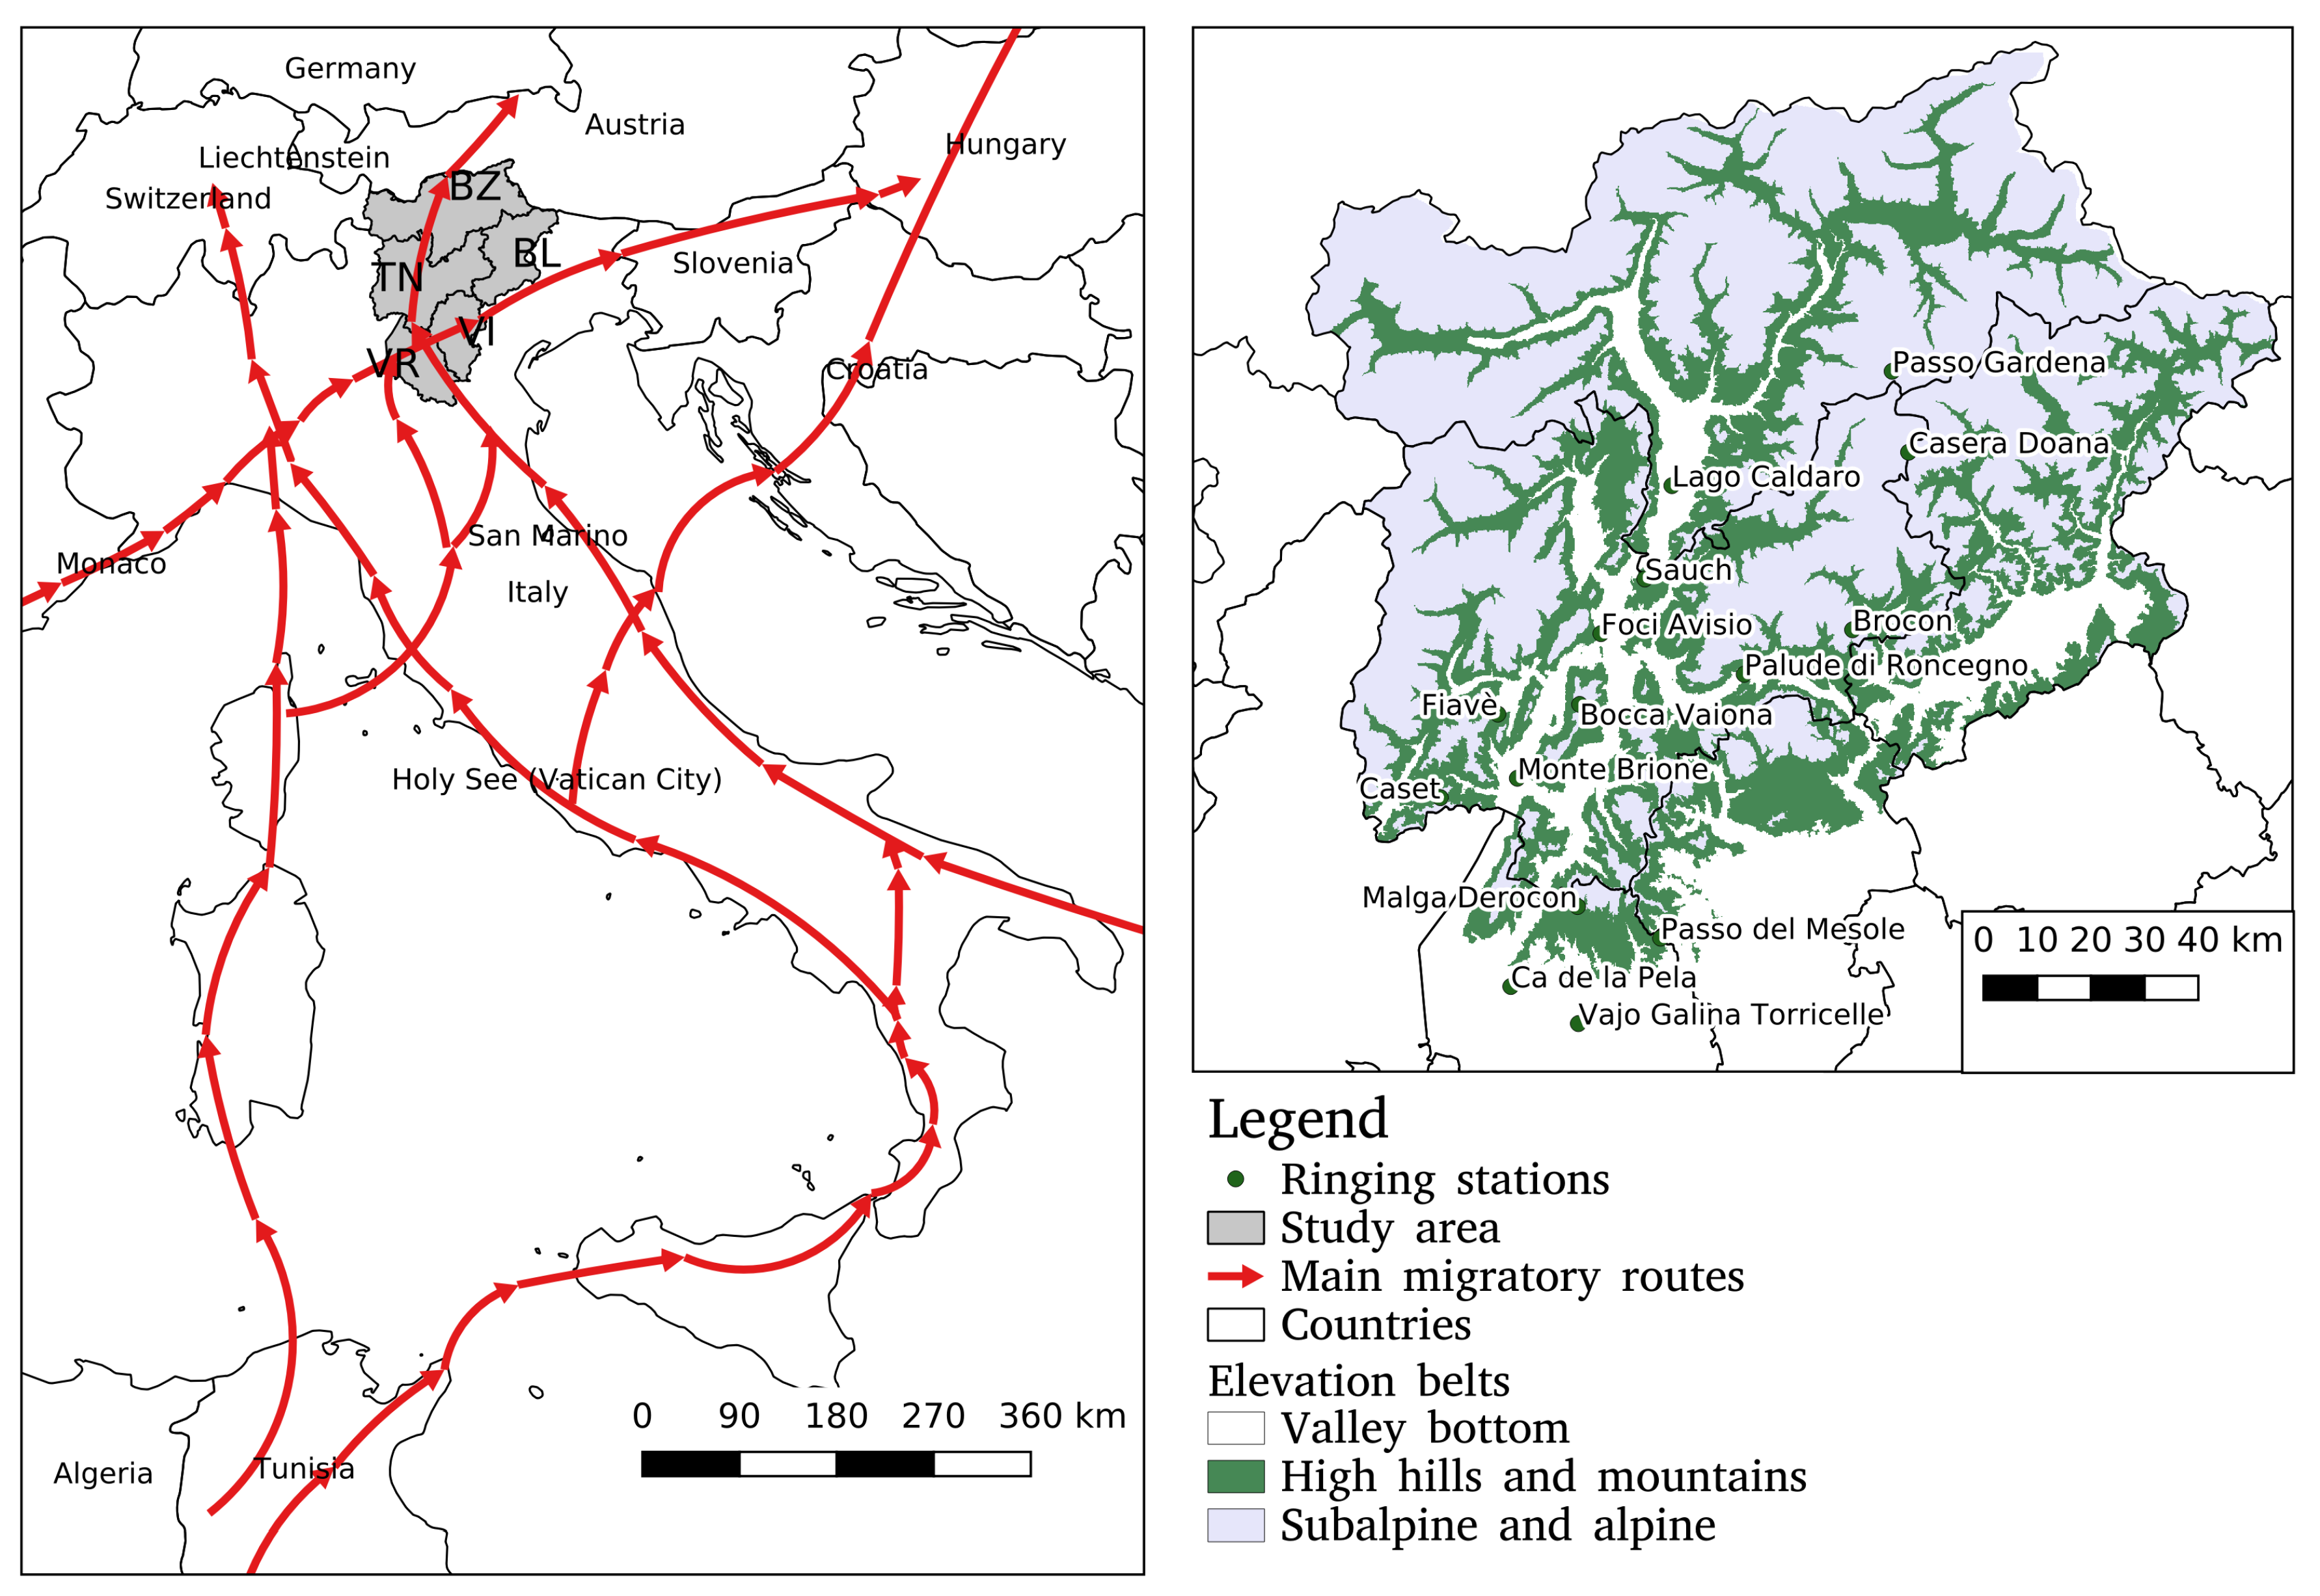
The study area (10.5 E, 45.2 N–12 E 46.5) is located in the southeastern Alps in Italy and includes the Provinces of Belluno, Vicenza, and Verona (Veneto region) and the Provinces of Bolzano and Trento (Trentino Alto Adige region) (see Figure 1) and it covers about 21,000 km.
Belluno, Bolzano, and Trento are mountainous areas influenced by a continental climate, with most of the territory lying over 1000 m above sea level, and around 55% covered by coniferous and deciduous forests [12,13]. Vicenza and Verona Provinces feel more the influence of the Adriatic sea and have a larger extension of plain and hilly territories. Forests are present only in 34% and 19% of Vicenza and Verona areas, respectively, while intensive agriculture is present in the flat areas of both provinces.
The elevation range was considered according to three different altitude belts, the same used in Progetto Alpi [14] that are representative of different ecological environment:
Belt 1: Valley bottom and hilly area, at an altitude below 700 m, it occupies an area of 5486.3 km;
Belt 2: High hills and mountains, at an altitude between 700 and 1400 m it occupies an area of 5990.0 km; and
Belt 3: Sub-alpine and alpine, at an altitude of more than 1400 m, is the larger area that occupies 10,177.70 km. The spatial distribution of the three belts in the study area is shown in Figure 1.
The five provinces represent a contiguous ecological system that connects Mediterranean areas with pre-alpine and alpine mountain environments.
The area includes developed touristic, agricultural, industrial, and commercial areas that are connected through main road and railway transport infrastructures. The provinces’ populations in 2017 are around 208,000 in Belluno, 865,082 in Vicenza, 921,557 in Verona, 525,000 in Bolzano, and 537,000 in Trento (Source http://www.istat.it). Most of the population is concentrated in the plain areas or in the valley floors. All these territories share a particular attention to mountain environment and forestry and they have translated this attention into scientific and practical management tools such as detailed forest types catalogs [15,16,17].
The area is interested by different migration routes of many bird species; since 1997, several ringing stations have been recording the bird passage in the framework of “Progetto Alpi” carried out at national level by “ISPRA” (Italian institute for environmental protection and research) and other projects promoted locally by the Natural History Museum of Trento [14]. The records of bird captures during spring were obtained from the Reports by CEA(Centro di Ecologia Alpina) [18,19,20].
The Natura2000 Network in the whole study area accounts for 256 Sites of Community Importance (SCI) and 195 Special Protection Areas (SPA), as identified by the Habitats Directive 92/43/EEC and Birds Directives 79/409/EEC, respectively. However, there is a great overlap among the two categories of protected sites because 188 of the SPAs fall entirely in areas already designated as SCI or Natural Parks. The province of Trento (TN in the map of Figure 1) hosts 152 Natura2000 areas, Bolzano (BZ) 40, Verona (VR) 15, Vicenza (VI) 15, and Belluno (BL) 35 for a grand total of more than 6500 km. The study area hosts 64 species of birds listed in the Habitat Directive, of which 17 are migratory species.
2. Materials and Methods
The analyses were carried out with GRASS GIS [22] using the modules for network analysis v.net.path and visibility r.viewshed and r.los. The main routes were calculated using the shortest path problem (SPP), which is able to find the minimum cost path among different points in a network [9]. The nodes of our network are the main passes, potential stopover sites (lakes and Natura2000 sites) and 1000 random points that allowed for a homogeneous coverage of the whole area.
The nodes were connected in a network and for each segment both the topographic linear and the three-dimensional distance were calculated to account for the terrain morphology. The routes have been calculated using as cost factors both topographic linear distance and the altitude gap between one point and the next one. After the identification of the least cost paths, the visibility from each point of the route was estimated considering the elevation of the bird (the observer) and the Digital Terrain Model. The result of the application of the GRASS module r.viewshed [23], using the processing described by Haverkort et al. [24], was a series of raster maps in which visible areas were highlighted, representing the area that a bird can see at a given height. The module that processes visibility does not take into account Earth curvature but the horizon can be calculated with a good approximation using the formula:
where d is the distance from horizon in km and h is observer altitude in meters above sea level [25]. In an area of complex morphology, such as this case, this simplification produces a reliable approximation [25]. In fact, for a bird flying at 700 m, the visible horizon would be more than 90 km. We can safely assume the rough terrain of the alpine valleys is not realistic to see greater distances. The overall process is summarized in the flow chart of Figure 2. In addiction to terrain roughness, meteorological conditions could significantly reduce visibility. The GIS algorithm calculates the visible area in ideal cloud- and fog-free conditions. In this work, we did not take into account animal moving time and meteorological conditions since no data were available, thus morphology is the main factor affecting visibility.
We used open source tools for the entire research process, from data analysis to editing (GRASS GIS [23], QGIS [26], R [27], LATEX, LibreOffice), following the philosophy highlighted by Rocchini and Neteler [28] about open source and ecology. Environmental data were downloaded from open geo-portals [1,2,3,4,29].
3. Results
3.1. Main Flight Corridors
The hypothesis is that the migratory birds tend to choose those paths implying a lower energy expenditure, thus preferably moving along the direction in which they see fewer obstacles, specifically very high mountains, and maintaining a relatively low flight altitude. With this approach, we were able to identify different flyways in the field of view along them. A glance at the digital terrain model clearly shows that there are two lines of penetration in the Alps with south–north axis: the first along the axis of Adige Valley and the second along the axis of Lake Garda, which joins up again with the first.
The starting points of the network for migratory birds heading north were chosen from the literature: the Mincio (MN) and Marsh Brusà (VR) for the route along the valley of the Adige and the Oasi Le Bine (MN) and Lakes Sovenigo (BS) for the route along Lake Garda. The shortest paths were calculated with the method of the shortest path problem (SPP) considering the difference that connect these points of departure with a point located at the north of the Alps at Starnberger in Austria.
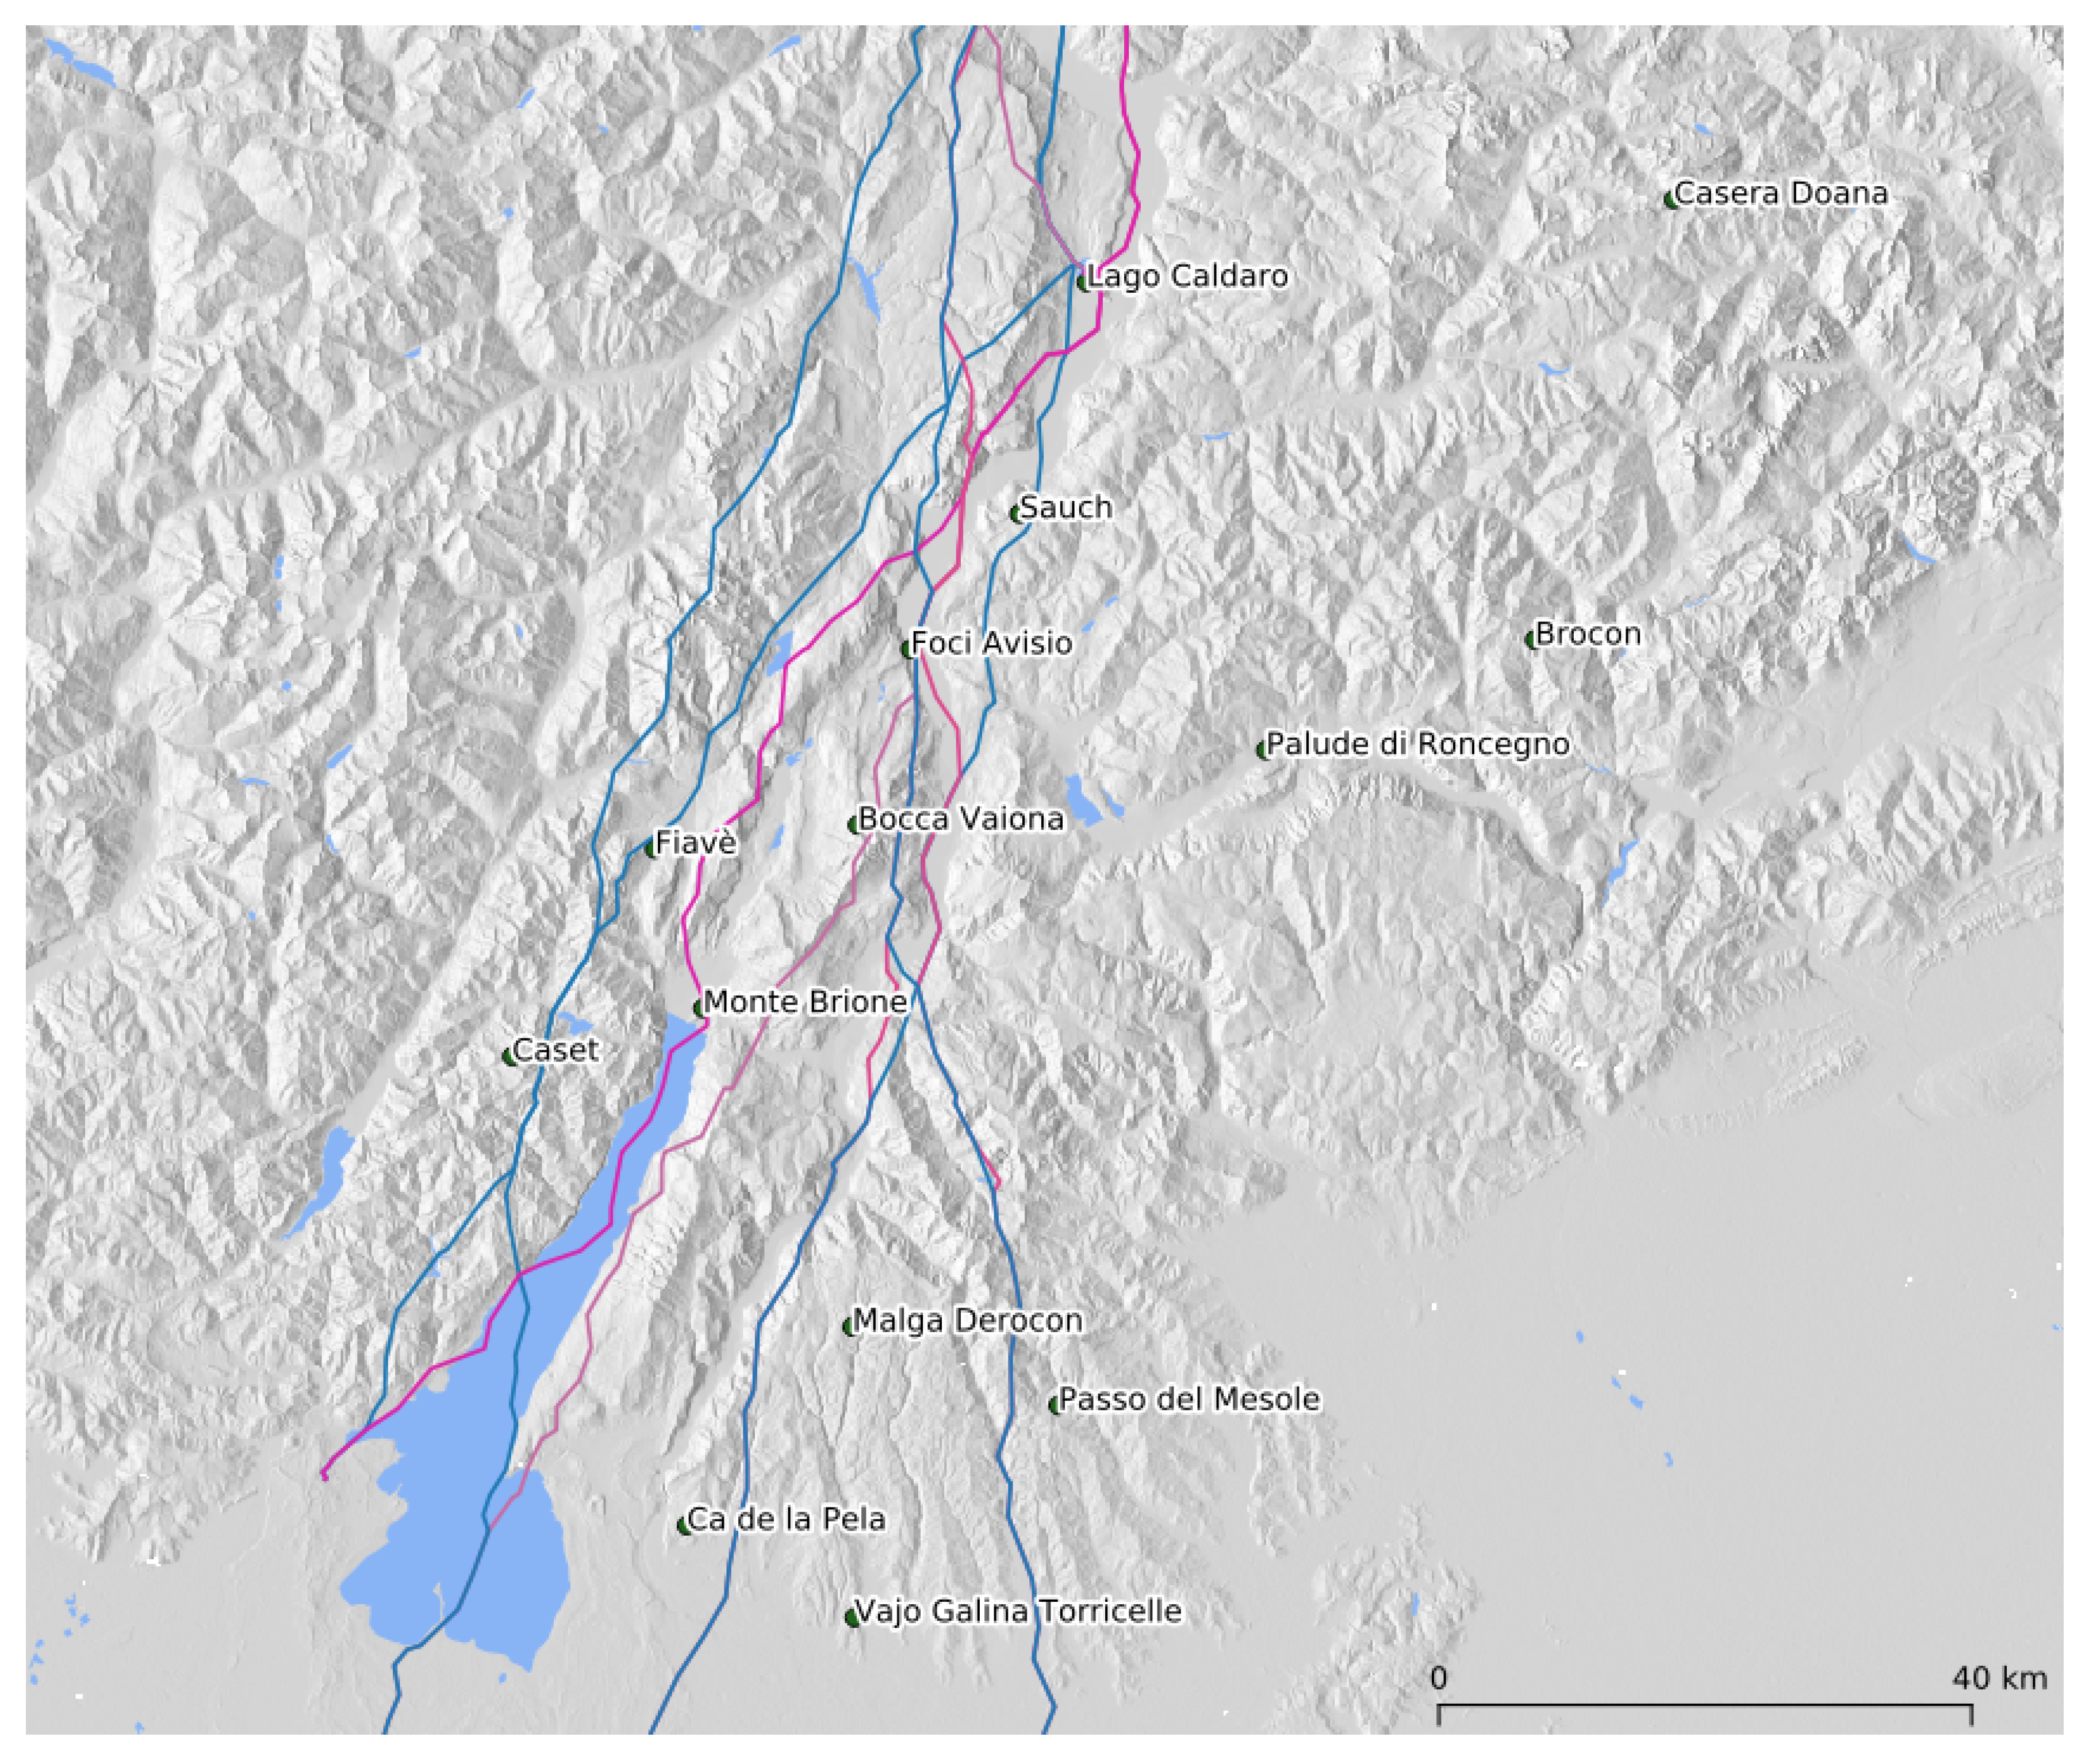
Figure 3 presents all the routes identified by the algorithm v.net.path available in GRASS GIS: the shortest paths as the crow flies (the blue lines) can be considered as the high altitude flyways that minimize the distance traveled. The pink lines instead identify the shorter routes with less elevation gain that can be considered as possible low and medium altitudes routes. Note that some of them overlap completely in the bottom valley. The role of the biotope “Foci dell’Avisio”—the mouth of Avisio creek—located at the crossroads of many routes is extremely evident in the map of Figure 3. These paths are obviously influenced by the structure of the network of points, therefore are not intended as the actual route followed by birds, but more as an indication of the corridors used during migration. The route found in the western shore of Lake Garda shows a good correspondence with the study of Fornasari et al. [30] based on recovered bird rings in Italy.
Considering the available data of captures during spring migration, both types of strategies (minimizing distance and minimizing elevation gaps) are used by birds, as captures happened in all the stations along the identified flyways (Table 1). Table 1 shows the number of birds and the number of different species recorded taking into account the sampling effort, measured as the length in meters of the net displaced at the stations (all the nets have the same height and are of the same model [31]). The number of birds captured per each meter of net vary widely across stations: the stations located along the paths minimizing elevation gaps (the pink lines of Figure 3) have a higher rate of captures. The “Torbiera di Fiavé”, the station located along the shortest path, has the lowest rate of capture.
3.2. Visibility of Stopover Sites
Starting from the lines identified by the network analysis, we assessed the visibility of possible stopover sites belonging to Natura2000 network. Both routes previously identified were analyzed, viz. the Adige one and the Garda one. Some inter-visible points were chosen along these routes and from those points we calculated the view of a bird in flight at about 700 m. The elevation of 700 m is the flying height for most of the small size migratory birds that do not perform gliding [14].
Overall, 56 sites (out of 222) belonging to the Natura2000 network are visible along from at least two simulated routes. Considering only the visible Natura2000 sites, 17 of them are visible from 85% of the routes, and 42 sites are visible from 50% of the simulations. More than 60% of the flyways pass above the Avisio ringing stations, 25% above Caset and Fiavè, and 12.5% above the other ringing stations.
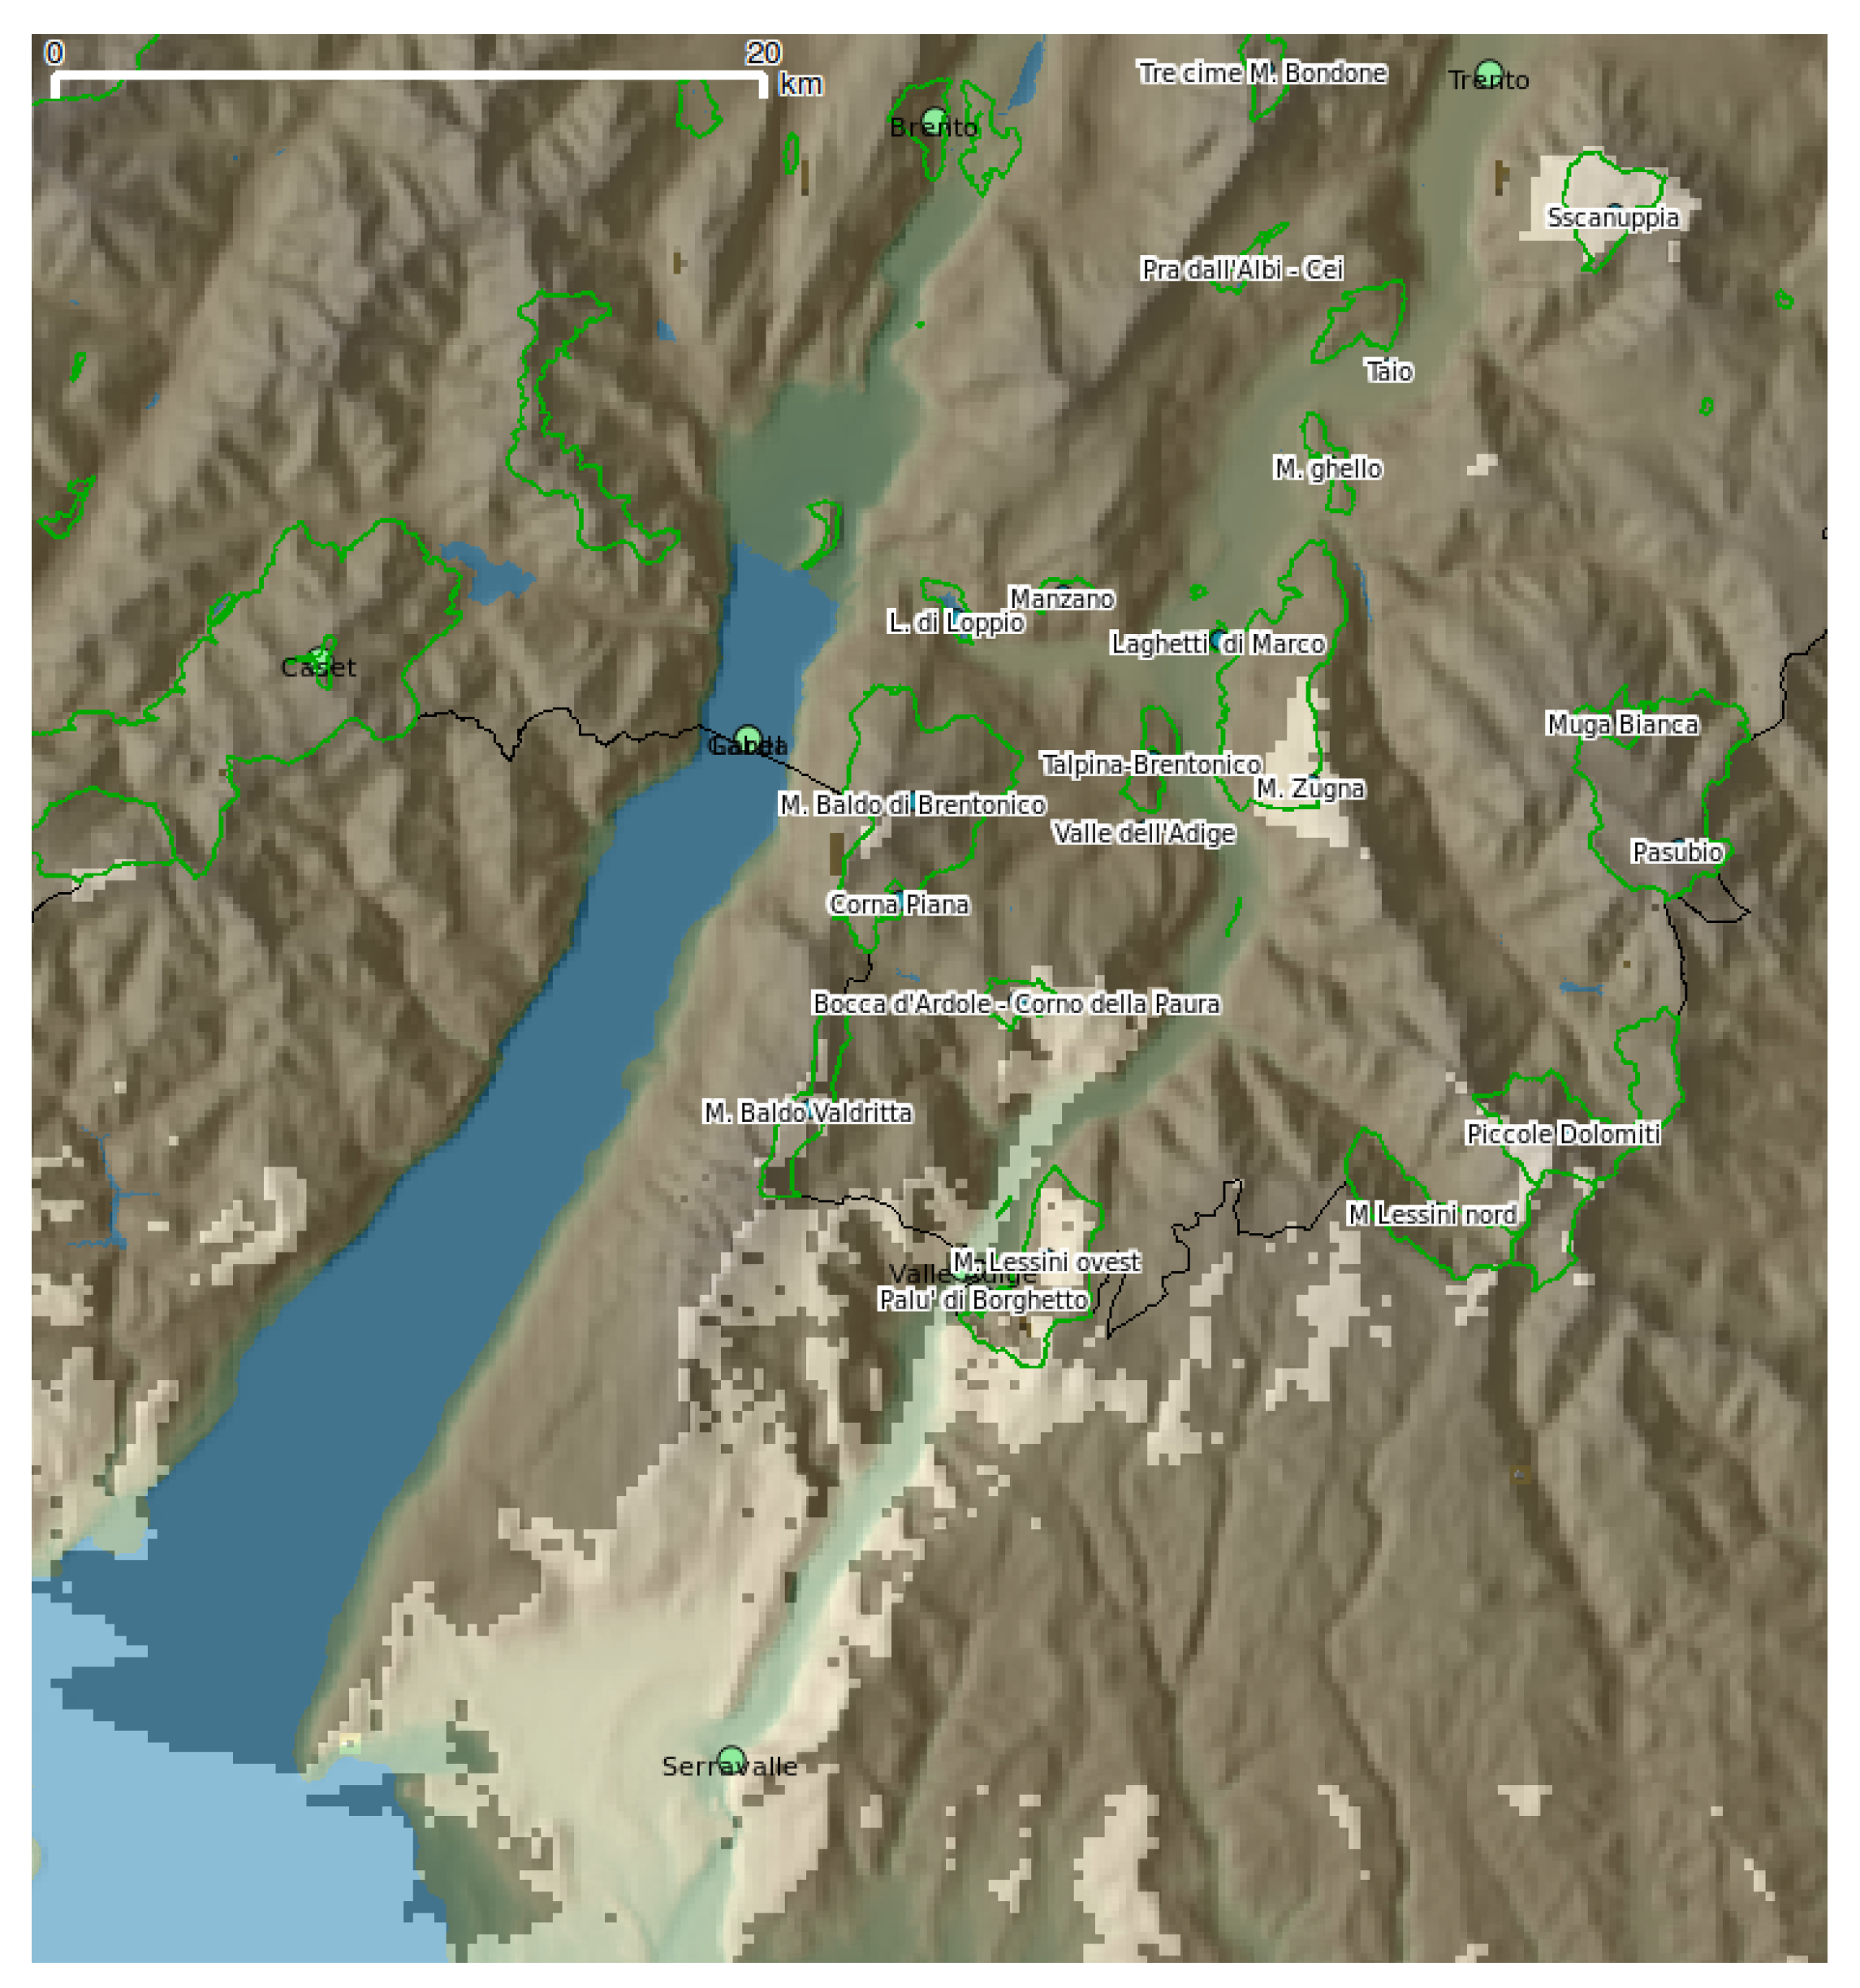
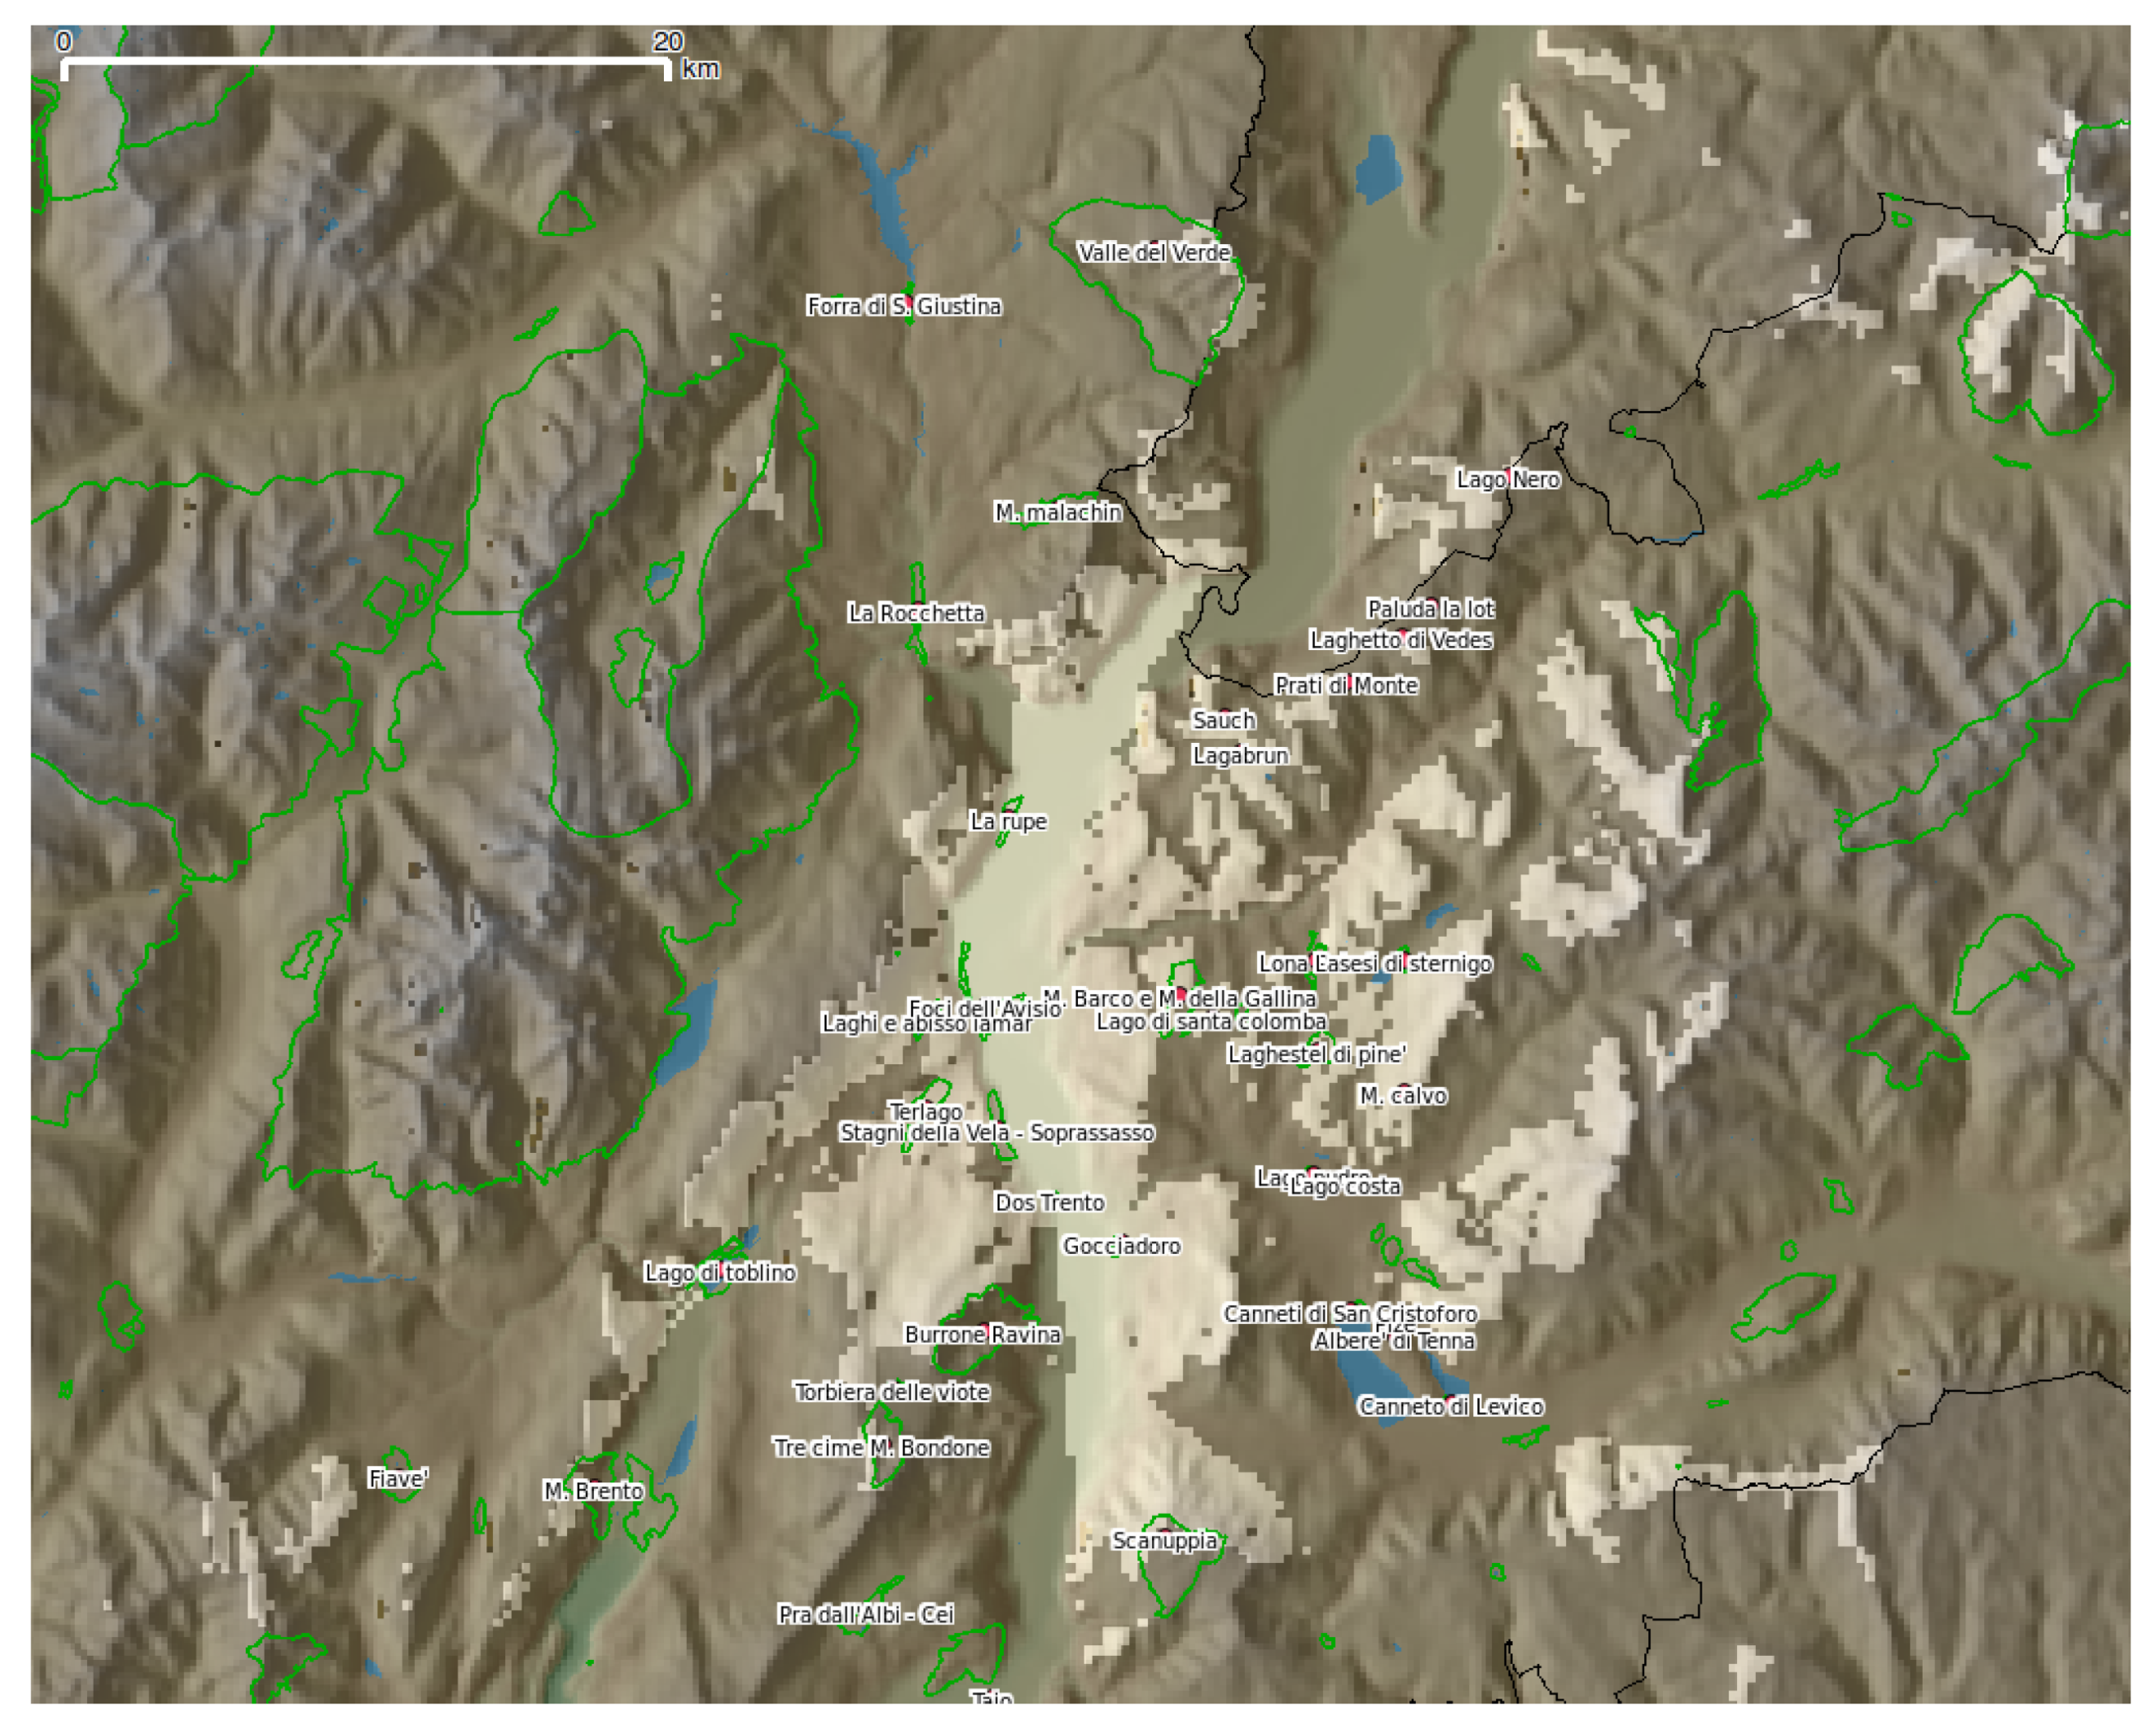
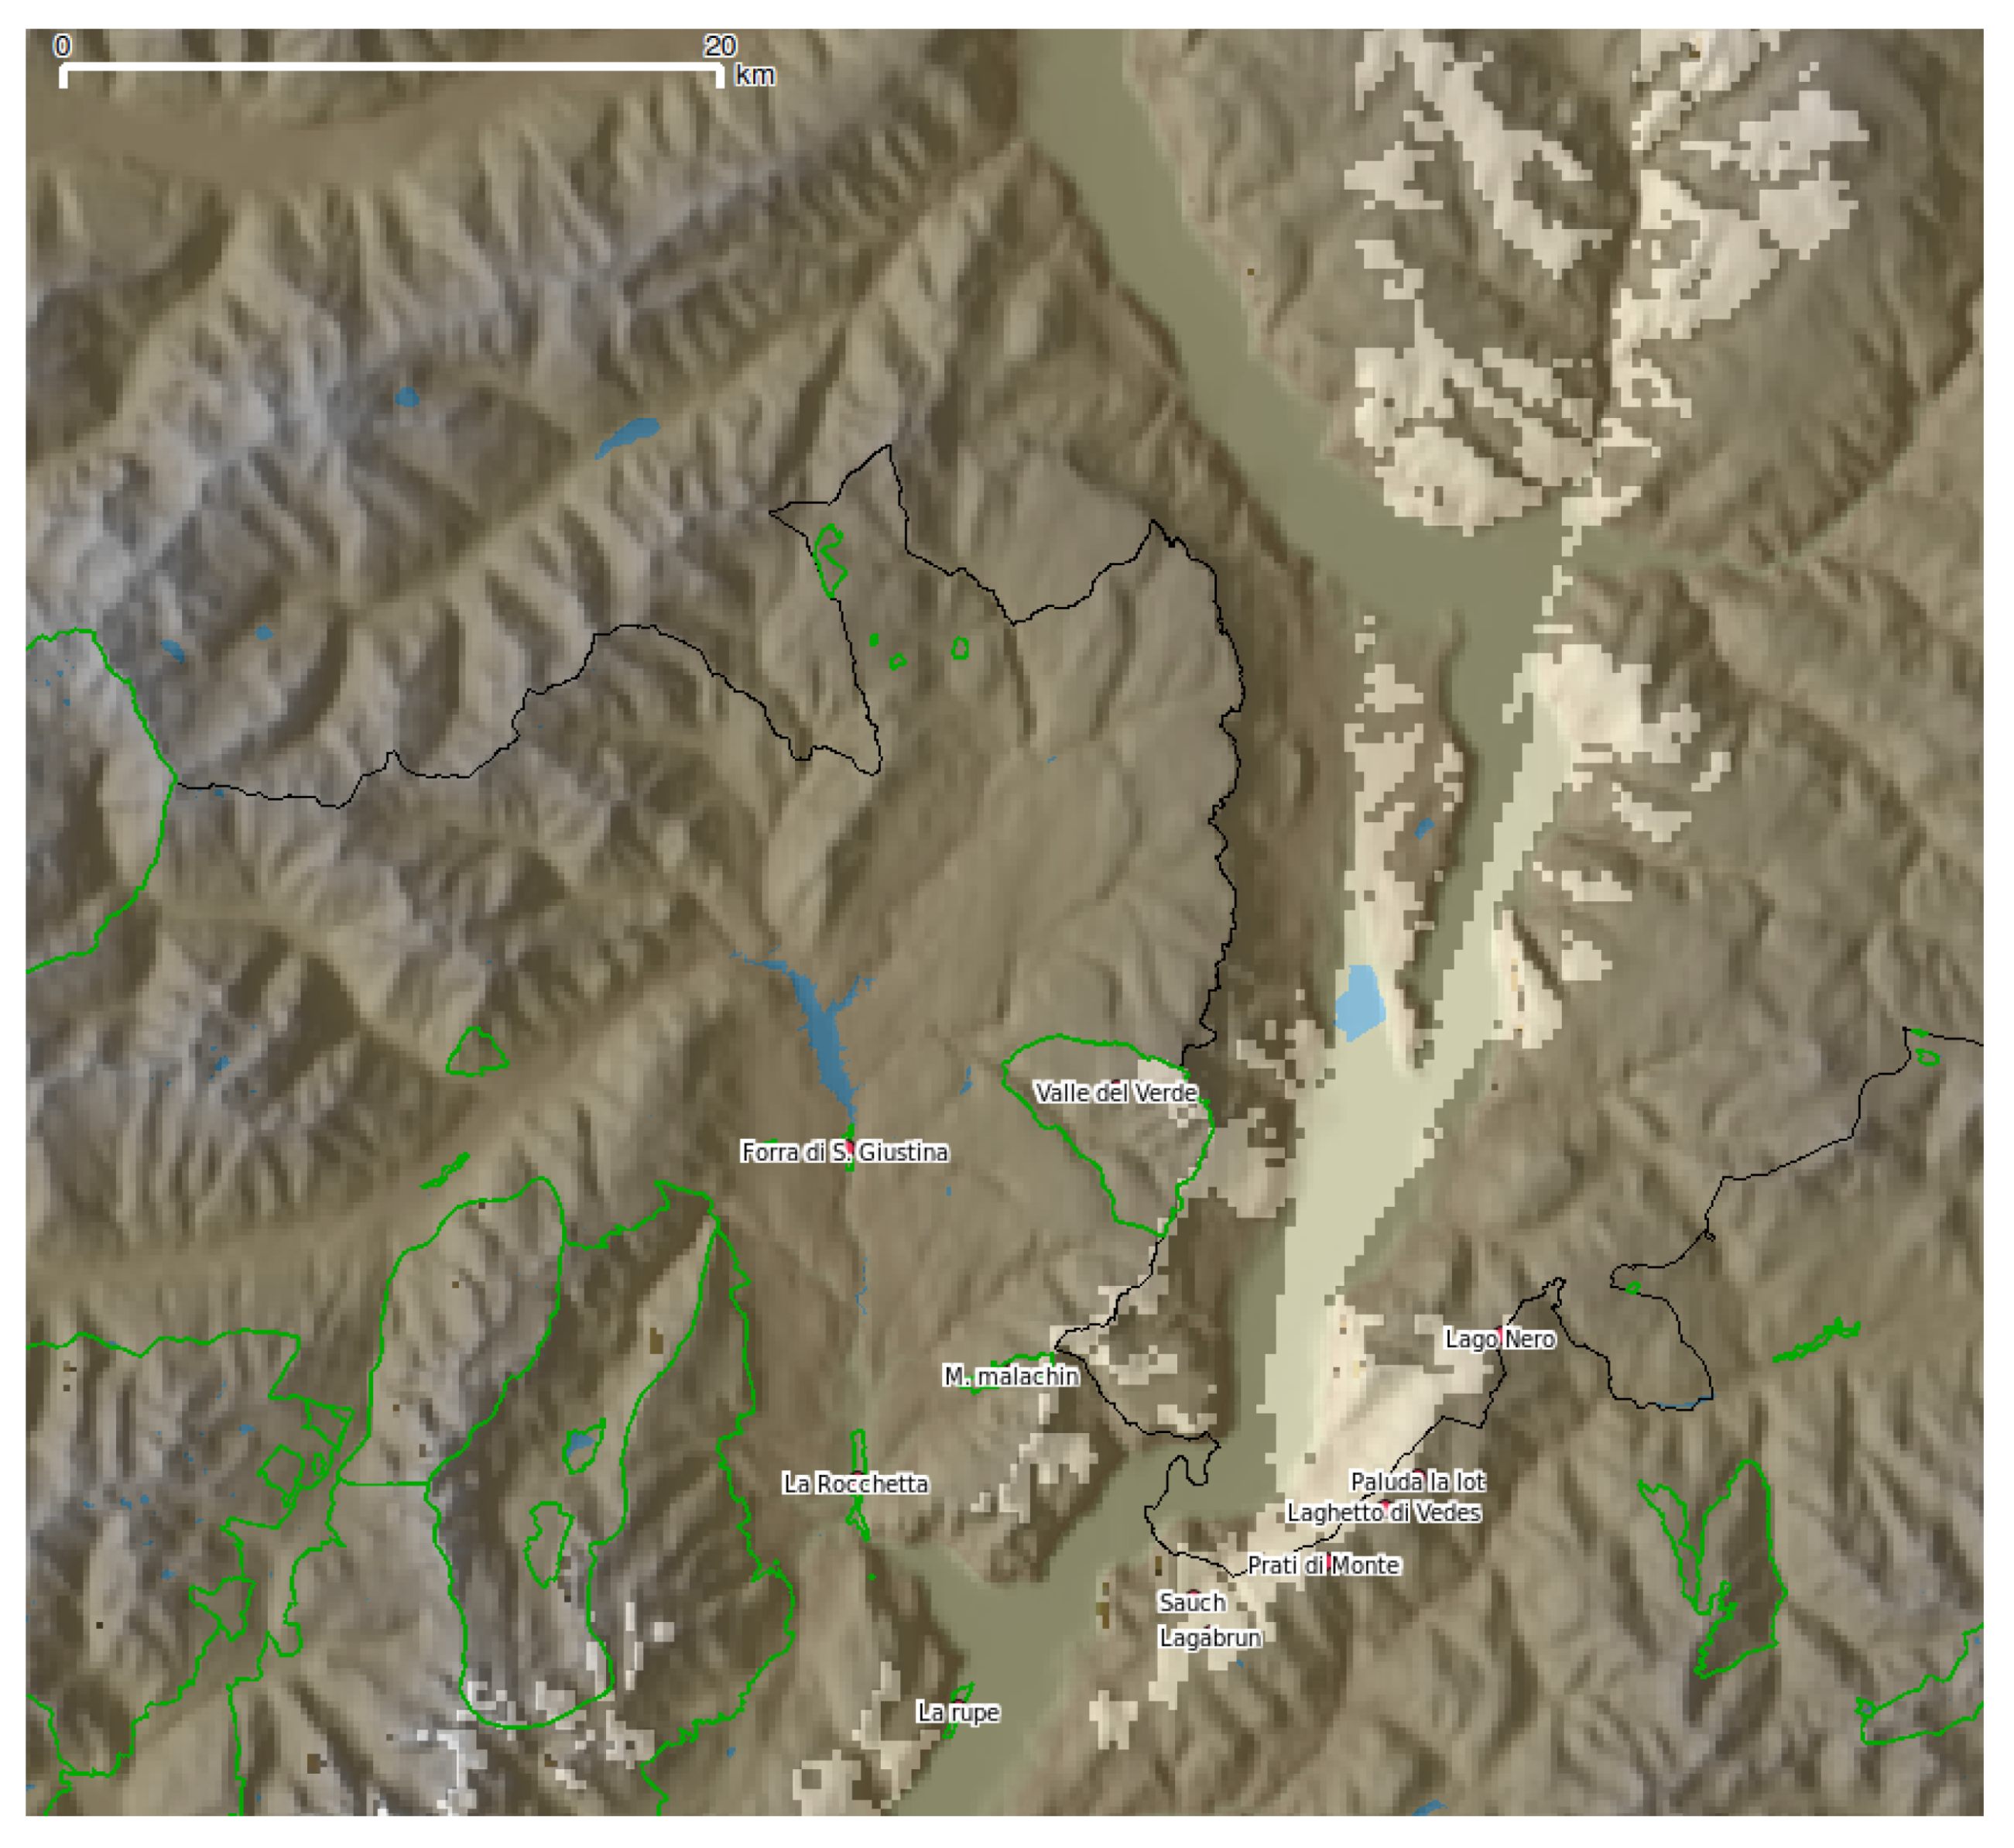
Along the Adige valley, some locations were chosen for the calculation of visibility, including known stopover and passing places and other intermediate points so that from every point the next was visible looking northward. This points are: Serravalle, at the narrowest part of the valley of the Adige; at the beginning of the valley (Valle Alto Adige); at the biotope valley of the Adige; near the city of Trento; at the biotope Foci dell’Avisio; and as Sauch, as shown on the map Figure 3 and also on the the maps of Figure 4, Figure 5, Figure 6, Figure 7, Figure 8 and Figure 9 where the results of the visibility calculated for each point on the route to a flight altitude of 700 m are displayed in sequence.
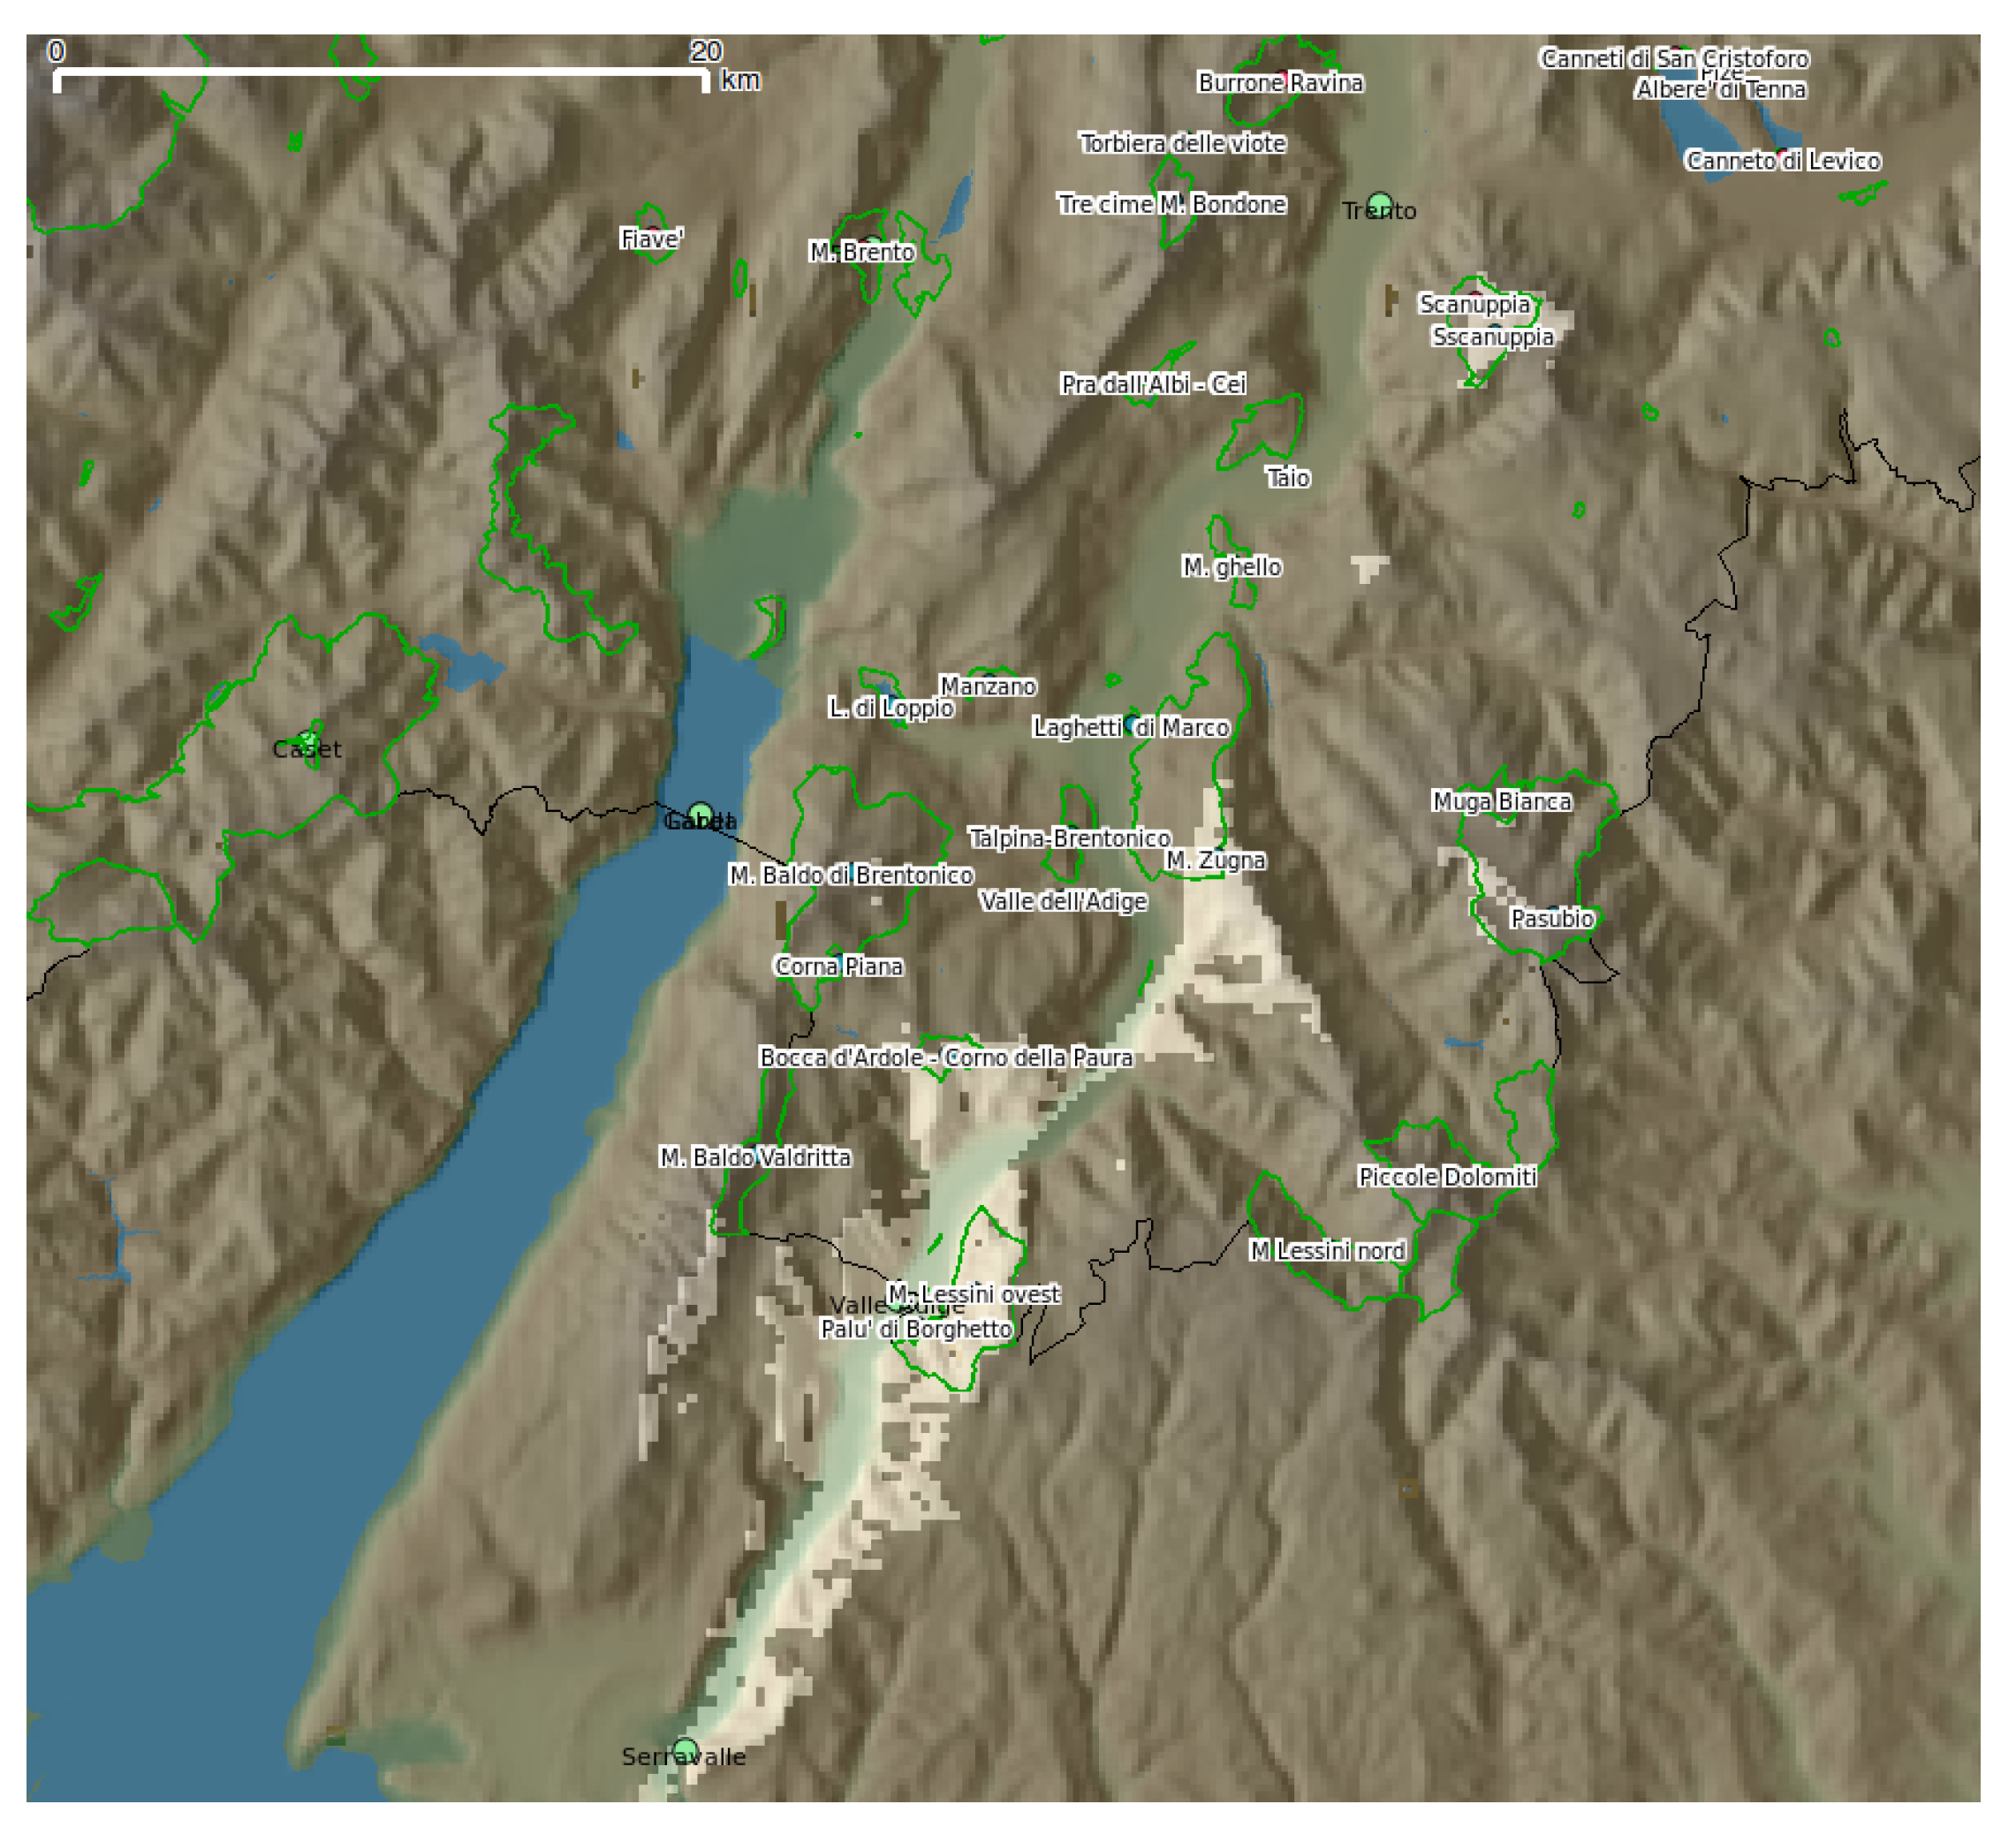
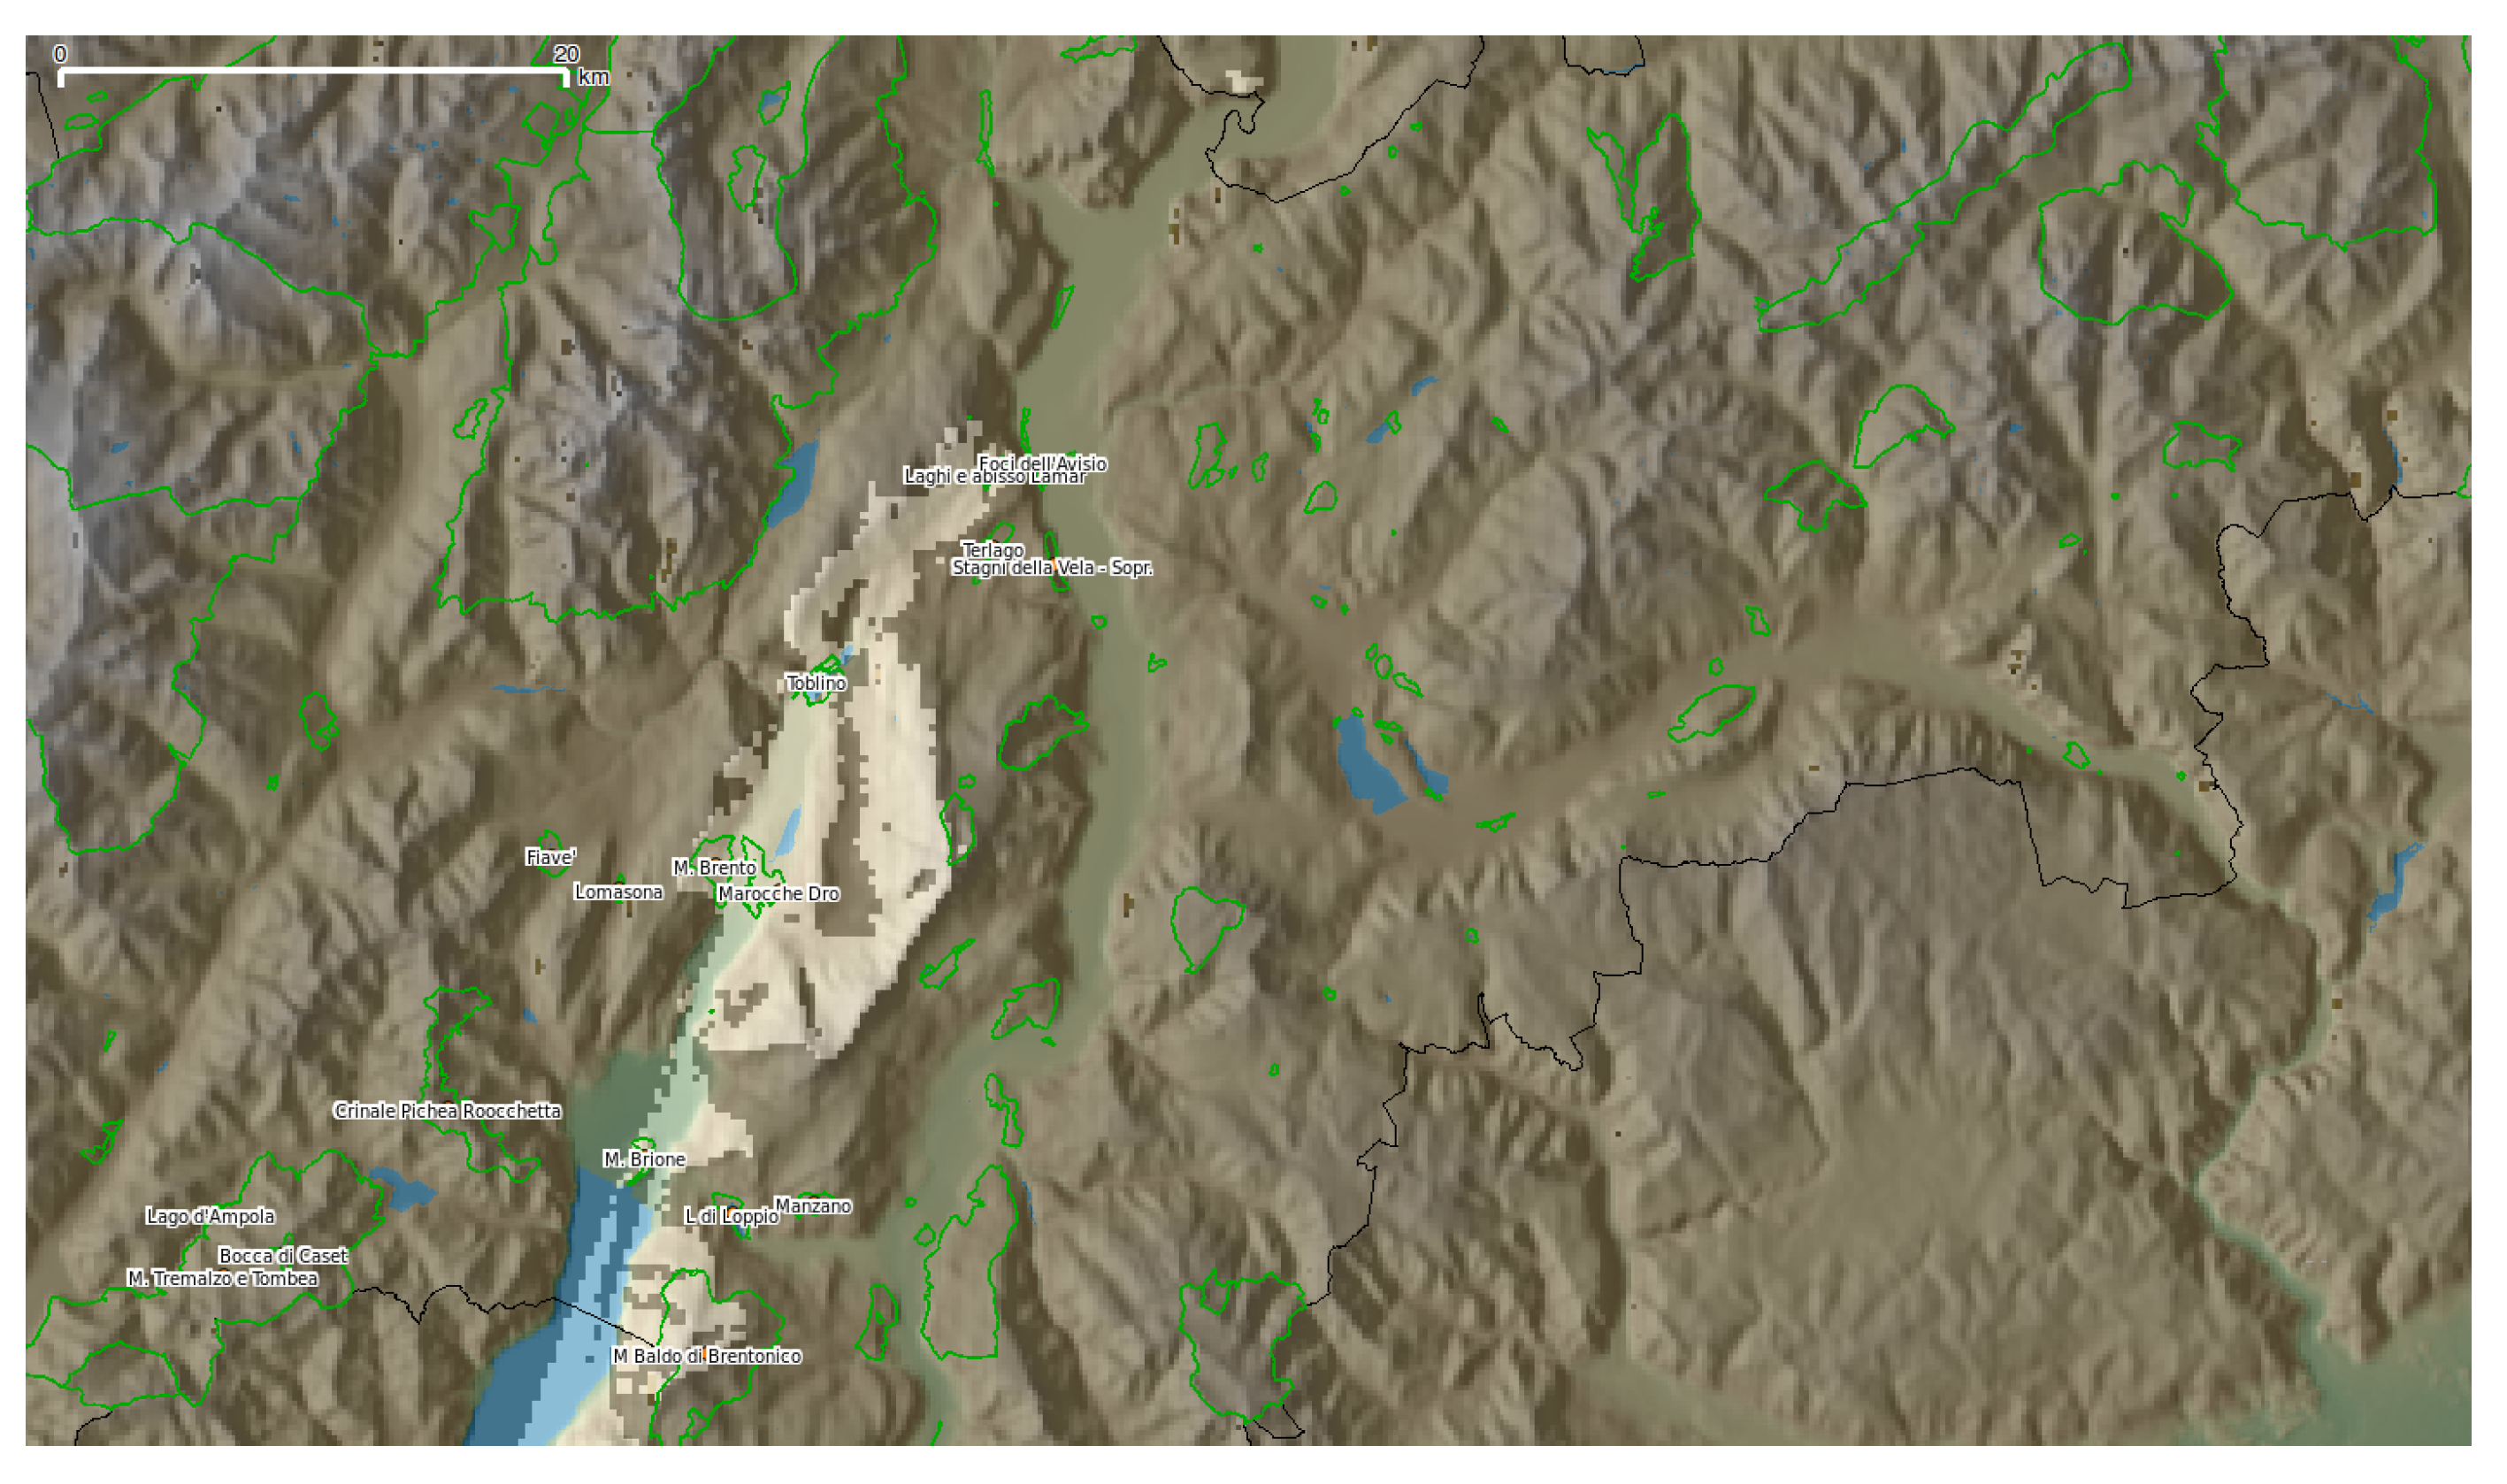
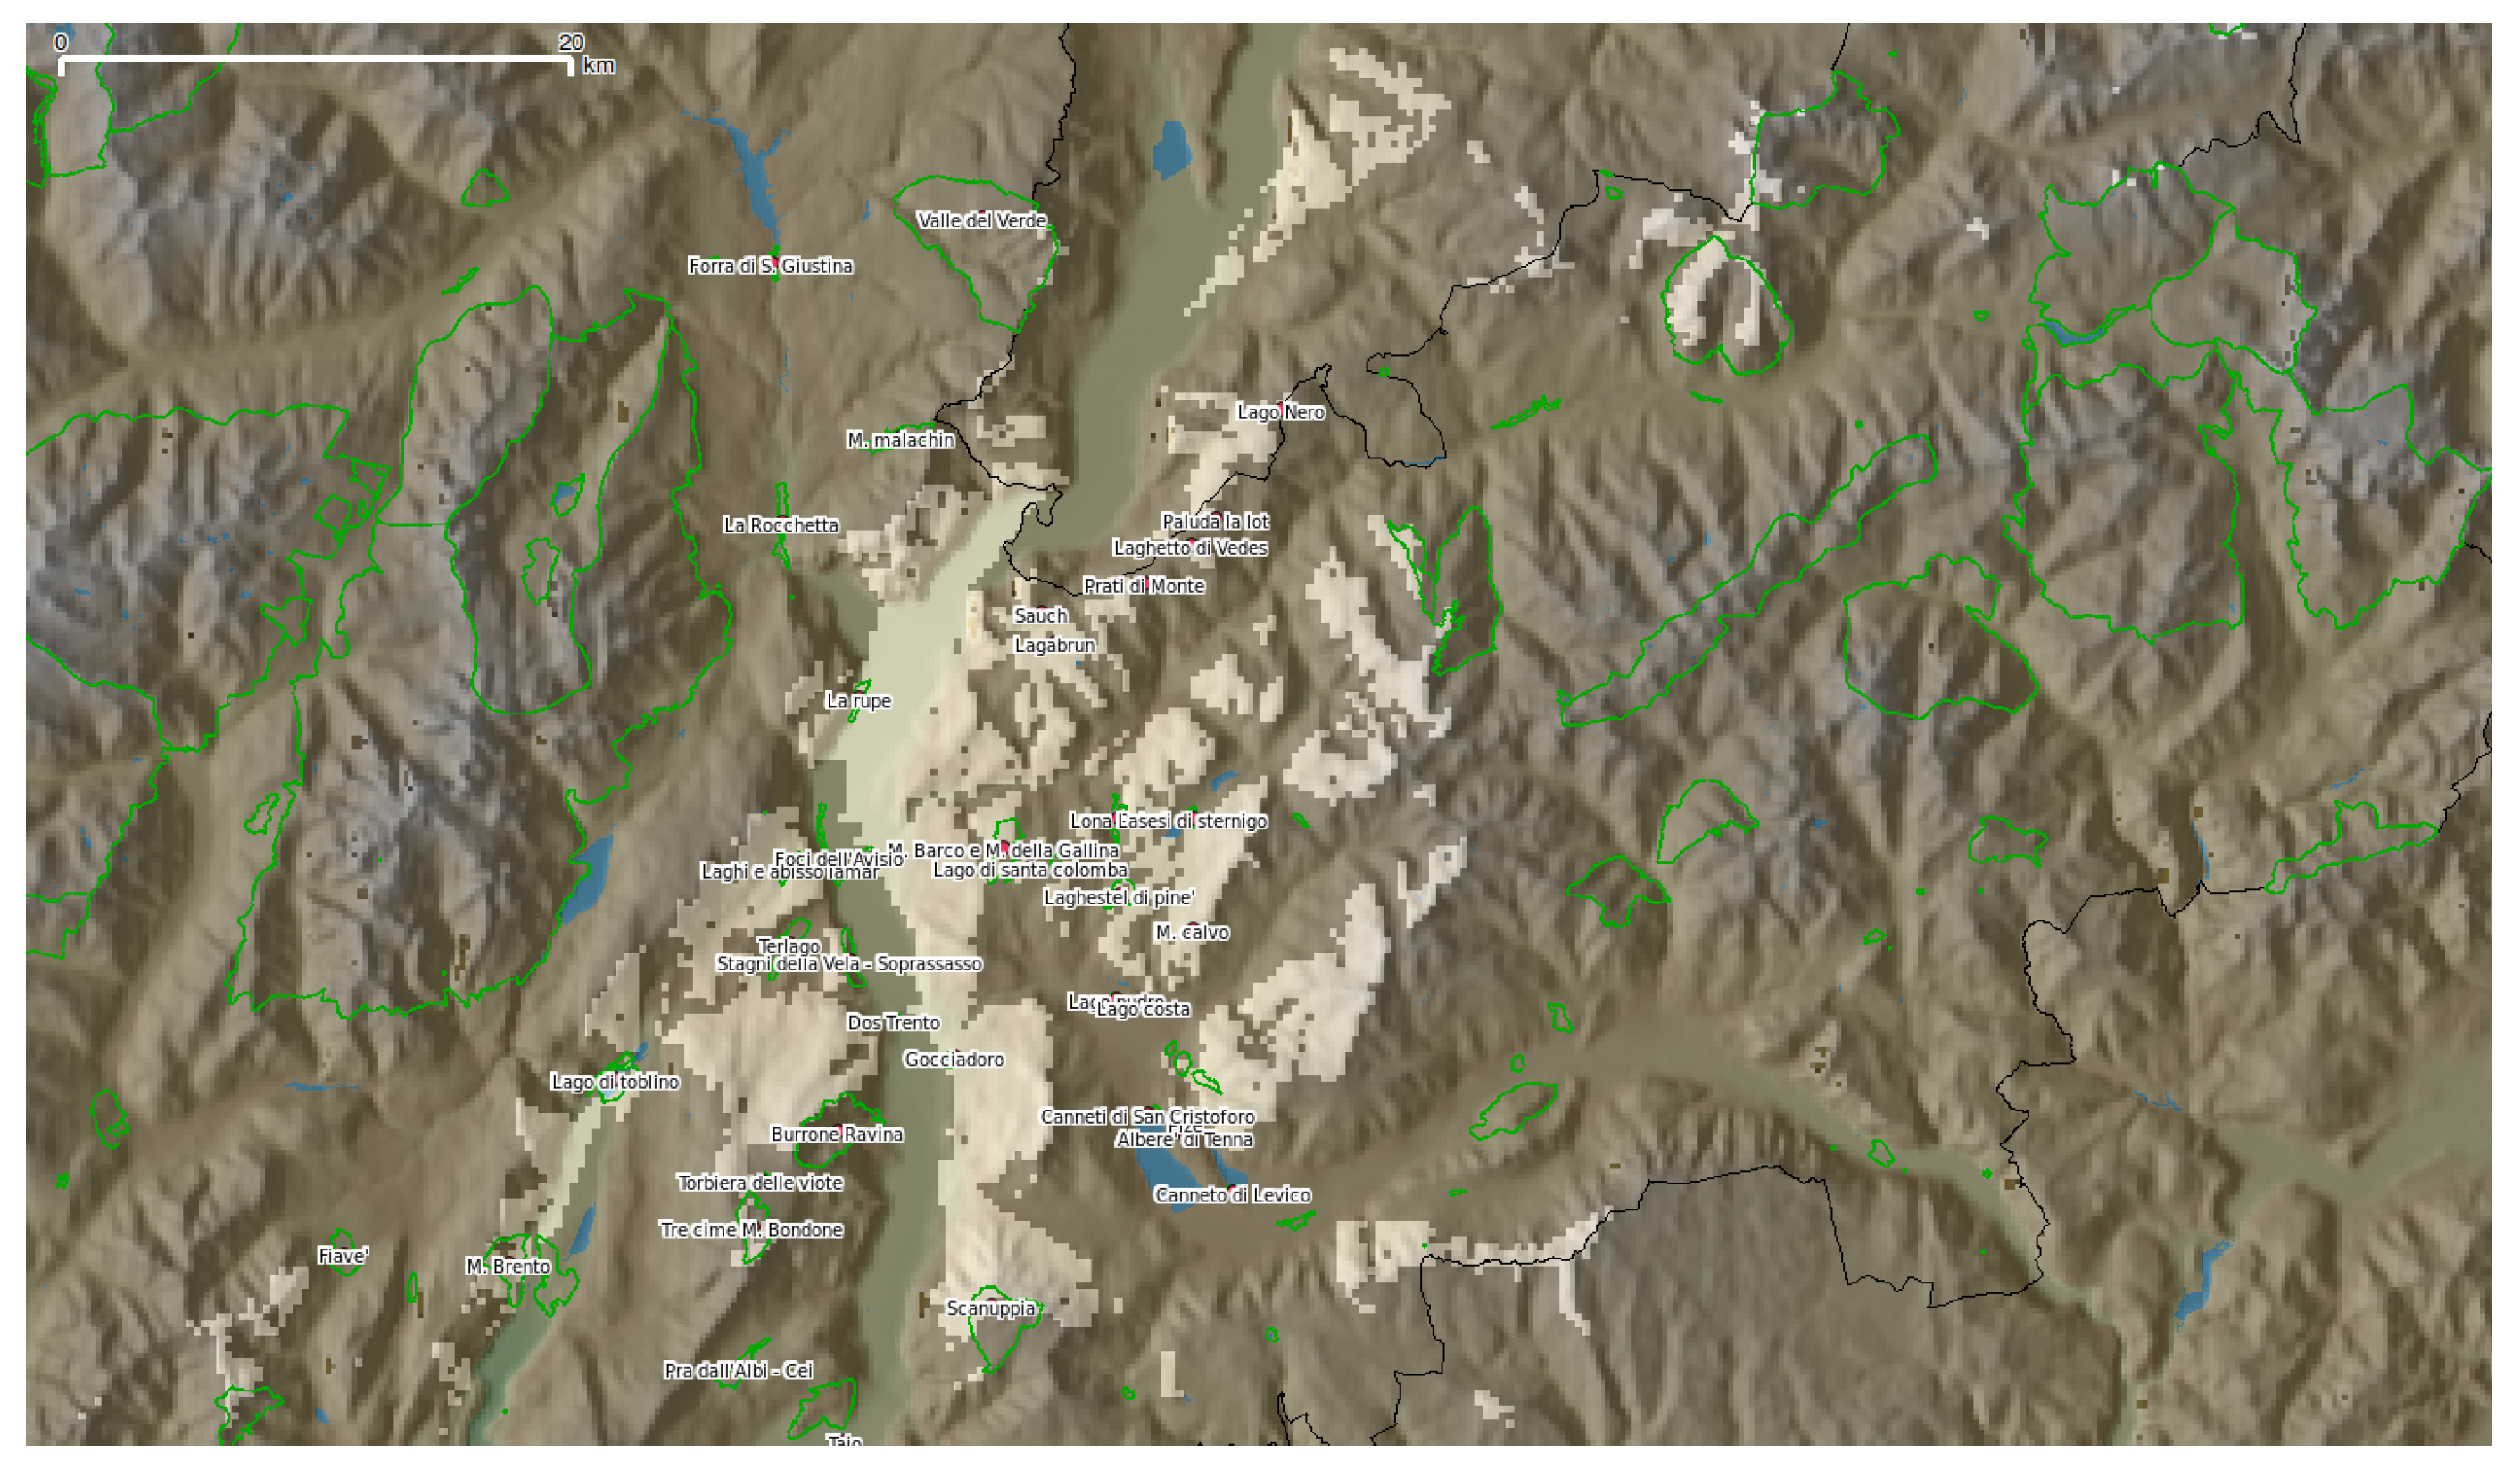
In each image, the boundaries of the Natura2000 network and the names of the SCI and SPA nearest to the visible route are shown on top of the digital terrain model. The visible area appears lighter in color than the rest of the map, as if it were sunny and the rest of the map were in the dark. The algorithm calculates the visibility in all directions, thus in the figures also the area at the south of the point of interest is illuminated, although in the hypothesis the shift is northbound. With this mode of representation, the visible protected areas that are suitable to serve as stopover are highlighted. The Figures show how the view of a migratory bird changes along the route of the Adige valley, highlighting the areas of Natura2000 that gradually become visible. From Serravalle, visibility can reach more than 20 km along the valley, including the SPAs Val d’Adige, Palu di Borghetto, and Corno della Paura, and the SCI Valdritta of Monte Baldo and of Monti Lessini. From the next point along the Adige valley, the field of view is more limited but once reaching the biotope Valle dell’Adige it opens again and it is possible to see again for more than 20 km to the north, until the three peaks of Bondone.
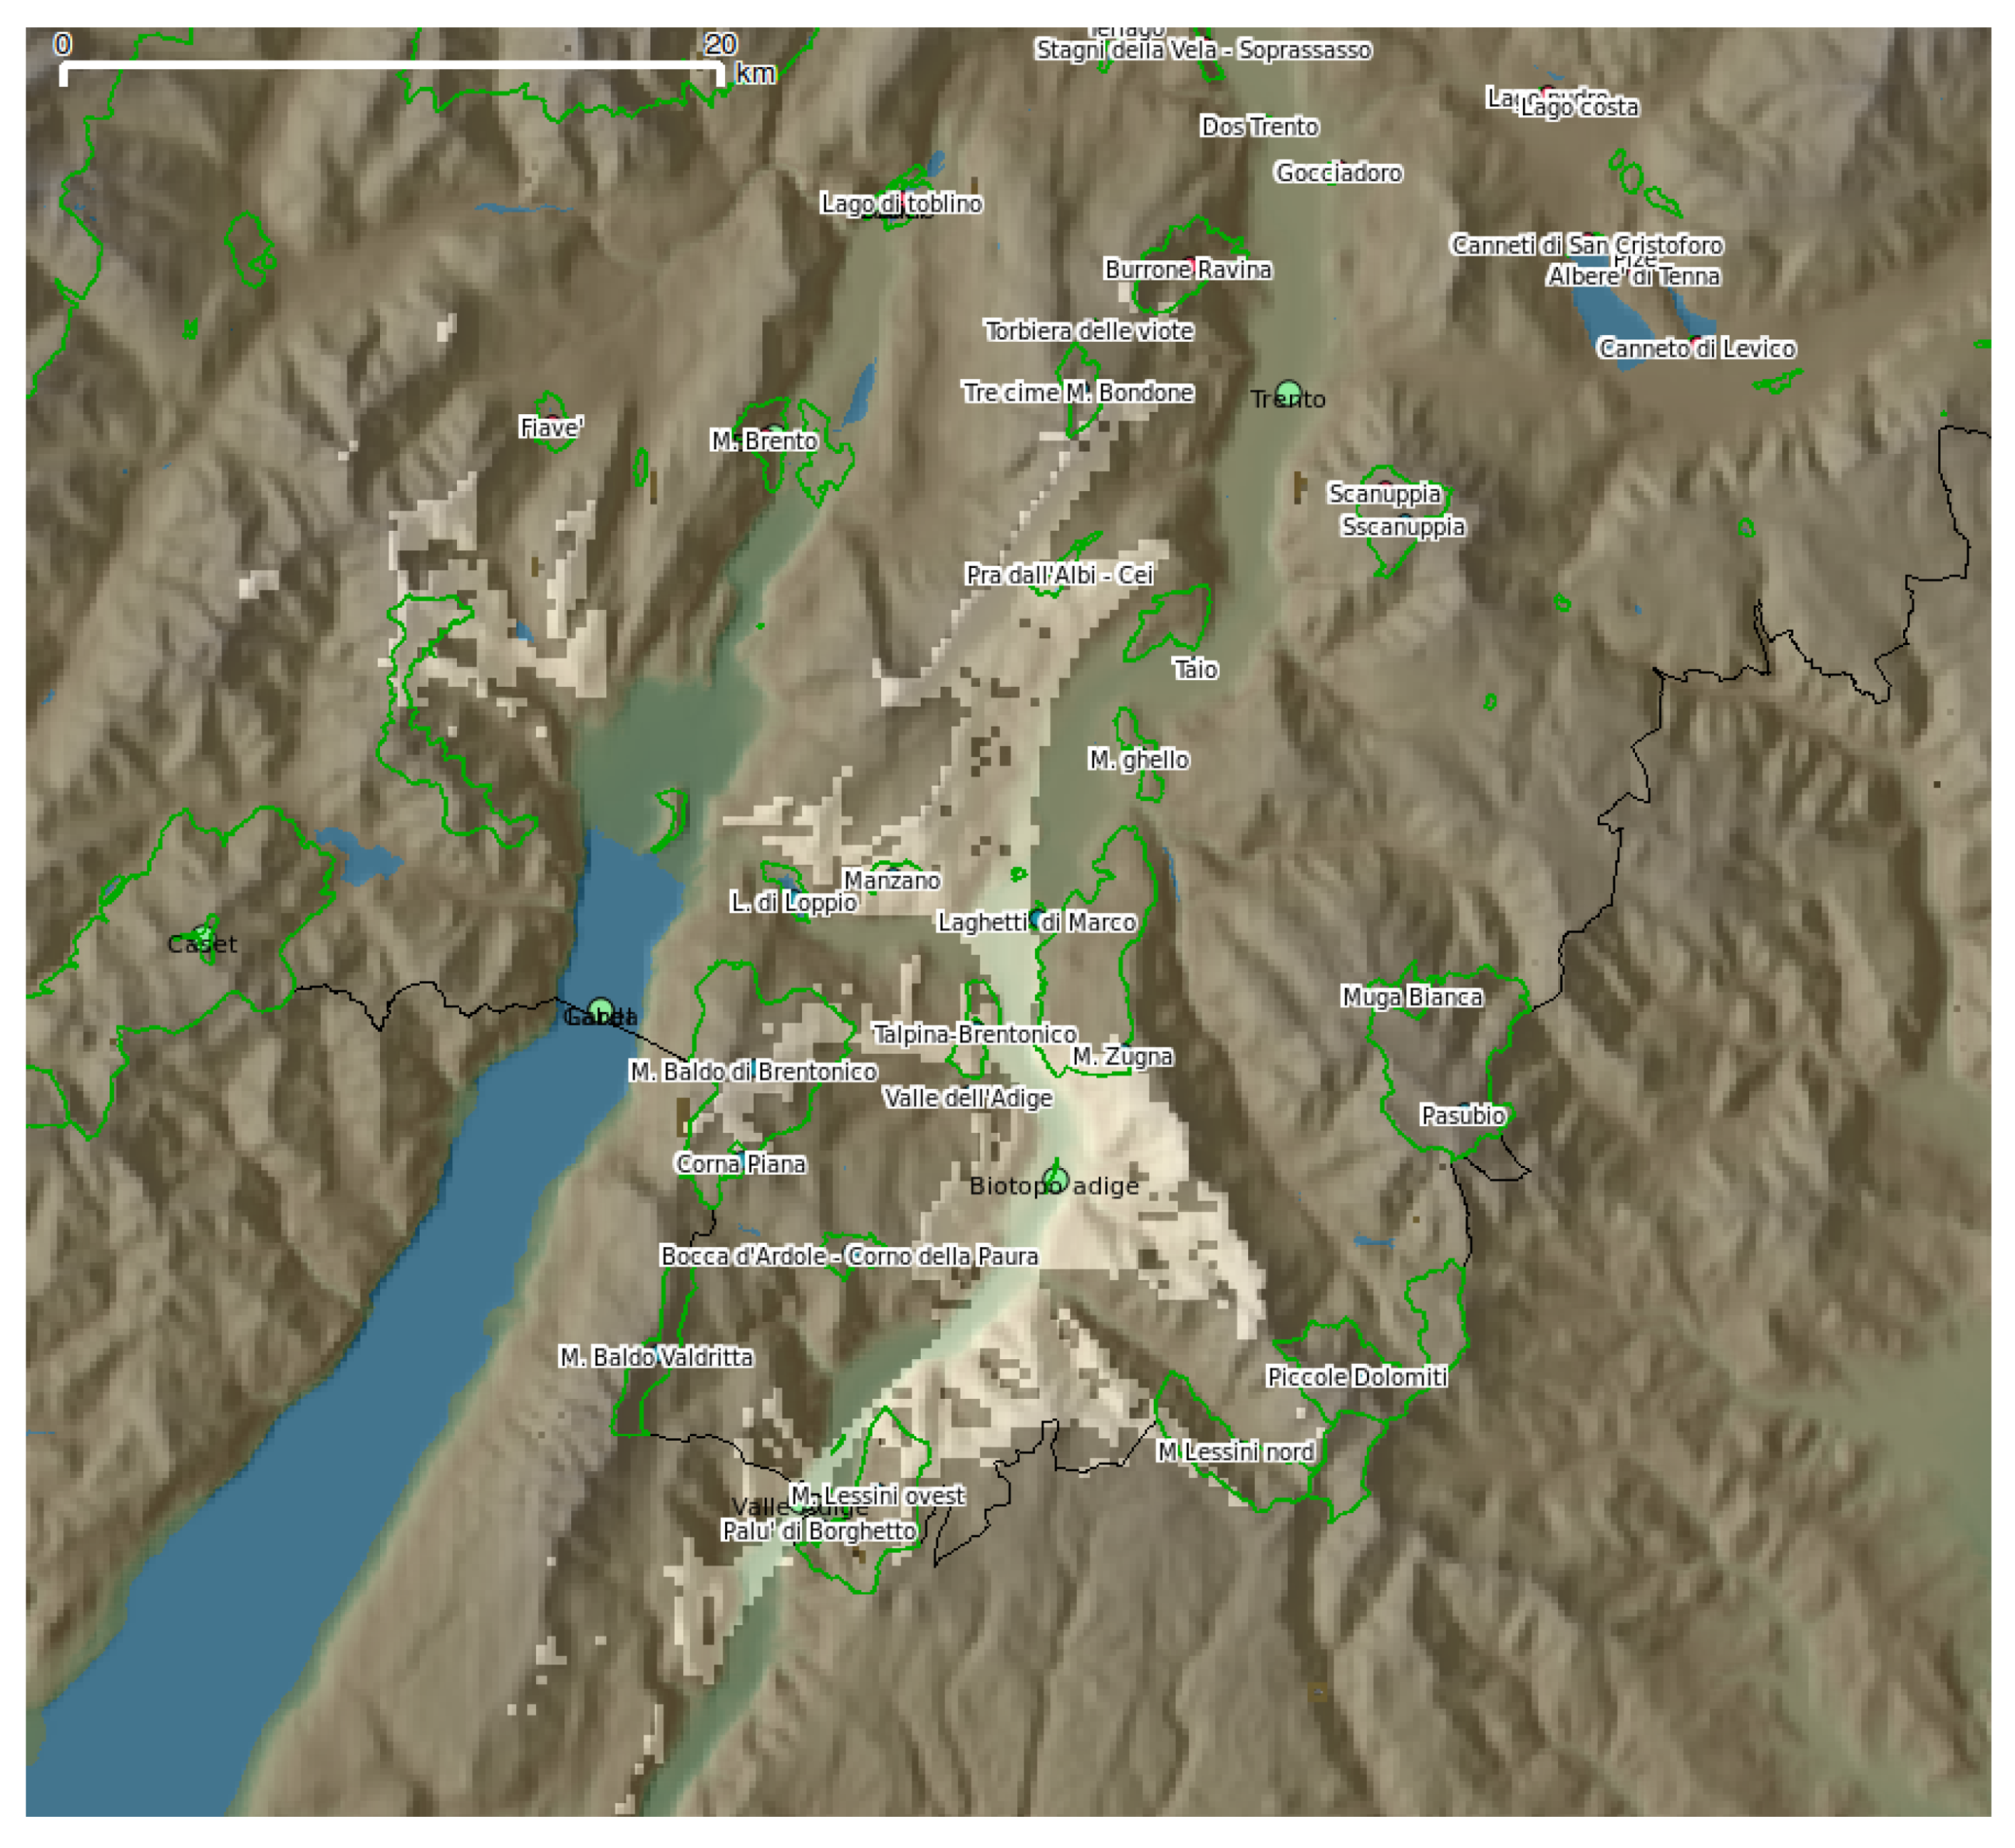
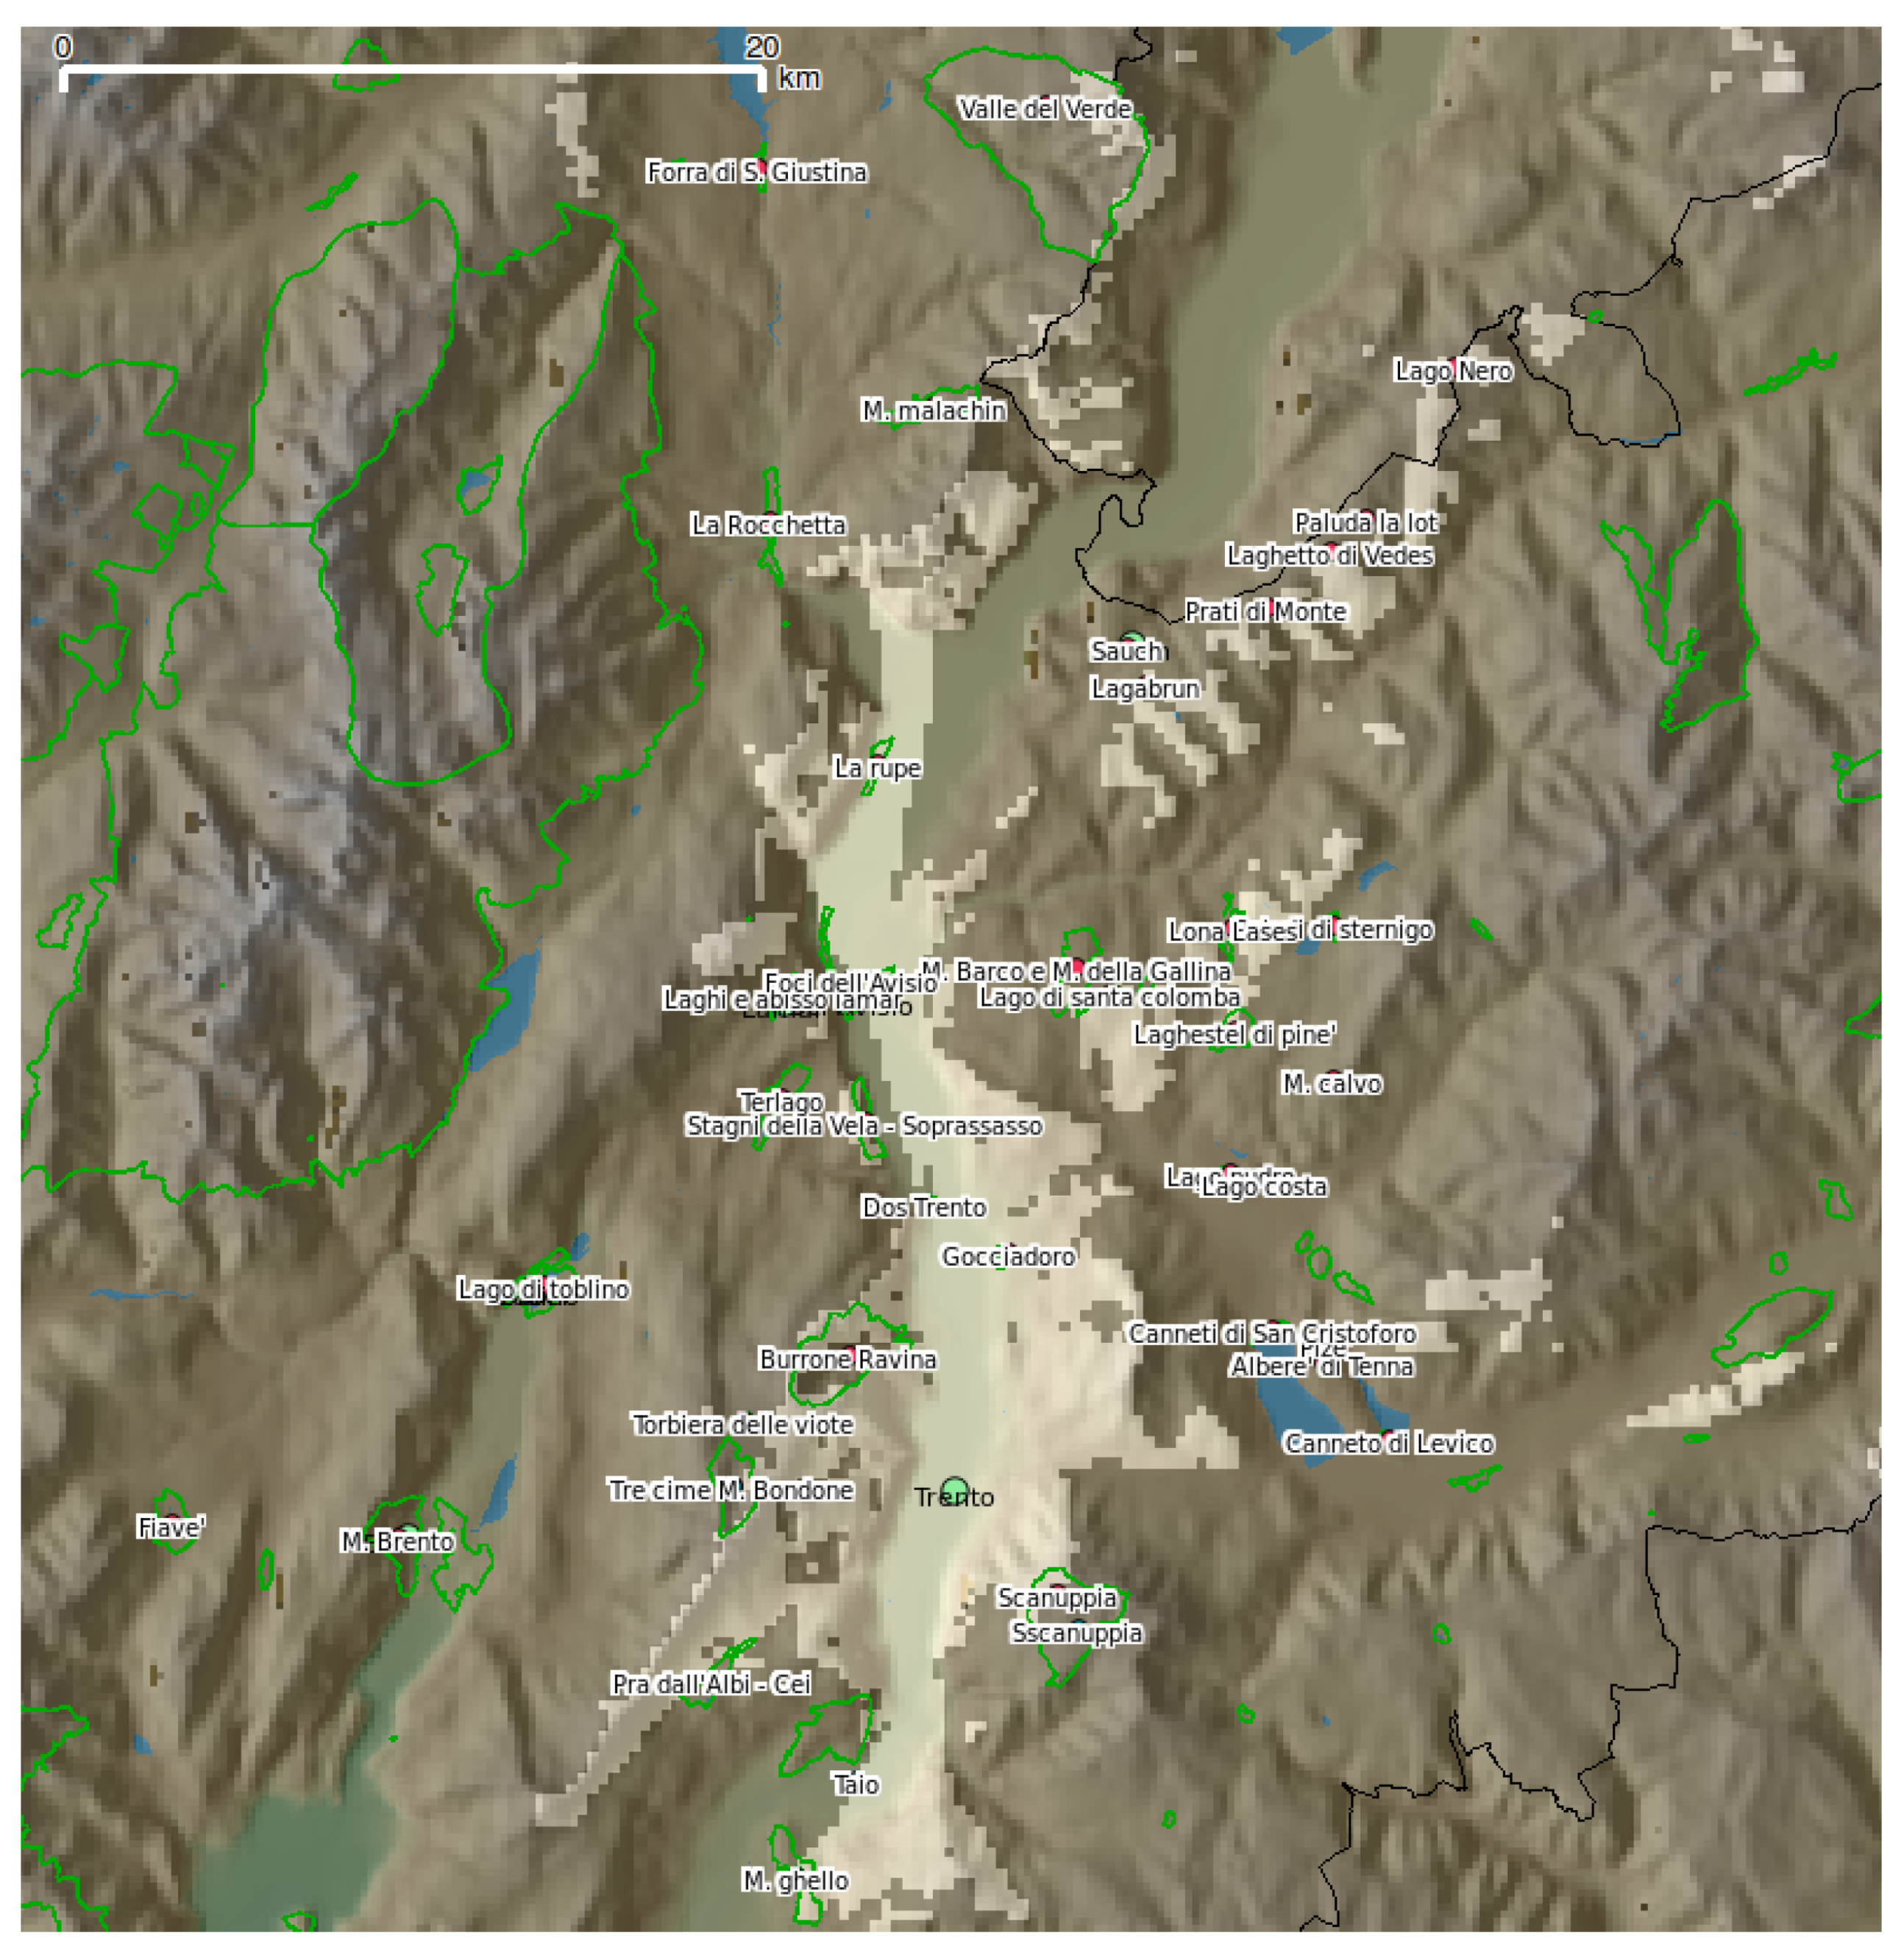
Once the bird arrives near Mount Ghello or Cei Lake, the hypothetical migrant can see up to the next point of the route, the city of Trento. Near Trento ( Figure 7), the visibility is very broad and includes various SCIs and SPAs. Continuing towards the mouth of the creek Avisio, the birds can see the Valle dei Laghi and 15 km north along the Adige, where the pass of Roccolo of Sauch is visible. It is interesting to note that the Rocchetta biotope remains hidden from the mountains even if lays a little more than 10 km as the crow flies.
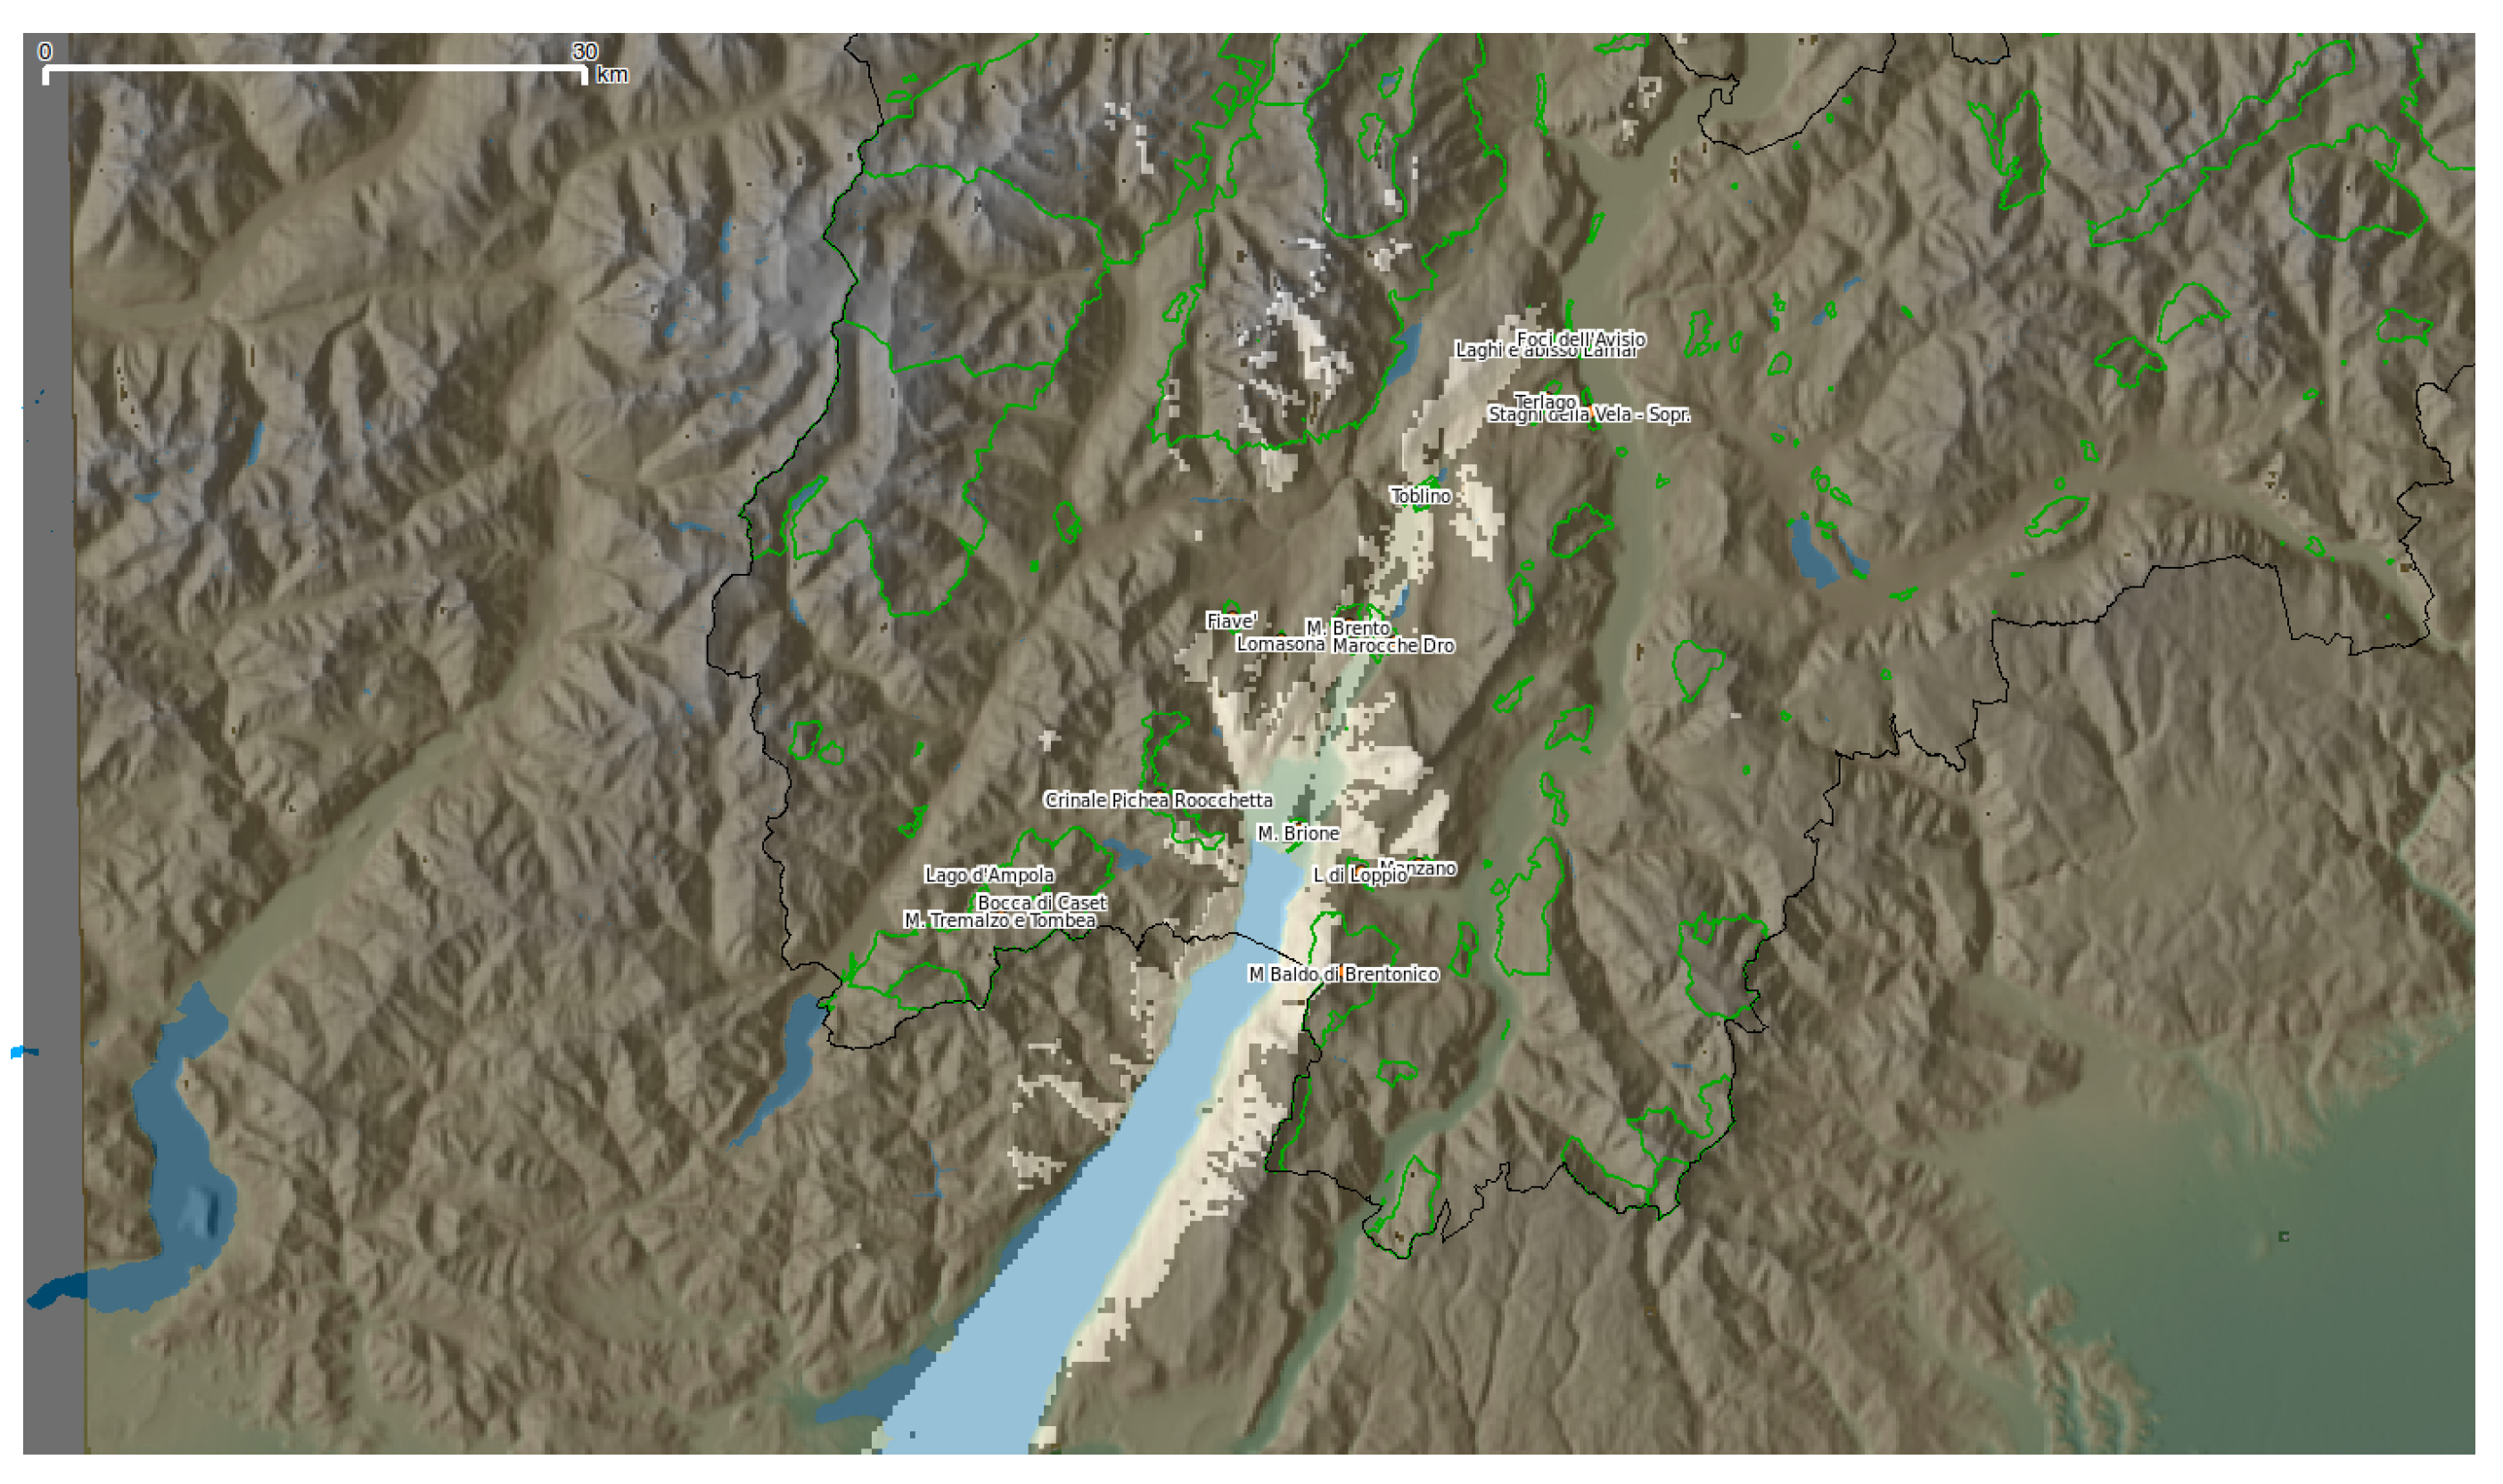
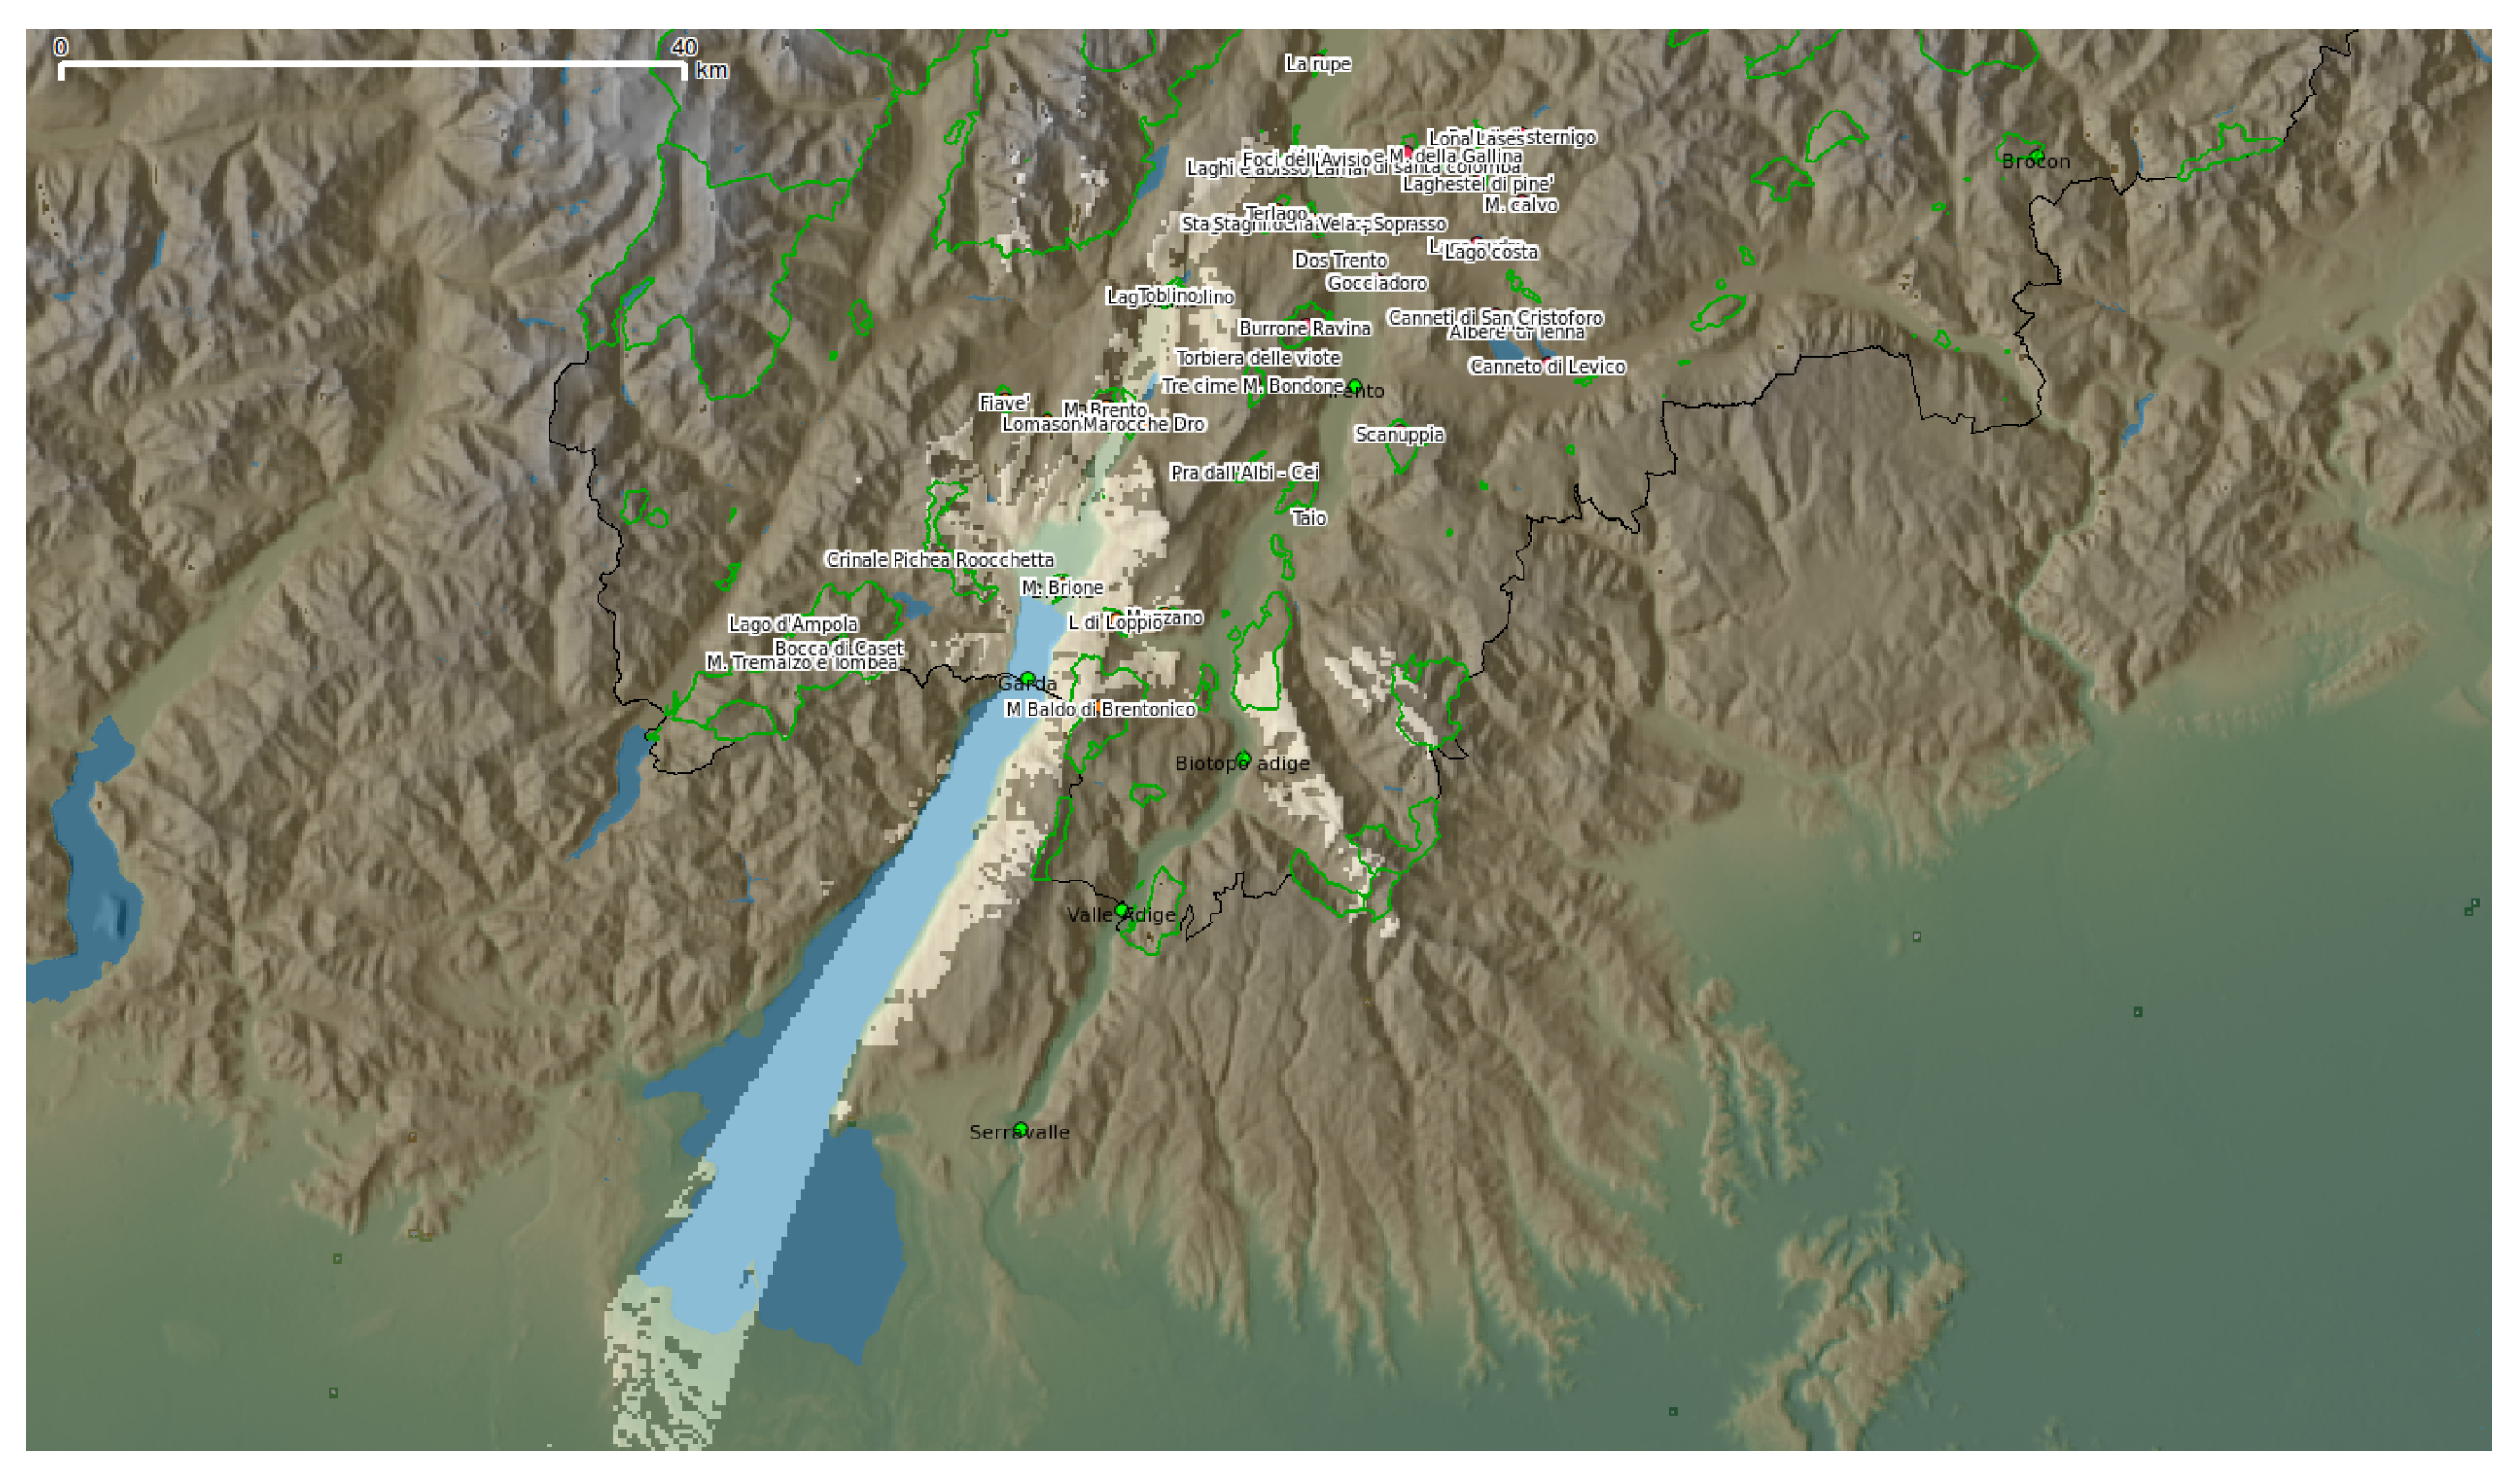
Similarly, we chose some intermediate points along the route that follows the Garda Lake: at the end of Lake Garda; near Mount Brione; the SCI of Mount Brento; Lake Toblino and lakes of Lamar, after which the Garda route is grafted onto the Adige one at the mouth of the Avisio (see the map of Figure 3). The figures show how the view of a migratory bird changes along the Garda and valley of lakes routes and how some Natura2000 protected areas gradually become visible. A migrant who enters the valley of Lake Garda in a clear day has a considerable visibility, from moraine hills to the south of the lake he can see for nearly 50 km, until the end of Valle dei Laghi. The valley appear as a long narrow hallway that penetrates through the mountains to the northeast. From the end of the lake, where the territory of the study area begins (Figure 10, Figure 11, Figure 12 and Figure 13), a set of protected areas interested by the passage of migration are visible: Mount Brione, Crinale Piche Rocchetta, part of Mount Baldo of Brentonico, the marocche Dro, and Lake Toblino.
From this late point, as well as from the subsequent ones, the possible stopovers Lomasona and the Fiavè bog are hidden from view. These environments, in particular Fiavè, are considered to be potentially suitable for the rest of the birds; however, previous studies [20] showed that in reality the bog is relatively little used by migratory birds, especially at long range migrants.
Amato and Pedrini (1997) suggested that the lack of presence of migratory birds in Fiavè may be related to the particularly cold micro-climate, and they also suggested that visibility could play an unexpected role. Our analysis strengthens that suggestion: a bird tries to move to the breeding sites as quickly as possible and cannot afford to explore hidden areas in search of places to stop, seeking to exploit those stopovers that minimize the deviations from the principal direction. Until Lake Toblino, the hypothetical migratory bird is channeled between the walls of the Valley of the Lakes, but once it reaches the area of Lamar, the view expands across the valley, from where it can continue north or stop at mouth of Avisio or the Rocchetta biotope. The series of Figure 10, Figure 11, Figure 12 and Figure 13 report the results of the visibility for each of the selected point along the Garda route, at flight altitude of 700 m.
4. Discussion
Besides the itinerary chosen by the birds, migration is affected by nutritional needs [6] and other factors such as weather conditions [32], the place of origin and destination [33], and the visibility, especially in the alpine environment. We tested whether there were routes along which birds can see at greater distances, and if there are visible stopover places. The sites of Natura2000 network can provide good stopover sites for migratory birds, as they are rich in plants that attract insects and produce berries during the migratory period [6]. The least cost analysis of northbound routes yielded two main paths for the migration of low and high altitude, in accordance with the field observations of Pedrini [34].
The data from the captures at the ringing stations suggest that the most used routes could be the path minimizing elevation gaps as the highest number of birds are captured along this flyway. In addition, the visibility analysis highlighted the sites belonging to the Natura2000 network that were visible to the birds moving along the main flyway, and therefore the area more probably used as stopover places because they allow small deviations from the direction toward the nesting places. The birds probably also stop in non-protected areas that deserve to be investigated. The majority of Natura2000 sites were not visible from the simulated flyways. This is not unexpected because some of these sites do not have the ideal stopover environment: Natura2000 sites also include habitat types such as glaciers or rock formations that are not optimal for migrant birds. The 56 visible SPA and SCI include wetlands, bogs, and lakes; have vegetation offering shelter; and food is present [6].
This calculation taking into account the three-dimensional aspects of the area confirmed the importance of certain places such as the mouth Avisio creek [31,35], which are located at the crossroads of two of the routes identified and are also visible from a considerable distance. Other areas, such as the bog Fiavè, despite being considered a suitable stopover site for its high ecologic value, is not visible from the flyway and this can explain the lower rate of capture of migratory birds [20]. To make more in-depth considerations, in future studies, it would be useful to consider the direction of winds and the possibility to place nets in those areas located in areas that are visible but were not previously investigated.
The conservation and management of stopover sites that can provide energy resources for migratory step is of particular importance for the protection of migration [36]. The results of this work provide very detailed suggestions regarding the location of suitable stopover sites. Smith et al. (2007) suggested a management of stopover areas which also includes vast bushy areas able to provide a suitable habitat for insects, and the Natura2000 sites provide a good vegetation coverage [6]. The protection of plant diversity has a positive role in supporting the richness of invertebrates, which can support birds during migration.
5. Conclusions
In this study, geomatics allowed quantifying and confirming for the first time the hypothesis that there is a connection between visibility and stopover frequentation.
This study explained some field observations with respect to visibility and can provide information to develop further studies and identify priority areas for conservation. Mapping migration flyways can also provide useful information for decision-making processes and in environmental assessment for infrastructures, especially wind farms.
This kind of analysis could help to concentrate the efforts to conserve the more visible stopovers or to decide what to do to make some stopovers more visible. It can also be useful both in well known areas (to compare ringing station results and visibility) as well as in areas where data are scarce or absent to create a general idea of the more suitable stopovers. The superposition of visibility with floristic richness and fruit availability could help to extract more information for further analysis. We encourage the use of the same method in other study areas.
Author Contributions
Both authors contributed equally to this work.
Funding
A preliminary study on this topic, limited to Trento area, was funded to CT as a consultancy for Museo Tridentino di Scienze Naturali, N 1273/C-8. This research received no other external funding.
Acknowledgments
The authors wish to thank all the volunteers at the ringing stations mentioned in the paper especially Francesca Rossi. Sandro Brugnoli helped getting started and inspired by lending to CT his personal books and suggesting further reading. Enrico Rossi dug into the MUSE underground archives and extracted useful reports and data.
Conflicts of Interest
The authors declare no conflict of interest. The funders had no role in the design of the study; in the collection, analyses, or interpretation of data; in the writing of the manuscript, or in the decision to publish the results.
Abbreviations
The following abbreviations are used in this manuscript:
| CEA | Centre for Alpine Ecology |
| GIS | Geographic Information Systems |
| ISPRA | Italian institute for environmental protection and research |
| PAT | Autonomous Province of Trento |
| SCI | Sites of Community Importance |
| SPA | Special Protection Areas |
| SPP | Shortest path problem |
References
- Berthold, P. Bird Migration: A General Survey; Oxford University Press: New York, NY, USA, 2001. [Google Scholar]
- Dorst, J. Le Migrazioni Degli Uccelli; Editoriale Olimpia: Firenze, Italy, 1976. [Google Scholar]
- Sapir, N.; Abramsky, Z.; Shochat, E.; Izhaki, I. Scale-dependent habitat selection in migratory frugivorous passerines. Naturwissenschaften 2004, 91, 544–547. [Google Scholar] [CrossRef]
- Bruderer, B.; Jenni, L. Strategies of bird migration in the area of the Alps. In Proceedings of the 19th Congr International Ornithol, Ottawa, ON, Canada, 22–29 June 1986; pp. 2150–2161. [Google Scholar]
- Bruderer, B.; Jenni, L. Migration Across the Alps. In Bird Migration; Gwinner, E., Ed.; Springer: Berlin/Heidelberg, Germany, 1990; pp. 60–77. [Google Scholar]
- Tattoni, C.; Soardi, E.; Prosser, F.; Odasso, M.; Zatelli, P.; Ciolli, M. Fruit availability for migratory birds: A GIS approach. Peerj 2019, 7. [Google Scholar] [CrossRef]
- Åkesson, S.; Walinder, G.; Karlsson, L.; Ehnbom, S. Reed warbler orientation: Initiation of nocturnal migratory flights in relation to visibility of celestial cues at dusk. Anim. Behav. 2001, 61, 181–189. [Google Scholar] [CrossRef]
- Becciu, P.; Menz, M.H.; Aurbach, A.; Cabrera-Cruz, S.A.; Wainwright, C.E.; Scacco, M.; Ciach, M.; Pettersson, L.B.; Maggini, I.; Arroyo, G.M.; et al. Environmental effects on flying migrants revealed by radar. Ecography 2019, 42, 942–955. [Google Scholar] [CrossRef]
- Daskin, M. Network and Discrete Location: Models, Algorithms, and Applications; Wiley: New York, NY, USA, 1995. [Google Scholar]
- Longley, P.; Goodchild, M.F.; Maguire, D.J.; Rhind, D. Geographical Information Systems and Science, 2nd ed.; Wiley: Chichester, UK, 2005. [Google Scholar]
- Downs, J.A.; Horner, M.W. Spatially modelling pathways of migratory birds for nature reserve site selection. Int. J. Geogr. Inf. Sci. 2008, 22, 687–702. [Google Scholar] [CrossRef]
- Ciolli, M.; Tattoni, C.; Ferretti, F. Understanding Forest Changes to Support Planning: A Fine-Scale Markov Chain Approach. Dev. Environ. Model. 2012, 25, 355–373. [Google Scholar]
- Ferretti, F.; Sboarina, C.; Tattoni, C.; Vitti, A.; Zatelli, P.; Geri, F.; Pompei, E.; Ciolli, M.; Ferretti, F.; Sboarina, C.; et al. The 1936 Italian Kingdom Forest Map reviewed: A dataset for landscape and ecological research. Ann. Silvic. Res. 2018, 42, 3–19. [Google Scholar] [CrossRef]
- Pedrini, P.; Rossi, F.; Rizzolli, F.; Spina, F. Le Alpi italiane quale barriera ecologica nel corso della migrazione post-riproduttiva attraverso l’Europa: Risultati generali della prima fase del Progetto Alpi (1997–2002). Biol. E Conserv. Della Fauna 2008, 116, 1–336. (In Italian) [Google Scholar]
- Odasso, M. I tipi forestali del trentino. Rep. Del Cent. Di Ecol. Alp. 2002, 192. (In Italian) [Google Scholar]
- Del Favero, R. Biodiversità e Indicatori nei tipi Forestali del Veneto[Biodiversity and Indicators for the Forest Types of Veneto Region]; Regione Veneto, Direzione Regionale dell’Economia Montana e delle Foreste, Mestre: Venezia, Italy, 2000; p. 335. (In Italian) [Google Scholar]
- Tipologie Forestali dell’Alto Adige. Tipi Forestali, Regioni Forestali, Chiave dei tipi Forestali. Available online: http://www.provincia.bz.it/agricoltura-foreste/bosco-legno-malghe/downloads/Tipologie_forestali_Volume_1.pdf (accessed on 27 November 2019). (In Italian).
- Amato, S.; Pedrini, P. Le migrazioni degli uccelli atttraverso le Alpi centro-meridionali Attività svolta nel 1993. Rep. Del Cent. Di Ecol. Alp. 1995, 2, 1–24. [Google Scholar]
- Amato, S. Stazione fissa di cattura e inanellamento “Roccolo del Sauch” (Trentino): Attività svolta nell’anno 1993 “Roccolo del Sauch” catching and ringing migration station in Trentino: Activity carried on in the year 1993. Rep. Del Cent. Di Ecol. Alp. 1995, 2, 25–47. [Google Scholar]
- Amato, S.; Pedrini, P. La migrazione primaverile degli uccelli attraverso il Trentino Spring migration of birds across Trentino (Northern Italy). Rep. Del Cent. Di Ecol. Alp. 1997, 13, 1–48. [Google Scholar]
- Borioni, M. Rapaci sul Conero. Parco del Conero. Herpetozoa 11 (1/2) 1993, 1, 87–91. [Google Scholar]
- Neteler, M.; Bowman, M.H.; Landa, M.; Metz, M. GRASS GIS: A multi-purpose open source GIS. Environ. Model. Softw. 2012, 31, 124–130. [Google Scholar] [CrossRef]
- GRASS Development Team. Geographic Resources Analysis Support System (GRASS GIS) Software. Available online: https://grass.osgeo.org/ (accessed on 27 November 2019).
- Haverkort, H.; Toma, L.; Zhuang, Y. Computing Visibility on Terrains in External Memory. J. Exp. Algorithm. 2009, 13, 5. [Google Scholar] [CrossRef]
- Bohren, C.F.; Fraser, A.B. At what altitude does the horizon cease to be visible? Am. J. Phys. 1986, 54, 222–227. [Google Scholar] [CrossRef]
- Quantum GIS Development Team. Quantum GIS Geographic Information System. Available online: https://www.qgis.org/en/site/ (accessed on 27 November 2019).
- R Development Core Team. R: A Language and Environment for Statistical Computing; R Foundation for Statistical Computing: Vienna, Austria, 2005; ISBN 3-900051-07-0. [Google Scholar]
- Rocchini, D.; Neteler, M. Let the four freedoms paradigm apply to ecology. Trends Ecol. Evol. 2012, 27, 310–311. [Google Scholar] [CrossRef]
- Jarvis, A.; Reuter, H.; Nelson, A.; Guevara, E. Hole-Filled Seamless SRTM Data V4, International Centre for Tropical Agriculture (CIAT). 2008. Available online: http://srtm.csi.cgiar.org (accessed on 12 May 2008).
- Fornasari, L.; Bani, L.; Bottoni, L.; de Carli, E.; Massa, R. Empirical procedures to identify migratory bottlenecks in the Alpine area. Ring 2000, 22, 67–77. [Google Scholar]
- Pedrini, P.; Rizzolli, F.; Negra, O.; Brugnoli, A.; Marchesi, L.; Pallaveri, A.; Tomasi, C. La stazione d’inanellamento nel biotopo Foci dell’Avisio (Valle dell’Adige, Trentino): Resoconto dell’attività 1995–2000. Studi Trentini Di Sci. Nat. Acta Biol. 2001, 78, 47–54. (In Italian) [Google Scholar]
- Halupka, L.; Wierucka, K.; Sztwiertnia, H.; Klimczuk, E. Conditions at autumn stopover sites affect survival of a migratory passerine. J. Ornithol. 2017, 158, 979–988. [Google Scholar] [CrossRef]
- Paxton, K.; Moore, F. Connecting the dots: Stopover strategies of an intercontinental migratory songbird in the context of the annual cycle. Ecol. Evol. 2017, 7, 6716–6728. [Google Scholar] [CrossRef] [PubMed]
- Pedrini, P.; Caldonazzi, M.; Zanghellini, S. Atlante degli Uccelli nidificanti e svernanti in provincia di Trento. Museo Tridentino di Scienze Naturali, Trento. Studi Trentini Sci. Nat. Acta Biol. 2005, 80, 674. (In Italian) [Google Scholar]
- Brugnoli, A.; Pedrini, P.; Sergio, F.; Rizzolli, F. L’influenza delle condizioni atmosferiche sulla sosta dei Passeriformi migratori in una zona umida di fondovalle (Foci Avisio, Trentino). Avocetta 2001, 25, 182. (In Italian) [Google Scholar]
- Smith, S.; McPherson, K.; Backer, J.; Pierce, B.; Podelesak, D.; McWilliams, S. Fruit quality and consumption by songbirds during autumn migration. Wilson J. Ornnitol. 2007, 119, 419–427. [Google Scholar] [CrossRef]
Figure 1.
The study area encompasses five provinces in NE Italy: BL, Belluno; BZ, Bolzano; TN, Trento; VR, Verona; and VI, Vicenza (map on the left). The main migratory flyways have been redrawn from [21]. The locations of the ringing stations are reported in the map on the right with the elevation hillshade (SRTM), and the Natura2000 network is also reported (PCN national cartpgraphic portal).

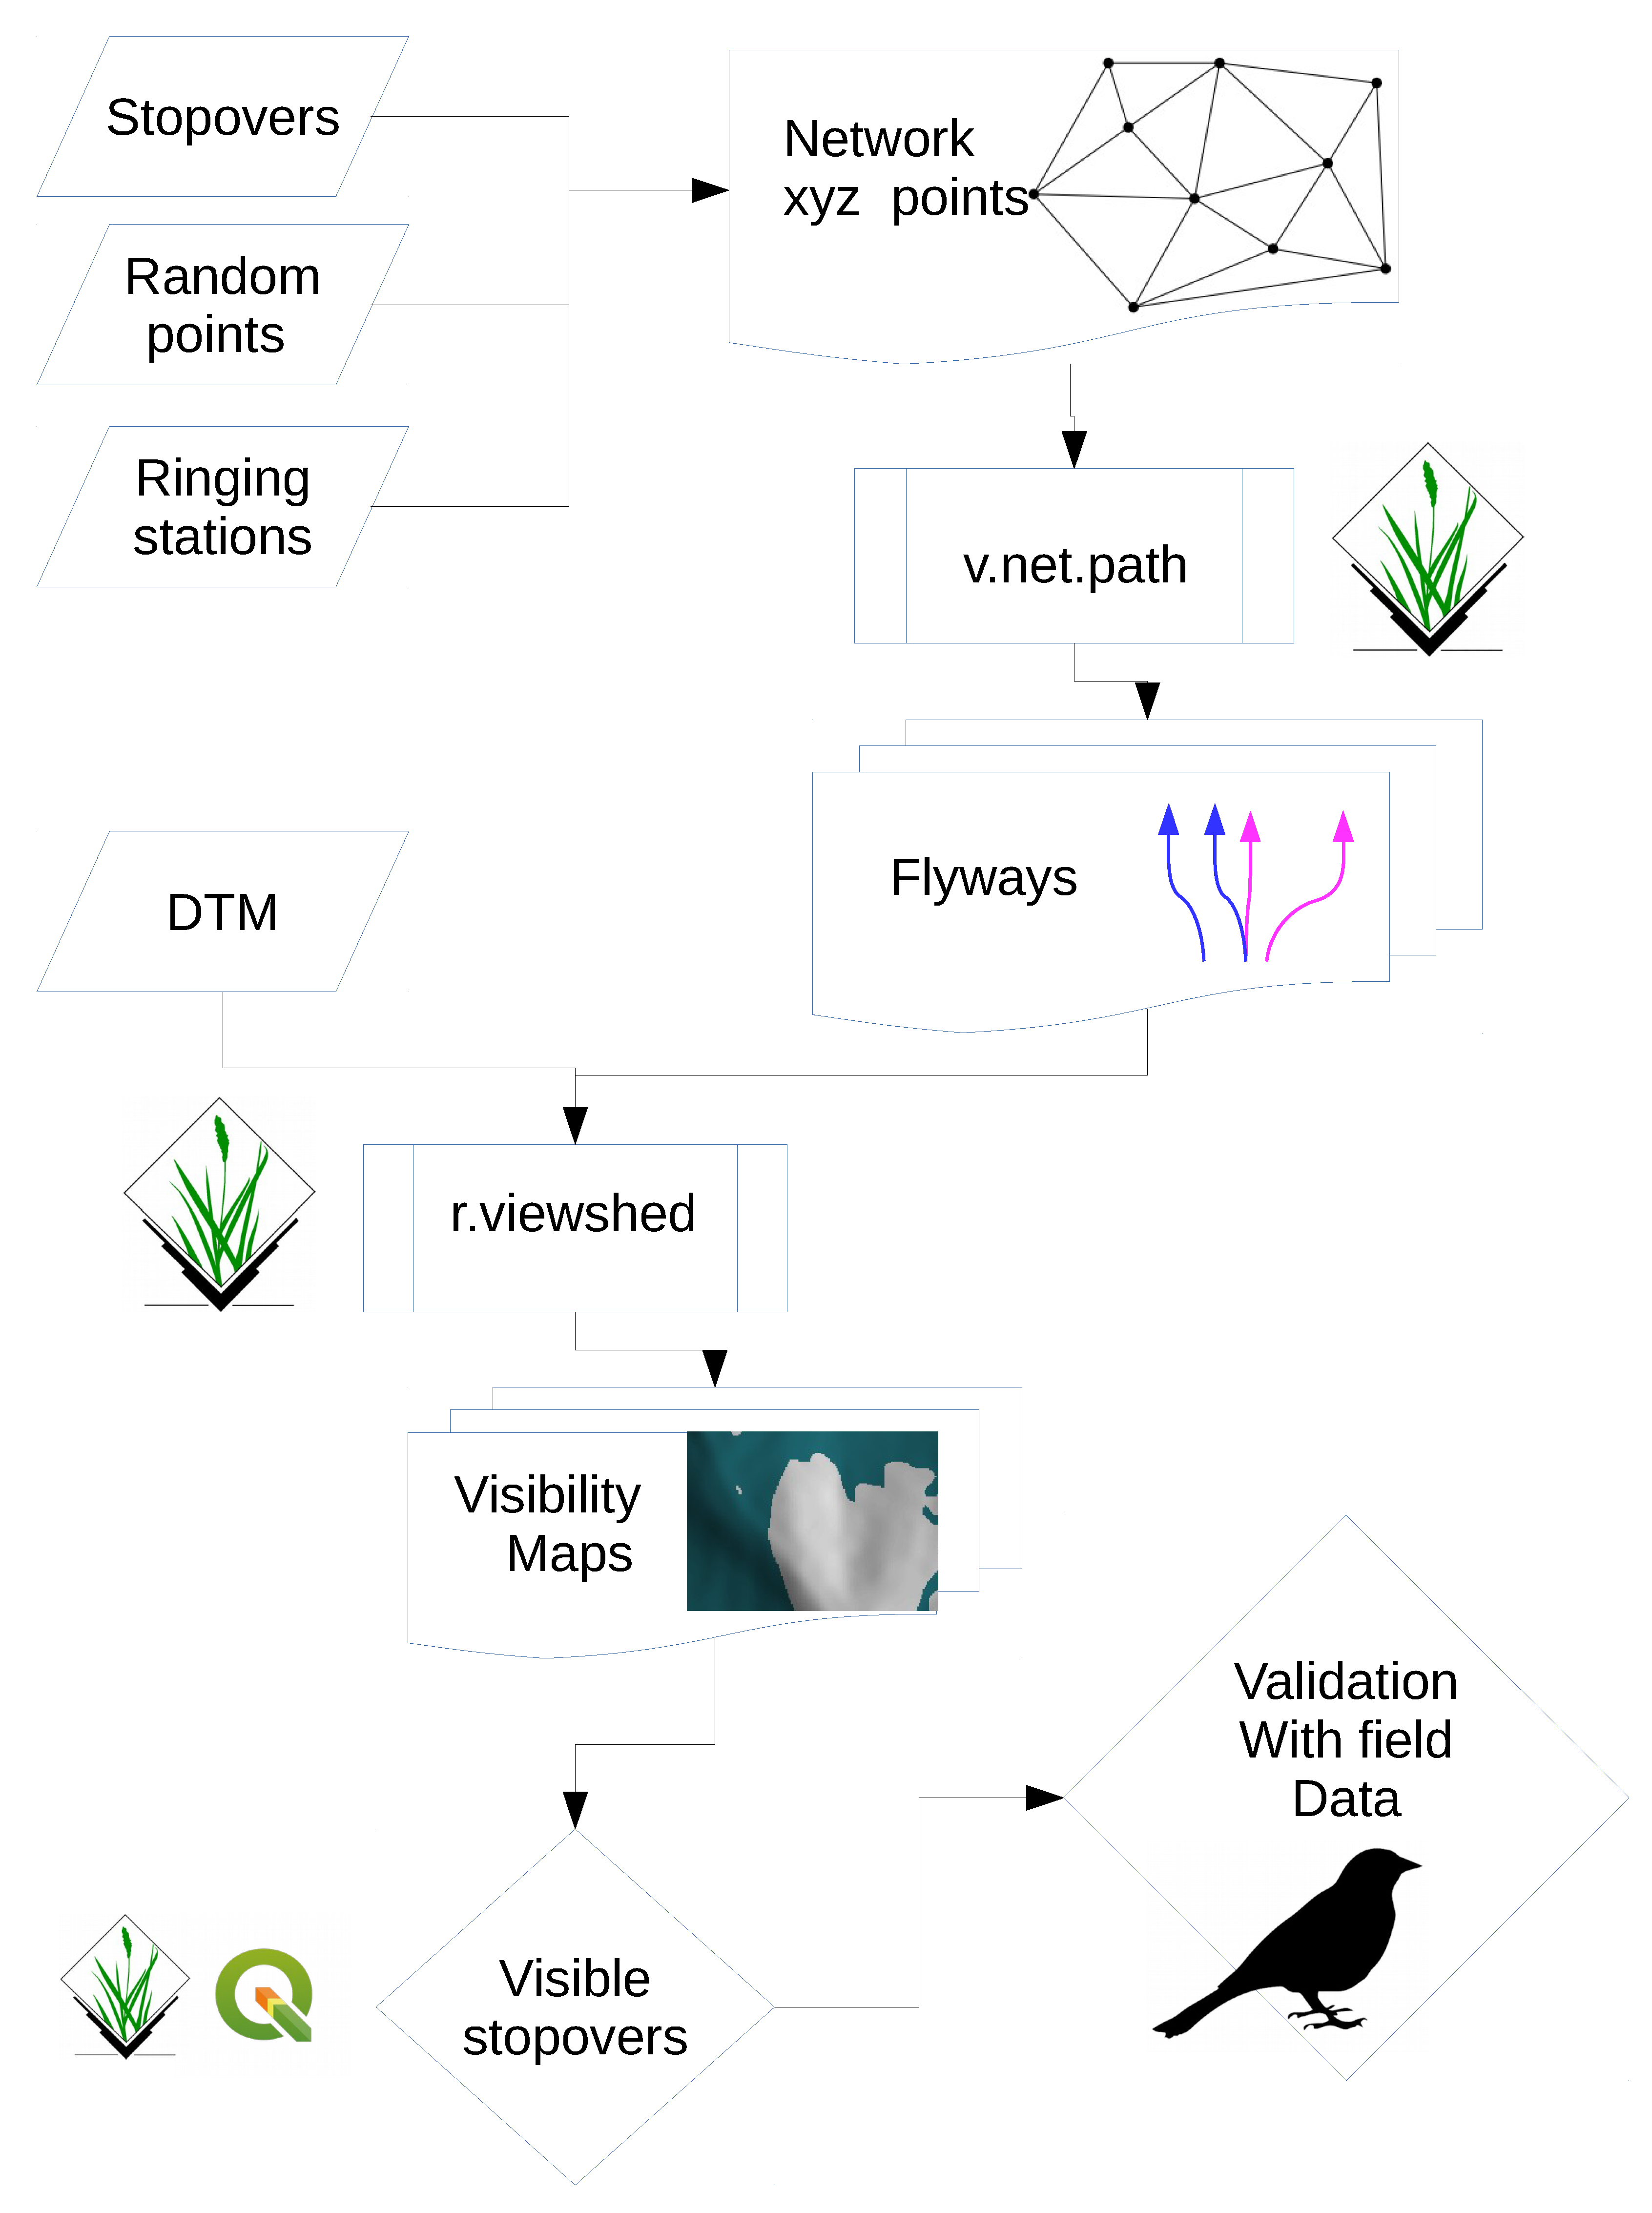
Figure 2.
Flow chart showing the input data, consecutive processing steps, and the GRASS GIS [23] modules used to identify the flyways and the visibility of stopovers sites in the Alps.
Figure 2.
Flow chart showing the input data, consecutive processing steps, and the GRASS GIS [23] modules used to identify the flyways and the visibility of stopovers sites in the Alps.

Figure 3.
Main flyways in NE Italy identified by the SPP algorithm: blue lines are shortest paths as the crow flies while the pink lines are paths minimizing elevation gaps.
Figure 3.
Main flyways in NE Italy identified by the SPP algorithm: blue lines are shortest paths as the crow flies while the pink lines are paths minimizing elevation gaps.

Figure 4.
Visibility of the Adige valley by a bird flying above Serravalle.

Figure 5.
Visibility of the Adige valley by a bird flying above the point named Valle dell’Adige.

Figure 6.
Visibility of the Adige valley by a bird flying above the Adige biotope.

Figure 7.
Visibility of the Adige valley by a bird flying above the town of Trento.

Figure 8.
Visibility of the Adige valley by a bird flying above the mouth of Avisio torrent.

Figure 9.
Visibility of the Adige valley by a bird flying above Roccolo del Sauch.

Figure 10.
En route visibility by a bird flying above Garda Lake.

Figure 11.
En route visibility by a bird flying above Brione.

Figure 12.
En route visibility by a bird flying above Mt. Brento.

Figure 13.
En route visibility by a bird flying above Lamar.


Table 1.
Number of ringed birds and species at the ringing stations sampled in spring. The length of the nets and the capture per linear length of net are also reported. Data elaborated from “Centro di Ecologia Alpina” Reports 2 and 13 [20,31], * Foci dell’Avisio data are averaged over six years of sampling. The summary line reports the totals but for the capture rate that is the average value.
| Station | Ringed Birds | N Species | Net Length (m) | Capture/m |
|---|---|---|---|---|
| Torbiera di Fiavé | 475 | 37 | 264 | 1.80 |
| Palude Roncegno | 621 | 42 | 300 | 2.07 |
| Monte Brione | 953 | 51 | 300 | 3.18 |
| Foci dell’Avisio * | 780.31 | 43.85 | 276 | 2.66 |
| Summary | 2829.3 1 | 51 | 1140 | 2.59 |
© 2019 by the author. Licensee MDPI, Basel, Switzerland. This article is an open access article distributed under the terms and conditions of the Creative Commons Attribution (CC BY) license (http://creativecommons.org/licenses/by/4.0/).
Share and Cite
MDPI and ACS Style
Tattoni, C.; Ciolli, M. Analysis of Bird Flyways in 3D. ISPRS Int. J. Geo-Inf. 2019, 8, 535. https://0-doi-org.brum.beds.ac.uk/10.3390/ijgi8120535
AMA Style
Tattoni C, Ciolli M. Analysis of Bird Flyways in 3D. ISPRS International Journal of Geo-Information. 2019; 8(12):535. https://0-doi-org.brum.beds.ac.uk/10.3390/ijgi8120535
Chicago/Turabian StyleTattoni, Clara, and Marco Ciolli. 2019. "Analysis of Bird Flyways in 3D" ISPRS International Journal of Geo-Information 8, no. 12: 535. https://0-doi-org.brum.beds.ac.uk/10.3390/ijgi8120535
Note that from the first issue of 2016, this journal uses article numbers instead of page numbers. See further details here.