An Approach for the Analysis of the Accessibility of Fire Hydrants in Urban Territories


Faculty of Environmental Engineering, Vilnius Gediminas Technical University, Saulėtekio al. 11, LT-10223 Vilnius, Lithuania
*
Author to whom correspondence should be addressed.
ISPRS Int. J. Geo-Inf. 2019, 8(12), 587; https://0-doi-org.brum.beds.ac.uk/10.3390/ijgi8120587
Submission received: 31 October 2019
/
Revised: 5 December 2019
/
Accepted: 16 December 2019
/
Published: 17 December 2019
(This article belongs to the Special Issue Geo-Information for Developing Urban Infrastructures)
Abstract
:Globally, fire causes considerable losses that can be alleviated by taking appropriate actions facilitated by systems supported by geo-information technologies. This research focuses upon the development of an approach for planning urban infrastructures, and particularly in the accessibility of fire hydrants. Accessibility of fire hydrants’ infrastructure in urban territories is one of the key elements in fire risk management and public safety. The main result of the research is a comprehensive and structured Geographic Information Systems (GISs)-based dataset for the fast and more efficient planning of fire hydrants in urban territories. The proposed framework for data collection and processing was used to determine the distribution of hydrants, location of fire brigade stations and areas and to demonstrate the capabilities of the existing municipal fire extinguishing systems in Vilnius City, Lithuania. Later on, research on fire hydrants’ accessibility, analysis of the location of protected and unprotected urban territories and marking of unprotected buildings, was carried out. The resulting map of unprotected urban territories can be of great benefit for understanding fire risks and offering more effective ways for fire risk management.
1. Introduction
In September 2015, the General Assembly of the United Nations (UN) adopted the 2030 Agenda for Sustainable Development, which includes 17 Sustainable Development Goals (SDGs). Fire is a ubiquitous natural disturbance that affects 3%–4% of the Earth’s surface each year. With the number of people living within cities projected to rise to five billion people by 2030, it is important that efficient urban planning and management practices are in place to deal with the challenges brought by urbanization [1,2,3,4].
Methodical planning of urban infrastructures is defined as the planning of resources, supply and transformation infrastructure if needed, and demand-side using the state-of-the-art technologies [5]. In order to characterize present and future components of urban infrastructure, a considerable amount of data is necessary. Processing, arrangement and the presentation of such an amount of data together need information technologies [6]. In order to work out decision trends, quality information must be used, and required data must be singled out. Thus, it is critical to develop the skeleton of the information system. The data characterize many segments of the urban infrastructure, and the relationship among them must be arranged in the systematically well-structured database in the way of allowing a definition of the system as a whole.
Burns are a major public health and safety problem globally. Fires are the fourth-largest cause of accidental injury globally (after road accidents, falls and drowning) [7]. Fire risk management is a global issue [8,9,10], where urban safety policies should take serious consideration of this topic. There are many phases for fire risk management, but more emphasis should be given to two strategies, such as [11,12]:
- Fire prevention: the most cost-effective and efficient mitigation program an agency or community can implement. Preventing unwanted, damaging fires is always less costly than suppressing them. Prevention programs that are accepted and promoted within the community not only reduce costs and resource damage, but also promote an understanding of the role and impact of fire in the ecosystem;
- Fire preparedness: includes training, equipping and staffing prior to the start of a fire. An effective fire preparedness program should be based on ‘fire risk and resource management’ planning, and should take into account year-to-year variations in funding, weather and human activities.
GIS is the mainstream data organization and analysis system of various urban infrastructures. To sum up, GIS principles are applicable in various fire safety areas, and not only for prevention, but also for preparedness actions, for both strategical and tactical needs. GIS has emerged as a critical technology to assist fire professionals in meeting mission requirements. The success of implementing GIS into fire risk management closely depends upon an assessment of the existing system, planning of GIS integrations, usage and management by applying GIS for new opportunities.
As the range of GIS applications is continually expanding, the interest in such responsive GIS technology is also constantly growing in studies of fire risk management [13,14,15,16,17]. Models are becoming more practically applied to particular problems, such as risk map development, hydraulic model development and improving hydrant assessment.
The field of this research is preparedness for fire extinguishing. Proper equipment and fire suppression techniques are a key component of any fire extinguishing. According to Xia et al. (2019), fire service needs and facility capacity are two important elements in assessing the supply-demand relationship of spatial accessibility [18]. Water is one of the most widely used suppressants for Class A fires, and the fire hydrants gained more importance when fire departments and taxpayers alike realized that strategically placed, high-capacity hydrants can significantly reduce the impacts of fire hazards.
The article introduces a GIS-based fire hydrant planning in the wider policy debate regarding urban planning and methodological approach. It shows through a case study how an original planning support system can be practically applied. It suggests simple and ingenious solutions for the evaluation and improvement of the accessibility of fire hydrants. When the cost–benefit results of GIS are compared with economic losses that occur because of fire, it can be argued that GIS provides a relatively economical and innovative solution for decision making [8,19].
Lithuania’s fire risk management is based on the “Lithuanian Republic Law of Fire Safety” [20], which forms the foundations of the Lithuanian Republic’s fire safety basis. The responsibility of fire safety management in Lithuania belongs to the Fire Departments and Municipalities. Inspections, installation and the accessibility of hydrants are performed according to ‘General Fire Safety Instructions’ [21] and ‘Rules for the design and installation of outdoor fire water supply networks and structures’ [22]. ‘General Fire Safety Instructions’ describes an ‘old fashioned’ maintenance with manually filling the Excel check book for outdoor fire hydrants. Each year, every fire hydrant shall be checked and maintained. These regulations should be implemented when there is a new building installed, during the reconstruction and if the building’s purpose is changed. During the building exploitation period, water for fire systems should fulfil technical requirements, which could determine building fire safety regulations’ requirements. Both fire hydrant access points and natural water ponds are permissible solutions according to Lithuanian legislation. The data management, sharing and monitoring issues are the most problematic at the moment. For example, Vilnius City has seven fire brigades operating in separate town areas. In most cases, the repair and maintenance of hydrants are the responsibilities of the Municipal Water Department.
However, the Fire Department performs water supply testing and hydrant inspections, and afterward sends information to the Water Department. Hence, municipalities are responsible for cost-effective and sustainable development strategies. Such strategies should comply with the overall implementation and development of firefighting systems, because it is expensive and time-consuming to inspect firefighting systems separately for each building and collect information manually. There is no informative database with assessment, problem identification, management and decision-making possibilities. The development of a management system allowing information sharing between departments is an actual question for today.
As was mentioned, Lithuanian firefighters still use manual hydrants, planning, maintenance and evaluation systems based on Excel spreadsheets. It is neither convenient to exchange data and information, nor time-saving. The main result of the research is a comprehensive computerized database for fire hydrants in Vilnius City which could fulfil fast, more efficient and continuous work of firefighters and responsible organizations. Due to that, the aim of the research is to develop a GIS-based fire hydrants database structure and approach suitable for the evaluation of fire hydrants’ accessibility.
2. Analysis of Innovative Fire Risk Management Practice in EU Countries
“European Fire Strategy 2020” was created for European Union (EU) members by the Federation of European Union Fire Officer Associations (FEU) in 2010 [23]. Presently the FEU represents senior fire officers in the following FEU countries: Austria, Belgium, Cyprus, the Czech Republic, Denmark, Estonia, Finland, France, Germany, Greece, Hungary, Ireland, Italy, Luxembourg, the Netherlands, Norway, Poland, Portugal, Slovenia, Spain, Sweden and the United Kingdom. The focus of the FEU concentrates on the development of fire brigades and fire safety in Europe, and especially in respect of organization and management, structure, technical skills, training and fire engineering. Lithuania does not belong to the Federation of European Union Fire Officer Associations.
World Fire Statistics Issue 2019 presents its latest report No. 24, containing fire statistics of many CTIF countries and their larger cities for 2017 and trends for the period 2013–2017. The fire and loss statistics for 2017 are based on data from 34 world countries and 35 cities [4]. Data on calls, fires and losses during 2013–2017 were provided from 59 countries that have supplied data for one or more of the five years in 2013–2017.
According to the report, the number of fires increased from 2.5 million fires per year to 3.2 million fires per year, and there were 14.2 million fires in total during period 2013–2017 in covered countries. The number of fire deaths is also enormous, because 96.3 thousand people lost their lives in the fires during these five years.
The report reveals that the average number of fire deaths per 100,000 inhabitants is very high in Lithuania, as it is in the fourth place among 54 countries with a 4.31 average fire deaths per 100,000 inhabitants per five years. The people who died in the fires is three times higher in Lithuania than the average of 54 world countries, and that indicates how important is fire risk management for urban policies.
During 10 months of 2019, 4772 fires, or 46 percent of all fires, occurred in open areas, and it burned over than 3.2 thousand hectares of crops and forests according to the Lithuanian Department of Statistics. Most of the fires that occur in open areas are the fires in meadows during early spring time, i.e., March and April months when the grass is dry. According to the last data from year 2019 (10 months), 1938 fires were extinguished in residential buildings, and it is 18.7 percent of the total number of fires with 44 fire deaths. Most people died in fires during the (home) heating period in the winter months, i.e. December, January and February. According to the Lithuanian Department of Statistics, the main causes of fires are the external source of fire (27.6%), careless human behaviour (16.6%), burning of grass, stubble, crop waste (9.4%), wrong installation of stoves, fireplaces and chimneys and violations of their operational requirements (7.9%), faults in electrical installations, appliances and wiring (5.9%). Lithuanian firefighters are well prepared to perform rescue works on water and on ice, and they therefore possess special equipment adapted to winter conditions, and ice is not a major obstacle to access water ponds.
Further analysis is constructed and based on World Fire Statistics Issue 2019 report No. 24 results [4] and the implementation and evaluation of a GIS system for fire risk management, more specifically fire hydrants infrastructure in the leading capitals of European Union countries. Austria (with 0.23 average number of fire deaths per 100,000 inhabitants in 2013–2017) was chosen, and this EU country has implemented GIS-based fire hydrants system in Vienna. Germany also has a low 0.48 average number of fire deaths per 100,000 inhabitants. This country employs GIS for fire risk management, and information engineering for their fire hydrants’ maintenance system.
Fire regulations are set by Austria’s federal states, but they are linked to national regulations known as the Austrian Institute of Construction Engineering (OIB) guidelines, which refer to subjects such as fire safety, fire in operational structures and high buildings. Fire protection compliance has to be carried out as early as possible in the design phase [24].
Each of the 2359 Austrian municipalities must establish and maintain an adequate fire service. The concept of ‘fire police’ (in a narrow sense) covers fire prevention, which comes under the municipal building and fire police, fire-fighting, which is the responsibility of the municipal fire brigades, and investigation of the causes of fire. For instance, Vienna has a ‘Public Infrastructure Manual’ (PIM), which was created to establish standards for the design and construction of infrastructure and facilities in the Town (last revision in October 2018). These standards and guidelines are designed to supplement the provisions of existing State and County regulations and Town codes and ordinances.
It is stated in PIM that any project that improves public utilities including water, sanitary and storm drains, shall provide as-built electronic data for the utility in State Plain North NAD 83 in the form of a DFX file [25]. The Town of Vienna’s GIS contains information from a wide variety of different sources, such as private contractorsand data created in-house. Such data layers include city parcels, utilities, roads, buildings, voting precincts and much more. The Town’s Planning and Zoning, Police, Public Works and Parks and Recreation Departments are currently using the GIS in day-to-day operations. The software utilized by the Town for GIS includes the ArcGIS suite by ESRI, ArcSDE, and SQL Server.
Vienna’s Open Data initiative has released a data set with all fire hydrants of Vienna in April 17, 2013, [26]. This Open Street Map (OSM) contains 12,702 unique entries of fire hydrants. According to the Open Government Data License Austria, CC-BY 4.0, this base map can be used online for any purpose, even commercially [27]. For example, every spring, the water distribution system is flushed using existing fire hydrants. While this operation is going on, each fire hydrant is checked for proper operation. This GIS system is used to mark tested fire hydrants, or mark hydrants that need to be repaired.
In Germany, fire protection is regulated by federal states, which are guided by Musterbauordnung (MBO), the National model Building Code, and Musterverwaltungsvorschriften Technische Baubestimmungen (MVV TB), being the Technical Building Regulations of the Sample Administrative Regulations. These documents are the two major German regulation document packages that describe how fire safety should be managed [28].
It is highly important to mention that Germany has a leading independent standardization and testing institutions for fire safety and security called VdS (Verband der Sachversicherer, or the Association of property insurers) and the German Institute of Standardization (Deutsches Institut für Normung, or DIN), well known across the world. Even some of Lithuania’s international site projects indicates to follow VdS standards and specifications, which specifies that a high-quality project shall be prepared. A VdS certificate, therefore, gives commercial and private consumers an important orientation aid in distinguishing between high-quality and mediocre products and services. One of the main aims of the VdS is to gather, prepare and pass on the latest know-how on the subjects of fire protection and security, and thus set sustainable standards [29]. The German Fire Protection Association (Vereinigung zur Förderung des Deutschen Brandschutzes, VFDB) establishes a platform for this cooperation, allowing members from science, industrial research and development, insurance agencies, as well as users to come together and exchange their opinions and ideas on a voluntary basis.
In Berlin, the Fire Hydrant Directory helps quickly and easily in finding the nearest water supply for fire extinguishing. The public water supply network and its extraction points are not particularly emphasized from afar. Information such as a description of the exact location, the diameter and the water pressure, helps with inspections and testing. For instance, in Berlin, the UiZ Company brings capabilities to create an accessible environment using GIS tools, and is responsible for remote sensing of the ability to map, study, monitor and manage water resources with GIS [30].
In order to enhance fire risk and manage the losses and damage of fire, it is highly important to organize effective communication and share the good experience between the EU. From the fire risk management review, it is clearly seen that Lithuania does not ensure that all fire forces use up-to date technology. Following the Federation of European Union Fire Officer Associations of Austria and Germany countries’ experience, Lithuania should create a plan for the development of gaining the most effective and sustainable means for fire risk management. Following Vienna’s and Berlin’s practice, the first step could be a GIS Hydrant Maintenance Inspection solution [31], which modernizes the hydrant maintenance inspections by using a smartphone or tablet device with online GIS map data. Hydrant Maintenance Inspection is a configuration of ArcGIS. Once configured, the Hydrant Maintenance Inspection map could be accessed by field crews using the Collector for ArcGIS application to view hydrants and record inspections.
3. Materials and Methods
The Geographic Information System (GIS) is a pivotal technology that enables better planning and action for both strategic and tactical needs. There are several layers of GIS maps which international scholars and practitioners use for various planning purposes: streets, parcels, fire hydrants, utility networks, topography, lakes and rivers, commercial and government buildings, fire station locations, police station locations, hospital locations, school locations, satellite or aerial imagery, historical incident or emergency call locations, fire demand zones (gas stations, wild forests, etc.) and public occupancies [25,26,32,33,34,35,36].
Vilnius is the capital and the largest city of Lithuania, where the country’s most important political, social, cultural and economic institutions are operating, and fire security should be elaborated to higher standards. According to the data published by the Department of Statistics of Lithuania, as of 1st of July 2018, the number of permanent residents of Lithuania was 2.8 million, including 0.55 million residents of Vilnius. and that is 19.6% of the total number of the inhabitants of the country [37].
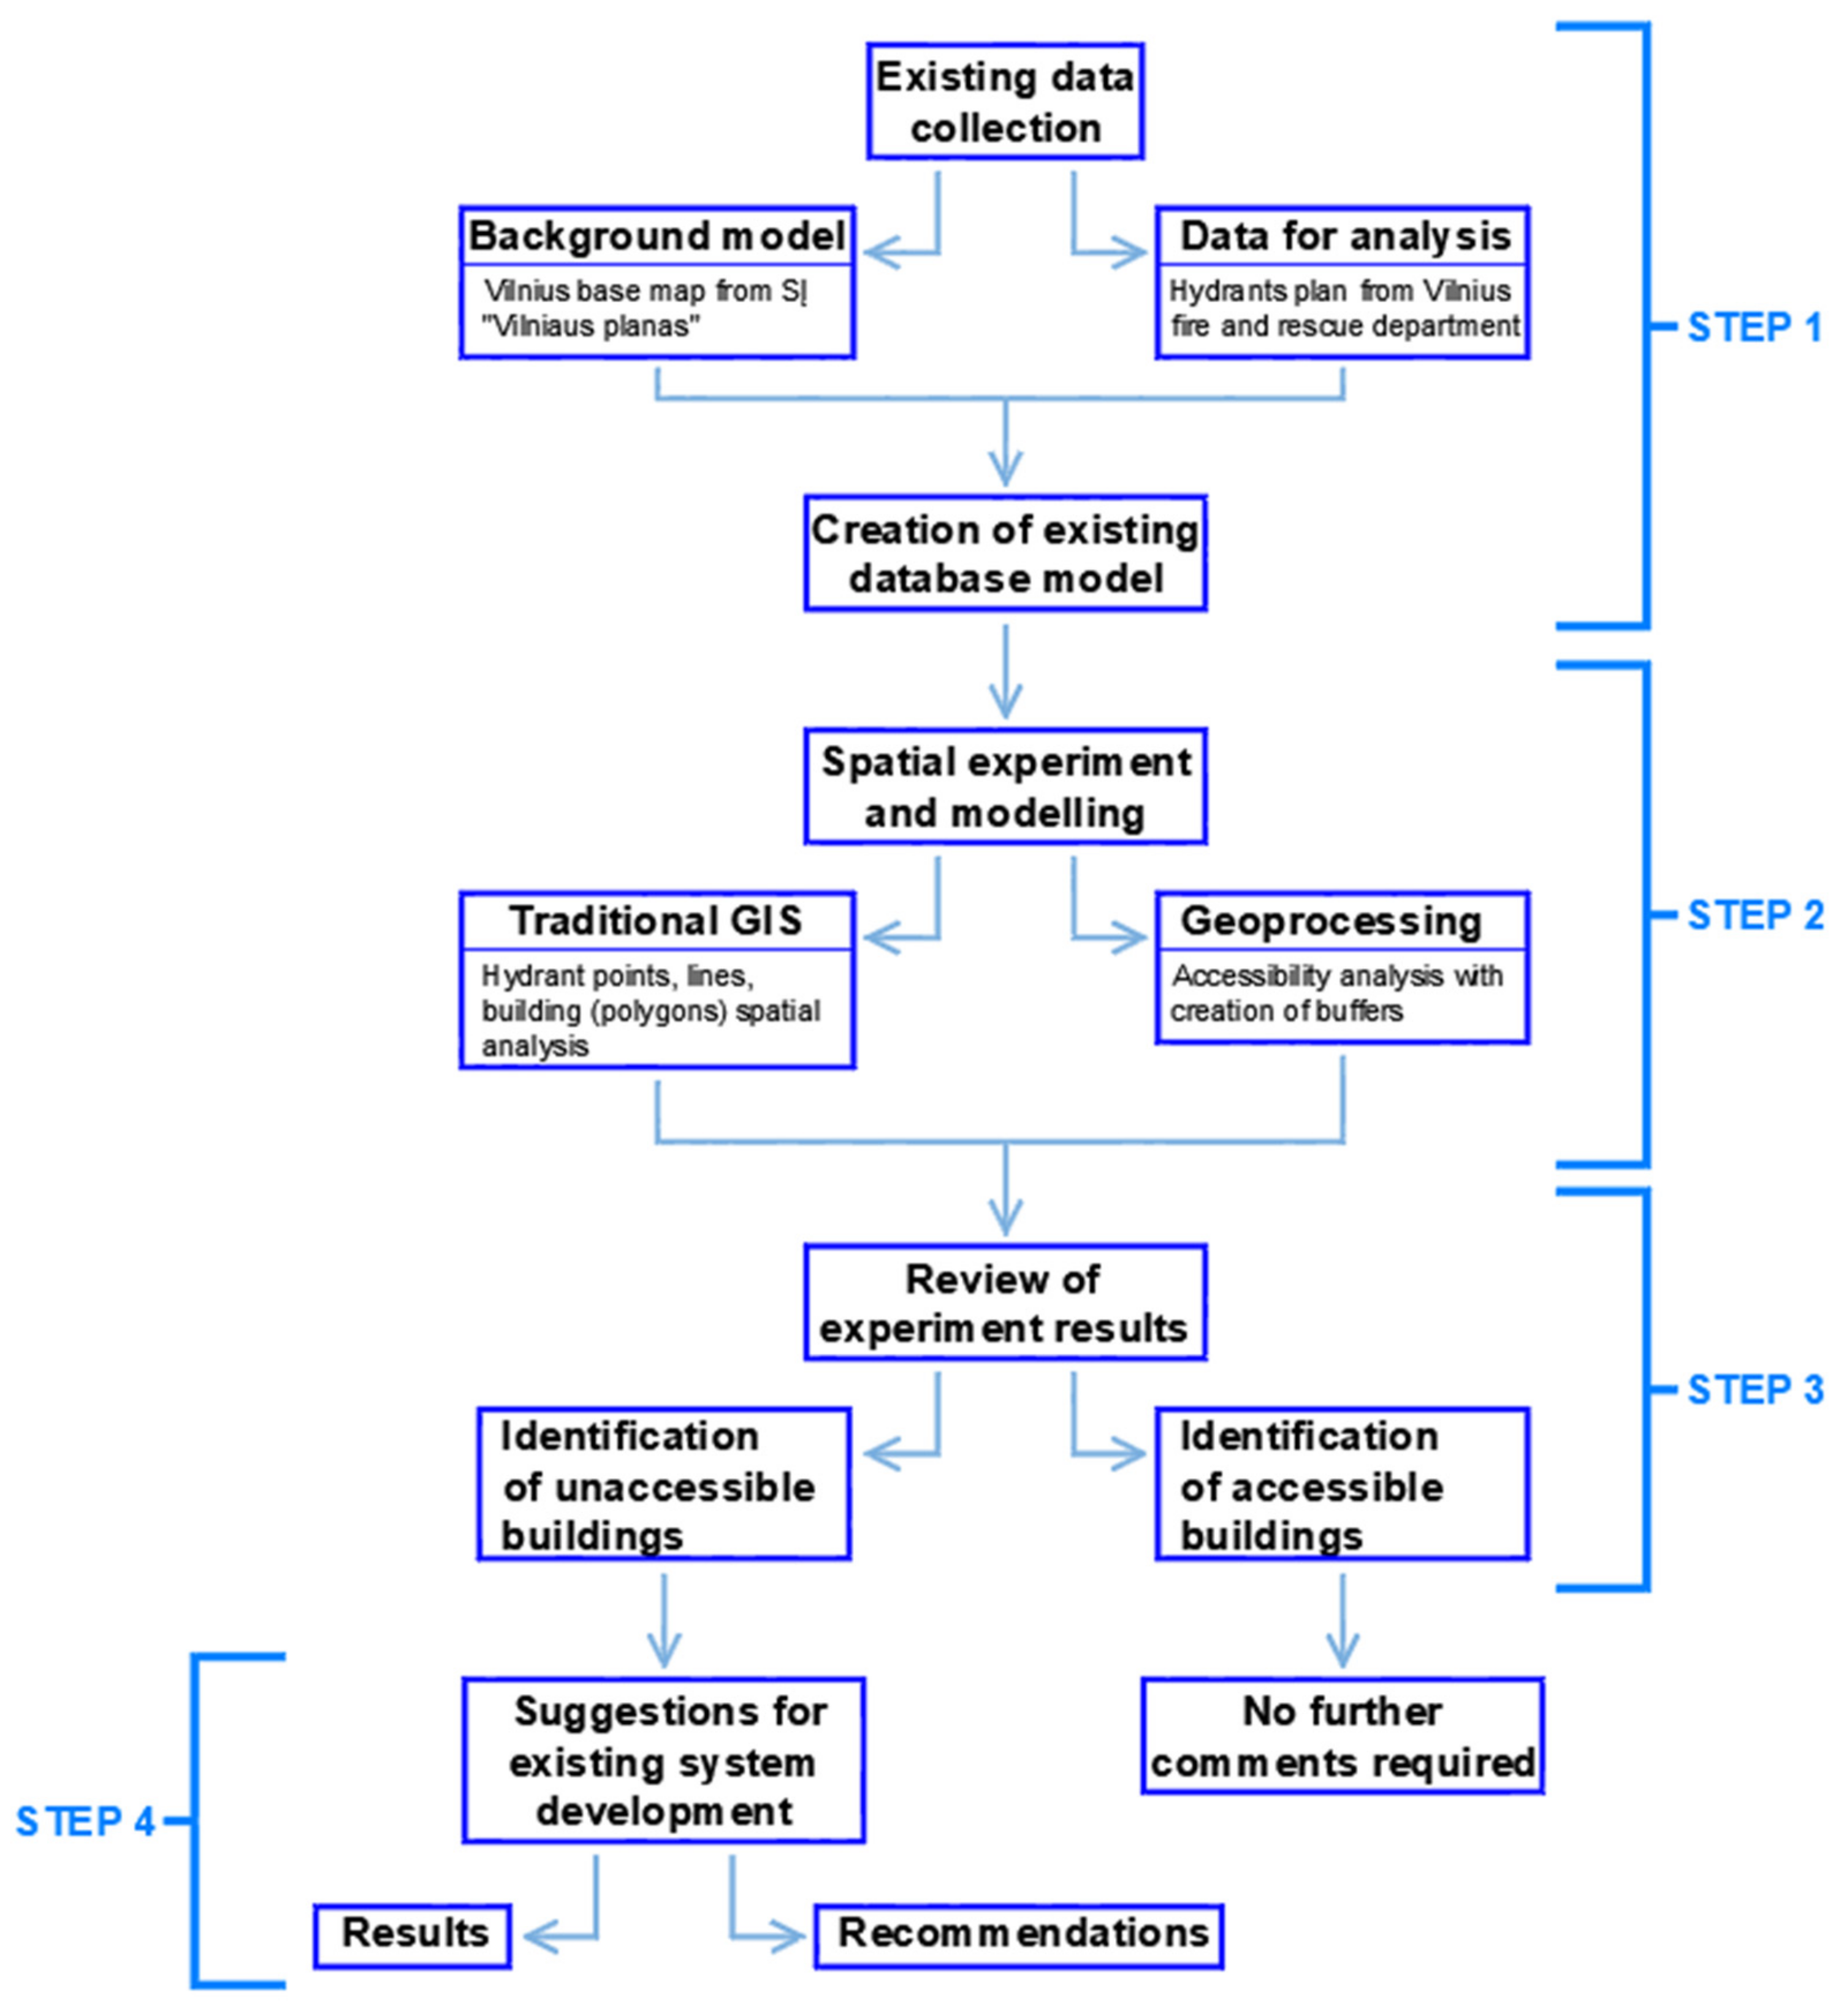
Following best practice, it is suggested to implement GIS into fire risk management and use this information system for hydrants’ system maintenance in Vilnius fire brigades’ operating areas. Primarily, fire brigades are responsible for the fire risk management in dedicated territories. A fire hydrants’ plan of the Vilnius Fire and Rescue Department was created and analyzed with GIS ArcGIS 10.5 software to find problem areas and suggest effective sustainable solutions and recommendations. The structure of the experiment is presented in Figure 1, and further steps are described below.
Step 1. Lithuania’s Fire and Rescue Department, which is based in Vilnius, provided an opportunity to experiment and create a GIS database with the Vilnius municipal hydrants system. Municipal enterprise “Vilniaus planas” and Vilnius Gediminas Technical University Department of Roads provided a base map and other useful GIS layers of Vilnius, which were used for the creation of an existing database system. In step one, all materials were uploaded into ArcGIS 10.5 software and a base file of the existing situation was created for further experimental steps.
Step 2. Hydrants as a vector data were sorted according to Vilnius fire brigades’ areas. The Vilnius map, hydrants’ graphical information and Database Management Systems (attribute tables) information were revised. Also, natural water ponds were marked and separate layers created for each fire brigade. The geographic data were verified by comparing the location of features visible on a preregistered orthophoto. Geoprocessing analysis was carried out to determine the spatial distribution and accessibility of fire hydrants and natural ponds in each Vilnius Fire Brigade area. Polygons of unprotected buildings and areas were created in order to calculate unprotected areas of each Vilnius Fire Brigade area.
Step 3. Unprotected areas of Vilnius fire brigades were presented. Final data with the accessibility of hydrants were submitted and a layer of unprotected buildings was prepared for further trial tests. The result maps were prepared and described.
Step 4. The number of unprotected buildings was calculated. Recommendations for the existing system development and unprotected building’s fire protection were suggested. Results and recommendations of the experiment were presented.
It is important to mention that further analysis is based only on municipal fire hydrants, and private installations are not evaluated because of a lack of data and information.
4. The Outline of the Experiment
4.1. Step 1: Collection and Preparation of Information
Firstly, the existing situation was analyzed. Vilnius has seven fire brigades that operate in separate town parts (see Figure 2).
The most important layers were prepared and assembled with the help of GIS: existing access points of municipal hydrants, natural water ponds, buildings and areas of fire brigades. The areas of Vilnius Fire Brigades were delineated after consultations with the Fire and Rescue Department (see Figure 2).
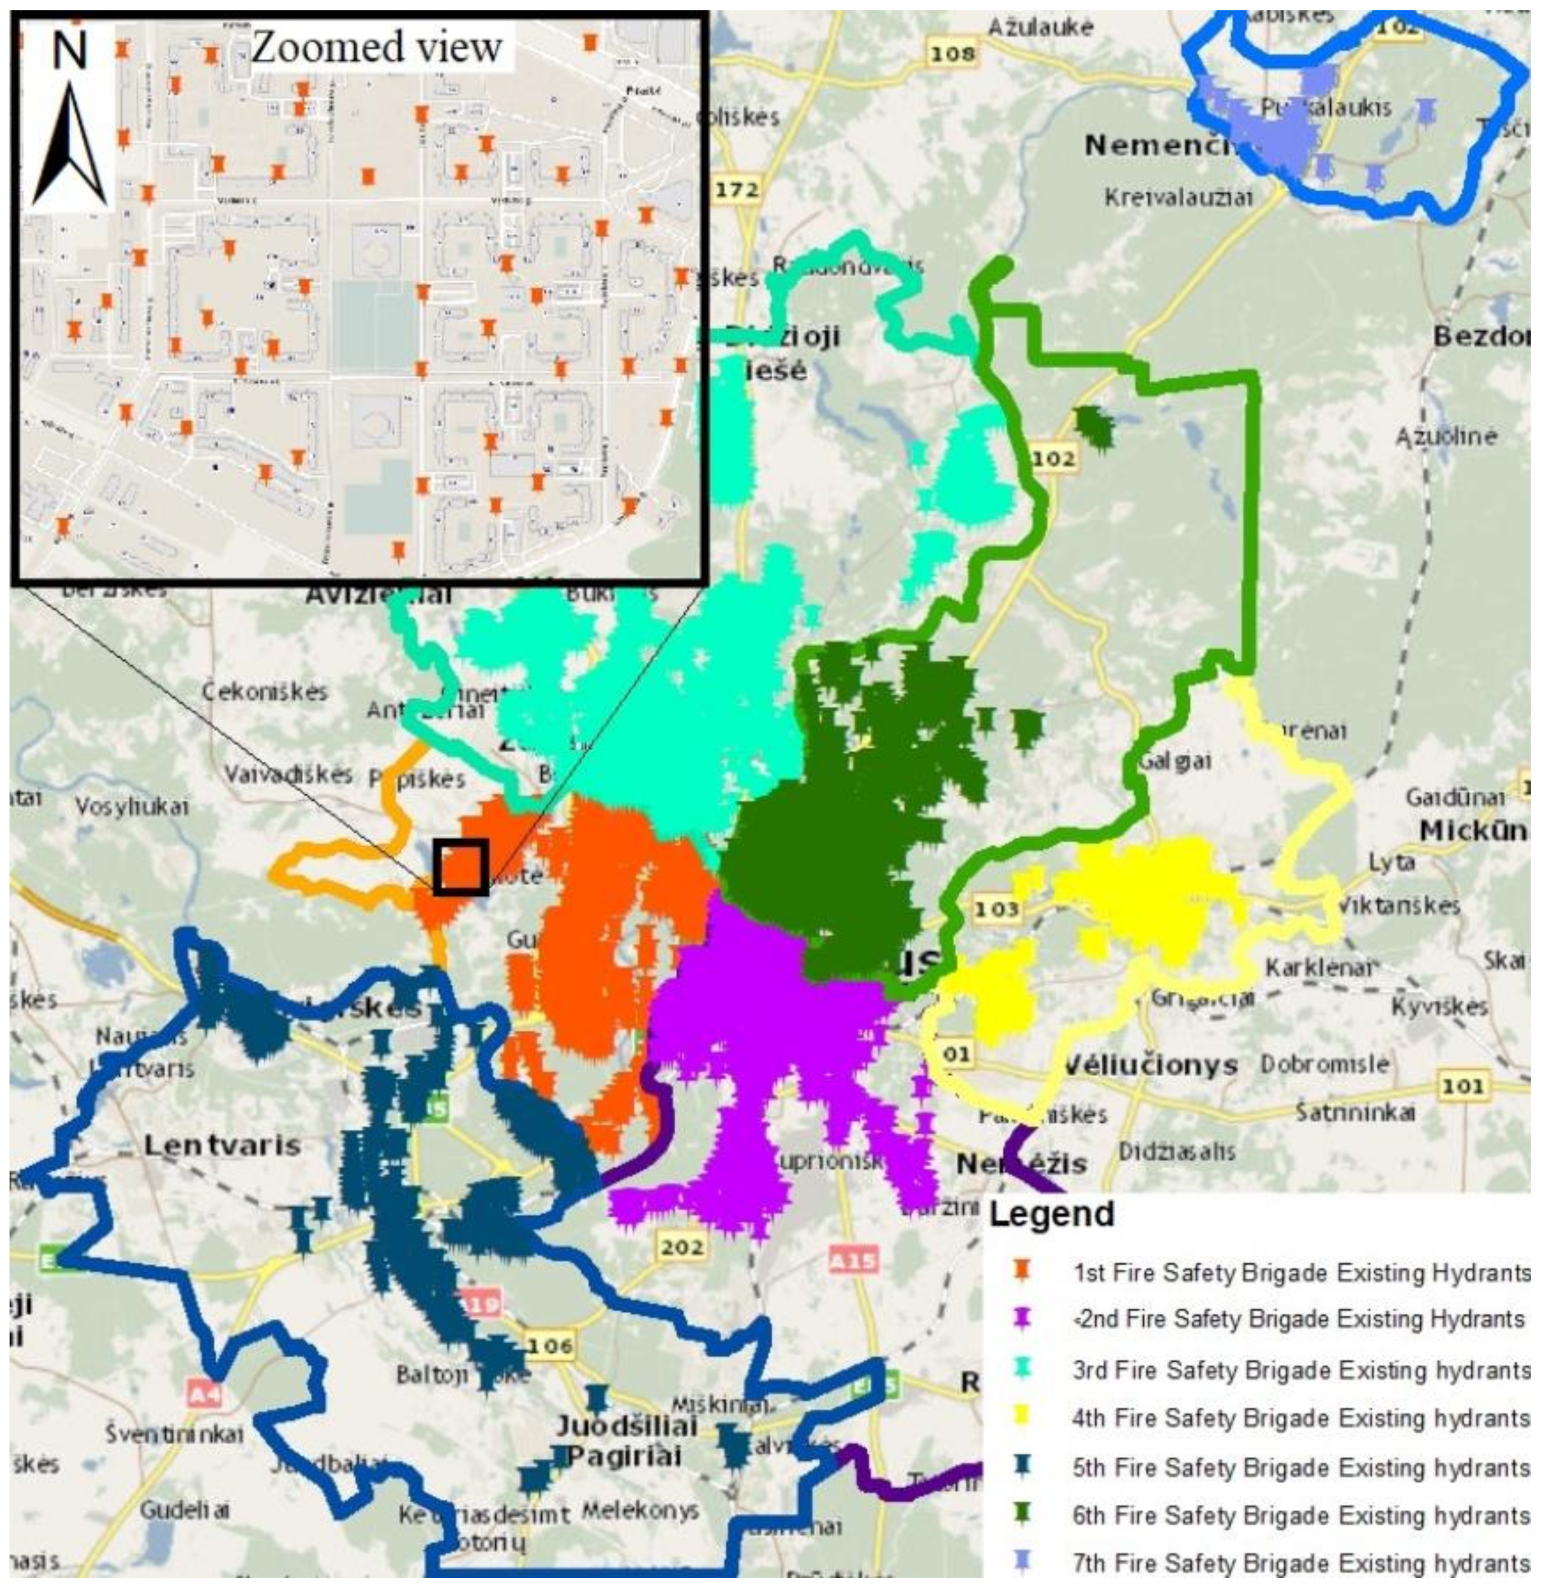
Table 1 and Figure 3 represents information about the Vilnius Fire Brigade’s locations, operating areas, numbers of hydrants’ access points and the number of natural water ponds.
As it could be seen, 22% of the total area is operated by Fire Brigade 3, which also has the highest number of fire hydrants access points, being 1127. Fire Brigade 7 in Nemenčinė, is operating in 4% of the total area. The lowest quantity of hydrants is in the Brigade 7 area, but this area is also the smallest. Further analysis will concentrate on the evaluation of the accessibility of fire hydrants, natural water ponds and water supply calculations for buildings’ fire extinguishing.
Relevant objects, such as hydrants’ access points, fire brigade’s areas and natural water ponds were imported as separate shapefiles, which could be easily represented graphically. Attribute information about objects was inputted into attribute tables. Geometrical data such as location, coordinates, numerical values and area were obtained by calculations of GIS tools. Tables, graphs and maps were extracted from the numerical data and processed with Microsoft Excel.
Figure 3 represents all municipal fire hydrants in all Fire brigades’ areas. It could be seen that a big part of these hydrants’ access points are located in the central area of Vilnius, and the municipal water system is developed very well in this area. Moreover, there was an ambition to cover central areas with much more dense protection due to a higher density of population and buildings, compared with peripheral areas that are much less dense and populated.
4.2. Step 2: Territorial Spatial Analysis
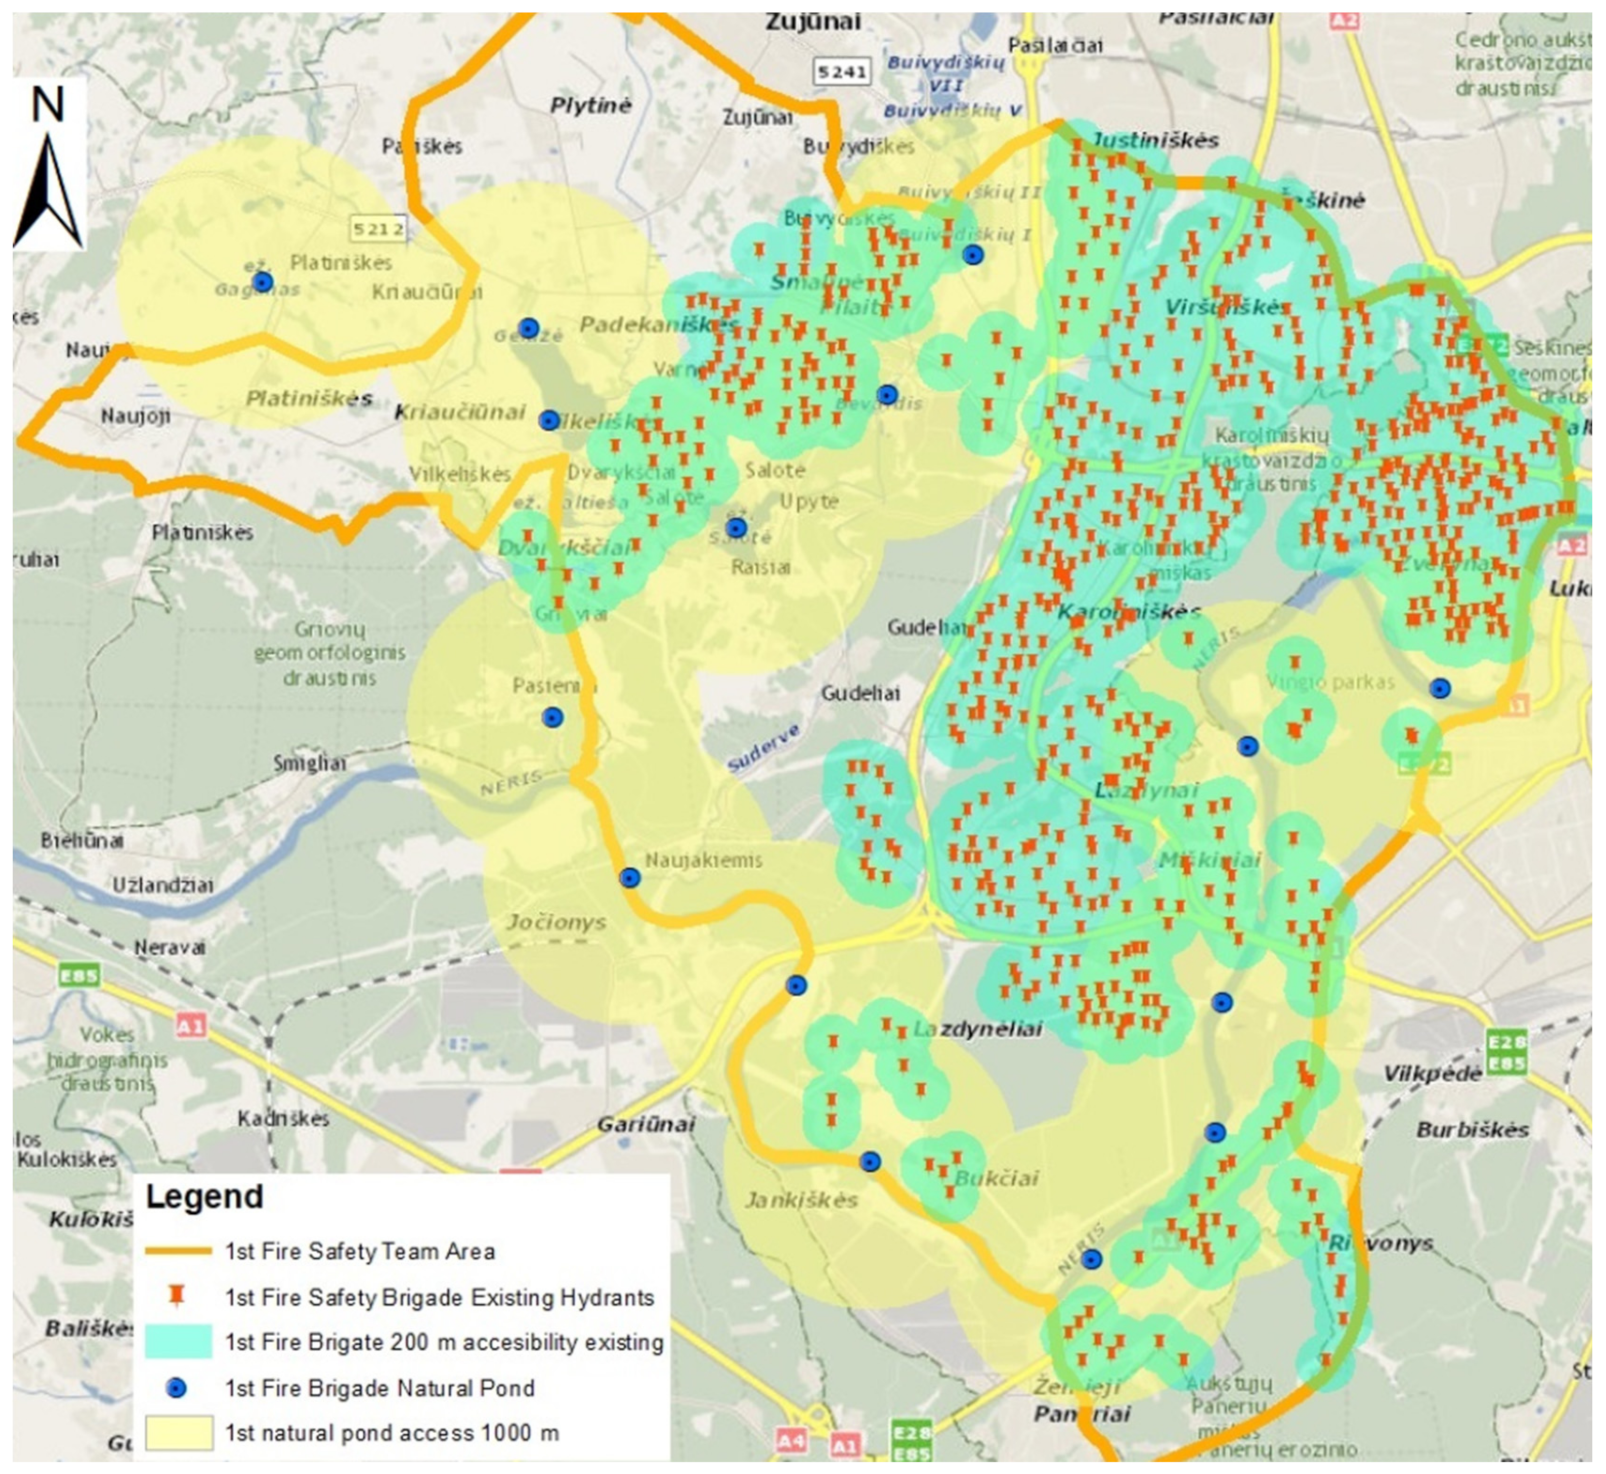
All seven Vilnius fire brigades were investigated, but in order to represent all the details, an example of Fire Brigade 1 was chosen. All other areas of fire brigades were studied analogically. The accessibility of fire hydrants has been assessed with the ArcGIS 10.5 program in each Vilnius fire brigade area by creating buffer zones around each fire hydrant. The reach limit was taken within a radius of 200 m from the hydrant access point, and 1000 m from natural water ponds, as is required by Lithuanian ‘Rules for the design and installation of outdoor fire water supply networks and structures’ [22]. The level of accessibility was estimated by marking every unprotected building with a polygon and analysing unprotected areas (see Figure 4).
There is a need to test the capacity of natural water ponds and to check the suitability of this water resource for fire extinguishing. The capacity of each marked natural water pond was calculated and tested to determine whether it is sufficient for fire extinguishing [38]. It is known that the size and volume of buildings vary in each area, and an average of 15 litres/s water capacity for fire extinguishing was selected as indicated in Lithuanian instructions and rules [21,22]. The fire extinguishing shall be secured for at least three hours [21], therefore an average water consumption would be 162 m3 in total per one natural water pond. Lithuania is a cold winter country, and one metre of frozen water was also included in the calculation, and therefore, the capacity of each natural water pond was reduced. Natural water ponds are a possible exception, and such ponds are not a high-quality water supply source for fire extinguishing. Natural water ponds are complicated for firefighters to use (there is not always a proper driveway installed, while during winter there is a need to make an ice hole and it is unsafe), and it is hard to ensure that during the fire the natural water pond will not be depleted. However, it is possible to use such water ponds according to the regulations, but it is highly recommended to install fire hydrant access points where it is possible.
4.3. Step 3: Determination of Unprotected Buildings
The next step of the experiment was a determination of unprotected buildings in each Vilnius fire brigade’s area (see Figure 5). Vilnius has seven fire brigades that operate in separate town parts. There are 4517 municipal hydrants in a 57,014.61 ha area. With natural water ponds, it covers and protects a 49,307.17 ha area, which is 86.5% of the Vilnius Fire Brigade’s operation area.
The most important ‘Unprotected area’ layer as a polygon was created, which qualified 49,307.17 ha, which is 13.51% of the Vilnius Fire Brigade’s operation area.
4.4. Step 4: Analysis and Evaluation
The experimental results were spatially analysed in separate Vilnius districts. Accessibility of municipal fire hydrants and natural water ponds (rivers, lakes, natural pools, etc.) were evaluated. The Vilnius area varies with many land purposes: forests, lakes, rivers, parks, industrial areas, living, shopping, etc. Likewise, various types of buildings (industrial, dwellings, administration, etc.) could be found in districts.
The number of unprotected buildings and areas were calculated with the help of spatial analysis methods, and are summarized in Table 2. Spatial experimental methods (clip, split, select, spatial join, buffer tools, etc.) were applied to determine problematic zones without any possibility to be extinguished with water in the case of fire within the 57,014.61 ha Vilnius area.
As is seen in Table 2, the highest unprotected area of buildings is located in the Fire Brigade 5 area, particularly the Gariūnai district (98,733.94 m2), dominated by the industrial and commercial buildings.
The highest number of unprotected buildings is located in the Fire Brigade 3 area, particularly in the Santariškės district (447 buildings), dominated by residential and public buildings. The percentage of total unprotected buildings’ area helps to identify areas of concern, and the highest number of unprotected buildings are located in Fire Brigade 5 area (843 buildings which need fire protection). The area of Fire Brigade 5 is located in the peripheral city zone, therefore it is dominated by small private homes with long distances between each other. Fire Brigade 7 has protection for every building, and the accessibility of fire hydrants is perfect. In a nutshell, there are still 735 thousand m2 of unprotected building’s area in the Vilnius Fire Brigade’s operation areas. This is a high percentage, and additional measures should be taken to eliminate those unprotected areas.
5. Results of the Experiment and Discussion of the Approach
The City of Vilnius is currently preparing a new master plan for the administrative territory, and does not have a periodically updated fire risk map; however, such a map was developed by Vasiliauskas and Beconytė in the study Spatial analysis of fires in Vilnius city 2010–2012 [39]. The general findings of this study is that “urban fires in the city of Vilnius occur in similar yearly spatial and temporal patterns”. Authors are indicating two residential areas where most fires occur in flats and garbage containers (western part of Karoliniškės and northern part of Justiniškės) and two industrial areas in Naujininkai (mainly fires in open areas and abandoned buildings).
Comparative analysis of the fire risk map and this study both reveal that accessibility of fire hydrants is a must-have decision-making technology, as buildings in Karoliniškės, Justiniškės and Naujininkai districts are quite well protected (see Table 2). It can be concluded that the priority task is to formulate the appropriate technical accessibility and capacity of the fire hydrants, as Lithuanian instructions and rules indicate and the secondary task is to consider the density of the population or buildings area. Compensatory measures for lower hydrant accessibility areas should be provided for the unprotected buildings (i.e. cameras, passive fire barriers) and future development of real estate in unprotected areas should be tackled with special attention, i.e. developers of the area should be expected to take care of the responsibility to install fire hydrant points.
Nowadays, urban areas are growing and expanding very rapidly, therefore fire risk management is an important component of urban planning, and evaluation of Vilnius development and new buildings construction in its territory shall be included in future research. Detailed identification of currently unprotected areas and those areas’ proportions could secure proper fire risk management. It helps to identify where fire hydrants should be installed, and will be further ground to develop plans for the installation of fire hydrants access points.
In this experiment, municipal fire hydrants’ location development and unprotected buildings’ fire protection solutions could be suggested in a theoretical and practical manner. However, for accurate experiment modelling, even more data is required’ such as private extinguishing systems, municipal water underground systems, Vilnius development plans, etc. Additionally, road network limitations for the accessibility of natural water ponds should be evaluated in further studies.
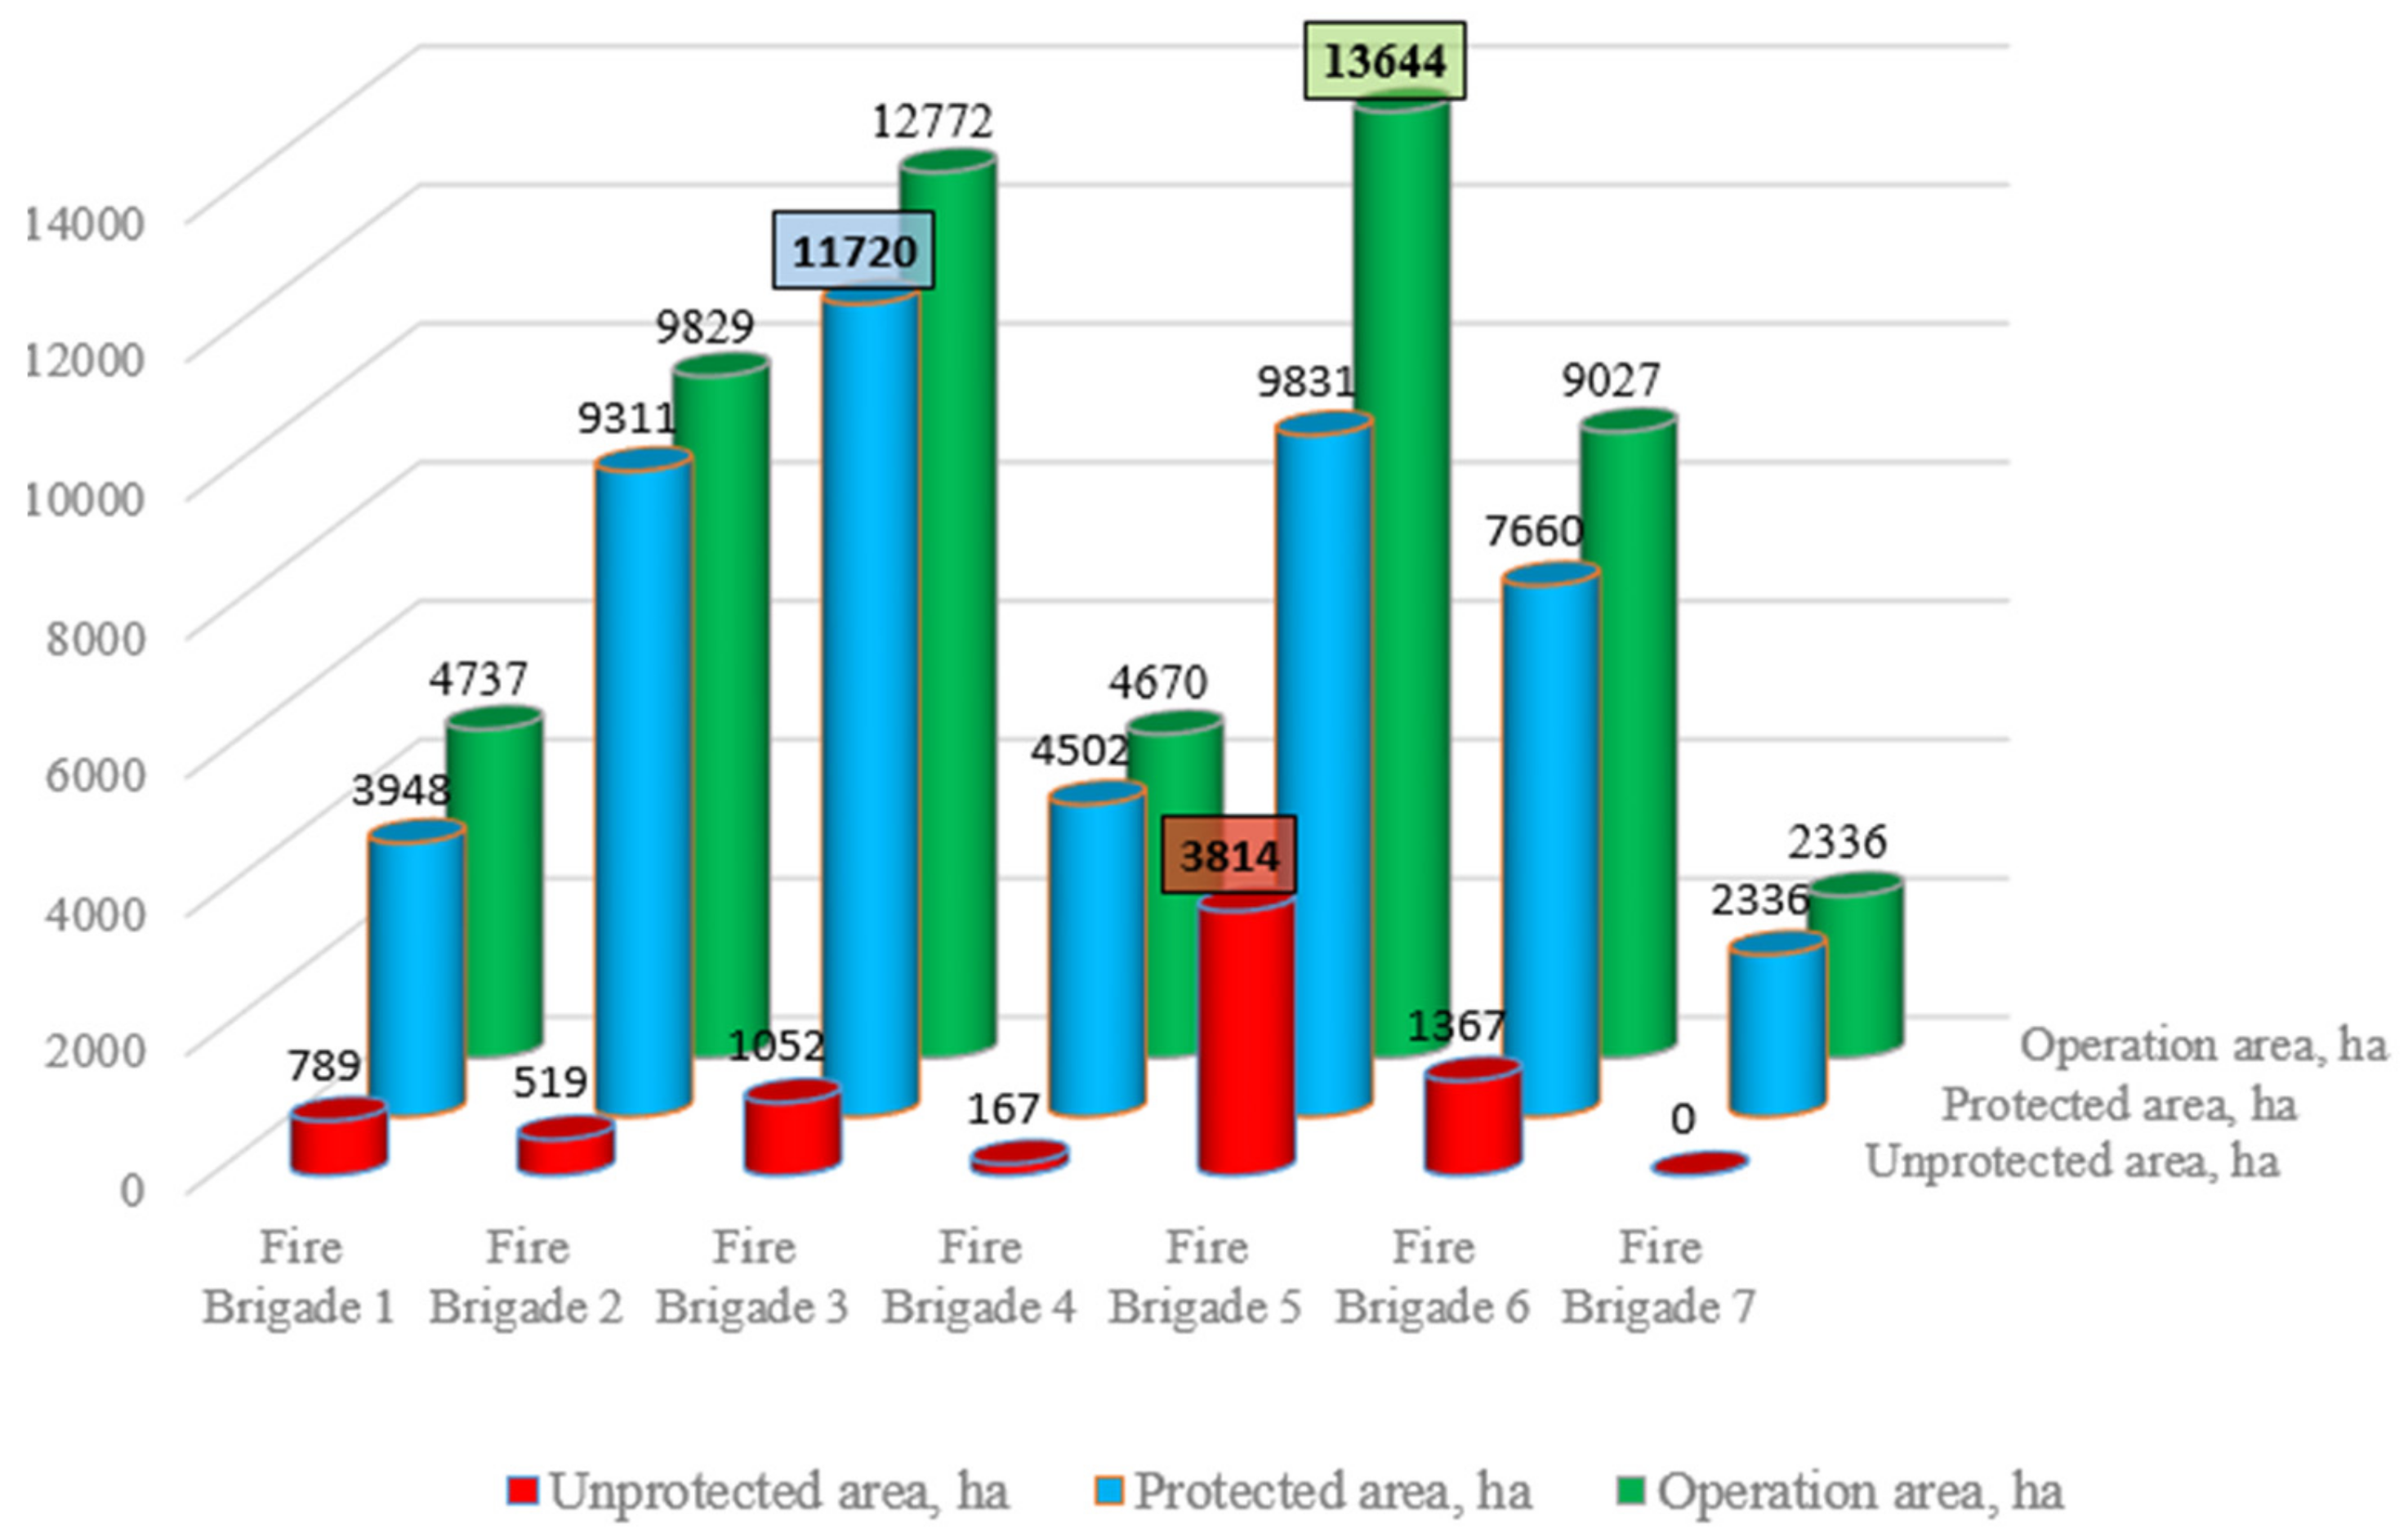
Figure 6 represents a strategical priority for the development of the fire preparedness list. It is known that there is 735 thousand m2 of unprotected building’s area in the Vilnius Fire Brigade’s operation areas. The highest percentage of unprotected area is 27.94% in Fire Brigade 5 (that makes 3814 ha of unprotected area). The access of fire hydrants should be secured in 13.51 percent of total unprotected area, and that is a large territory. The results of the experiment reveal that a proper database of fire hydrants helps identify problematic areas. Identification of unprotected areas and those areas proportions could help for future fire risk management in Vilnius.
GIS is an effective spatial data storage and query system useful for fire risk management, particularly fire preparedness. GIS is convenient software with various geoprocessing tools (buffer, clip, merge, spatial join, etc.) for experiments with large quantities of data and identification of problems in a very structured and practical way. The further and more detailed experiments should be carried out to solve the development problems of Vilnius districts and future sustainability [40].
Research on fire hydrants, protected and unprotected areas’ locations and building marking is a most essential part of the experiment. The GIS-based database was used to determine the distribution of hydrants, location of fire brigade stations and areas, and show the capabilities of the existing municipal extinguishing system.
6. Conclusions and Recommendations
- Review of fire risk management practice in EU countries and Lithuania exposed that following the best European experience from Germany and Austria, it is essential to prepare an accessible day-to-day database for responsible organizations and outside public utilities by using tools for maximizing the fire risk preparedness.
- A geographic information system is a powerful tool to achieve fire risk management missions, so as to enhance situational awareness, improve a fire fighter’s safety, access real-time fire data, and control efforts, as well as develop existing strategies, optimize resource placement, and also develop a budget, support incident management mapping and evaluation. These missions are succeeded with GIS by creating hydrants and fire brigade’s infrastructure maps, analysing response zones, pre-planning and managing responsible inspections, etc. Based on GIS methodology, implementation of GIS technologies for fire and rescue control highly depends on proper project planning and management.
- The article presents a four-step approach comprising collection and preparation of data, territorial spatial analysis, determination of unprotected buildings, analysis and evaluation. Moreover, this case study reveals qualitative and quantitative aspects in research on the accessibility of fire hydrants. While comprehensiveness may be desirable in the analysis of urban infrastructures, this article presents a qualitative approach that could be easily replicated in other cities where GIS-based fire risk management systems under consideration or in the early development phase. The experiment in this case study might be interesting in the sense that it has been applied to a real city and leads to a systematization of the need for quantitative data.
- During the experiment, the Vilnius municipal hydrants system was developed and a database of seven fire brigades operating in separate Vilnius town parts was created. This experiment was based on a GIS database, and an analysis of the accessibility of 4517 fire hydrants and 280 natural water ponds points in Vilnius were performed. Spatial experimental methods (clip, split, select, spatial join, buffer tools, etc.) were applied to determine problematic zones without access to fire hydrants. Fire hydrant access point (200 m) and natural water ponds (1000 m) buffers were applied to measure the building’s reachability. As a result, 3027 buildings’ polygons were identified without any water extinguishing possibility. The most important ‘Unprotected area’ layer as a polygon was created with a 49,307.17 ha area, and it is 13.51% of the Vilnius Fire Brigade’s operation area. The further comparative analysis reveals that the primary priority task is to formulate the appropriate technical accessibility and capacity of the fire hydrants, as Lithuanian instructions and rules indicate, and only the secondary task is to consider the density of the population or buildings area.
- After visualization of the accessibility of municipal fire hydrants in Vilnius city, it was observed that there are 735 thousand m2 of unprotected building’s area (or 3027 units). These experimental results require further experimental analysis with more data (private extinguishing system, underground water lines, etc.).
- As a follow-up to the findings of this research, the following recommendations are suggested for improving the fire risk management in Lithuania:
- The Fire and Rescue Department must integrate GIS as software for fire risk management. The accessibility of the fire hydrants experiment with GIS was a significant example that information systems could be a useful tool for saving time and making investigations of identifying unprotected buildings.
- Theoretically identified unprotected areas could be solved by providing new hydrants’ installation, but the determination of hydrant access points requires more specific data and information (private extinguishing systems, municipal water networks, Vilnius development plan, etc.). It is recommended to employ not only existing information, but the future Vilnius development plan for future research.
- To avoid additional costs and save expenses for future fire hydrants’ installation, it is important to create a complex GIS system that could be implemented with other department’s data and could help to eliminate mistakes and failures.
- Learning from EU countries’ experience, it is recommended to develop fire risk management, not only on legal and institutional policies, but also on organizations, agencies and communities which shall also be involved in the sustainable development of fire safety.
Author Contributions
Writing-Original Draft Preparation and Data Curation, Raminta Raškauskaitė; Development of the approach and experiment, Formal Analysis, Writing-Review & Editing, Raminta Raškauskaitė, and Vytautas Grigonis. All authors have read and agreed to the published version of the manuscript.
Funding
This research received no external funding.
Acknowledgments
Municipal enterprise “Vilniaus planas” and Vilnius Gediminas Technical University Department of Roads provided a base map and other useful GIS layers of Vilnius, which were used for the creation of a database system and experimentation. Lithuania’s Fire and Rescue Department provided an opportunity to experiment with Vilnius municipal hydrants system layers.
Conflicts of Interest
The authors declare no conflict of interest.
References
- United Nations. Sustainable Development Goals. Available online: https://www.un.org/sustainabledevelopment/sustainable-development-goals/ (accessed on 9 May 2019).
- Martin, D.A. Linking fire and the United Nation Sustainable Development Goals. Sci. Total Environ. J. 2018, 662, 547–558. [Google Scholar] [CrossRef] [PubMed]
- International Association of Fire and Rescue Services. World Fire Statistics 2005–2017, World Fire Statistics Magazine No. 22. 2017. Available online: https://www.ctif.org/world-fire-statistics (accessed on 15 May 2019).
- Brushlinsky, N.N.; Ahrens, M.; Sokolov, S.V.; Wagner, P. CTIF World Fire Statistics 2019, No. 24; CTIF Center of Fire Statistics: Berlin, Germany, 2019. [Google Scholar]
- Zhang, H.; Cheng, C.; Miao, S. A Precise Urban Component Management Method Based on the GeoSOT Grid Code and BIM. ISPRS Int. J. Geo-Inf. 2019, 8, 159. [Google Scholar] [CrossRef] [Green Version]
- Malienė, V.; Grigonis, V.; Palevičius, V.; Griffiths, S. Geographic Information System: Old Principles with New Capabilities. Urban Design International; Macmillan Publishers Ltd.: New York, NY, USA, 2011; pp. 1–6. [Google Scholar] [CrossRef]
- World Health Organization. Burn Prevention, Success Stories Lessons Learned; World Health Organization: Geneva, Switzerland, 2011. [Google Scholar]
- Jennings, C.R. Social and economic characteristics as determinants of residential fire risk in urban neighborhoods: A review of the literature. Fire Saf. J. 2013, 62, 13–19. [Google Scholar] [CrossRef]
- Xia, Z.; Li, H.; Chen, Y.; Yu, W. Detecting urban fire high-risk regions using colocation pattern measures. Sustain. Cities Soc. 2019, 49, 101607. [Google Scholar] [CrossRef]
- Zhang, X.; Yao, J.; Sila-Nowicka, K. Exploring Spatiotemporal Dynamics of Urban Fires: A Case of Nanjing, China. ISPRS Int. J. Geo-Inf. 2018, 7, 7. [Google Scholar] [CrossRef] [Green Version]
- FAO. Fire Management: Voluntary Guidelines. Principles and Strategic Actions. Fire Management Working Paper 17. Rome. 2006. Available online: http://www.fao.org/3/j9255e/j9255e00.pdf (accessed on 10 May 2019).
- Enrica Verrucci, E.; Perez-Fuentes, G.; Rossetto, T.; Bisby, L.; Haklay, M.; Rush, D.; Rickles, P.; Fagg, G.; Joffe, H. Digital engagement methods for earthquake and fire preparedness: A review. Nat. Hazards 2016, 83, 1583. [Google Scholar] [CrossRef] [Green Version]
- Barbosa, P.; Kucera, J.; Strobl, P. European Forest Fire Information System (EFFIS)-Rapid Damage Assessment: Appraisal of burnt area maps with MODIS data. In Proceedings of the 6th International Workshop of The EARSeL Special Interest Group On Forest Fires—Advances in Remote Sensing and GIS Applications in Forest Fire Management: Towards An Operational Use of Remote Sensing in Forest Fire Management, 27–29 September 2007, Thessaloniki, Greece; Institute for Environment and Sustainability: Ispra, Italy, 2007; ISSN 1018-5593. [Google Scholar]
- Nisanci, R. GIS based fire analysis and production of fire-risk maps: The Trabzon experience. Sci. Res. Essays 2010, 5, 970–977. [Google Scholar]
- Xia, Z.; Li, H.; Chen, Y. An Integrated Spatial Clustering Analysis Method for Identifying Urban Fire Risk Locations in a Network-Constrained Environment: A Case Study in Nanjing, China. ISPRS Int. J. Geo-Inf. 2017, 6, 370. [Google Scholar] [CrossRef]
- Edwards, J.; Koval, E.; Lendt, B.; Ginther, P. GIS and hydraulic model integration: Implementing cost-effective sustainable modelling solutions. J. AWWA 2009, 101, 34–42. [Google Scholar] [CrossRef]
- Conant, J.B.; Lewis, D. Improve fire hydrant assessments with GIS. J. AWWA 2014, 40, 24. [Google Scholar]
- Xia, Z.; Li, H.; Chen, Y.; Yu, W. Integrating Spatial and Non-Spatial Dimensions to Measure Urban Fire Service Access. ISPRS Int. J. Geo-Inf. 2019, 8, 138. [Google Scholar] [CrossRef] [Green Version]
- Wielebski, Ł.; Medyńska-Gulij, B. Cartographic visualization of fire hydrants accessibility for the purpose of decision making. Geodesy Cartogr. 2013, 62, 183–198. [Google Scholar] [CrossRef] [Green Version]
- Lithuanian Republic Law of Fire Safety. Available online: https://e-seimas.lrs.lt/portal/legalAct/lt/TAD/TAIS.197461/asr (accessed on 27 November 2019). (In Lithuanian).
- General Fire Safety Instructions. Available online: https://e-seimas.lrs.lt/portal/legalAct/lt/TAD/TAIS.250714/asr (accessed on 27 November 2019). (In Lithuanian).
- Fire and Rescue Department under the Ministry of Internal Affairs, Rules for the Design and Installation of Outdoor Fire Water Supply Networks and Structures. Available online: https://pagd.lrv.lt/lt/veiklos-sritys-1/valstybine-priesgaisrine-prieziura/statiniu-projektavimo-taisykles (accessed on 15 May 2019).
- Federation of European Union Fire Officer Associations. Pan European Fire Safety Strategy 2020; Chief Fire Officers Association: Birmingham, UK, 2012. [Google Scholar]
- Federation of the European Union. Fire Officers Associations: Legislation in Austria. Available online: https://www.f-e-u.org/national_legi.php (accessed on 28 November 2019).
- Vienna Town Council. Public Infrastructure Manual Vienna; Vienna Town Council: Vienna, Austria, 2018.
- Open Government Wien: Datenaftritt -Stadt Wien. Available online: https://www.data.gv.at/auftritte/?organisation=stadt-wien (accessed on 28 November 2019).
- Austrian Open Government Data Basemap. 2016. Available online: https://www.basemap.at/index_en.html (accessed on 28 November 2019).
- The Confederation of Fire Protection Associations Europe: Legislation in Germany. Available online: http://cfpa-e.eu/national-regulations/regulations-germany/ (accessed on 28 November 2019).
- Germany’s Leading Independent Testing Institution for Fire Protection and Security. 2011. Available online: http://vds-global.com/en/about-vds/ (accessed on 28 November 2019).
- Remote Sensing for Water Resource Mapping. 2019. Available online: http://uizentrum.de/en/remote-sensing-services-2/water-resource-mapping/ (accessed on 28 November 2019).
- Hydrant Maintenance Inspection: Overview. 2019. Available online: https://solutions.arcgis.com/utilities/water/help/hydrant-maintenance-inspection (accessed on 28 November 2019).
- European Commission. The European Forest Fire Information System. Available online: http://effis.jrc.ec.europa.eu/ (accessed on 12 May 2019).
- ESRI White Paper; GIS for the Fire Service. 2012. Available online: https://www.esri.com/library/whitepapers/pdfs/gis-for-fire-service.pdf (accessed on 28 November 2019).
- Kaufman, M.M.; Rosencrants, T. GIS method for characterizing fire flow capacity. Fire Saf. J. 2015, 72, 25–32. [Google Scholar] [CrossRef]
- Liu, S.J.; Zhu, G.Q. The application of GIS and IOT technology on building fire evacuation. Procedia Eng. 2014, 71, 577–582. [Google Scholar] [CrossRef] [Green Version]
- Xiong, Q.; Zhu, Q.; Du, Z.; Zhu, X.; Zhang, Y.; Niu, L.; Li, Y.; Zhou, Y. A Dynamic Indoor Field Model for Emergency Evacuation Simulation. ISPRS Int. J. Geo-Inf. 2017, 6, 104. [Google Scholar] [CrossRef]
- The Department of Statistics. Population and Social Statistics. 2018. Available online: https://osp.stat.gov.lt/ (accessed on 7 February 2019).
- Češljar, G.; Stevović, S. Small reservoirs and their sustainable role in fires protection of forest resources. Renew. Sustain. Energy Rev. 2015, 47, 496–503. [Google Scholar] [CrossRef]
- Vasiliauskas, D.; Beconytė, G. Spatial analysis of fires in Vilnius city in 2010–2012. Geodesy Cartogr. 2015, 41, 25–30. [Google Scholar] [CrossRef] [Green Version]
- Hamdy, O.; Zhao, S.; Salheen, M.A.; Eid, Y.Y. Identifying the risk areas and urban growth by ArcGIS-tools. Geosciences (Switzerland) 2016, 6, 47. [Google Scholar] [CrossRef] [Green Version]
Figure 1.
Structure of the experiment of fire hydrants’ accessibility.

Figure 2.
Vilnius fire brigades operating areas and locations (without scale).
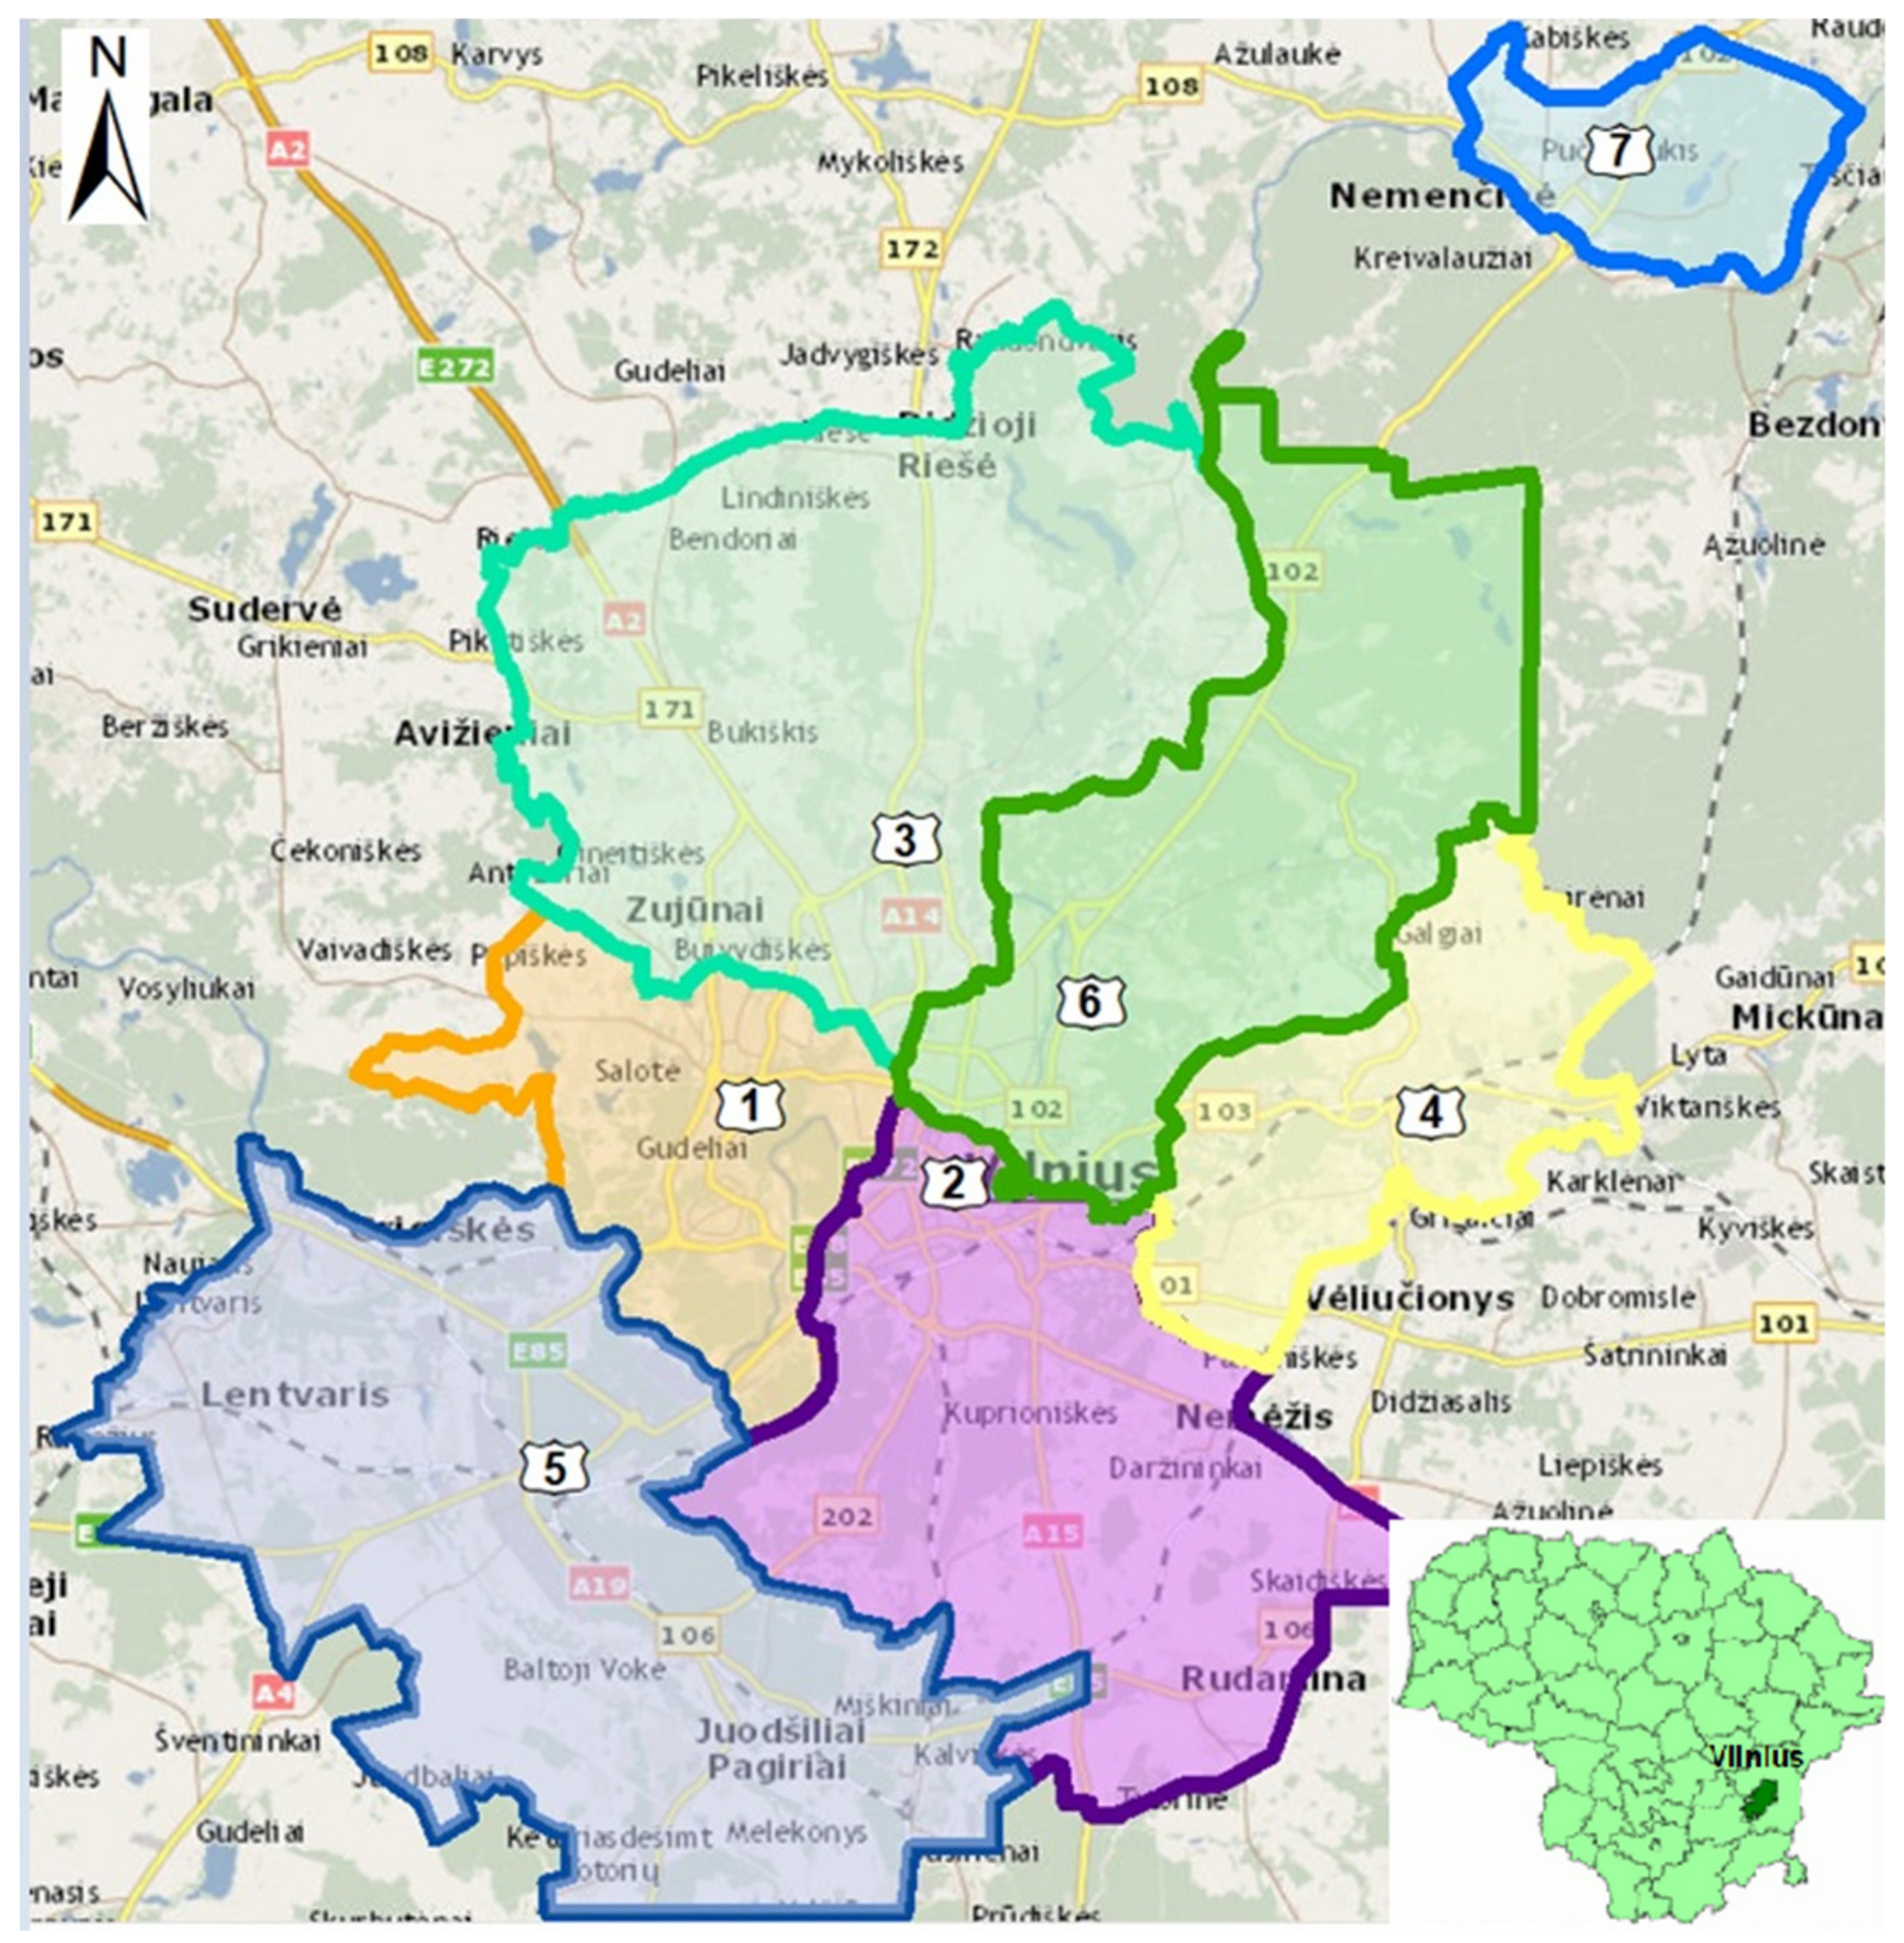
Figure 3.
Fire hydrants access points in Vilnius fire brigades territories (without scale).

Figure 4.
Accessibility of fire hydrants’ access points (200 m) and natural water ponds (1000 m) in the area of Fire Brigade 1 (without scale).
Figure 4.
Accessibility of fire hydrants’ access points (200 m) and natural water ponds (1000 m) in the area of Fire Brigade 1 (without scale).

Figure 5.
Unprotected areas in the zone of Fire Brigade 1 (marked in red) (without scale).

Figure 6.
Analysis of protected and unprotected building areas in Vilnius (Areas of Fire Brigades).


Table 1.
General data about Vilnius Fire Brigades.
| Fire Brigade | Address | Operation Area, ha | Number of Fire Hydrants Access Points | Number of Natural Water Ponds |
|---|---|---|---|---|
| 1 | R. Jankausko g. 2, Vilnius | 4736.97 | 660 | 15 |
| 2 | Švitrigailos g. 18, Vilnius (with Fire and Rescue Department) | 9829.29 | 1073 | 56 |
| 3 | Ateities g. 17, Vilnius | 12,772.16 | 1127 | 78 |
| 4 | Pergalės g. 31, Vilnius | 4669.63 | 268 | 31 |
| 5 | Kirtimų g. 37, Vilnius | 13,644.19 | 367 | 52 |
| 6 | P. Vileišio g. 20A, Vilnius | 9026.50 | 974 | 29 |
| 7 | Švenčionių g. 64A, Nemenčinė | 2335.87 | 48 | 19 |
| Total: | 57,014.61 | 4517 | 280 | |
Table 2.
Quantity and area of unprotected buildings in Vilnius districts.
| Vilnius District | District Area, ha | Quantity of Unprotected Buildings | Area of Unprotected Buildings, m2 | Percentage of Total Unprotected Building’s Area, % |
|---|---|---|---|---|
| Area of Fire Brigade 1 | ||||
| Ž. Paneriai | 740.7 | 3 | 23,324.75 | 19.27 |
| Karoliniškės | 398 | 6 | 841.18 | 0.70 |
| Salotė | 485.1 | 111 | 15,314.22 | 12.65 |
| Pilaitė I | 493.6 | 24 | 2227.54 | 1.84 |
| Pilaitė II | 370.9 | 182 | 32,558.49 | 26.90 |
| Viršuliškės | 267.7 | 5 | 625.25 | 0.52 |
| Medžiakalnis | 630.2 | 325 | 46,140.08 | 38.12 |
| Total: | 656 | 12,1031.55 | 100 | |
| Area of Fire Brigade 2 | ||||
| Naujininkai | 311.4 | 33 | 16,420.53 | 15.28 |
| Ž. Paneriai | 740.7 | 3 | 2928.04 | 2.72 |
| Kirtimai | 1477.6 | 167 | 78,035.37 | 72.62 |
| Nemėžis | 3473.5 | 54 | 10,072.75 | 9.37 |
| Total: | 257 | 107,456.70 | 100 | |
| Area of Fire Brigade 3 | ||||
| Verkiai | 3123.0 | 24 | 3947.64 | 2.66 |
| Riešė | 7439.0 | 69 | 11,596.37 | 7.83 |
| Santariškės | 2010.0 | 447 | 65,209.42 | 44.0 |
| Avižieniai | 4660.0 | 105 | 17,675.66 | 11.93 |
| Fabijoniškės | 369.0 | 12 | 7083.24 | 4.78 |
| Baltupiai | 431.7 | 9 | 13,213.08 | 8.92 |
| Pašilaičiai | 330.1 | 183 | 23,323.42 | 15.74 |
| Total: | 849 | 148,191.93 | 100 | |
| Area of Fire Brigade 4 | ||||
| N. Vilnia | 2369.4 | 49 | 6479.90 | 36.16 |
| Pavilnys | 1552.4 | 82 | 11,438.14 | 63.84 |
| Total: | 131 | 17,918.04 | 100 | |
| Area of Fire Brigade 5 | ||||
| Gariūnai | 2026.2 | 156 | 98,733.94 | 35.21 |
| Ž. Paneriai | 740.7 | 18 | 2021.14 | 0.72 |
| Lentvaris | 1045.5 | 91 | 38,085.97 | 13.58 |
| Trakų Vokė | 2063.0 | 222 | 71,506.89 | 25.50 |
| A. Paneriai | 2393.0 | 318 | 67,696.51 | 24.14 |
| Vaidotai | 1195.8 | 38 | 2368.38 | 0.84 |
| Total: | 843 | 280,450.24 | 100 | |
| Area of Fire Brigade 6 | ||||
| Valakupiai | 5348.3 | 25 | 3979.30 | 6.67 |
| Dvarčionys | 1550.9 | 99 | 12,569.22 | 21.05 |
| Antakalnis | 837.3 | 87 | 12,696.75 | 21.27 |
| Belmontas | 531.4 | 80 | 30,456.19 | 51.01 |
| Total: | 291 | 59,701.46 | 100 | |
© 2019 by the authors. Licensee MDPI, Basel, Switzerland. This article is an open access article distributed under the terms and conditions of the Creative Commons Attribution (CC BY) license (http://creativecommons.org/licenses/by/4.0/).
Share and Cite
MDPI and ACS Style
Raškauskaitė, R.; Grigonis, V. An Approach for the Analysis of the Accessibility of Fire Hydrants in Urban Territories. ISPRS Int. J. Geo-Inf. 2019, 8, 587. https://0-doi-org.brum.beds.ac.uk/10.3390/ijgi8120587
AMA Style
Raškauskaitė R, Grigonis V. An Approach for the Analysis of the Accessibility of Fire Hydrants in Urban Territories. ISPRS International Journal of Geo-Information. 2019; 8(12):587. https://0-doi-org.brum.beds.ac.uk/10.3390/ijgi8120587
Chicago/Turabian StyleRaškauskaitė, Raminta, and Vytautas Grigonis. 2019. "An Approach for the Analysis of the Accessibility of Fire Hydrants in Urban Territories" ISPRS International Journal of Geo-Information 8, no. 12: 587. https://0-doi-org.brum.beds.ac.uk/10.3390/ijgi8120587
Note that from the first issue of 2016, this journal uses article numbers instead of page numbers. See further details here.